Nairobi Luxury Apartments Market, & Cytonn Weekly #45/2017
By Cytonn Research Team, Nov 12, 2017
Executive Summary
Fixed Income
During the week, T-bills were oversubscribed for the first time in 8 weeks, with the overall subscription rate coming in at 106.1%, compared to 69.7% recorded the previous week. Yields on the 91 and 364-day papers remained unchanged at 8.0% and 11.0%, respectively, while the yield on the 182-day paper rose to 10.5% from 10.4% the previous week
Equities
During the week, the equities market was on a downward trend with NASI, NSE 25 and NSE 20 losing 2.1%, 1.6% and 1.3%, respectively, taking their YTD performance to 20.7%, 19.9% and 17.8% for NASI, NSE 25 and NSE 20, respectively. KCB Group and Co-operative Bank released Q3’2017 results, with KCB Group posting a 5.0% growth in core earnings per share to Kshs 4.9 from Kshs 4.6 in Q3’2016, while Co-operative Bank reported a 9.5% decline in core earnings per share (EPS) to Kshs 1.6 from Kshs 1.8 in Q3'2016
Private Equity
This week, Africa-focused private equity firm Apis Partners, injected USD 5.0 mn (Kshs 519.0 mn) in the form of equity into Kenyan technology firm Direct Pay Online (DPO), while UK-based insurance firm Aon has sold its African operations to South-African based private equity firm Capitalworks; as such Aon Sub-Saharan Africa will now be trading as Minet Group
Real Estate
The housing sector has continued to experience reduced price appreciation attributed to low credit growth to the private sector and the extended electioneering period. However, the hospitality sector has had positive outlook as exhibited by continued investments in the sector with the recent opening of the country’s second airport hotel at Jomo Kenyatta International Airport. Further highlighting the attractiveness of the hospitality sector in Kenya, a report released by an online travel and booking firm TravelBird ranked Nairobi at position 93 out of 500 global destinations for tourists, out-pacing other major cities such as Cairo and Budapest
Focus of the Week
Following our launch of the iconic Mixed-Use Development, Cytonn Towers, in Kilimani in September 2017, this week we look into the performance of luxury apartments in the Nairobi market, the key drivers, how this type of apartments are differentiated, and the potential returns. Cytonn Towers will offer 160 luxury apartments, in addition to a shopping mall, serviced apartments, commercial offices, a hotel and the only suspended restaurant in Africa.
- Our Managing Partner & CEO, Edwin Dande, was the guest speaker at the Grant Thornton Emerging Leaders conference, a forum in which new Grant Thornton Managers and Senior Associates from 18 different countries are trained on Exceptional People and Client Experience in preparation for taking up future roles as partners in the firm. See Event Note here
- Cytonn Investments held a Q’3 Company and Market Update Event at Radisson Blu, Nairobi, on 9th of November 2017. The event also included a session dubbed ‘Open to Talk’, an initiative by Cytonn Investments meant to facilitate an open and transparent engagement, and was attended by over 200 Cytonn clients. See Event Note here
- Our Managing Partner & C.E.O, Edwin Dande, was the keynote speaker at Mindspeak, an event hosted by a renowned investment professional Aly-Khan Satchu, Founder and CEO of Rich Management. The event was spurred by growing interest in structured products in the market. See Event Note here
- Our Investment Analyst, Caleb Mugendi discussed the performance of Co-operative Bank after they released their Q3’2017 financial results, reporting a 5% decline in core earnings per share (EPS) to Kshs 1.6 from Kshs 1.8 in Q3'2016. Watch Caleb Mugendi on CNBC here
- We continue to showcase our real estate developments through weekly site visits. Watch progress videos and pictures of The Alma, Amara, The Ridge and Taraji Heights. The site visits target both investors looking to invest in real estate directly and those interested in high yield investment products to familiarize themselves with how we support our high yields. Key to note is that our cost of capital is priced off the loan markets where all-in pricing ranges from 16.0% to 21.0% and our yield on real estate developments ranges from 23.0% to 25.0%, hence our top-line gross spread is about 6%. If interested in attending the site visits, kindly register here
- We continue to see very strong interest in our Private Wealth Management training (largely covering financial planning and structured products), which is at no cost, and is held bi-weekly, but is open only to pre-screened participants. We also continue to see institutions and investment groups interested in the trainings for their teams. The Wealth Management Trainings are run by the Cytonn Foundation under its financial literacy pillar, and if interested in the training for your employees or investment group please get in touch with us through clientservices@cytonn.com or book through this link Wealth Management Training. To view the wealth management training topics click here
- For recent news about the company, see our news section here
- We have 10 investment-ready projects, offering attractive development and buyer targeted returns of around 23.0% to 25.0% p.a. See further details here: Summary of investment-ready projects
- To invest in any of our current or upcoming real estate projects, please visit Cytonn Real Estate
- Cytonn Towers, where we are only selling residential units in the first phase of residential apartments, is currently about 20.0% sold. See Cytonn Towers
- The Alma, which is 55.0% sold. See The Alma
- Amara Ridge is currently 100.0% sold. See Amara Ridge
- Situ Village is currently 22.0% sold. See Situ Village
- The Ridge (Phase 1) is currently 31.0% sold. See The Ridge
- Taraji Heights is currently 14.0% sold. See Taraji Heights
- RiverRun Estates (Phase 1) is currently 11.0% sold. See RiverRun Estates
- With over 10 investment ready projects and over Kshs 82.0 billon of project value, we shall be very selective on new real estate projects going forward, only focusing on Joint Ventures and real estate opportunities with deep value. We are increasingly focused on private equity deals. Should you have any deals in banking, insurance, education, hospitality and technology sectors, kindly email a teaser to PE@cytonn.com
- We continue to beef up the team with ongoing hires: Careers at Cytonn . This week we commence a key search for a Financial Controller, see here
During the week, T-bills were oversubscribed, for the first time in 8 weeks with the overall subscription rate coming in at 106.1%, compared to 69.7% recorded the previous week, despite relatively tight liquidity in the money market. The subscription rates for the 91, 182 and 364-day papers came in at 171.3%, 58.2%, and 127.9% compared to 109.4%, 42.1% and 81.4%, respectively, the previous week. Yields on the 91 and 364-day papers remained unchanged at 8.0% and 11.0%, respectively, while the yield on the 182-day paper rose to 10.5% from 10.4% the previous week. The overall acceptance rate came in at 93.7%, compared to 95.5% the previous week, with the government accepting a total of Kshs 23.9 bn of the Kshs 25.5 bn worth of bids received, against the Kshs 24.0 bn on offer in this auction. The government is still behind its domestic borrowing target for the current fiscal year, having borrowed Kshs 59.3 bn, against a target of Kshs 149.9 bn (assuming a pro-rated borrowing target throughout the financial year of Kshs 410.2 bn budgeted for the full financial year as per the Cabinet-approved 2017 Budget Review and Outlook Paper (BROP)).
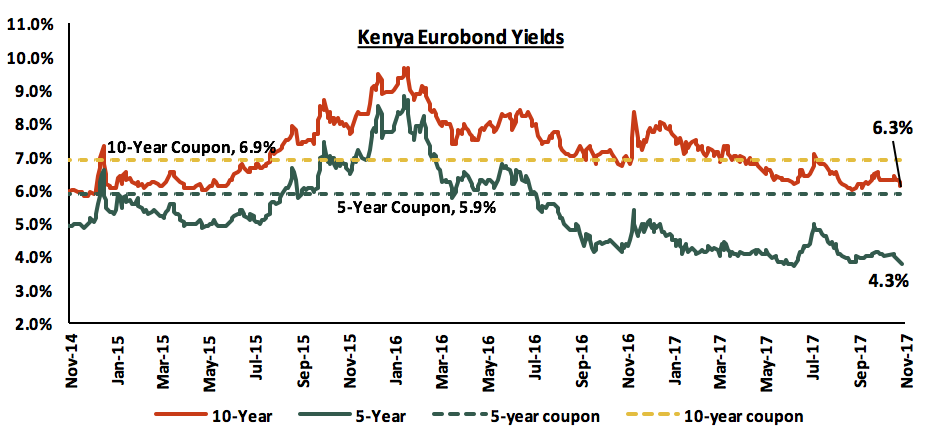
According to Bloomberg, yields on the 5-year and 10-year Eurobonds increased by 50 bps and 30 bps, respectively, during the week to close at 4.3% and 6.3%, from 3.8% and 6.0% the previous week, respectively. This is the first time in since September that the Kenyan Eurobonds have recorded an increase in yields. Since the mid-January 2016 peak, yields on the Kenya Eurobonds have declined by 4.9% points and 3.6% points for the 5-year and 10-year Eurobonds, respectively, due to the relatively stable macroeconomic conditions in the country. The declining Eurobond yields and stable rating by Standard & Poor (S&P), in spite of the political uncertainty around the presidential poll re-run, are indications that Kenya’s macro-economic environment remains stable and hence an attractive investment destination. However, concerns from Moody’s around Kenya’s rising debt to GDP levels may see Kenya receive a downgraded sovereign credit rating.
The Kenya Shilling appreciated by 0.1% against the US Dollar during the week to close at Kshs 103.6, from Kshs 103.7 recorded the previous week, supported by subdued dollar demand by importers. On a year to date basis, the shilling has depreciated against the dollar by 1.1%. In our view, the shilling should remain relatively stable against the dollar in the short term, supported by (i) the weakening of the USD in the global markets as indicated by the US Dollar Index, which has shed 7.6% year to date, (ii) the CBK’s activity, as they have sufficient forex reserves, currently at USD 7.2 bn (equivalent to 4.8 months of import cover), and (iii) increasing diaspora remittances, which rose by 23.0% y/y to USD 176.1 mn in September 2017, from Kshs USD 143.2 mn in a similar period last year. The key factor to watch is the current account deficit that worsened to 6.2% of GDP in Q2’2017, as compared to 5.3% of GDP in a similar period last year.
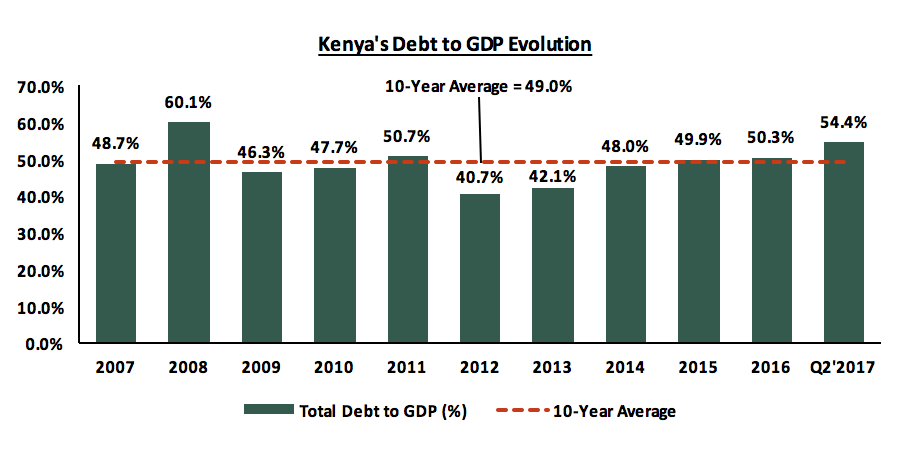
The government is set to sign a new syndicated loan of an undisclosed amount to refinance a previously received syndicated loan amounting to USD 750 mn, which is set to mature in April 2018 after 6 months extension. However, the government also has the option to go back to the international debt market and issue a new Eurobond to aid settling its maturing obligations. So far, the government has only borrowed Kshs 18.0 bn from the foreign market for the current fiscal year, translating to 6.8% of its foreign borrowing target of Kshs 277.3 bn for this fiscal year, against a prorated target of Kshs 101.7 bn. Given the current debt levels of the country at 54.4% of GDP, from 48.0% 3-years ago, above the IMF recommendation of 50.0% of debt to GDP for frontier and emerging markets, more debt if mismanaged could have adverse impacts on the economy. The cost of borrowing for countries in these markets could be at a premium compared to the developed markets but global investors still have appetite for African debt following the successful issuances by Nigeria and Ghana that received approximately 8.0x and 5.0x subscription rates in 2017 and 2016, respectively. Below is a chart showing the evolution of the total debt to GDP over the last ten years for Kenya:
Despite the recent uncertainties facing the country especially on the political front given a second presidential election petition, and a more discontent opposition, the country continues to do well in the international front with the recent improvement in the ease of doing business ranking by the World Bank to position 80 in the 2018 ranking from position 92 in the 2017 ranking, as highlighted in our report here. We maintain the view that the market should normalize once the electioneering period is over, post-election fears and uncertainty dissipates, the president-elect is sworn in, and the government takes charge, with the country’s growth fundamentals remaining strong and intact.
Rates in the fixed income market have remained stable, and we expect this to continue in the short-term. However, a budget deficit that is likely to result from depressed revenue collection creates uncertainty in the interest rates environment as any additional borrowing in the domestic market to plug the deficit could lead to upward pressures on interest rates. Our view is that investors should be biased towards short-to medium term fixed income instruments to reduce duration risk.
During the week, the equities market was on a downward trend with NASI, NSE 25 and NSE 20 losing 2.1%, 1.6% and 1.3%, respectively, taking their YTD performance to 20.7%, 19.9% and 17.8% for NASI, NSE 25 and NSE 20, respectively. This week’s performance was attributable to losses by select large cap stocks such as Safaricom, Co-operative Bank and KCB Group, which lost 3.9%, 2.7% and 2.4%, respectively. Since the February 2015 peak, the market has lost 9.3% and 31.8% for NASI and NSE 20, respectively.
Equities turnover decreased by 17.1% to USD 28.9 mn from USD 34.9 mn the previous week. Foreign investors were net buyers with a net inflow of USD 2.3 mn compared to a net inflow of USD 7.8 mn recorded the previous week. We expect the market to remain supported by improved investor sentiment once fear and uncertainty dissipates, as investors take advantage of the attractive stock valuations.
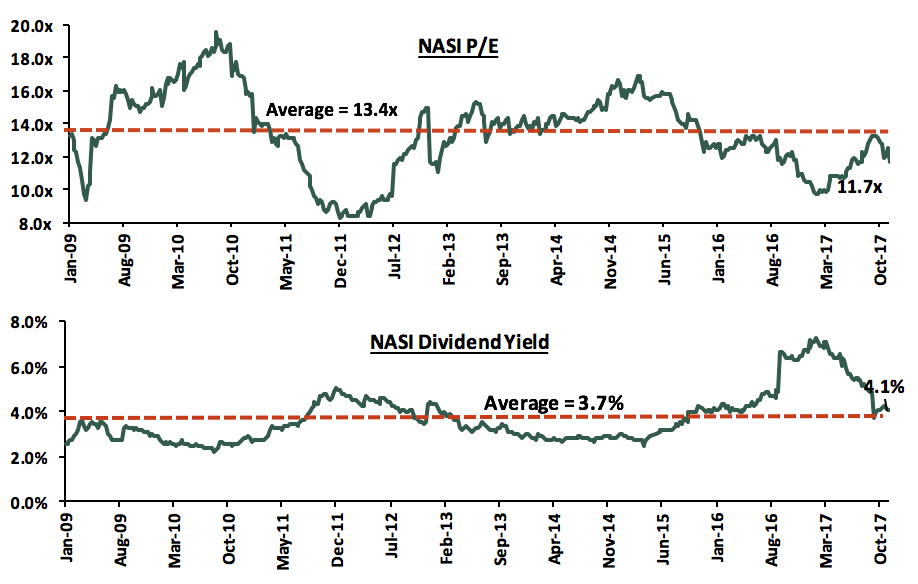
The market is currently trading at a price to earnings ratio (P/E) of 11.7x, versus a historical average of 13.4x, and a dividend yield of 4.1%, compared to a historical average of 3.7%. In our view, there still exist pockets of value in the market, with the current P/E valuation being 30.9% below the most recent peak in February 2015. The current P/E valuation of 11.7x is 20.6% above the most recent trough valuation of 9.7x experienced in the first week of February 2017, and 40.8% above the previous trough valuation of 8.3x experienced in December 2011. The charts below indicate the historical P/E and dividend yields of the market.
During the week, we had a number of earnings releases. Below is the detailed analysis of the earnings’ releases:
KCB Group released Q3’2017 results
KCB Group released Q3’2017 results, recording a 5.0% growth in core earnings per share to Kshs 4.9 from Kshs 4.6 in Q3’2016, driven by a 4.6% increase in operating revenue, which, in absolute terms, was more than the 5.7% increase in operating expenses. Key highlights for the performance from Q3’2016 to Q3’2017 include:
- Total operating revenue grew by 4.6% y/y to Kshs 53.2 bn from Kshs 50.8 bn, driven by an 18.4% growth in Non-Funded Income (NFI) to Kshs 17.5 bn from Kshs 14.8 bn in Q3'2016; which made up for the 1.0% decline in Net Interest Income (NII) to Kshs 35.7 bn from Kshs 36.0 bn,
- Interest Income declined by 3.6% to Kshs 46.8 bn from Kshs 48.5 bn in Q3’2016, despite the loan book recording a 15.1% growth, implying that the decline was an effect of the interest rate cap. The interest income on loans and advances alone declined by 4.4% y/y to Kshs 37.1 bn from Kshs 38.8 bn, while interest income on government securities grew by 1.9% y/y to Kshs 9.3 bn from Kshs 9.1 bn. As a result, the yield on interest-earning assets declined to 11.3% from 12.4% in Q3’2016,
- Interest expense decreased by 10.9% to Kshs 11.1 bn from Kshs 12.4 bn in Q3’2016, following a 13.2% decline in interest expense on customer deposits to Kshs 9.9 bn from Kshs 11.4 bn. This is despite a 13.6% increase in deposits. The increase in deposits yet interest expense decreasing is attributed to reclassification of customer deposits to current accounts, which currently account for 66% of total deposits up from 64% in Q3’2016, bringing down the cost of funds to 2.9% from 3.7% in Q3’2016,
- Net Interest Income declined by 1.0% to Kshs 35.7 bn from Kshs 36.0 bn with Net Interest Margin remaining relatively stable at 8.7% from 8.9% in Q3'2016,
- Non-Funded Income (NFI) recorded a growth of 18.4% to Kshs 17.5 bn from Kshs 14.8 bn in Q3'2016. The growth in NFI was driven by a 29.8% increase in total fees and commissions on loans to Kshs 4.8 bn from Kshs 3.7 bn in Q3’2016, a 22.4% increase in other fees and commissions to Kshs 6.4 bn from Kshs 5.2 bn, and a 14.4% increase in other income to Kshs 2.6 bn from Kshs 2.3 bn in Q3’2016. The current revenue mix stands at 67:33 funded to non-funded income from 71:29 in Q3’2016,
- The 29.8% increase in total fees and commissions on loans was driven by a 15.1% expansion in the value of total loans issued and an increase in fees charged on loans by banks,
- The 22.4% increase in other fees and commissions was driven by a growth in commissions from alternative banking channels including digital platforms and agency banking. The volume of transactions made through these alternative channels increased to 86% from Kshs 80% in Q3’2016,
- Total operating expenses increased by 5.7% to Kshs 30.7 bn from Kshs 29.1 bn, driven by an 11.3% increase in Staff Costs to Kshs 13.8 bn from Kshs 12.4 bn in Q3'2016. This was despite a decline in Loan Loss Provision (LLP), which declined by 7.8% to Kshs 3.1 bn from Kshs 3.4 bn in Q3'2016. The growth in staff costs is attributed to the voluntary employee buyout programme that the group rolled out, whose costs would be recovered within 18 months,
- The Cost to Income ratio slightly increased to 57.8% from 57.2% in Q3'2016 following a 5.7% increase in total operating expenses. Without LLP, the Cost to Income ratio worsened to 51.9% from 50.5% in Q3'2016,
- Profit before tax grew by 3.1% to Kshs 22.4 bn from Kshs 21.7 bn. Profit after tax grew by 5.0% to Kshs 15.1 bn from Kshs 14.4 bn in Q3’2016, following the booking of a deferred tax asset of Kshs 0.8 bn in Q3’2017,
- The total assets increased by 12.9% to Kshs 643.8 bn from Kshs 570.1 bn in Q3'2016. This growth was driven by a 15.1% growth in the loan book to Kshs 419.5 bn from Kshs 364.5 bn in Q3’2016. Investment in government and other securities increased by 2.8% to Kshs 103.6 bn from Kshs 100.8 bn in Q3'2016,
- Total liabilities rose by 13.1% to Kshs 540.6 bn from Kshs 478.1 bn in Q3'2016, driven by a 13.6% increase in deposits to Kshs 496.3 bn from Kshs 436.8 bn in Q3'2016,
- Shareholders’ funds increased by 12.2% to Kshs 103.2 bn from Kshs 92.0 bn in Q3’2016, due to a 14.4% y/y increase in retained earnings to Kshs 63.0 bn from Kshs 55.0 bn,
- The faster growth in loan book compared to deposits led to an increase in the loan to deposit ratio to 84.5% from 83.5% in Q3'2016.
Going forward, KCB Group should continue leveraging on its Fintech strategy to boost its growth and increase its competitiveness in the current tough operating environment. By Q3'2017, 86% of the bank's transactions were handled through alternative channels such as mobile, internet, merchant, ATMs and agency banking with the remaining 14% being branch transactions.
In our view, the Group should focus more on the fee-based businesses in order to reduce the dominance of interest income revenue line item, which currently is at 67.0% of the total operating income, improve on its efficiency, and also contain its regional expansion strategy by focussing on its core Kenyan business.
For a more comprehensive analysis, see our KCB Group Q3’2017 Earnings Note.
Co-operative Bank released Q3’2017 results
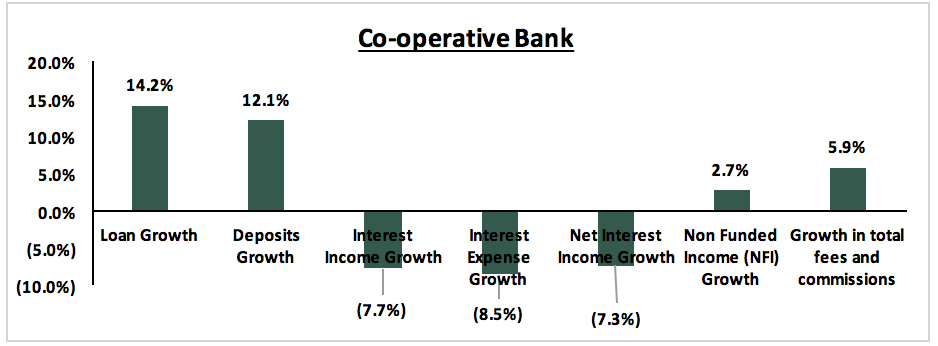
Co-operative Bank released Q3’2017 results, recording a 9.5% decline in core earnings per share (EPS) to Kshs 1.6 from an adjusted EPS of Kshs 1.8 in Q3'2016, attributed to a 4.3% decline in operating revenue, and a 0.7% increase in total operating expenses. The change in core EPS has been adjusted for the bonus share issue of one for every five ordinary shares held, which was approved by shareholders in May 2017. Without adjustment for the bonus share issue, EPS declined by 24.6% to Kshs 1.6 from Kshs 2.2 in Q3’2016. Key highlights for the performance from Q3’2016 to Q3’2017 include:
- Total operating revenue declined by 4.3% to Kshs 30.9 bn from Kshs 32.3 bn in Q3’2016. The decline was attributed to a 7.3% drop in Net Interest Income to Kshs 20.8 bn from Kshs 22.4 bn in Q3’2016, despite a 2.7% increase in Non-Funded Income to Kshs 10.1 bn from Kshs 9.9 bn in Q3’2016,
- Interest Income declined by 7.7% to Kshs 29.9 bn from Kshs 32.3 bn in Q3’2016, despite a 14.2% growth in the loan book. Interest income on government securities declined by 8.2% y/y to Kshs 6.7 bn from Kshs 6.1 bn, while interest income on loans and advances recorded a 6.9% y/y decline to Kshs 23.6 bn from Kshs 25.3 bn. As a result, the yield on interest-earning assets declined to 12.3% from 14.9% in Q3’2016,
- Interest expense declined 8.5% to Kshs 9.1 bn from Kshs 9.9 bn in Q3’2016 following an 11.4% y/y decline in interest expense on customer deposits to Kshs 8.1 bn from Kshs 9.1 bn. The decline in interest expense is despite a 12.1% growth in deposits, the trend is attributed to reclassification of customer deposits to current and transaction accounts, which currently account for 59.5% of total deposits from 58.0% in Q3’2016, bringing down the cost of funds to 3.9% from 5.3% in Q3’2016,
- Net Interest Income declined by 7.3% to Kshs 20.8 bn from Kshs 22.4 bn, leading to a decline in the Net Interest Margin to 8.6% from 9.7% in Q3’2016,
- Non-Funded Income (NFI) recorded a growth of 2.7% to Kshs 10.1 bn from Kshs 9.9 bn in Q3’2016. The growth in NFI was driven by an increase in total fees and commissions that rose by 5.9% to Kshs 7.9 bn from Kshs 7.4 bn. The alternative banking channels including digital and agency banking supported this increase in fees and commissions. Forex income also registered a 9.9% increase to Kshs 1.5 bn from Kshs 1.4 bn in Q3’2015. The current revenue mix stands at 67:33 funded to non-funded income from 69:31 in Q3’2016,
- Total operating expenses grew slightly by 0.7% to Kshs 17.3 bn from Kshs 17.2 bn in Q3’2016, driven by an 8.3% y/y growth in staff costs to Kshs 7.2 bn from Kshs 6.7 bn. Loan Loss Provisions (LLP) rose 31.7% to Kshs 2.6 bn from Kshs 2.0 bn in Q3’2016, while other operating expenses recorded a 12.3% decline to Kshs 7.5 bn from Kshs 8.5 bn in Q3’2016. The growth in staff costs was attributed to an increase in staff number to the current 4,113 from 4,072 in Q3’2016 as the bank filled key strategic positions,
- Cost to income ratio deteriorated to 55.9% from 53.1% in Q3’2016, as a result of a 0.7% growth in operating expenses coupled with a 4.3% decline in operating revenue. Without LLP, cost to income ratio stood at 47.6% from 47.1% in the same period last year,
- Profit before tax declined by 9.8% to Kshs 13.7 bn from Kshs 15.2 bn in Q3’2016. Profit after tax also declined by 9.5% to Kshs 9.5 bn from Kshs 10.5 bn in Q3’2016. The effective tax rate remained relatively stable at 30.6% from 30.8% in Q3’2016,
- The balance sheet recorded an expansion in Q3’2017, with total assets increasing by 9.7% to Kshs 388.3 bn from Kshs 354.0 bn in Q3’2016. This growth was driven by a 14.2% y/y growth in the loan book to Kshs 259.4 bn from Kshs 227.1 bn in Q3’2016. Growth was supported by increased use of alternative channels to drive loan disbursement, with 86% of Co-operative Banks’ total transactions year to date facilitated via alternative channels,
- Total liabilities increased by 8.8% to Kshs 321.1 bn from Kshs 295.2 bn in Q3’2016, driven by 12.1% growth in customer deposits to Kshs 289.0 bn from Kshs 257.8 bn in Q3’2016, driven by an increase in the collections from alternative channels especially agency banking, and the number of bank account holders, currently at 6.8 mn customers,
- Shareholders’ funds increased by 13.8% to Kshs 67.3 bn from Kshs 59.2 bn in Q3’2016, due to a 16.9% y/y increase in retained earnings to Kshs 58.7 bn from Kshs 50.2 bn,
- The faster growth in loans as compared to deposits led to an increase in the loan to deposit ratio to 89.8% from 88.1% in Q3’2016, with Co-operative bank able to leverage on long-term funds from Development Partners to fund their loan book.
During the quarter, Co-operative Bank continued with the second stage of its Soaring Eagle Transformation Agenda, focusing on 4 major themes namely, (i) Deposits growth, (ii) Loan book growth, (iii) Pro-active Retention (PAR), and (iv) grow product holding to 3.5 per customer. We expect the bank to continue implementing its key transformation steps, including operational efficiencies, automation and use of alternative channels to support future growth. We are also of the view that in addition to cost efficiency brought about by the Soaring Eagle Transformation Strategy, Co-operative bank has untapped opportunity in the alternative revenue streams to drive NFI growth, just like its peers such as KCB Group; generally speaking, in addition to efficiency and alternative channels, NFI is the next frontier for Kenyan banks.
For a more comprehensive analysis, see our Co-operative Bank Q3’2017 Earnings Note.
Below is a summary of the Q3’2017 results for the three listed banks that have released thus far and key take-outs from the results:
Key takeaways:
- Of the 3 banks that have released their Q3’2017 results, two have recorded a decline in core earnings per share, with the average decline in core earnings across the banking sector at 1.8%, owing to the tough operating environment as a result of the interest rate caps and political uncertainty in the country that affected the business environment,
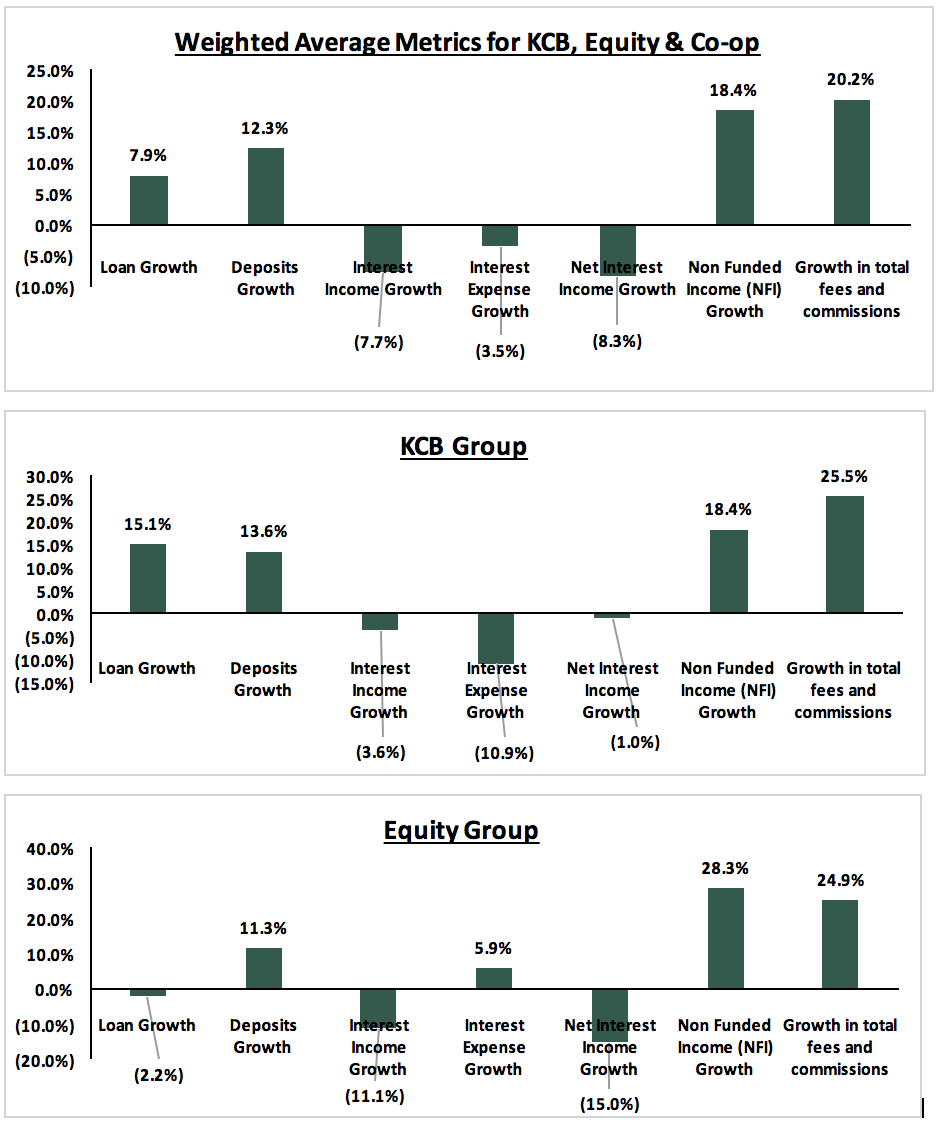
- Average deposit growth has been 12.3%. However, despite the average deposits having grown, the interest expense paid on deposits has declined by 3.5% on average, indicating that banks are growing deposits but opening less interest earning accounts and possibly transferring some existing interest earning accounts to transaction accounts. This is evidence by the fact that proportion of transaction accounts has increased to 62.8% from 61.0% in Q3’2016,
- Average loan growth has been 7.9%, however interest income has decreased by 7.7%, showing the effects of the rate caps,
- Investment in government securities has grown by 8.3% outpacing loan growth of 7.9%,
- Non-funded income has however grown by 18.4%, which included a Fee and Commissions growth of 20.2%. This shows that banks are charging more fee income to improve their total yield on loans above the rate cap maximum. This evidenced by the total cost of borrowing per KBA which puts the all in cost of borrowing for Equity, Coop and KCB Group at 18.0%, 16.0% and 16.0%, respectively,
- In summary, it appears that banks are coping with the interest rate cap regime by a combination of the following:
- Increased investment in government securities rather than in lending,
- Significant increases in fees and commissions charged on loans, and
- Increasingly directing deposits to non-interest bearing transaction accounts.
Safaricom has established an online sales platform dubbed “Masoko” in a move to tap into the fast-growing e-commerce market in Kenya. The platform will ride on the telco’s mobile money platform, M-Pesa, and is expected to face stiff competition from dominating brands in the industry such as Jumia, Kilimall, OLX and Pigiame, with Jumia alone controlling 5,000 vendors and about 500,000 products. Safaricom targets to start to roll-out of the platform, currently under internal testing, with 200 vendors and 30,000 consumer goods. We view this move as another driver of growth for the telco that recently reported a 9.0% growth in core earnings per share mainly driven by growth in the service revenue (M-PESA, messaging, mobile data, fixed service), as highlighted in our Safaricom H1’2018 Earnings Note. In another move riding on the M-Pesa platform, Safaricom and Gulf African Bank are set to launch a Sharia-compliant banking service to allow customers operate M-sharia bank accounts. The M-sharia platform is expected to be rolled out by March 2018 targeting the bank’s retail and merchant segments, with the borrowing targets set as little as Kshs 100 up-to a maximum of Kshs 500,000. Safaricom has increasingly been diversifying its revenue streams, and supported by the aggressive roll-out of 4G network, these strategies will be key growth drivers for the firm.
Below is our equities universe of coverage:
|
all prices in Kshs unless stated otherwise |
||||||||
|
No. |
Company |
Price as at 03/11/17 |
Price as at 10/11/17 |
w/w Change |
YTD Change |
Target Price* |
Dividend Yield |
Upside/ (Downside)** |
|
1. |
NIC*** |
38.3 |
38.0 |
(0.7%) |
46.2% |
58.2 |
3.3% |
56.4% |
|
2. |
KCB Group*** |
41.5 |
40.5 |
(2.4%) |
40.9% |
57.1 |
4.9% |
45.9% |
|
3. |
Liberty |
12.0 |
12.0 |
0.0% |
(9.1%) |
16.4 |
0.0% |
36.7% |
|
4. |
Barclays |
10.2 |
10.0 |
(1.5%) |
17.9% |
12.5 |
10.0% |
35.0% |
|
5. |
I&M Holdings |
124.0 |
120.0 |
(3.2%) |
33.3% |
149.6 |
2.5% |
27.2% |
|
6. |
Kenya Re |
20.5 |
20.0 |
(2.4%) |
(11.1%) |
24.4 |
3.8% |
25.8% |
|
7. |
DTBK |
184.0 |
189.0 |
2.7% |
60.2% |
234.1 |
1.3% |
25.2% |
|
8. |
Jubilee Insurance |
458.0 |
494.0 |
7.9% |
0.8% |
575.4 |
1.8% |
18.2% |
|
9. |
HF Group*** |
12.1 |
12.4 |
2.5% |
(11.4%) |
14.2 |
1.8% |
16.3% |
|
10. |
Co-op Bank |
16.7 |
16.3 |
(2.7%) |
23.1% |
17.5 |
5.7% |
13.4% |
|
11. |
CIC Group |
5.7 |
5.6 |
(0.9%) |
47.4% |
6.2 |
1.8% |
12.5% |
|
12. |
Sanlam Kenya |
29.0 |
28.8 |
(0.9%) |
4.5% |
31.4 |
1.0% |
10.1% |
|
13. |
Britam |
14.8 |
14.2 |
(3.7%) |
42.0% |
15.2 |
1.6% |
8.7% |
|
14. |
Equity Group |
40.3 |
40.0 |
(0.6%) |
33.3% |
40.5 |
5.0% |
6.3% |
|
15. |
Stanbic Holdings |
80.5 |
80.0 |
(0.6%) |
13.5% |
79.1 |
5.2% |
4.0% |
|
16. |
Standard Chartered |
225.0 |
227.0 |
0.9% |
20.1% |
199.8 |
4.5% |
(7.4%) |
|
17. |
NBK |
10.1 |
10.9 |
8.5% |
51.4% |
5.2 |
0.0% |
(52.5%) |
|
*Target Price as per Cytonn Analyst estimates |
|
|
|
|
|
|||
|
**Upside / (Downside) is adjusted for Dividend Yield |
||||||||
|
***Banks in which Cytonn and/or its affiliates holds a stake |
||||||||
|
For full disclosure, Cytonn and/or its affiliates holds a significant stake in KCB Group and NIC Bank, ranking as the 5th largest local institutional investor and the 9th largest shareholder, respectively |
||||||||
We maintain a “NEUTRAL” view on equities for investors with short-term investment horizon since, despite the lower earnings growth prospects for this year, the market has rallied and brought the market P/E closer to its’ historical average. Pockets of value exist, with a number of undervalued sectors like Financial Services, which provide an attractive entry point for long-term investors and thus we are positive for investors with a long-term investment horizon.
Apis Partners, a London based private equity firm that focuses on financial services and growth market investment, has injected funding of USD 5.0 mn (Kshs 519.0 mn) into Direct Pay Online, a Kenyan Internet Payments Firm, from the USD 287 bn fund. This is the second investment into the firm after an initial injection of USD 10.0 mn (Kshs 1.0 bn) into the firm last year. DPO currently operates in 12 African countries, including Kenya, Tanzania, Uganda and South Africa and has acquired firms in Namibia and Botswana, with further plans to expand into countries such as Nigeria, Ghana, DRC and Mozambique. Other investments made on behalf of the fund include (i) TransFast, a provider of multi-currency cross-border payments solutions to consumers and businesses in 120 countries across the Americas, Asia, Africa and Europe; (ii) EPS, a leading electronic payments system provider based in India; and (iii) Microcred, a financial institution that targets the financially unbanked in 9 countries across Asia and Africa. The continued interest by investors in technology-driven companies in Sub-Sahara Africa is catalysed by the rising need for technology products as more businesses seek to enhance efficiency and reduce costs. The rising number of tech hubs in Africa, which support the growth of tech start-ups by providing mentorship has also provided a platform through which investors can easily identify opportunities to invest in. According to the World Bank, tech hubs in Africa have increased from 117 in 2015 to 173 in 2016, with South Africa and Kenya leading with 32 and 16 tech hubs, respectively.
Capitalworks, a Johannesburg-based private equity firm acquired the African operations of the UK-based multinational firm, Aon for an undisclosed amount. The transaction will effectively see Aon sub-Saharan Africa rebrand to Minet Group. Aon Africa was previously owned by Aon London and Minet Africa. Capitalworks manages more than USD515.0 mn (Kshs 53.4 bn) in assets, and other investments include IQ Business, a management consultancy in South Africa; and Obsidian, a health solutions provider in Africa headquartered in South Africa. The acquisition is part of a buyout spanning 10 Aon units in Africa including Kenya, Zambia, Swaziland, Namibia, Lesotho, Angola, Mozambique, Malawi, Tanzania and Uganda. The investment is part of Capitalworks’ strategy to diversify as they have previously invested largely, but not exclusively, in the construction, mining and manufacturing sectors. The deal has been approved by the regulatory authorities in six of the ten countries, with the others expected to follow suit by the first quarter of 2018; and Aon Sub-Saharan Africa will hereafter trade under the name of Minet Group. The continued interest by foreign investors in Africa is driven by strong economic growth fundamentals in Sub Saharan Africa.
Private equity investments in the Sub-Sahara African Region remains robust as evidenced by the increased deal flow in a number of sectors that support growth. The increasing investor interest in private equity investment in Sub-Sahara Africa is attributed to (i) rapid urbanization, a resilient and adapting middle class and increased consumerism, (ii) the attractive valuations in the private markets compared to the public markets, (iii) the attractive valuations in Sub Saharan Africa’s markets compared to global markets, and (iv) better economic projections in Sub Sahara Africa compared to global markets. We remain bullish on PE as an asset class in Sub-Sahara Africa. Going forward, the increasing investor interest and stable macro-economic environment will continue to boost deal flow into the Sub-Saharan market.
During the week, Kenya Bankers Association released its Q3’2017 Housing Price Index (KBA-HPI), which tracks both qualitative and quantitative factors that determine pricing in the housing sector. The report showed house price changes and units uptake in Q3’2017. The key takeouts from the report include;
- House prices increased by 0.4% in Q3’2017 compared to 1.0% increase in Q2’2017. The lower growth can be attributed to: (a) the observed slowdown in credit growth in the private sector at 1.6% over the 12 months to August 2017 from a 4-year average of 14.8% from January 2013 and (b) a wait-and-see stance adopted by investors during the electioneering period. Notably, though still increasing the house price changes have generally been slower from Q3’2016 after the Banking Amendment Act, 2015 took effect. The graph below shows the performance of the house prices between 2016 and 2017 exhibiting the adverse effects of the law on capping interest on real estate performance. This illustrates that the slowdown is essentially due to disruption in capital flows caused by the rate cap legislation. We should see a quick and clear reversal once the rate cap legislation is reviewed,
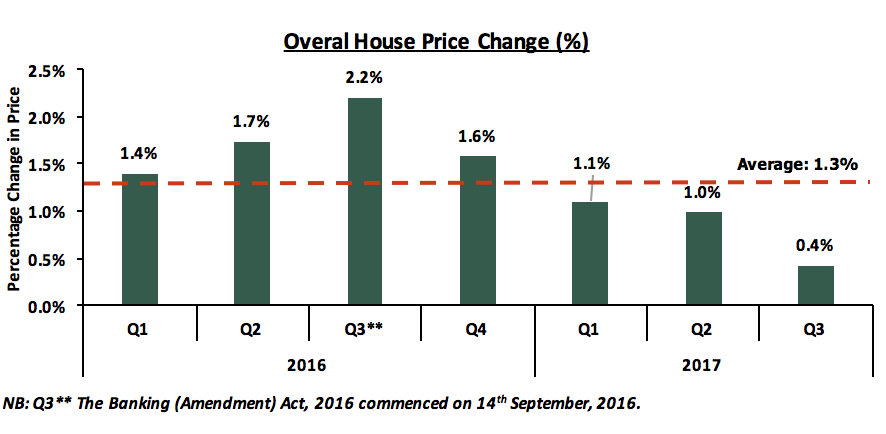
Source: Kenya Bankers Association Housing Price Index, Issue 12
- Apartments accounted for 82.7% of the total number of units sold in Q3’ 2017 with Maisonettes and bungalows accounting for 10.7% and 6.6% respectively attributed to affordability of apartment units compared to maisonettes and bungalows,
- Apartments registered the highest increase in prices compared to bungalows and Maisonettes across all the lower, upper and middle market segments. This is attributed to higher demand for apartments which are more affordable compared to detached units (such as maisonettes and bungalows) with the average sale price of Kshs 95,101 per SQM for apartments compared to Kshs 137,555 per SQM for detached units in Nairobi and its Metropolitan areas. Some of the factors that investors and house owners look at when buying a house include: (i) the type of house with apartments being preferred to detached units due to their affordability (ii) house plinth area, (iii) number of bedrooms, (iv) presence of backyard, (v) master ensuite, and (vi) other amenities such as gated community, gym, swimming pool and proximity to social amenities.
This KBA-HPI report is in tandem with findings highlighted in the Nairobi Metropolitan Residential Report 2017 by Cytonn Investments, which established that apartments recorded an average annual uptake of 24.0% compared to detached units which recorded annual uptake of 23.2% in 2017, with an average market price appreciation of 3.5% y/y in 2017 compared to 7.4% y/y recorded in 2016. Even though the sector has seen lower price growth, it remains attractive due to (i) high demand due to the huge cumulated national housing deficit estimated at 2.0 mn units, (ii) rapid urbanization rate of 4.4% p.a. compared to a global average of 2.0% and (iii) government incentives such as the 50.0% tax cut for developers who supply 100 affordable units annually
Still in the housing sector, over the week, The Ministry of Transport, Infrastructure, Housing and Urban Development released its schedule to ground break on 8,000 housing unit project in Mavoko County in December 2017. In the same line, National Housing Corporation (NHC) also announced its plans to develop 6,000 house units across eight counties, such as Uasin Gishu, Mombasa, etc, in the next three years. Notably, since its inception in 1953, NHC has since managed to complete a total of 17,186 housing units across the country with 53.8% and 46.2% of the units under the tenant purchase and rental scheme respectively. In our view, the projects will go a long way towards reducing the country’s housing deficit that currently stands at 200,000 units per annum.
During the week, TravelBird, an online travel and vacation booking firm based in Amsterdam, released a report ranking cities based on how welcoming they were in 2016 in relation to their levels of support for growth in tourism. The report ranked Nairobi City the 93rd (out of top 500 global tourist destinations) most welcoming city in the world ahead of major cities such as Budapest (Hungary), Cairo (Egypt) and Bucharest (Romania). Singapore secured the highest ranking followed by Stockholm (Sweden), and Helsinki (Finland). The ranking factored in a number of metrics, which included; (a) having a friendly port of entry, (b) citizens’ happiness, (c) level of national security, and (d) openness to host visitors. This favourable ranking enhances tourist trust in the country, hence increasing competitiveness of the country’s hospitality sector on the global platform.
In line with the above, we have seen continued investments in the sector and recently the global hospitality firm, Marriott International, opened 172-room Four Points by Sheraton Nairobi Airport hotel at Jomo Kenyatta International Airport (JKIA). This will be the second brand to establish a hotel at JKIA after the 144-room Lazizi Premiere Hotel, which opened its doors in May 2017. Both hotels bank on the growing number of international arrivals as well as the increasing expenditure by tourists and business travellers. The number of international arrivals through Jomo Kenyatta International Airport grew at an annual rate of 16.2% to hit 781,513 in 2016 from 672,789 recorded in 2015. Moreover, the country’s hotel bed-nights occupancy increased by 8.5% y/y to 781,513 in 2016 from 672,789 recorded in 2015. Receipts accruing from tourism earnings also increased by 17.9% y/y from Kshs 5.9 million in 2015 to Kshs 6.4 million recorded in 2016 as per Kenya National Bureau of Statistics Economic Survey 2017. The Kenyan market has witnessed entry of more international hotel brands over the year as they seek to tap into the growing tourist numbers driven by;
- Lifting of travel advisories to Kenya by United States, United Kingdoms and France due to improved security in the country,
- Government incentives to boost the tourism industry through measures such as removal of visa fees for children, elimination of VAT on park fees, introduction of Airline Charter Incentive Program that waivers landing fees for a period of two and a half years and provide subsidy set at USD. 30 rebates per seat filled by international passengers who terminate or disembark in Kenya over the same period,
- Marketing of the country’s hospitality industry at local and international levels, for instance this week Kenya Tourism Board (KTB) is leading a 30-member delegation of local travel trade firms in marketing the hospitality sector in the country at the 3-day World Travel Market (MTM) in London, United Kingdom,
- Meetings, incentives, conferences and exhibitions (MICE), which is valued at Kshs 30.0 bn of annual revenue, with hotels conferences accounting for 60.0% of this total value as per Kenya Hospitality Report, 2017 by Jumia Travel.
Other Real estate highlights during the week;
- The United Nations submitted a proposal to the UN General Assembly to upgrade the infrastructure in its offices in Gigiri, Nairobi, to; (i) achieve full environmental green building policies, (ii) accommodate more staff and (iii) enhance ease of accessibility of the Gigiri offices for people with disabilities at a cost of Kshs 7.0 billion over the next seven years. This is a right move by the institution in embracing green building technology as it sets the pace for construction of environmentally friendly buildings in the country,
- The National Museum of Kenya (NMK) announced that it is seeking to raise Kshs 1.5 billion to construct Africa’s biggest biomes and cultural artefacts collection museum center on a 5-acre land parcel at Ololua Forest, Nairobi. Kenya National Economic Survey 2017 Report shows that the number of visitors to museums, snake parks and historical sites increased on y/y basis at a CAGR of 6.2% in 2013/2016 period and reporting a 15.8% increase in the number of visitors from 797,500 in 2015 to 923,100 recorded in 2016. Notably, Kitale Museum, which displays artefacts similar to that of the planned treasure collection centre, recorded the highest growth rate having experienced an increase of visitors by 66.6% on a y/y basis from 33,500 in 2015 to 55,800 recorded in 2016. Therefore, we expect that, upon completion, the treasure collection centre will further provide catchment for visitors and enhance growth in leisure tourism sector in the country.
Despite the lower growth in prices in the residential sector, we expect the sector to recover in the short and medium term supported by (i) the country’s need to meet its housing deficit estimated at 2.0 million units, (ii) high urbanization rate that is 2.4% above the global average, and (iii) government incentives such as the Airline Chatter Incentive Programs.
Kenya’s real estate and construction market has grown over the last 7-years, with its contribution to GDP increasing from 12.6% in 2010 to 13.6% in 2016.The growth has been fuelled primarily by (i) demand as a result of growing population at 2.7% per annum compared to the global average of 1.2%, (ii) a high rate of urbanization at 4.4%, compared to the global average of 2.1%, (iii) infrastructural development in various parts of the country, which has opened up areas for development, (iv) entrance of multi-national firms such as Wrigleys, who demand institutional grade commercial and residential real estate, (v) and Nairobi’s status as the regional hub for East Africa. The residential real estate market has seen development of housing to meet demand from the high-end, upper middle, lower-middle and the low income market segments. In this sense, opportunities exist for either investment or home-ownership purposes, whichever the user deems fit. Notably, residential units have become one of the key expressions of affluence and therefore, for this week, we look into the opportunities in the luxury residential apartments that target the high-end market.
Nairobi’s prime residential developments are mainly located in areas such as Karen, Lower Kabete, Runda and Kitisuru that are zoned for low rise residential developments only, restricting the development of apartments and thus are characterized by palatial villas and bungalows, developed on at least a 1/2-acre land parcel. Nonetheless, we have seen the development of luxury apartments for the up-market segment of the market in locations such as Kilimani, Riverside, Upperhill, Westlands and Kileleshwa, where zoning regulations have been relaxed due to increasing land prices. These developments still provide the prestige and exclusivity sought by affluent individuals in the context of high rise residential units. The main factors driving development of luxury apartments include;
- Changing Tastes and Sophisticated Lifestyles – Increasing incomes and exposure to international designs and trends has resulted in refined tastes and sophisticated preferences, thus creating demand for lifestyle products in Kenya, including housing,
- The Growth of High Net Worth Individuals - According to the Knight Frank Wealth report 2017, Kenya had 9,400 high net worth individuals in 2016 and the number is expected to increase to 16,900 over the next 10 years. High net-worth individuals, according to the report, are persons with a net worth exceeding USD 1.0 mn (Kshs 103.3 mn) excluding their primary residence. If such an individual invests at least 25.0% of their assets in real estate, they can afford a Kshs 25.8 mn house. The number of high net worth Kenyans grew by 93.0% between 2006 and 2016, and is projected to grow by 80.0% over 10 years to 2026 supported by entrepreneurial growth, and increased number of senior level employment in large and growing corporates, indicating the potential for increased demand,
- Safe Haven Investment Factors - Real estate continues to provide a safe haven for high net worth individuals with stable rental income and capital preservation thus acting as a hedge against inflation and other market risks. To support this, Knight Frank Wealth report 2017 on high net worth individual’s wealth allocation in Africa indicates that 25.0% of wealth is allocated to real estate investments (excluding primary residence and second homes) and another 25.0% is allocated to traditional investments such as equities and bonds. High net-worth individuals therefore allot a large portion of their assets into real estate given the long-term stability and returns of real estate investments, and
- Kenya as a regional Hub and Presence of Multinational Firms - The presence of multinational firms such as Google, General Electric and Hewlett Packard, as well as the entry of firms such as Wrigleys and Volkswagen, has created demand for up-market housing from expatriates.
The above factors therefore show the potential in housing for the up-market segment of the market.
The luxury market, however, is not without challenges that pose a risk to investment, including;
- Exit of Multi-National Firms- In the last 3 years, we have seen firms such as HSBC, Cadbury, Sameer’s Yana Tyres and Unilever cease operations in Kenya citing a tough operating environment in Kenya characterized by high productions costs, cost of credit and increased competition. This resulted in a decline in prices in prime residential properties by 2.1% in 2016, according to Knight Frank. In 2017, returns in the high-end segment of the market dipped by 2.8% points to 8.9% in 2017 from 11.7% in 2016, according to Cytonn Research, and
- Increased Supply - According to the World Bank, 35.0% of housing supply in Kenya is in the high-end market and another 48.0% in the upper middle income market whereas the highest demand is in the lower middle and low income segments, Increased development in the high end and upper middle segments of the market has resulted in increased supply, which has resulted in slowing down of price appreciation in areas such as Kileleshwa and Westlands changing to a 1.1% and 3.5% appreciation in 2017 compared to 4.7% and 6.4% appreciation in 2016, respectively.
Market Research
In tandem with the recent launch of the luxury apartments component of Cytonn Towers, a mixed use development, we are sharing market research that we undertook on prime residential properties in Nairobi to determine what differentiates luxury apartments and what the potential returns are.
The research is intended to answer the following key questions:
- What are the typical plinth areas for luxury apartments segment? and how does it compare to the apartments in the rest of residential sector (upper mid-end, lower middle suburbs and satellite areas)?
- What is the typical selling price and monthly rent for luxury apartments segment? and how does it compare to the rest of residential sector?
- How does the rate of uptake for luxury apartments compare to the rest of the residential sector?
- And how do returns in luxury apartments segment compare to the rest of residential sector?
Factors which characterize apartments for the high end markets include;
- Larger Unit Sizes: Residential developments in the luxury market segment generally provide more space compared to the standard house size due to additional rooms such as pantries, laundry room, TV-rooms, study area, walk-in closets and large balconies. For example, while the average size of standard 3 bedroom units in Nairobi and its metropolitan areas stands at 150.0 SQM, the average size of a 3-bedroom luxury apartments is 222.0 SQM,
- Relatively higher Prices: Luxury apartments tend to have higher prices per square metre compared to other housing. According to Cytonn Residential Report 2017, the average price of a standard apartment in Nairobi and its metropolitan areas is Kshs 106,840.8 per SQM. In the luxury market however, the average price per square metre is approximately 84.3% higher than the standard house at Kshs 193,261.3 on average, mainly due to provision of more amenities, higher quality designs and finishing which result in higher costs of construction. In addition, these properties are mostly developed in prime areas thus incurring high land costs, which are passed on to buyers,
|
Luxury Apartments Plinth Areas, Selling Prices and Rental Prices per SQM |
||||||||||
|
Unit Typology |
Plinth Area in SQM |
Selling Price per SQM |
Rental Price per SQM |
|||||||
|
|
Market Average |
Luxury Average |
Market Average |
Luxury Average |
Market Average |
Luxury Average |
||||
|
1 Bedroom |
57.0 |
69.0 |
99,083.1 |
180,252.1 |
457.4 |
1,627.7 |
||||
|
2 Bedroom |
102.0 |
110.0 |
95,353.5 |
206,510.9 |
440.8 |
1,504.1 |
||||
|
3 Bedroom |
150.0 |
222.0 |
97,080.9 |
185,315.9 |
473.2 |
1,151.5 |
||||
|
4 Bedroom |
250.0 |
413.0 |
135,845.8 |
200,968.5 |
674.2 |
1,089.6 |
||||
|
Average |
|
|
106,840.8 |
193,261.9 |
511.4 |
1,343.2 |
||||
|
Conclusions: · Luxury apartments have plinth areas approximately 35.5% higher than the standard unit as they provide additional rooms such as pantries, laundry rooms, large balconies, TV-rooms, walk-in closets etc · Luxury apartments also have higher selling prices and rents due to the provision of more sophisticated facilities, designs and finishing thus resulting in higher costs of construction. In addition, luxury apartments are mostly developed in prime areas with high land costs which are then passed on to buyers |
||||||||||
Source: Cytonn Research 2017
- Unique House Designs and Finishing: Luxury residential units exude exclusivity as they adhere to high and modern finishing standards and layout that resonates with and are appreciated by the targeted home owners. For example, while standard houses may be built using red-oxide or ceramic tiles for flooring, luxury apartments use above standard material such as natural marble, granite or wooden flooring, and
- The Amenities: Luxury residential developments offer comfort and convenience that comprehensively support the lifestyle of the buyers such as advanced security measures and recreational facilities such as a club house, swimming pool, a lounge for guests, gym, sauna and steam baths. In addition, they are located in close proximity to convenience stores, entertainment areas, shopping malls and hospitals among other social amenities which provide convenience for the residents.
We compared the prices and rents of luxury developments across Nairobi including The Montave in Upperhill, Le Mac in Westlands, Garden City Apartments along Thika Road, Signature Apartments in Kileleshwa and One, General Mathenge. The findings are summarised below;
|
(All values in Kshs unless stated otherwise) |
||||||||
|
1 Bedroom Units |
||||||||
|
Development |
Area in SQM |
Selling Price |
Price per SQM |
Projected Rent |
Number of Units |
Uptake |
Projected Rental Yield |
Price Appreciation |
|
Le Mac |
81 |
15.2m |
187,654.3 |
150,000.0 |
24 |
100% |
11.8% |
1.1% |
|
Montave |
57 |
9.9m |
172,849.8 |
80,000.0 |
39 |
100% |
8.0% |
13.2% |
|
Average |
69 |
12.5m |
180,252.1 |
115,000.0 |
|
100% |
9.9% |
7.2% |
|
2 Bedroom Units |
||||||||
|
Development |
Area in SQM |
Selling Price |
Price per SQM |
Projected Rent |
Number of Units |
Uptake |
Projected Rental Yield |
Price Appreciation |
|
Le Mac |
114 |
26.9m |
235,675.4 |
200,000.0 |
174 |
26% |
8.9% |
6.3% |
|
Garden City Duplex |
126 |
24.6m |
195,616.1 |
180,000.0 |
15 |
67% |
8.8% |
0.5% |
|
Montave |
90 |
17.0m |
188,241.2 |
120,000.0 |
178 |
85% |
8.5% |
6.5% |
|
Average |
110 |
22.8m |
206,510.9 |
166,666.7 |
|
59% |
8.7% |
4.4% |
|
3 Bedroom Units |
||||||||
|
Development |
Area in SQM |
Selling Price |
Price per SQM |
Projected Rent |
Number of Units |
Uptake |
Projected Rental Yield |
Price Appreciation |
|
Garden City |
178 |
36.2m |
182,714.6 |
195,000.0 |
15 |
67% |
6.8% |
0.6% |
|
One G. Mathenge |
396 |
72.0m |
181,818.2 |
350,000.0 |
10 |
70% |
5.8% |
3.2% |
|
Le Mac |
146 |
27.0m |
184,926.8 |
250,000.0 |
6 |
100% |
11.0% |
1.0% |
|
Signature |
213 |
40.7m |
191,595.4 |
200,000.0 |
12 |
80% |
7.5% |
6.5% |
|
Montave |
133 |
24.7m |
185,524.5 |
150,000.0 |
13 |
100% |
6.9% |
9.1% |
|
Average |
222 |
32.1m |
185,315.9 |
229,000.0 |
|
83% |
7.6% |
4.1% |
|
4 Bedroom Units |
||||||||
|
Development |
Area in SQM |
Selling Price |
Price per SQM |
Projected Rent |
Number of Units |
Uptake |
Projected Rental Yield |
Price Appreciation |
|
One G. Mathenge |
413 |
83.0m |
200,968.5 |
450,000.0 |
21 |
67% |
6.1% |
4.2% |
|
Average |
413 |
83.0m |
200,968.5 |
450,000.0 |
|
67% |
6.1% |
4.2% |
|
Total Average |
|
|
193,261.9 |
|
|
|
8.1% |
5.0% |
|
Conclusions: · One-bedroom apartment prices range from Kshs 9.0 Mn to Kshs 15.2 Mn depending on the area of the unit in square metres while the average monthly rent is Kshs 115,000 · Two-bedroom apartment prices range from Kshs 19.0 Mn to Kshs 26.0 Mn depending on the area of the unit in square metres while the average monthly rent is Kshs 166,000 · Three-bedroom apartment prices range from kshs 24.0 Mn to Kshs 40.0 Mn, with the exception of One General Mathenge whose unit costs Kshs 72.0 Mn due to its large size of 396 square metres. The average monthly rent for 3-bedroom apartments is Kshs 229,000 |
||||||||
Source: Cytonn Research 2017
Since most of our comparables are still under development and thus not renting out yet, we asked what the expected monthly income from the various unit typologies is likely to be, based on neighbouring existing developments. In summary, for an investor, luxury apartments generate higher rental yields of 8.1% compared to the 2017 yields from apartments in the rest of the residential market at 5.6% as shown below;
|
Luxury Apartments Returns 2017 |
||||||
|
Unit Typology |
Average Rent per SM |
Average Price per SM |
Annual Uptake |
Rental Yield |
Price Appreciation |
Total Return |
|
1 Bedroom |
1,627.7 |
180,252.1 |
54.8% |
9.9% |
7.2% |
17.1% |
|
2 Bedroom |
1,504.1 |
206,510.9 |
34.7% |
8.7% |
4.4% |
13.1% |
|
3 Bedroom |
1,151.5 |
185,315.9 |
37.3% |
7.6% |
4.1% |
11.7% |
|
4 Bedroom |
1,089.6 |
200,968.5 |
9.8% |
6.1% |
4.2% |
10.3% |
|
Average |
1,343.2 |
193,261.9 |
34.2% |
8.1% |
5.0% |
13.1% |
|
Residential Apartments 2017 |
511.4 |
106,840.8 |
23.6% |
5.6% |
3.8% |
9.4% |
|
Conclusions: · Luxury apartments have higher rental yields at 8.1% compared to apartments in the rest of the residential sector at 5.6% mainly attributed to higher rents per square metre charged due to prime locations and facilities provided · Luxury apartments also have higher annualized uptake at 34.2% compared to apartments in the rest of the residential sector at 23.6% on average · 1 bedroom units have the highest annual uptake at 54.8% given they are the lowest in supply in the developments. They have the highest returns at 17.1% and thus are most ideal for letting out to young professionals · 2 bedrooms and 3 bedroom units have annual uptake ranging from 34.7% to 37.3%. They attract persons with families and have returns of 13.1% and 11.1%, respectively · 4 bedroom apartments are not popular in the market and thus have slow uptake at 9.8% annually and relatively lower returns at 10.3% |
||||||
Source: Cytonn Research 2017
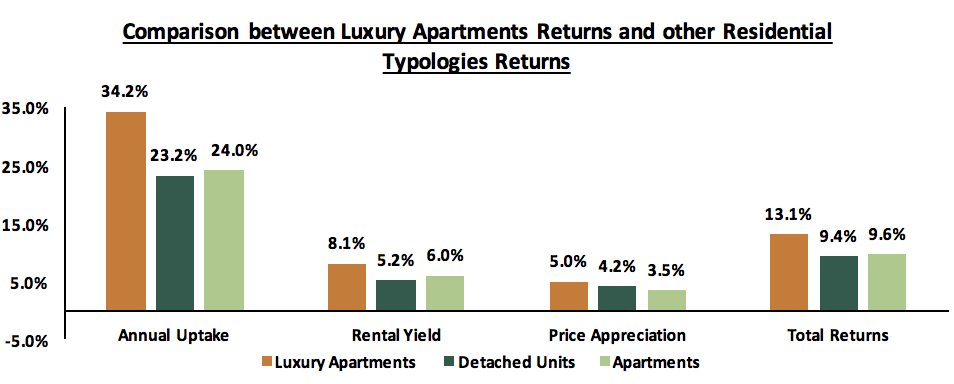
With a total return of 13.1%, luxury apartments are generating a return that is significantly higher by 40%, compared to the rest of the residential sector at 9.4%. The luxury apartments segment is suitable for investors aiming to preserve their capital and generate rental income with little variability. In addition, prospective home owners now have the chance to explore luxurious apartment-themed residential units which provide diversity from the usual luxury detached units thus, indulging in a new, affluent and unique user experience. Below is a comparison of returns between luxury apartments, detached units in the entire residential sector and standard apartments in the entire residential sector in 2017:
Below is a graph showing the comparison between returns of luxury apartments versus other investments in the public markets over the last 5-years:
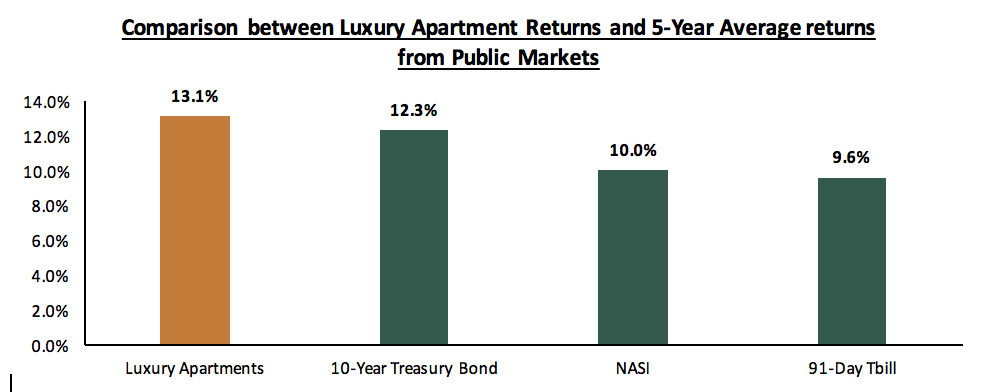
Luxury apartments are therefore generating returns higher than the public markets instruments over the last 5-years.
Having seen that luxury apartments are the best returning part residential sector, for investors looking into luxury residential, we recommend the following:
- Buying prices in the range of Kshs 180,000.0 - Kshs 230,000.0 per square metre for a luxury house depending on the number of bedrooms, the size in square metres and the facilities provided.
- Plinth areas averaging at 69.0 SM for 1 bed-units, 110.0 SM for 2-bed units, 222.0 SM for 3-bed units and 413.0 SM for 4-bed apartments.
- The following neighbourhoods: Upperhill, Kilimani and Westlands due to the following;
- Proximity to commercial offices whose employees would be a target for luxury apartments
- Proximity to high-grade retail and recreational facilities enabling convenience for residents
- Good transport networks in this areas easing accessibility
- Relaxation of zoning regulations allowing developers to construct high-rise units which not only attract residents seeking good views on higher floors, but also enable developers to optimise returns by building more units per acre
- The following typologies: 1 bed, 2 bed and 3 bed apartments. 1-bed apartments are ideal for those looking to let to young professionals and have the highest yields at 9.9% while 2 and 3-bed apartments are ideal for families and have yields of 7.6% to 8.7%.
- Talk to us
- Kenya
- P.O Box 20695 - 00200, Nairobi, Kenya
- Cell +254(0) 709 101 000
- Tel +254(0) 20 3929 000
- WhatsApp +254(0) 748 070 000
- United States
- +1 (240) 368-6217
- DOWNLOAD OUR APP
-


- Kenya
- Cysuites work spaces, Church Rd, Westlands, Nairobi, Kenya
- USA
- Suite 1150, 1775 Eye Street NW, USA, Washington DC 20006, USA
- Investments
- High Yield
- Private Equity
- Real Estate
- Real Estate
- RiverRun Estates
- Cytonn Towers
- The Ridge
- Taraji Heights
- The Alma