Accra, Ghana Real Estate Investment Opportunity, & Cytonn Weekly #47
By Cytonn Research Team, Nov 26, 2017
Executive Summary
Fixed Income
During the week, T-bills were undersubscribed, with the overall subscription rate coming in at 66.0%, compared to 72.6% recorded the previous week, as liquidity in the market remained relatively tight, as a result of transfer of taxes by banks amounting to Kshs 32.8 bn. Yields on the 91, 182 and 364-day papers remained unchanged at 8.0%, 10.5% and 11.0%, respectively. The International Monetary Fund (IMF) this week expressed concerns about Kenya’s debt levels, stating that despite the country’s resilience through both the 2016/17 drought and the elongated election period, debt vulnerability should be addressed;
Equities
During the week, the equities market was on an upward trend with NSE 25, NASI and NSE 20 recording gains of 3.3%, 3.2% and 2.8%, respectively, taking their YTD performance to 26.3%, 24.4% and 20.3% for NASI, NSE 25 and NSE 20, respectively. The upward trend can be attributed to a positive political outlook following the upholding of the Kenyan Presidential re-elections’ win by the Supreme Court. The Kenya Deposit Insurance Corporation (KDIC) and the Central Bank of Kenya (CBK) are set to jointly monitor corporate governance and financial performance of banks, in order to identify early warning signs and discuss resolutions with the owners and directors of these troubled institutions;
Private Equity
Phatisa, a private equity firm focused on Sub-Saharan Africa, has received USD 10.0 mn from the African Development Bank (AfDB) for its Phatisa Food Fund II (PFF2), representing 3.3% of the entire fund target of USD 300.0 mn;
Real Estate
The real estate sector continues to attract international investors with Milost Global Inc, a US based private equity firm with over USD 25.0 bn in committed capital, reported to be partnering with real estate developer Kings Pride Properties Limited to provide Kshs 45.0 bn in financing for its projects. In the retail sector, retailers such as Tuskys and Manix are increasingly expanding into other regions within the country such as Kisumu, Eldoret and Mombasa;
Focus of the Week
In line with our regional expansion strategy, Cytonn continues to conduct comprehensive studies in various markets across Africa, with the aim of offering a diversified investment portfolio to our clients. In August this year, we conducted real estate research for the Kampala market, see Kampala Investment Opportunity. Last week, released the Sub Saharan Africa Financial Services Report . Additionally, we recently conducted real estate research in Accra, Ghana. We expect to be able to provide exposure in these markets to our clients by mid-2019. The research findings herein indicate that Accra’s real estate market offers an attractive investment opportunity compared to other markets such as Nairobi and Kampala, with average rental yields of 14.3%, 10.1%, 9.5% and 7.6% for serviced offices, un-serviced offices, retail, and residential, respectively. The hospitality sector has better performance as well, with average daily rates of USD 210 compared to Nairobi’s USD 130, and occupancy rates averaging 61.0% in Accra compared to Nairobi’s 55.0%. From our research and analysis, the best investment opportunities in Accra are in serviced offices, and 3, 4 and 5 star hotels.
- On Thursday 23rd November, 2017, Cytonn Foundation, our Corporate Social Responsibility arm, held the annual Cytonn e-Hub Investor Forum. Cytonn is a brand that is committed to growing entrepreneurs in Kenya and equipping them with the right information that will assist them in attaining maximum social impact by helping them to scale up. Cytonn Foundation’s aim is to promote an entrepreneurial culture in Kenya and the region through training and mentorship programs. See Event Note
- Cytonn Investments Management Plc emerged the national winner in the Investment Manager - Alternative Investment & Private Equity category in the Think Business Investment Awards 2017, an improvement from 1st runners up position attained during the 2016 awards. See Event Note
- We continue to showcase our real estate developments through weekly site visits. Watch progress videos and pictures of The Alma, Amara, The Ridge and Taraji Heights. The site visits target both investors looking to invest in real estate directly and those interested in high yield investment products to familiarize themselves with how we support our high yields. Key to note is that our cost of capital is priced off the loan markets where all-in pricing ranges from 16.0% to 21.0% and our yield on real estate developments ranges from 23.0% to 25.0%, hence our top-line gross spread is about 6.0%. If interested in attending the site visits, kindly register here
- We continue to see very strong interest in our Private Wealth Management training (largely covering financial planning and structured products), which is at no cost, and is held bi-weekly, but is open only to pre-screened participants. We also continue to see institutions and investment groups interested in the trainings for their teams. The Wealth Management Trainings are run by the Cytonn Foundation under its financial literacy pillar, and if interested in the training for your employees or investment group please get in touch with us through clientservices@cytonn.com or book through this link Wealth Management Training.
- For recent news about the company, see our news section here
- We have 10 investment-ready projects, offering attractive development and buyer targeted returns of around 23.0% to 25.0% p.a. See further details here: Summary of investment-ready projects
- To invest in any of our current or upcoming real estate projects, please visit Cytonn Real Estate
- Cytonn Towers, where we are only selling residential units in the first phase of residential apartments, is currently about 20.0% sold. See Cytonn Towers
- The Alma, which is 55.0% sold. See The Alma
- Amara Ridge is currently 100.0% sold. See Amara Ridge
- Situ Village is currently 22.0% sold. See Situ Village
- The Ridge (Phase 1) is currently 31.0% sold. See The Ridge
- Taraji Heights is currently 14.0% sold. See Taraji Heights
- RiverRun Estates (Phase 1) is currently 11.0% sold. See RiverRun Estates
- With over 10 investment ready projects worth over Kshs 82.0 billon of project value, we shall be very selective on new real estate projects going forward, only focusing on Joint Ventures and real estate opportunities with deep value. We are increasingly focused on private equity deals. Should you have any deals in banking, insurance, education, hospitality and technology sectors, kindly email a teaser to PE@cytonn.com
- We continue to beef up the team with ongoing hires: Careers at Cytonn .
During the week, T-bills were undersubscribed, with the overall subscription rate coming in at 66.0%, compared to 72.6% recorded the previous week, due to relatively tight liquidity in the money market, as a result of transfer of taxes by banks amounting to Kshs 32.8 bn that fell due on 20th November. The subscription rates for the 91, 182 and 364-day papers came in at 108.4%, 48.6%, and 66.5% compared to 44.2%, 91.1% and 65.6%, respectively, the previous week. Yields on the 91, 182 and 364-day papers remained unchanged at 8.0%, 10.5% and 11.0%, respectively. The overall acceptance rate came in at 96.6%, compared to 99.4% the previous week, with the government accepting a total of Kshs 15.3 bn of the Kshs 15.9 bn worth of bids received, against the Kshs 24.0 bn on offer. The government is still behind its domestic borrowing target for the current fiscal year, having borrowed Kshs 86.8 bn, against a target of Kshs 165.7 bn (assuming a pro-rated borrowing target throughout the financial year of Kshs 410.2 bn budgeted for the full financial year as per the Cabinet-approved 2017 Budget Review and Outlook Paper (BROP)).
Liquidity in the money market was tight during the week, with a net liquidity injection of Kshs 2.2 bn, compared to a net injection of Kshs 1.8 bn the previous week. The CBK was active in the Repo market, injecting Kshs 3.1 bn through Reverse Repo Purchases in a bid to counter the tight liquidity. The average interbank rate declined marginally to 9.0% from 9.4% recorded the previous week, while the average volumes traded in the interbank market decreased by 19.1% to Kshs 18.7 bn from Kshs 23.2 bn the previous week. It is important to note that for this week, banks holding of excess liquidity stood at Kshs 10.4 bn above the 5.25% requirement, from Kshs 4.4 bn the previous week, as banks accumulated liquidity needed for transfer of taxes that fell due on 20th November, as can be seen below from the Kshs 32.8 bn liquidity reduction in transfer of taxes from banks.
Below is a summary of the money market activity during the week:
|
all values in Kshs bn, unless stated otherwise |
|||
|
Weekly Liquidity Position – Kenya |
|||
|
Liquidity Injection |
|
Liquidity Reduction |
|
|
Term Auction Deposit Maturities |
0.0 |
T-bond sales |
0.0 |
|
Government Payments |
23.9 |
Transfer from Banks - Taxes |
32.8 |
|
T-bond Redemptions |
27.9 |
T-bill (Primary issues) |
17.3 |
|
T-bill Redemption |
0.0 |
Term Auction Deposit |
0.0 |
|
T-bond Interest |
9.7 |
Reverse Repo Maturities |
3.7 |
|
T-bill Re-discounts |
0.0 |
Repos |
8.6 |
|
Repos Maturities |
0.0 |
||
|
Reverse Repo Purchases |
3.1 |
||
|
Total Liquidity Injection |
64.6 |
Total Liquidity Withdrawal |
62.4 |
|
Net Liquidity Injection |
2.2 |
||
Last week, the Kenyan Government issued a 7-year amortized Infrastructure Bond (IFB 1/2017/7), with an effective tenor of 6.0 years, and a coupon of 12.5%, in a bid to raise Kshs 30.0 bn for partial support of infrastructural projects in the roads (Kshs 10.0 bn), energy (Kshs 15.0 bn) and water (Kshs 5.0 bn) sectors. The overall subscription rate for the bond issue came in at 153.0%, with the market average bid rate coming in at 12.3%, slightly above the accepted rate of 12.2%, and higher than the 11.4% after-tax yield on a similar tenor bond trading in the secondary market. The government accepted Kshs 42.0 bn out of the Kshs 45.9 bn worth of bids received, translating to an acceptance rate of 91.5%.
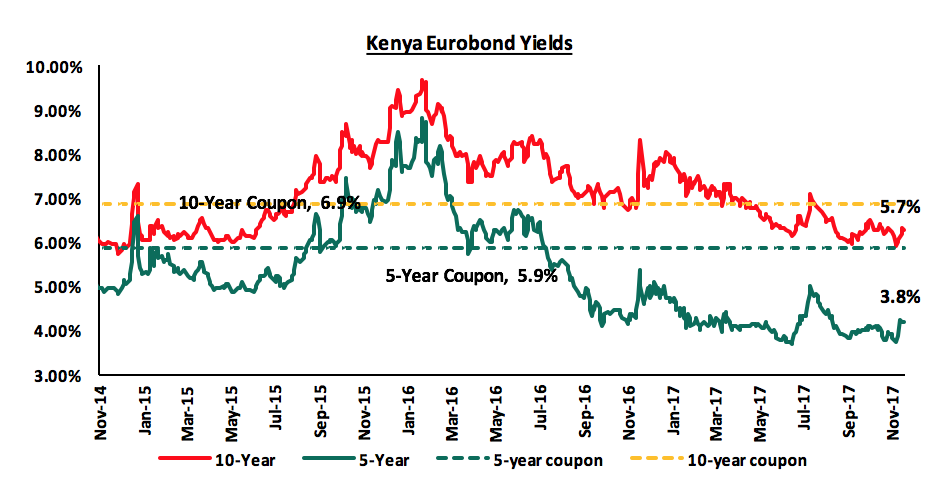
According to Bloomberg, yields on the 5-year and 10-year Eurobonds declined by 20 bps and 30 bps, respectively, during the week, to close at 3.8% and 5.7%, from 4.0% and 6.0% the previous week, respectively. Since the mid-January 2016 peak, yields on the Kenya Eurobonds have declined by 5.0% points and 4.0% points for the 5-year and 10-year Eurobonds, respectively, due to the relatively stable macroeconomic conditions in the country. The declining Eurobond yields and stable rating by Standard & Poor (S&P), in spite of the political uncertainty around the presidential poll re-run, are indications that Kenya’s macro-economic environment remains stable and hence an attractive investment destination. However, concerns from Moody’s around Kenya’s rising debt to GDP levels may see Kenya receive a downgraded sovereign credit rating.
The Kenya Shilling appreciated by 0.6% against the US Dollar during the week to close at Kshs 103.3, from Kshs 103.9 recorded the previous week, due to increased foreign investor inflows into the equities market and primary bond auction. On a year to date basis, the shilling has depreciated against the dollar by 0.7%. In our view, the shilling should remain relatively stable against the dollar in the short term supported by (i) expected calm in the political front following the conclusion of the presidential elections, (ii) the weakening of the USD in the global markets as indicated by the US Dollar Index, which has shed 9.1% year to date, and (iii) the CBK’s activity, as they have sufficient forex reserves, currently at USD 7.1 bn (equivalent to 4.7 months of import cover).
We are projecting the inflation rate for the month of November to decline to a range of between 5.0% - 5.3%, from 5.7% in October, mainly due to an expected decline in food prices following favourable weather conditions in the month, despite an increase in fuel prices during the month. Going forward to the end of 2017, we expect inflationary pressures to be subdued given food prices are expected to stabilize on account of the ongoing rains. We expect inflationary pressures to ease in the last two months of 2017, but average 8.1% over the course of the year, which is above the upper bound of the government target range of 2.5% - 7.5%.
The International Monetary Fund (IMF) this week expressed concerns about Kenya’s debt levels, stating that, despite the country’s resilience through the 2016/17 drought and the elongated election period, debt vulnerability should be addressed. According to CBK data, Kenya’s total debt has continued to grow, and has risen 21.0% y/y to Kshs 4.5 tn in September 2017 from Kshs 3.7 tn in September 2016. Furthermore, the budget deficit to GDP was expected to increase to 7.9% in the fiscal year 2017/18 from 6.2% previously and public debt to GDP ratio was expected to hit 59.0% by December 2017 from 51.8% previously targeted, that being 900 bps above the 50.0% IMF threshold, which is what is raising concerns over Kenya’s debt vulnerability. The Treasury is also contemplating taking on a syndicated loan and floating another Eurobond in a bid to meet its foreign borrowing target of Kshs 277.3 bn, which will further add to Kenya’s debt exposure. We are of the same view as the IMF that the debt levels need to be kept sustainable, and be driven towards recommended levels, such as the 50.0% IMF threshold. As mentioned in our topical on Post-Election Areas of Focus, the government should manage the debt levels by (i) enhanced tax revenue collection, (ii) more Public-Private Partnerships (PPPs) to involve the private sector in development funding, and (iii) reduce recurrent expenditure, which as per the BROP is actually expected to increase by 7.1% in FY 2017/18 mainly due to increased expenditure on the presidential re-run.
The Monetary Policy Committee (MPC) met this week, on Thursday 23rd November 2017, to review the prevailing macroeconomic conditions and give direction on the Central Bank Rate (CBR). The MPC maintained the CBR at 10.0%, which was in line with our expectations as per our MPC Note. The Committee indicated that the decision was on the back of a relatively stable macroeconomic environment, given:
- Inflation declined to 5.7% in October, from 7.1% in September, primarily due to reduced food prices,
- The foreign exchange market has remained relatively stable,
- The foreign reserves at USD 7.1 bn translating to 4.7 months of import cover, with a standby facility of USD 1.5 bn from the IMF, provide an adequate buffer for short term pressure on the shilling, and,
- A resilient banking sector, with the average commercial banks liquidity ratio and capital adequacy ratio at 44.7% and 18.8%, against statutory limits of 20.0% and 14.5%, respectively, as at August 2017, with the gross NPL ratio improving slightly to 10.6% in October, from 10.7% in August.
See the CBK release.
Key to note is that private sector credit growth improved slightly once again to 2.0% in October, from 1.7% in September, however this remains way below the government set annual target of 18.3%.
Rates in the fixed income market have remained stable, and we expect this to continue in the short-term. However, a budget deficit that is likely to result from depressed revenue collection creates uncertainty in the interest rates environment as any additional borrowing in the domestic market to plug the deficit could lead to upward pressures on interest rates. Our view is that investors should be biased towards short-to medium term fixed income instruments to reduce duration risk.
During the week, the equities market was on an upward trend with NSE 25, NASI and NSE 20 recording gains of 3.3%, 3.2% and 2.8%, respectively, taking their YTD performance to 26.3%, 24.4% and 20.3% for NASI, NSE 25 and NSE 20, respectively. This week’s performance was driven by gains in select large cap stocks such as Equity Group, Safaricom and KCB Group, which gained 5.5%, 4.9% and 4.3%, respectively. Safaricom rallied during the week, touching a 12-month high of Kshs 28.5 per share. It however eased back to close the week at Kshs 26.8 per share. Since the February 2015 peak, the market has lost 5.1% and 30.3% for NASI and NSE 20, respectively.
Equities turnover declined slightly by 0.4% to USD 33.4 mn from USD 33.5 mn the previous week. Foreign investors turned net buyers with a net inflow of USD 4.7 mn compared to a net outflow of USD 1.3 mn recorded the previous week. We expect the market to remain supported by improved investor sentiment once uncertainty dissipates, as investors take advantage of the attractive stock valuations.
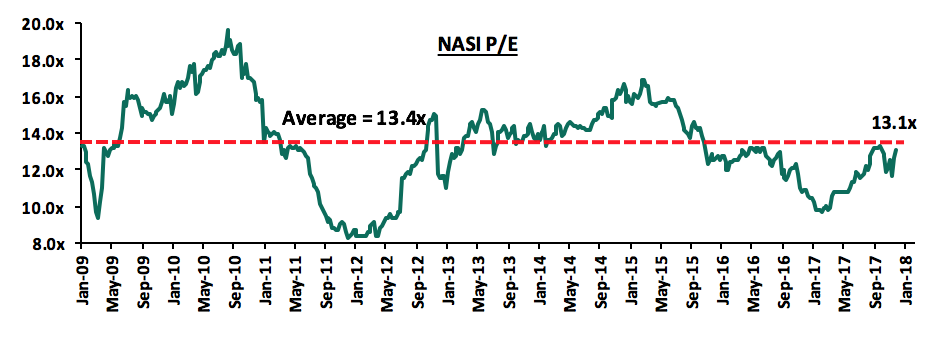
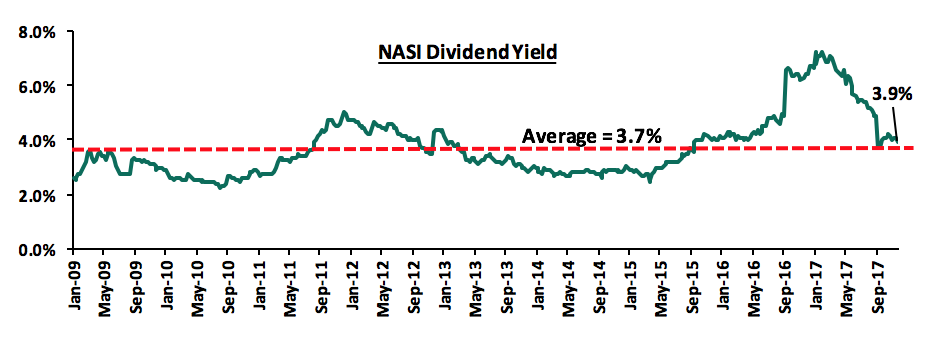
The market is currently trading at a price to earnings ratio (P/E) of 13.1x, versus a historical average of 13.4x, and a dividend yield of 3.9%, compared to a historical average of 3.7%. In our view, there still exist pockets of value in the market, with the current P/E valuation being 22.5% below the most recent peak in February 2015. The current P/E valuation of 13.1x is 35.2% above the most recent trough valuation of 9.7x experienced in the first week of February 2017, and 57.8% above the previous trough valuation of 8.3x experienced in December 2011. The charts below indicate the historical P/E and dividend yields of the market.
The Kenya Deposit Insurance Corporation (KDIC) and the Central Bank of Kenya (CBK) are set to jointly monitor corporate governance and financial performance of banks, in order to identify early warning signs and discuss resolutions with the owners and directors of any troubled institutions. KDIC plays the role of protecting depositors against loss of all their deposits in case of a bank failure, by providing payments of insured deposits. This move is expected to curb runs on deposits and safeguard depositors as regulators will ensure revival of institutions, with liquidation being a last resort. This serves as relief for depositors as they could soon be spared the distress of having their money locked up in failed banks. These measures come after the collapse of Chase Bank, which has since been acquired, Imperial Bank (which is in the process of reopening) and Dubai Bank, which shook depositors' confidence in the banking sector, leading to flight to safety of deposits from small banks to large banks. This is a good move by the regulators as it will ensure bank failures are minimised, and reduce disruptions and the negative impact on financial stability in the banking sector resulting from banks being put under receivership.
During the week, we had a number of earnings releases. Below is the detailed analysis of the earnings’ releases:
NIC Bank released Q3’2017 results
NIC Bank released Q3’2017 results, recording a 2.5% decline in core earnings per share to Kshs 3.3 from Kshs 3.4 in Q3’2016, attributable to an 18.8% decline in total operating income, despite a 24.8% decrease in operating expenses. Key highlights for the performance from Q3’2016 to Q3’2017 include:
- Total operating income declined by 18.8% to Kshs 10.1 bn from Kshs 12.5 bn in Q3'2016, driven by a 21.8% decline in Net Interest Income (NII) to Kshs 7.4 bn from Kshs 9.4 bn in Q3'2016, and a 9.6% decline in Non-Funded income to Kshs 2.8 bn from Kshs 3.1 bn in Q3’2016,
- Interest Income decreased by 15.7% to Kshs 12.4 bn from Kshs 14.7 bn in Q3’2016. The decline is attributable to a 16.1% decline in interest income on loans & advances to Kshs 9.2 bn from Kshs 11.1 bn, despite an increase in interest income on government securities by 14.3% to Kshs 3.2 bn from Kshs 2.8 bn in Q3’2016,
- Interest expense increased by 3.8% to Kshs 5.5 bn from Kshs 5.3 bn in Q3’2016, attributed to a 2.4% increase in interest expense on customer deposits to Kshs 4.3 bn from Kshs 4.2 bn in Q3’2016 and an 11.1% in other interest expenses to Kshs 1.0 bn from Kshs 0.9 bn in Q3’2016. This coupled with a 15.7% decline in interest income led to a 21.8% decline in the Net Interest Income to Kshs 7.4 bn from Kshs 9.4 bn. The Net Interest Margin thus declined to 6.4% from 8.3% in Q3'2016,
- Non-Funded Income (NFI) recorded a decline of 9.6% to Kshs 2.8 bn from Kshs 3.1 bn in Q3'2016. The decline in NFI was driven by a decrease in other income that shed 47.0% to Kshs 0.4 bn from Kshs 0.7 bn in Q3’2016 despite the 2.4% increase in fees & commissions on loans to Kshs 0.97 bn from Kshs 0.95 bn in Q3’2016. The decline in NFI is however against the performance of majority of the other banks which have recorded a weighted average growth of 10.8%,
- The current revenue mix came in at 73:27 funded to non-funded income from 75:25 in Q3’2016,
- Total operating expenses decreased by 24.8% to Kshs 5.8 bn from Kshs 7.7 bn, driven by a 34.6% decrease in Loan Loss Provisions (LLP) to Kshs 2.1 bn from Kshs 3.2 bn, coupled with a 15.0% decline in staff costs to Kshs 1.9 bn from Kshs 2.3 bn in Q3'2016. The decline in staff costs is attributable to job cuts that saw the bank retrench senior level employees in a move to cut on operational costs. Staff costs account for 32.9% of operating expenses while LLPs account for 36.0% of operating expenses,
- The Cost to Income ratio improved to 57.4% from 62.0% in Q3'2016, following the 24.8% decrease in total operating expenses that outpaced the 18.8% decline in total operating income. Without LLP, the Cost to Income ratio deteriorated to 36.7% from 36.4% in Q3'2016,
- Profit before tax decreased by 8.9% to Kshs 4.3 bn from Kshs 4.7 bn, while profit after tax decreased by 2.5% to Kshs 3.3 bn from Kshs 3.4 bn in Q3’2016, due to the one-off deferred tax asset of Kshs 0.8 bn recorded in Q3’2017.
- The balance sheet recorded an expansion in Q3’2017, with total assets increasing by 10.0% to Kshs 181.9 bn from Kshs 165.3 bn in Q3'2016. This growth was driven by a 42.4% increase in investment in government securities to Kshs 49.3 bn from Kshs 34.6 bn in Q3'2016, despite a 0.2% decrease in the loan book, which is 60.6% of the bank’s total assets, to Kshs 110.3 bn from Kshs 110.5 bn in Q3’2016. Contribution of government securities to the total interest earning assets increased to 30.0% from 23.1% in Q3’2016,
- Total liabilities rose by 13.3% to Kshs 153.8 bn from Kshs 135.7 bn in Q3'2016, driven by a 13.6% increase in deposits to Kshs 123.1 bn from Kshs 108.4 bn in Q3'2016. Shareholders’ funds decreased by 3.3% to Kshs 28.1 bn from Kshs 29.1 bn in Q3’2016,
- The increase in deposits and decline in loans led to a decline in the loan to deposit ratio to 89.6% from 101.9% in Q3'2016,
- NIC Group is currently sufficiently capitalized with a core capital to risk weighted assets ratio at 16.3%, 5.8% above the statutory requirement, with total capital to total risk weighted assets exceeding statutory requirement by 5.1%,
- NIC Group currently has a return on average assets of 2.4% and a return on average equity of 14.9%, against an industry average return on average assets of 2.9% and a return on average equity of 18.1%.
Key Take outs:
- Resilience through improved efficiency and coverage. NIC Group’s cost to income ratio improved by 4.6 percentage points to 57.4% from 62.0% in Q3’2016, due to a faster decline in operating expenses by 24.8%, compared to the 18.8% decline in operating income. This was driven by a 15.0% decline in staff costs to Kshs 1.9 bn from Kshs 2.3 bn in Q3’2015, with staff costs constituting 32.9% of operating expenses,
- Prudence through improved coverage. The lender’s largest cost component, LLPs at 36.0%, declined by 34.6% to Kshs 2.1 bn from Kshs 3.2 bn, as NPLs and loans declined by 2.5% and 0.2%, respectively. With the declining gross NPL ratio due to this, we notice that the NPL coverage ratio improved to 50.9% from 22.4% in Q3’2016,
- Going forward, we expect NIC Group to reap the benefits expected from the newly concluded restructuring, which include improved capital use, strategic and risk management. This is expected to result in further gradual improvement of efficiency and asset quality, observed through improving cost to income and gross NPL ratios, respectively.
For a more comprehensive analysis, see our NIC Bank Q3’2017 Earnings Note.
Barclays Bank released Q3’2017 results
Barclays Bank released Q3’2017 results, recording a 12.0% decline in core earnings per share to Kshs 1.0 from Kshs 1.1 in Q3’2016, attributable to a 7.5% decline in operating revenue outpacing a 5.3% decline in operating expenses. Key highlights for the performance from Q3’2016 to Q3’2017 include:
- Total operating revenue declined by 7.5% y/y to Kshs 22.6 bn from Kshs 24.4 bn, driven by a 14.8% decline in Non-Funded Income (NFI) to Kshs 6.5 bn from Kshs 7.6 bn in Q3'2016, and a 4.2% decline in Net Interest Income (NII) to Kshs 16.1 bn from Kshs 16.9 bn,
- Interest Income declined by 4.6% to Kshs 20.1 bn from Kshs 21.1 bn in Q3’2016, despite the loan book recording a 5.3% growth, implying that the decline was an effect of the interest rate cap. The decline in interest income is attributable to 97.9% y/y decline in other interest income to Kshs 0.03 bn from Kshs 1.31 bn, and a 2.2% y/y decline on loans and advances to Kshs 15.9 bn from Kshs 15.6 bn, while interest income on government securities grew by a marginal 0.5% y/y to Kshs 4.1 bn from Kshs 4.0 bn. As a result, the yield on interest-earning assets declined to 12.1% from 13.8% in Q3’2016,
- Interest expense decreased by 6.3% to Kshs 4.0 bn from Kshs 4.2 bn in Q3’2016, following a 100.0% decline in other interest expenses to Kshs 0.0 bn from Kshs 0.5 bn in Q3’2016. The Net Interest Income declined by 4.2% to Kshs 16.1 bn from Kshs 16.9 bn in Q3’2016. The Net Interest Margin thus declined to 9.7% from 10.9% in Q3'2016,
- Non-Funded Income (NFI) recorded a drop of 14.8% to Kshs 6.5 bn from Kshs 7.6 bn in Q3'2016. The decline in NFI was driven by a 54.5% drop in fees and commissions on loans to Kshs 0.5 bn from Kshs 1.1 bn in Q3’2016, and an 8.7% decline in other fees and commissions to Kshs 3.5 bn from Kshs 3.8 bn. With the decline in NFI faster than the decline in NII, the proportion of NFI to total revenue also declined, with the current revenue mix at 71:29 funded to non-funded income from 69:31 in Q3’2016,
- Total operating expenses declined by 5.3% to Kshs 14.8 bn from Kshs 15.7 bn, attributable to a 25.6% drop in loan loss provisions (LLP) to Kshs 2.3 bn from Kshs 3.1 bn in Q3’2016 despite a 9.8% growth in staff costs to Kshs 8.1 bn from Kshs 7.4 bn in Q3’2016. The growth in staff costs is attributed to the voluntary employee buyout programme that the bank rolled out and saw 145 employees leave the firm as at October this year,
- Following a faster decline in operating revenue than in operating expenses, the Cost to Income ratio worsened to 65.9% from 64.3% in Q3'2016. Without LLP, the Cost to Income ratio worsened to 55.6% from 51.5% in Q3'2016,
- Profit before tax declined by 11.5% to Kshs 7.7 bn from Kshs 8.7 bn. Profit after tax declined by 12.0% to Kshs 5.3 bn from Kshs 6.1 bn in Q3’2016.
- Total assets increased by 5.3% to Kshs 278.0 bn from Kshs 264.0 bn in Q3'2016. This growth was driven by a 5.3% growth in the loan book to Kshs 167.2 bn from Kshs 158.8 bn in Q3’2016. Investment in government increased marginally by 1.6% to Kshs 57.6 bn from Kshs 56.7 bn in Q3'2016. The 5.3% loan book growth was supported by strong performance in lending to the consumer and SME segments of the business,
- Total liabilities rose by 5.8% to Kshs 235.4 bn from Kshs 222.5 bn in Q3'2016, driven by a 10.8% increase in deposits to Kshs 200.4 bn from Kshs 180.9 bn in Q3'2016. The increase in deposits was driven by an increase in transactional accounts following the launch of new products such as the Twin Account
- Shareholders’ funds increased by 2.6% to Kshs 42.5 bn from Kshs 41.5 bn in Q3’2016, due to a 2.8% y/y increase in retained earnings to Kshs 39.4 bn from Kshs 38.3 bn in Q3’2016,
- The faster growth in deposits compared to the loan book led to a drop in the loan to deposit ratio to 83.5% from 87.8% in Q3'2016,
- Barclays Bank Kenya is currently sufficiently capitalized with a core capital to risk weighted assets ratio at 15.9%, 5.4% above the statutory requirement, with total capital to total risk weighted assets exceeding statutory requirement by 3.5%,
- Barclays Bank Kenya currently has a return on average assets of 2.6% and a return on average equity of 15.9%, against an industry average return on average assets of 2.9% and a return on average equity of 18.1%.
Going forward, we expect BBK’s growth to be propelled by their investments in innovation, technology, introduction of new products, review of their existing products, their Customer Life-cycle Management (CLM) analysis and diversification of their revenue streams to increase their non-funded income contribution to total operating income, which currently standing at 28.6%.
For a more comprehensive analysis, see our Barclays Bank Q3’2017 Earnings Note.
Stanbic Bank released Q3’2017 results
Stanbic Bank released Q3’2017 results, recording a 19.7% rise in EPS to Kshs 18.9 from Kshs 15.8 in Q3'2016, largely on account of an improvement in the hyper-inflationary environment in South Sudan that saw an improvement in the expensing of the exceptional items by 91.0% to Kshs 0.1 bn from Kshs 1.1 bn in Q3’2016. Profit before tax decreased by 17.4% to Kshs 4.4 bn from Kshs 5.3 bn in Q3’2016 driven by the 1.7% decline in operating income and the 7.6% increase in operating expenses. Key highlights for the performance from Q3’2016 to Q3’2017 include:
- Total operating income declined by 1.7% to Kshs 14.0 bn from Kshs 14.2 bn in Q3'2016, attributed to a 6.5% decline in Net Interest Income (NII) to Kshs 7.8 bn from Kshs 8.3 bn in Q3'2016, despite a 5.1% increase in Non-Funded income to Kshs 6.2 bn from Kshs 5.9 bn in Q3’2016,
- Interest Income decreased by 7.3% to Kshs 12.2 bn from Kshs 13.2 bn in Q3’2016. This is attributable to a 3.6% decline in interest income on loans & advances to Kshs 8.9 bn from Kshs 9.3 bn and a 15.4% decline in interest income on government securities to Kshs 3.0 bn from Kshs 3.6 bn in Q3’2016,
- Interest expense declined by 8.8% to Kshs 4.4 bn from Kshs 4.9 bn in Q3’2016, following a 3.2% and 29.6% decline in interest expense on customer deposits and other interest expenses, respectively,
- Non-Funded Income (NFI) recorded a growth of 5.1% to Kshs 6.2 bn from Kshs 5.9 bn in Q3'2016. The growth in NFI was driven by a 29.0% increase in fees & commissions on loans to Kshs 0.3 bn from Kshs 0.2 bn in Q3’2016,
- The current revenue mix came in at 56:44 funded to non-funded income from 58:42 in Q3’2016,
- Total operating expenses increased by 7.6% to Kshs 9.6 bn from Kshs 8.9 bn, attributed to an 88.5% increase in Loan Loss Provisions (LLP) to Kshs 2.3 bn from Kshs 1.2 bn, despite a 1.5% decline in staff costs to Kshs 3.61 bn from Kshs 3.67 bn in Q3'2016. Staff costs account for 37.7% of operating expenses while LLPs account for 23.6% of operating expenses,
- The Cost to Income ratio deteriorated to 68.6% from 62.7% in Q3'2016, following the 7.6% increase in total operating expenses coupled with the 1.7% decline in total operating income. Without LLP, the Cost to Income ratio improved to 52.4% from 54.2% in Q3'2016,
- Profit before tax decreased by 17.4% to Kshs 4.4 bn from Kshs 5.3 bn, while profit after tax increased by 19.7% to Kshs 3.2 bn from Kshs 2.7 bn in Q3’2016, largely on account of a decline in exceptional items that declined by 91.0% to Kshs 0.1 bn from Kshs 1.1 bn in Q3’2016, brought about by an adjustment related to the hyper-inflationary environment in South Sudan,
- The balance sheet recorded an expansion, with total assets increasing by 2.9% to Kshs 236.5 bn from Kshs 229.9 bn in Q3'2016. This growth was driven by a 13.8% increase in the loan book to Kshs 121.3 bn from Kshs 106.7 bn in Q3'2016,
- Total liabilities rose by 1.6% to Kshs 204.6 bn from Kshs 201.3 bn in Q3'2016, driven by an 8.2% increase in deposits to Kshs 150.9 bn from Kshs 139.4 bn in Q3'2016.
- Shareholders’ funds increased by 11.6% to Kshs 31.9 bn from Kshs 28.6 bn in Q3’2016,
- The faster increase in loans than deposits led to an increase in the loan to deposit ratio to 80.4% from 76.5% in Q3'2016,
- Stanbic Bank is currently sufficiently capitalized with a core capital to risk weighted assets ratio at 15.2%, 4.7% above the statutory requirement, with total capital to total risk weighted assets exceeding statutory requirement by 2.5%.
Going forward, we expect Stanbic Bank’s growth to be propelled by their diversified and clearly defined business strategy, enabling the bank to respond effectively to shifting market dynamics, with their non-funded income at 44.4% of total operating income, coupled with the roll out of their new digital platform and support systems.
Below is a summary of the Q3’2017 results for the eight listed banks that have released thus far and key take-outs from the results:
|
Listed Banks Q3'2017 Earnings and Growth Metrics |
||||||||||||||||||
|
Bank |
Core EPS Growth |
Interest Income Growth |
Interest Expense Growth |
Net Interest Income Growth |
Non Funded Income (NFI) Growth |
NFI to Total Operating Income |
Growth in total fees and commissions |
Loan Growth |
Deposits Growth |
Growth in Govt Securities |
||||||||
|
|
Q3'2017 |
Q3'2016 |
Q3'2017 |
Q3'2017 |
Q3'2017 |
Q3'2017 |
Q3'2017 |
Q3'2017 |
Q3'2017 |
Q3'2016 |
Q3'2017 |
Q3'2016 |
Q3'2017 |
|||||
|
Stanbic |
19.7% |
(2.1%) |
(7.3%) |
(8.8%) |
(6.5%) |
5.1% |
44.4% |
45.3% |
13.8% |
1.9% |
8.2% |
22.8% |
40.0% |
|||||
|
KCB |
5.0% |
16.1% |
(3.6%) |
(10.9%) |
(1.0%) |
18.4% |
32.9% |
25.5% |
15.1% |
4.9% |
13.6% |
(7.3%) |
2.8% |
|||||
|
NIC Bank |
(2.5%) |
(6.4%) |
(15.7%) |
3.8% |
(21.8%) |
(9.6%) |
27.4% |
1.8% |
(0.2%) |
(0.7%) |
13.6% |
2.4% |
40.0% |
|||||
|
Equity |
(2.7%) |
17.7% |
(11.1%) |
5.9% |
(15.0%) |
28.3% |
43.6% |
24.9% |
(2.2%) |
3.0% |
11.3% |
4.8% |
17.7% |
|||||
|
DTB |
(3.5%) |
11.4% |
0.8% |
3.7% |
(1.4%) |
4.7% |
21.2% |
8.6% |
8.1% |
5.4% |
16.5% |
29.9% |
18.2% |
|||||
|
Co-op |
(9.5%) |
22.3% |
(7.7%) |
(8.5%) |
(7.3%) |
2.7% |
32.8% |
5.9% |
14.2% |
6.9% |
12.1% |
1.7% |
0.8% |
|||||
|
Barclays |
(12.0%) |
(5.4%) |
(4.6%) |
(6.3%) |
(4.2%) |
(14.8%) |
31.0% |
(17.6%) |
5.3% |
14.3% |
10.8% |
13.4% |
28.8% |
|||||
|
StanChart |
(39.1%) |
24.5% |
(1.4%) |
19.1% |
(8.0%) |
(3.2%) |
31.8% |
(4.0%) |
(5.4%) |
14.1% |
19.5% |
19.8% |
19.9% |
|||||
|
Weighted Average* |
(6.5%) |
15.2% |
(6.6%) |
(0.7%) |
(8.2%) |
10.8% |
36.7% |
14.6% |
6.3% |
6.6% |
13.9% |
7.6% |
16.0% |
|||||
|
* The weighted average is based on Market Cap as at 24th November, 2017 |
|
|||||||||||||||||
Key takeaways:
- Of the 8 banks that have released their Q3’2017 results, only Stanbic Bank and KCB Group have recorded a growth in core earnings per share, with the average decline in core earnings across the banking sector at 6.5%, owing to the tough operating environment as a result of the interest rate caps and political uncertainty in the country that affected the business environment,
- Average deposit growth came in at 13.9%. However, despite the average deposits having grown, the interest expense paid on deposits recorded a negative growth of 0.7% on average, indicating that banks are growing deposits but opening less interest earning accounts and possibly transferring some existing interest earning accounts to transaction accounts,
- Average loan growth has been recorded at 6.3%, however interest income has decreased by 6.6%, showing the effects of the rate caps,
- Investment in government securities has grown by 16.0% outpacing loan growth of 6.3%, showing increased lending to the government by banks as they avoid the risky borrowers,
- Non-funded income has however grown by 10.8%, which included a Fee and Commissions growth of 14.6%. This shows that banks are charging more fee income to improve their total yield on loans above the rate cap maximum.
Below is our Equities Universe of Coverage:
|
all prices in Kshs unless stated otherwise |
||||||||
|
No. |
Company |
Price as at 17/11/17 |
Price as at 24/11/17 |
w/w Change |
YTD Change |
Target Price* |
Dividend Yield |
Upside/ (Downside)** |
|
1. |
NIC*** |
36.3 |
36.8 |
1.4% |
41.3% |
58.2 |
3.3% |
61.7% |
|
2. |
KCB Group*** |
41.0 |
42.8 |
4.3% |
48.7% |
57.1 |
4.9% |
38.5% |
|
3. |
Barclays |
9.8 |
9.9 |
1.5% |
16.7% |
12.5 |
10.0% |
36.2% |
|
4. |
DTBK |
187.0 |
190.0 |
1.6% |
61.0% |
234.1 |
1.3% |
24.5% |
|
5. |
Kenya Re |
19.9 |
20.3 |
1.8% |
(10.0%) |
24.4 |
3.8% |
24.3% |
|
6. |
I&M Holdings |
120.0 |
126.0 |
5.0% |
40.0% |
149.6 |
2.5% |
21.2% |
|
7. |
Liberty |
12.5 |
13.7 |
9.2% |
3.4% |
16.4 |
0.0% |
20.1% |
|
8. |
Jubilee |
494.0 |
490.0 |
(0.8%) |
0.0% |
575.4 |
1.8% |
19.2% |
|
9. |
Sanlam Kenya |
27.0 |
27.8 |
2.8% |
0.9% |
31.4 |
1.0% |
14.1% |
|
10. |
Co-op Bank |
16.1 |
16.2 |
0.9% |
22.7% |
17.5 |
5.7% |
13.7% |
|
11. |
HF Group*** |
12.2 |
12.7 |
4.1% |
(9.3%) |
14.2 |
1.8% |
13.6% |
|
12. |
CIC Group |
5.6 |
5.9 |
6.3% |
55.3% |
6.2 |
1.8% |
6.9% |
|
13. |
Britam |
14.5 |
15.0 |
3.4% |
50.0% |
15.2 |
1.6% |
3.0% |
|
14. |
Stanbic Holdings |
80.0 |
81.5 |
1.9% |
15.6% |
79.1 |
5.2% |
2.2% |
|
15. |
Equity Group |
40.8 |
43.0 |
5.5% |
43.3% |
40.5 |
5.0% |
(0.8%) |
|
16. |
StanChart |
218.0 |
219.0 |
0.5% |
15.9% |
199.8 |
4.5% |
(4.2%) |
|
17. |
NBK |
10.1 |
10.5 |
4.5% |
45.8% |
5.2 |
0.0% |
(50.7%) |
|
*Target Price as per Cytonn Analyst estimates |
||||||||
|
**Upside / (Downside) is adjusted for Dividend Yield |
||||||||
|
***Banks in which Cytonn and/or its affiliates holds a stake |
||||||||
|
For full disclosure, Cytonn and/or its affiliates holds a significant stake in KCB Group and NIC Bank, ranking as the 5th largest local institutional investor and the 9th largest shareholder, respectively |
||||||||
We maintain a “NEUTRAL” view on equities for investors with short-term investment horizon since, despite the lower earnings growth prospects for this year, the market has rallied and brought the market P/E closer to its’ historical average. Pockets of value exist, with a number of undervalued sectors like Financial Services, which provide an attractive entry point for long-term investors and thus we are positive for investors with a long-term investment horizon.
Phatisa, a private equity firm focused on investments in Sub-Saharan Africa, has received USD 10.0 mn from the African Development Bank (AfDB) for its Phatisa Food Fund II (PFF2), representing 3.3% of the entire fund target. Following up on its predecessor, the African Agriculture Fund (AAF), which achieved a final close of USD 246.0 mn in mid-2013, and deployed this into 8 companies in Sub Saharan Africa, the fund aims to boost the agriculture sector across Africa by supporting capacity building for small and medium sized enterprises aiming to improve efficiency in the agricultural distribution chain, while also enhancing rural financing opportunities. PFF2 targets a close of USD 300.0 mn, 22.0% higher than the previous African Agriculture Fund (AAF), to still be deployed in the Sub-Saharan Africa region. The success of the previous fund was hinged on Phatisa’s agriculture investment philosophy of investing in the entire value chain. Phatisa invests in (i) Primary Agriculture which involves arable land development and livestock farming, (ii) Secondary Agriculture which involves processing and packaging, and (iii) Tertiary Agriculture which involves logistics, storage and input financing, and as well have a real estate fund known as the Pan African Housing Fund (PAHF). Agriculture in Africa remains one of the most attractive sectors for private equity investors given (i) a high population growth of 2.0% annually, (ii) 600 mn hectares of uncultivated arable land, representing 60.0% of the global total, (iii) lack of efficient synergies within the entire agriculture value chain (production, processing and distribution), and (iv) the underutilization of mechanized farming in Africa.
Private equity investments in Africa remain robust as evidenced by the growing number of successful exits. The increasing investor interest is attributed to (i) rapid urbanization, a resilient and adapting middle class and increased consumerism, (ii) the attractive valuations in Sub Saharan Africa’s private markets compared to its public markets, (iii) the attractive valuations in Sub Saharan Africa’s markets compared to global markets, and (iv) better economic projections in Sub Saharan Africa compared to global markets. We remain bullish on PE as an asset class in Sub Saharan Africa. Going forward, the increasing investor interest and stable macro-economic environment will continue to boost deal flow into African markets.
This week, Kings Pride Properties Limited, a local real estate developer, is reported in the local dailies to have signed a deal with Milost Global Inc, a New York based private equity firm with over USD 25.0 bn in committed capital, to get Kshs 45.0 bn in equity cum debt financing for the expansion of their real estate developments. Kings Pride currently has 14 residential projects targeting the middle and upper income population, some of which include the Runda Royale Apartments in Thindigua, Capital View in South B, Glenwood Gardens in Ruaka and Telagen Gardens in Lavington. The partnership indicates positive sentiments in the real estate opportunity in Kenya, despite the slowed performance during the election period. Investors are increasingly attracted to Kenya due its strong fundamentals of (i) a high average GDP growth rate of 5.5% over the last 5-years compared to the global GDP growth of 2.6%, (ii) the huge housing deficit of approximately 2.0 mn units and growing at approximately 150,000 – 200,000 per annum, (iii) positive demographic trends with an annual population growth rate of 2.6% compared to a global average of 1.2%, and (iv) rapid urbanization at 4.3% p.a. versus a global average of 2.0%. In our view, this is a milestone for both firms as it enables coupling of investors seeking attractive returns available in real estate in high growth Sub-Saharan Africa countries such as Kenya, with developers seeking financing for real estate development; and it ultimately plays a role in reducing Kenya’s housing deficit, creating employment and growing the economy.
In the retail sector, both local and international retailers are increasing their foothold in Nairobi and other counties such as Kisii, Kisumu, Mombasa and Eldoret, attracted by (i) the growing urban population, (ii) the expanding middle class with a higher purchasing power, and (iii) growth of formal retail facilities including malls with Nairobi, Kisumu and Mombasa having a total mall space supply of 5.6 mn, 0.9 mn and 0.7 mn sqft, respectively, as at 2017. This week we saw the following activities;
- Tuskys opened 2 stores in Kisii and Kisumu with a cumulative space of approximately 40,000 SQFT at a cost of Kshs 240.0 mn reaching a total of 64 branches (57 in Kenya and 7 in Uganda, respectively),
- Naivas Supermarket opened a new branch in Kericho, bringing its total number of branches to 42,
- International fashion retailer, Manix Clothing Store, announced plans to open five branches in Mombasa, Eldoret and Kisumu at a cost of Kshs 75.0 mn in the next 2-years. This will bring its total branches to 22 excluding its franchise in Westside Mall in Nakuru, Manix Clothing Store Kisumu and City Mall in Nyali, and,
- Massmart Holding’s subsidiary, Game, is set to open a new store at the 200,000 SQFT Waterfront in Karen, set to open in January 2018, replacing Nakumatt, the initial proposed anchor client. This will mark Game’s second outlet in Kenya after the Garden City Mall branch that was opened in May 2015.
Our view is that the trend is likely to continue, given plans by the retailers to open more branches across the country. Naivas, for instance, is set to open 5 more branches in Utawala, Mountain View, Kitengela, Thika and Nairobi CBD. This will increase Kenyan formal retail penetration rate that currently stands at 35.0%, falling only 2nd in Sub-Saharan Africa after South Africa at 60.0%, according to Oxford Business Group.
In the hospitality market, Paddock Investments renewed plans to build a 220 bed, 4-star hotel on 8.4 acres in Runda Estate. The firm forwarded a new request to the National Environmental Management Authority (NEMA) to build the Kshs 1.0 bn hotel, having previously faced opposition from the Runda Gated Community Association. The plan, which will result in the amalgamation of 15 plots, will require a change of use and has seen residents file a plea to the NEMA opposing the plan, citing breach of security and the requirements of controlled development. Should the development obtain approval, it will increase the graded hotel room supply in the Kiambu/Limuru Road region from 267 rooms as at 2017 to 487 rooms, according to Cytonn Research. The Kiambu/Limuru road region has one of the lowest supply of rated hotels in Nairobi at 6.1% out of a total of approximately 33 graded hotels, compared to an area such as the CBD, which has the highest supply accounting for 27.3% of Nairobi’s supply.
We expect the real estate sector to pick up after the end of the extended electioneering period. This will be driven by the sustainable high returns generated from the sector, with real estate outperforming other asset classes in the last 5-years, generating returns of 25.0% p.a., compared to an average of 12.4% p.a. in the traditional asset classes and positive demographic trends with population growth urbanization at 2.7% and 4.4%.
Following our September Kampala Investment Opportunity research report and last week’s Sub Saharan Africa Financial Services Report , Cytonn continues to focus on regional expansion to enable a diversified return and product range to our clients. In line with this strategy, we continue to conduct comprehensive studies of various markets across Africa, with Ghana being the most recent. The country is among the leading economic hubs in West Africa, and among the most politically stable in Africa, thus providing an investments safe-haven. We set out to conduct an in-depth real estate research within the region’s real estate market with a keen focus on the residential, commercial (office & retail) and hospitality real estate themes.
We start with the general overview of Accra, the factors driving real estate, and the challenges facing real estate in the city. We then delve into the thematic performance of real estate, while comparing the market to other real estate markets in our focus across Africa, which are Kenya, Uganda, and Rwanda, before concluding with our outlook on the Accra real estate investment opportunity.
Ghana Overview
Measuring 238,535 SQKM, Ghana is one of the leading West African power houses. The country is neighboured by Togo to the East, Cote D’Ivoire to the West, Burkina Faso to the North and the Atlantic Ocean to the South. The country is known worldwide for its natural resources such as a gold, cocoa & petroleum, which are its main exports. Administratively, the country has 10 regions, with our focus being the Greater Accra region. As at 2017, Ghana had a population of approximately 29 mn people growing at 2.2% p.a., compared to the global average of 1.2% p.a. This translates to a density of 127 people per SQKM (Kenya has 87 people per SQKM). 53.9% of this population is urban and growing at 3.4% per annum, compared to the global average of 2.1%. As at 2017, the Greater Accra region had the 2nd highest population in Ghana, with an approximate population of 4.8 mn people after the Ashanti Region, which is the largest administrative region in Ghana.
The country has been hailed as one of the leading emerging markets in Africa and was declared a lower middle income country in 2010 by the World Bank. As at 2016, the country’s GDP Per Capita was at USD 1,550 compared to Kenya’s USD 1,304. However, due to a decline in the country’s economic performance in 2015, the GDP Per capita has been growing at a slower rate, at 1.3% compared to Kenya’s 3.2%, albeit marginally higher than the global average of 1.2%.
Infrastructural Amenities
The Greater Accra region is endowed with various developments that make it stand out as an attractive economic and technology hub, such as below:
- It is served by the Kotoka International Airport for air travel,
- 4 National Highways – N1, N2, N4 and N6 and 1 regional highway (R40) pass through Greater Accra,
- The main port is located at Tema allowing importation of goods by sea,
- It is connected to Kumasi and Takoradi by a railway line,
- It is served with electricity from the Electricity Company of Ghana,
- It is well served with telecommunication lines, with the main mobile service providers being Airtel, MTN and Vodacom.
Factors Driving Real Estate in Accra
- Improving Macro-economic Environment: Ghana has exhibited strong fundamentals supporting its economic growth with (i) Q2’2017 GDP growth at 9.0%, up from 6.6% and 1.1% recorded in Q1’2017 and Q2’2016, respectively, and the IMF projecting 5.9% and 9.0% growth for 2017 and 2018, respectively, (ii) inflation declining to 11.6% in October from 13.3% in January, closer to the 6.0%-10.0% Bank of Ghana target, thus creating room for policy rate cuts to 21.0% currently from 25.5% in January, and (iii) declining interest rates as the 91-day T-Bill rate is currently at 13.3% from 16.8% in January,
- Demographics: The country’s population is growing at a faster rate of 2.2% compared to the global population growth rate at 1.2%. Additionally, 53.9% of the population lives in urban areas and the rate of urbanization is 3.4% per annum compared to the global urbanization rate of 2.1% per annum. In 2015 it was estimated that the market had 3.4 mn units as per the Ghana Statistical Services, and given an average household size of 4.4 persons, there was an approximate deficit of 1.7 mn units in the country, mainly in the urban centres such as Accra, Kumasi and Takoradi,
- Spending Power: The expanding middle class, as a result of a growing economy has led to an increase in disposable income, leading to an aggressive rise in quality real estate portfolio especially mid end and high end housing and malls. To put this into perspective, between 2007 and 2016, there was a total of 1.2 mn SQFT of mall space developed and the current deal pipeline is over 1.2 mn SQFT across Accra, Takoradi and Kumasi,
- Oil & Gas Discovery: Since the discovery of oil and gas in 2007, the country has received attention from international investors evidenced by the various developments across the commercial sector owned by foreigners,
- Political Stability: The country is considered one of the most politically stable countries in Africa, making it one of the preferred investment hubs in West Africa for international investors.
Despite the factors driving real estate in Ghana, the sector continues to face major challenges that have discouraged aspiring investors. Among them:
- Land Regimes: Ghana is faced with multiple land ownership issues and litigations mainly due to the communal–system of land ownership, which is a hindrance to development as it makes the process of land acquisition cumbersome,
- High Cost of Construction Material: Like most other African countries, Ghana is highly dependent on imports, with around 80.0% of construction material being imported,
- Slow Infrastructural Development: There is lack of on-site infrastructure in most areas and thus developers have to incur the costs while developing. Larger parts of Accra also lack a centralized sewer system hence properties rely on septic tanks and bio-digesters,
- Financing Costs: Cost of borrowing is high, with lending rates ranging from 19%-35% per annum on the Cedi and approximately 13%-16% on the USD. The main lender in Ghana is Ghana Home Loans (GHL), which has provided loans worth USD 97.1 mn to only 1,651 beneficiaries as at 2015. GHL had a 47.0% market share as at 2013. The mortgage to GDP ratio stands at 0.25% as at 2010 compared to Kenya at 2.7% as at 2016.
Having looked at the overall state of the market in Accra, and an overview of the real estate sector, we shall now look at the performance of the various themes in the real estate sector in Accra.
Market Performance
- Residential
For a country that still upholds majority of its traditional African culture, Ghana’s residential sector is characterized by individual compound homes. However, investment grade residential units are common in urban areas due to demand from the country’s elite class as well as its expatriates. The former have created a demand for high-end residential units leading to popularity of such top notch estates as Cantonments and East Legon, which host most embassies and the exclusive Airport Hills.
Ghana, has a huge housing deficit of approximately over 1.7 mn units and to address the shortage, the Government has come up with such corporations as SSNIT (Social Security & National Insurance Trust), which has managed, over the last 40 years, to provide a total of 7,168 houses across the Greater Accra Region, as well as other areas such as Kumasi, Cape Coast and Takoradi. Dominating private real estate developers include Trasacco, Taysec Holdings and Clifton Homes that serve the high end income segment of the market; and Devtracco and Regimanuel who serve the middle and lower middle income groups, while government corporation SSNIT caters to the low income groups.
The market is segmented into:
- High-End: These include estates in Accra such as Cantonments, Osu, Ridge, Airport Residential, Dzorwulu and parts of Legon. They are located in close proximity to both business districts, Accra Central and Airport City. The average price for detached and apartment units being USD 1.1 mn and USD 359,000, respectively,
- Upper Mid-End: These include Ringway, Shiashi, Spintex, Madina, Oyibi, Teshie and Klagon. Located on the outskirts of Accra, the average price for detached and apartment units is USD 346,000 and USD 164,000, respectively, and,
- Lower Mid-End: Estates in Greater Accra such as Tema, Kwabenya, Adenta, Madina, Katamanso, Dansoman, Darkuman, Ablekuma, James Town and Afienya. The average price in these areas is USD 177,000 and 61,500 for detached and apartments, respectively.
The residential market however is evolving to accommodate the serviced apartment component, which is still at a nascent stage with few serviced apartments being rated as hospitality facilities. Currently, the supply of serviced apartments is largely composed of unbranded or locally managed, independent properties. However, furnished apartments are a common phenomenon, with investors buying apartments, furnishing them and letting to tenants at an average monthly charge of USD 500 above the normal residential rates.
(1 USD=4.35 GHC, 1 USD= Kshs 103.5)
NB: (All yields are dollarized)
- Accra Residential Performance
|
RESEARCH SUMMARY |
|||||
|
Apartments |
|
|
|
|
|
|
Type |
Price Per SQM (USD) |
Rent Per SQM (USD) |
Rental Yield |
Capital Appreciation |
Total Returns |
|
High End |
2,844 |
17.8 |
8.4% |
6.7% |
15.1% |
|
Mid End |
2,181 |
30.6 |
10.8% |
6.2% |
16.9% |
|
Lower mid End |
737.1 |
2.7 |
4.9% |
10.0% |
14.8% |
|
Average |
1,920 |
17 |
8.0% |
7.6% |
15.6% |
|
Detached |
|
|
|
|
|
|
Type |
Price Per SQM (USD |
Rent Per SQM (USD) |
Rental Yield |
Capital Appreciation |
Total Returns |
|
High End |
2,557 |
8.4 |
5.6% |
8.6% |
14.2% |
|
Mid End |
1,640 |
9.9 |
8.0% |
6.4% |
14.4% |
|
Lower Mid End |
1042 |
5.9 |
7.8% |
3.3% |
11.1% |
|
Average |
1,746 |
8.1 |
7.1% |
6.1% |
13.2% |
|
Grand Average |
1,833 |
12.6 |
7.6% |
6.9% |
14.4% |
|
· The average returns from mid end properties was 15.7% which is partly due to high rental yields as Mid end properties attract as premium rents as high end and significantly lower absolute prices · Lower mid end segments performed the poorest with the lowest returns at 12.9%, indicating that investment grade real estate performs better with the high end and upper middle markets · Apartments have the highest returns to investors with an average of 15.6% attributable to their popularity with investors due to their ability to earn income as serviced or furnished, a market gaining traction in Accra · Generally, residential property in Accra offer better dollarized yields compared to other African markets such as Kenya whose average is 3.8% and Kampala’s 6.8% |
|||||
The performance breakdown of the various market segments and typologies is as shown below:
A: High-End
|
PERFORMANCE SUMMARY – HIGH END |
|||||||||||
|
Apartments |
|
|
|
|
|
|
|
|
|
|
|
|
Typology |
Unit Plinth Area (SM) |
Price 2017 USD |
Price in Kshs |
Price per SM (USD) |
Rent (USD) |
Rent in Kshs |
Rent per SM (USD) |
Rental Yield |
Capital Appreciation |
Total Returns |
|
|
1-Bed |
78 |
211,500 |
21.9 mn |
2,753 |
1,560 |
161,460 |
20.0 |
9.7% |
10.0% |
19.7% |
|
|
2-Bed |
136 |
351,259 |
36.4 mn |
2,701 |
2,380 |
246,330 |
17.5 |
8.7% |
6.4% |
15.1% |
|
|
3-Bed |
181 |
515,297 |
53.3 mn |
2,822 |
3,435 |
355,561 |
19.0 |
8.3% |
5.2% |
13.5% |
|
|
4-Bed |
271 |
824,860 |
85.4 mn |
3,027 |
4,000 |
414,000 |
14.7 |
6.7% |
5.3% |
12.0% |
|
|
Average |
|
|
|
2,844 |
|
|
17.8 |
8.4% |
6.7% |
15.1% |
|
|
|
|
|
|
|
|
|
|
|
|
|
|
|
Detached |
|
|
|
|
|
|
|
|
|
|
|
|
Typology |
Unit Plinth Area (SM) |
Price 2017 USD |
Price in Kshs |
Price per SM (USD) |
Rent in USD |
Rent in Kshs |
Rent per SM |
Rental Yield |
Capital Appreciation |
Total Returns |
|
|
3-Bed |
335 |
550,000 |
56.9 mn |
2,187 |
4,333 |
448,500 |
12.9 |
10.6% |
3.5% |
14.1% |
|
|
4-Bed |
418 |
894,444 |
92.6 mn |
2,140 |
4,164 |
430,936 |
10.0 |
6.9% |
6.9% |
13.8% |
|
|
5-Bed |
463 |
1,376,667 |
142.5 mn |
2,973 |
3,917 |
405,375 |
8.5 |
3.8% |
12.9% |
16.7% |
|
|
Average |
|
|
|
2,557 |
|
|
8.4 |
5.6% |
8.6% |
14.2% |
|
|
Grand Average |
|
|
|
2,700 |
|
|
13.1 |
7.0% |
7.7% |
14.6% |
|
|
· The one-bedroom typology was the best performing with average returns to investors at 19.7%. This is due to a high demand with investors as they are easily convertible to furnished or serviced units which are popular with travellers · Apartments generally were the best performing in the market attributable to their demand by expatriates who, are common in Accra · Among detached units, the 5-bed typology had the highest returns to the investor with average returns of 16.7%. This is due to their popularity with the native Ghanaians who prefer large compound houses on an own compound · Of key to note is that detached units are more popular with the natives due to their tendency to live as large families, with some houses having as much as 6-10 bedrooms |
|||||||||||
Source: Cytonn Research 2017
B: Mid-End
|
PERFORMANCE SUMMARY – MID END |
|||||||||||
|
Apartments |
|
|
|
|
|
|
|
|
|
|
|
|
Typology |
Unit Plinth Area (SM) |
Price 2017 (USD) |
Price (Kshs) |
Price per SM (USD) |
Rent in (USD) |
Rent (Kshs) |
Rent per SM(USD) |
Rental Yield |
Capital Appreciation |
Total Returns |
|
|
Studio |
36 |
82,050 |
8.5 mn |
2,279 |
2,303 |
92,751 |
64.0 |
13.6% |
4.6% |
18.2% |
|
|
1-Bed |
55 |
111,885 |
11.6 mn |
2,034 |
2,169 |
128,636 |
39.4 |
13.4% |
1.5% |
14.9% |
|
|
2-Bed |
102 |
201,808 |
20.9 mn |
1,979 |
2,042 |
180,747 |
20.0 |
9.7% |
5.7% |
15.4% |
|
|
3-Bed |
147 |
262,094 |
27.1 mn |
1,783 |
1,778 |
218,854 |
12.1 |
9.1% |
13.0% |
22.1% |
|
|
4-Bed |
167 |
438,900 |
45.4 mn |
2,828 |
2,926 |
302,841 |
17.5 |
8.0% |
|
|
|
|
Average |
|
|
|
2,181 |
|
|
30.6 |
10.8% |
6.2% |
17.0% |
|
|
|
|
|
|
|
|
|
|
|
|
|
|
|
Detached |
|
|
|
|
|
|
|
|
|
|
|
|
Typology |
Unit Plinth Area (SM) |
Price 2017 (USD) |
Price (Kshs) |
Price per SM (USD) |
Rent in (USD) |
Rent (Kshs) |
Rent per SM (USD) |
Rental Yield |
Capital Appreciation |
Total Returns |
|
|
2-Bed |
90 |
190,000 |
19.7 mn |
2111 |
1,200 |
124,200 |
13.3 |
7.6% |
|
||
|
3-bed |
237 |
306,250 |
31.7 mn |
1617 |
1,817 |
188,025 |
7.7 |
9.2% |
5.9% |
15.1% |
|
|
4-bed |
276 |
386,250 |
40.0 mn |
1662 |
2,387 |
247,091 |
8.6 |
7.2% |
6.9% |
14.1% |
|
|
Average |
|
|
|
1,640 |
|
|
9.9 |
8.0% |
6.4% |
14.4% |
|
|
Grand Average |
|
|
|
1,910 |
|
|
20.2 |
9.4% |
6.3% |
15.7% |
|
|
· The apartments have high rental yields as well at an average of 10.8%, 3.2% points higher than the market average attributable to the premium they charge due to their apt locations in the center of the city and along major highways · The 3-bed apartments were the best performing with average returns of 22.1% attributable to the attractive rental rates they charge followed by studio apartments with 18.2%. This is due to demand for the same among investors as furnished apartments are popular with short stay business tourists · 3 bedroom detached properties outperform the 4 bedroom units due to the high rental yields which, as a result of the high rental rates they attract considering their prices. Indicating that the returns to investors through monthly income, are faster for these typology, · 2 bedroom detached units though uncommon, are starting to gain attraction with a few developments under construction with a projected average absolute price of USD 190,000 |
|||||||||||
Source: Cytonn Research 2017
C: Lower Mid-End
|
PERFORMANCE SUMMARY – LOWER MID END |
||||||||||
|
Apartments |
|
|
|
|
|
|
|
|
|
|
|
Typology |
Unit Plinth Area (SM) |
Price 2017 USD |
Price in Kshs |
Price per SM (USD) |
Rent in USD |
Rent in Kshs |
Rent per SM (USD) |
Rental Yield |
Capital Appreciation |
Total Returns |
|
1-Bed |
45 |
26,896 |
2.9 mn |
597.7 |
13.5% |
|||||
|
2-Bed |
77 |
66,484 |
4.9 mn |
639.7 |
204 |
21,077 |
2.8 |
4.8% |
11.1% |
15.9% |
|
3-Bed |
92 |
56,517 |
5.8 mn |
666.2 |
242 |
25,042 |
2.6 |
4.9% |
5.3% |
10.2% |
|
Average |
|
|
|
737.1 |
|
|
2.7 |
4.9% |
10.0% |
14.8% |
|
|
|
|
|
|
|
|
|
|
|
|
|
Detached |
|
|
|
|
|
|
|
|
|
|
|
Typology |
Unit Plinth Area (SM) |
Price 2017 USD |
Price in Kshs |
Price per SM (USD) |
Rent in USD |
Rent in Kshs |
Rent per SM (USD) |
Rental Yield |
Capital Appreciation |
Total Returns |
|
2-Bed |
103.3 |
105,384 |
10.9 mn |
1,193 |
860 |
89,010 |
8.3 |
10.8% |
|
|
|
3-Bed |
179 |
165,326 |
17.1 mn |
1,028 |
1028 |
105,800 |
5.7 |
7.4% |
1.6% |
9.0% |
|
4-Bed |
292 |
261,667 |
27.1 mn |
905 |
1,100 |
113,850 |
3.8 |
5.2% |
4.9% |
10.1% |
|
Average |
|
|
|
1,042 |
|
|
5.9 |
7.8% |
3.3% |
11.1% |
|
Grand Average |
|
|
|
889.5 |
|
|
4.3 |
6.3% |
6.6% |
12.9% |
|
· Two bed apartments performed better with average returns at 15.9% than other typologies in the lower mid end market. This is attributable to a high capital appreciation indicating a preference for the same among investors · 3-bed detached units performed poorly with average capital appreciation of 1.6% but good rental yields averaging at 7.4%, indicating demand with renters |
||||||||||
Source: Cytonn Research 2017
- Commercial Office
The commercial office theme in Accra is characterized by old stock built by the government, mostly in areas like Accra Central. However due to demand for better service office stock, especially with the growing service industry as well as entrance of multinationals who demand high quality office stock, private developers entered the market providing facilities otherwise not found in the old stock such as parking space, security, air conditioners, standby generators, lifts among others. The modern stock is located in areas like Osu, Labone, Spintex, the Ridge area and the leading commercial hub, Airport City. The office sector is driven by such factors as economic growth with the discovery of oil and gas leading to foreign companies setting up shop in the country and the growth of SMEs in the banking and telecommunication industries, which are dominant across the city.
The serviced office sector has also gained traction in Accra driven by the oil and gas industry as well as the logistics industry, thus creating demand for the multinational firms tapping into these. Additionally, the services sector, which continues to grow evidenced by its 59.0% contribution to the country’s GDP as at 2016, has led to demand for office space for professionals in the banking and telecommunication industries. As per our research, the average occupancy rates for serviced offices was 80.4%, with rental yields ranging between 14.3% and 16.1% per annum.
Ghana’s commercial office sector is predominantly rental with developers preferring to sell the developments either as a whole or shell and core units.
To calculate the yields, we looked at a few office developments that were selling which informed our assumptions as below:
- Grade A, a selling price of USD 330 (Kshs. 34,320) per SQFT,
- Grade B, a selling price of USD 220 (Kshs. 22,880) per SQFT, and
- Grade C, a selling price of USD 180 (Kshs. 18,720) per SQFT
The performance for the office sector is as summarized below:
|
PERFORMANCE SUMMARY BY LOCATION AND GRADE |
||||
|
Grade A |
||||
|
Location |
Monthly Rent Per SQFT (USD ) |
Monthly Rent Per SQFT (Kshs ) |
Occupancy Rate |
Rental Yield |
|
Accra Central |
33 |
3,416 |
83.9% |
10.2% |
|
Airport City |
33 |
3,416 |
85.0% |
10.6% |
|
Average |
33 |
3,416 |
84.6% |
10.4% |
|
Grade B |
||||
|
Location |
Monthly Rent Per SQFT (USD ) |
Monthly Rent Per SQFT (Kshs ) |
Occupancy Rate |
Rental Yield |
|
Accra Central |
24 |
2,525 |
73.0% |
9.9% |
|
Airport City |
30 |
3,105 |
51.1% |
8.0% |
|
Labone |
32 |
3,312 |
100.0% |
12.0% |
|
North Ridge |
23 |
2,381 |
68.1% |
8.5% |
|
Average |
26 |
2,831 |
70.6% |
9.5% |
|
Grade C |
||||
|
Location |
Monthly Rent Per SQFT (USD ) |
Monthly Rent Per SQFT (Kshs ) |
Occupancy Rate |
Rental Yield |
|
Airport City |
22 |
2,225 |
79.9% |
9.9% |
|
Osu |
20 |
2,070 |
75.0% |
10.0% |
|
Spintex Rd |
22 |
2,277 |
63.0% |
8.8% |
|
Teshie Rd |
12 |
1,242 |
66.7% |
6.9% |
|
Average |
19 |
1,975 |
79.6% |
10.3% |
|
Grand Average |
27 |
2,740 |
78.3% |
10.1% |
|
||||
Source: Cytonn Research 2017
|
OFFICE PERFORMANCE SUMMARY |
||||
|
Grade |
Current price Per SQFT (Kshs) |
Monthly Rent Per SQFT (Kshs ) |
Occupancy Rate |
Rental Yield |
|
A |
33,658 |
348 |
84.6% |
10.4% |
|
B |
24,613 |
278 |
70.6% |
9.5% |
|
C |
17,105 |
215 |
79.6% |
10.3% |
|
Average |
25,159 |
280 |
78.3% |
10.1% |
|
· Grade A offices have the best performance in Accra with average rental yields at 10.4%, 0.3% higher than the market average of 10.1%. This is attributable to the high occupancy rates at 84.6% which also indicate demand from the high end clientele |
||||
Source: Cytonn Research 2017
- Retail
The formal retail market is fairly nascent in Ghana standing at 5-10% of the retail market share, while informal retail takes 90.0% according to Oxford Business Group. However, it has proven to be both vibrant and fast-growing, mainly due to significant economic growth evidenced by the relatively high yields of 9.5% and average occupancy rates at 94.8%. Existing malls tend to target high and middle-income segment of the population as well as expatriates. Currently, Ghana has a mall space of 1.2 mn SQFT, which is all in Accra, with a deal pipeline of 1.2 mn SQFT as a result of upcoming malls in Accra, Mallam Junction (21,800 SQM); Meridian Mall (20,000 SQM); The Exchange (11,000 SQM); Kumasi Mall (29,000 SQM), and Garden City Mall (22,000 SQM) in Kumasi City and Takoradi Mall (19,000 SQM) in Takoradi
The retail performance summary is as below:
|
|
PERFORMANCE SUMMARY – RETAIL SECTOR |
|||
|
Class |
Rent Per SQFT (USD) |
Rent Per Sqft(Kshs) |
Occupancy Rate |
Rental Yield |
|
Community |
5 |
468 |
98.7% |
10.5% |
|
Regional |
4 |
437 |
97.7% |
9.8% |
|
Neighborhood |
4 |
399 |
93.5% |
8.6% |
|
Shopping Centre |
1 |
125 |
79.2% |
7.4% |
|
Average |
|
403 |
94.7% |
9.5% |
|
· Community malls have the best returns at 10.5% and high occupancy rates at 98.7%, attributable to their apt location with malls such as Accra Mall, Achimota and Junction, along major highways, which enhances footfall to the malls and thus attracting attractive rents · Regional malls have high yields as well at 9.8% and 97.7% occupancy rates, compared to the market average of 9.5% and 94.7%, respectively · Neighborhood malls perform worse with 8.6% yields and 93.5% occupancy rates followed by shopping centers which have average yields at 7.4% and 79.2% occupancy rates. This is attributable to their lower than market average occupancy rates as a result of competition form better located malls |
||||
Source: Cytonn Research 2017
- Hospitality
The hospitality industry in Ghana recorded a 1.8% growth from 2015 to 2016 and is expected to grow by 1.1% in 2017, 2.1% in 2018 and 2.3% in 2019 according to the PwC Hotel Outlook 2017. According to HTI Consulting, there were 2,723 hotels and lodges in Ghana as at May 2017; 56.0% of these are 4-star, 24.0% 5-star and 13.0% 3-star, showing the penetration of quality hotels.
The sector is largely driven by business tourism including conferences and economic growth and presence of multi-national firms such as Nestle, FAO and WHO. As per Ghana Tourism Authority, this accounted for 31.9% of international tourist arrivals between 2012 and 2014. The government of Ghana has also been keen on marketing the country to other countries in Europe and America for its heritage and tourism sites.
|
GHANA HOSPITALITY PERFORMANCE SUMMARY Vs NAIROBI |
||||||
|
|
Nairobi (STR Data) |
Ghana |
||||
|
|
Occupancy (%) |
ADR |
RevPAR |
Occupancy |
ADR |
RevPAR |
|
2013 |
59% |
125 |
73.4 |
64% |
215 |
138 |
|
2014 |
53% |
123 |
65.9 |
61% |
205 |
125 |
|
2015 |
53% |
136 |
72.0 |
59% |
200 |
118 |
|
2016 |
53% |
134 |
70.6 |
60% |
220 |
132 |
|
Average |
55% |
130 |
70.5 |
61% |
210 |
128 |
|
· 3, 4 and 5-star hotels in Ghana have been performing better than those in Kenya with an Average Daily Rate of USD 210 between 2013 and 2016 compared to hotels in Kenya at USD 130 · They also have relatively higher occupancy at 61% compared to Kenya at 55% on average between 2013 and 2016, showing Ghana would be a better hotel investment location compared to Kenya |
||||||
Source: Cytonn Research 2017
Land
|
LAND PERFORMANCE SUMMARY |
||||
|
Location |
Acreage |
Price (USD) |
Price per acre (USD) |
Price per acre (Kshs) |
|
Accra |
||||
|
Cantonments |
1 |
4.0 mn |
4.0 mn |
414.0 mn |
|
Cantonments |
0.8 |
2.0 mn |
2.6 mn |
265.4 mn |
|
Dzorwulu |
4.6 |
4.5 mn |
1.0 mn |
101.9 mn |
|
Airport City |
1 |
3.0 mn |
3.0 mn |
310.5 mn |
|
Average |
|
3.4 mn |
2.6 mn |
272.9 mn |
|
Excluding outliers |
|
|
3.1 mn |
330.0 mn |
|
Accra Metro |
||||
|
Oyibi |
2.5 |
.3 mn |
.1 mn |
11.6 mn |
|
Near Appolonia |
2 |
.2 mn |
.1 mn |
10.4 mn |
|
Average |
|
.2 mn |
.1 mn |
11.0 mn |
|
Grand Average |
|
2.3 mn |
1.8 mn |
185.6 mn |
|
· The average price per acre in Accra City center areas is Kshs 317.2 mn · An acre in the outskirts of the city goes for Kshs 11.1 mn while a serviced acre of land in the same locality goes for an average of Kshs 23.5 mn as shown below: |
||||
Land is characterized by cumbersome processes due to the customary-charged land laws. An acre is most expensive within the city with an average cost per acre at USD 2.6 mn – 3.1 mn. Areas like Cantonments, which host Embassies such as American and Italy, have the highest land prices with an acre ranging between USD 2.6 mn – 4.0 mn.
Source: Cytonn Research 2017
The average price for serviced plots is as shown below:
|
SERVICED PLOTS |
|||
|
Size of plots |
Current Price (USD) |
Price per acre (USD) |
Price per acre (Kshs) |
|
70*50 |
19,950 |
228,000 |
23.6 mn |
|
80*50 |
22,600 |
226,000 |
23.4 mn |
|
90*60 |
30,500 |
225,926 |
23.4 mn |
|
100*80 |
45,500 |
227,500 |
23.5 mn |
|
110*90 |
56,000 |
226,263 |
23.4 mn |
|
Average |
34,910 |
226,738 |
23.5 mn |
Source: Cytonn Research 2017
Comparative Analysis:
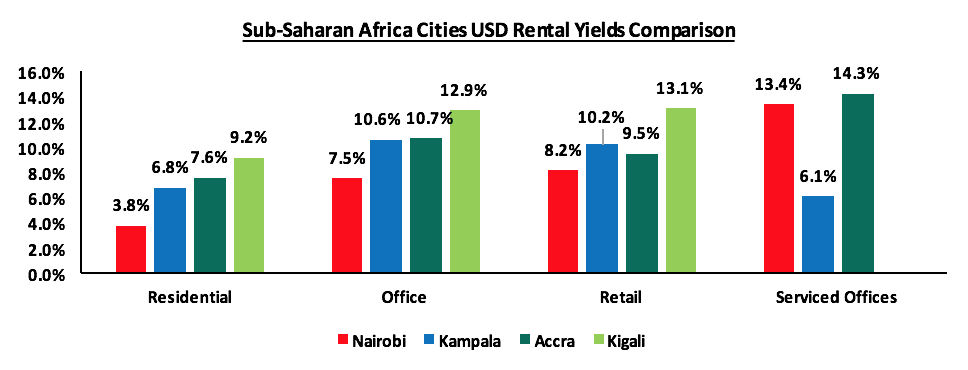
Source: Cytonn Research 2017
In comparison with other cities in Sub-Saharan Africa, Accra has better dollarized rental yields in residential, un-serviced and serviced offices, with yields of 7.6%, 10.1% and 14.3%, respectively, compared to Nairobi with 3.8%, 7.5% and 13.4%, respectively, and Kampala with 6.8%, 10.6% and 6.1%, respectively. Kigali however has the highest yields at 9.2%, 12.9% and 13.1% for residential, office and retail themes, respectively. The Kigali market’s outstanding performance is due to its nascent stage, evidenced by its small population of 1.1 mn against matured markets such as Accra’s 2.4 mn, Nairobi’s 4.1 mn and Kampala’s 1.5 mn people, according to the country’s respective statistical bureaus.
Conclusion
|
Theme |
Recommendation/ Outlook |
Area of Focus |
|
Residential |
Focus on 3 and 4-bed compound houses in the mid and lower end segment of the market. For apartments, focus on 2-bed units in the high and mid-end segments of the market |
3 and 4-bed compound houses in areas such as Spintex, East-Legon and Tema 2-bed apartments in Airport City, Dzorwulu, East Legon and Cantonments |
|
Commercial Office |
The office market is on a declining trend and vacancy rates are likely to increase due to i) increasing supply ii) firms increasingly taking up smaller office spaces iii) high cost of office rental space. However, given increasing demand for smaller office space set-up and demand from multi-nationals in the oil & gas, logistics and services sectors, the serviced offices is a viable venture for investors |
Grade A and B serviced office space in Accra City |
|
Retail Sector |
The retail sector has a deal pipeline of 1.2mn sqft as a result of upcoming malls in Accra, Kumasi and Takoradi. Demand and supply is on the rise in other urban centers as existing tenants are looking to open new branches away outside the capital |
Urban areas outside Accra such as Kumasi and Takoradi |
|
Hospitality |
Focus on business hotels in Accra in the short to mid-term
|
3,4 and 5-star hotels within Accra City |
We have a positive outlook for the real estate sector in Accra given the improving political governance with the IMF intervention program, increased entry of multinationals, as well as a positive demographic profile.
For the comprehensive report, see our Accra Investment Opportunity Report

- Talk to us
- Kenya
- P.O Box 20695 - 00200, Nairobi, Kenya
- Cell +254709101200
- Tel +254709101200
- WhatsApp +254741676635
- United States
- +254709101200
- DOWNLOAD OUR APP
-


- Kenya
- 8th Floor, Pinetree Plaza, Kaburu Drive, Ngong Road, Nairobi, Kenya
- USA
- Suite 1150, 1775 Eye Street NW, USA, Washington DC 20006, USA
- Investments
- High Yield
- Private Equity
- Real Estate
- Real Estate
- RiverRun Estates
- Cytonn Towers
- The Ridge
- Taraji Heights
- The Alma