Administration as a Business Restructuring Option & Cytonn Weekly #37/2022
By Research, Sep 18, 2022
Executive Summary
Fixed Income
During the week, T-bills were undersubscribed, with the overall subscription rate coming in at 97.0%, a decline from the 153.0% recorded the previous week, partly attributable to the concurrent bond issue in the primary bond market. Investor’s preference for shorter 91-day paper persisted, with the paper receiving bids worth Kshs 9.9 bn against the offered Kshs 4.0 bn, translating to a subscription rate of 248.4%. It is worth noting that the 91-day paper’s rate has been increasing for the sixteenth consecutive week, with the rate quickly heading to 9.0% levels which has consistently countered the need to invest in the longer tenure papers. The subscription rate for the 182-day paper increased to 113.9% from 34.8% while that of the 364-day paper declined to 19.6%, from 62.3% recorded the previous week. The yields on the government papers recorded mixed performance, with the yields on the 182-day and 91-day papers increasing by 1.6 bps and 4.0 bps to 9.6% and 9.0%, respectively, while the yields on the 364-day paper declined by 0.2 bps to 9.9%. In the primary bond market, the Central Bank of Kenya released the results for the recently re-opened bonds; FXD1/2022/10 and FXD1/2022/15 highlighting that the bonds recorded an undersubscription of 92.3%;
Also during the week, the Energy and Petroleum Regulatory Authority (EPRA) released their monthly statement on the maximum retail fuel prices in Kenya effective 15th September 2022 to 14th October 2022. Notably, Super Petrol, Diesel and Kerosene prices increased by 12.7%, 17.9% and 15.7% to Kshs 179.3 per litre, Kshs 165.0 per litre and Kshs 147.9 per litre, from Kshs 159.1 per litre, Kshs 140.0 per litre and Kshs 127.9 per litre, respectively. Additionally, the National Treasury gazetted the revenue and net expenditures for the second month of the FY’2022/2023 highlighting that the total revenue collected as at the end of August 2022 amounted to Kshs 284.0 bn equivalent to 13.3% of the original estimates of Kshs 2,141.6 bn;
Equities
During the week, the equities market was on a downward trajectory with NASI, NSE 20 and NSE 25 declining by 6.6%, 2.2% and 5.5% respectively, taking their YTD performance to losses of 20.8%, 8.7% and 16.0%, for NASI, NSE 20 and NSE 25, respectively. The equities market performance was mainly driven by losses recorded by large-cap stocks such as Safaricom, KCB Group, NCBA and EABL of 9.2%, 8.0%, 7.7% and 7.2%, respectively. The losses were slightly mitigated by gains recorded by stocks such as Sanlam Kenya of 5.5%;
Also during the week, Equity Group Holdings Plc through Equity Bank (Kenya) Limited, announced that it had entered into an Assets and Liabilities purchase agreement with Spire Bank Limited for purchase of certain assets and liabilities;
Real Estate
Recently, the Kenya National Bureau of Statistics (KNBS) released the June 2022 Leading Economic Indicators (LEI) report highlighting that the number of visitor arrivals through the Jomo Kenyatta (JKIA) and Moi International Airports (MIA) increased by 147.1% to 279,981 in Q2’2022, from the 113,307 recorded in Q2’2021. For Real Estate Investment Trusts (REITs), Fahari I-REIT closed the week trading at an average price of Kshs 7.0 per share on the Nairobi Stock Exchange, while Acorn D-REIT and I-REIT closed the week trading at Kshs 23.8, and Kshs 20.8 per unit, respectively on the Unquoted Securities Platform, as at 2nd September 2022;
Focus of the Week
Recently, Kaluworks Limited came out of administration after a successful restructuring, which took fifteen months, hence the need to look at administration as a means of business restructuring. A business or entity is said to be insolvent when it cannot be able to raise enough cash to meet its obligations. Generally, there are two types of insolvency i) Where the company’s liabilities are more than the assets, and, ii) Technical insolvency where the assets exceed liabilities but cannot be easily liquidated to pay off the obligations that are due. In light of the above, this week we shift our focus to Administration as a business restructuring option in Kenya;
Investment Updates:
- Weekly Rates:
- Cytonn Money Market Fund closed the week at a yield of 10.56%. To invest, dial *809# or download the Cytonn App from Google Playstore here or from the Appstore here;
- Cytonn High Yield Fund closed the week at a yield of 13.91% p.a. To invest, email us at sales@cytonn.com and to withdraw the interest, dial *809# or download the Cytonn App from Google Playstore here or from the Appstore here;
- We continue to offer Wealth Management Training every Wednesday and every third Saturday of the month, from 9:00 am to 11:00 am, through our Cytonn Foundation. The training aims to grow financial literacy among the general public. To register for any of our Wealth Management Trainings, click here;
- If interested in our Private Wealth Management Training for your employees or investment group, please get in touch with us through wmt@cytonn.com;
- Any CHYS and CPN investors still looking to convert are welcome to consider one of the five projects currently available for assignment, click here for the latest term sheet;
- Cytonn Insurance Agency acts as an intermediary for those looking to secure their assets and loved ones’ future through insurance namely; Motor, Medical, Life, Property, WIBA, Credit and Fire and Burglary insurance covers. For assistance, get in touch with us through insuranceagency@cytonn.com;
- Cytonnaire Savings and Credit Co-operative Society Limited (SACCO) provides a savings and investments avenue to help you in your financial planning journey. To enjoy competitive investment returns, kindly get in touch with us through clientservices@cytonn.com;
- For an exclusive tour of Cytonn’s real estate developments, visit: Sharp Investor's Tour, and for more information, email us at sales@cytonn.com;
- Phase 3 of The Alma is now ready for occupation and the show house is open daily. To rent please email properties@cytonn.com;
- We have 8 investment-ready projects, offering attractive development and buyer targeted returns; See further details here: Summary of Investment-ready Projects;
- For Third Party Real Estate Consultancy Services, email us at rdo@cytonn.com;
- For recent news about the group, see our news section here;
Hospitality Updates:
- We currently have promotions for Staycations. Visit cysuites.com/offers for details or email us at sales@cysuites.com;
During the week, T-bills were undersubscribed, with the overall subscription rate coming in at 97.0%, a decline from the 153.0% recorded the previous week, partly attributable to the concurrent bond issue in the primary bond market. Investor’s preference for shorter 91-day paper persisted, with the paper receiving bids worth Kshs 9.9 bn against the offered Kshs 4.0 bn, translating to a subscription rate of 248.4%, from 675.4% recorded the previous week. It is worth noting that the 91-day paper’s rate has been increasing for the sixteenth consecutive week, with the rate quickly heading to 9.0% levels which has consistently countered the need to invest in the longer tenure papers. The subscription rate for the 182-day paper increased to 113.9% from 34.8% while that of the 364-day paper declined to 19.6%, from 62.3% recorded the previous week.
The yields on the government papers recorded mixed performance, with the yields on the 182-day and 91-day papers increasing by 1.6 bps and 4.0 bps to 9.6% and 9.0%, respectively, while the yields on the 364-day paper declined by 0.2 bps to 9.9%. We however believe that the 91-day paper rates are not sustainable and this will likely lead to a reversal in the rates in the short term. The government continued to reject expensive bids, accepting a total of Kshs 17.4 bn worth of bids out of the Kshs 23.3 bn worth of bids received, translating to an acceptance rate of 74.6%.
In the primary bond market, the Central Bank of Kenya released the auction results for the recently re-opened bonds; FXD1/2022/10 and FXD1/2022/15, with tenors to maturity of 10 years and 15 years, and coupons of 13.5% and 13.9%, respectively. In line with our expectations, the bonds recorded an undersubscription of 92.3% despite the ample liquidity in the money market and the eased tensions in the country following the peaceful elections. The government issued the bonds seeking to raise Kshs 50.0 bn for budgetary support, received bids worth Kshs 46.1 bn and accepted bids worth Kshs 39.0 bn translating to an 84.6% acceptance rate. The weighted average yields were 13.9% for the FXD1/2022/10 and 14.0% for FXD1/2022/15.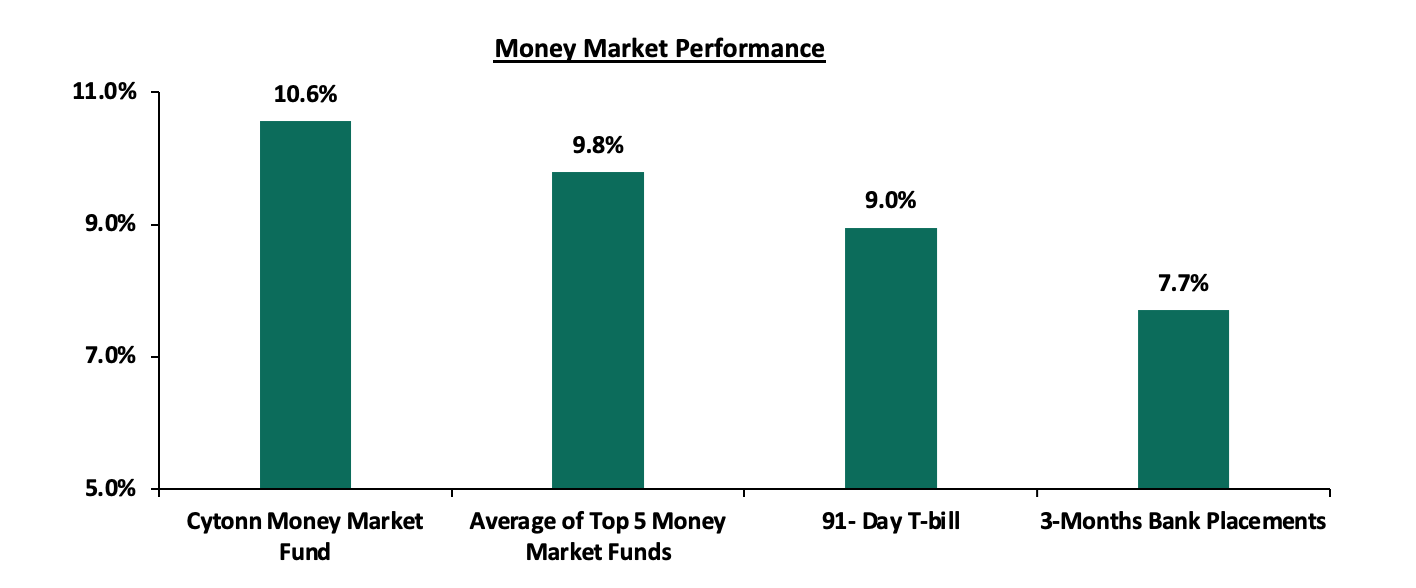
In the money markets, 3-month bank placements ended the week at 7.7% (based on what we have been offered by various banks), while the yield on the 91-day T-bill increased by 4.0 bps to 9.0%. The average yield of the Top 5 Money Market Funds and Cytonn Money Market Fund remained relatively unchanged at 9.8% and 10.6%, respectively, as was recorded last week.
The table below shows the Money Market Fund Yields for Kenyan Fund Managers as published on 16th September 2022:
|
Money Market Fund Yield for Fund Managers as published on 16th September 2022 |
||
|
Rank |
Fund Manager |
Effective Annual Rate |
|
1 |
Cytonn Money Market Fund |
10.6% |
|
2 |
Zimele Money Market Fund |
9.9% |
|
3 |
Dry Associates Money Market Fund |
9.6% |
|
4 |
Sanlam Money Market Fund |
9.5% |
|
5 |
NCBA Money Market Fund |
9.4% |
|
6 |
Nabo Africa Money Market Fund |
9.4% |
|
7 |
Apollo Money Market Fund |
9.3% |
|
8 |
Old Mutual Money Market Fund |
9.3% |
|
9 |
Madison Money Market Fund |
9.3% |
|
10 |
Co-op Money Market Fund |
9.2% |
|
11 |
GenCap Hela Imara Money Market Fund |
9.1% |
|
12 |
CIC Money Market Fund |
9.0% |
|
13 |
Orient Kasha Money Market Fund |
8.7% |
|
14 |
ICEA Lion Money Market Fund |
8.6% |
|
15 |
AA Kenya Shillings Fund |
8.3% |
|
16 |
British-American Money Market Fund |
6.4% |
Source: Business Daily
Liquidity:
During the week, liquidity in the money markets eased, with the average interbank rate declining to 4.0% from 4.3% recorded the previous week, partly attributable to government payments that offset tax remittances. The average interbank volumes traded increased by 103.1% to Kshs 27.3 bn from Kshs 13.5 bn recorded the previous week.
Kenya Eurobonds:
During the week, the yields on Eurobonds recorded mixed performance with the yield on the 30-year Eurobond issued in 2018 being the only gainer, increasing by 0.1% points to 11.8% from 11.7% recorded the previous week. The yield on the 10-year Eurobond issued in 2014 recorded the highest decline having declined by 0.7% points to 11.9% from 12.6% recorded the previous week. The decline in the yields points towards improving investor confidence as elections related uncertainties dissipate. The table below shows the summary of the performance of the Kenyan Eurobonds as of 15th September 2022;
|
Kenya Eurobond Performance |
||||||
|
2014 |
2018 |
2019 |
2021 |
|||
|
Date |
10-year issue |
10-year issue |
30-year issue |
7-year issue |
12-year issue |
12-year issue |
|
3-Jan-22 |
4.4% |
8.1% |
8.1% |
5.6% |
6.7% |
6.6% |
|
31-Aug-22 |
15.3% |
13.2% |
12.4% |
14.5% |
13.1% |
11.5% |
|
9-Sep-22 |
12.6% |
12.3% |
11.7% |
13.3% |
12.5% |
10.9% |
|
12-Sep-22 |
12.1% |
11.7% |
11.4% |
12.5% |
11.9% |
10.4% |
|
13-Sep-22 |
11.5% |
11.7% |
11.3% |
12.3% |
11.8% |
10.5% |
|
14-Sep-22 |
11.9% |
12.1% |
11.7% |
12.8% |
12.3% |
10.9% |
|
15-Sep-22 |
11.9% |
12.2% |
11.8% |
12.8% |
12.4% |
10.9% |
|
Weekly Change |
(0.7%) |
(0.1%) |
0.1% |
(0.5%) |
(0.1%) |
0.0% |
|
MTD Change |
(3.3%) |
(1.0%) |
(0.6%) |
(1.8%) |
(0.7%) |
(0.6%) |
|
YTD Change |
7.5% |
4.2% |
3.7% |
7.2% |
5.7% |
4.3% |
Source: Central Bank of Kenya (CBK)
Kenya Shilling:
During the week, the Kenyan shilling depreciated by 0.1% against the US dollar to close the week at Kshs 120.4, from Kshs 120.3 recorded the previous week, partly attributable to increased dollar demand from the oil and energy sectors against a slower supply of hard currency. On a year to date basis, the shilling has depreciated by 6.4% against the dollar, higher than the 3.6% depreciation recorded in 2021. We expect the shilling to remain under pressure in 2022 as a result of:
- High global crude oil prices on the back of persistent supply chain bottlenecks coupled with high demand as most economies gradually recover,
- An ever-present current account deficit due to an imbalance between imports and exports, with Kenya’s current account deficit estimated at 5.1% of GDP in the 12 months to July 2022 compared to the 5.2% within a similar period in 2021, and,
- The aggressively growing government debt which is not translating into GDP growth thus putting pressure on forex reserves to service some of the public debt. Notably, Kenya’s public debt has increased at a 10-year CAGR of 18.2% to Kshs 8.6 tn in May 2022, from Kshs 1.6 tn in May 2012 while the average GDP growth over the same period has been 3.9%.
The shilling is however expected to be supported by:
- Sufficient Forex reserves currently at USD 7.3 bn (equivalent to 4.2-months of import cover), which is above the statutory requirement of maintaining at least 4.0-months of import cover, and,
- Sufficient diaspora remittances evidenced by a 14.7% y/y increase to USD 3,992.0 mn cumulative remittances as of August 2022, from USD 3,481.0 mn recorded over the same period in 2021, which has continued to cushion the shilling against a faster depreciation.
Weekly Highlights:
- Fuel Prices
During the week, the Energy and Petroleum Regulatory Authority (EPRA) released their monthly statement on the maximum retail fuel prices in Kenya effective 15th September 2022 to 14th October 2022. Notably, Super Petrol, Diesel and Kerosene prices increased by 12.7%, 17.9% and 15.7% to Kshs 179.3 per litre, Kshs 165.0 per litre and Kshs 147.9 per litre from Kshs 159.1 per litre, Kshs 140.0 per litre and Kshs 127.9 per litre, respectively. The performance was attributable to:
- Full removal of subsidy on super petrol, and partial removal of subsidies on Diesel and Kerosene which reduced by 68.5% and 64.6% to Kshs 20.8 per litre and Kshs 26.3 per litre from Kshs 66.2 and Kshs 74.2 per litre in the month of August 2022, respectively,
- The 7.2% increase in the Free On Board(FOB) price of Murban crude oil to USD 117.5 per barrel from USD 109.7 per barrel in the month of July, and,
- The Kenyan shilling continued depreciation having declined by 0.6% to Kshs 120.6 in August 2022 from Kshs 119.9 in July.
We however believe that the fuel prices were cushioned from a further hike by the decline in the average landed cost of super petrol, diesel and kerosene by 24.3%, 13.9% and 19.1% to USD 812.9 per cubic metre, USD 949.7 per cubic metre and USD 899.6 per cubic metre in August 2022 from USD 1,074.0 per cubic metre, USD 1,103.0 per cubic metre and USD 1,115.0 per cubic metre in July 2022.
Over the last two months, Kenya’s fuel prices have remained stable primarily due to the subsidy program from the Petroleum Fund. However, we believed that the fuel subsidy was unsustainable and recommended it be eliminated given that it was a burden on the country’s expenditure. Notably, the Kenyan government partially removed the fuel subsidy in the month of September 2022 setting fuel prices to historic highs. Going forward, we expect the new administration to completely phase out the fuel subsidy program and adjust the domestic fuel prices to ease pressure on expenditure and consequently reduce the need for excessive borrowing. Consequently, we expect the cost of living to remain elevated given that fuel is a major contributor to Kenya’s inflation. Additionally, the business environment is expected to remain unfavorable because of a diminishing consumer purchasing power.
- Revenue and Net Exchequer for FY’2022/2023
The National Treasury gazetted the revenue and net expenditures for the second month of FY’2022/2023, ending 31st August 2022. Below is a summary of the performance:
|
FY'2022/2023 Budget Outturn - As at 31st August 2022 |
|||||
|
Amounts in Kshs billions unless stated otherwise |
|||||
|
Item |
12-months Original Estimates |
Actual Receipts/Release |
Percentage Achieved |
Prorated |
% achieved of prorated |
|
Opening Balance |
|
0.6 |
|
|
|
|
Tax Revenue |
2,071.9 |
280.2 |
13.5% |
345.3 |
81.1% |
|
Non-Tax Revenue |
69.7 |
3.1 |
4.5% |
11.6 |
26.9% |
|
Total Revenue |
2,141.6 |
284.0 |
13.3% |
356.9 |
79.6% |
|
External Loans & Grants |
349.3 |
31.8 |
9.1% |
58.2 |
54.6% |
|
Domestic Borrowings |
1,040.5 |
54.8 |
5.3% |
173.4 |
31.6% |
|
Other Domestic Financing |
13.2 |
13.4 |
101.5% |
2.2 |
608.8% |
|
Total Financing |
1,403.0 |
100.0 |
7.1% |
233.8 |
42.8% |
|
Recurrent Exchequer issues |
1,178.4 |
149.4 |
12.7% |
196.4 |
76.1% |
|
CFS Exchequer Issues |
1,571.8 |
183.5 |
11.7% |
262.0 |
70.1% |
|
Development Expenditure & Net Lending |
424.4 |
20.8 |
4.9% |
70.7 |
29.3% |
|
County Governments + Contingencies |
370.0 |
30.2 |
8.2% |
61.7 |
49.0% |
|
Total Expenditure |
3,544.6 |
383.9 |
10.8% |
590.8 |
65.0% |
|
Total Borrowing |
1,389.8 |
86.6 |
6.2% |
231.6 |
37.4% |
The Key take-outs from the release include;
- Total revenue collected as at the end of August 2022 amounted to Kshs 284.0 bn, equivalent to 13.3% of the original estimates of Kshs 2,141.6 bn for FY’2022/2023 and is 79.6% of the prorated estimates of Kshs 356.9 bn. We note that the government has not been able to meet its prorated revenue targets two months into the FY’2022/2023 partly attributable to the deterioration of the business environment following the increased cost of living that has seen consumers continue to cut on spending. Cumulatively, tax revenues amounted to Kshs 280.2 bn, equivalent to 13.5% of the original estimates of Kshs 2,071.9 bn and 81.1% of the prorated estimates of Kshs 345.3 bn,
- Total financing amounted to Kshs 100.0 bn, equivalent to 7.1% of the original estimates of Kshs 1,403.0 bn and is equivalent to 42.8% of the prorated estimates of Kshs 233.8 bn. Additionally, domestic borrowing amounted to Kshs 54.8 bn, equivalent to 5.3% of the original estimates of Kshs 1,040.5 bn and is 31.6% of the prorated estimates of Kshs 173.4 bn,
- The total expenditure amounted to Kshs 383.9 bn, equivalent to 10.8% of the original estimates of Kshs 3,544.6 bn, and is 65.0% of the prorated target expenditure estimates of Kshs 590.8 bn. Additionally, the net disbursements to recurrent expenditures came in at Kshs 149.4 bn, equivalent to 12.7% of the original estimates and 76.1% of the prorated estimates of Kshs 196.4 bn,
- Consolidated Fund Services (CFS) Exchequer issues came in at Kshs 183.5 bn, equivalent to 11.7% of the original estimates of Kshs 1,571.8 bn, and are 70.1% of the prorated amount of Kshs 262.0 bn. The cumulative public debt servicing cost amounted to Kshs 177.9 bn which is 12.8% of the original estimates of Kshs 1,393.1 bn, and is 76.6% of the prorated estimates of Kshs 232.2 bn. Additionally, the Kshs 177.9 bn debt servicing cost is equivalent to 59.6% of the actual revenues collected as at the end of August 2022, further emphasizing on how much public debt weighs on the country’s expenditure, and,
- Total Borrowings as at the end of August 2022 amounted to Kshs 86.6 bn, equivalent to 6.2% of the original estimates of Kshs 1,389.8 bn for FY’2022/2023 and are 37.4% of the prorated estimates of Kshs 231.6 bn. The cumulative domestic borrowing target of Kshs 1,040.5 bn comprises of adjusted Net domestic borrowings of Kshs 579.1 bn and Internal Debt Redemptions (Roll-overs) of Kshs 461.4 bn.
As expected, the revenue performance for the second month of the FY’2022/2023 is not plausible mainly due to the economic uncertainties that emanated from the elevated inflationary pressures and the prolonged electioneering period. The slow-down in economic environment is expected to persist in the short term as consumers continue to cut on spending. As such, we believe that the performance of revenue collection in the coming months will be largely determined by how soon the country’s business environment stabilizes and how fast the new regime implements its economic growth related initiatives. However, risks lie on the downside given the high global commodity prices coupled with the persistent supply bottlenecks which continue to weigh on the economy.
Rates in the Fixed Income market have remained relatively stable due to the relatively ample liquidity in the money market. As it is still early in the financial year, the government is 13.4% behind its prorated borrowing target of Kshs 124.7 bn having borrowed Kshs 141.3 bn of the Kshs 581.7 bn borrowing target for the FY’2022/2023. We expect sustained gradual economic recovery as evidenced by the revenue collections of Kshs 2.0 tn in the FY’2021/2022, equivalent to a 2.8% outperformance. Despite the performance, we believe that the projected budget deficit of 6.2% is relatively ambitious given the downside risks and deteriorating business environment occasioned by high inflationary pressures. We however expect the support from the IMF and World Bank to finance some of the government projects and thus help maintain a stable interest rate environment since the government is not desperate for cash. Owing to this, our view is that investors should be biased towards short-term fixed-income securities to reduce duration risk.
Markets Performance
During the week, the equities market was on a downward trajectory with NASI, NSE 20 and NSE 25 declining by 6.6%, 2.2% and 5.5% respectively, taking their YTD performance to losses of 20.8%, 8.7% and 16.0%, for NASI, NSE 20 and NSE 25, respectively. The equities market performance was mainly driven by losses recorded by large-cap stocks such as Safaricom, KCB Group, NCBA and EABL of 9.2%, 8.0%, 7.7% and 7.2%, respectively. The losses were slightly mitigated by gains recorded by stocks such as Sanlam Kenya of 5.5%.
During the week, equities turnover increased by 59.3% to USD 21.4 mn, from USD 13.5 mn recorded the previous week, taking the YTD turnover to USD 621.7 mn. Foreign investors remained net sellers, with a net selling position of USD 4.6 mn, from a net selling position of USD 0.6 mn recorded the previous week, taking the YTD net selling position to USD 152.5 mn.
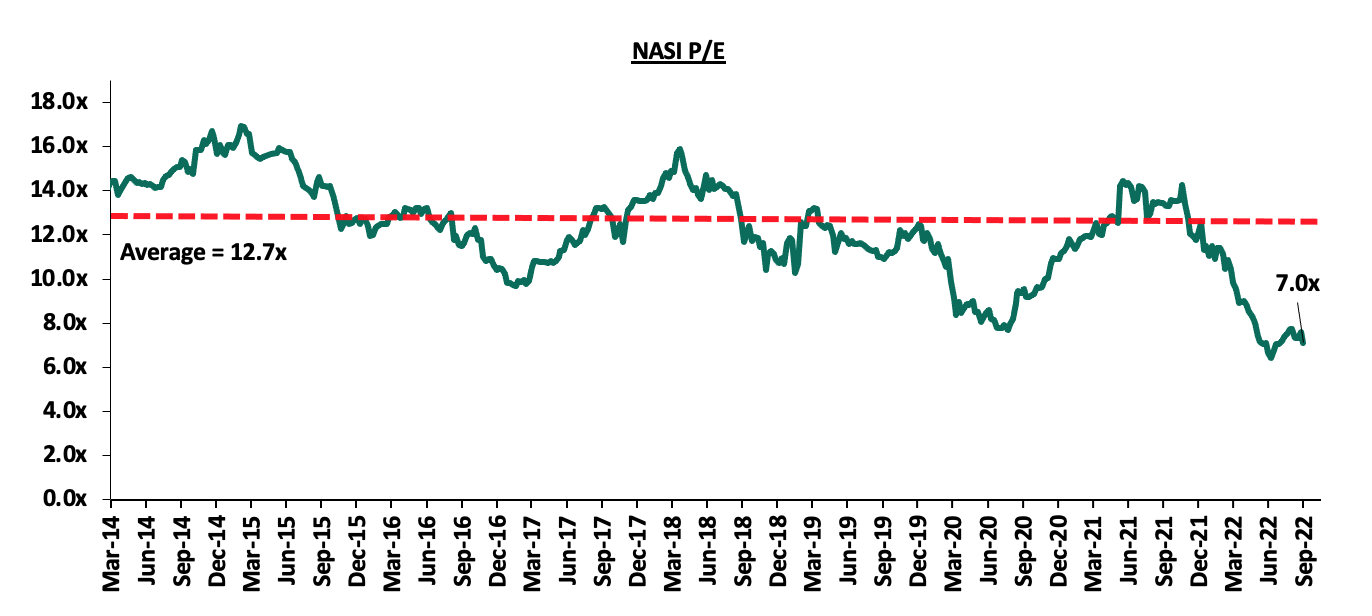
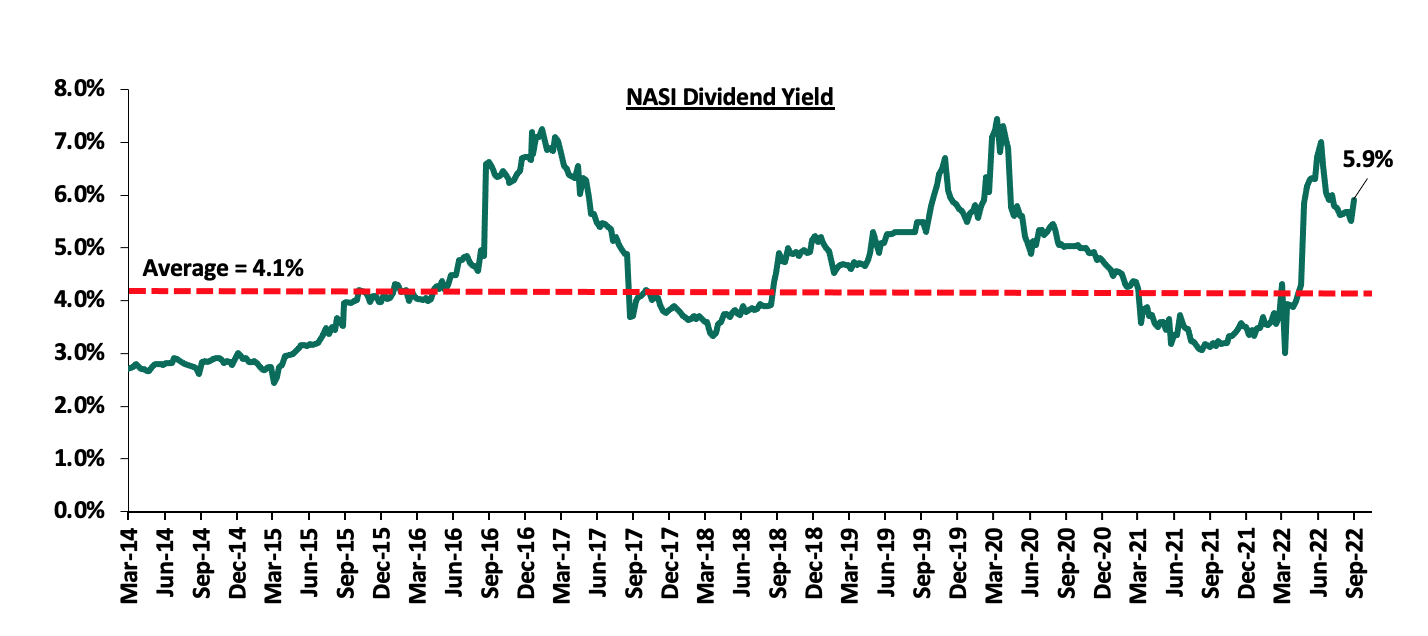
The market is currently trading at a price to earnings ratio (P/E) of 7.0x, 44.8% below the historical average of 12.7x, and a dividend yield of 5.9%, 1.8% points above the historical average of 4.1%. Key to note, NASI’s PEG ratio currently stands at 0.9x, an indication that the market is undervalued relative to its future growth. A PEG ratio greater than 1.0x indicates the market may be overvalued while a PEG ratio less than 1.0x indicates that the market is undervalued. The charts below indicate the historical P/E and dividend yields of the market:
Weekly Highlight:
Equity Group Holdings’ acquisition of Spire Bank
During the week, Equity Group Holdings Plc through Equity Bank (Kenya) Limited, announced that it had entered into an Assets and Liabilities purchase agreement with Spire Bank Limited for purchase of certain assets and liabilities. In this deal which is anchored in Equity’s plan to support economic recovery post COVID-19, Equity Bank Kenya Limited will acquire approximately 20,000 deposit customers with deposits totaling Kshs 1.3 bn, and 3,700 loan customers with outstanding loan balances at Kshs 1.7 bn, with a net carrying value of Kshs 0.9 bn after adjusting for statutory loan loss provisions of Kshs 0.8 bn. Upon completion of the proposed transaction on 30th November 2022, all existing depositors of Spire Bank with exemption of deposits from Mwalimu National Sacco will become customers of Equity Bank Kenya, which ensures preservation of their deposits.
Upon completion of the proposed transaction, Mwalimu Sacco, which owns Spire Bank will pay Equity Group an additional Kshs 1.7 bn to cover liabilities hence the P/Bv multiple in in this transaction is inconsequential. Spire Bank, which is fully owned by Mwalimu National Sacco, reported a loss of Kshs 403.0 mn in H1’2022, a decrease of 21.4% from Kshs 512.9 in H1’2021. The Bank has been recording losses since 2013, when it last recorded a profit of Kshs 55.6 mn. The losses have eroded Spire Bank’s shareholder’s funds, which currently stand at a paltry Kshs 9.6 mn, with accumulated losses at Kshs 10.0 bn. Additionally, the bank’s capital adequacy levels have also been adverse, with key ratios such as the core capital to liabilities ratio coming in at (40.8%), below the regulatory limit of 8.0%. Similarly, the core capital to risk weighted assets came in at (33.4%), 43.9% below the regulatory limit of 10.5% while the liquidity ratio came in 6.8%.
The combined pro-forma financials for the banks upon transaction approval are shown in the table below;
|
Combined Pro-forma Balance Sheet |
|||
|
Balance Sheet |
Equity Group (Kshs bn) |
Spire Bank (Kshs bn) |
Combined Entity (Kshs bn) |
|
Net Loans (Kshs bn) |
650.6 |
1.7 |
652.3 |
|
Customer deposits (Kshs bn) |
970.9 |
1.3 |
972. 2 |
|
Total assets (Kshs bn) |
1,333.9 |
3.6 |
1,337.4 |
|
Total liabilities |
1,183.5 |
2.9 |
1186.4 |
|
*Figures as of June 2022 |
|||
In our view, we commend Equity Group Holdings for coming to the aid of Spire Bank and preventing collapse of another banking player, following the collapse of Imperial Bank, Dubai Bank and Chase Bank. We expect the bank to benefit from Equity Group’s financial muscle and restore full operations and reverse the loss making trend. It is also commendable that the Central Bank of Kenya continued to support the bank with short term liquidity that ensured the bank stayed the course until it found a buyer, as compared to placing it under receivership. However, Spire Bank’s weak capital adequacy underlines the challenges being faced by the tier 3 banks as the gap between them, tier 2 and tier 1 banks widens. As such, we expect to see more consolidation activities in the Kenyan Banking Sector as weaker banks are merged with the big banks to form a stronger banking system in order to boost their capital adequacy and liquidity ratios to the required minimum statutory levels.
Below is a summary of the deals in the last 8-years that have either happened, been announced or expected to be concluded:
|
Acquirer |
Bank Acquired |
Book Value at Acquisition (Kshs bn) |
Transaction Stake |
Transaction Value (Kshs bn) |
P/Bv Multiple |
Date |
|
Equity Group |
Spire Bank |
0.01 |
Undisclosed |
Undisclosed |
N/A |
Sep-22 |
|
KCB Group |
Trust Merchant Bank |
12.4 |
85.0% |
15.7 |
1.5x |
Aug-22 |
|
Access Bank PLC |
Sidian Bank |
4.1 |
83.4% |
4.3 |
1.1x |
June-22* |
|
KCB Group |
Banque Populaire du Rwanda |
5.3 |
100.0% |
5.6 |
1.1x |
Aug-21 |
|
I&M Holdings PLC |
Orient Bank Limited Uganda |
3.3 |
90.0% |
3.6 |
1.1x |
Apr-21 |
|
KCB Group** |
ABC Tanzania |
Unknown |
100.0% |
0.8 |
0.4x |
Nov-20* |
|
Co-operative Bank |
Jamii Bora Bank |
3.4 |
90.0% |
1 |
0.3x |
Aug-20 |
|
Commercial International Bank |
Mayfair Bank Limited |
1.0 |
51.0% |
Undisclosed |
N/A |
May-20* |
|
Access Bank PLC (Nigeria) |
Transnational Bank PLC. |
1.9 |
100.0% |
1.4 |
0.7x |
Feb-20* |
|
Equity Group ** |
Banque Commerciale Du Congo |
8.9 |
66.5% |
10.3 |
1.2x |
Nov-19* |
|
KCB Group |
National Bank of Kenya |
7.0 |
100.0% |
6.6 |
0.9x |
Sep-19 |
|
CBA Group |
NIC Group |
33.5 |
53% : 47% |
23 |
0.7x |
Sep-19 |
|
Oiko Credit |
Credit Bank |
3.0 |
22.8% |
1 |
1.5x |
Aug-19 |
|
CBA Group** |
Jamii Bora Bank |
3.4 |
100.0% |
1.4 |
0.4x |
Jan-19 |
|
AfricInvest Azure |
Prime Bank |
21.2 |
24.2% |
5.1 |
1.0x |
Jan-18 |
|
KCB Group |
Imperial Bank |
Unknown |
Undisclosed |
Undisclosed |
N/A |
Dec-18 |
|
SBM Bank Kenya |
Chase Bank Ltd |
Unknown |
75.0% |
Undisclosed |
N/A |
Aug-18 |
|
DTBK |
Habib Bank Kenya |
2.4 |
100.0% |
1.8 |
0.8x |
Mar-17 |
|
SBM Holdings |
Fidelity Commercial Bank |
1.8 |
100.0% |
2.8 |
1.6x |
Nov-16 |
|
M Bank |
Oriental Commercial Bank |
1.8 |
51.0% |
1.3 |
1.4x |
Jun-16 |
|
I&M Holdings |
Giro Commercial Bank |
3.0 |
100.0% |
5 |
1.7x |
Jun-16 |
|
Mwalimu SACCO |
Equatorial Commercial Bank |
1.2 |
75.0% |
2.6 |
2.3x |
Mar-15 |
|
Centum |
K-Rep Bank |
2.1 |
66.0% |
2.5 |
1.8x |
Jul-14 |
|
GT Bank |
Fina Bank Group |
3.9 |
70.0% |
8.6 |
3.2x |
Nov-13 |
|
Average |
76.7% |
1.2x |
||||
|
* Announcement Date ** Deals that were dropped |
||||||
Universe of Coverage
|
Company |
Price as at 09/09/2022 |
Price as at 16/09/2022 |
w/w change |
YTD Change |
Target Price* |
Dividend Yield |
Upside/ Downside** |
P/TBv Multiple |
Recommendation |
|
Kenya Reinsurance |
2.2 |
2.1 |
(2.8%) |
(8.7%) |
3.2 |
4.8% |
56.9% |
0.2x |
Buy |
|
Jubilee Holdings |
245.0 |
245.3 |
0.1% |
(22.6%) |
379.4 |
0.4% |
55.1% |
0.4x |
Buy |
|
KCB Group*** |
42.5 |
39.1 |
(8.0%) |
(14.3%) |
53.5 |
7.7% |
44.7% |
0.7x |
Buy |
|
Sanlam |
10.9 |
11.5 |
5.5% |
(0.4%) |
15.9 |
0.0% |
38.3% |
1.2x |
Buy |
|
Equity Group*** |
48.6 |
47.2 |
(2.9%) |
(10.5%) |
62.2 |
6.4% |
38.2% |
1.1x |
Buy |
|
Co-op Bank*** |
12.6 |
12.4 |
(1.6%) |
(5.0%) |
15.6 |
8.1% |
34.4% |
0.7x |
Buy |
|
ABSA Bank*** |
12.0 |
11.6 |
(2.9%) |
(1.3%) |
14.9 |
1.7% |
30.2% |
1.0x |
Buy |
|
I&M Group*** |
17.0 |
17.0 |
(0.3%) |
(20.8%) |
20.5 |
8.8% |
30.0% |
0.4x |
Buy |
|
Diamond Trust Bank*** |
50.5 |
50.0 |
(1.0%) |
(16.0%) |
59.5 |
6.0% |
25.0% |
0.2x |
Buy |
|
Standard Chartered*** |
139.0 |
136.3 |
(2.0%) |
4.8% |
155.0 |
10.3% |
24.0% |
0.9x |
Buy |
|
NCBA*** |
33.0 |
30.5 |
(7.7%) |
19.6% |
35.2 |
6.6% |
22.0% |
0.7x |
Buy |
|
Britam |
6.7 |
6.5 |
(3.9%) |
(14.3%) |
7.7 |
0.0% |
18.8% |
1.1x |
Accumulate |
|
Stanbic Holdings |
93.5 |
94.3 |
0.8% |
8.3% |
99.9 |
9.5% |
15.5% |
0.7x |
Accumulate |
|
Liberty Holdings |
7.5 |
7.0 |
(6.2%) |
(0.8%) |
7.8 |
0.0% |
11.4% |
0.5x |
Accumulate |
|
HF Group |
3.6 |
3.5 |
(2.0%) |
(8.2%) |
3.6 |
0.0% |
2.6% |
0.2x |
Lighten |
|
CIC Group |
2.1 |
2.1 |
(0.9%) |
(3.2%) |
2.1 |
0.0% |
0.0% |
0.7x |
Sell |
|
Target Price as per Cytonn Analyst estimates **Upside/ (Downside) is adjusted for Dividend Yield ***For Disclosure, these are stocks in which Cytonn and/or its affiliates are invested in |
|||||||||
We are “Neutral” on the Equities markets in the short term due to the current adverse operating environment and huge foreign investor outflows, and, “Bullish” in the long term due to current cheap valuations and expected global and local economic recovery.
With the market currently trading at a discount to its future growth (PEG Ratio at 0.9x), we believe that investors should reposition towards value stocks with strong earnings growth and that are trading at discounts to their intrinsic value. We expect the current high foreign investors sell-offs, and the slow vaccine rollout to continue weighing down the economic outlook in the short term.
- Industry Reports
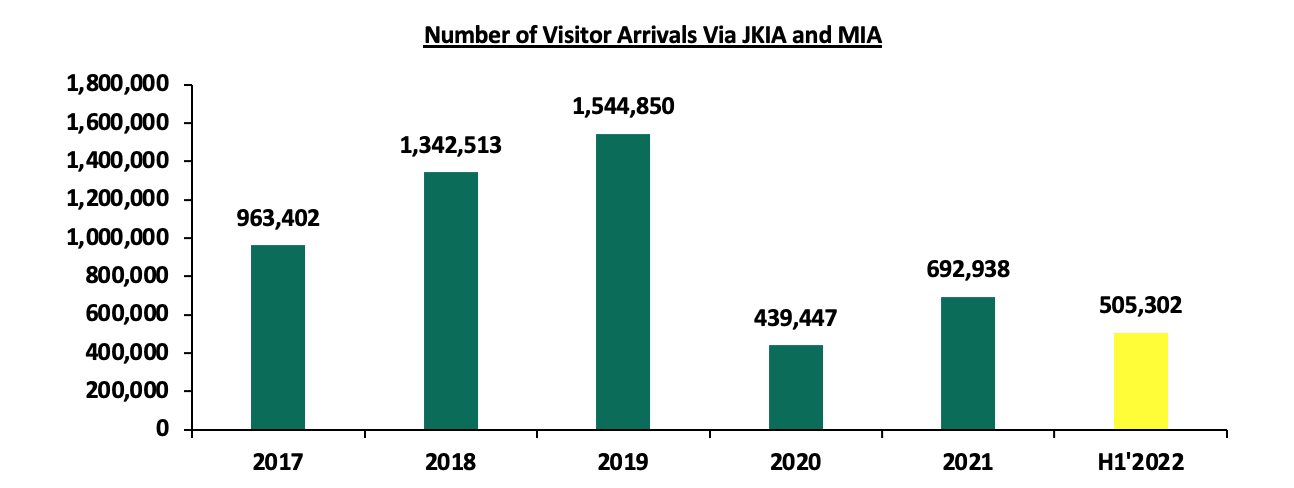
The Kenya National Bureau of Statistics (KNBS) released the June 2022 Leading Economic Indicators (LEI) report which highlights the performance of major economic indicators such as international arrivals, building plan approvals, among others. The key highlights related to the Real Estate sector include;
- Overall international arrivals through Jomo Kenyatta International Airport (JKIA) and Moi International Airport (MIA) increased by 147.1% to 279,981 in Q2’2022, from the 113,307 recorded in Q2’2021. On a q/q basis, the performance was a 24.3% increase from 225,321 recorded in Q1’2022. The remarkable performance was mainly driven by; i) Lowered travel restrictions and advisories from countries such as UK and USA, ii) Increased vaccine roll out which boosted the confidence of visitors into the country, iii) Positive accolades promoting tourism such as the 2021 World Travel Awards, iv) world rally championship program held annually at Naivasha, and, v) Aggressive marketing of Kenya’s tourism and hospitality market through platforms such as the Magical Kenya platform, among others. The chart below shows the number of international arrivals in Kenya between 2017 and H1’2022:
Source: Kenya National Bureau of Statistics (KNBS)
- The value of building plans approved in the Nairobi Metropolitan Area (NMA) increased by 1,916.7% to Kshs 36.3 bn in Q2’2022, from Kshs 1.8 bn recorded in Q2’2021, amidst the improved construction activities resulting from the improved business environment. However, on a q/q basis, the performance represented a 32.5% decline from Kshs 53.8 bn recorded in Q1’2022, partly attributable to a decline in development activities as investors adopted a ‘wait and see’ investment approach in the electioneering period. Consequently, the consumption of cement declined by 12.0% to 2.3 mn metric tonnes in Q2’2022, from 2.5 mn metric tonnes realized in Q1’2022, as shown below.
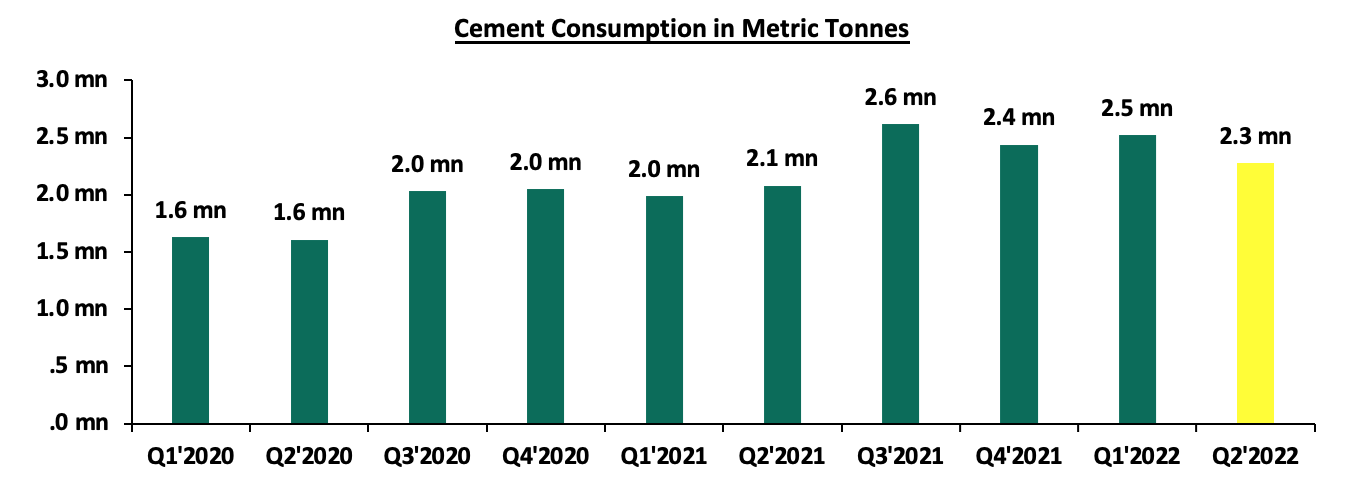
Source: Kenya National Bureau of Statistics (KNBS)
Following the peaceful general elections, we expect the Real Estate sector to register remarkable growth and improved performance mainly driven by;
- Increased expansion and construction activities particularly in the residential and infrastructure sectors, given that the current government also embraced the affordable housing initiative in a bid to bridge Kenya’s housing deficit currently at 2.0 mn units, by delivering 250,000 units p.a., and,
- The increasing number of visitor arrivals into the country boosting performance of serviced apartments and hotels. This will be further fueled by the incoming festive season, as well as the World Travel Awards (WTA) event which will be held at Nairobi’s Kenyatta International Convention Centre (KICC) on October 15th
- Real Estate Investment Trusts (REITs)
In the Nairobi Stock Exchange, ILAM Fahari I - REIT closed the week trading at an average price of Kshs 7.0 per share representing a 9.4% Year-to-Date (YTD) increase from Kshs 6.4 per share. On an Inception-to-Date (ITD) basis, the REIT’s performance continues to be weighed down having recorded a 65.0% decline from Kshs 20.0. The graph below shows Fahari I-REIT’s performance from November 2015 to September 2022: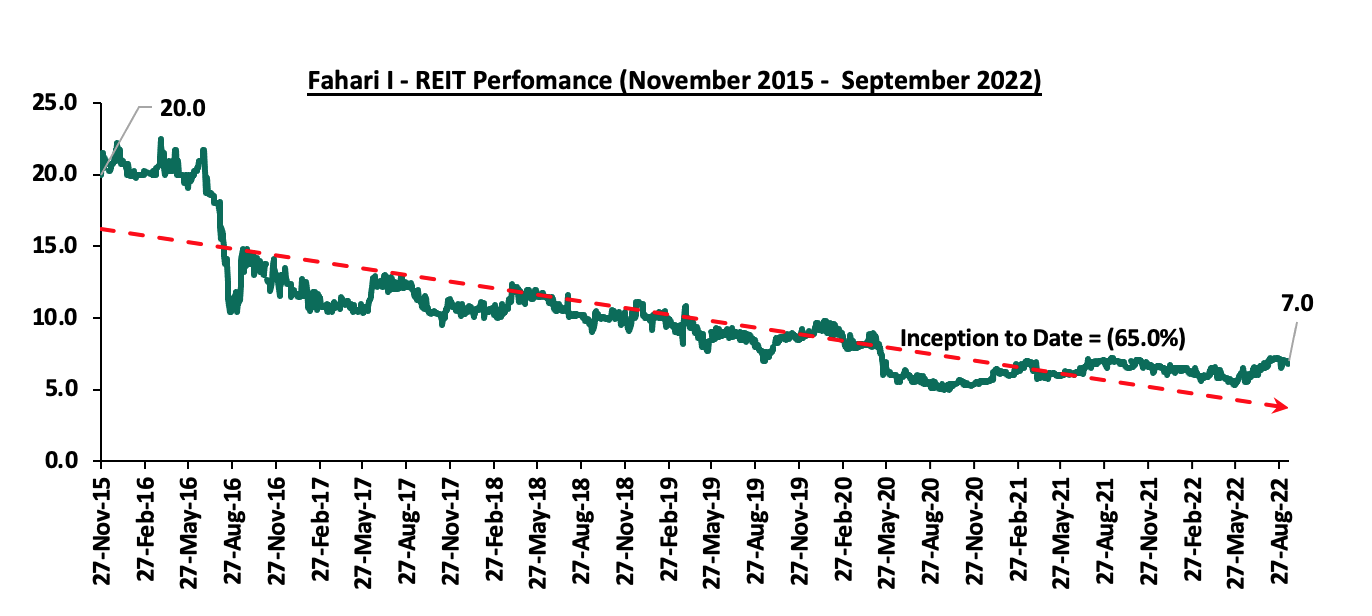
In the Unquoted Securities Platform, Acorn D-REIT and I-REIT closed at Kshs 23.8 and Kshs 20.8 per unit, respectively, as at 2nd September 2022. The performance represented a 19.0% and 4.0% gain for the D-REIT and I-REIT, respectively, from the Kshs 20.0 inception price. The volumes traded for the D-REIT and I-REIT came in at 5.5 mn and 14.5 mn shares, respectively, with a turnover of Kshs 117.0 mn and Kshs 300.3 mn, respectively since Inception-to-Date.
We expect the performance of Kenya’s Real Estate sector to improve as a result of the anticipated increase in construction activities especially in the residential and infrastructure sectors, coupled with the expected rise in tourism arrivals driving performance of hotels and serviced apartments. However, setbacks such as high construction costs, and investor’s inadequate appetite for the Kenyan REIT instrument is expected to hinder optimum investments in the property market.
Recently, Kaluworks Limited successfully exited administration after struggling financially over the last few years on the back of weak sales and increased competition from other manufacturers. Key to note the company was under receivership for a period of fifteen months, and is now slated to resume operations. As such, we saw it fit to cover a topical on administration as a business restructuring option to shed light on the recent administrations and key lessons to draw from them.
A business is said to be insolvent when it cannot be able to raise enough cash to meet its obligations. Generally, there are two types of insolvency i) Where the company’s liabilities are more than the assets, and, ii) Technical insolvency where the assets exceed liabilities but cannot be easily liquidated to pay off the obligations that are due. However, mere insolvency does not afford enough ground for lenders to petition for involuntary bankruptcy of the borrower, or force liquidation of the business. On the contrary, Kenyan laws provide alternatives on how a technically insolvent business can be assisted to get back to its feet and be able to service its creditors’ obligations and protect the interests of the other stakeholders. The available options include: (i) Administration, (ii) Company Voluntary arrangements, and, (iii) Liquidation. To read more on the options, please see our topical on Business Restructuring Options. Similarly, if the cause of business distress is uptake of debt, there are various means to restructure the debt to not only ensure continuity but to realize a better return of value to the stake holders as opposed to liquidation. For more information, please see our topical on Debt restructuring.
In this week’s topical, we shall focus on Administration as a business restructuring option in Kenya. We shall do this by taking a look into the following:
- Background and Overview of the Topic,
- Case Studies,
- Key learnings, and,
- Conclusion.
Section I: Background and Overview of the Topic
Administration was introduced by the Insolvency Act, No. 18 of 2015 as an alternative to liquidation, with the following key objectives;
- To maintain the company as a going concern,
- To achieve a better outcome for the company’s creditors than liquidation would offer, and,
- To realize the property of the company and make distributions to secured or preferential creditors.
The process of administration is headed by an Administrator, a certified Insolvency Practitioner, who may be appointed by an administration order of the court, unsecured creditors, or a company or its directors. An administrator of a company is required to perform the administrator’s functions in the interests of the company’s creditors as a whole. The administrator is deemed an officer of the Court, whether appointed by the court or not.
Once the Administrator is appointed, they are entitled to all the records of the company and are required to present a proposal to the creditors on their plan to salvage the company. The Administrator assumes control of all the property the company is entitled to manage as well as the company’s property. While under administration, creditors may undertake procedures to enforce security over the company’s property, with approval from the court or an agreement with the administrator. The Administrator must therefore set a date for the creditors meeting and invite all the creditors that it knows of, having had access to the books of the company. Only creditors who have filed proof of debt before 4.00 pm of the day before the Creditors meeting are entitled to vote at the said creditor’s meeting.
At the Creditors’ meeting, the Administrator must present their proposal to the Creditors who shall vote on it. The percentage of an individual vote shall be determined by the amount of debt owed to the creditor. The creditor may opt to either vote for the proposal without amendments, vote for the proposal with amendments, or reject the proposal altogether. The decision of the creditors meeting shall be final.
Section II: Case studies
In this section, we look at the various companies that have experienced financial distress and consequently invoked the Insolvency Act. We shall thus look at Nakumatt Holdings, Athi River Mining (ARM) Limited, and more recently, Kaluworks Limited.
- Case Study of Nakumatt Holdings
Background: Nakumatt Holdings is a Kenyan supermarket chain. Until February 2017, Nakumatt was regarded as the largest Kenyan retailer, with 62 branches across the region, (45 in Kenya, 9 in Uganda, 5 in Tanzania and 3 in Rwanda) and a gross turnover of Kshs 52.2 bn. However, what was fueling Nakumatt’s rapid expansion was funded through debt. This included short-term borrowings, bank loans and letters of credit to its numerous suppliers. Following the collapse of Imperial Bank, the Commercial Paper market, which Nakumatt had been relying on, dried up and Nakumatt started experiencing serious cash-flow difficulties in 2016. The retailer was therefore unable to meet its financial obligations to landlords, its suppliers and employees. It was for these reasons that the administrator was appointed by an order of the court pursuant to an application filed by unsecured creditors, and Nakumatt Holdings was placed under administration in January 2018.
Following the assessment of Nakumatt’s financial position, the administrator, PKF Consulting Limited (PKF) determined that if a liquidation route was used, then out of the total creditors with amounts worth Kshs 35.8 bn, Kshs 30.6 bn was unlikely to be paid. This represented a significant 85.0% potential loss to the creditors. In essence, all unsecured creditors, namely Trade Creditors, Commercial Paper Holders and Short Term Noteholders, as well as private placement loan providers would suffer the maximum 100% loss of their debt amounts, as the available assets would first pay off secured creditors. Since Nakumatt’s business model could support a better outcome for all the creditors as compared to a liquidation scenario, the Administrator set out to come up with a restructuring proposal to achieve this outcome based on the company remaining a going concern. Nakumatt’s administrator came back to creditors with proposals, which we highlighted in our focus note, Restructuring an Insolvent Business, that the creditors were supposed to take a vote on. The creditors rejected the proposal which entailed a debt waiver and restructuring into equity in order to ease the debt burden for the company and turn the business around. The plan would have seen bank debt, Kenya Revenue Authority and Employee liabilities were treated as preferential creditors; thus exempting them from the 25.0% waiver that non-preferential creditors took on their debt, as well as the 75.0% debt to equity mandatory conversion.
Our View: In our view, the proposals brought forth were not equitable and fair to all creditors. In addition, they failed to inspire confidence especially with the major stakeholders, required to turn around the business, more so suppliers, landlords, and employees. We thus concurred with the creditors who rejected the deal.
We noted that the best-case scenario for all creditors was a debt to equity conversion of their creditor claims, as liquidation was not in the best interest of anyone. This should have included even the banks who had taken preferential debt. Case in point being, the recent restructuring of Kenya Airways. In the case of Kenya Airways’ restructuring, the Government and several banks converted their debt into equity to the tune of Kshs 59.0 bn. The Government’s stake in Kenya Airways rose to 46.5% from 29.8% before the debt to equity conversion, while the bank’s consortium (KQ Lenders Co.) ended up owning 35.7% of the company. Ordinary shareholders who did not inject additional equity were diluted by 95.0%.
In conclusion, we note that the proposed procedures, in line with the Insolvency Act, accorded Nakumatt with a second chance, to pursue the ongoing recovery strategy, dubbed “Nakumatt Bounce Back” but it was later in 2020 voted that the company could not continue with its operations and the creditors voted for its winding up.
It is noteworthy that almost all of Nakumatt branches have now been taken over by competitors such as Naivas and Carrefour, which points to the fact that they business had potential had the restructuring been undertaken earlier and more effectively.
- Case Study of Athi River Mining (ARM) Cement
Background: ARM is a Kenyan manufacturing company listed at the Nairobi Securities Exchange, with operations in Kenya, Tanzania and Rwanda. The firm specializes in the production of cement, fertilizers, quicklime, and other industrial minerals. ARM cement, once a stable company, started experiencing difficulty in 2016, as the firm’s revenue lines started decreasing. Revenues declined by 32.0% from Kshs 12.8 bn in FY’2016 to Kshs 8.7 bn in FY’2017 while operating expenses rose by 34.8% to Kshs 3.1 bn from Kshs 2.3 bn in FY’2016. This saw the operating loss widen to Kshs 4.2 bn in FY’2017 from Kshs 0.3 bn in FY’2016, and consequently the loss after tax widened by 87.5% to Kshs 7.5 bn in FY’2017 from Kshs 4.0 bn in FY’2016. The shrinking revenue lines were largely attributed to stiff competition in the cement industry both in Kenya and Tanzania, the company’s main revenue contributors. The declining performance pushed the company into a negative working capital position, further exacerbating the poor performance, thereby rendering the company unable to service its debt obligations to various creditors, such as:-
- UBA Bank Kenya, which provided the company with a Kshs 500.0 mn short term loan,
- Africa Finance Corporation (AFC), which provided a Kshs 4.6 bn loan, and,
- Stanbic Bank Kenya, which provided the company with a Kshs 3.2 bn loan.
The company was then placed under administration in August 2018, with PwC’s Muniu Thoithi and George Weru appointed as the administrators. The administrators, having full control held a creditor’s meeting in October 2018, where creditors voted to give the administrators up to September 2019, to revive the company. The creditors also approved the sale of some or even all of the company’s assets, and capital injections from strategic investors as part of the strategies to revive the company. The administrators wrote off the Kshs 21.3 bn in loans advanced to its Tanzanian Subsidiary, due to alleged misrepresentation of the loan given that it had been non-performing for several years and that the subsidiary was deemed unable to repay the loan. As such, the company slipped to a negative equity position of Kshs 2.4 bn, effectively meaning a complete write-off for shareholders in the event of a liquidation, and that only secured lenders could be fully covered by the then Kshs 14.2 bn asset base. Proposed moves to look for a strategic investor such as several major companies like Dangote Cement and Oman Based Raylat limited did not bear fruit.
Despite the Insolvency Act enabling the company to remain operational as it undertook the turnaround strategy, ARM failed to revive and the administrators only option was to sell the salvageable assets in an attempt to return value to the creditors and shareholders. In October 2019, National Cement, owned by the Devki Group, acquired all cement and non-cement assets and businesses of ARM Cement at a cost of Kshs 5.0 bn. However, this was still a drop in the ocean with the listed Cement manufacturer owing its creditors in upwards of Kshs 28.4 bn. In May 2020, ARM sold its Tanzania subsidiary Maweni Limestone Limited to a Chinese firm Huaxin Cement, in a deal priced at Kshs 11.9 bn. When it was clear that all creditors and shareholders’ demands could not be met, the administrators in April 2021 advised liquidation and subsequent delisting from the Nairobi Securities Exchange (NSE).
Disclosures made by PwC’s Muniu Thoithi and George Weru as at 31st July 2022 revealed that following liquidation, the net amount available for distribution to secured, preferential and unsecured creditors of ARM stood at USD 52.0 mn (Kshs 6.2 bn), with the creditors having suffered a combined shortfall in upwards of USD 100.0 mn (Kshs 11.9 bn). As a result, there would be no disbursement to shareholders. The disbursement is summarized in the table below;
|
Item |
Amount (Kshs bn) |
|||
|
Net realized amount from liquidation |
6.2 |
|||
|
Utilization of funds |
||||
|
Item |
Amount owed (Kshs bn) |
Amount paid (Kshs bn) |
Amount Lost (Kshs bn) |
Haircut |
|
Preferential creditors |
0.3 |
0.3 |
- |
- |
|
Secured creditors |
8.0 |
5.2 |
2.8 |
35.0% |
|
Unsecured creditors |
9.0 |
0.7 |
8.3 |
92.2% |
|
Shareholders |
5.3* |
0.0 |
5.3 |
100.0% |
|
*Based on last traded price of Kshs 5.5 |
||||
Source: Administrator filings
Our View: We are of the opinion that there existed mechanisms of restructuring ARM and its debt to ensure that the company continued operations and avoid total wiping off of shareholder’s equity. Similar to debt to Equity conversion done at Kenya Airways, where it restructured Kshs 59.0 bn owed to the Government and several banks, this would have ensured that ARM had a stronger fighting chance.
- Case study of Kaluworks Limited
Background: Kaluworks is a manufacturer of cook wear and building materials which was founded in 1929. The company operates as a subsidiary of Clovis Co Ltd, a Bermuda registered Investment Holding Company owned by Comcraft Group, whose Chairman is Manu Chandaria.
Kaluworks was one of Kenya’s leading aluminium products such as utensils and roofing sheets, before the country started to see an influx of imports of similar materials. This came at a time when Kaluworks was on an aggressive expansion drive and had invested Kshs 1.8 bn to upgrade its factory in Mariakani Mombasa, both initiatives largely funded through debt from Commercial banks. This was also followed by interruptions brought about by the COVID-19 pandemic, which saw a slowdown in building activities in the country. As at May 2021, Kaluworks had liabilities of Kshs 12.6 bn against total assets of Kshs 1.3 bn. One of the main creditors, NCBA placed Kaluworks under receivership on May 27th 2021 by NCBA Group, by virtue of being holders of a qualifying floating charge of Kshs 4.3 bn. Other creditors include Cooperative Bank, owed Kshs 4.8 bn, while other unsecured lenders such as I&M Bank, commercial paper holders such as Sanlam Kenya held a combined of Kshs 3.5 bn. NCBA appointed an insolvency practitioner, Pongangialli Rao in a bid to recover the amounts owed to them.
In a gazette noticed dated 25th August 2022, the High Court of Kenya in Nairobi, consented to the termination of administration of Kaluworks Limited, tabled by the receiver manager, Pongangialli Rao in agreement with Kaluwork’s secured creditors. In the tabled agreement, Kaluworks shareholders agreed to a Kshs 1.2 bn capital injection, with a section paid to the secured lenders as is in the schedule below;
|
Kaluworks’ Limited disbursement to creditors (Kshs bn) |
||||
|
Lender |
Amount owed (Kshs bn) |
Amount paid (Kshs bn) |
Amount written off (Kshs mn) |
Haircut |
|
NCBA |
4.3 |
0.6 |
3.8 |
88.0% |
|
Cooperative Bank |
4.8 |
0.6 |
2.6 |
55.0% |
|
Other Creditors (CPs) |
3.5 |
-* |
-* |
100.0%* |
|
Total |
12.6 |
1.2 |
6.4 |
51.0% |
|
*Not disclosed |
||||
Source: Administrator’s filings. CPs stands for Commercial Paper
As seen in the table above, the secured creditors (NCBA Group and Cooperative Bank) got into an agreement with the administrator and Kaluworks Limited to write off a total Kshs 6.3 bn out of the total Kshs 9.1 bn owed to them, equating to a 70.6% haircut. Additionally, the main shareholders (Comcraft Group), agreed to inject Kshs 150.0 mn into the business in order to revive operations and the business remaining a going concern.
Our View: The Insolvency act gave Kaluworks Limited a fighting chance, and its successful exit from administration highlights how collaborative efforts from all stakeholders are crucial in saving a business. We expect that the company will regain its footing, resume operations and fulfill its potential not only in the country but in the region.
Section III: Key learnings
From the above case studies, it is key to highlight the following points about administration,
- Administration offers struggling businesses a second chance to reorganize themselves and come out stronger and viable businesses,
- Administration offers a better deal for creditors as compared to other restructuring options such as liquidation given that it allows continuity of a trade or business which goes a long way in preserving the assets of a company. Similarly, it is easier for a business to source for finances to restore operations as a financier will view it more as a rescue than a gone case,
- It encourages entrepreneurship by providing a path to redemption in the case of a viable venture that has run into turbulence and just needs room to restructure and re-strategize. Research has shown that the availability of reorganization frameworks encourages entrepreneurship, and,
- Administration allows a company in operation to continuously chart its way out of administration by allowing for the Company Voluntary Agreements, a schedule or restructuring plan fronted by the Company to pay back its creditors, should they adopt the plan.
Additionally, we identified key challenges which in our view, have led to most administrations not being as successful:
- Getting into administration too late: As was the case with Nakumatt, it got into administration too late when it was too late to resuscitate the business,
- Administration costs are too high: As was the case with ARM, spending Kshs 2.5 bn on administration costs is too high, given that it was over 40.3% of amount recovered. It is important the administration costs are kept low to ensure creditors recover meaningful amounts and service providers align with the interest of creditors,
- Administrations take too long: In the case of ARM, it started in 2018 and ended in 2022, almost 5 years, this can only be beneficial to the service providers around the administration, and not the creditors. It would be helpful if administrations were conducted and closed as fast as possible,
- Creditors failure collaborate: In the case of Nakumatt, the retail creditors who held the commercial paper were not collaborative with the administrator and insisted on either full refunds or liquidation. They ended up with 100.0% loss, yet an equity restructuring would have given them value, which is now being enjoyed by competitors such as Carrefour,
- Failure to accept reality by shareholders: In the case of Nakumatt, shareholder management wanted to stay in control and would not cede control to possible new investors until it was too late to bring in new investors as the business had unraveled by the time they were willing to cede control,
- Lack of knowledge around administration: Many creditors, and even regulators and businesses, are yet to understand or accept administration as a legitimate business restructuring option,
- Lack of leadership to align interests: Administration has various actors, whose interests may not be aligned. Each administration requires firm leadership to align all the conflicting interests to face one direction in the interest of restructuring the business, and,
- Negative publicity around administration: Administration especially when not well understood by all stakeholders, poses as a risk to the business continuity. This is because the process often attracts negative publicity and uncertainty which deals inadvertent blows to the business and may lead to total collapse
Section IV: Conclusion
While evaluating the administration process, it is paramount for the stakeholders to view and approach it from a Win-Win mindset and be open to the various possible options to get the business back on track and return value to all stakeholders. Liquidation as an option gives the least value for all stakeholders. In the case of Nakumatt, unsecured lenders got zero while the secured lenders got very little out of the sale of assets. Similarly, for ARM, the creditors recouped slightly more than a third of their investments, underlining Liquidation as a first resort is not viable. Companies under administration and moratorium after invoking the Insolvency Act, are not subject to debt repayment obligations, as the administrators focus purely on the best possible resolution strategy to the creditors and to the shareholders. This, in our view, encourages entrepreneurship by giving business owners time to restructure and possibly regain financial stability in case of financial distress when faced by unprecedented challenges.
Disclaimer: The views expressed in this publication are those of the writers where particulars are not warranted. This publication, which is in compliance with Section 2 of the Capital Markets Authority Act Cap 485A, is meant for general information only and is not a warranty, representation, advice or solicitation of any nature. Readers are advised in all circumstances to seek the advice of a registered investment advisor.

- Talk to us
- Kenya
- P.O Box 20695 - 00200, Nairobi, Kenya
- Cell +254709101200
- Tel +254709101200
- WhatsApp +254741676635
- United States
- +254709101200
- DOWNLOAD OUR APP
-


- Kenya
- 8th Floor, Pinetree Plaza, Kaburu Drive, Ngong Road, Nairobi, Kenya
- USA
- Suite 1150, 1775 Eye Street NW, USA, Washington DC 20006, USA
- Investments
- High Yield
- Private Equity
- Real Estate
- Real Estate
- RiverRun Estates
- Cytonn Towers
- The Ridge
- Taraji Heights
- The Alma