Consolidation in Kenya’s Banking Sector to Continue, & Cytonn Weekly #06/2019
By Cytonn Research Team, Feb 10, 2019
Executive Summary
Fixed Income
T-bills remained over-subscribed during the week, with the overall subscription rate coming in at 198.3%, an increase from 167.4% recorded the previous week. The continued over-subscription in the primary auctions in 2019 has been attributed to improved liquidity in the market, driven by debt maturities as well as government payments. There was mixed performance, with the 91-day and 182-day papers recording an increase in subscription rates to 83.4% and 149.3%, from 59.7% and 81.0% recorded the previous week, respectively, while the 364-day paper subscription rate declined marginally to 293.2% from 296.9% recorded the previous week;
Equities
During the week, the equities market was on an upward trend with NASI, NSE 20 and NSE 25 gaining by 3.8%, 5.2%, and 3.5%, respectively, taking their YTD performance to 14.2%, 8.0% and 14.5%, for NASI, NSE 20 and NSE 25, respectively. The Capital Markets Authority (CMA) released The Report on the State of Corporate Governance of Issuers of Securities to the Public in Kenya. According to data from the Kenya National Bureau of Statistics, commercial banks in Kenya reduced their deposit rates to 5.7% in November 2018, the lowest in 15-months, from a high of 7.0% in February 2018;
Private Equity
In the telecommunications sector, Airtel Kenya and Telkom announced the signing of an agreement to merge their respective mobile, enterprise, and carrier services businesses in Kenya to operate under a joint venture company to be named Airtel-Telkom. African Private Equity and Venture Capital Association (AVCA) released two reports after completing two sets of surveys on institutional investors in Africa: (i) Their 2018 Annual Limited Partner Survey, a study that analyses the plans, views, preferences, expectations and evolving attitudes of 60 Limited Partners regarding Private Equity (PE) in Africa, which concluded that investors’ appetite for African private equity remains high, and (ii) the profile report of Africa’s Institutional Investors, which maps the different pools of capital for African private equity, which concluded that foreign investors remain the biggest players in the African PE space. The Africa’s Institutional Investors report also gives an overview of the demographics of institutional investors with allocations to Africa. The key takeout from both reports was the positive sentiment expressed by investors towards the African private equity space, with Nigeria being the most favored destination, followed by Kenya and Egypt;
Real Estate
During the week, Broll Kenya, a property services company, released their Nairobi Retail Report H2’2018, highlighting slow growth in the retail sector. Also, in the retail sector, Ebrahim Supermarkets, a local retailer, closed its outlet situated at Wazir House, at the Junction of Moi Avenue and Kenyatta Avenue, while Ukwala Supermarkets, having already sold 75.0% of their assets to Botswana retailer Choppies as at March 2016, applied for voluntary liquidation after revealing that it had been unable to pay off its debts, a move signaling the winding up of the parent company. Property developer, Tilisi Developments, announced that it had opened the sale of Phase 2, of the 400-acre mixed-use development, which is located in Limuru;
Focus of the Week
Over the last 8-years, there has been various consolidation activity in the banking sector, as banks either acquire smaller banks or merge with other banks to form relatively larger companies. The consolidation activity has picked up in the recent past, and as such, we look at the factors influencing the need for consolidation, and the expected impact of this activity on the banking sector’s health and stability.
- Following the completion and handover of Amara Ridge, we have now launched Applewood, our Kshs 2.5 bn residential development located in Miotoni, Karen. This signature development shall comprise luxury homes, each sitting on 1/2 acre. We invite you to the exhibition of Applewood, which will be at the Amara Ridge Clubhouse (Location pin: https://goo.gl/maps/B3GVnu8pHyn) from 9:00 am to 5:00 pm daily and will end on 28th February 2019. Call 0709 101 000 or email resales@cytonn.com to reserve a villa! See Video here;
- Ground breaking for Applewood shall be on Tuesday, 19th February 2019;
- David King’oo, Cytonn Procurement Manager, discussed the journey towards buying land and houses, and the factors to consider on Sema by Citizen T.V. Watch David here;
- We continue to hold weekly workshops and site visits on how to build wealth through real estate investments. The weekly workshops and site visits target both investors looking to invest in real estate directly and those interested in high yield investment products to familiarize themselves with how we support our high yields. Watch progress videos and pictures of The Alma, Amara Ridge, and The Ridge. Key to note is that our cost of capital is priced off the loan markets, where all-in pricing ranges from 16.0% to 20.0%, and our yield on real estate developments ranges from 23.0% to 25.0%, hence our top-line gross spread is about 6.0%. If interested in attending the site visits, kindly register here;
- We continue to see very strong interest in our weekly Private Wealth Management Training (largely covering financial planning and structured products). The training is at no cost and is open only to pre-screened participants. We also continue to see institutions and investment groups interested in the training for their teams. Cytonn Foundation, under its financial literacy pillar, runs the Wealth Management Training. If interested in our Private Wealth Management Training for your employees or investment group, please get in touch with us through wmt@cytonn.com. To view the Wealth Management Training topics, click here;
- For recent news about the company, see our news section here;
- We have 10 investment-ready projects, offering attractive development and buyer targeted returns of around 23.0% to 25.0% p.a. See further details here: Summary of Investment-Ready Projects;
- We continue to beef up the team with ongoing hires for Financial and Real Estate Advisors for our offices in Nairobi, Nakuru, Kisumu, and Nyeri. Visit the Careers Section on our website to apply;
- Are you looking for the perfect Valentine gift? Reserve a unit at The Alma in Ruaka and get your loved one a fully fitted kitchen with modern appliances and accessories. Having delivered Amara Ridge in 2018, we are delivering The Alma in 2019! To book a unit, visit: the-alma.com/introduction/FB.
T-Bills & T-Bonds Primary Auction:
T-bills remained over-subscribed during the week, with the overall subscription rate coming in at 198.3%, an increase from 167.4% recorded the previous week. The continued over-subscription in the primary auctions in 2019 has been attributed to improved liquidity in the market, driven by debt maturities as well as government payments. There was mixed performance, with the 91-day and 182-day papers recording an increase in subscription rates to 83.4% and 149.3%, from 59.7% and 81.0% recorded the previous week, respectively, while the 364-day paper subscription rate declined marginally to 293.2%, from 296.9% recorded the previous week.
The yields on the 91-day, 182-day, and 364-day papers declined to 7.0%, 8.6% and 9.6% from 7.1%, 8.8% and 9.9% recorded the previous week, respectively. The acceptance rate declined to 60.8%, from 80.5% recorded the previous week, with the government accepting Kshs 28.9 bn of the Kshs 47.6 bn worth of bids received.
The reopened 2-year (FXD1/2019/2) and 15-year (FXD1/2019/15) Treasury bonds recorded an oversubscription of 555.0%, driven by the 2-year bond, which attracted bids totaling to Kshs 50.2 bn out of the Kshs 66.6 bn bids received for the entire auction, an indication of the pent up demand in the shorter-term papers. The yields came in at 10.3% and 12.8% for the 2-year and 15-year bonds, respectively. The government accepted Kshs 23.4 bn out of the Kshs 66.6 bn worth of bids received against Kshs 12.0 bn on offer, translating to an acceptance rate of 35.2%, indicating that bids were largely not within ranges the Central Bank of Kenya (CBK) deemed acceptable. For the month of February, the Kenyan Government has issued a 5-year and 10-year Treasury bond, with issue No’s. FXD 1/2019/5 and FXD 1/2019/10, respectively, with market-determined coupon rates, in a bid to raise Kshs 50 bn for budgetary support. The period of sale is from 7th February 2019 to 19th February 2019. We shall give our bidding range in next week’s report.
Liquidity:
The average interbank rate declined to 3.0%, from 4.6% the previous week, while the average volumes traded in the interbank market rose by 100.9% to Kshs 4.8 bn, from Kshs 2.4 bn the previous week. The lower interbank rate points to improved liquidity conditions, with the rate declining to a low of 1.8% as at 7th February 2019, from 5.5% as at the start of the week, partly attributed to government payments and net redemption of government securities.
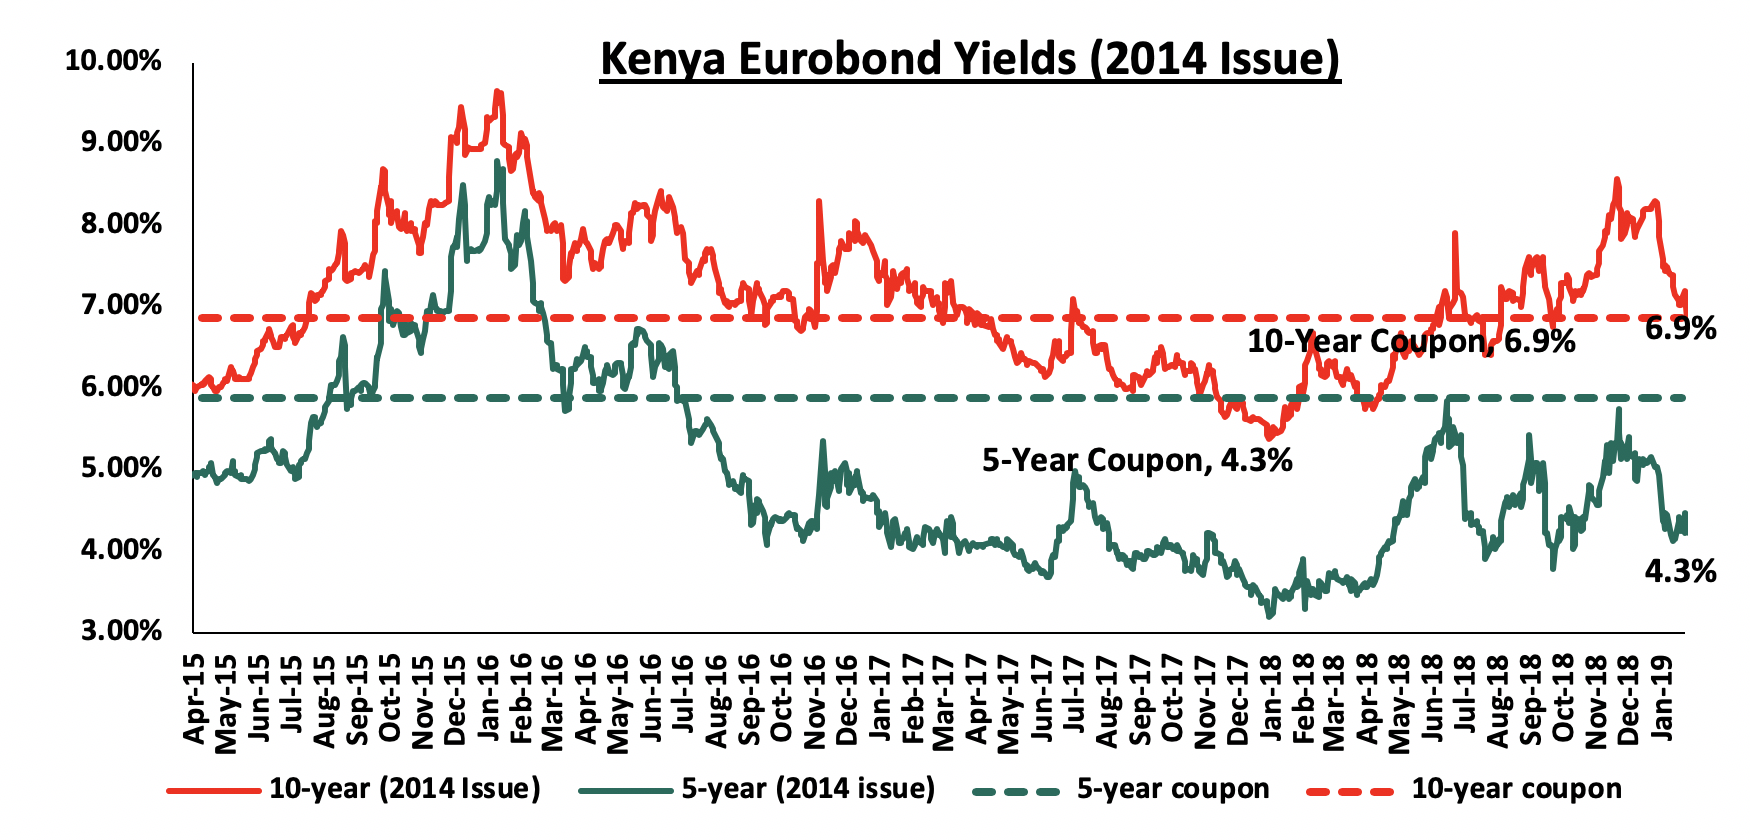
Kenya Eurobonds:
According to Bloomberg, the yields on the 5-year Eurobond issued in 2014 declined by 0.1% points to 4.3%, from 4.4% the previous week, while that of the 10-year Eurobond increased by 0.1% points to 6.9% from 6.8% the previous week. Since the mid-January 2016 peak, yields on the Kenyan Eurobonds have declined by 2.7% points and 4.5% points for the 10-year and 5-year Eurobonds, respectively, an indication of the relatively stable macroeconomic conditions in the country. Key to note is that these bonds have 0.3-years and 5.3-years to maturity for the 5-year and 10-year, respectively.
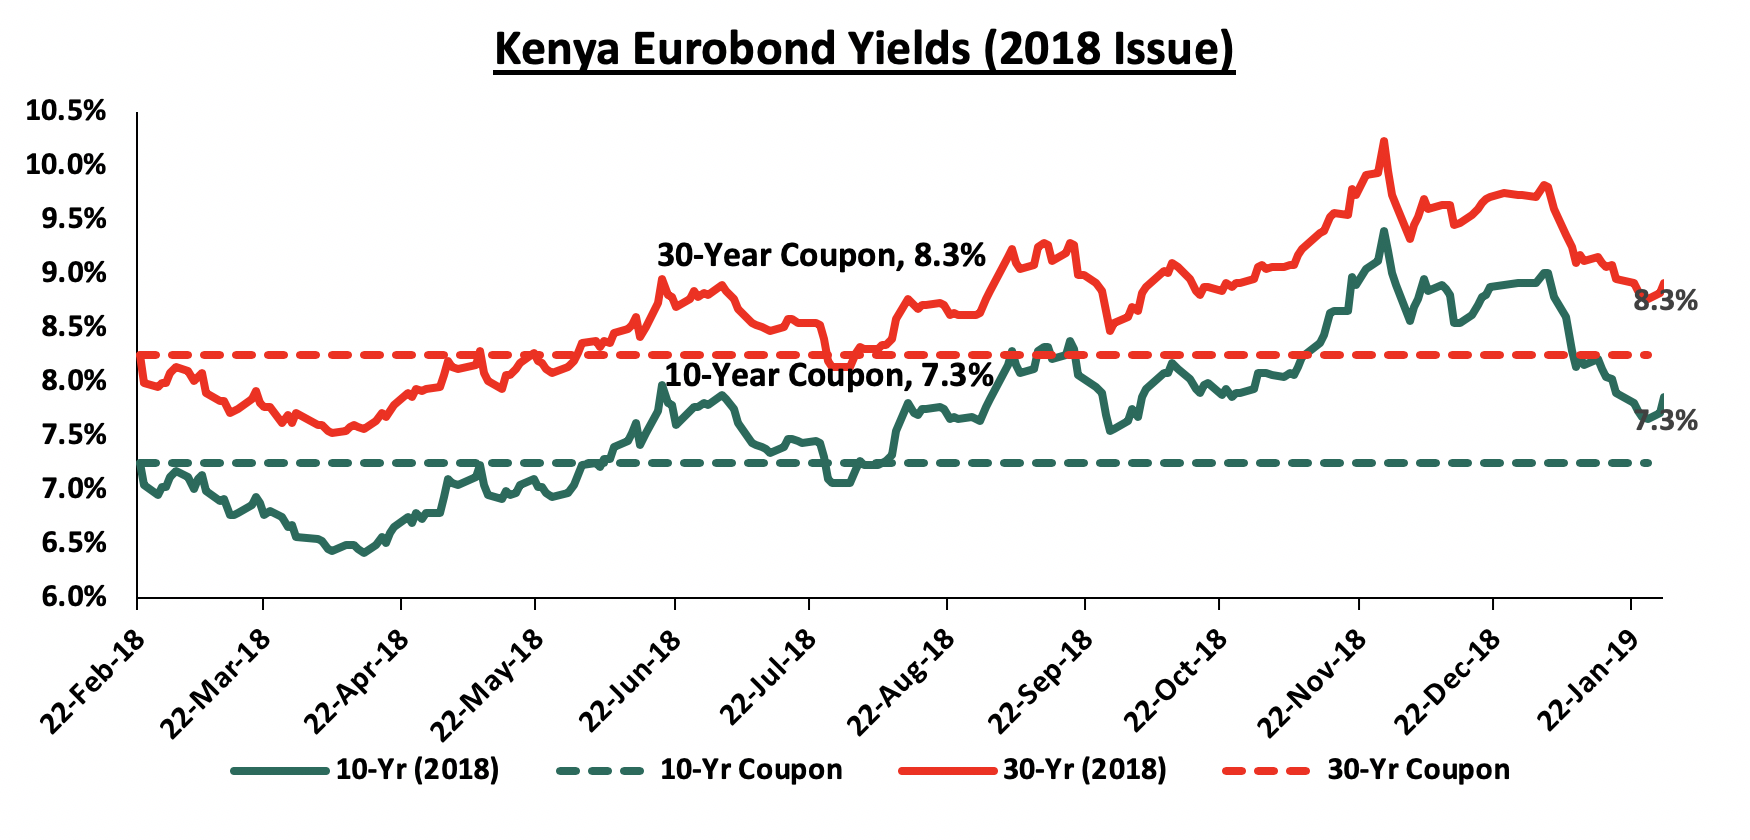
For the February 2018 Eurobond issue, during the week, the yields on both the 10-year Eurobond remained unchanged at 7.6%, with the yield on the 30-year Eurobond declining by 0.1% points to 8.5% from 8.6% the previous week, respectively. Since the issue date, the yields on both the 10-year Eurobond and the 30-year Eurobonds have increased by 0.3% points.
Kenya Shilling:
During the week, the Kenya Shilling appreciated by 0.5% against the US Dollar, recording a 9-month high to close at Kshs 100.1, from Kshs 100.6 recorded the previous week. The Kenya Shilling has appreciated against the US Dollar by 1.7% year to date, and in our view the shilling should remain relatively stable to the dollar in the short term, supported by:
- The narrowing of the current account deficit to 5.1% in the 12-months to November 2018, from 6.5% in November 2017, attributed to improved agriculture exports, increased diaspora remittances, strong receipts from tourism and slower growth in imports due to lower food and SGR–related equipment imports and the decline in international oil prices,
- Improving diaspora remittances, which increased by 38.6% in 2018 to USD 2.7 bn from USD 1.9 bn recorded in 2017. The rise is due to; (a) increased uptake of financial products by the diaspora due to financial services firms, particularly banks, targeting the diaspora, and (b) new partnerships between international money remittance providers and local commercial banks making the process more convenient,
- CBK’s activities in the money market, such as repurchase agreements and selling of dollars, and,
- High levels of forex reserves, currently at USD 8.1 bn, equivalent to 5.3-months of import cover, compared to the one-year average of 5.1-months and above the EAC Region’s convergence criteria of 4.5-months of imports cover.
Weekly Highlights:
According to Stanbic Bank’s Monthly Purchasing Manager’s Index (PMI), the business environment in the country recorded an uptick during the month of January, although at a slower pace than in December 2018. The seasonally adjusted PMI recorded a decline to 53.2 in January 2019 from 53.6 recorded in December 2018. A PMI reading of above 50 indicates improvements in the business environment, while a reading below 50 indicates a worsening outlook. The marginal decline in the PMI reading is partly attributable to a slower increase in new orders in January, recording a four-month low, owing to easing demand in the domestic economy. New export orders however increased at the sharpest rate since October, with many businesses reporting higher foreign demand. There was an uptick in output growth, which was at a three-months high, driven by the influx of new business and stronger client bases. Despite the rise in orders, employment growth remained modest in January. Purchase prices rose at the slowest pace in 16 months, driven by the decline in fuel prices, with petrol prices having declined by 8.2%, while diesel and kerosene prices declined by 8.9% and 3.3%, respectively, which in effect led to a decline in inflation to 4.7% in January, from the 5.7%, recorded in December 2018. We expect the business environment to improve going forward supported by improved purchasing activity due to suppressed inflation with the expectations of lower international oil prices.
African Development Bank (AfDB) released their African Economic Outlook 2019, highlighting economic prospects and projections for the continent as a whole and for each of the 54 countries. According to the report, Kenya’s economy is expected to expand by 6.0% in 2019 and by 6.1% in 2020, supported by the continued macroeconomic stability, improved business confidence and growth in the tourism sector. AfDB recognized the government fiscal consolidation efforts aimed at reducing the fiscal deficit and reducing reliance on debt by enhancing revenue collection, rationalizing expenditure as well as diversifying funding sources. The key concern however remains on the quality of fiscal consolidation, with similar concerns voiced by the World Bank in their Kenya Economic Update, October 2018, having noted the majority cuts to government expenditure fell on development spending, which could potentially compromise the growth potential of the economy. AfDB also noted that the country’s public debt–to-GDP ratio had increased considerably over the past five years to 57.0% as at the end of FY’2017/2018, with half of the debt being external. The ballooning levels of public debt have elevated the risk of debt sustainability, which saw the International Monetary Fund, through their debt sustainability analysis elevating the country’s risk of debt stress to moderate from low. Additionally, the increase in the portion of external debt, from 43.2% in February 2014 to 50.6% in September 2018, also makes the country more susceptible to external market conditions and shocks.
In summary, the report paints the picture that the country’s macro-economic fundamentals are still stable and the outlook going forward is positive with inflation expected to be within the government set target of 2.5%-7.5% and with the consensus GDP growth as per 16 firms expected to come in at 5.8%.
|
Kenya 2019 Annual GDP Growth Outlook |
|||
|
No. |
Research Body |
Q1’2019 Estimates |
|
|
1 |
Central Bank of Kenya |
6.3% |
|
|
2 |
International Monetary Fund (IMF) |
6.1% |
|
|
3 |
Citigroup Global Markets |
6.1% |
|
|
4 |
African Development Bank (AfDB) |
6.0% |
|
|
5 |
PNB Paribas |
6.0% |
|
|
6 |
UK HSBC |
6.0% |
|
|
7 |
Euromonitor International |
5.9% |
|
|
8 |
World Bank |
5.8% |
|
|
9 |
Cytonn Investments Management Plc |
5.8% |
|
|
10 |
Focus Economics |
5.8% |
|
|
11 |
JPMorgan |
5.7% |
|
|
12 |
Euler Hermes |
5.7% |
|
|
13 |
Oxford Economics |
5.6% |
|
|
14 |
Standard Chartered |
5.6% |
|
|
15 |
Capital Economics |
5.5% |
|
|
16 |
Fitch Solutions |
5.2% |
|
|
Average |
5.8% |
||
Private sector credit growth remains a key concern recording anemic growth since the implementation of the interest rate cap, coming in at 2.4% in the 12-months to December 2018, slower than the 3.0% recorded in the 12 months to November 2018, bringing the 2018 average to 3.3%. The Monetary Policy Committee, through its assessment of the impacts of the interest rate cap, has also noted that the implementation of the interest rate cap has weakened the transmission of monetary policy constraining its effectiveness in influencing private sector credit access.
Rates in the fixed income market have remained stable as the government rejects expensive bids as it is currently 3.2% ahead of its domestic borrowing target for the current financial year, having borrowed Kshs 196.4 bn against a pro-rated target of Kshs 190.3 bn. However, a budget deficit that is likely to result from depressed revenue collection creates uncertainty in the interest rate environment as any additional borrowing from the domestic market goes to plug the deficit. Despite this, we do not expect upward pressure on interest rates due to increased demand on government securities, driven by improved liquidity in the market owing to the relatively high debt maturities. Our view is that investors should be biased towards medium-term fixed income instruments to reduce duration risk associated with long-term debt, coupled with the relatively flat yield curve on the long-end due to saturation of long-term bonds.
Market Performance
During the week, the equities market was on an upward trend with NASI, NSE 20 and NSE 25 gaining by 3.8%, 5.2%, and 3.5%, respectively, taking their YTD performance to 14.2%, 8.0% and 14.5%, for NASI, NSE 20 and NSE 25, respectively. The gain in NASI was mainly driven by gains in large cap banking stocks such as NIC Group, Barclays Bank, KCB Group and Standard Chartered Bank, which gained by 10.1%, 7.0%, 6.6% and 5.9%, respectively.
Equities turnover declined by 0.9% during the week to USD 59.7 mn, from USD 60.3 mn the previous week, taking the YTD turnover to USD 216.8 mn. Foreign investors remained net sellers for the week, with a net selling position of USD 3.6 mn, which is a 52.4% decrease from last week’s net selling position of USD 7.6 mn.
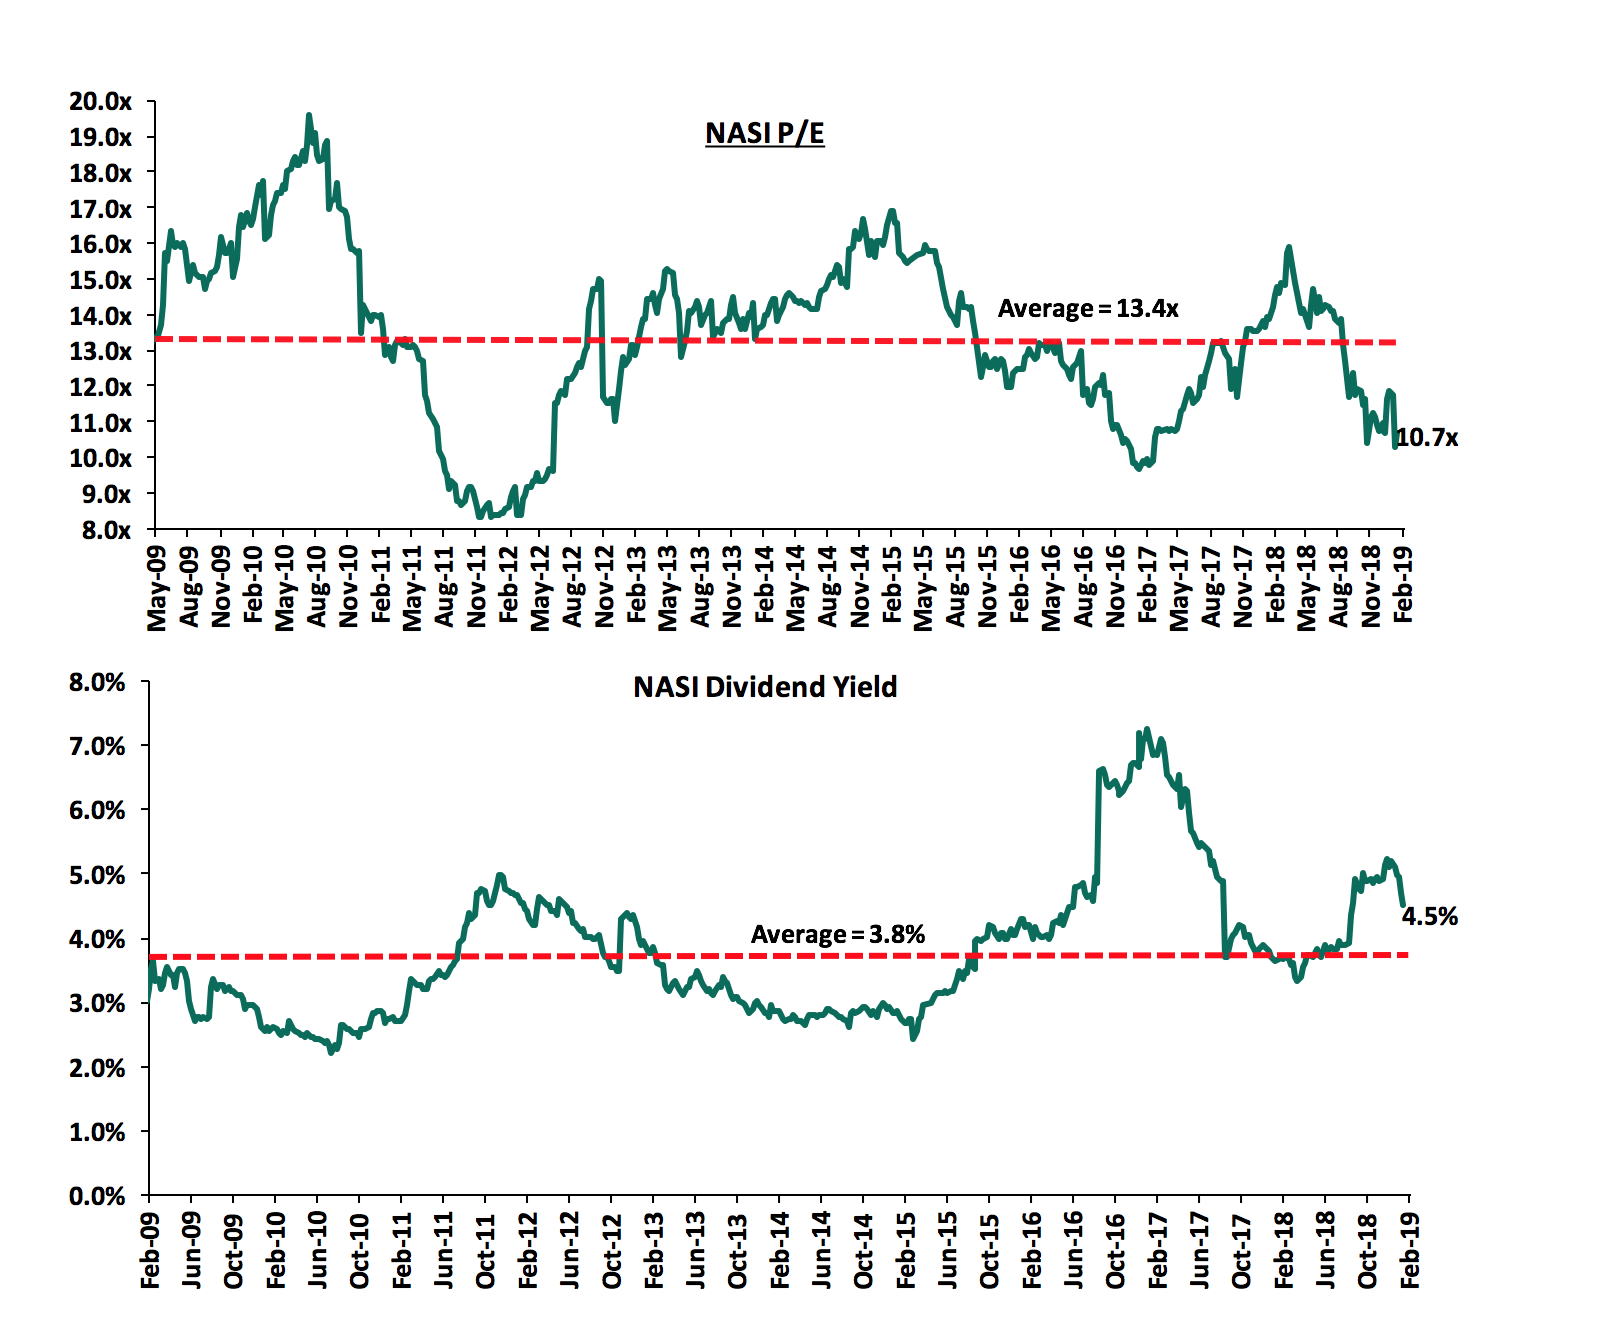
The market is currently trading at a price to earnings ratio (P/E) of 10.7x, 25.2% below the historical average of 13.4x, and a dividend yield of 4.5%, above the historical average of 3.8%. With the market trading at valuations below the historical average, we believe there is value in the market. The current P/E valuation of 10.7x is 10.2% above the most recent trough valuation of 9.7x experienced in the first week of February 2017, and 28.6% above the previous trough valuation of 8.3x experienced in December 2011. The charts below indicate the historical P/E and dividend yields of the market.
Weekly Highlights
Safaricom customers have borrowed Kshs 6.2 bn in one month on the Fuliza overdraft service, revealing a huge pent-up demand for instant, micro-loans in the economy. The Fuliza overdraft facility, which was launched on 5th January 2019, is a partnership involving Safaricom, Commercial Bank of Africa (CBA) and KCB Group. The banks provide M-Pesa users with top-up loans whenever they need to make a transaction, but find they lack enough money in their mobile cash wallets. The virtual loan amounts can be used to buy goods, pay bills and is also transferrable to other mobile subscribers. The service has been used by 4.2 mn customers. The Fuliza loans attract an interest rate of 1.08% a day, which translates to 395.3% per annum. An additional administrative fee of up to Kshs 30.0 is charged for each day that the loan remains unpaid. The overdraft facility has a term of 30-days beyond which a borrower is deemed to be in default. Fuliza analyses the creditworthiness of borrowers by an analysis of their transactions and borrowing history among other factors. Borrowers can take loans of upto Kshs 70,000. Fuliza joins the growing list of digital lending platforms, such as Branch and Tala, that seek to offer small loans through the internet and mobile phones. Kenyans’ rising demand for quick loans has spawned the growth of unregulated microlenders with annualised interest rates ranging from 18.0% to more than 200.0%. Micro-lending is far more lucrative than mainstream banking whose margins have been restricted by the capping of lending rates. The fast paced growth is set to boost the fees collected by Safaricom, KCB and CBA. Besides the facility and administration fees, Fuliza also attracts standard M-Pesa charges, further boosting Safaricom’s earnings from the mobile money platform. For CBA and KCB, Fuliza offers an opportunity for customer acquisition and an additional high-margin revenue stream.
According to data from the Kenya National Bureau of Statistics, commercial banks in Kenya reduced their deposit rates to 5.7% in November 2018, the lowest in 15-months, from a high of 7.0% in February 2018. This comes after the removal of the 70.0% of the Central Bank Rate (CBR) floor, after the assention of the Finance Act 2018 in September 2018. The removal of the floor on deposit rates and retention of a ceiling on lending rate has failed to unlock credit to the private sector with the private sector credit growth coming in at 2.4% in the 12-months to December 2018, slower than the 3.0% recorded in the 12-months to November 2018. The reduction in deposit rates is in a bid to increase net interest margins (NIM) for banks due to reduced interest expense on deposits.
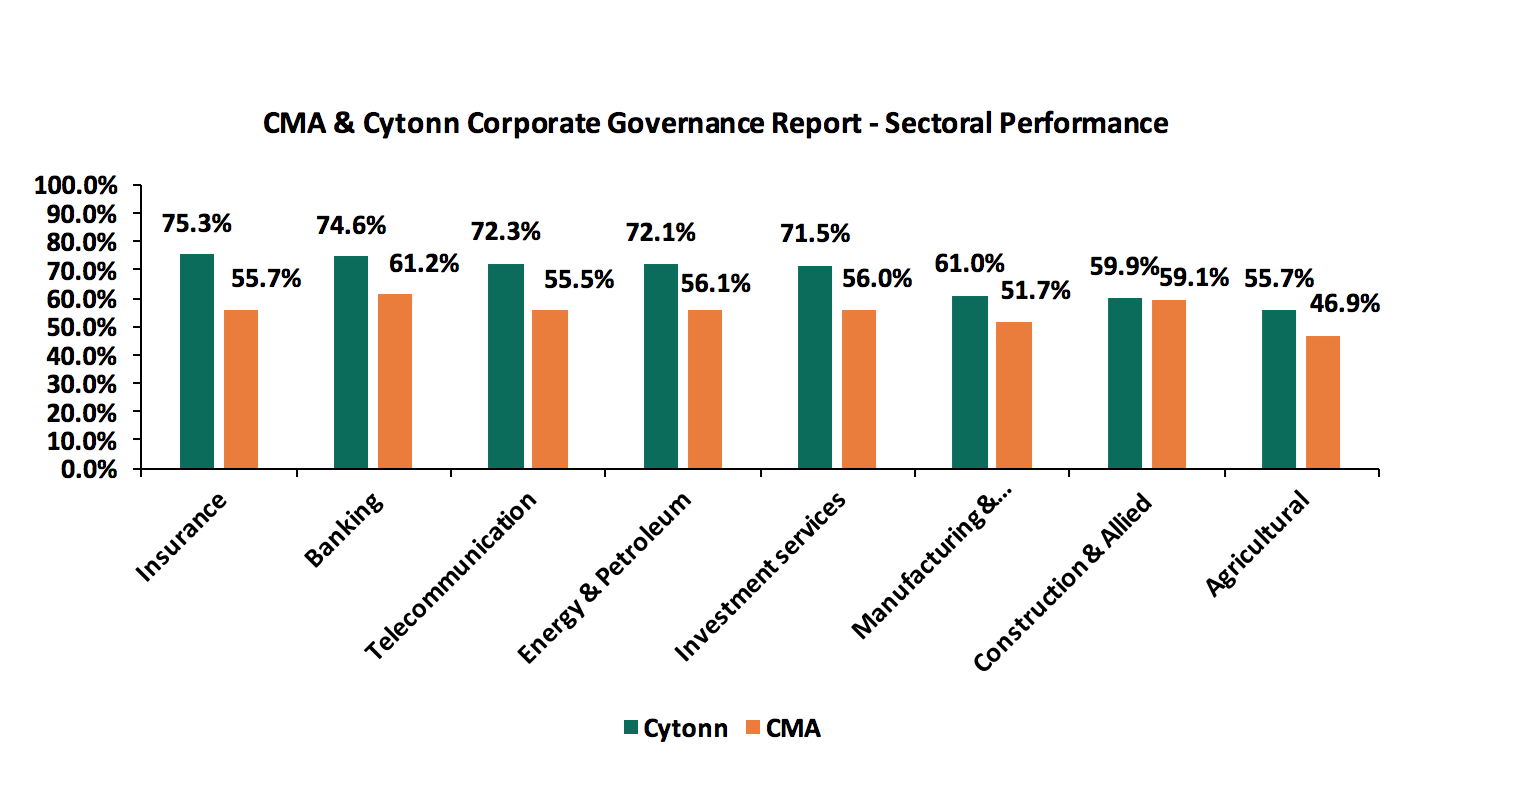
The Capital Markets Authority (CMA) released The Report on the State of Corporate Governance of Issuers of Securities To The Public in Kenya. The findings suggest a “Fair” status of 55.0% weighted overall score in the application of corporate governance practices by Kenyan issuers of securities to the public. The report analyzed 62 listed companies and 5 issuers of corporate bonds. The principles analysed were; (i) Commitment to Good Corporate Governance, (ii) Board Operations and Control, (iii) Rights of Shareholders, (iv) Stakeholders Relations, (v) Ethics and Social Responsibility, (vi) Accountability, Risk Management and Internal Control, and (vii) Transparency and Disclosure. The report used four score ratings: (i) “Leadership” compliance of 75% and above, (ii) “Good” compliance of between 74% and 65%, (iii) “Fair” compliance of between 64% and 50%, and (iv) “Needs Improvement” compliance of below 50%. The report ranked 3 companies in “Leadership”, 5 companies in “Good” , 31 companies in “Fair” and 17 in “Needs Improvement”. The report did not disclose the specific company ranks but noted that 3 issuers in “Leadership” were from the banking sector, while the 5 issuers in “Good” rating comprised of 2 from banking, 2 from commercial and services and 1 from manufacturing and allied sectors.
The sectoral performance is highlighed in the graph below with the best performing sector being Banking with a score of 61.2% and the worst sector being the Agricultural sector with a score of 46.9%. In the table below, we compare the CMA rankings versus our own rankings, released in the Cytonn Corporate Governance Report 2018.
(Kindly note that Cytonn did a corporate governance ranking report for listing companies to fill an existing gap in the market. With the CMA having now launched a corporate governance ranking report, we shall now cease the publication of the Cytonn Corporate Governance Ranking Report going forward.)
Universe of Coverage
Below is our banking universe of coverage table:
|
Universe of Coverage |
||||||||
|
Banks |
Price as at 01/02/2019 |
Price as at 08/02/2019 |
w/w change |
YTD Change |
Target Price* |
Dividend Yield |
Upside/Downside** |
P/TBv Multiple |
|
GCB Bank*** |
4.1 |
4.2 |
2.0% |
(9.1%) |
7.7 |
9.3% |
97.6% |
1.0x |
|
Diamond Trust Bank |
147.5 |
151.0 |
2.4% |
(3.5%) |
283.7 |
1.8% |
94.1% |
0.8x |
|
Access Bank |
6.0 |
6.7 |
10.8% |
(2.2%) |
9.5 |
6.7% |
65.0% |
0.4x |
|
UBA Bank |
7.2 |
7.7 |
7.0% |
(0.6%) |
10.7 |
11.9% |
61.5% |
0.5x |
|
KCB Group |
40.9 |
43.6 |
6.6% |
16.4% |
61.3 |
7.3% |
57.2% |
1.3x |
|
Zenith Bank*** |
22.9 |
24.4 |
6.6% |
5.9% |
33.3 |
11.8% |
57.3% |
1.0x |
|
CAL Bank |
0.9 |
0.9 |
(1.1%) |
(9.2%) |
1.4 |
0.0% |
55.6% |
0.8x |
|
CRDB |
135.0 |
135.0 |
0.0% |
(10.0%) |
207.7 |
0.0% |
53.9% |
0.5x |
|
I&M Holdings |
95.0 |
95.0 |
0.0% |
11.8% |
138.6 |
3.7% |
49.6% |
1.0x |
|
NIC Group |
34.8 |
38.3 |
10.1% |
37.6% |
48.8 |
2.9% |
43.3% |
0.9x |
|
Ecobank |
7.5 |
7.5 |
0.0% |
(0.1%) |
10.7 |
0.0% |
43.3% |
1.6x |
|
Equity Group |
40.9 |
42.3 |
3.4% |
21.4% |
56.2 |
4.9% |
42.3% |
2.0x |
|
Co-operative Bank |
15.8 |
16.0 |
1.6% |
11.9% |
19.9 |
5.1% |
31.4% |
1.4x |
|
Union Bank Plc |
6.3 |
6.3 |
0.0% |
11.6% |
8.2 |
0.0% |
30.4% |
0.7x |
|
Stanbic Bank Uganda |
30.0 |
29.0 |
(3.3%) |
(6.5%) |
36.3 |
3.9% |
24.8% |
2.1x |
|
Barclays Bank |
11.5 |
12.3 |
7.0% |
11.9% |
12.5 |
8.7% |
17.9% |
1.6x |
|
Guaranty Trust Bank |
33.7 |
38.7 |
14.7% |
12.2% |
37.1 |
7.1% |
17.2% |
2.1x |
|
SBM Holdings |
6.0 |
5.9 |
(1.0%) |
(0.3%) |
6.6 |
5.0% |
14.3% |
0.9x |
|
Bank of Kigali |
278.0 |
278.0 |
0.0% |
(7.3%) |
299.9 |
5.0% |
12.9% |
1.5x |
|
Standard Chartered |
195.0 |
206.5 |
5.9% |
6.2% |
196.3 |
6.4% |
7.1% |
1.6x |
|
HF Group |
6.6 |
7.0 |
5.8% |
25.6% |
6.6 |
5.3% |
5.6% |
0.3x |
|
Stanbic Holdings |
91.3 |
90.8 |
(0.5%) |
0.0% |
92.6 |
2.5% |
3.9% |
0.9x |
|
Bank of Baroda |
134.0 |
134.2 |
0.1% |
(4.1%) |
130.6 |
1.9% |
(0.7%) |
1.2x |
|
FBN Holdings |
7.4 |
8.0 |
8.8% |
0.6% |
6.6 |
3.4% |
(6.4%) |
0.4x |
|
Standard Chartered |
21.1 |
21.0 |
(0.4%) |
0.0% |
19.5 |
0.0% |
(7.7%) |
2.6x |
|
Stanbic IBTC Holdings |
45.3 |
47.0 |
3.8% |
(2.0%) |
37.0 |
1.3% |
(17.0%) |
2.3x |
|
National Bank |
6.0 |
6.0 |
(0.3%) |
12.4% |
4.9 |
0.0% |
(18.3%) |
0.4x |
|
Ecobank Transnational |
14.1 |
13.7 |
(2.5%) |
(19.4%) |
9.3 |
0.0% |
(34.0%) |
0.5x |
|
* Target Price as per Cytonn Analyst estimates ** Upside/ (Downside) is adjusted for Dividend Yield ***Banks in which Cytonn and/or its affiliates are invested in ****Stock prices indicated in respective country currencies |
||||||||
We are “Positive” on equities for investors as the sustained price declines has seen the market P/E decline to below its historical average. We expect increased market activity, and possibly increased inflows from foreign investors, as they take advantage of the attractive valuations, to support the positive performance.
Kenya’s second and third largest telecommunication companies, Airtel and Telkom, announced the signing of a binding agreement that will see the shareholders of the two companies merge their respective mobile, enterprise, and carrier services businesses in Kenya to operate under a joint venture company. Although still in its early stages, the following has been disclosed regarding the transaction:
- The merged entity will be named Airtel-Telkom,
- The merged company will be chaired by Telkom Kenya Limited’s current CEO Mugo Kibati, while Airtel’s CEO Prasanta Sarma will be appointed CEO of the merged entity,
- Telkom Kenya Limited’s real estate portfolio and specific government services will not form part of the combined entity, and,
- The final shareholding will be determined at the closing of the transaction with Telkom Kenya having the option of holding up to 49.0% of the merged entity.
We expect this merger to have the following effects on the Kenyan telecommunication space: (i) Subscriptions / Voice Market Share is expected to be split between two major players with the merged entity set to increase its share, (ii) The combined entity will command a market share of 29.6%, (iii) Airtel will make an entry into the fixed data services market, and, (iv) Mobile Money is least likely to be affected given that neither of the two merging entities have a significant share in the market. The overall effect to the market is that we will now have a company that has scale to provide a credible market alternative to the currently dominant Safaricom.
In terms of the detailed effect, we expect the below:
- Mobile Subscription: Overall market share of the merged entity will increase
According to the Communication Authority’s sector report for September 2018, the number of active mobile subscribers (number of active sim cards) stood at 46.6 mn translating to a mobile penetration rate of 100.1%. As at September 2018, Safaricom Plc had the largest market share by mobile subscriptions at 64.2%, whereas Airtel posted a market share of 22.3%. Telkom Kenya Limited recorded a market share of 9.0%. If the merger is successful, Airtel-Telkom (the merged entity) will have an effective market share of 31.3%. This should have a positive development in the market because we should have a second player with scale competing with Safaricom and providing a credible alternative to Safaricom.
|
Network |
Subscribers |
Mkt Share |
|
Safaricom PLC |
29,943,641 |
64.2% |
|
Airtel Networks Limited |
10,413,732 |
22.3% |
|
Telkom Kenya Limited |
4,188,517 |
9.0% |
|
Other |
2,084,272 |
4.5% |
|
Total |
46,630,162.00 |
100% |
|
Network |
Subscribers |
Mkt Share* |
|||||||||
|
Safaricom PLC |
29,943,641 |
64.2% |
|||||||||
|
Airtel-Telkom |
14,602,249 |
31.3% |
|||||||||
|
Other |
2,084,272 |
4.5% |
|||||||||
|
Total |
46,630,162.00 |
100% |
|||||||||
|
*Proforma market share |
|||||||||||
- Mobile Data Services: The merged entity will command a market share of 29.6%
Data services in Kenya are classified as either mobile or fixed data with the number of subscribers as at September 2018 indicated below:
|
Internet Subscriptions |
Subscribers |
|
Mobile Data Subscriptions |
41,854,706 |
|
Fixed Data Subscriptions |
349,797 |
|
Total |
42,204,503 |
In terms of market share, the mobile data market is as follows:
|
Mobile Data |
Subscribers |
Mkt Share |
|
Safaricom PLC |
29,416,539 |
69.7% |
|
Airtel Kenya |
9,242,786 |
21.9% |
|
Telkom Kenya Ltd |
3,249,747 |
7.7% |
|
Others |
295,432 |
0.7% |
|
Total |
42,204,503 |
100.0% |
Source: Communications Authority
Market share of mobile data services is proportional to that of mobile subscription. If the merger is successful, the mobile data market will be dominated by 2 parties (Safaricom and Airtel-Telkom) controlling nearly 100%, as shown below:
|
Mobile Data |
Subscribers |
Proforma Mkt Share |
|
Safaricom PLC |
29,416,539 |
69.7% |
|
Airtel-Telkom |
12,492,533 |
29.6% |
|
Others |
295,432 |
0.7% |
|
Total |
42,204,503 |
100.0% |
- Fixed Data: Airtel will look to tap into Telkom’s existing infrastructure
In fixed data, the market is more competitive with Wananchi Companies Ltd having the largest share at 39.2%. Key to note is that Airtel has no significant share in the fixed data market. We expect this will be one key area that they will be looking to tap given Telkom’s current infrastructure.
|
Fixed Data |
Subscribers |
Mkt Share |
|
Wananchi Companies Ltd |
137,213 |
39.2% |
|
Safaricom PLC |
96,608 |
27.6% |
|
Jamii Telecommunications Ltd |
45,933 |
13.1% |
|
Poa Internet Kenya Ltd |
26,726 |
7.6% |
|
Internet Solutions Kenya Ltd |
15,074 |
4.3% |
|
Mawingu Networks Ltd |
13,128 |
3.8% |
|
Liquid Telecommunications Kenya Ltd |
8,234 |
2.4% |
|
Telkom Kenya Ltd |
3,801 |
1.1% |
|
Other |
3,080 |
0.9% |
|
Total |
349,797 |
100.0% |
Source: Communications Authority
- Mobile Money Services: The merged entity will struggle to gain mobile money market share
We expect this to be a key area of focus in terms of strategy for the merged entity. As at September 2018, the mobile-money market was as highlighted below:
|
Platform |
Agents |
Active Subscriptions |
No. of Transactions |
Value of Transactions (Kshs) |
Mkt Share* |
||||||
|
M-pesa |
162,800 |
24,206,341 |
575,660,251 |
1,585,729,101,317 |
78.20% |
||||||
|
Equitel Money |
- |
1,992,150 |
149,463,508 |
439,188,528,611 |
21.70% |
||||||
|
Airtel Money |
27,267 |
3,434,843 |
4,628,370 |
1,153,142,919 |
0.10% |
||||||
|
Mobile Pay |
6,890 |
92,122 |
354,565 |
1,379,068,293 |
0.10% |
||||||
|
T-Kash |
21,538 |
59,933 |
104,833 |
197,106,156 |
0.00% |
||||||
|
Market |
218,495 |
29,785,389 |
730,211,527 |
2,027,646,947,296 |
100.0% |
||||||
|
*Market share by value of transactions |
|||||||||||
Source: Communications Authority
After the merger, the merged entity (Airtel money and T-Kash) will have a wider distribution network in terms of mobile money agents as highlighted below. This is expected to accelerate the number of active subscriptions and, in turn increase its market share.
|
Platform |
Agents |
Active Subscriptions |
No. of Transactions |
Value of Transactions (Kshs) |
Mkt Share** |
||||||
|
M-pesa |
162,800 |
24,206,341 |
575,660,251 |
1,585,729,101,317 |
78.20% |
||||||
|
Equitel Money |
|
1,992,150 |
149,463,508 |
439,188,528,611 |
21.70% |
||||||
|
Airtel-Telkom |
48,805 |
3,494,776 |
4,733,203 |
1,350,249,075 |
0.10% |
||||||
|
Mobile Pay |
6,890 |
92,122 |
354,565 |
1,379,068,293 |
0.10% |
||||||
|
Market |
218,495 |
29,785,389 |
730,211,527 |
2,027,646,947,296 |
100.00% |
||||||
|
**Proforma Market share by value of transactions |
|||||||||||
Source: Communications Authority
Overall, we expect the merger to greatly benefit both parties since Airtel and Telkom combined leads to a player with scale to compete with Safaricom, and most importantly for the market, if the integration is well executed, it provides a credible alternative to the consumer. However, Safaricom’s dominance is still expected to remain given its commanding presence in all the channels analyzed.
Reports Released:
African Private Equity and Venture Capital Association (AVCA) released two reports after completing two sets of surveys on institutional investors in Africa. The reports are:
- The 2018 Annual Limited Partner (LP) Survey, a study that analyses the plans, views, preferences, expectations and evolving attitudes of 60 Limited Partners (LPs) from Africa, Asia, Europe and North America regarding Private Equity (PE) in Africa, and,
- The 2019 Profile of Africa’s Institutional Investors, that maps the different pools of capital for African private equity. It also gives an overview of the demographics of institutional investors with allocations to Africa.
The 2018 Annual Limited Partner (LP) Survey
According to the report:
- LPs’ appetite for African PE has remained steady, with 53.0% of LPs planning to increase their PE allocation on the continent over the next three-years. This is 1.0% point lower than the sentiment expressed in the 2017 survey,
- In terms of preference, 65.0% of LPs view Africa as more attractive for PE investment than developed markets over the next ten-years,
- Overall, most LPs believe in the medium to long term attractiveness of Africa compared to developed markets,
- Regionally, Nigeria is viewed by majority of LPs as the most attractive country for PE investment in Africa over the next three-years with a popularity index ranking of 58.0%, followed by Kenya (40.0%) and Egypt (31.0%), and,
- By sector, Financial Services is identified by LPs as the most attractive sector for PE investment in Africa over the next three-years with a popularity index score of 51.0%.Other sectors viewed as attractive include, Consumer Goods, Agribusiness, Healthcare and Education.
Profile of Africa’s Institutional Investors
- The report sorted the institutional investors by type. Of the institutions surveyed, 29.0% were Development Finance Institutions (DFI), 25.0% were pension funds and 15.0% were third party fund managers,
- Majority of the institutions are European based with 36.0% having their head offices in Europe while North American based institutions came second at 32.0% of the total. Africa based investors were 31.0% of the total,
- By regional focus, 63.0% of the directory population indicated that they have a pan-African geographic focus, while 18.0% claimed to have Sub-Saharan African focus, and,
- In terms of investment strategy, growth equity is the most popular investment strategy for the directory population with a popularity index of 93.0%, while venture capital and mezzanine finance scoring 64.0% and 63.0%, respectively.
Takeout:
Investor sentiments analyzed from both reports are in line with our general outlook for private equity in Africa as analyzed in our Cytonn 2019 Markets Outlook and are summarized as follows:
- Private equity in Africa remains attractive as witnessed by the positive investor sentiment, with Nigeria being the most favored destination, followed by Kenya and then Egypt.
- Nigeria, recovering from recent recession, remains Africa’s largest private equity market in terms of deal volume. We expect its recovery to boost the private equity space even further.
- Kenya has been fortunate not to face economic headwinds as was the case in Nigeria and South Africa, the two most developed African PE markets. As such, Kenya has gained ground on its counterparts and we expect this trend to continue in 2019.
Foreign players remain an integral component of PE activity in Africa and we expect foreign direct investments to continue defining Africa’s private equity space.
We maintain a positive outlook on private equity investments in Africa as evidenced by the increasing investor interest, which is attributed to; (i) economic growth, which is projected to improve in Africa’s most developed PE markets, (ii) attractive valuations in Sub Saharan Africa’s private markets compared to its public markets, and (iii) attractive valuations in Sub Saharan Africa’s markets compared to global markets. Going forward, the increasing investor interest, stable macro-economic and political environment will continue to boost deal flow into African markets.
- Industry Reports
During the week, Broll Kenya, a property services company, released their Nairobi Retail Report H2’2018, which highlighted a slowdown in the retail market performance. The report noted that landlords embarked on offering rent concessions aimed at drawing tenants to their vacant spaces in addition to taking a cautionary approach by leasing smaller spaces to more than one anchor tenant, following the fall of local giant, Nakumatt Holdings, which was a sole anchor tenant in several retail spaces.
The key take-outs from the report include:
- The market recorded a 5.0% increase in supply of retail space to 5.7 mn SQFT as at H2’2018, from 5.4 mn SQFT recorded in H1’2018, attributed to the opening of spaces such as The Well in Karen, which brought into the market 77,371 SQFT of space,
- The sector recorded a 6.0% points y/y increase in occupancy rates in H2’2018, and this was mainly attributed to the take-up of space that was previously occupied by Nakumatt Supermarkets, in addition to the entry of new international retailers primarily from Europe, across the fashion, sportswear and hypermarket categories,
- In terms of the market share of supermarkets within Nairobi, Tuskys Supermarket had the highest percentage of market share of approximately 23.0%, while Naivas and Foodplus Supermarkets came in second and third with a market share of approximately 20.0% and 11.0% in H2’2018, respectively, and,
- On average the monthly rent for anchor tenants came in at between Kshs 55.0 per SQFT and Kshs 100.0 per SQFT, while that of line shops ranged between Kshs 120.0 and Kshs 340.0 per SQFT. In addition, the monthly service charge for small regional centers registered the highest average rate of Kshs 52.7 per SQFT, while that of neighborhood centers came in at Kshs 33.5 per SQFT.
According to the report, the retail sector recorded a slight improvement in performance in H2’2018, with the 6.0% points y/y increase in occupancy rates, amidst the growing supply. On the contrary, Cytonn Annual Markets Review 2018, noted that the performance softened as a result of increased supply of retail space, and the tough operating environment characterized by low private sector credit growth, resulting in a 0.6% points decline in rental yields to 9.0% in 2018 from 9.6% in 2017. For 2019, we expect a slowdown in performance with returns expected to soften as a result of the current retail oversupply at 2.0 mn SQFT, while occupancy rates are expected to decline by 2.9% points to 76.9% from 79.8% in 2018 leading to reduced yields of 8.7% from 9.0% in 2018. However, we expect the continued entry of international retailers and expansion of local retailers to cushion the market. For more information, see our Cytonn 2019 Markets Outlook.
- Master-planned Developments
During the week, property developer Tilisi Developments announced that it had opened the sale of Phase 2 of its 400-acre mixed-use development, which is located in Limuru. This follows the completion of Phase 1 of infrastructure for its 85-acre logistics park, which according to the CEO, Kavit Shah, is 65.0% sold. In addition, an initial sale of approximately 120-acres of Phase 2 was made to Chigwell Holdings, a Nairobi- based property development firm. The firm plans to develop 300 residential units on a 47-acre parcel of land, and this will be the developer’s fourth project, with others being 127 residential units at a development knows as Sidai Village in Athi River, the 343-unit Phenom Estate in Lang’ata, and an ongoing Phenom Park in the same area. The Tilisi project highlights the rise of master-planned communities in Kenya, which encompass mixed-use developments built in a rural or undeveloped area aimed at shifting urban development from cities. They integrate themes such as residential, retail, industrial, education facilities etc., and are thus mainly located in Satellite Towns where large tracts of land are available at lower prices compared to those in major urban centers.
- Residential Sector
In the residential sector, Sprinter Real Estate Investment, an American investor, and Third Eye Management and Associates, a US based firm, are set to construct 300 houses in Ndenderu, Kiambu County. The 300-unit project, dubbed Fanisi Tigoni View, will sit on 8-acres of land and comprises of 2- and 3-bedroom apartments of 84 SQM and 115 SQM, selling at Kshs 5.2 mn and Kshs 5.9 mn, respectively, which translates to an average of Kshs 56,604 per SQM. The Ndenderu area benefits from good infrastructure with access from Limuru Road, Northern Bypass and the Western Bypass, which is under construction, and its proximity to fast growing neighboring markets such as Ruaka. As with other Satellite Towns, we expect to continue recording increased activities fueled by the relatively affordable land prices, availability of land in bulk, the improving infrastructure and the continued focus on the government’s Big Four Agenda on provision of affordable housing by both the private sector and the government.
- Retail Sector
During the week, Ebrahim Supermarkets, a local retailer, closed its outlet situated at Wazir House, at the Junction of Moi Avenue and Kenyatta Avenue, reasons undisclosed. Established in 1944, Ebrahim Supermarket is among of the oldest retail stores in the country and the move will see the retailer remain with only one electronics and computer distribution unit situated along Kimathi Street, in Nairobi, having previously closed other stores in Kisumu, Nakuru and Mombasa. In addition, Ukwala Supermarkets, having already sold 75.0% of their stake to Botswana retailer Choppies as at March 2016, which includes most of their assets, at the time of sale being 10 out of 14 stores, applied for voluntary liquidation after revealing that it had been unable to pay off its debts, which included amongst others, creditors’ claims and the Kenya Revenue Authority (KRA) debt amounting to Kshs 930 mn and Kshs 840 mn, respectively. The above is a move towards winding up of the parent company, with the judgement on the application expected on March 14th. This comes at a time when we have seen other retail giants such as Nakumatt Holdings and Uchumi struggling, leading to the closure of several of their stores across the country. We attribute these to:
- Financial constraints, which have forced retailers to embark on restructuring e.g. Ukwala and Uchumi Supermarkets,
- Poor supply chain management and governance practices in the case of family-owned Nakumatt Holdings,
- Increased competition from dominant local retailers such as Tuskys and Naivas, that has diminished the market share of smaller-scale retailers such as Ebrahim thus affecting returns, and
- Limited in-store products owing to the small size of the outlets compared to competitors and failure to adapt to market trends mainly on product differentiation, in the case of Ebrahim Supermarkets, thus not able to meet clients’ ever-changing preferences fueled by the growing purchasing power of the expanding middle class.
Other highlights during the week:
Mauritius Duty Free Paradise, a company that operates duty free retail for travelers, announced plans to venture into the Kenyan market through a yet to be revealed local partner in the next three-years. The company, which sells products such as perfumes, cosmetics, alcohol, cigars and Swarovski crystals, aims to have the outlet serve as a base for expanding into East Africa, as it aims to focus on Kenya, Zambia, Rwanda and Madagascar. Other duty-free shop operators already in the market include Maya Duty Free at the Jomo Kenyatta International Airport (JKIA), Moi International Airport and Wilson Airport, and Siamanda Duty Free Limited at JKIA. We expect the entry of the retailer to result in demand for retail space at the Kenyan airports.
We expect the real estate sector to continue recording increased activities fueled by the focus on the provision of affordable housing, availability of development class land and entry and expansion of retailers in the Kenyan market.
Over the last 8-years, there has been various consolidation activities in the banking sector, as banks either acquire smaller banks or merge and form strategic partnerships with other banks to form relatively larger companies. Consolidation activity has picked up in the recent past as smaller banks that have struggled to operate under the interest rate cap regime are acquired by their larger counterparts, while some of the banks have been forming strategic partnerships. Some of the consolidation activity has also been driven by remediation of collapsed banks that had been under receivership, such as Imperial Bank Ltd, and Chase Bank Ltd. 2 deals are already in the pipeline in 2019, with Commercial Bank of Africa (CBA) issuing a cash buy-out offer of Kshs 1.4 bn to Jamii Bora Bank as analyzed in our CBA Acquisition Note, and CBA and NIC Group issuing a merger notice as analyzed in our NIC-CBA Merger Note. As such, we look at the factors that are driving the need for consolidation, and the expected impact of this activity in both the individual banks, and the banking sector on aggregate. As such, we shall look at the following:
- Background of Consolidation Activity,
- Types of Consolidation Arrangements and the Impact,
- Recent Consolidation in Kenya,
- Case Study of Consolidation in the Nigerian Banking Sector, and,
- Our View on Banking Consolidation
Section I: Background of Consolidation Activity
The Banking Sector in Sub Saharan Africa (SSA) has witnessed a considerable amount of consolidation activity over the last 10-years. The consolidation activity has been fueled by:
- The need to create larger enterprises able to take advantage of their larger financial muscle and an extensive deposit gathering capability, in order to achieve a competitive edge in the fiercely competitive sector, given the high number of players, and ultimately ensure the individual bank’s long-term survival,
- When organic growth seems untenable, companies pursue growth inorganically through consolidation,
- Various banks that had seen a reduction in their profitability due to lower net interest margins following the implementation of the Banking (Amendment) Act 2015, coupled with a harsh operating environment, become acquired by their stronger and larger counterparts, and,
- Banks have formed strategic partnerships through mergers, with the aim of leveraging on the synergies created under the merged entities to grow their market share, attain pricing power, and consequently ensure sustainable growth.
The resultant effect of this will be a banking sector that is stable and resilient to any shocks it may encounter.
Major economies in SSA have experienced consolidation activity, with Kenya, Nigeria and Ghana being the key examples. Most of the consolidations in Nigeria and Ghana were largely induced by regulation, fueled by the need to create a stable financial services sector, by weeding out weaker participants in the banking sector who were prone to be adversely affected by systemic risks such as industry wide asset quality deterioration, and were not serving their core banking mandate. Thus, to achieve this, the respective Central Banks have been consistently raising the minimum capital requirements, which has induced consolidation in the sector. The banking sector’s main role is the financial intermediation function, where they are granted funds from depositors and lend out to credit consumers. As such, banks have to ensure that the deposit funds are not eroded by cumulative impairments on their assets and operating losses, if any. Thus, they have to hold adequate capital to cover for the impairments and losses, so as to protect depositors’ funds. Therefore, both deposit mobilization capacity and capital base will determine the strength and stability of a bank.
Hence, on aggregate, a banking sector’s stability will depend on how well its players are capitalized. With well-capitalized players, the sector would be better positioned to withstand any systemic risks and shocks, as well as facilitating financial intermediation, resulting to an increase in their investments in both high and low risk assets such as loans and government securities, leading to capital formation, increased investment, and consequently driving economic growth.
The banking sector is at the core of any economy, given the reliance of other sectors on services and products offered by the banking sector. The sector’s main function of financial intermediation between depositors’ funds and credit provision serves as a catalyst of investment, by facilitating capital formation, thereby leading to economic growth and development. Moreover, the importance of banking is even more pronounced in Sub-Saharan Africa, where there is over-reliance on the banking sector for funding, which ranges between 90.0% - 95.0% for SSA economies as opposed to 40.0% bank funding in advanced economies.
Section II: Types of Consolidation Arrangements and the Impact
The term consolidation is loosely used to describe the combination of company assets and possibly even the liabilities, through various types of financial transactions. Key examples include:
- Mergers
A merger is an agreement that combines two existing separate companies into one new entity. Most mergers are done to gain market share in the industry, leverage on the economies of scale to reduce costs of operations, use the relatively larger capital base to expand to new territories or product lines, unite common products, with all of these aimed at obtaining a competitive advantage, and ensuring sustainable growth. After a merger, issued shares of the new company are distributed to existing shareholders of both original businesses in pre-agreed proportions. For example, the transaction between NIC Group and CBA is a merger.
- Acquisitions
An acquisition is a transaction where one company purchases a majority (more than 50.0%) or (in some instances) all of another company's shares in order to take control. As part of the exchange, the acquiring company often purchases the target company's equity, which allows the acquiring company to make decisions regarding the use of the newly acquired assets with/without the approval of the target company’s shareholders owing to the majority holding in the target company. Companies often acquire other companies when they intend to achieve quick inorganic growth, which may be more attainable, and does not pose any additional inefficiencies and logistic constrains that may arise from organic growth. For example, SBM Bank Kenya’s acquisition of Chase Bank Ltd.
- Tender Offers
Tender offer refers to when one company offers to purchase the equity directly from the shareholders of the target company, often at a premium, bypassing the target company’s board of directors and management. Tender offers are particularly common in listed companies where the acquiring company issues a takeover bid, subject to the approval of the target company’s shareholders. If there are no dissenting shareholders, tender offers have often resulted in acquisitions.
- Management Acquisitions
Management acquisitions refer to transactions where a company’s management team purchases the assets and consequently the operations of the company they manage. In this type of transaction, the management team pools resources, and acquire a stake, or even the entire company. The management may use their own individual financial resources or seek backing from external financiers such as private equity financiers, and financial institutions.
Section III: Recent Consolidation in Kenya
In the recent past consolidation has picked up in Kenya’s banking sector, as the relatively smaller banks become acquired by larger banks while relatively larger banks merge and form partnerships. The acquisitions have picked up, as the smaller tier 2 and tier 3 banks have found it difficult to operate in Kenya due to:
- The implementation of The Banking (Amendment) Act 2015, which saw the capping of interest chargeable on loans to 4.0% above the Central Bank Rate (CBR). This compressed their net interest margins, as they were unable to price loans higher for their riskier clients, and yet they have higher costs of deposits, which consequently saw most of them struggle to retain profitability,
- The implementation of the law saw the larger banks venture into the small banks’ niche markets such as Small and Medium Enterprises (SMEs) banking, and consequently, most have struggled to operate on declining top line revenue, leading to increased operational inefficiency, and operating losses, which has depleted capital,
- A tough operating environment caused by an abrasive political climate and prolonged droughts has made it even more difficult to operate, as it consequently lead to a deterioration in asset quality, and,
- The failure of Imperial bank prompted a flight to safety, making it hard for tier 2 and 3 banks to operate. This has led to acquisition of tier 3 banks such as Habib Bank Kenya by Diamond Trust Bank (DTBK), and mergers of tier 2 and tier 1 banks, such as the NIC and CBA deal.
Thus, in order to maintain a competitive edge and fast-track their growth, banks have either been acquiring the smaller counterparts, forming strategic partnerships, or merging together, so as to leverage on the synergies created to provide an adequate capital base, which will drive long term growth.
The banking sector acquisitions in Kenya over the past 5-years are highlighted in the table below:
|
Acquirer |
Bank Acquired |
Book Value at Acquisition (Kshs bns) |
Transaction Stake |
Transaction Value (Kshs bns) |
P/Bv Multiple |
Date |
|
CBA Group |
Jamii Bora Bank |
3.4 |
100.0% |
1.4 |
0.4x |
19-Jan* |
|
AfricInvest Azure |
Prime Bank |
21.2 |
24.2% |
5.1 |
1.0x |
19-Jan |
|
CBA Group |
NIC Group |
33.5** |
53:47*** |
Undisclosed |
N/A |
19-Jan* |
|
KCB Group |
Imperial Bank**** |
Unknown |
Undisclosed |
Undisclosed |
N/A |
18-Dec* |
|
SBM Bank Kenya |
Chase Bank ltd |
Unknown |
75.0% |
Undisclosed |
N/A |
18-Aug |
|
DTBK |
Habib Bank Kenya |
2.4 |
100.0% |
1.8 |
0.8x |
17-Mar |
|
SBM Holdings |
Fidelity Commercial Bank |
1.8 |
100.0% |
2.8 |
1.6x |
16-Nov |
|
M Bank |
Oriental Commercial Bank |
1.8 |
51.0% |
1.3 |
1.4x |
16-Jun |
|
I&M Holdings |
Giro Commercial Bank |
3 |
100.0% |
5 |
1.7x |
16-Jun |
|
Mwalimu SACCO |
Equatorial Commercial Bank |
1.2 |
75.0% |
2.6 |
2.3x |
15-Mar |
|
Centum |
K-Rep Bank |
2.1 |
66.0% |
2.5 |
1.8x |
14-Jul |
|
GT Bank |
Fina Bank Group |
3.9 |
70.0% |
8.6 |
3.2x |
13-Nov |
|
Average |
|
|
76.10% |
|
1.6x |
|
|
* Announcement date |
||||||
|
** Book Value as of the announcement date |
||||||
|
*** Shareholder swap ratio between CBA and NIC, respectively |
||||||
|
**** KCB acquired certain assets and liabilities of Imperial Bank, hence Imperial Bank remains in existence. |
||||||
Increased consolidation in the sector should see the formation of banks that have an adequate capital base, which will provide them with the requisite cover to partake in core banking activities, thereby catalyzing economic growth and development in the country. Furthermore, with an aggregate adequate capital cover, the banking sector will remain resilient to any internal or external systemic shocks that may affect the sector. Thus, it would be ideal for the sector to have even fewer, but stronger players.
We have maintained our position that Kenya remains overbanked when compared to other major economies in Africa, and there is the need to trim the number to fewer more stable players. Furthermore, regulation, monitoring and oversight of the sector by the Central Bank of Kenya (CBK) would be made even easier with fewer players, thus reducing cases of fraud, poor governance and malpractice as witnessed in banks such as Imperial Bank Ltd and Chase Bank Ltd, which forced the banks into receivership.
Section IV: Case Study of Consolidation in the Nigerian Banking Sector
Before 2004, the Nigerian banking sector was served by 89 banks, whose landscape was characterized by an oligopolistic competition, where the sector was dominated by a few of the larger players. This was evidenced by the fact that the top 10 large banks accounted for more than 50.0% of the sector’s total assets, more than 51.0% of the total deposits and issued 46.0% of the total industry loans. Owing to the stiff competition, the relatively smaller banks were plagued by rising inefficiencies, thin capital bases, as they averaged NGN 1.4 bn (USD 10.0 mn) in capital, continuous loss making, an over-reliance on government deposits, with 20.0% of their deposits being sourced from government sources, illiquidity, poor corporate governance, and poor asset quality. The situation seemed to have stemmed from the relative ease of entry into the banking sector, owing to the relatively lower minimum capital requirements of NGN 2.0 bn (USD 14.3 mn). Consequently, due to the stiff competition, various banks sought to participate in non-banking activities such as real estate and commodities shipping. A review of the entire sector indicated that financially unsound banks accounted for 19.2% of the total industry assets, and 17.2% of the total deposits, thereby presenting concern of adverse effects to any systemic distress such as commodity price declines. Thus, to diffuse the situation, the Central Bank of Nigeria (CBN) fronted a strategic plan aimed at reducing the number of industry players into few players able to play their fundamental role of financial intermediation, and consequently support economic development.
The CBN proposed a reform agenda, which induced the consolidation phase in the banking sector. The major reforms included:
- Raising the minimum capital requirement to NGN 25.0 bn (USD 180.0 mn) from NGN 2.0 bn (USD 14.3 mn),
- Phased withdrawal of public sector funds from banks, beginning July 2004,
- Adoption of a risk-focused and rule-based regulatory framework, and,
- Zero tolerance for weak corporate governance, misconduct and lack of transparency.
This resulted in increased consolidation activity in the sector by way of mergers, acquisitions, and recapitalization from shareholders and external investors. Most activity was by way of mergers and acquisitions with most opting for this method as it presented the following benefits:
- Improved operating efficiency derived from the economics of scale as well as a more efficient allocation of resources,
- Faster revenue expansion, aided by the higher asset base, deposit liabilities and capital base,
- Risk reduction, due to change in organizational focus and structure, and,
- Globalization, which inculcated global practices and standards, and created a more globally interconnected financial services sector, which facilitated the provision of holistic financial services, and aided geographical expansion of banking operations in Nigeria, West Africa and Europe, for some of the larger players such as Zenith Bank and Guaranty Trust Bank.
As a result, from the wave of consolidation activity in 2005, which was mainly induced by regulation, the number of banks reduced to 25 relatively larger banks from 89. With size being an important ingredient of success, empirical analysis has shown that with the higher capital and asset bases, banks increased their risk appetites thereby increasing their lending activities, improved their operational efficiency by human resource restructuring and eliminating branch network overlaps. Furthermore, since banks were now endowed with larger capital bases, the sector was able to absorb both internal and external shocks, without adverse impacts. With fewer players, oversight was even easier for the CBN, which reduced incidences of malpractice and recourse actions from the Nigeria Deposit Insurance Corporation (NDIC). By engendering public confidence in the banking sector, the core financial intermediation function by banks was promoted, thereby aiding in capital formation, investment, and consequently driving economic growth.
Section V: Our View on Banking Sector Consolidation
As evidenced from the banking sectors in countries such as Nigeria, Ghana and the US, consolidation is always credit positive as it:
- Enhances the resilience of the sector to both external and internal shocks,
- Enhances the public’s confidence in the sector mainly in terms of deposit security,
- Enhances the entities’ capacity to conduct their core banking function of financial intermediation, which in turn pivots economic growth, and,
- Enables more oversight into the sector’s activities thereby reducing, and possibly eliminating cases of corporate governance malpractice.
We maintain our view that Kenya continues to be overbanked, necessitating a reduction in the number of players in the sector. Some of the larger banks are looking for acquisition targets to grow their market share. We lay out five criteria that would be used by these larger banks in their selection:
- Poorly Capitalized Banks - This includes challenges in meeting the statutory requirements, including capital adequacy and liquidity. With the injection of fresh capital, the acquiring entity can bolster the capital position of the bank, thereby meeting all statutory requirements,
- Locally owned Tier III banks- Since the banks are locally owned, the banks most likely have a particular niche or market segment that they serve in Kenya’s banking space. In addition, their market share is below 1.0% of the total market by deposit, indicating that they are largely non-competitive but there is lots of market share to potentially grow into and merge with existing business,
- Banks with a Low Return on Equity - This will favor the acquiring foreign entity as shareholders would be more willing to sell their stake owing to the low profits or operating losses possibly occasioned by highly inefficient operations, and cash out, as opposed to banks that deliver a high return on equity,
- Banks with High Non-Performing Loans - This is an area where the acquiring foreign entity can improve with their expertise and move with speed to rectify, and also restructure their loan book and debt, and,
- Banks with Shared Common Significant Shareholding - Local stable banks will also seek to acquire banks aligned with their strategies, and with a large common shareholding, especially banks where government holds significant stakes.
With acquisitions currently happening at cheaper valuations relatively to historical levels, we expect well-capitalized players to take advantage, which should see several deals completed. Thus, we continue to expect consolidation activity in Kenya’s banking sector.
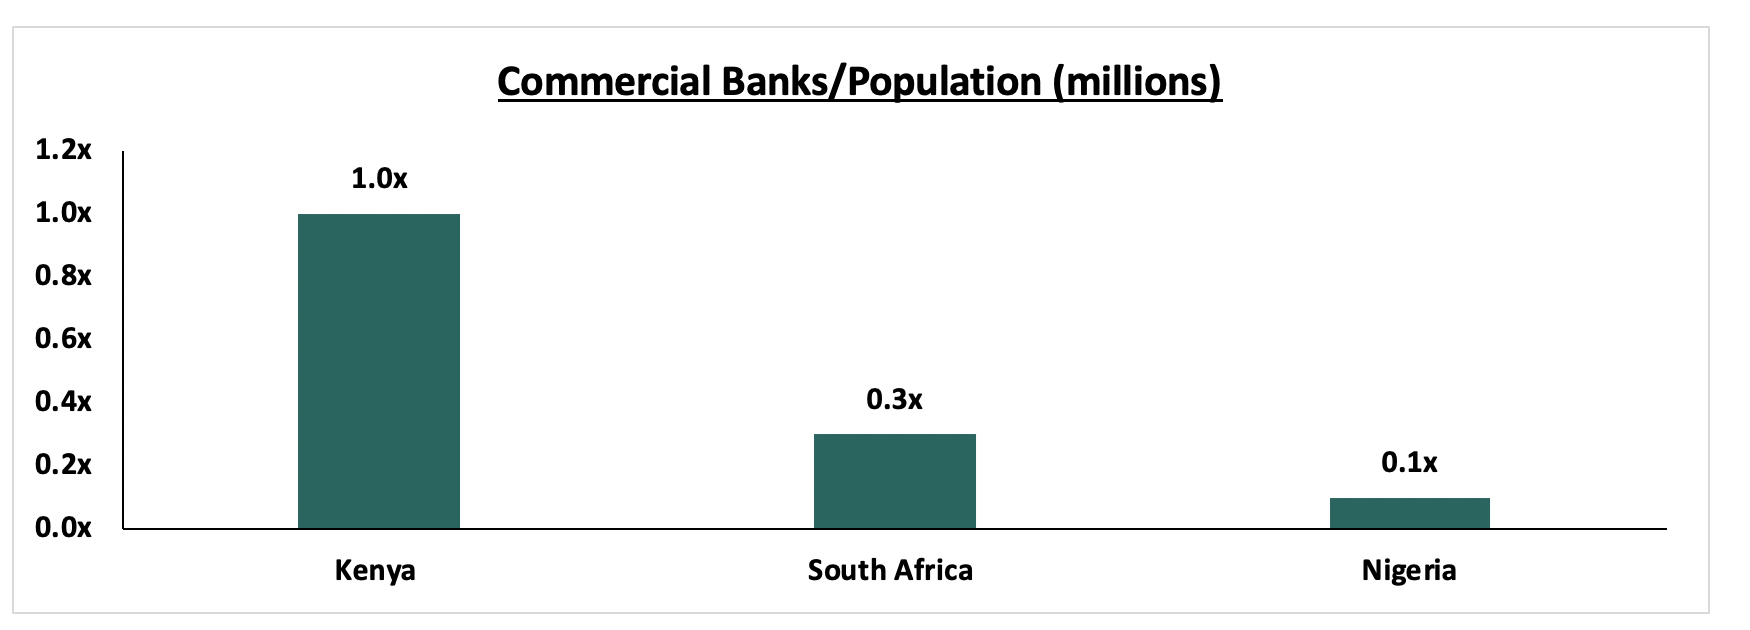
We note that the pace of consolidation in the banking sector has picked up, and is likely to continue as banks merge to form strategic partnerships and struggling banks especially those that do not serve a niche, are acquired. This will lead to a more stable and safer banking sector.( If we were to move to a banking sector population to bank ratio similar to Nigeria, it means we need to reduce the number of banks from the current 39 to 5, which means 34 banks being acquired or merging.)
Disclaimer: The Cytonn Weekly is a market commentary published by Cytonn Asset Managers Limited, “CAML”, which is regulated by the Capital Markets Authority, CMA and the Retirement Benefits Authority, RBA. However, the views expressed in this publication are those of the writers where particulars are not warranted. This publication is meant for general information only, and is not a warranty, representation, advice or solicitation of any nature. Readers are advised in all circumstances to seek the advice of a registered investment advisor.

- Talk to us
- Kenya
- P.O Box 20695 - 00200, Nairobi, Kenya
- Cell +254709101200
- Tel +254709101200
- WhatsApp +254741676635
- United States
- +254709101200
- DOWNLOAD OUR APP
-


- Kenya
- 8th Floor, Pinetree Plaza, Kaburu Drive, Ngong Road, Nairobi, Kenya
- USA
- Suite 1150, 1775 Eye Street NW, USA, Washington DC 20006, USA
- Investments
- High Yield
- Private Equity
- Real Estate
- Real Estate
- RiverRun Estates
- Cytonn Towers
- The Ridge
- Taraji Heights
- The Alma