Cytonn 2023 Markets Outlook
By Research Team, Jan 29, 2023
Executive Summary
Global Markets Outlook:
According to the World Bank’s Global Economic Prospects - 2023, global economic growth in 2023 is expected to remain subdued, slowing down to 1.7%, from the 2.9% growth rate in 2022. The expected economic slowdown is driven by the persistent high global inflation that has in turn necessitated tightening of monetary policies aggravating the financial conditions in most economies, pre-existing supply chain constraints worsened by geopolitical tensions, elevated debt sustainability concerns, and the tightening of monetary policies aggravating the financial conditions in most economies;
Sub Saharan Africa Regional Market Outlook:
According to the World Bank’s Global Economic Prospectus - 2023, Sub-Saharan Africa region is expected to register economic growth of 3.6% in 2023, 0.2% points higher than the estimated 3.4% in 2022. The slightly higher growth in 2023 is partly attributable to the expected increase in oil and gas exports from the region, an expected slight ease in the cost of living following reduction in prices of key imports such as fertilizers, and expected increase in domestic demand. However, the region continues to face key risks such as imported inflation driven by elevated global inflationary pressures, degree of global and domestic monetary tightening that will be needed to anchor inflation, tight food markets due to limited imports coupled with erratic weather conditions, and increased credit risks amplified by high debt-levels and debt servicing costs, which are expected to hinder capital flows to the region;
Kenya Macro Economic Outlook:
GDP Growth – Our outlook for 2023 is Neutral on GDP Growth. We are projecting the economy to register a growth within the range of 4.8%- 5.2% in 2023 supported by continued recovery of businesses and expected rebound in agricultural sector and other sectors; this is on average 0.1% points lower than the estimated 2022 growth of 5.1%. The key downside to this growth shall be tightened monetary policy, high risk of debt distress and elevated inflation;
Inflation - Our outlook for 2023 is Neutral on Inflation. We expect the annual average inflation rate to fall back within the government’s target of 2.5%-7.5% coming in at an average of 6.6% as compared to 7.6% in 2022. We expect the decline in inflation to be driven by an expected cooling in inflation, both globally and locally as the tightened monetary policy continues to take effect. However, the current high global crude oil prices as well as high food prices, will continue putting pressure on the inflation rate in the short term. Additionally, the current administration is keen to phase out consumption subsidies that will see increases in prices of fuel and electricity;
Currency - Our outlook for 2023 is Negative on Currency. We project the Kenya Shilling to trade within the range of between Kshs 130.2 and Kshs 134.4 with a bias towards 6.4% depreciation against the USD in 2023. We expect the depreciation to be mainly driven by the ever present current account deficit with Kenya being a net importer, which will increase dollar demand in the market. Additionally, the currently high global crude oil prices have weighed in on the dollar demand from oil and energy importers who will have to increase the amounts they pay for oil imports and hence depleting dollar supply in the market;
Interest Rates – Our outlook for 2023 is Negative on Interest Rates. The Central Bank is expected to continue tightening monetary policy stance in the medium term with the intention of anchoring inflation which is currently above the target range. Additionally, we may see slight upward pressure on the interest rates as the government compensates investors for the increased risks posed by currency depreciation and elevated inflation;
Government borrowing – Our outlook for 2023 is Negative on Government Borrowing. We expect the government to borrow aggressively from both the domestic and foreign markets as it aims to plug in the fiscal deficit, which is projected to come in at Kshs 689.2 bn in the FY/2023/24, 4.3% of the GDP as well as paying the upcoming maturities. On revenue collection, we expect continued improvement in 2023 due to the raft of measures proposed by the Kenya Revenue Authority and the proposals in Budget Policy Statement 2023 such as reducing Value Added Tax (VAT) gap to 19.8% from 38.9%, minimizing Corporate Income Tax gap to 30.0% from the current 32.2%, integrating KRA Tax Systems with Telecommunication companies, amongst others. However, the upward revision of taxes comes at a time when the business environment remains subdued which will weigh down on the projected revenue performance;
Investor Sentiment – Our outlook for 2023 is Neutral on Investor Sentiment. We expect 2023 to register lower investor sentiments in the short term mainly due to elevated inflation in the country currently at 9.1%, and continued depreciation of the Kenyan currency as a result of increased dollar demand from importers, especially for oil and energy sectors against a lower supply of hard currency and high debt servicing. The business environment will also remain subdued in the short term in 2023, with the average Purchasing Managers Index (PMI) for 2022 coming in at 49.2 showing a deterioration in the business environment compared to 50.8 in 2021. However, the investor sentiments will improve in the medium term with inflation expected to ease going forward. The monthly PMI since September 2022 has also averaged 51.1, above 50.0 showing improving business environment momentum;
Security – Our outlook for 2022 is Positive on Security. We expect security to be maintained in 2023 with a stable political environment, following the peaceful conclusion of general elections in 2022;
Fixed Income Outlook:
We expect upward pressure on the interest rates market on the back of the government’s increased borrowing for budgetary support, debt repayments, funding of infrastructure projects and payment of domestic maturities which stand at Kshs 572.5 bn for H1’2022. Investors should be biased towards SHORT-TERM FIXED INCOME INSTRUMENTS to reduce duration risk;
Equities Outlook:
We have a NEUTRAL outlook on the Kenyan Equities market in the short term but “BULLISH” in the medium to long term. We expect a slight improvement the listed sector’s earnings growth in 2023, largely driven by the continued improvement in the country’s business environment. The improvement is evidenced by an average Purchasing Manager’s Index (PMI) of 51.1 for the last four months of 2022 which is expected to raise growth prospects;
Real Estate Outlook
Residential sector: Our outlook for the Nairobi Metropolitan Area (NMA) residential sector is NEUTRAL. We expect the demand for housing to grow, boosted by infrastructural development and positive demographics in the country as the government and private sector continue focusing on affordable housing. However, the rising construction costs amid elevated inflationary pressures and low penetration of mortgages are expected to hamper optimum performance of the sector. For detached units, investment opportunity lies in areas such as Ruiru, Juja, and Ngong, while for apartments, investment opportunity lies in Ruaka, Waiyaki Way, and Ruiru, as the areas offer more attractive returns in terms of rental yield and capital appreciation;
Commercial Office Sector: Our overall outlook for the NMA commercial office sector is NEUTRAL. We expect sector performance to slightly improve attributable to: i) gaining traction in co-working spaces, ii) slow but rising expansion in the sector, and, iii) reduced developments in the pipeline which we expect will help curb the oversupply challenge by allowing room for the absorption of available and fewer incoming spaces. We expect that this will boost occupancy rates and asking rents thereby improving average rental yields. However, the existing oversupply of office spaces at 6.7 mn SQFT in the NMA is expected to weigh down optimum performance of the sector by crippling the overall demand for physical space. Investment opportunity lies in Gigiri, Westlands and Karen supported by relatively high returns with yields of 8.7%, 8.3% and 8.3% respectively, compared to the market average of 7.3%, as at FY’2022 as a result of; i) high concentration of top-notch office spaces fetching premium rental rates and attractive yields for investors, ii) availability of adequate infrastructure and amenities in the areas enhancing investments, and, iii) presence of international organizations, multinational companies and embassies within the areas which drive up demand for quality offices;
Retail Sector: We have a NEUTRAL outlook on the retail sector’s performance which is expected to be driven by the continuous aggressive expansion by both local and foreign retailers taking up new and existing spaces, continuous developments of public infrastructure of roads and railway projects boosting accessibility in new areas for investments, and positive demographics facilitating increasing demand. However, the slow growth in the sector is expected to be facilitated by some negative factors such as; i) oversupply of retail space approximately at 3.0 mn SQFT in NMA alone, and the rest of the Kenyan retail sector totalling to approximately 1.7 mn SQFT, ii) growing adoption of e-commerce by most retailers which continues to undermine occupier demand, and, iii) limited access to financing for developments, expansion and improvement in operations towards technological levels to enhance retailers’ efficiency by small and medium-sized enterprises. Investment opportunities lie in Kilimani, Karen, and Westlands given relatively higher returns of 9.8%, 9.4%, and 8.7% respectively, compared to the market average of 7.9%, attributed to presence of high quality retail spaces fetching the high rents, coupled with the availability of quality infrastructure services;
Hospitality Sector: We have a NEUTRAL outlook for the sector as we expect the sector to continue registering improved performance moving forward in terms of overall hotels in operations, hotel bookings, and hotel occupancies. However, we anticipate factors such as; i) the recently issued travel advisory by the United Kingdom government through its Foreign and Commonwealth Office (FCO) on 20th December 2022, to have a negative impact on international arrivals, considering the UK is among top five tourist markets for Kenya, ii) the government’s directive to indefinitely suspend hotel meetings, conferences and trainings, iii) difficulty in accessing finance as lenders demand more collateral to cushion themselves owing to elevated credit risk, iv) projected decline in the volumes of mergers and acquisitions within the hospitality industry due to increased associated costs, attributable to the increase in capital gains tax, v) existing inflationary pressures which have increased the cost of operations on the back of a depreciating currency, and, vi) the possible threat of a new wave of the COVID-19 pandemic to weigh down the optimum performance of the sector in 2023. The investment opportunity lies in Westlands, Kilimani and Kileleshwa/Lavington which recorded average rental yields of 9.3%, 7.2% and 6.6%, respectively against a market average of 6.2% in 2022. This is attributed to proximity to the CBD, presence of high quality serviced apartments which attract premium rates, accessibility, and proximity to international organization offered by the apartments, all of which drive the demand for serviced apartments in the nodes;
Land Sector: We retain a POSITIVE outlook for the Nairobi Metropolitan Area land sector which continues to establish itself as a reliable investment opportunity, displaying great resilience even during times of economic hardship in the COVID-19 period, and a depreciating Kenyan currency. We anticipate that a number of factors will contribute to the sector's positive performance in 2023, including; i) a greater emphasis on Affordable Housing projects and private projects, ii) tax policies such as increased property rates in some counties which might provoke landowners and landlords to demand higher land prices and rents, in efforts to recover additional costs incurred from higher rates set to be charged, iii) positive population demographics, and, iv) rapid growth of satellite towns amid increased delivery of infrastructural developments which are improving accessibility, property prices and demand in the regions. The investment opportunity lies in satellite towns such as Juja, Utawala and Limuru for unserviced land, which recorded annualized capital appreciations of 16.6%, 14.8% and 13.4%, respectively, in FY’2022 compared to the market average of 11.1%. For serviced land, investment opportunity lies in Syokimau and Ruiru-Juja which recorded the highest annualized capital appreciations at 19.2% and 13.0%, respectively against the serviced average of 8.0%;
Infrastructure Sector: We have a NEUTRAL outlook for the infrastructure sector as we expect to continue seeing the launching, execution, and completion of more infrastructural developments in 2023 mainly supported by the government's aggressiveness to; i) initiate and implement projects, ii) increase its diplomacy and partnerships in development among neighbouring nations, and, iii) step up on competition for attracting regional and international investors against other countries in Eastern Africa like Tanzania through railway connections and ports infrastructure. However, according to the Draft 2023 Budget Policy Statement, the government's Infrastructure, Energy, and ICT allocations for the FY'2023/2024 are forecast to be Kshs 398.2 bn, representing a 4.4% decline from the Kshs 416.4 bn in FY'2022/2023. The decrease in spending will affect the government's ability to fund new infrastructure projects;
Listed Real Estate: We retain a NEGATIVE outlook for listed REIT market with some of the factors that will continue to hinder the optimal performance of the sector market include; i) inadequate investor knowledge of the instrument, ii) lengthy registration, licensing, and approval process, iii) high Minimum Investment Amounts Set at Kshs 5.0 mn, iv) insufficient Investment Knowledge and Awareness of the REITs Market, v) subdued performance in some Real Estate sectors with oversupply of spaces in Commercial Office Sector at 7.3 mn SQFT and Retail Sector at 3.0 mn SQFT in the NMA, vi) high minimum capital requirements for a trustee of Kshs 100.0 mn, and, vii) adverse conflicts of interests with bank trustees. Moving forward, with the admission of Vuka platform and LapTrust Imara I-REIT in the market, we expect the Capital Markets Authority to further streamline the capital markets framework and incorporate proposed policies and regulations suggested by stakeholders in the sector in 2022. This is to ensure eased operations of existing institutions, attract more local and foreign REIT institutions, and increase opportunities for more investors to play active roles in the sector;
Investment Updates:
- Weekly Rates:
- Cytonn Money Market Fund closed the week at a yield of 10.80%. To invest, dial *809# or download the Cytonn App from Google Playstore here or from the Appstore here;
- Cytonn High Yield Fund closed the week at a yield of 13.87% p.a. To invest, email us at sales@cytonn.com and to withdraw the interest, dial *809# or download the Cytonn App from Google Playstore here or from the Appstore here;
- Cytonn Investments Real Estate Research Analyst, Kennedy Waweru and Legal Assistant, Noah Randiek featured on a twitter space to discuss The Critical Issue of Safety Construction in Kenya. Listen to the conversation here;
- We continue to offer Wealth Management Training every Wednesday, from 9:00 am to 11:00 am, through our Cytonn Foundation. The training aims to grow financial literacy among the general public. To register for any of our Wealth Management Trainings, click here;
- If interested in our Private Wealth Management Training for your employees or investment group, please get in touch with us through wmt@cytonn.com;
- Any CHYS and CPN investors still looking to convert are welcome to consider one of the five projects currently available for assignment, click here for the latest term sheet;
- Cytonn Insurance Agency acts as an intermediary for those looking to secure their assets and loved ones’ future through insurance namely; Motor, Medical, Life, Property, WIBA, Credit and Fire and Burglary insurance covers. For assistance, get in touch with us through insuranceagency@cytonn.com;
- Cytonnaire Savings and Credit Co-operative Society Limited (SACCO) provides a savings and investments avenue to help you in your financial planning journey. To enjoy competitive investment returns, kindly get in touch with us through clientservices@cytonn.com;
Real Estate Updates:
- For an exclusive tour of Cytonn’s real estate developments, visit: Sharp Investor's Tour, and for more information, email us at sales@cytonn.com;
- Phase 3 of The Alma is now ready for occupation and the show house is open daily. To rent please email properties@cytonn.com;
- We have 8 investment-ready projects, offering attractive development and buyer targeted returns; See further details here: Summary of Investment-ready Projects;
- For Third Party Real Estate Consultancy Services, email us at rdo@cytonn.com;
- For recent news about the group, see our news section here;
Hospitality Updates:
- We currently have promotions for Staycations. Visit cysuites.com/offers for details or email us at sales@cysuites.com;
According to the World Bank’s Global Economic Prospects - 2023, global economic growth in 2023 is expected to remain subdued, slowing down to 1.7%, from the 2.9% growth rate in 2022. The expected economic slowdown is driven by the continued high global inflation, persistent supply chain constraints worsened by geopolitical tensions, elevated debt sustainability concerns, and the tightening of monetary policies aggravating the financial conditions in most economies. The 2023 inflation rate is expected to ease to 5.2% in 2023 as compared to the 7.6% global inflation recorded in 2023, mainly attributable to declining commodity prices. Notably, despite the expected ease in inflation, the global inflation will remain elevated driven by the persistent supply chain constraints and currency depreciations. As such, the Central Banks will have to be cautious on the various policy stances they adopt by weighing their respective currency values against inflation pressure to maintain purchasing power of their respective economies.
Growth in 2023 shall be shaped by the following four key themes:
- Global Trade Slowdown
The World Bank projects the global trade growth to deteriorate to 1.6% growth in 2023 from the 4.0% growth rate in 2022 on the back of increased fragmentation of trade networks, and heightened securities concerns driven by geopolitical tensions. Other factors contributing to the slow growth in global trade are the persistent supply chain constraints worsened by the Russian-Ukraine conflict, and the tight monetary policies adopted by economies especially developed economies leading to massive capital outflows from emerging and developing economies. Additionally, services trade is also expected to remain subdued as travel and tourism activities will be constrained by slower global activity and high costs of inputs. Key to note, global trade slowed down to 4.0% growth in 2022 from the 9.5% rebound recorded in 2021, driven by decline in global demand due to elevated inflationary pressures, with the global inflation rate averaging 7.6% in 2022. However, going forward, despite global inflation projection coming in at 5.2% in 2023, 2.4% points below the 7.6% recorded in 2022, inflationary pressures still remain significantly above the pre-pandemic (2015-2019) average of 2.3%.
- Tightened Monetary Policies
In 2023, we expect most of the Central banks to continue raising their interest rates, albeit at a slower rate in H1’2023 as they monitor inflation levels given the persistent high fuel prices despite crude oil exhibiting a downward trajectory in the last quarter of 2022. Additionally, the interest hikes will be adopted driven by the need to anchor local currencies from aggressive currency depreciations following increased benchmark rates in developed economies. Most Central banks raised their benchmark interest rates in 2022 with the intention to anchor inflation, however, the tightened monetary policies led to a weaker-than-expected global demand. As such, we note that the interest hikes expected in 2023 though at slower rate will weigh down on economic performance due to tighter financial conditions that are expected to hinder both production and consumer spending, and consequently lead to decline in global trade.
The USA Federal Reserve is set to continue maintaining the tightened monetary stance in 2023 in a bid to anchor the high inflation level that despite declining by 0.6% points to close the year 2022 at 6.5% in December 2022, from 7.1% recorded in November 2022, remains significantly above the Federal’s target of 2.0%. On the other hand, the Bank of China (BOC) has continued to adopt a more accommodative policy, maintaining the benchmark lending rate at 3.65% from August 2022 to support the slow economic growth witnessed in China due to reintroduction of lockdowns to effect the Zero-COVID policy, as well as, subdued Real Estate Sector performance. The table below highlights the policy stance adopted by the Central Banks of major economies;
|
Cytonn Report: Monetary Policy Stance Adopted by Central Banks in Select Economies |
|||||
|
No |
Country |
Central Bank |
Previous Rate |
Current Rate |
Margin |
|
1 |
USA |
Federal Reserve |
3.75-4.00% |
4.25% - 4.50% |
0.50% points |
|
2 |
Australia |
Reserve Bank of Australia |
2.85% |
3.10% |
0.25% points |
|
3 |
Malaysia |
Bank Negara Malaysia |
2.75% |
2.75% |
0.00% points |
|
4 |
China |
Bank of China |
3.65% |
3.65% |
0.00% points |
|
5 |
England |
Bank of England |
3.00% |
3.50% |
0.50% points |
|
6 |
Canada |
Bank of Canada |
3.75% |
4.25% |
0.50% points |
|
7 |
Euro Area |
European Central Bank |
2.00% |
2.50% |
0.50% points |
Source: Central Banks of respective Countries
- Easing Commodity Prices
Global commodity prices are expected to ease further in 2023, having slowed in H2’2022 mainly attributable to the decline in aggregate global demand. While average y/y change shows that most prices registered upward trajectories in 2022, the half-year change shows that prices eased significantly in H2’2022 as shown in the table below:
|
Cytonn Report: Average Commodity Prices (USD) |
||||||
|
Commodity Index |
2021 |
2022 |
Average y/y change |
Jun-22 |
Dec-22 |
Half-year Change |
|
Fertilizers |
132.2 |
214.9 |
62.6% |
220.3 |
189.6 |
(13.9%) |
|
Energy Prices |
95.4 |
152.6 |
60.0% |
173.5 |
130.8 |
(24.6%) |
|
Agriculture |
108.3 |
122.7 |
13.3% |
128.5 |
115.0 |
(10.5%) |
|
Non-energy commodities |
111.7 |
123.6 |
10.6% |
127.8 |
115.3 |
(9.7%) |
|
Metals & Minerals |
116.4 |
115.0 |
(1.2%) |
115.7 |
107.6 |
(7.0%) |
|
Precious metals |
140.2 |
136.8 |
(2.4%) |
138.9 |
138.2 |
(0.5%) |
Source: World Bank
Energy and Oil prices are expected to ease in 2023 but remain above the pre-pandemic levels on the back of increase in coal prices, coupled with higher demand that has continued to outweigh supply. We also expect the prices of precious metals to further decline in the medium term driven by reduced investor demand for precious metals as a primary store of value. Key to note, the prices of metals and minerals will remain subdued and are projected to decline by 15.0% in 2023 mainly due to the deterioration of China’s property sector, which is one of the largest markets for metals. Similarly, agriculture prices are also expected to decline by 5.0% in 2023, with grains and oils and meals having registered 8.9% and 16.9% declines to USD 143.9 and USD 129.5 in December 2022, from USD 157.9 and USD 155.8 recorded in June 2022, respectively, an indication of better agricultural productions globally. However, Agricultural production maybe hindered by the erratic weather patterns experienced in Emerging and Developing economies (EMDEs), as well as the possible increase in fertilizer prices following the shutdown of fertilizer factories in Europe on the back of continued La Nina effect, as this will further constrain the supply chain and drive prices upwards.
- Public Debt
Global public debt is expected to increase rapidly in 2023 driven by widened current account deficits and surging debt service costs on the back of declining global trade and currency depreciation in most economies, coupled with tighter financial conditions undermining economic growth. According to International Monetary Fund (IMF), the global public debt (public and non-financial private debt stocks) came in at 247.0% of the GDP, (USD 235.0 tn) in 2021, translating to a 10.0% points decline from 256.0% of the GDP (USD 226.0 tn) recorded in 2020. Similarly, public debt stock as a percentage of GDP declined by 4.0% points to 96.0% in 2021, from 100.0% recorded in 2020. The decline in debt stock as a percentage of GDP was due to economic expansions witnessed in 2021 with global economic growth rate rebounding to 9.5% in 2021. However, given the perceived interest hikes in 2023, especially in developed economies such as the US that have strengthened the dollar, global public debt is expected to increase significantly due to increase of debt servicing costs with a huge chunk of the external debt in most economies being dollar denominated.
Below is a summary of the regional growth rates by country as per the World Bank:
|
|
Cytonn Report: World GDP Growth Rates |
||||||
|
Region |
2018 |
2019 |
2020 |
2021 |
2022e |
2023f |
|
|
1. |
India |
6.5% |
4.0% |
(6.6%) |
8.7% |
6.9% |
6.6% |
|
2. |
Kenya |
6.3% |
5.0% |
(0.3%) |
7.5% |
5.5% |
5.0% |
|
3. |
China |
6.6% |
6.0% |
2.2% |
8.1% |
2.7% |
4.3% |
|
4. |
Sub-Saharan Africa* |
2.6% |
2.5% |
(2.0%) |
4.3% |
3.4% |
3.6% |
|
5. |
Middle East, North Africa |
0.8% |
0.9% |
(3.6%) |
3.7% |
5.7% |
3.5% |
|
6. |
South Africa |
0.8% |
0.1% |
(6.3%) |
4.9% |
1.9% |
1.4% |
|
7. |
Japan |
0.8% |
(0.2%) |
(4.3%) |
2.2% |
1.2% |
1.0% |
|
8. |
Brazil |
1.3% |
1.2% |
(3.3%) |
5.0% |
3.0% |
0.8% |
|
9. |
United States |
2.9% |
2.3% |
(2.8%) |
5.9% |
1.9% |
0.5% |
|
10. |
Euro Area |
1.9% |
1.6% |
(6.1%) |
5.3% |
3.3% |
0.0% |
|
|
Global Growth Rate |
3.0% |
3.1% |
(3.2%) |
5.9% |
2.9% |
1.7% |
|
*Including South Africa |
|||||||
Source: World Bank
Global economic growth in 2023 is expected to remain subdued at 1.7%, a slowdown from the 2.9% growth rate in 2022 on the back of elevated global inflation, high fuel and energy prices, persistent supply chain constraints, and the tightening of monetary policies. Key to note, growth in the Emerging and Developing markets (EMDEs) is expected to weigh down the global economy further at 2.7% growth rate (excluding China) mainly due to weaker external demand, evidenced by economic deteriorations in economies such as the Euro Area and US that are the largest export destinations for EMDEs. Additionally, the tighter financial conditions, heightened uncertainties brought by surging debt levels in the EMDEs, and the aggressive currency depreciation will contribute to slow growth in EMDEs.
According to the World Bank’s Global Economic Prospectus - 2023, the Sub Saharan Africa region is expected to register an economic growth of 3.6% in 2023, 0.2% points higher than the estimated 3.4% in 2022. The slightly higher growth in 2023 is partly attributable to the expected increase in oil and gas exports from the region, an expected slight ease in the cost of living following reduction in prices of key imports such as fertilizers and fuel, and expected increase in domestic demand.
However, the projections remain subject to key downward risks such as:
- Global inflationary pressures, which when persist longer than expected, global interest rates may rise further leading to greater deterioration of financial conditions, consequently making it difficult in regaining access to international borrowing markets,
- Policy tightening across the region which may pick up if commodities prices continues to soar or if risks of debt distress are elevated due to high global interest rates and currency depreciation,
- Food markets remain tight as a result of decline in stocks, limited imports, and erratic weather conditions as well as high prices of farming inputs, making food systems in the region vulnerable to various shocks, and,
- Limited fiscal space on the back of declined government revenue coupled with high debt-levels leading to debt distress and high debt service costs, which are expected to hinder capital flows to the region amid sharply increased credit risks.
In Nigeria, the region largest economy, growth is projected to decelerate to 2.9% in 2023, with growth momentum in oil sector likely to be restrained by the existing production and security challenges coupled with moderation in oil prices. Growth in South Africa is expected to weaken to 1.4% in 2023 attributable to weak trading activity with its major trading partners such as United Kingdom, China, Euro Area and United States. Moreover, with over 60.0% of countries in Sub Saharan Africa already in, or at high risk of debt distress, fiscal efforts to support demand and activity are likely to be constrained due to tighter access to external financing. In the East African region, the persistent unfavorable weather conditions are expected to exacerbate the adverse impact of costlier farming inputs on agricultural production.
The table below highlights the real GDP forecasts of select Sub - Saharan Africa countries;
|
Cytonn Report: Real GDP Forecasts of Select Sub - Saharan Africa countries |
||
|
Country |
2022e |
2023f |
|
Senegal |
4.8% |
8.0% |
|
Rwanda |
6.0% |
6.7% |
|
Uganda |
4.7% |
5.5% |
|
Mauritius |
5.8% |
5.5% |
|
Tanzania |
4.6% |
5.3% |
|
Ethiopia |
3.5% |
5.3% |
|
Kenya |
5.5% |
5.0% |
|
Nigeria |
3.1% |
2.9% |
|
Angola |
3.1% |
2.8% |
|
Ghana |
3.5% |
2.7% |
|
South Africa |
1.9% |
1.4% |
|
Average |
4.2% |
4.6% |
Note: e - estimate, f – forecast. Data Source: World Bank
a. Economic Growth
According to Kenya National Bureau of Statistics (KNBS) Q3’2022 Gross Domestic Product Report, the Kenyan economy recorded a 4.7% growth in Q3’2022, significantly lower than the 9.3% contraction recorded in a similar period in 2021, when most sectors of the economy were recovering from the impact of the COVID-19. Consequently, the average GDP growth rate for the 3 quarters in 2022 is a growth of 5.6%, a decline from the 6.9% expansion recorded during a similar period of review in 2021. The average GDP growth rate for 2022 is expected to be 5.1%, a decline from the 7.5% improvement witnessed in 2021.
In 2023, we expect the economy to continue its recovery trajectory though at a slower pace with the projected GDP growth to come in at a range of 4.8% - 5.2%.
The key factors that shall support growth include:
- Expected Rebound in Transport, Agricultural and majority of the economic sectors- The country’s agricultural sector is expected to rebound in 2023 as a result of the subsidy programs introduced by the government on major farm inputs and reduced drought severity which shall mitigate the soaring food prices. Further, other economic sectors such as Transport and Accommodation shall also witness continued recovery post pandemic and this shall be enhanced with the political stability after the peaceful general elections,
- Gradual Increase in Access to Credit: As at November 2022, the private sector credit growth rate increased by 4.7% points to 12.5%, from 7.7% recorded in the same period last year. Growth of credit to the private sector is expected to remain strong on the back of existing policy measures, including the MSMEs Credit Guarantee Scheme, and continued economic recovery. Additionally, we expect the Hustler Fund, a government scheme to offer cheaper credit to the citizens at the bottom of the economic ladder to scale up, targeting more than 15 mn people with the amount disbursed as of 23rd January 2023 standing at Kshs 15.7 bn with total repayments of Kshs 7.5 bn. Despite the elevated Gross Non-Performing Loans Ratio in Q3’2022, which increased to 13.7%, as compared to 12.0% in Q3’2021, the banks continued to advance credit to the private sector albeit cautiously. Notably, the risk based pricing models, already adopted by majority of commercial banks will see banks offer different rates to clients depending on their risk category to mitigate default risk exposure. As such, the high credit risk will not severely hamper access to credit by creditors who would have otherwise be considered non-fit for credit advancement. The chart below shows 5-year private sector credit growth;
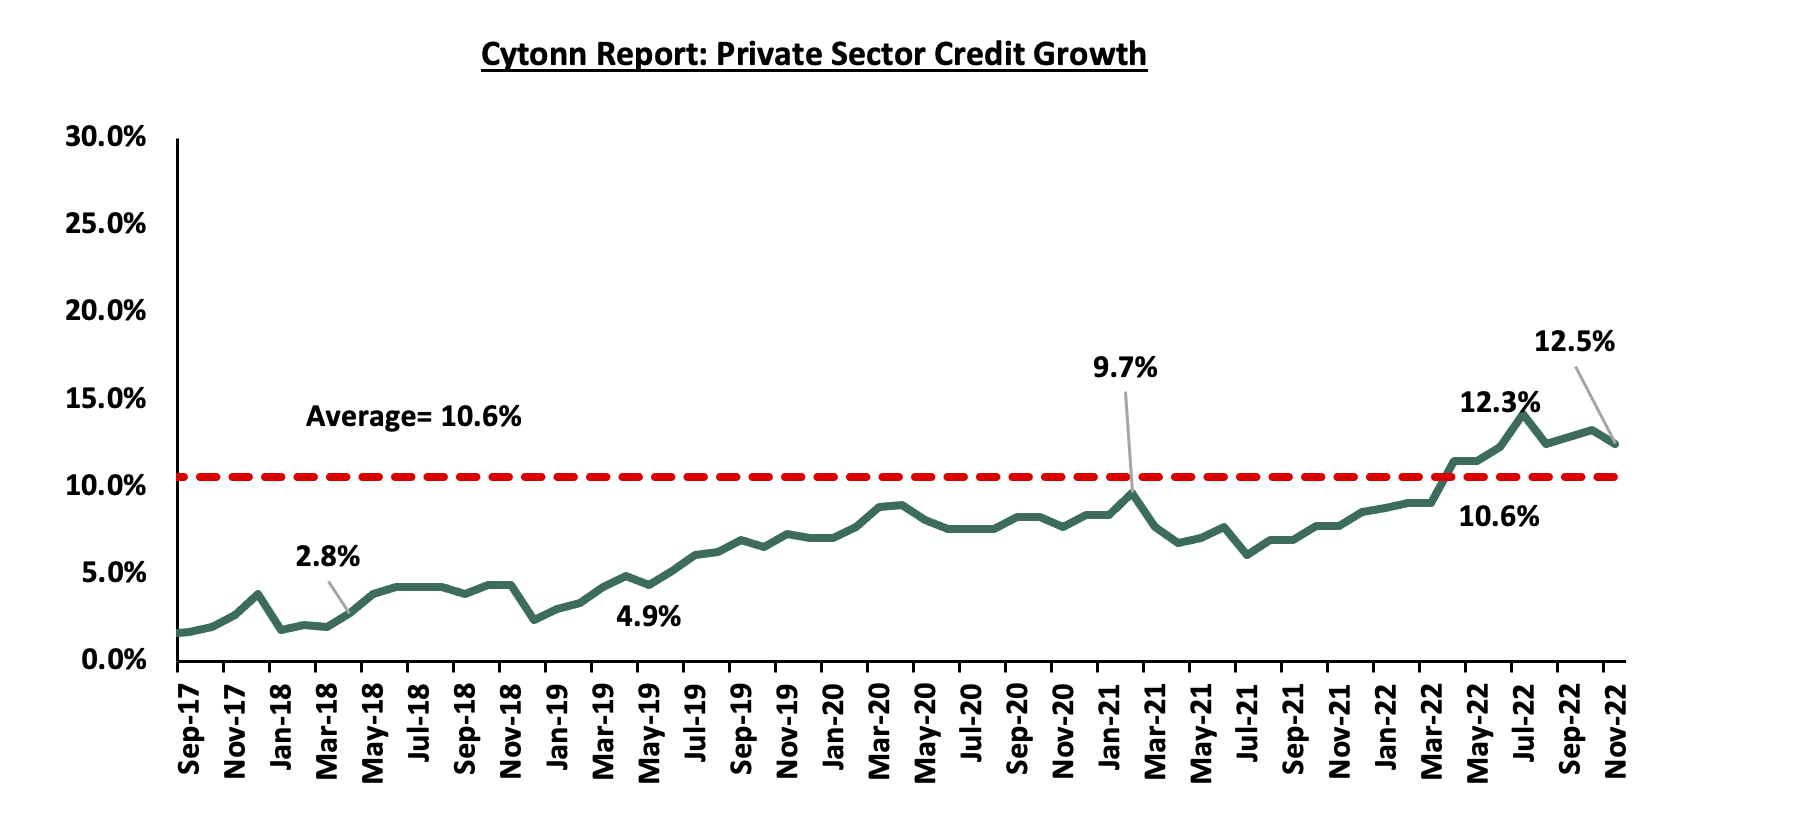
Source: CBK
However, key risks abound economic growth include:
- High risk of debt distress: According to International Monetary Fund and the World bank, Kenya is currently under risk of high debt distress with the country’s debt to GDP ratio currently at 62.3%, 12.3% above the recommended IMF threshold of 50.0% for developing countries. Additionally, Kenya’s debt stood at Kshs 8.7 tn as of October 2022 which is Kshs 1.3 tn less the Kshs 10.0 tn debt ceiling. From this, the total debt is nearly breaching the debt ceiling and with the projected Kshs 695.2 bn for FY’2023/24 borrowing, the government would need to consider new debt ceiling as the debt is likely to surpass the Kshs 10.0 tn mark in the near term. Consequently, the government will face significant pressure to service the existing debt with the debt service to revenue ratio standing at 51.0% as of December 2022. A high level of debt reduces the prospects of economic growth as a large portion of revenues is used to service the existing debt as opposed to development expenditure,
- Tightened Monetary Policy – The Central Bank increased the Monetary Policy Rate by 175.0 bps to 8.75% in 2022 from 7.0% in 2021 in a bid to anchor the elevated inflation back to the CBK’s target range of 2.5%-7.5% from the 7.6% average in 2022. The high CBR is expected to stifle economic growth, and,
- Elevated Inflation –The country’s inflation rate averaged 7.6% in 2022 above the CBK’s target range of 2.5%-7.5%. Inflation is expected to remain elevated in the short term and will weigh down on the business environment.
- Currency:
In 2022, the Kenyan Shilling depreciated by 9.0% against the US Dollar, to close at Kshs 123.4, from Kshs 113.1 recorded at the end of 2021, driven by the increased global crude oil prices that led to increased dollar demand from oil and energy importers. Going forward, we expect the shilling to range between Kshs 130.21 and Kshs 134.40 supported by:
- Improving diaspora remittances standing at a cumulative USD 4.0 bn for the year 2022, representing an 8.3% y/y increase from a cumulative USD 3.7 bn recorded in 2021. Notably on a m/m basis, the remittance for the month of December 2022 increased by 3.4% to USD 0.4 bn, from USD 0.3 bn recorded in November 2022. The improving remittances have continued to cushion the shilling against further depreciation and are attributable to financial innovations that have provided Kenyans in the diaspora more convenient channels to transact,
- Expected dollar inflows from both commercial and multilateral loans such as the IMF under the Extended Fund Facility (EFF) and Extended Credit Facility (ECF). Under this program, Kenya has already received Kshs 205.9 bn (USD 1,655.6 mn) with a pending amount of Kshs 85.1 bn (USD 684.4 mn). The National Treasury is also expected to borrow Kshs 198.6 bn externally in FY’2023/2024 to finance the budget deficit of 4.3% of the GDP, which will also improve the dollar inflows, and,
- Sufficient Forex reserves currently at USD 7.4 bn (equivalent to 4.2 months of import cover) as at 30thDecember 2022, which is above the statutory requirement of maintaining at least 4.0-months of import cover, but lower than the EAC region’s convergence criteria of 4.5-months of import cover.
The graph below shows Kenya’s amount of forex reserves and the reserves equivalents of months of import cover, in the last 5 years: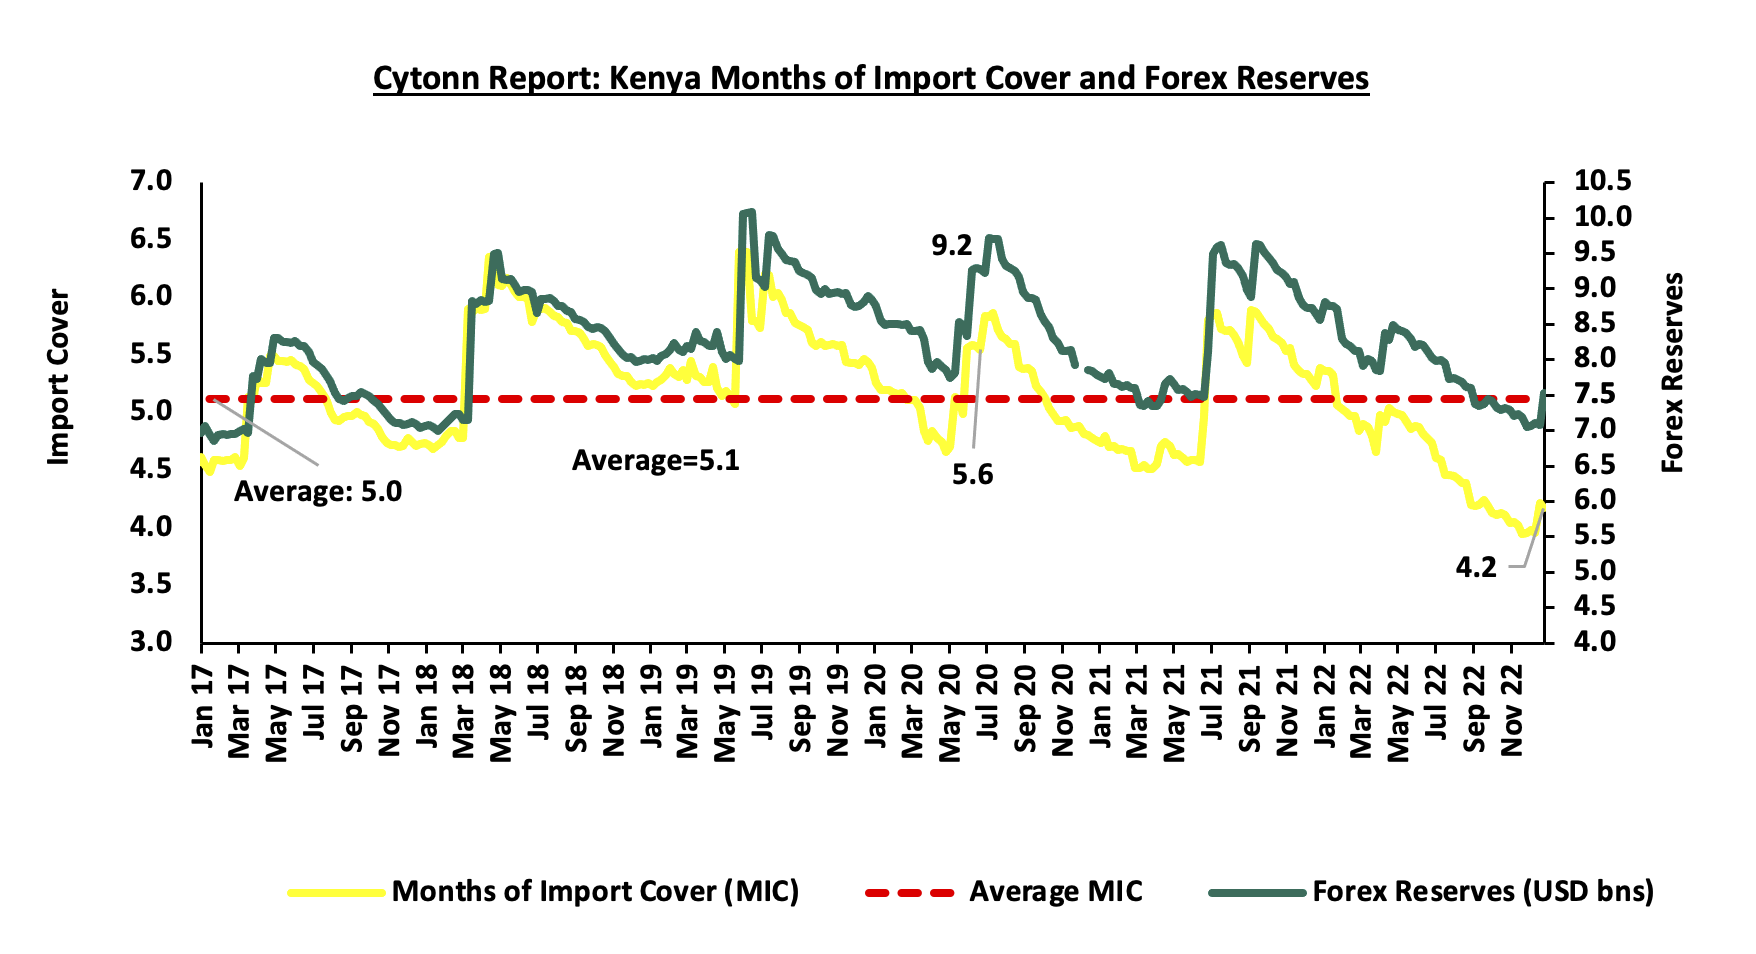
Source: CBK
The Kenyan shilling will however face the following challenges:
- High global crude oil prices on the back of persistent supply chain bottlenecks coupled with high demand,
- An ever-present current account deficit estimated at 5.2% of GDP in the 12 months to November 2022, despite improving by 0.2% points from 5.4% recorded in a similar period in 2021,
- The need for Government debt servicing which continues to put pressure on forex reserves given that 69.3% of Kenya’s External debt was US Dollar denominated as of October 2022, and,
- A continued hike in the USA Fed interest rates in 2022 to a range of 4.25% - 4.50% in December 2022 has strengthened the dollar against other currencies by causing capital outflows from other global emerging markets.
We expect the shilling to remain within a range of Kshs 130.21 and Kshs 134.40 against the USD in 2023 with a bias towards a 6.4% depreciation by the end of the year.
- Inflation:
In 2022, the inflation rate remained above the government’s set range of 2.5% - 7.5%, with the average monthly inflation rate coming in at 7.6% higher than the 6.1% average for 2021. The relatively high inflation can be attributed to the high fuel prices experienced through most of the year as a result of persistent supply chain constraints, coupled with the erratic weather conditions experienced in the first half of the year and increased costs of agricultural inputs hiking production costs consequently leading to food commodity prices spiking.
We expect inflation to average 6.6% in 2023, within the government target range of 2.5% - 7.5%. Key risks that abound are the high electricity prices, high fuel costs due to increased crude prices globally exacerbated by the partial removal of the fuel subsidy program.
- Interest Rates:
The Central Bank is expected to continue with the restrictive monetary policy stance in the medium term with the intention to anchoring inflation back to CBK’s target range of 2.5%-7.5%. Additionally, we may see slight upward pressure on the interest rates as the government compensates investors for the increased risks posed by currency depreciation and elevated inflation.
Despite the projected decline in borrowing by 18.1% to Kshs 695.2 bn in FY’2023/24 from Kshs 849.3 bn in FY’2022/23, Kenya still has an ever present fiscal deficit, projected at 4.3% in FY’2023/24. As such, we expect the government to continue borrowing aggressively from both the domestic and foreign markets. Additionally, the rising debt servicing following additional borrowing will continue to put pressure on the government to borrow more to fund the maturities. Some of the upcoming maturities include the 10-year USD 2.0 bn (Kshs 226.0 bn) Eurobond maturing in 2024. Consequently, the increased borrowing will continue to exert upward pressure on the yield curve as investors will demand compensation for possible losses. Despite this, the interest rate will not go overboard owing to the support from concessional multilateral loans from IMF reducing the government’s cash crunch.
The table below summarizes the various macro-economic factors and the possible impact on the business environment in 2023. With three indicators being negative, three being neutral and one being positive, the general outlook for the macroeconomic environment in 2023 is NEUTRAL.
|
|
Macro-Economic & Business Environment Outlook |
|
|
|
Macro-Economic Indicators |
|
2023 Outlook |
Effect |
|
Government Borrowing |
|
On the domestic front, we expect the government to borrow aggressively from the domestic market as it aims to plug in the fiscal deficit, which is projected to come in at Kshs 689.2 bn in the FY/2023/24, 4.3% of the GDP. Domestic debt provides the government with a cheaper source of debt compared to foreign currency-denominated debts that have higher interest rates and have currency risk attached to them. In our view, the level of foreign borrowing will also increase in 2023 due to the following reasons; i) Need to service the upcoming maturities such as the 10-year USD 2.0 bn (Kshs 226.0 bn) Eurobond maturing in 2024 with the government having phased out on the two Eurobonds that it had announced to issue by June 2022, and (ii) disbursements from the multilateral loan from IMF as part of the 3-year disbursing program agreed in April 2021. On revenue collection, we expect continued improvement in 2023 due to the raft of measures the new administration has put in place to boost tax collection such as the draft regulations for the Excise Duty Regulations 2023. We expect to see improved revenue collection which will help lower the budget deficit, and reduce the need for more borrowing. KRA registered a performance rate of 102.8% in FY’2021/2022. Additionally, KRA has also embarked on various efforts to raise more revenue through its strategies as explained in the Budget Policy Statement, 2023 such as reducing the Value Added Tax (VAT) gap to 19.8% from 38.9%, minimizing Corporate Income Tax gap to 30.0% from the current 32.2% recorded in FY’2022/23, integrating KRA tax system with telecommunication companies, and expanding the tax base to include the informal sector targeting 2,800 SMEs. However, the upward revision of taxes comes at a time when the business environment remains subdued, underpinned by the elevated inflationary pressures and the aggressive depreciation of the Kenyan shilling that has suppressed business production levels weighing down on the projected revenue performance. |
Negative |
|
Exchange Rate |
• |
We expect the Shilling to range between Kshs 130.21 and Kshs 134.40 to the USD with a bias to a 6.4% depreciation by the end of the year. In 2023, the shilling is likely to face continued pressure due to: i) High global crude oil prices on the back of persistent supply chain coupled with high demand, ii) high debt servicing costs putting pressure on forest reserves, and iii) a continued hike in the USA Fed interest rates which has strengthened the dollar against the Kenya shillings. However, we expect improved diaspora remittances to support the shilling coupled with sufficient forex reserves |
Negative |
|
Interest Rates |
• |
Given the restrictive policy stance utilized in 2022, we expect the same to be maintained in the medium term of 2023 with the intention of anchoring the elevated inflation. Additionally, the yield curve is expected to remain adjusted upwards especially in the medium term as the government compensates investors for the increased risks of currency depreciation and elevated inflation. |
Negative |
|
Inflation |
• |
We expect inflation to average 6.6% in 2023 and within the government target range of 2.5% - 7.5% |
Neutral |
|
GDP |
• |
We project GDP growth for 2023 to continue expanding at a slower pace within a range of 4.8% - 5.2%. GDP growth is expected to be supported by the continued economic recovery, expected rebound in sectors such as Transport, accommodation and agriculture especially with the introduction of farm input subsidies. However, risks abound due to high risk of debt distress, the erratic weather conditions expected to adversely affect the Agricultural sector, which is the largest contributor to Kenya’s GDP, elevated inflationary pressures, currency depreciation and restrictive monetary policy |
Neutral |
|
Investor Sentiment |
• |
We expect 2023 to register lower investor sentiments mainly due to; i) elevated inflation in the country currently at 9.1%, and ii) Continued depreciation of the Kenyan currency as a result of increased dollar demand from importers, especially for oil and energy sectors against a lower supply of hard currency and high debt servicing. However, we expect the business environment to improve in the medium term with the PMI averaging 51.1 since September 2022 indicating continued improvement in business environment. |
Neutral |
|
Security |
• |
We expect security to be maintained in 2023 with a stable political environment following peaceful general elections in 2022. |
Positive |
The three changes from last year’s outlook are:
- Exchange Rate to Negative from Neutral necessitated by key factors such as high global crude oil prices on the back of persistent supply chain coupled with high demand, high debt servicing costs putting pressure on forest reserves, and a continued hike in the USA Fed interest rates which has strengthened the dollar against the Kenya shillings,
- Interest Rate to Negative from Neutral necessitated by the restrictive monetary policy which is expected to be maintained in the medium term of 2023 to anchor the elevated inflation. We also expect the yield curve to remain adjusted upwards especially in the medium term due to increases risks arising from currency depreciation and elevated inflation,
- Investor Sentiment to Neutral from Negative necessitated by the expected improvement in business environment in the medium term with the PMI index averaging 51.1 since September 2022 indicating continued improvement in the business environment. This is despite elevated inflation and currency depreciation, and,
- Security from Neutral to Positive attributable to stable political environment following peaceful general elections in 2022.
Out of the seven metrics that we track, three have a neutral outlook, three have a negative outlook and one has a positive outlook; from last year where five had a neutral outlook and two had a negative outlook. Our general outlook for the macroeconomic environment remains NEUTRAL for 2023, unchanged from 2022.
The government is currently 4.8% behind its prorated domestic borrowing target, having borrowed Kshs 324.0 bn domestically, against the pro-rated target of Kshs 340.4 bn, going by the government domestic borrowing target of Kshs 581.7 bn as per the Budget Review and Outlook Paper (BROP) 2022. In order to meet the domestic borrowing target, the government has to borrow an average of Kshs 43.5 bn on a monthly basis, in the 2nd half of the current fiscal year. We expect an upward pressure on the interest rates as the government will need to borrow aggressively from the local market to plug in the deficit projected to end at 5.8% of GDP for the FY’2022/2023, given the challenging environment to source external financing coupled with the local currency depreciation that has increased debt servicing costs.
Below is a summary of treasury bills and bonds maturities and the expected borrowings over the same period. The government will need to borrow Kshs 43.5 bn on average each month for the rest of the fiscal year to meet the domestic borrowing target of Kshs 550.9 bn for the FY’2022/2023, and cover T-bill and T-bond maturities, as illustrated in the graph below: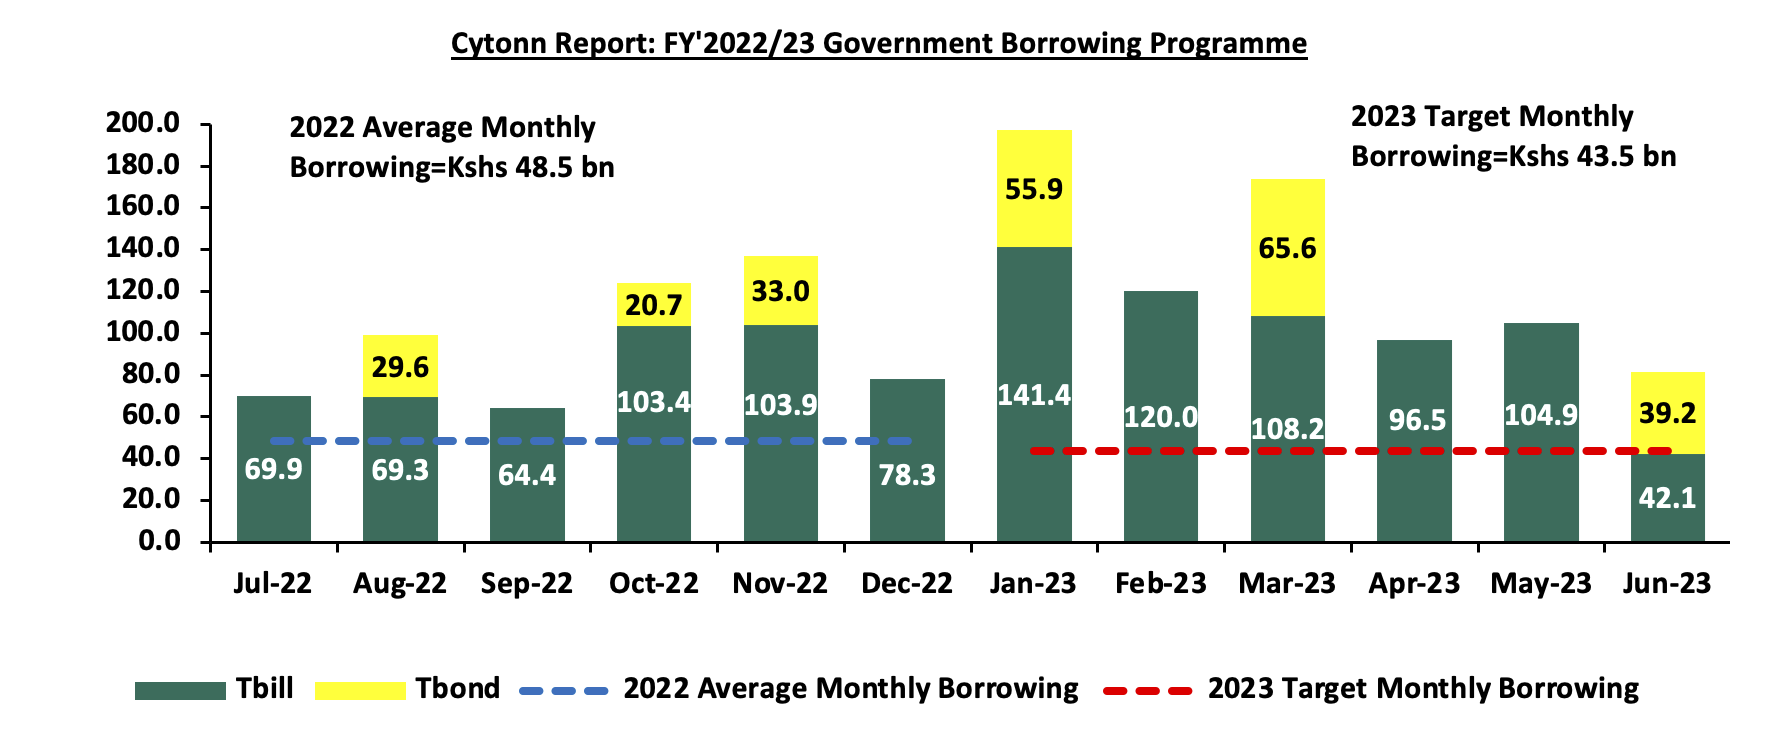
Fig: Schedule of Treasury bills and bonds maturities and the expected target borrowings in the 2022-2023 fiscal year to cater for the maturities and additional government borrowing.
Weekly Market Performance;
During the week, T-bills remained oversubscribed, with the overall subscription rate coming in at 142.9%, up from 122.7% recorded the previous week. Investor’s preference for the shorter 91-day paper persisted as they sought to avoid duration risk, with the paper receiving bids worth Kshs 18.4 bn against the offered Kshs 4.0 bn, translating to a subscription rate of 458.9%, up from 354.3% recorded the previous week. The subscription rate for the 364-day paper also increased to 56.8% from 21.9% recorded the previous week, while that of the 182-day paper declined to 102.6% from 131.0% recorded the previous week. The yields on the government papers were on an upward trajectory, with the yields on the 364-day, 182-day and 91-day papers increasing by 3.4 bps, 6.3 bps and 6.4 bps to 10.5%, 10.0% and 9.6%, respectively. The Government accepted a total of Kshs 32.1 bn worth of bids out of the Kshs 34.3 bn worth of bids received, translating to an acceptance rate of 93.6%. The graph below compares the overall T- bills subscription rates obtained in 2017, 2022 and 2023 Year to Date (YTD):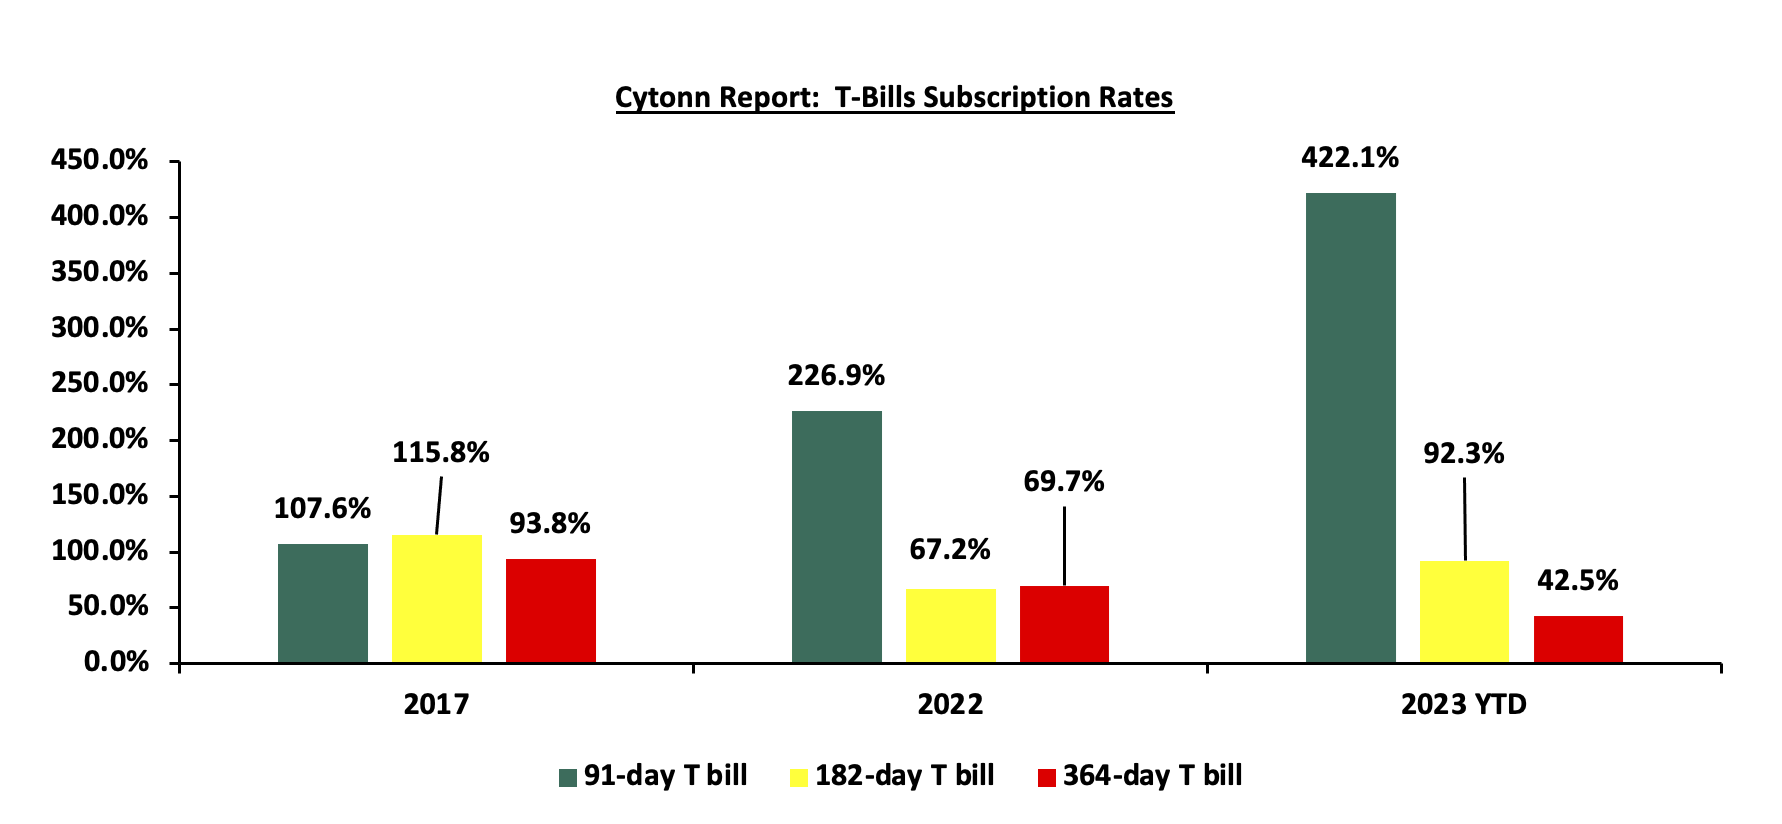
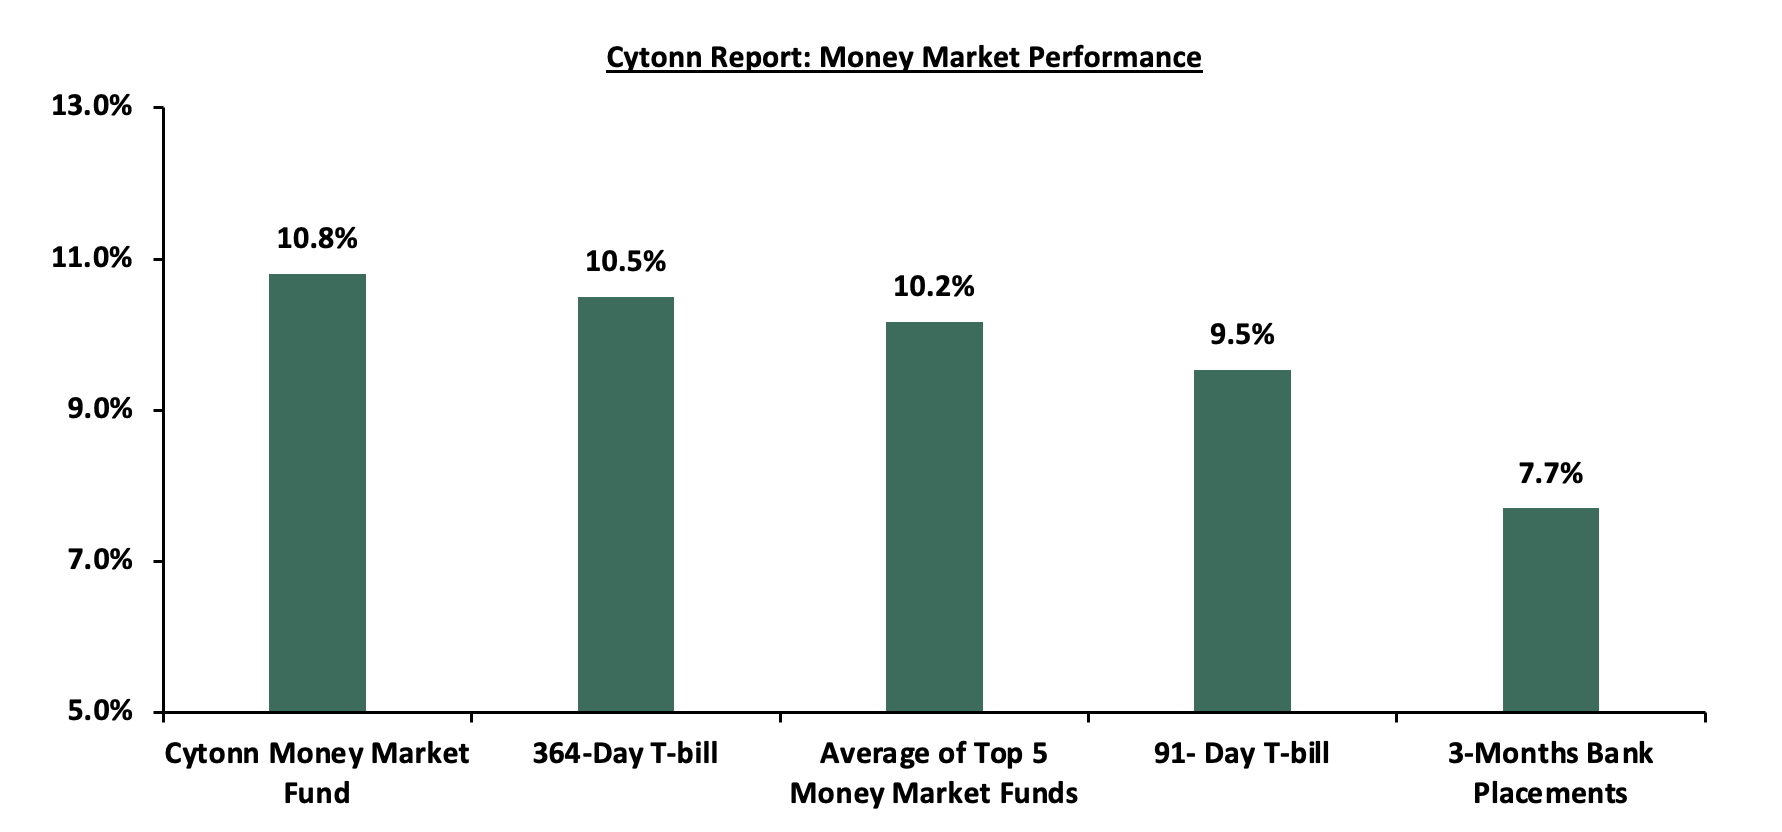
In the money markets, 3-month bank placements ended the week at 7.7% (based on what we have been offered by various banks), while the yield on the 364-day and 91-day T-bills increased by 3.4 bps and 6.4 bps to 10.5% and 9.5%, respectively. The average yield of the Top 5 Money Market Funds increased by 2.2 bps to 10.2%, while yield on the Cytonn Money Market Fund remained unchanged at 10.8%.
The table below shows the Money Market Fund Yields for Kenyan Fund Managers as published on 27th January 2023:
|
Cytonn Report: Money Market Fund Yield for Fund Managers as published on 27th January 2023 |
||
|
Rank |
Fund Manager |
Effective Annual Rate |
|
1 |
Cytonn Money Market Fund (dial *809# or download Cytonn App) |
10.8% |
|
2 |
Kuza Money Market fund |
10.2% |
|
3 |
Apollo Money Market Fund |
10.1% |
|
4 |
Zimele Money Market Fund |
9.9% |
|
5 |
GenCap Hela Imara Money Market Fund |
9.9% |
|
6 |
Nabo Africa Money Market Fund |
9.8% |
|
7 |
NCBA Money Market Fund |
9.8% |
|
8 |
Old Mutual Money Market Fund |
9.7% |
|
9 |
Madison Money Market Fund |
9.6% |
|
10 |
Sanlam Money Market Fund |
9.6% |
|
11 |
AA Kenya Shillings Fund |
9.4% |
|
12 |
Dry Associates Money Market Fund |
9.3% |
|
13 |
Co-op Money Market Fund |
9.3% |
|
14 |
CIC Money Market Fund |
9.2% |
|
15 |
British-American Money Market Fund |
8.9% |
|
16 |
ICEA Lion Money Market Fund |
8.8% |
|
17 |
Orient Kasha Money Market Fund |
8.6% |
|
18 |
Absa Shilling Money Market Fund |
8.1% |
|
19 |
Equity Money Market Fund |
7.7% |
Source: Business Daily
Liquidity:
During the week, liquidity in the money markets tightened, with the average interbank rate increasing to 6.2% from 5.7% recorded the previous week, partly attributable to tax remittances that offset government payments. The average interbank volumes traded increased by 2.2% to Kshs 15.9 bn from Kshs 15.6 bn recorded the previous week.
Kenya Eurobonds:
During the week, the yields on Eurobonds recorded mixed performance with the yield on the 10-year Eurobond issued in 2014 recording the largest decline having declined by 0.5% points to 10.4% from 10.9%, recorded the previous week. The decline in yields on the 10-year Eurobond issued in 2014 is partly attributable to increased investor sentiments following International Monetary Fund (IMF) positive reviews as well as the new administration’s pledge on honoring debt payments. The table below shows the summary of the performance of the Kenyan Eurobonds as of 26th January 2023;
|
Cytonn Report: Kenya Eurobonds Performance |
||||||
|
|
2014 |
2018 |
2019 |
2021 |
||
|
Date |
10-year issue |
10-year issue |
30-year issue |
7-year issue |
12-year issue |
12-year issue |
|
Amount Issued (USD bn) |
2.0 |
1.0 |
1.0 |
* 2.1 |
1.0 |
|
|
Years to Maturity |
1.4 |
5.1 |
25.1 |
4.3 |
9.3 |
11.4 |
|
30-Dec-22 |
12.9% |
10.5% |
10.9% |
10.9% |
10.8% |
9.9% |
|
2-Jan-23 |
12.9% |
10.5% |
10.9% |
10.9% |
10.8% |
9.9% |
|
19-Jan-23 |
10.9% |
9.9% |
10.4% |
9.9% |
10.1% |
9.4% |
|
20-Jan-23 |
10.6% |
9.6% |
10.2% |
9.7% |
10.0% |
9.3% |
|
23-Jan-23 |
10.6% |
9.7% |
10.2% |
9.7% |
9.9% |
9.4% |
|
24-Jan-23 |
10.6% |
9.7% |
10.2% |
9.7% |
9.9% |
9.4% |
|
25-Jan-23 |
10.6% |
9.7% |
10.3% |
9.7% |
9.9% |
9.3% |
|
26-Jan-23 |
10.4% |
9.7% |
10.3% |
9.8% |
10.0% |
9.4% |
|
Weekly Change |
(0.5%) |
(0.2%) |
(0.1%) |
(0.1%) |
(0.1%) |
- |
|
MTD Change |
(2.5%) |
(0.8%) |
(0.6%) |
(1.1%) |
(0.8%) |
(0.5%) |
|
YTD Change |
(2.5%) |
(0.8%) |
(0.5%) |
(1.1%) |
(0.8%) |
(0.5%) |
*2019 aggregate amount issued for the two issues was USD 2.1 bn
Source: Central Bank of Kenya (CBK)
Debt sustainability concerns continue to persist in the Sub-Saharan Africa (SSA) region in 2023 amid a slow post-pandemic recovery and elevated inflationary pressures. The table below shows the SSA countries that have issued Eurobonds and their respective risk of debt distress;
Sub Saharan Africa (SSA) Eurobond Countries
|
Cytonn Report: Sub-Saharan Africa Eurobond Countries |
|||||
|
Country |
Debt to GDP Ratio (2021, IMF) |
Debt to GDP Ratio (2022, IMF Projected) |
Debt Service to Revenue Ratio |
Risk of overall debt distress ( Joint IMF & Word bank DSA) |
Current Situation |
|
Zambia |
119.1% |
122.8% |
61.0% |
In debt distress |
External Debt Restructuring Ongoing |
|
Ghana |
82.1% |
90.7% |
97.1% |
In debt distress |
External and domestic debt restructuring ongoing |
|
Senegal |
73.2% |
77.3% |
21.7% |
Moderate risk of debt distress |
No debt restructuring ongoing |
|
Namibia |
72.00% |
71.8% |
13.8% |
High risk of debt distress |
No debt restructuring ongoing |
|
Kenya |
67.8% |
69.4% |
51.0% |
High risk of debt distress |
No debt restructuring ongoing |
|
Rwanda |
66.6% |
68.1% |
30.1% |
Moderate risk of debt distress |
No debt restructuring ongoing |
|
South Africa |
69.0% |
68.0% |
36.2% |
High risk of debt distress |
No debt restructuring ongoing |
|
Seychelles |
72.9% |
64.9% |
- |
High risk of debt distress |
No debt restructuring ongoing |
|
Angola |
86.4% |
56.6% |
19.5% |
High risk of debt distress |
No debt restructuring ongoing |
|
Ivory Coast |
52.1% |
56.0% |
34.0% |
Moderate risk of debt distress |
No debt restructuring ongoing |
|
Benin |
49.9% |
54.8% |
64.7% |
Moderate risk of debt distress |
No debt restructuring ongoing |
|
Gabon |
65.8% |
54.0% |
48.9% |
Moderate risk of debt distress |
No debt restructuring ongoing |
|
Cameroon |
45.5% |
46.8% |
51.6% |
Moderate risk of debt distress |
No debt restructuring ongoing |
|
Ethiopia |
52.9% |
46.0% |
16.8% |
High risk of debt distress |
No debt restructuring ongoing |
|
Tanzania |
40.7% |
39.5% |
14.2% |
Moderate risk of debt distress |
No debt restructuring ongoing |
|
Nigeria |
36.6% |
37.3% |
57.1% |
Moderate risk of debt distress |
Domestic Debt Restructuring |
|
Average |
65.8% |
64.0% |
41.2% |
||
Sources: International Monetary Fund (IMF) 2022 economic outlook & Joint Debt Sustainability Analysis (DSA), World Bank
Key take-outs in the table include
- The average debt to GDP ratio for the above countries came in at 65.8% in 2021 and is projected to end 2022 at 64.0%, high above the recommended International Monetary Fund (IMF) threshold of 50.0% to developing economies,
- Two countries: Ghana and Zambia are already in debt distress, and have already initiated different forms of debt restructuring, especially at the G20 and the Paris Club,
- The average debt servicing consumes above 41.2% of the total revenue collected, translating to less allocation for development purposes, and,
- Although Kenya’s debt to GDP ratio is projected to increase to 69.4% in 2022 from 67.8% in 2021, the current administrations initiatives towards fiscal consolidation has seen the debt to GDP ratio decline to 62.3% in October 2022 from 69.1% in May 2022.
Kenya Shilling:
During the week, the Kenyan shilling depreciated by 0.2% against the US dollar to close the week at Kshs 124.4, from Kshs 124.1 recorded the previous week, partly attributable to increased dollar demand from importers, especially oil and energy sectors against a slower supply of hard currency. On a year to date basis, the shilling has depreciated by 0.8% against the dollar, adding to the 9.0% depreciation recorded in 2022. We expect the shilling to remain under pressure in 2023 as a result of:
- High global crude oil prices on the back of persistent supply chain bottlenecks coupled with high demand,
- An ever-present current account deficit estimated at 5.2% of GDP in the 12 months to November 2022, despite improving by 0.2% points from 5.4% recorded in a similar period in 2021,
- The need for Government debt servicing which continues to put pressure on forex reserves given that 69.3% of Kenya’s External debt was US Dollar denominated as of October 2022, and,
- A continued hike in the USA Fed interest rates in 2022 to a range of 4.25% - 4.50% in December 2022 has strengthened the dollar against other currencies by causing capital outflows from other global emerging markets.
The shilling is however expected to be supported by:
- Improved diaspora remittances standing at a cumulative USD 4.0 bn for the year 2022, representing an 8.3% y/y increase from a cumulative USD 3.7 bn recorded in 2021. Notably on a m/m basis, the remittance for the month of December 2022 increased by 3.4% to USD 0.4 bn, from USD 0.3 bn recorded in November 2022, and,
Key to note, Kenya’s forex reserves declined by 5.1% to USD 7.0 bn as at 26th January 2023 from USD 7.4 bn recorded the previous week, mainly due to foreign debt servicing obligations for the month of January 2023, which amounted to USD 0.5 bn. As such, the country’s months of import cover came in at 3.9 months, which are marginally below the statutory requirement of maintaining at least 4.0-months of import cover from the 4.1 months recorded in the previous week. The chart below summarizes the evolution of Kenya months of import cover over the last 10 years;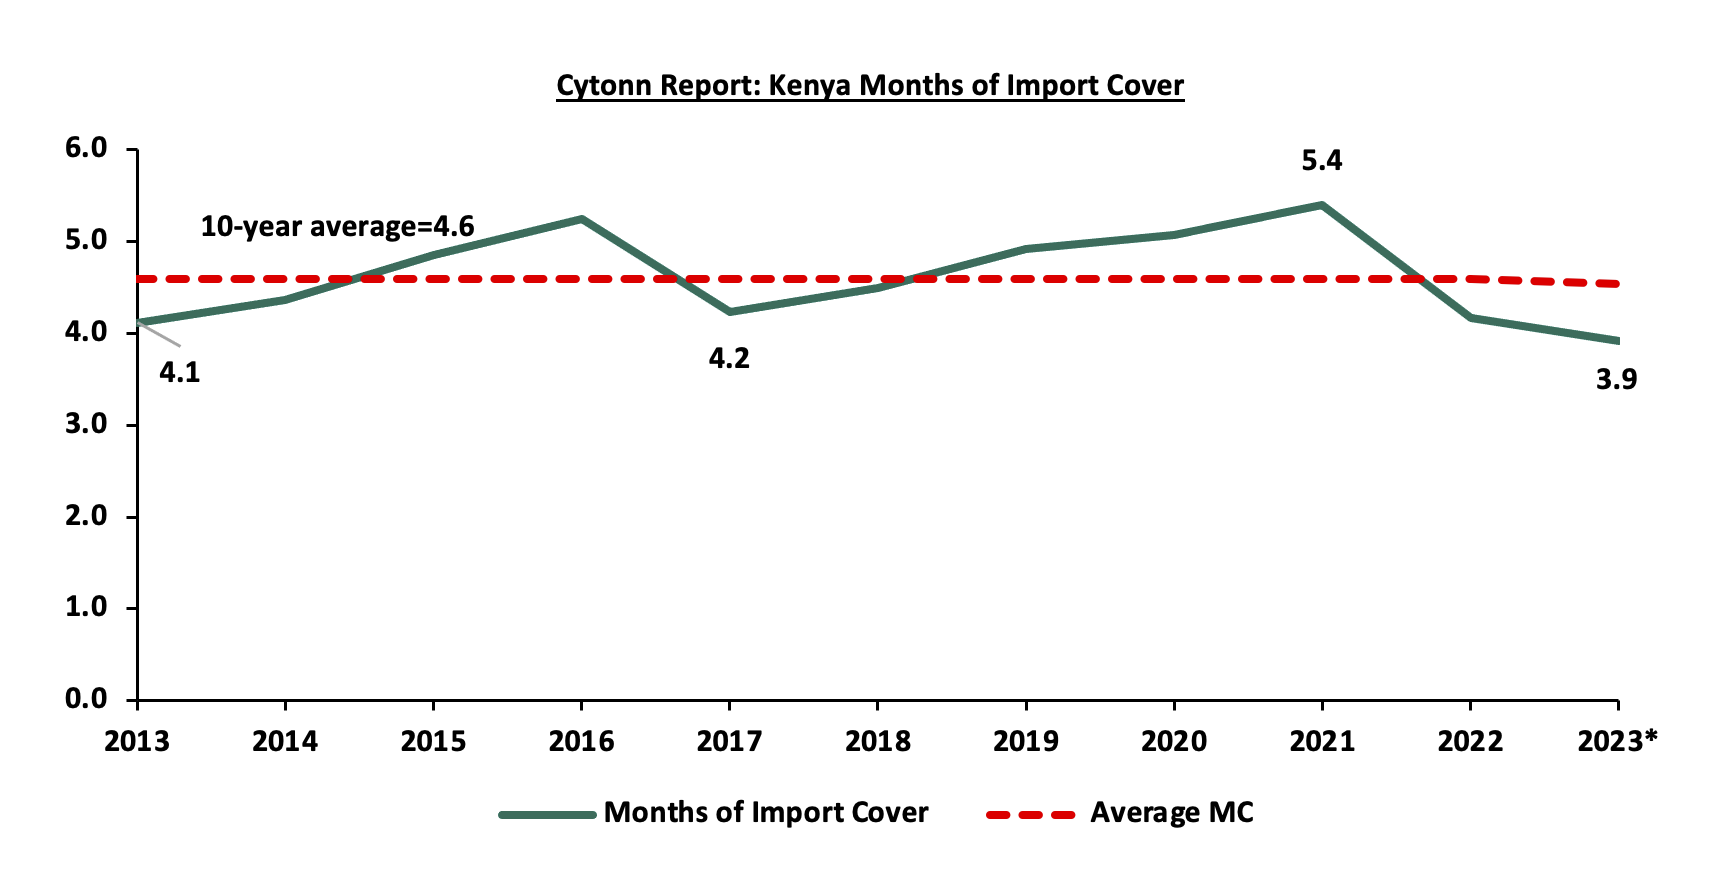
*Figure as of January 2023
Weekly Highlights:
- January MPC Meeting
The Monetary Policy Committee (MPC) is set to meet on Monday, 30th January 2023, to review the outcome of its previous policy decisions and recent economic developments, and to decide on the direction of the Central Bank Rate (CBR). We expect the MPC to increase the Central Bank Rate (CBR) by 25.0 bps to 9.00% from the current 8.75% with their decision mainly being supported by;
- The need to continue cooling down inflation to the government’s target range of 2.5%-7.5%. Key to note, inflation for the months of November and December 2022 eased to 9.5% and 9.1%, respectively, in line with the easing global inflation, especially in the advanced economies such as the U.S and the EU. Going forward, inflation is expected to remain elevated in the short term as it continues to ease gradually driven by the high fuel and food prices. Additionally, we expect the fuel prices to rise as the current administration plans to completely do away with the fuel subsidy program and adjust the domestic fuel prices to ease pressure on expenditure. Further, we expect food prices to remain elevated in the short term, due to the erratic weather patterns and as the measures being taken by the current administration to address food security concerns take effect. As such, we expect the MPC to raise the CBR as it continues to monitor the situation and react accordingly, given that its main role is maintaining price stability, and,
- The need to support the shilling from further depreciation as other Central Banks raise their rates. Notably, the Kenyan shilling depreciated by 9.0% during 2022, and to an all-time low of Kshs 124.2 as of 25th January 2023, from Kshs 123.4 recorded in the beginning of 2023, representing a 0.7% depreciation year to date. The depreciation is mainly attributable to increased dollar demand in the oil and energy sectors as a result of high fuel prices. In the short term, we expect the shilling to depreciate even further should the prices of fuel continue to rise leading to an increased import bill, Kenya being a net importer. As such, this might put pressure on the Central Bank to pursue additional policy measures to slow the accelerated depreciation of the shilling.
For a more detailed analysis, please see our January 2023 MPC note.
- January 2023 inflation Projection
We are projecting the y/y inflation rate for January 2023 to come in at the range of 9.2%-9.6% mainly on the back of:
- High fuel prices-Despite fuel prices remaining unchanged at Kshs 177.3, Kshs 162.0 and Kshs 145.9 per litres of Super Petrol, Diesel and Kerosene for the period between 15th January 2023 to 14th February 2023, Kenya’s fuel prices remain elevated attributable to the partial removal of the fuel subsidy in September 2022 by the current administration under the Petroleum Development Levy Program. As such, given that fuel is major input to most sectors, we expect the high prices to weigh on the inflation basket in the short term,
- Elevated food prices-This was evidenced by the 13.8% y/y increase in the prices of food and non-alcoholic beverages as of December 2022 attributable to high costs of input products such as fertilizers experienced in 2022 exacerbated by supply chain constraints emanating from the Russian invasion in Ukraine given that the two countries are major producers of fertilizers. Additionally, the erratic weather conditions experienced in the first half of 2022 across the country impeded agricultural production, resulting to high food prices. Given that the index constitute 32.9% of the inflation basket, we expect the resulting high food prices to exert pressure on the inflation rate, and,
- Higher electricity prices- Kenya’s price of electricity increased by 15.0% in January 2023 as the current administration reversed the former President’s electricity subsidy program, which lapsed at the end of 2022, noting that the subsidy program was unsustainable and was exerting pressure on the country’s expenditure. As such, we expect the move to increase the cost of production and thus increase the prices of commodities.
Going forward, we anticipate inflation to remain elevated in the short term but ease gradually driven by high fuel and food prices, given that the current administration’s plans to do away with the subsidies on fuel to ease pressure on expenditure. Also, the unfavorable weather conditions experienced in the first half of 2022 undermined agricultural production and translated into high food prices. However, we expect the measures taken by current administration to subsidize major inputs of agricultural production such as fertilizers to contribute to the easing of inflation in the long term, as they would take time to translate into a decline in food prices. Additionally, the continued monetary tightening by the MPC by 50.0 bps to 8.75% from 8.25% in November 2022, which we expect to be raised further by 25.0 bps in the January 2023 to 9.00% will anchor the elevated inflation to the government’s target range of 2.5%-7.5%.
Rates in the Fixed Income market have remained relatively stable due to the relatively ample liquidity in the money market. The government is 4.8% behind its prorated borrowing target of Kshs 340.4 bn having borrowed Kshs 324.0 bn of the Kshs 581.7 bn domestic borrowing target for the FY’2022/2023. We expect sustained gradual economic recovery as evidenced by the revenue collections of Kshs 987.9 bn in the FY’2022/2023 as at the end of December, equivalent to a 46.1% of its annual target of Kshs 2.1 tn, and 92.3% of its prorated target of Kshs 1.1 tn. Despite the performance, we believe that the projected budget deficit of 6.2% is relatively ambitious given the downside risks and deteriorating business environment occasioned by high inflationary pressures. We however expect the support from the IMF and World Bank to ease the need for elevated borrowing and thus help maintain a stable interest rate environment since the government is not desperate for cash. Owing to this, our view is that investors should be biased towards short-term fixed-income securities to reduce duration risk.
In 2022, the Kenyan equities market was on a downward trajectory with NASI, NSE 20 and NSE 25 declining by 23.7%, 12.4% and 16.6%, respectively. Large cap decliners in 2022 included Safaricom, Bamburi, KCB Group, Diamond Trust Bank (DTB-K) and Equity Group of 36.7%, 17.5%, 16.4%, 16.0% and 15.6%, respectively. The performance during the year was mainly attributable to increased sell offs by foreign investors as they exited the market. Additionally, interest rate hikes in developed economies such as United States caused dollar investments to be more appealing and thus lowering their appetite for risky investments in emerging markets such as Kenya.
Following the poor performance in the equities market in 2022, the market valuation closed the year at a price to earnings ratio (P/E) of 6.7x, 42.0% lower than the 11.5x recorded at the end of 2021 and 47.0% below the 12-year historical average of 12.6x. On the other hand, the equities market closed the year at a dividend yield of 6.6%, 2.5% points above the historical average of 4.1%. Additionally, equities turnover declined by 36.5% to USD 0.8 bn, from USD 1.3 bn recorded in FY’2021. Foreign investors remained net sellers, with a net outflow of USD 204.3 mn, compared to net outflows of USD 91.9 mn recorded in 2021. The year also saw 11 companies issuing profit warnings in 2022, as compared to 4 companies in 2021. The increase in number of companies that issued profit warnings in 2022 highlights the tough macro-economic environment occasioned by continued ripple effects of COVID-19 as well as the disruption of the global supply chain due to the ongoing Ukraine-Russia conflict which has led to high cost of production and consequently reduced consumer demand. Key to note, companies are required to issue profit warnings if they project a more than 25.0% decline in profits year-on-year. For more information, see our Cytonn Annual Markets Review-2022.
Kenyan 2023 Equities Outlook
In 2023, we project the following factors to affect the direction of the Kenyan equities market:
- Corporate Earnings Growth: We expect a slight improvement in the listed sector’s earnings growth in 2023, largely driven by the continued improvement in the country’s business environment. The improvement is evidenced by an average Purchasing Manager’s Index (PMI) of 51.1 for the last four months of 2022 which is expected to raise growth prospects. Additionally, the growth in Corporate Earnings is expected to be boosted by the successful expansion of operations into Ethiopian telecommunication industry by Safaricom, which currently controls 48.3% the entire bourse as of 27th January 2023. Further, we anticipate growth in the banking sector’s earnings as a result of expected increase in lending with the continued adoption of risk-based lending as well as revenue diversification strategies by banks. Notably, credit risk has also gradually eased with the industry’s non-performing loan ratio declining by 1.0% points to 13.7% in Q3’2022 from 14.7% in Q2’2022;
- Attractive valuations: The market valuations remained below the historical average, with NASI closing the year at a price to earnings ratio (P/E) of 6.7x, 47.0% below the 12-year historical average of 12.6x, and a dividend yield of 6.6%, 1.5% points above the historical average of 4.1%. Given these cheap valuations, we expect investors to take advantage of this and buy into the market;
- Capital Markets Investor Sentiment: We expect the equities market to register muted foreign interest in 2023, attributable to the uncertainties in the Kenyan macro-economic conditions occasioned by the elevated inflationary pressures. This resulted in high capital flights in 2022 as investors sought less risky investments such as government papers and other investment alternatives. On the flipside, we believe pockets of value still exist in the equities market due to the attractive valuations, with NASI trading 49.5% below its historical average;
- Diversification of Capital Markets and New Listings: We expect a number of activities to be undertaken by NSE in 2023 such as increasing the number of Single Stock Futures traded on the derivatives market. Currently, the bourse offers 6 Single Stock Futures namely Safaricom Plc, Kenya Commercial Bank Group Plc, Equity Group Holdings Plc, East African Breweries Ltd, ABSA Bank Kenya and British American Tobacco Plc. Additionally, we expect increased listing with the current administration in September 2022 announcing a target of 10 listings in one year. It is our view that the initiative to increase the number of listings would result in; (i) increased liquidity in the market by increasing the volume of securities available for trading, and, (ii) improved depth in the capital market by increasing product offerings at the exchange, consequently attracting investors;
- Monetary Policy Direction: In 2022, the Monetary Policy Committee (MPC) met 6 times, where they maintained the Central Bank Rate (CBR) at 7.00% and the Cash Reserve Ratio of 4.25% in the first two of the meetings of January and March 2022. However, the MPC raised the CBR rate by 50.0 and 75.0 basis points (bps) to 7.50% and 8.25% in May 2022 and September 2022, respectively. Further, the MPC hiked the CBR by an additional 50.0 bps to 8.75% in latest meeting in November 2022 in a bid to anchor inflation which is currently above the government’s target range of 2.5% - 7.5%. We expect the MPC to continue raising the CBR rates in the medium term in a bid to stabilize inflation within the government’s target range and also anchor the Kenyan shilling from further depreciation after recording a 9.0% depreciation in 2022. An increase in the CBR will result in higher yields in the fixed income market, which will in turn make government bonds more attractive compared to equities. An increase in the CBR will also result in lower liquidity in the market, leaving investors with less disposable income to invest.
Below, we summarize the metrics used in coming up with our 2023 Equities Outlook;
|
Equities Market Indicators |
Outlook for 2023 |
Current View |
|
Macro-Economic Environment |
· We expect the economy to grow at a slower pace given the gradual improvement in the general business environment in the country which has been dented by the elevated inflationary pressures occasioned by high fuel and food prices. Additionally, the Central Bank of Kenya’s Monetary Policy Committee decision to hike the Central Bank Rate (CBR) in a bid to curb inflation and maintain price stability is expected to curtail economic growth · Further, we expect the Agricultural sector to remain subdued largely due to erratic weather conditions. However, we expect the sector to be supported by the long rains witnessed across the country at the end of the year, coupled with recent fiscal policies such as subsidizing costs of crucial farm inputs such as fertilizers that will enhance growth in the sector |
Neutral |
|
Corporate Earnings Growth |
· We expect a slight improvement in the listed sector’s earnings growth in 2023, largely driven by the continued improvement in the country’s business environment. Corporate earnings growth is projected to come in at 10.6% for 2023 compared to the projected 7.8% growth in 2022, · Additionally, the growth in Corporate Earnings is expected to be boosted by the successful expansion of operations into Ethiopian telecommunication industry by Safaricom, which continues to control the largest bourse in the Nairobi Stock Exchange, · Further, we anticipate growth in the banking sector’s earnings as a result of expected increase in lending with the continued adoption of risk-based lending as well as revenue diversification strategies by banks |
Neutral |
|
Valuations |
· With the market closing the year 2022 at a P/E of 6.7x, and having an expected earnings growth of 10.6% in 2023, it is currently trading at a Forward P/E of 8.7x. This represents a potential upside of 32.2% compared to historical levels |
Positive |
|
Investor Sentiment and Security |
· We expect the equities market to register muted foreign interest in 2023, attributable to the uncertainties in the Kenyan macro-economic conditions occasioned by the elevated inflationary pressures. This caused high capital flights in 2022 as investors sought less risky investments such as government papers and other investment alternatives · On the flipside, we believe pockets of value still exist in the equities market due to the attractive valuations, with NASI trading 49.5% below its historical average |
Negative |
Out of the four metrics that we track, two have a “neutral” and one a “positive” outlook while one also a has a “negative”. Compared to 2022, we have maintained our positive outlook on the valuations of the market. In consideration of the above, we have a ‘’NEUTRAL” outlook on the Kenyan Equities market in the short term. However, we maintain our bias towards a “BULLISH” equities markets in the medium to long term, with the expectations of a slower growth in corporate earnings and the cheap valuations currently in the market.
Weekly Market Performance
During the week, the equities market recorded mixed performance, with NASI and NSE 25 gaining by 1.4% and 0.7%, respectively, while NSE 20 declined by 0.6%, taking the YTD performance to losses of 1.0% and 0.1% for NASI and NSE 20, while NSE 25 remained relatively unchanged. The equities market performance was mainly driven by gains recorded by large cap stocks such as Safaricom, EABL, Co-operative Bank and Standard Chartered Bank of Kenya (SCBK) of 3.1%, 2.1%,1.6% and 1.3% respectively. The gains were however weighed down by losses recorded by large cap stocks such as NCBA, Bamburi and Equity Group of 3.4%, 3.0% and 1.3%, respectively.
During the week, equities turnover declined by 77.2% to USD 8.4 mn from USD 37.0 mn recorded the previous week, taking the YTD turnover for the equities market to USD 61.0 mn. Additionally, foreign investors turned net buyers, with a net buying position of USD 0.4 mn, from a net selling position of USD 20.1 mn recorded the previous week, taking the YTD net selling position to USD 23.2 mn.
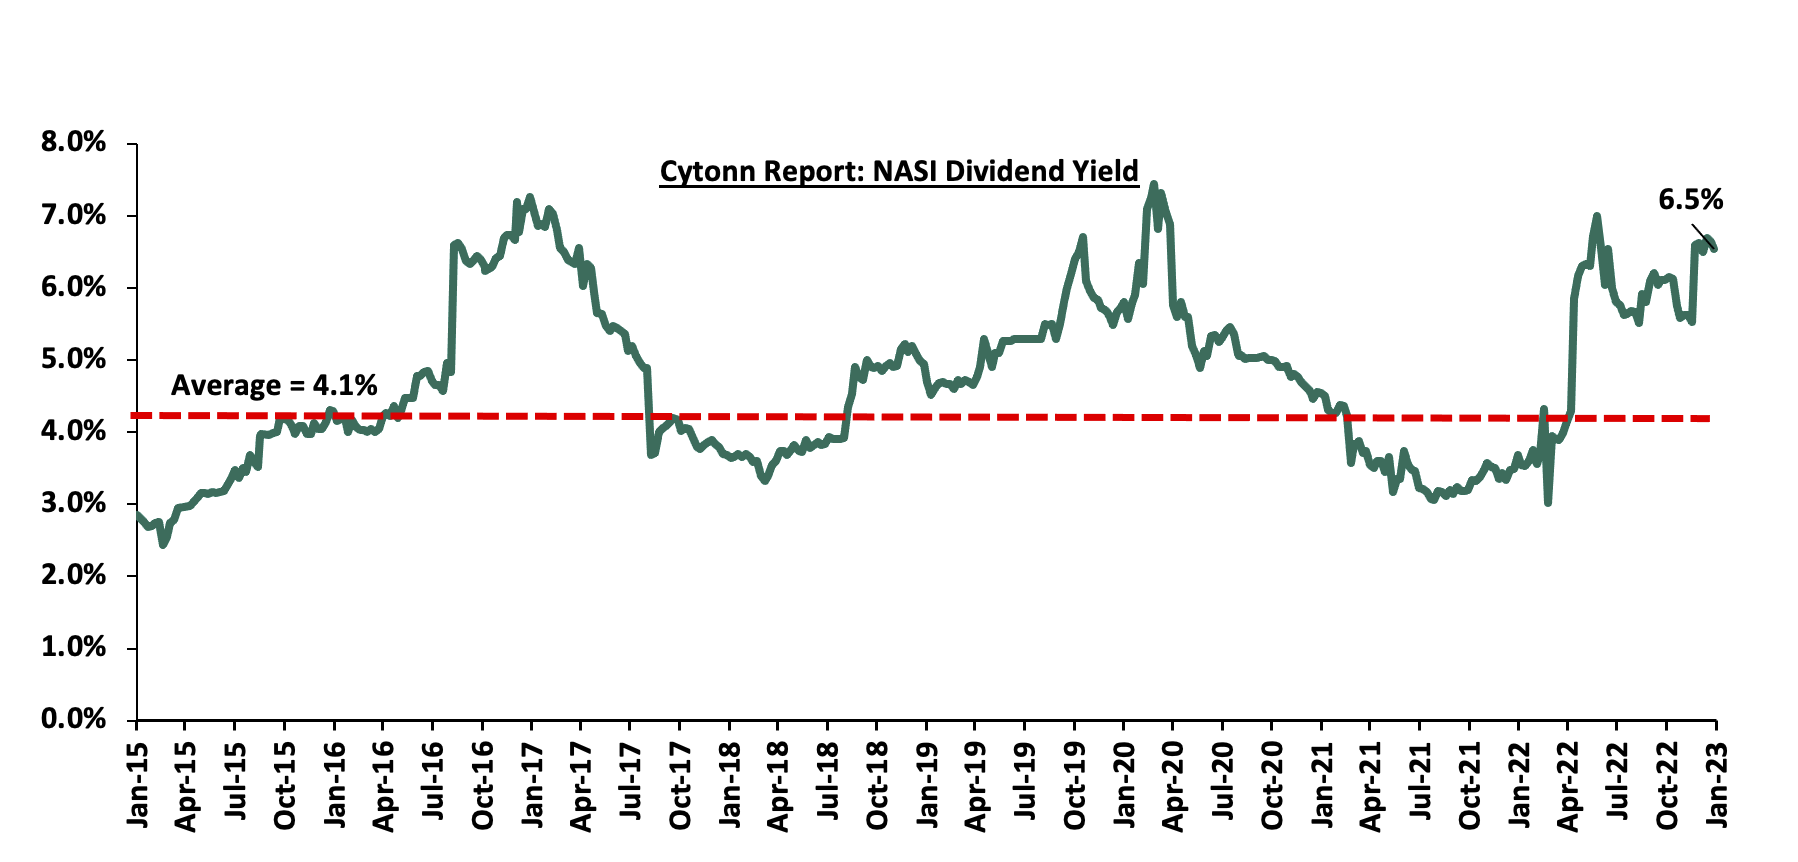
The market is currently trading at a price to earnings ratio (P/E) of 6.3x, 49.5% below the historical average of 12.5x, and a dividend yield of 6.5%, 2.4% points above the historical average of 4.1%. Key to note, NASI’s PEG ratio currently stands at 0.8x, an indication that the market is undervalued relative to its future growth. A PEG ratio greater than 1.0x indicates the market may be overvalued while a PEG ratio less than 1.0x indicates that the market is undervalued. The charts below indicate the historical P/E and dividend yields of the market;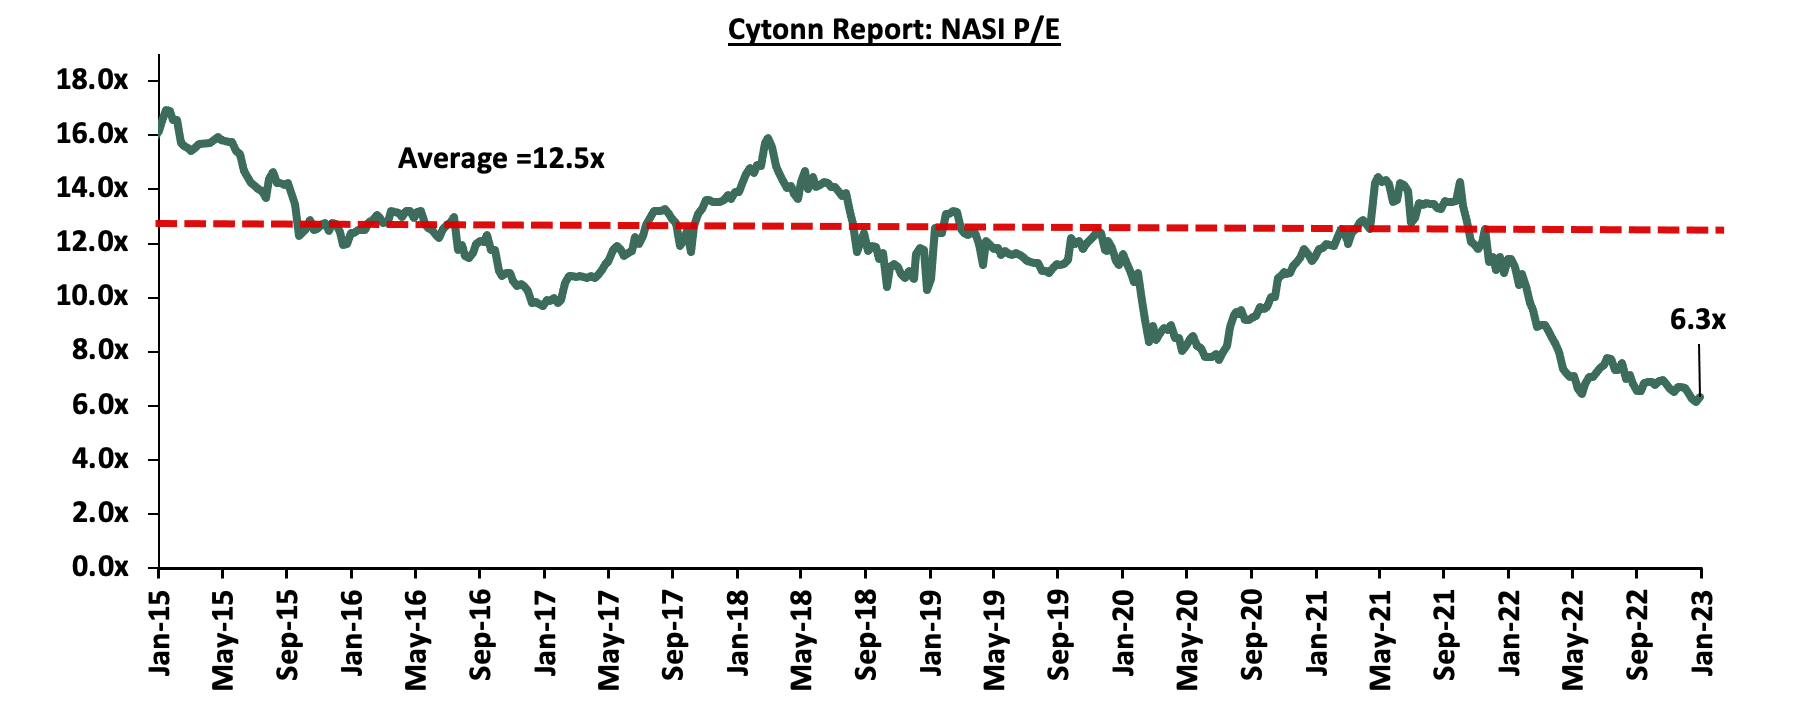
Source: Bloomberg
Source: Nairobi Stock Exchange
Weekly Highlight:
East African Breweries Plc (EABL) H1’2023 Financial Performance
During the week, East African Breweries Plc (EABL) released their H1’2023 financial results for the period ending 31st December 2022, recording a stagnation in the Profits After Tax (PAT) at Kshs 8.7 bn as was recorded in a similar period last year. The stagnation was mainly attributable to a 13.0% increase in Indirect Taxes to Kshs 47.4 bn in H1’2023, from Kshs 41.9 bn in H1’2022 that offset the 8.1% growth in Gross Sales to Kshs 104.7 bn in H1'2023 from Kshs 96.8 bn in H1'2022. The tables below show the breakdown of the Group’s financial performance;
|
Cytonn Report: East African Breweries Plc (EABL) Summarized Income Statement |
|||
|
Income Statement |
H1'2022 |
H1'2023 |
Y/Y Change |
|
Kshs (bn) |
Kshs (bn) |
||
|
Gross Sales |
96.8 |
104.7 |
8.1% |
|
Indirect Taxes |
(41.9) |
(47.4) |
13.0% |
|
Net Revenue |
54.9 |
57.3 |
4.3% |
|
Cost of Sales |
(28.4) |
(30.7) |
8.0% |
|
Gross Profit |
26.5 |
26.6 |
0.3% |
|
Operating Costs |
(11.4) |
(11.3) |
(0.5%) |
|
Net Finance Costs |
(2.2) |
(2.4) |
7.8% |
|
Profit Before Income Tax |
12.9 |
12.9 |
(0.2%) |
|
Income Tax Expenses |
(4.1) |
(4.2) |
0.3% |
|
Profit After Tax |
8.7 |
8.7 |
(0.4%) |
|
Earnings Per Share-Annualized |
16.9 |
17.3 |
2.1% |
Source: East African Breweries Plc (EABL) H1’2023 financial statements
|
Cytonn Report: East African Breweries Plc (EABL) Summarized Balance Sheet |
|||
|
Balance Sheet |
H1'2022 |
H1'2023 |
Y/Y Change |
|
Kshs (bn) |
Kshs (bn) |
||
|
Current Assets |
35.4 |
45.4 |
28.1% |
|
Non-Current Assets |
75.0 |
80.2 |
6.9% |
|
Total Assets |
110.4 |
125.6 |
13.7% |
|
Short term borrowings |
6.6 |
13.3 |
100.7% |
|
Other Current Liabilities |
35.2 |
41.7 |
18.5% |
|
Total Current Liabilities |
41.8 |
55.0 |
31.5% |
|
Long term Borrowings |
35.2 |
35.1 |
(0.1%) |
|
Other Non-Current Liabilities |
7.0 |
7.3 |
4.8% |
|
Total Non-Current Liabilities |
42.2 |
42.5 |
0.7% |
|
Total Liabilities |
84.0 |
97.5 |
16.0% |
|
Total Equity |
26.4 |
28.1 |
6.2% |
Source: East African Breweries Plc (EABL) H1’2023 financial report
Key take outs from the financial performance include;
- Net revenue increased by 4.3%, Kshs 57.3 bn in H1’2023, from Kshs 54.9 bn recorded in H1’2022, mainly driven by improved brand mix and pricing. Notably, Uganda and Tanzania subsidiaries recorded strong growth at 19.0% and 11.0% increase in net revenue, respectively while Kenyan net revenue declined by 1.0% as volume of sales reduced as a result of increase in excise duty tax during the period,
- Indirect Taxes increased significantly by 13.0% to Kshs 47.4 bn, from Kshs 41.9 bn attributable to multiple increases in excise duty taxes in Kenya during the period of review,
- Cost of sales increased by 8.0% to Kshs 30.7 bn, from Kshs 28.4 bn in H1’2022, mainly attributable to increased cost of inputs occasioned by heightened inflationary pressures at 9.1% in December 2022 as compared to 5.7% in the same period in 2021,
- The Group’s short term borrowing increased significantly by 100.7% to Kshs 13.3 bn, from Kshs 6.6 bn recorded in H1’2022, mainly attributable increased short term loans aimed at supporting the working capital as well as to cater for amortization of long term borrowings, and,
- Annualized Earnings per share increased by 2.1% to Kshs 17.3, from Kshs 16.9 in H1’2022, largely driven by a 3.9% increase in total comprehensive income attributable to equity holders to Kshs 7.9 bn, from Kshs 7.6 bn in H1’2022. Additionally, the board of directors has recommended an interim dividend of Kshs 3.75 per share expected to be paid by 28th April 2023.
Despite the challenging macroeconomic environment arising from elevated inflationary pressures couple with the government’s decision to increase excise taxes over the last 15 months, EABL has continued to display strong financial performance as evidence by the Profit After Tax (PAT) of Kshs 8.7 bn in H1’2023 as well as the 2.1% increase earnings per share in H1’2022. Going forward, we expect the volume of sales to drop in Kenya as a result of the high excise duty taxes that will weigh down on the Group’s overall performance and profitability. However, the Group’s announcement of an interim dividend of Kshs 3.75 per share for the period ending 31st December 2022 is expected to boost investors’ confidence in the Group’s stock. Further this comes at the time when Diageo Kenya has received requisite regulatory approvals for its proposed acquisition of an additional 15.0% stake in EABL to bring its shareholding to 65.0%, through a tender to minority shareholders. The Group announced that the tender offer will open on 6th February 2023 with transfer and settlement of shares expected to commence by 11th April 2023. The move reflects the strategic importance of EABL to the Group, having announced it will purchase each share at Kshs 192.0 which represents a 11.6% premium on the current share price of Kshs 172.0 as of 27th January 2023.
Universe of coverage:
|
Company |
Price as at 13/01/2023 |
Price as at 20/01/2023 |
w/w change |
YTD Change |
Target Price* |
Dividend Yield |
Upside/ Downside** |
P/TBv Multiple |
Recommendation |
|
Jubilee Holdings |
196.3 |
194.3 |
(1.0%) |
(2.3%) |
305.9 |
0.5% |
58.0% |
0.4x |
Buy |
|
Kenya Reinsurance |
1.8 |
1.8 |
0.0% |
(3.7%) |
2.5 |
5.6% |
45.0% |
0.1x |
Buy |
|
KCB Group*** |
38.4 |
38.5 |
0.3% |
0.4% |
52.5 |
7.8% |
44.1% |
0.6x |
Buy |
|
Sanlam |
8.3 |
8.3 |
0.0% |
(12.9%) |
11.9 |
0.0% |
42.8% |
0.9x |
Buy |
|
Liberty Holdings |
4.8 |
4.8 |
(0.6%) |
(4.8%) |
6.8 |
0.0% |
40.6% |
0.4x |
Buy |
|
ABSA Bank*** |
12.3 |
12.5 |
1.2% |
2.0% |
15.5 |
12.0% |
36.1% |
1.1x |
Buy |
|
Britam |
5.4 |
5.2 |
(2.2%) |
0.8% |
7.1 |
0.0% |
35.9% |
0.9x |
Buy |
|
Equity Group*** |
46.0 |
45.4 |
(1.3%) |
0.8% |
58.4 |
6.6% |
35.1% |
1.1x |
Buy |
|
I&M Group*** |
17.1 |
17.0 |
(0.6%) |
(0.3%) |
20.8 |
8.8% |
31.3% |
0.4x |
Buy |
|
Co-op Bank*** |
12.4 |
12.6 |
1.6% |
4.1% |
15.5 |
7.9% |
30.7% |
0.7x |
Buy |
|
NCBA*** |
38.3 |
37.0 |
(3.4%) |
(5.0%) |
43.4 |
11.5% |
28.8% |
0.8x |
Buy |
|
CIC Group |
1.9 |
1.9 |
(1.0%) |
(1.0%) |
2.3 |
0.0% |
22.8% |
0.7x |
Buy |
|
Diamond Trust Bank*** |
51.3 |
51.3 |
0.0% |
2.8% |
57.1 |
5.9% |
17.3% |
0.2x |
Accumulate |
|
Standard Chartered*** |
155.0 |
157.0 |
1.3% |
8.3% |
166.3 |
3.8% |
9.7% |
1.1x |
Hold |
|
Stanbic Holdings |
111.8 |
112.0 |
0.2% |
9.8% |
112.0 |
8.0% |
8.0% |
1.0x |
Hold |
|
HF Group |
3.1 |
3.3 |
4.8% |
4.1% |
3.4 |
0.0% |
4.6% |
0.2x |
Lighten |
|
*Target Price as per Cytonn Analyst estimates **Upside/ (Downside) is adjusted for Dividend Yield ***For Disclosure, these are stocks in which Cytonn and/or its affiliates are invested in |
|||||||||
We are “Neutral” on the Equities markets in the short term due to the current adverse operating environment and huge foreign investor outflows, and, “Bullish” in the long term due to current cheap valuations and expected global and local economic recovery.
With the market currently trading at a discount to its future growth (PEG Ratio at 0.8x), we believe that investors should reposition towards value stocks with strong earnings growth and that are trading at discounts to their intrinsic value. We expect the current high foreign investors sell-offs to continue weighing down the economic outlook in the short term.
In 2022, the general Real Estate sector witnessed considerable growth in activity in terms of property transactions and development activities. Property selling and rental prices also continued to soar, driven by continued inflationary pressures on the back of supply chain disruptions, and a weakened shilling against the United States dollar that saw a rise in costs of construction materials. Consequently, the Real Estate Sector in Q3’2022 grew by 5.1%, 2.0% points slower than the 7.1% growth recorded in Q3’2021 when the economy was recovering from the impacts of COVID-19 pandemic, according to the Quarterly GDP Report Q3’2022 by the Kenya National Bureau of Statistics’ (KNBS).
The graph below shows Real Estate sector growth rates from 2016 to Q3’2022;
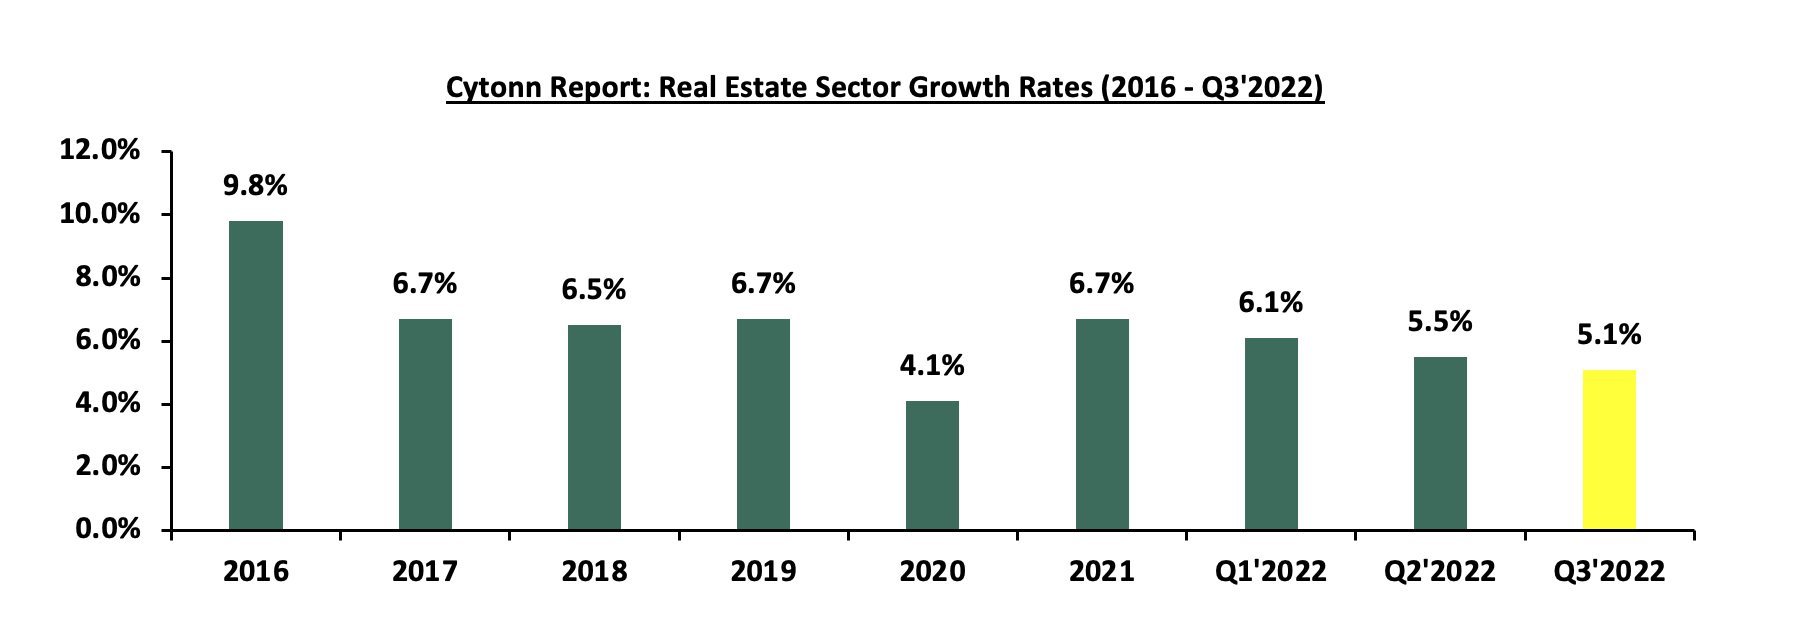
Source: Kenya National Bureau of Statistics (KNBS)
In terms of performance in the Nairobi Metropolitan Area (NMA), the Residential, Commercial Office, Retail, Hospitality, and Mixed-Use Development sectors realized average rental yields of 5.1%, 7.6%, 7.9%, 6.2%, and 7.4%, respectively in FY’2022. This resulted to an overall rental yield of 6.8%, 0.3% points higher than the 6.5% recorded in FY’2021. The table below is a summary of thematic performance of average rental yields in FY’2022 compared to FY’2021;
|
Cytonn Report: Real Estate Thematic Average Rental Yields Y/Y Summary |
|||
|
Theme |
Rental Yield FY’2021 |
Rental Yield FY’2022 |
Y/Y Change |
|
Retail |
7.8% |
7.9% |
0.1% |
|
Commercial Office |
7.1% |
7.6% |
0.5% |
|
Mixed-use Developments (MUDs) |
7.2% |
7.4% |
0.2% |
|
Hospitality |
5.5% |
6.2% |
0.7% |
|
Residential |
4.8% |
5.1% |
0.3% |
|
Grand Average |
6.5% |
6.8% |
0.4% |
Source: Cytonn Research
We had a NEUTRAL outlook for the Real Estate sector in 2022 supported by factors such as; i) continued launch and implementation of various infrastructure projects, ii) aggressive expansion efforts by retailers, iii) focus by the government and private sector to provide affordable housing, iv) provision of long-term, low-interest home loans to potential buyers by the Kenya Mortgage Refinance Company (KMRC), v) increased mergers and acquisitions in the hospitality sector, and, vi) positive demographics promoting demand for Real Estate developments. However, factors such as; i) prevailing inflationary pressure from local and external shocks, ii) limited credit access partly due to the rising non-performing loans in the property sector, iii) low absorption of physical space due to the continued oversupply in the commercial office and retail sectors, iv) uncoordinated land use due to lack of proper urban planning, and, v) subdued growth of the Real Estate Investment Trusts (REITs) market continued to impede the optimal performance of the sector. For a detailed review of the sector’s performance during 2022, see our Cytonn Annual Markets Review - 2022.
In 2023, we expect the key drivers of Real Estate to be as follows:
- Infrastructural development: The government has continued to launch and implement various infrastructure projects, with an aim of improving the country’s economic status, as well as positioning Kenya as a regional hub. This is expected to enhance performance of the sector by opening up areas for Real Estate development,
- Affordable housing initiative: There has been an ongoing focus by the government and private sector to provide decent housing to Kenyans through the Affordable Housing Program (AHP). Currently, the AHP pipeline boasts about 30 affordable housing projects, with an estimated target of 200,000 units to be delivered per year,
- Focus on mortgage financing: The Kenya Mortgage Refinance Company (KMRC) has continued to advance its efforts to make home ownership more accessible to Kenyans by providing long-term, low-interest home loans to potential home buyers. To source funding, KMRC issued the first tranche of its Kshs 10.5 bn Medium Term Note (MTN) in February 2022, aiming to raise Kshs 1.4 bn, which recorded an oversubscription of 478.6%. This was attributable to the attractive returns offered by the bond of 12.5%, receiving bids worth Kshs 8.1 bn, of which KMRC only accepted bids worth Kshs 1.4. bn. The company intends to issue the subsequent tranches over the years, so as to expand its lending to Kenyan home buyers, which stood at Kshs 1.3 bn in 2021,
- Recovery of the hospitality sector: The hospitality sector has seen various mergers and acquisitions, signifying investor appetite and confidence in a bid to gain market dominance coupled by the recovery of the sector away from the pandemic lockdowns. Driven by the sector’s gradual recovery away from the slowdown that was caused by pandemic lockdowns and travel restrictions, these expansionary efforts will continue to boost the performance of the sector,
- Aggressive expansion in the retail sector: The sector has seen rapid expansion efforts by both local and international retailers such as Naivas, Carrefour and Quickmart, among others, in a bid to increase their share of the market and ensure dominance, as Kenya’s formal retail penetration stands at approximately 30.0% according to the Nielsen Report, and,
- Positive demographics: Kenya has relatively high urbanization and population growth rates averaging 3.7% and 1.9% compared to the global averages of 1.6% and 0.9%, respectively, according to the World Bank as of 2021. This will continue to provide sustained demand for more housing units in the country.
Despite the above drivers, the sector is expected to be constrained by the following factors in 2023:
- Increasing construction costs: Rising construction costs as a result of prolonged inflationary pressure and supply chain shortages continue to hamper optimum development activities in the Real Estate sector. Consequently, the consumption of cement declined by 14.7% to 2.2 mn metric tonnes in Q3’2022, from 2.6 mn metric tonnes realized in Q3’2021,
- Constrained financing to developers: Lenders continue to tighten their lending requirements and demand more collateral from developers as a result of the high credit risk in the real estate sector. This is evidenced by a 9.2% increase in gross non-performing loans in the sector to Kshs 75.6 bn in Q3’2022 from Kshs 69.2 bn recorded during the same period in 2021,
- Underdeveloped capital markets: It is difficult to develop pools of capital focused on projects, particularly in the private markets, to supplement government efforts in providing housing. Banks in Kenya are the primary source of funding for real estate developers, providing nearly 99.0% of funding as opposed to 40.0% in developed countries. This means that capital markets contribute only 0.1% of Real Estate development funding, compared to 60.0% in developed countries,
- Uncoordinated development: In many urban areas, a lack of urban planning has resulted in uncoordinated land use, with the proliferation of large, sprawling developments that are not connected to public transportation, water supply, and other services,
- Oversupply in select sectors: The existing oversupply of physical space in select sectors, with approximately 6.7 mn SQFT in the NMA commercial office market, approximately 3.0 mn SQFT in the NMA retail market, with the rest of the Kenyan retail market having an oversupply of approximately 1.7 mn SQFT, continues to be a challenge for the Real Estate sector in the respective themes, and,
- Subpar performance of listed Real Estate: With just one REIT listed on the Nairobi Securities Exchange (NSE), the Kenyan REITs market has remained subdued. This is largely as a ‘result of the large minimum capital requirements, prolonged approval process, scant investor knowledge, and only a few entities capable of incorporating REITs.
The table below summarizes our outlook on the various Real Estate themes and the possible impact on the business environment in 2023;
Thematic Performance Review and Outlook
|
Cytonn Report: Thematic Performance Review and Outlook |
|||
|
Theme |
2022 Performance |
2023 Outlook |
Effect |
|
Residential Sector |
|
|
Neutral |
|
Commercial Office Sector |
|
|
Neutral |
|
Retail Sector |
|
|
Neutral |
|
Hospitality Sector |
|
|
Neutral |
|
Land Sector |
|
|
Positive |
|
Infrastructure Sector |
|
|
Neutral |
|
Listed Real Estate |
|
|
Negative |
With 1 theme having a positive outlook, 5 neutral and 1 being negative, the general outlook for the sector therefore is NEUTRAL. The sector’s performance will be supported by; i) infrastructural development, ii) government and private sector focus on affordable housing, iii) focus on mortgage financing through the KMRC, iv) improved investor confidence amid recovery of the hospitality sector, v) aggressive expansion by both local and international retailers in a bid to maintain market dominance, and, vi) Kenya's positive demographics driving housing demand. However, factors such as increased construction costs on the back of inflation, constrained financing to developers with increased underdeveloped capital markets, oversupply in select sectors and low of investor appetite in Real Estate Investments Trusts (REITs) are expected to continue impeding performance of the sector.
For the detailed real estate market outlook report, see our Real Estate Sector 2023 Markets Outlook Note.
Key Highlights during the Week:
- Residential Sector
During the week, President William Ruto presided over the ground breaking ceremony of the Kshs 10.0 bn Shauri Moyo A Affordable Housing Project which sits on an 8.0-acre piece of land in Shauri Moyo, Nairobi County. The launch comes after the setting aside of 3,000 acres of Nairobi County public land for the Affordable Housing Programme (AHP) in November 2022. The newly commissioned flagship project was initially designed to consist of a total of 2,731 housing units incorporating three typologies set within 16 storeys. The project is set to be developed as a mixed-use development with residential units, and social common amenities such as a retail spaces, kindergarten and a public park, to be rolled out in two phases. Construction will be spearheaded by Epco Builders, a local construction firm based in Kenya under a Public Private Partnership (PPP). President William Ruto, however, during the ground breaking ceremony directed the Housing and Planning Permanent Secretary Charles Hinga to have the design changed to 25 storeys to accommodate more residents, in line with the issue of land scarcity in Nairobi. Furthermore, the president directed that upon completion, tenants will benefit from a rent-to-own scheme for 50.0% of the houses in the project, requiring a payment of no more than Kshs 7,000 per month over the course of 10 to 15 years, allowing them to eventually own the home. Following the proposed design changes, the details of the new number of units and whether the floor areas will remain unchanged still remains unknown. The table below highlights the project details as per the initial design plan;
|
Cytonn Report: Shauri Moyo Affordable Housing Project, Nairobi |
|||||
|
Phases |
Typologies |
No. of Units |
Floor Area (SQM) |
Provisional Price (Kshs) |
Price Per SQM |
|
Shauri Moyo A |
1 Bedroom |
480 |
30 |
1,500,000 |
50,000 |
|
2 Bedroom |
706 |
40 |
2,000,000 |
50,000 |
|
|
3 Bedroom |
528 |
60 |
3,000,000 |
50,000 |
|
|
Shauri Moyo B |
1 Bedroom |
45 |
33 |
1,550,000 |
46,970 |
|
2 Bedroom |
636 |
40 |
2,000,000 |
50,000 |
|
|
3 Bedroom |
336 |
60 |
3,000,000 |
50,000 |
|
|
Average |
44 |
2,175,000 |
49,495 |
||
|
Total |
2,731 |
||||
Source: State Department for Housing and Urban Development (SDHUD)
The Shauri Moyo project is the third of the President’s affordable housing projects launched in Nairobi City County under the Affordable Housing Programme (AHP), after Mukuru Kwa Njenga and Kibera Soweto B projects in October 2022, placing the county at the foreground of the initiative. The project is scheduled to be completed in 24 months after ground breaking, and joins the line of ongoing projects meant to provide descent, quality and affordable housing to residents in support of the government’s vision of constructing 200,000 units annually. The projects in the AHP pipeline include;
|
Cytonn Report: Notable Ongoing Affordable Housing Projects by the Government |
|||
|
Name |
Developer |
Location |
Number of Units |
|
Pangani Affordable Housing Program |
National Government and Tecnofin Kenya Limited |
Pangani |
1,562 |
|
River Estate Affordable Housing Program |
National Government and Erdemann Property Limited |
Ngara |
2,720 |
|
Park Road Affordable Housing Program |
National Housing Corporation |
Ngara |
1,370 |
|
Mukuru Affordable Housing Program |
National Housing Corporation |
Mukuru kwa Njenga, Enterprise Road |
15,000 |
|
Mavoko Affordable Housing Project |
National Government and Epco Builders |
Syokimau, Machakos County |
5,360 |
|
NHC Stoni Athi View (Economy Block-Rental) |
National Housing Corporation |
Athi River, Machakos County |
50 |
|
NHC Stoni Athi View |
National Housing Corporation |
Athi River, Machakos County |
120 |
|
Mariguini Informal Settlement |
National Government |
Starehe, Nairobi County |
2,600 |
|
Kibera Soweto East Zone B |
National Government |
Kibera, Nairobi County |
3,000 |
|
Starehe Affordable Housing Project |
National Government and Tecnofin Kenya Limited |
Starehe, Nairobi County |
3,000 |
|
Kings Boma Estate |
National Government and Kings Developers Limited |
Gitabaya Estate, Kiambu County |
1,050 |
|
Clay City Project |
Housing Finance Development and Investment and Clay Works Limited |
Kasarani, Thika Road |
5,200 |
|
Bachelors Jevanjee Estate |
County Government of Nairobi and Jabavu Village |
Ngara |
1,800 |
|
Kings Serenity |
National Government and Kings Developers Limited |
Ongata Rongai, Kajiado |
720 |
|
Shauri Moyo |
State Department for Housing and Urban Development |
Shauri Moyo |
2,731 |
|
Total |
46,283 |
||
Source: Boma Yangu
Upon completion, the above government AHP projects, in conjunction with projects by private developers, are expected to play a crucial role in the Real Estate sector by: i) curbing Kenya’s 80.0% annual housing deficit by providing descent, affordable homes, and, ii) boosting home ownership rates especially in urban areas which have remained low at 21.3% as at 2020, compared to other African countries such as South Africa and Ghana with a 53.0% and 47.2% as shown below;
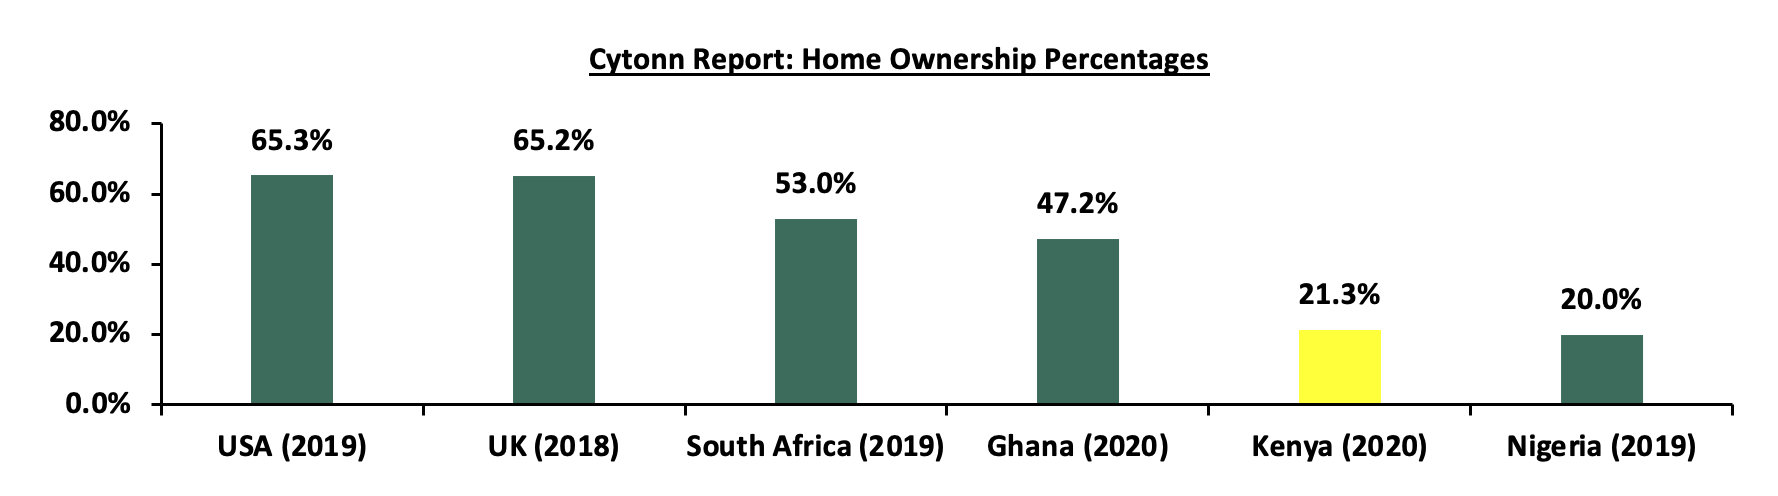
Source: Federal Reserve Bank, Centre for Affordable Housing Finance (CAHF)
- Real Estate Investment Trusts (REITs)
In the Nairobi Securities Exchange, ILAM Fahari I-REIT closed the week trading at an average price of Kshs 6.3 per share. The performance represented a 0.9% decline from Kshs 6.4 per share recorded the previous week, taking it to a 7.1% Year-to-Date (YTD) decline from Kshs 6.8 per share recorded on 3rd January 2023. In addition, the performance represented a 68.5% Inception-to-Date (ITD) loss from the Kshs 20.0 price. The dividend yield currently stands at 7.9%. The graph below shows Fahari I-REIT’s performance from November 2015 to 27th January 2023;
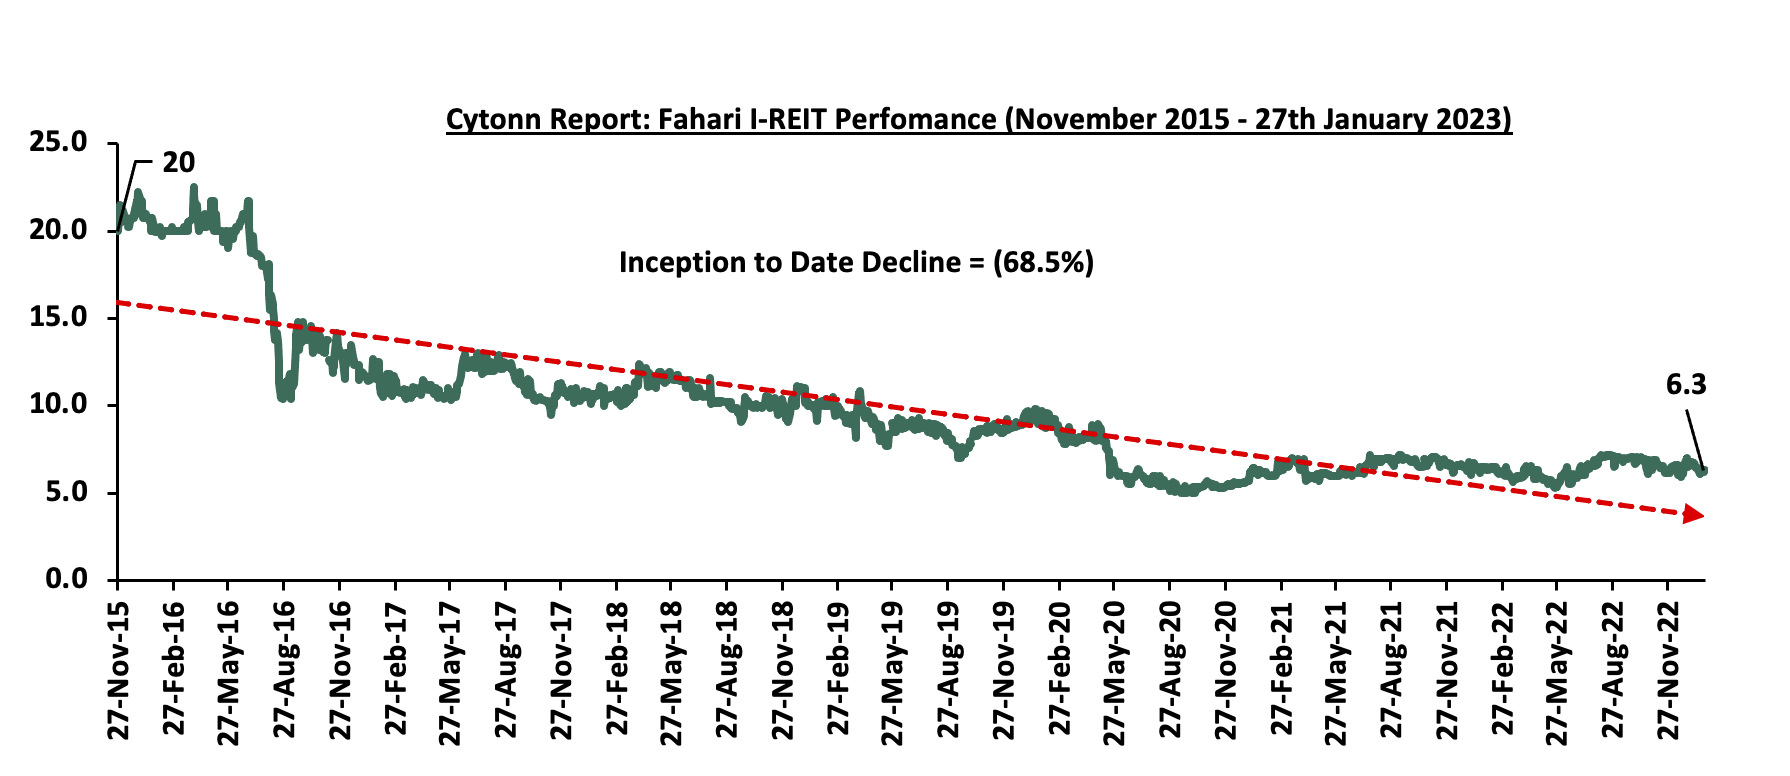
Inception to Date Decline
In the Unquoted Securities Platform, Acorn D-REIT and I-REIT traded at Kshs 23.9 and Kshs 20.9 per unit, respectively, as at 13th January 2023. The performance represented a 19.4% and 4.4% gain for the D-REIT and I-REIT, respectively, from the Kshs 20.0 inception price. The volumes traded for the D-REIT and I-REIT came in at 12.3 mn and 28.7 mn shares, respectively, with a turnover of Kshs 257.5 mn and Kshs 591.8 mn, respectively, since inception in February 2021.
We anticipate the performance of Kenya’s Real Estate sector to continue on an upward trajectory in terms of activities supported by government’s and private sector efforts and focus to initiate affordable housing projects in the country. Conversely, we expect the performance to be weighed down by a bearish REITs market constrained by various factors, such as inadequate investor appetite and high set minimum investment amounts.
Outlook Summary
Key: Green – POSITIVE, Grey – NEUTRAL, Red – NEGATIVE
|
Fixed Income and Equities Outlook for 2023 |
|
|
Fixed Income |
We expect upward pressure on the interest rates market on the back of the government’s increased borrowing for budgetary support, debt repayments, funding of infrastructure projects and payment of domestic maturities which stand at Kshs 572.5 bn for H1’2022. Investors should be biased towards SHORT-TERM FIXED INCOME INSTRUMENTS to reduce duration risk |
|
Equities |
We have a NEUTRAL outlook on the Kenyan Equities market in the short term but “BULLISH” in the medium to long term. We expect a slight improvement the listed sector’s earnings growth in 2023, largely driven by the continued improvement in the country’s business environment. The improvement is evidenced by an average Purchasing Manager’s Index (PMI) of 51.1 for the last four months of 2022 which is expected to raise growth prospects |
|
Real Estate Outlook Summary |
|
|
Real Estate Sector |
The overall outlook for the real estate sector is NEUTRAL, supported by; i) infrastructural development, ii) government and private sector focus on affordable housing, iii) focus on mortgage financing through the KMRC, iv) improved investor confidence amid recovery of the hospitality sector, v) aggressive expansion by both local and international retailers in a bid to maintain market dominance, and, vi) Kenya's positive demographics driving housing demand. However, factors such as increased construction costs on the back of inflation, constrained financing to developers with increased underdeveloped capital markets, oversupply in select sectors and low of investor appetite in Real Estate Investments Trusts (REITs) are expected to continue impeding performance of the sector |
For more information, please see the Cytonn 2023 Markets Outlook.
Disclaimer: The views expressed in this publication are those of the writers where particulars are not warranted. This publication, which is in compliance with Section 2 of the Capital Markets Authority Act Cap 485A, is meant for general information only and is not a warranty, representation, advice or solicitation of any nature. Readers are advised in all circumstances to seek the advice of a registered investment advisor.

- Talk to us
- Kenya
- P.O Box 20695 - 00200, Nairobi, Kenya
- Cell +254709101200
- Tel +254709101200
- WhatsApp +254741676635
- United States
- +254709101200
- DOWNLOAD OUR APP
-


- Kenya
- 8th Floor, Pinetree Plaza, Kaburu Drive, Ngong Road, Nairobi, Kenya
- USA
- Suite 1150, 1775 Eye Street NW, USA, Washington DC 20006, USA
- Investments
- High Yield
- Private Equity
- Real Estate
- Real Estate
- RiverRun Estates
- Cytonn Towers
- The Ridge
- Taraji Heights
- The Alma