Cytonn Monthly - May 2026
By Research Team, May 31, 2026
Executive Summary
Fixed Income
During the month of May 2026, T-bills were oversubscribed, with the overall average subscription rate coming in at 108.7%, higher than the subscription rate of 72.2%, recorded in April 2026. The overall average subscription rates for the 91-day, 182-day and 364-day papers increased to 256.0%, 85.0% and 73.4% from 131.2%, 71.3% and 49.7% recorded in April 2026 respectively. The average yields on the government paper were on an upward trajectory during the month, with the average 364-day, 91-day and 182-day papers increasing by 27.2 bps, 73.2 bps and 36.7 bps respectively to 8.5%, 8.2% and 8.2% from the 8.3%, 7.5% and 7.8% recorded the previous month respectively. For the month of May, the government accepted a total of Kshs 100.4 bn of the Kshs 104.3 bn worth of bids received in T-Bills, translating to an acceptance rate of 96.2%, compared to an acceptance rate of 99.9% in the month of April;
During the week, T-bills were undersubscribed for the first time in three weeks, with the overall subscription rate coming in at 69.3%, lower than the subscription rate of 125.2%, recorded the previous week. Investors’ preference for the shorter 91-day paper persisted, with the paper receiving bids worth Kshs 14.1 bn against the offered Kshs 4.0 bn, translating to a subscription rate of 352.3%, albeit lower than the subscription rate of 396.6%, recorded the previous week. The subscription rate for the 182-day and 364- day papers decreased to 10.5% and 14.9% from 83.9% and 57.9% respectively recorded the previous week. The government accepted a total of Kshs 16.62 bn worth of bids out of Kshs 16.64 bn bids received, translating to an acceptance rate of 99.9%. The yields on the government papers were on an upward trajectory with the yields on the 364-day, 91-day and 182-day papers increasing by 3.9 bps, 0.2 bps and 3.9 bps respectively to 8.63%, 8.4% and 8.3% from the 8.59%, 8.4% and 8.3% recorded the previous week respectively;
Additionally, May 2026 bonds were oversubscribed, with the overall average subscription rate coming in at 117.8%, lower than the average subscription rate of 188.7%, recorded in April 2026. The reopened bonds FXD1/2021/020, FXD3/2019/015, FXD1/2012/020, FXD1/2019/020 and FXD1/2021/025 with tenors to maturity of 15.3 years, 8.3 years, 7.6 years, 13.2 years and 20.0 years respectively and fixed coupon rates of 13.4%, 12.3%, 12.0%, 12.9% and 13.9% respectively, received bids worth Kshs 153.2 bn against the offered Kshs 130.0 bn translating to an oversubscription rate of 117.8%. The government accepted bids worth Kshs 130.6 bn, translating to an acceptance rate of 85.3%. The weighted average yield for the accepted bids for the FXD1/2021/020, FXD3/2019/015, FXD1/2012/020, FXD1/2019/020 and FXD1/2021/025 came in at 13.7%, 13.0%, 12.5%, 13.2% and 13.7% respectively. Also, during the month, the government conducted a bond switch auction, involving a switch from FXD1/2017/010 to FXD1/2021/020 which was undersubscribed, receiving bids worth Kshs 7.6 bn against the offered 10.0 bn, translating to subscription rate of 76.1% having an average acceptance yield of 13.4% and a coupon rate of 13.4%;
In the primary bond market, the government re-opened two bonds FXD1/2020/015, and FXD1/2018/025 seeking to raise Kshs 40.0 bn for budgetary support. The bonds, FXD1/2020/015, and FXD1/2018/025, have fixed coupon rates of 12.8% and 13.4% respectively and tenors to maturity of 8.7 years, and 17.1 years respectively. The period of sale for both the FXD1/2020/015 and FXD1/2018/025 opened on Friday 29th May 2026 and will close on Wednesday 3rd June 2026. Our bidding ranges for the FXD1/2020/015, and FXD1/2018/025 is 13.0% - 13.5% and 13.5% - 14.0% respectively;
The year-on-year inflation in May 2026 increased by 1.1% points to 6.7% from the 5.6% % recorded in April 2026. The price increase was primarily driven by a rise in prices of items in the Food and Non-alcoholic Beverages at 9.4%; Transport 16.5%; and Housing, Water, Electricity, Gas and other fuels at 3.4%; over the one-year period;
Equities
During the month of May, the equities market recorded a mixed performance, with NSE 10 and NASI gaining by 0.9% and 0.2% respectively, while NSE 20 and NSE 25 declined by 1.0% and 0.2%. The performance was mainly driven by losses recorded by large cap stocks such as BAT, Stanbic and ABSA of 9.4%, 5.8% and 5.7% respectively. However, the performance was supported by gains recorded by large-cap stocks such as Cooperative Bank, EABL and Equity Bank of 2.6%, 1.8% and 1.0% respectively;
During the week, the equities market recorded a mixed performance, with NSE 20 gaining by 0.7% while NSE10, NSE 25, and NASI declined by 0.4%, 04% and 0.3% respectively, taking the YTD performance to gains of 11.8%, 10.5%, 9.8% and 9.1% for NSE 20, NSE 25, NASI and NSE 10 respectively. The week-on-week equities market performance was driven by losses recorded by large-cap stocks such as Equity, Stanbic, and DTB-K of 2.3%, 1.8% and 1.5% respectively. The performance was however supported by gains recorded by large cap stocks such as BAT and EABL of 3.4% and 1.3% respectively;
Also, during the month, the banking sector index declined by 1.1% to close at 233.5 from the 236.1 recorded at the end of the April 2026. This was attributable to losses recorded by large-cap stocks such as Stanbic, Absa and Standard Chartered of 5.8%, 5.7% and 5.1% respectively. The performance was however supported by gains recorded by large cap stacks such as Cooperative Bank and Equity of 2.6% and 1.0% respectively;
During the week, the banking sector index declined by 1.4% to 233.5 from 236.9 recorded the previous week. This is attributable to losses recorded by large cap stocks such Equity, Stanbic, and DTB-K of 2.3%, 1.8% and 1.5% respectively;
During the week, I&M Group released their Q1’2026 financial results, recording a 19.4% increase in profit after tax to Kshs 5.0 bn in Q1’2026, from Kshs 4.2 bn in Q1’2025;
During the week, Absa Bank released their Q1’2026 financial results recording a 13.9% decrease in profit after tax to Kshs 5.3 bn in Q1’2026, from Kshs 6.2 bn in Q1’2025;
During the week, HFCB released their Q1’2026 financial results, recording a 45.0% increase in profit after tax to Kshs 0.5 bn in Q1’2026, from Kshs 0.3 bn in Q1’2025;
During the week, Standard Chartered Bank released their Q1’2026 financial results, recording a 26.3% decrease in profit after tax to Kshs 3.6 bn in Q1’2026, from Kshs 4.9 bn in Q1’2025;
Real Estate
During the week, the Kenya National Bureau of Statistics (KNBS) released the Leading Economic Indicators (LEI) March 2026 Report, which highlighted the performance of major economic indicators. In Q1’2026, cement consumption reached 2.8 metric tonnes, representing a 17.9% y/y increase from 2.3 metric tonnes in Q1’2025;
During the week, the Kenya Mortgage Refinance Company (KMRC) listed its Kshs 3.0 bn sustainability-linked green bond on the fixed income segment of the Nairobi Securities Exchange (NSE), following an issuance that attracted subscriptions worth Kshs 9.4 bn, translating to a 312.8% oversubscription rate. The eight-year note, issued at a fixed coupon rate of 12.2%, marks the second tranche under KMRC’s approved Kshs 10.5 bn Medium-Term Note (MTN) programme, with proceeds earmarked for refinancing eligible green and social home loans aimed at supporting affordable and climate-resilient housing developments;
During the week, the Kenya Mortgage Refinance Company (KMRC) announced plans to issue the third tranche of its Medium-Term Note (MTN) programme in 2028, following the successful listing of its oversubscribed Kshs 3.0 bn sustainability-linked green bond on the Nairobi Securities Exchange (NSE);
On the Unquoted Securities Platform Acorn D-REIT and I-REIT traded at Kshs 29.6 and Kshs 23.8 per unit, respectively, as per the last updated data on 22nd May 2026. The performance represented a 48.0% and 18.8% gain for the D-REIT and I-REIT, respectively, from the Kshs 20.0 inception price. The volumes traded for the D-REIT and I-REIT came in at 13.5 mn and 43.3 mn shares, respectively. Additionally, ILAM Fahari I-REIT traded at Kshs 13.8 per share as of 22nd May 2026, representing a 31.0% loss from the Kshs 20.0 inception price. The volume traded to date came in at 1.2 mn shares for the I-REIT;
Digital Payments
During the week, Mastercard received the BitLicense from the New York State Department of Financial services marking a significant step in its broader strategy to integrate stablecoins and blockchain technology into mainstream payments infrastructure. The license, issued by one of the strictest crypto regulators in the United States, allows Mastercard to expand digital-asset and stablecoin-related services through its Mastercard Transaction Services unit. This positions the company to support blockchain-based settlement, tokenized payment systems, and stablecoin-enabled cross-border transactions within a regulated framework;
This week, SoFi launched a U.S. dollar–pegged stablecoin, SoFiUSD, directly within its banking app, marking one of the first instances of a federally regulated bank distributing a stablecoin to retail users. The token allows customers to buy, hold, transfer, and convert digital dollars instantly inside the SoFi ecosystem, effectively integrating blockchain-based money movement into a mainstream banking interface. This positions the stablecoin as a consumer-facing product rather than a niche crypto instrument, with functionality designed to support real-time payments and transfers within a regulated banking environment;
The digital payment stocks we track (AXP, Visa, Mastercard and Circle) are currently trading at an average P/E of 33.7x, implying that investors are pricing in strong future earnings growth expectations and are willing to pay a significant premium for current earnings, which may also suggest that the stocks are richly valued relative to their near-term fundamentals.
Investment Updates:
-
Weekly Rates: Cytonn Money Market Fund closed the week at a yield of 12.05% p.a. To invest, dial *809# or download the Cytonn App from Google Play store here or from the Appstore here;
-
We continue to offer Wealth Management Training every Tuesday, from 7:00 pm to 8:00 pm. The training aims to grow financial literacy among the general public. To register for any of our Wealth Management Trainings, click here. If interested in our Private Wealth Management Training for your employees or investment group, please get in touch with us through wmt@cytonn.com;
-
Cytonn Insurance Agency acts as an intermediary for those looking to secure their assets and loved ones’ future through insurance namely; Motor, Medical, Life, Property, WIBA, Credit and Fire and Burglary insurance covers. For assistance, get in touch with us through insuranceagency@cytonn.com;
-
Cytonn Asset Managers Limited (CAML) continues to offer pension products to meet the needs of both individual clients who want to save for their retirement during their working years and Institutional clients that want to contribute on behalf of their employees to help them build their retirement pot. To more about our pension schemes, kindly get in touch with us through pensions@cytonn.com;
Hospitality Updates:
-
We currently have promotions for Staycations. Visit cysuites.com/offers for details or email us at sales@cysuites.com;
Money Markets, T-Bills Primary Auction:
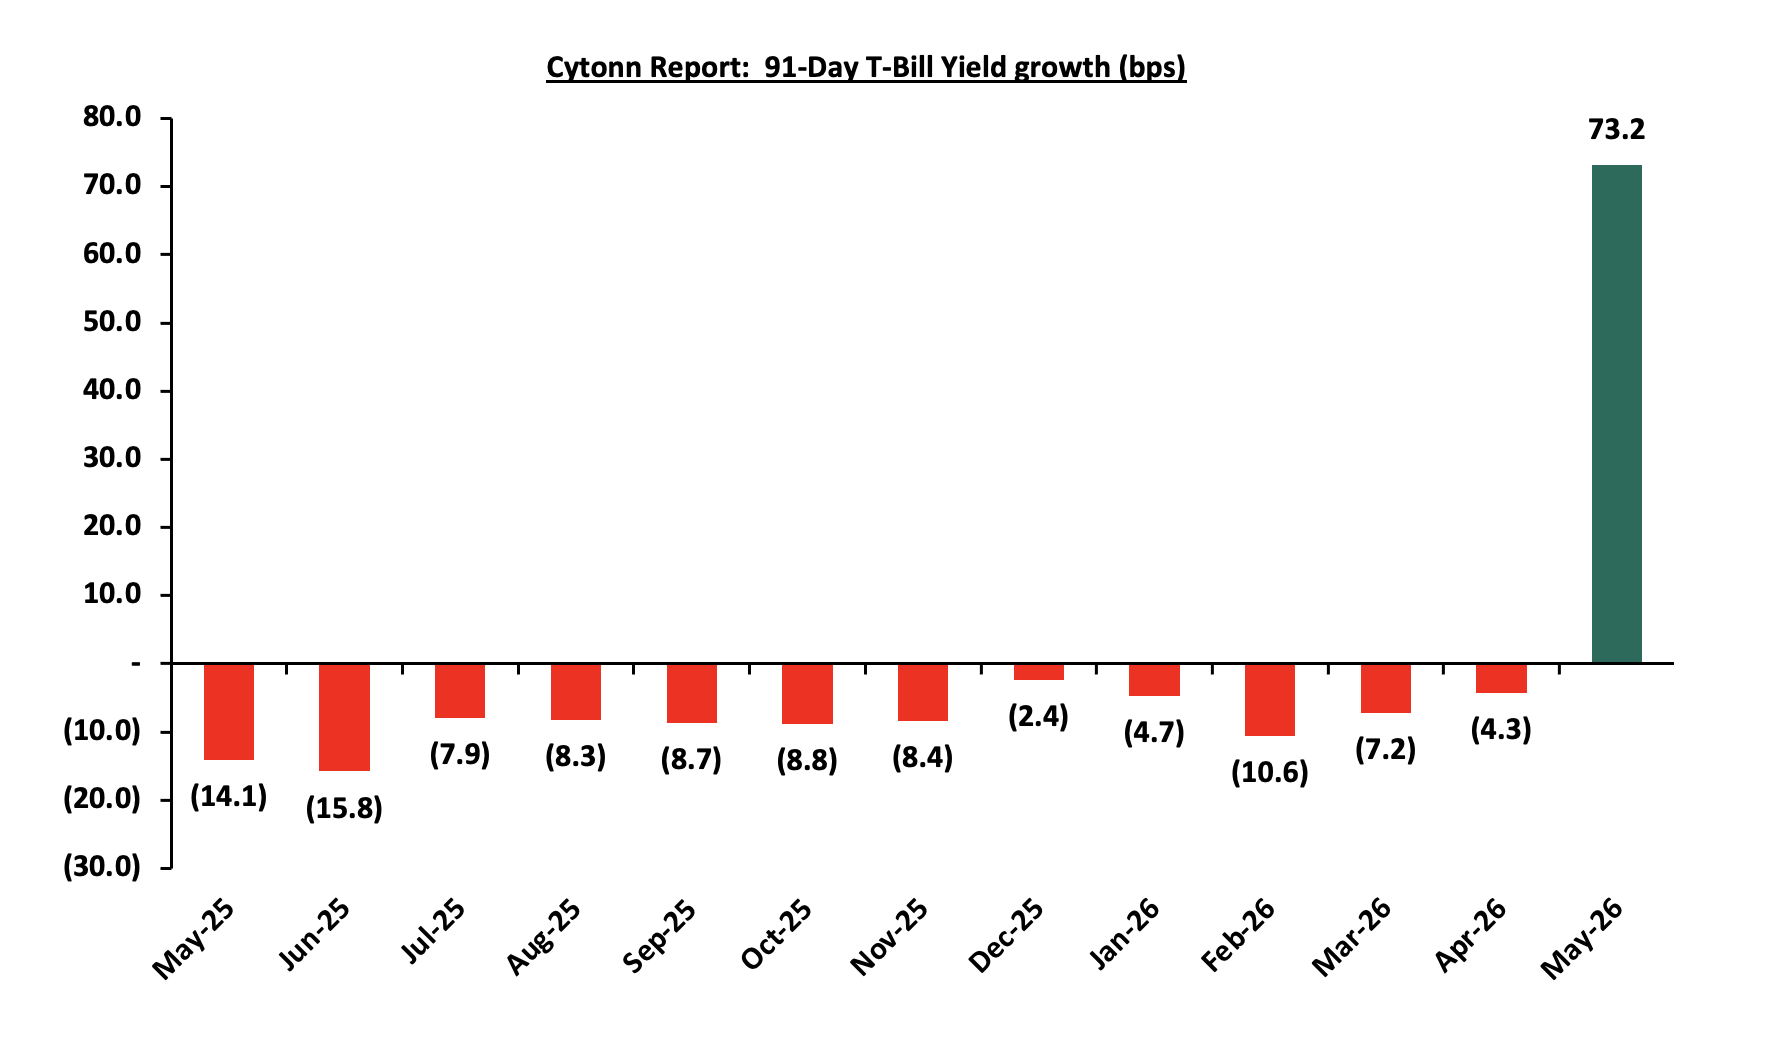
During the month of May 2026, T-bills were oversubscribed, with the overall average subscription rate coming in at 108.7%, higher than the subscription rate of 72.2%, recorded in April 2026. The overall average subscription rates for the 91-day, 182-day and 364-day papers increased to 256.0%, 85.0% and 73.4% from 131.2%, 71.25% and 49.7% recorded in April 2026 respectively. The average yields on the government paper were on an upward trajectory during the month, with the average 364-day, 91-day and 182-day papers increasing by 27.2 bps, 73.2 bps and 36.7 bps respectively to 8.5%, 8.2% and 8.2% from the 8.3%, 7.5% and 7.8% recorded the previous month respectively. For the month of May, the government accepted a total of Kshs 100.4 bn of the Kshs 104.3 bn worth of bids received in T-Bills, translating to an acceptance rate of 96.2%, compared to an acceptance rate of 99.9% in the month of April. The chart below shows the yield growth rate for the 91-day paper for the past one year:
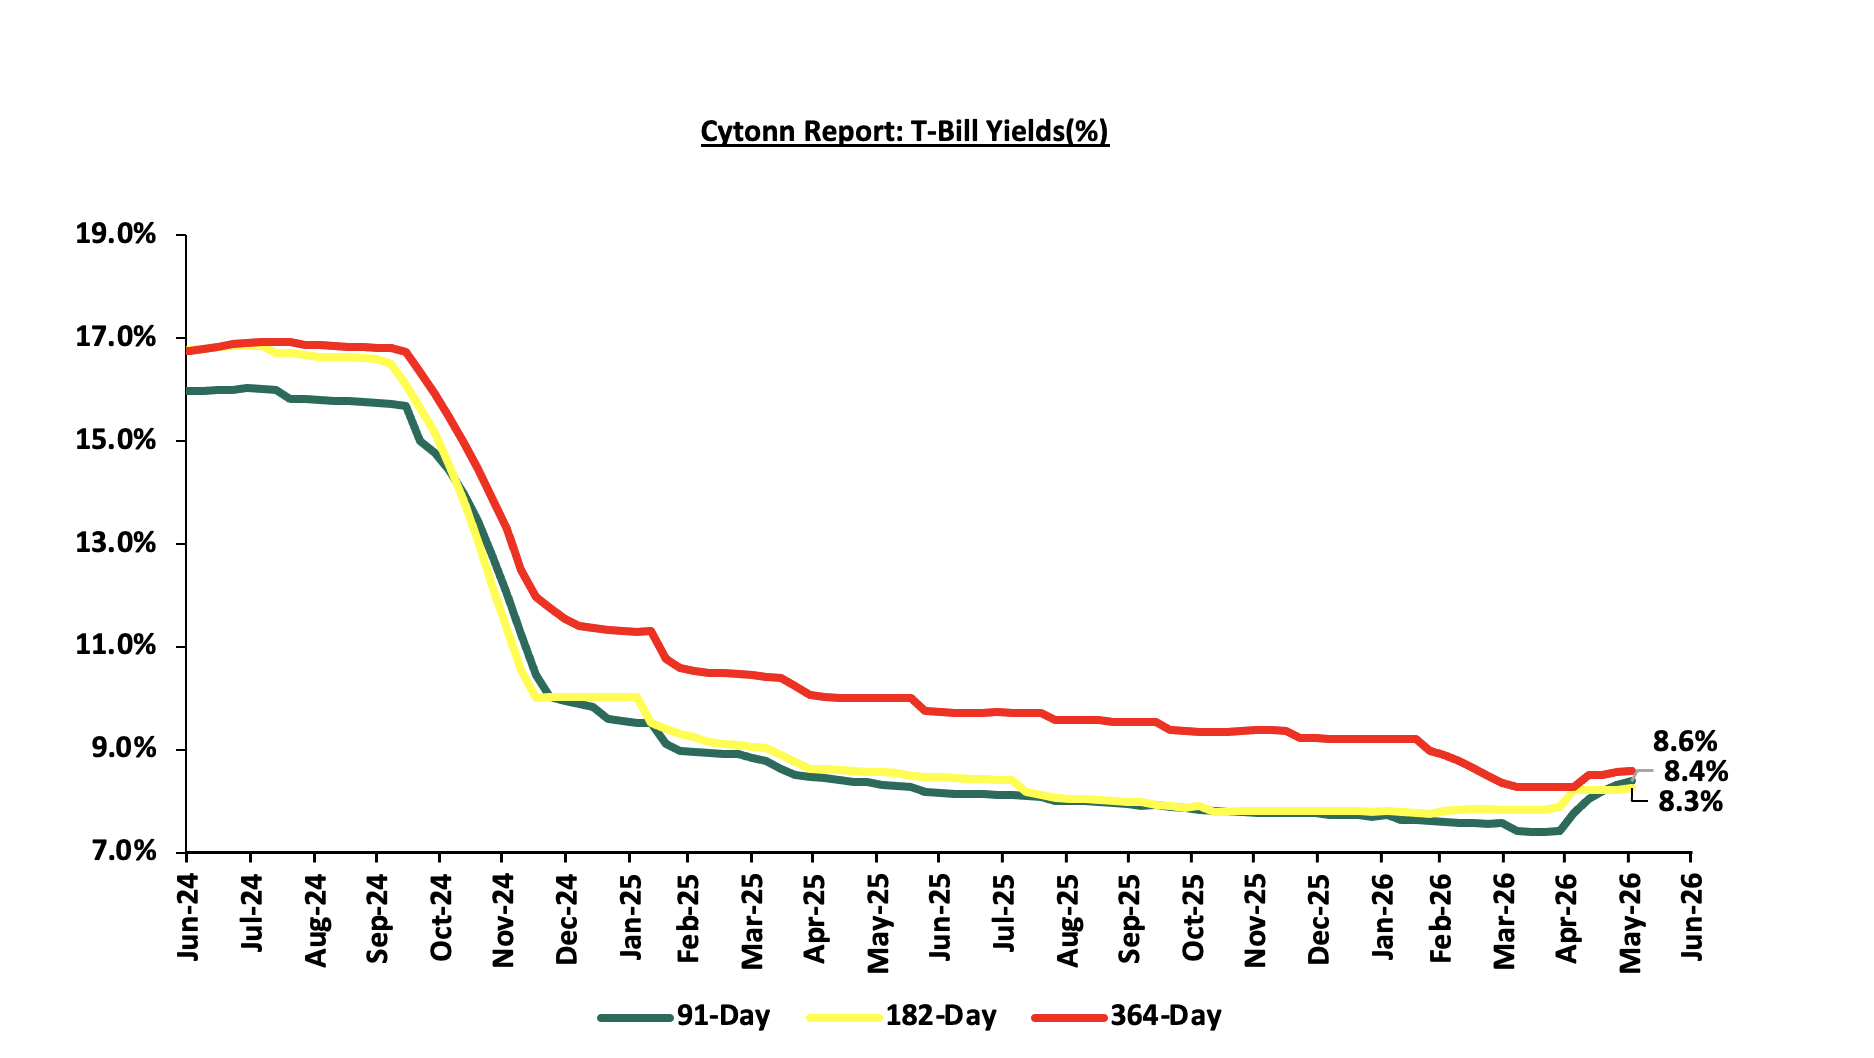
During the week, T-bills were undersubscribed for the first time in three weeks, with the overall subscription rate coming in at 69.3%, lower than the subscription rate of 125.2%, recorded the previous week. Investors’ preference for the shorter 91-day paper persisted, with the paper receiving bids worth Kshs 14.1 bn against the offered Kshs 4.0 bn, translating to a subscription rate of 352.3%, lower than the subscription rate of 396.6%, recorded the previous week. The subscription rate for the 182-day and 364- day papers decreased to 10.5% and 14.9% from 83.9% and 57.9% respectively recorded the previous week. The government accepted a total of Kshs 16.62 bn worth of bids out of Kshs 16.64 bn bids received, translating to an acceptance rate of 99.9%. The yields on the government papers were on an upward trajectory with the yields on the 364-day, 91-day and 182-day papers increasing by 3.9 bps, 0.2 bps and 3.9 bps respectively to 8.63%, 8.4% and 8.3% from the 8.59%, 8.4% and 8.3% recorded the previous week respectively. The chart below shows the performance of the 91-day, 182-day and 364-day papers from June 2024 to June 2026:
So far in the current FY’2025/26, government securities totaling Kshs 1,932.0 bn have been advertised. The government has accepted bids worth Kshs 2,388.4 bn, of which Kshs 1,310.1 bn and Kshs 1,078.2 bn were treasury bills and bonds, respectively. Total redemptions so far in FY’2025/26 equal to Kshs 1,329.5 bn, with treasury bills accounting for the entire amount. As a result, the government has a domestic borrowing surplus of Kshs 1,058.9 bn in FY’2025/26.
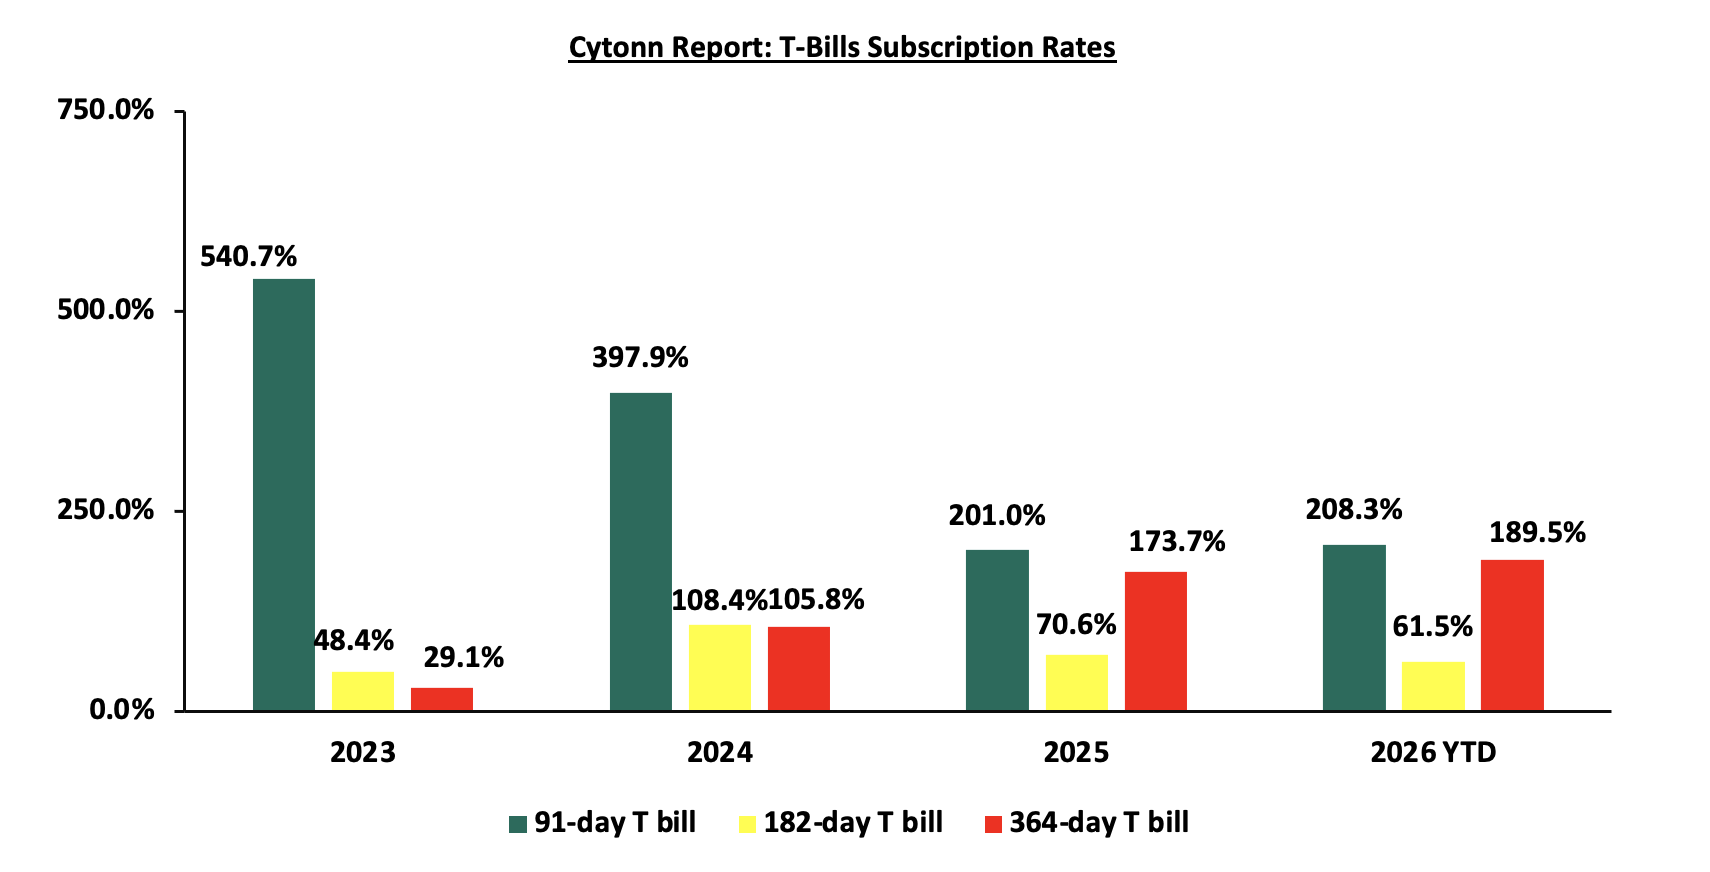
The chart below compares the overall average T-bill subscription rates obtained in 2023,2024, 2025 and 2026 Year-to-date (YTD):
Additionally, May 2026 bonds were oversubscribed, with the overall average subscription rate coming in at 117.8%, lower than the average subscription rate of 188.7%, recorded in April 2026. The reopened bonds FXD1/2021/020, FXD3/2019/015, FXD1/2012/020, FXD1/2019/020 and FXD1/2021/025 with tenors to maturity of 15.3 years, 8.3 years, 7.6 years, 13.2 years and 20.0 years respectively and fixed coupon rates of 13.4%, 12.3%, 12.0%, 12.9% and 13.9% respectively, received bids worth Kshs 153.2 bn against the offered Kshs 130.0 bn translating to an oversubscription rate of 117.8%. The government accepted bids worth Kshs 130.6 bn, translating to an acceptance rate of 85.3%. The weighted average yield for the accepted bids for the FXD1/2021/020, FXD3/2019/015, FXD1/2012/020, FXD1/2019/020 and FXD1/2021/025 came in at 13.7%, 13.0%, 12.5%, 13.2% and 13.7% respectively. The table below provides more details on the bonds issued in April 2026 and May 2026:
|
Cytonn Report: Bond Issuances for April 2026-May 2026 |
|||||||||||||||||
|
Issue Date |
Bond Auctioned |
Effective Tenor to Maturity (Years) |
Coupon |
Amount offered (Kshs bn) |
Actual Amount Raised/Accepted (Kshs bn) |
Total bids received (Subscription) |
Average Accepted Yield |
Subscription Rate |
Acceptance Rate |
||||||||
|
20-May |
SDB1/2011/030-Reopened |
15.3 |
13.4% |
50.0 |
22.2 |
26.5 |
13.7% |
94.3% |
83.6% |
||||||||
|
FXD3/2019/020-Reopened |
8.3 |
12.3% |
14.4 |
20.6 |
13.0% |
69.9% |
|||||||||||
|
18-May |
FXD1/2021/020-Switch |
15.2 |
13.4% |
10.0 |
4.5 |
7.6 |
13.4% |
76.1% |
59.5% |
||||||||
|
11-May |
FXD1/2012/020- Reopened |
7.6 |
12.0% |
80.0 |
47.5 |
47.9 |
12.5% |
132.5 |
99.13% |
||||||||
|
FXD1/2019/020 - Reopened |
13.2 |
12.9% |
14.5 |
17.6 |
13.2% |
82.73% |
|||||||||||
|
FXD1/2021/025-Reopened |
20.0 |
13.9% |
32.0 |
40.5 |
13.7% |
78.96% |
|||||||||||
|
20-Apr |
SDB1/2011/030-Reopened |
14.9 |
12.0% |
20.0 |
6.6 |
7.1 |
13.0% |
191.7 |
93.2% |
||||||||
|
FXD1/2026/030-Reopened |
30.0 |
12.5% |
23.5 |
31.3 |
13.8% |
75.1% |
|||||||||||
|
15-Apr |
FXD1/2018/015-Switch |
7.1 |
12.7% |
20.0 |
1.8 |
2.6 |
12.0% |
12.8% |
68.5% |
||||||||
|
02-Apr |
FXD1/2020/015- Reopened |
8.9 |
12.8% |
40.0 |
36.5 |
41.4 |
12.2% |
187.2% |
88.1% |
||||||||
|
FXD1/2018/025-Reopened |
17.3 |
13.4% |
13.7 |
33.5 |
13.0% |
40.9% |
|||||||||||
|
May 2026 Average |
12.9 |
12.9% |
130.0 |
130.6 |
153.2 |
13.2% |
117.8% |
85.3% |
|||||||||
|
April 2026 Average |
17.8 |
12.7% |
60.0 |
80.3 |
113.2 |
13.0% |
188.7% |
70.9% |
|||||||||
|
2025 Average |
13.6 |
13.3% |
41.8 |
35.8 |
53.8 |
13.8% |
128.9% |
66.5% |
|||||||||
Also, during the month, the government conducted a bond switch auction, involving a switch from FXD1/2017/010 to FXD1/2021/020 which was undersubscribed, receiving bids worth Kshs 7.6 bn against the offered 10.0 bn, translating to subscription rate of 76.1% having an average acceptance yield of 13.4% and a coupon rate of 13.4%.
Secondary Bond Market:
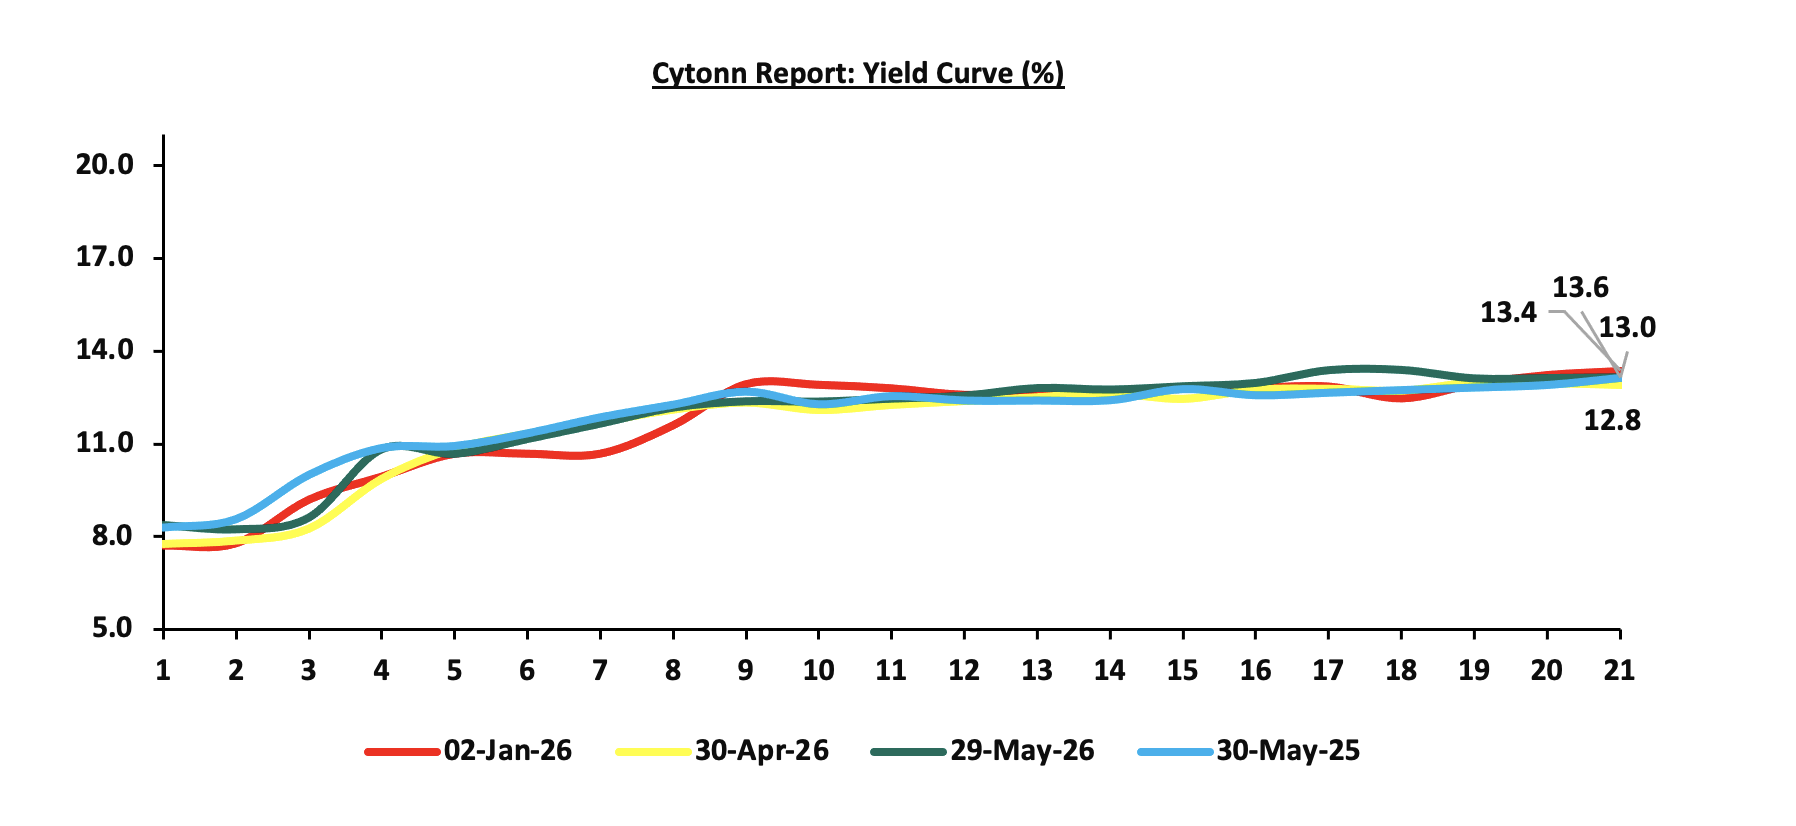
The yields on the government securities recorded a mixed performance during the month of May similar to April. This is attributable to a divergence between short-term monetary policy anchoring and rising medium to long-term risk premium. The Central Bank of Kenya’s decision to maintain the policy rate at 8.75% helped stabilize short-term rates by anchoring expectations on the near-term cost of funds, limiting significant movements in Treasury bill yields. However, upward pressure on inflation driven by elevated global oil prices linked to the Middle East conflict, eroded real returns and heightened uncertainty around the inflation outlook. This led investors to demand higher compensation on longer-dated securities, pushing yields upward at the belly and long end of the curve. At the same time, intermittent liquidity conditions and selective demand for specific maturities created pockets of downward movement in some tenors, ultimately resulting in a mixed yield curve performance for the month. The chart below shows the yield curve movement during the period:
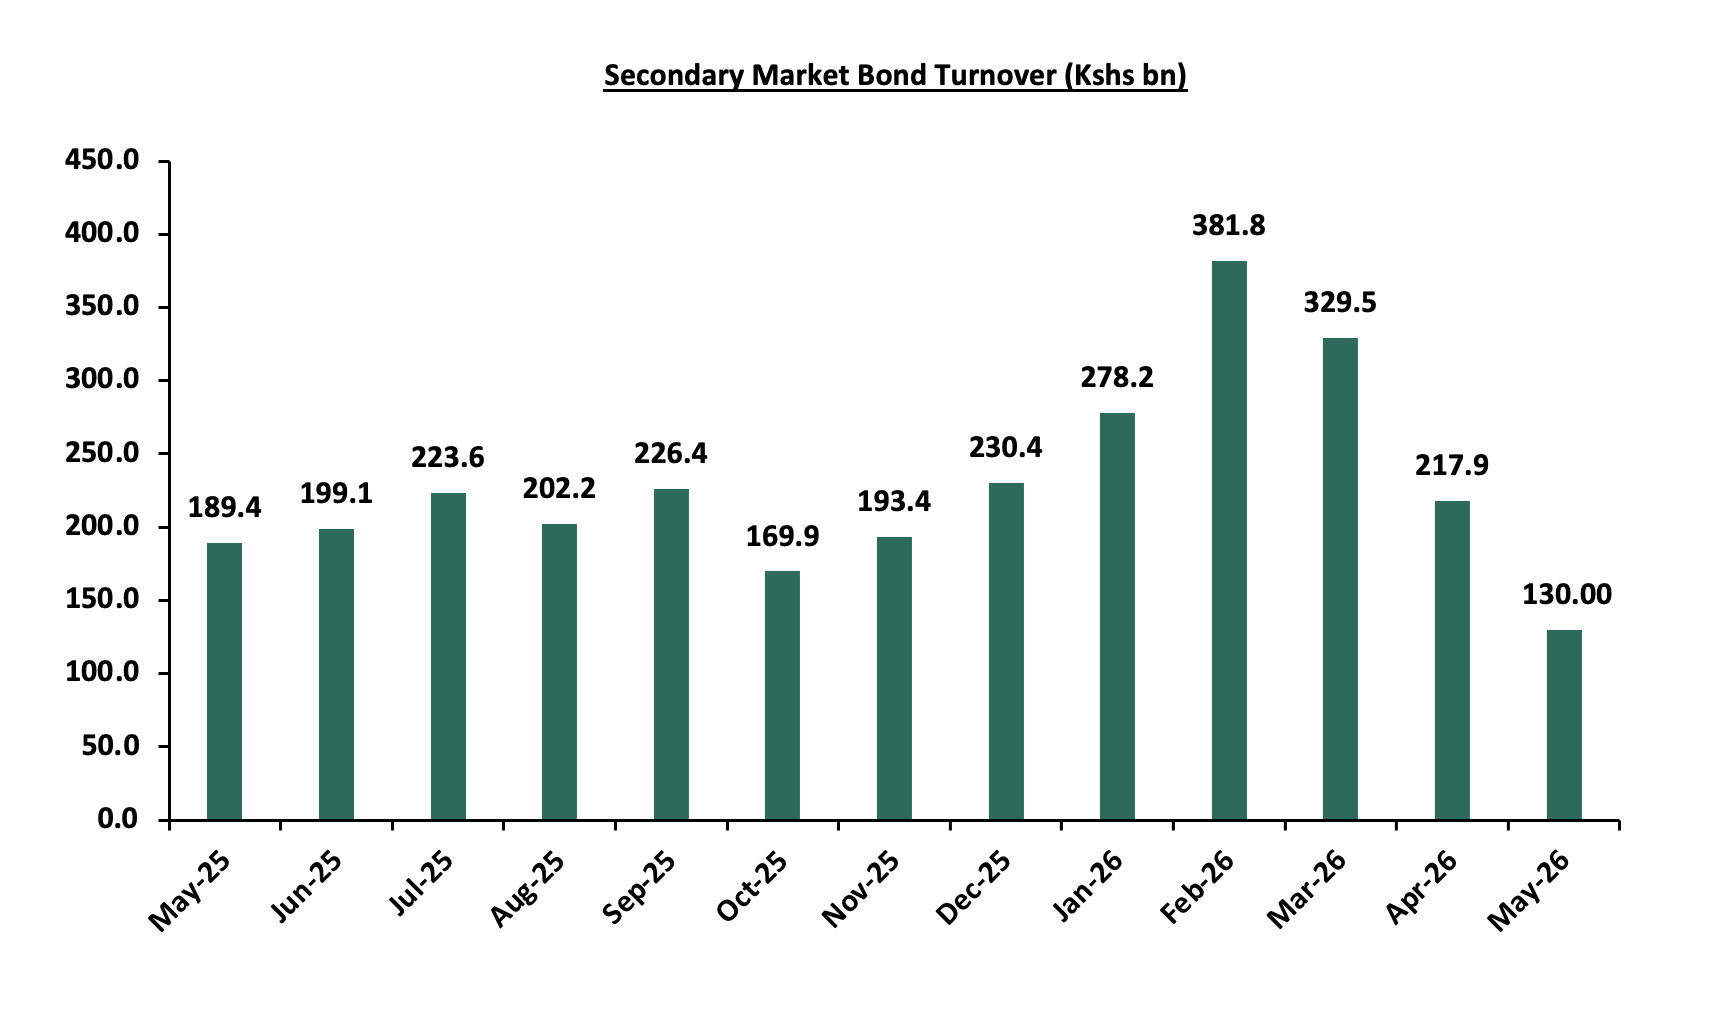
The secondary bond turnover decreased by 40.3% to Kshs 130.0 bn, from Kshs 217.9 bn recorded in April 2026, pointing towards decreased activities by commercial banks in the secondary bonds market for the month of May driven by tighter liquidity during the month hence banks preferring to hold on to cash. On a year-on-year basis, the bond turnover decreased by 31.4% from Kshs 189.4 bn worth of treasury bonds transacted over a similar period last year. The chart below shows the bond turnover over the past 12 months.
Money Market Performance:
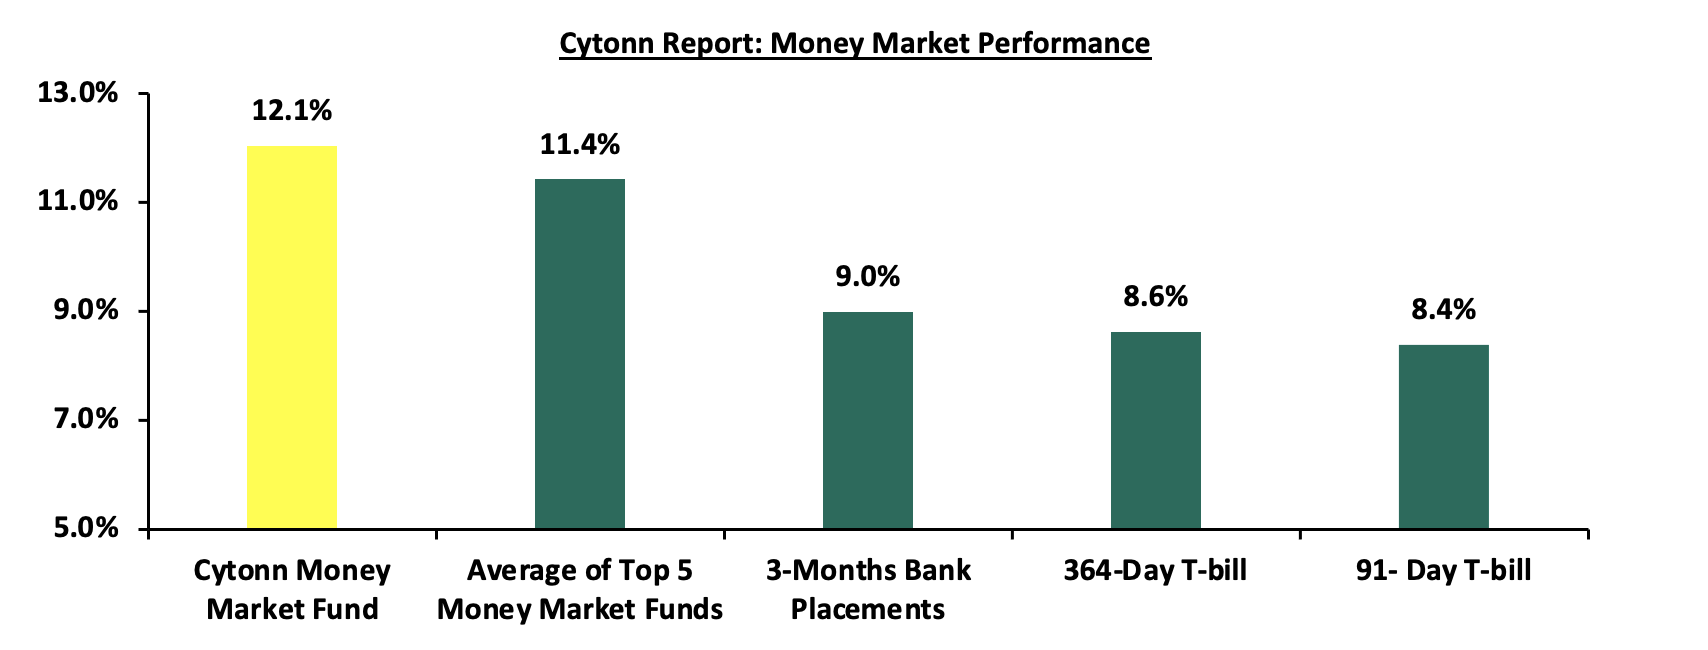
In the money markets, 3-month bank placements ended the week at 9.0% (based on what we have been offered by various banks). The yields on the 364-day papers increased by 3.8 bps to remain relatively unchanged from the 8.6% recorded the previous week, while the 91-day paper increased by 0.2 bps to remain relatively unchanged from the 8.4% recorded the previous week and the yield on the Cytonn Money Market Fund decreased marginally by 7.0 bps to remain relatively unchanged from the 12.1% recorded the previous week, while the average yields on the Top 5 Money Market Funds decreased by 1.8 bps to 11.4% from 11.5% recorded in the previous week.
The table below shows the Money Market Fund Yields for Kenyan Fund Managers as published on 29th May 2026:
|
Money Market Fund Yield for Fund Managers as published on 29th May 2026 |
||
|
Rank |
Fund Manager |
Effective Annual Rate |
|
1 |
Cytonn Money Market Fund ( Dial *809# or download Cytonn App) |
12.1% |
|
2 |
Nabo Africa Money Market Fund |
12.0% |
|
3 |
Etica Money Market Fund |
11.5% |
|
4 |
Arvocap Money Market Fund |
10.9% |
|
5 |
Lofty-Corban Money Market Fund |
10.7% |
|
6 |
Enwealth Money Market Fund |
10.5% |
|
7 |
Faulu Money Market Fund |
10.5% |
|
8 |
Madison Money Market Fund |
10.5% |
|
9 |
Ndovu Money Market Fund |
10.5% |
|
10 |
Kuza Money Market fund |
10.4% |
|
11 |
Orient Kasha Money Market Fund |
10.2% |
|
12 |
Old Mutual Money Market Fund |
10.1% |
|
13 |
Gulfcap Money Market Fund |
10.1% |
|
14 |
Jubilee Money Market Fund |
10.0% |
|
15 |
British-American Money Market Fund |
9.8% |
|
16 |
GenAfrica Money Market Fund |
9.8% |
|
17 |
SanlamAllianz Money Market Fund |
9.3% |
|
18 |
Dry Associates Money Market Fund |
9.2% |
|
19 |
Apollo Money Market Fund |
9.2% |
|
20 |
KCB Money Market Fund |
9.0% |
|
21 |
Genghis Money Market Fund |
8.7% |
|
22 |
CIC Money Market Fund |
8.4% |
|
23 |
CPF Money Market Fund |
8.2% |
|
24 |
Mali Money Market Fund |
8.0% |
|
25 |
Co-op Money Market Fund |
7.9% |
|
26 |
ICEA Lion Money Market Fund |
7.7% |
|
27 |
Absa Shilling Money Market Fund |
7.5% |
|
28 |
Mayfair Money Market Fund |
7.0% |
|
29 |
AA Kenya Shillings Fund |
6.0% |
|
30 |
Ziidi Money Market Fund |
5.9% |
|
31 |
Stanbic Money Market Fund |
5.3% |
|
32 |
Equity Money Market Fund |
5.1% |
Source: Business Daily
Liquidity:
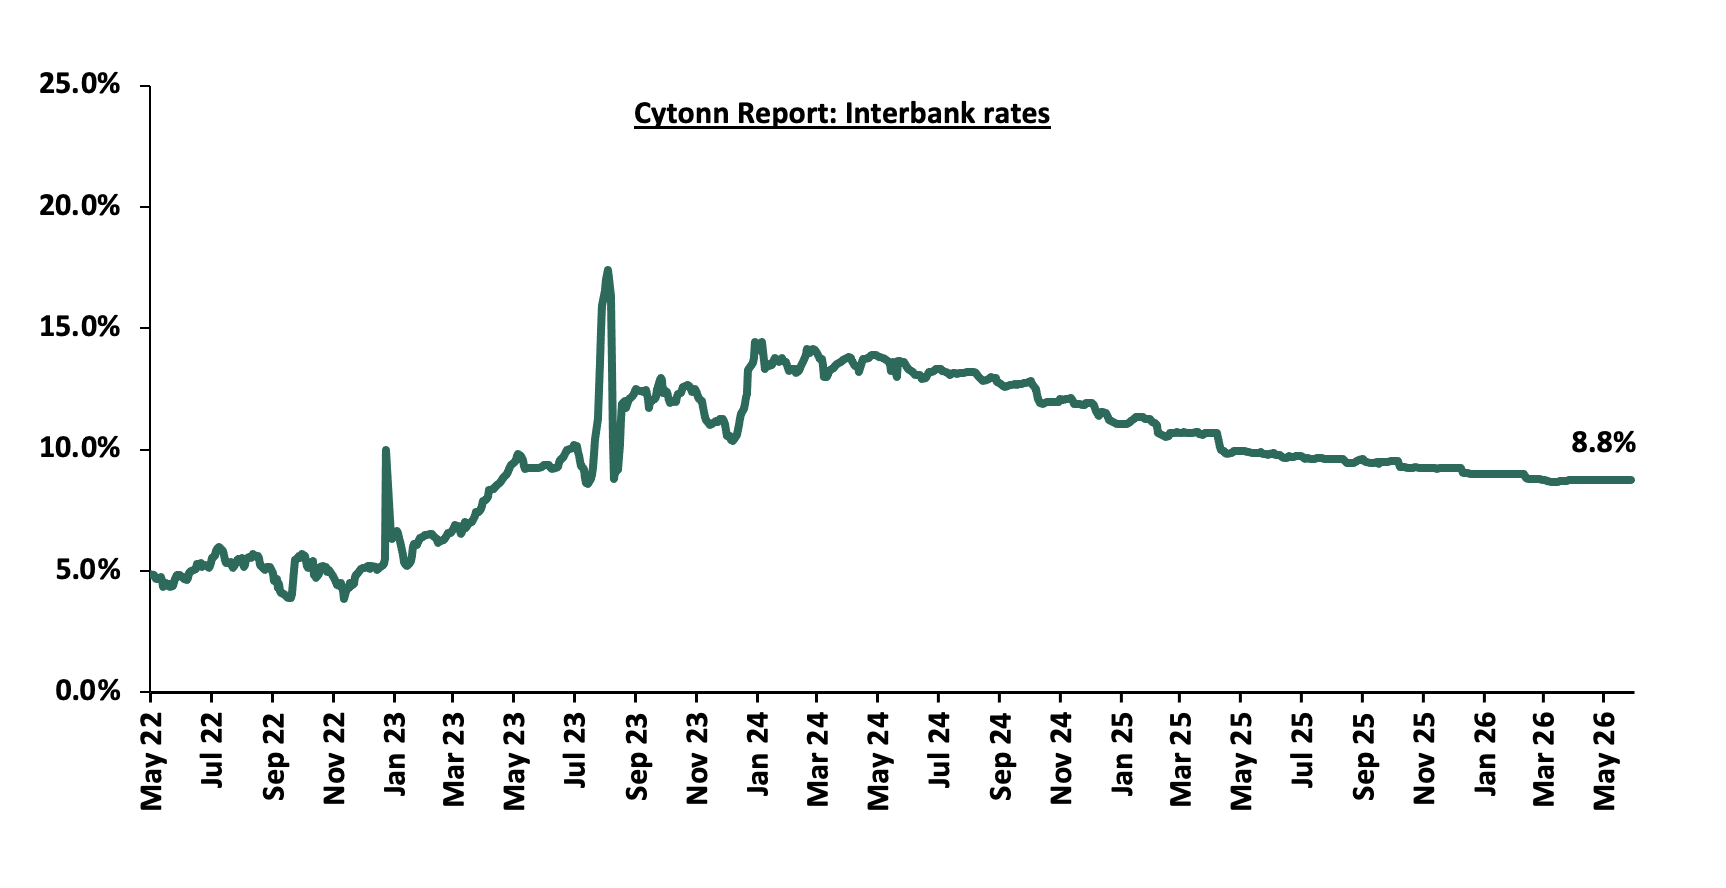
Liquidity in the money markets eased in the month of May 2026, with the average interbank rate decreasing by 0.1% points to 8.7% from 8.8% recorded the previous month. The average interbank volumes traded increased by 13.7% to Kshs 12.9 bn, from Kshs 11.3 bn recorded in April 2026. Additionally, during the week, liquidity in the money markets tightened, with the average interbank rate decreasing by 0.1 bps, to remain relatively unchanged from the 8.8% recorded the previous week, partly attributable to government payments that offset tax remittances. The average interbank volumes traded increased by 45.6% to Kshs 18.6 bn from Kshs 12.8 bn recorded the previous week. The chart below shows the interbank rates in the market over the years:
Kenya Eurobonds:
During the month, the yields on the Eurobonds were on a downward trajectory, with the yield on the 7-year Eurobond issued in 2024 decreasing the most by 79.0 bps to 7.4% from 8.2% recorded at the end of April 2026. Also, during the week, the yields on the Eurobonds were on a downward trajectory with the yield on the 7-year Eurobond issued in 2024 decreasing the most by 61.0 bps each to 7.4% from 8.0% recorded the previous week respectively. The table below shows the summary performance of the Kenyan Eurobonds as of 28th May 2026:
|
|
2018 |
2019 |
2021 |
2024 |
||
|
Tenor |
10-year issue |
30-year issue |
12-year issue |
13-year issue |
7-year issue |
|
|
Amount Issued (USD) |
1.0 bn |
1.0 bn |
1.2 bn |
1.0 bn |
1.5 bn |
|
|
Years to Maturity |
2.5 |
22.5 |
6.7 |
8.8 |
5.5 |
|
|
Yields at Issue |
7.3% |
8.3% |
7.9% |
6.2% |
10.4% |
|
|
2-Jan-26 |
6.1% |
8.8% |
7.2% |
7.8% |
7.1% |
|
|
30-Apr-26 |
7.5% |
9.4% |
8.5% |
8.9% |
8.2% |
|
|
21-May-26 |
7.3% |
9.3% |
8.3% |
8.9% |
8.0% |
|
|
22-May-26 |
7.2% |
9.2% |
8.2% |
8.7% |
7.8% |
|
|
25-May-26 |
7.2% |
9.2% |
8.2% |
8.7% |
7.8% |
|
|
26-May-26 |
7.1% |
9.1% |
8.1% |
8.5% |
7.7% |
|
|
27-May-26 |
7.1% |
8.9% |
7.8% |
8.3% |
7.4% |
|
|
28-May-26 |
7.2% |
8.9% |
7.8% |
8.3% |
7.4% |
|
|
Weekly Change |
(0.2%) |
(0.4%) |
(0.6%) |
(0.6%) |
(0.6%) |
|
|
M/M Change |
(0.4%) |
(0.4%) |
(0.8%) |
(0.6%) |
(0.8%) |
|
|
YTD Change |
1.1% |
0.1% |
0.6% |
0.5% |
0.3% |
|
Source: Central Bank of Kenya (CBK) and National Treasury
Kenya Shilling:
During the month, the Kenya Shilling depreciated by 27.9 bps against the US Dollar, to Kshs 129.6 from the Kshs 129.2 recorded at the end of April. However, during the week, the Kenya Shilling appreciated by 15.4 bps against the US Dollar, to Kshs 129.6 from the Kshs 129.8 recorded the previous week. On a year-to-date basis, the shilling has depreciated by 38.7 bps against the dollar, as compared to the 22.9 bps appreciation recorded in 2025.
We expect the shilling to be supported by:
-
Diaspora remittances standing at a cumulative USD 5,053.5 mn in the twelve months to April 2026, 1.1% higher than the USD 4,997.2 mn recorded over the same period in 2025. These have continued to cushion the shilling against further depreciation. In the April 2026 diaspora remittances figures, North America remained the largest source of remittances to Kenya accounting for 52.2% in the period, and,
-
Tourism inflows, which strengthened significantly. Tourism receipts reached Kshs 560.0 bn in 2025, up from Kshs 452.2 bn in 2024, representing a 23.9% increase, supported by improved international arrivals through the country’s major airports, and,
-
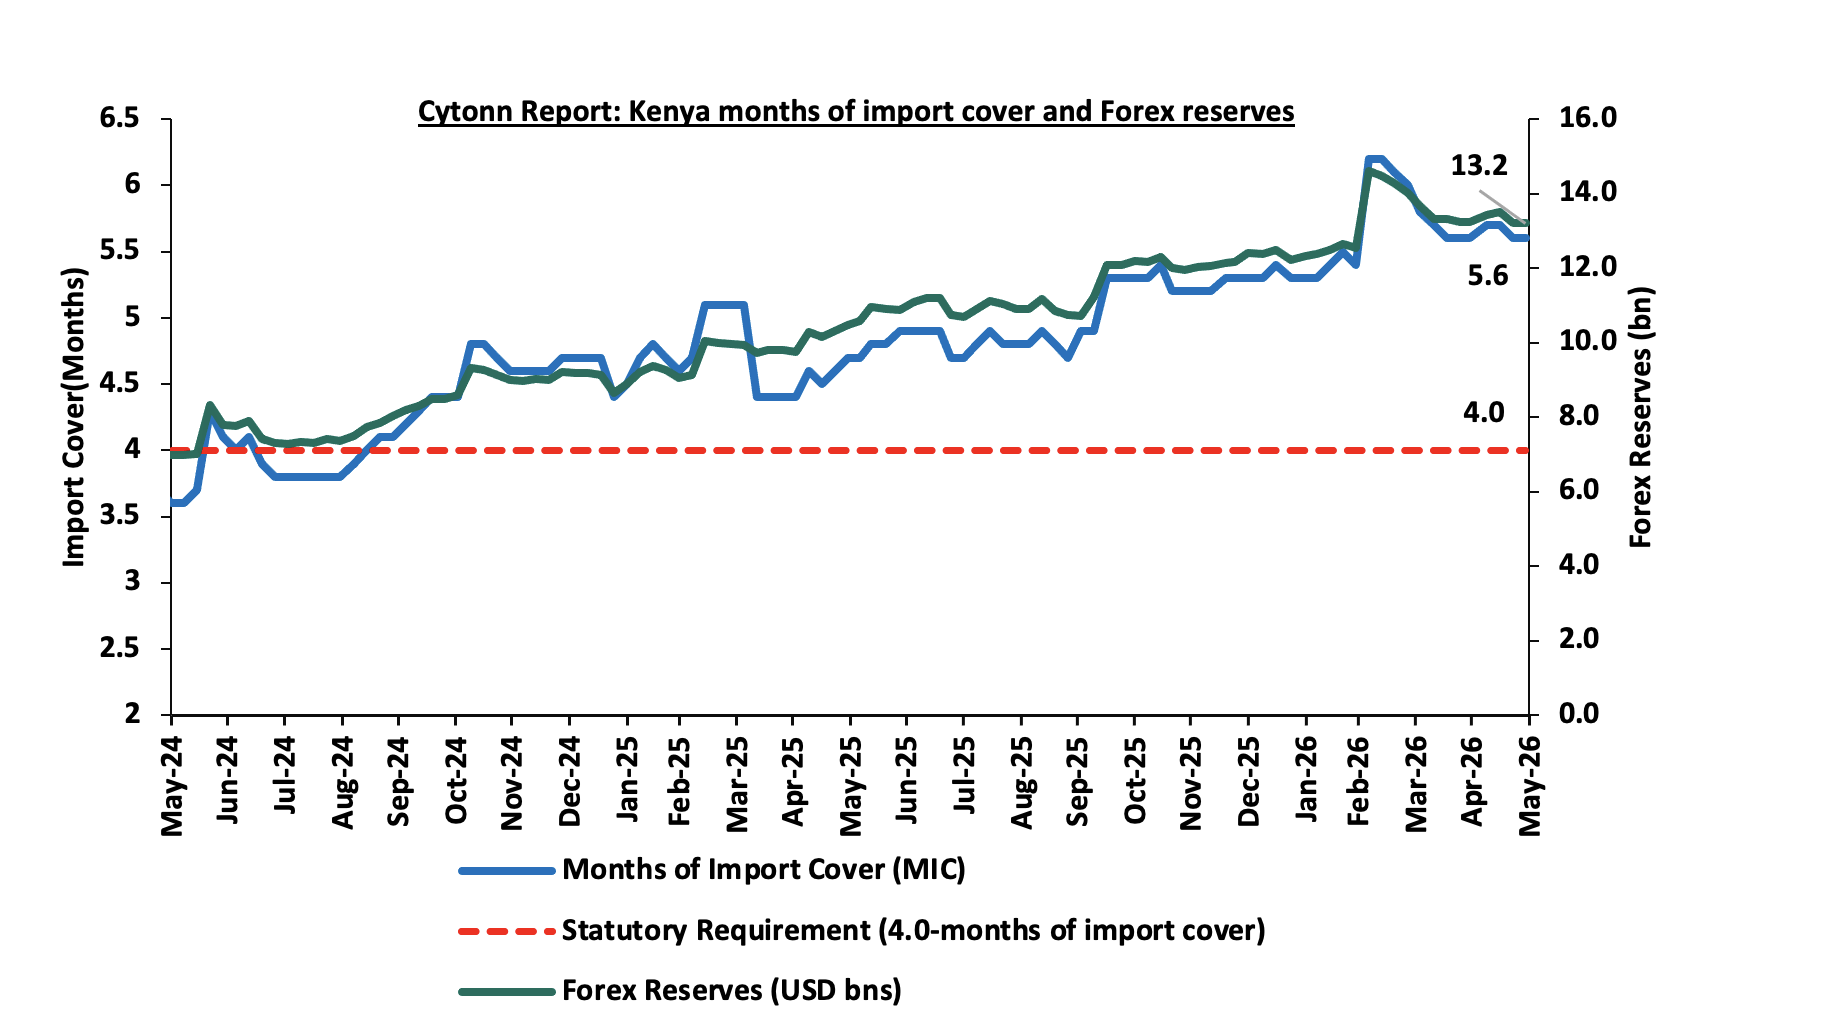
Improved forex reserves currently at USD 13.2 bn (equivalent to 5.6-months of import cover), which is above the statutory requirement of maintaining at least 4.0-months of import cover and above the EAC region’s convergence criteria of 4.5-months of import cover.
The shilling is however expected to remain under pressure in 2026 as a result of:
-
An ever-present current account deficit which came at 2.4% of GDP in the twelve months to February 2026, and,
-
The need for government debt servicing, continues to put pressure on forex reserves given that 52.0% of Kenya’s external debt is US Dollar-denominated as of September 2025.
-
Rising geopolitical tensions in the Middle East, which could exert pressure on the shilling through higher global oil prices and increased uncertainty in international markets. Given that Kenya is a net importer of petroleum products, any sustained increase in oil prices would widen the import bill, increase demand for US Dollars, and consequently put depreciation pressure on the shilling
Key to note, Kenya’s forex reserves decreased by 0.1% during the month of May 2026, to remain relatively unchanged from the USD 13.2 bn recorded in the previous month, equivalent to 5.6 months of import cover and above the statutory requirement of maintaining at least 4.0-months of import cover. This is attributable to higher demand for foreign currency and lower inflows, driven by increased oil import costs linked to the Middle East conflict and ongoing external debt repayments, with additional pressure from Central Bank interventions to support the Shilling. Additionally, during the month, the import cover remained relatively unchanged at 5.6 months recorded in the previous month. During the week, Kenya’s forex reserves decreased by 0.02% to remain relatively unchanged from the USD 13.2 bn recorded the previous week, equivalent to 5.6 months of import cover, and above the statutory requirement of maintaining at least 4.0-months of import cover. The chart below summarizes the evolution of Kenya's months of import cover over the years:
Weekly Highlights
-
Inflation Highlight May 2026
The year-on-year inflation in May 2026 increased by 1.1% points to 6.7% from the 5.6% % recorded in April 2026. The price increase was primarily driven by a rise in prices of items in the Food and Non-alcoholic Beverages at 9.4%; Transport 16.5%; and Housing, Water, Electricity, Gas and other fuels at 3.4%; over the one-year period. The month-on-month inflation rate stood at 1.6% in May 2026. The table below summarizes the performance of commodity indices both on a year-on-year and month-on-month basis:
|
Cytonn Report: Major Inflation Changes –May 2026 |
|||
|
Broad Commodity Group |
Price change m/m (May-2026/ April-2026) |
Price change y/y May-2026/May-2025) |
Reason |
|
Food and Non- Alcoholic Beverages |
1.8% |
9.4% |
The m/m increase was mainly driven by the significant rise in prices of tomatoes of 11.2% and increase in prices for Spinach and cabbages by 5.2% and 5.0%. However, the increase was weighed down by a decline in prices of beans and oranges by 0.4% and 0.2% respectively. |
|
Transport |
6.1% |
16.5% |
The m/m increase was driven by the significant increase in prices of diesel of 18.4%. Consequently, tuktuk fares rose by 12.0% coupled with the increase in prices for petrol by 8.4%. |
|
Housing, Water, Electricity, Gas and Other fuels |
0.9% |
3.4% |
The m/m increase was mainly due to increase in price of kerosene/paraffin by 25.3% and 0.8%. The increase was however weighed down due to decrease in the price of electricity with 50 kWh and 200kWh by 2.4% and 2.2% respectively. |
|
Overall Inflation |
1.6% |
6.7% |
The m/m increase was mainly attributable to the 6.1% increase in transport. |
In May 2026, overall inflation increased by 1.1% points to 6.7% from the 5.6% recorded in April 2026 on a y/y basis, signaling a sharp uptick in price pressures across major categories, but still remained within the Central Bank of Kenya’s preferred range of 2.5%–7.5%, for the thirty fifth consecutive month. Prices for Super Petrol and Diesel increased by Kshs 16.7, and Kshs 46.3 per litre to Kshs 214.3, and Kshs 242.9 per litre from Kshs 197.6, and 196.6 per litre respectively in April 2026, marking the second increase in 2026. While Kerosene remained unchanged at Kshs 152.8 per litre respectively effective from 15th May 2026 to 14th June 2026. Subsequently, the price schedule was revised effective 19th May 2026 to 14th June 2026. Diesel prices were adjusted downwards by Kshs 10.1 per litre to Kshs 232.8 per litre, while Kerosene prices were adjusted upward by Kshs 38.6 per litre to Kshs 191.4 per litre. Electricity costs decreased during the month, with 50kWh and 200 kWh decreasing by 2.4% and 2.2% respectively. Additionally, the recent maintenance in the Central Bank Rate at 8.75% remaining unchanged from February. The Monetary Policy Committee is expected to adopt a more cautious approach to rate adjustments in the coming meetings while monitoring the effects of the Middle East Conflict. Even with a cautious stance, cheaper credit from past easing, external supply shocks and potential currency depreciation create an environment where inflationary pressures can outpace CBK’s stabilizing efforts.
The chart below shows the inflation rates for the past 5 years:
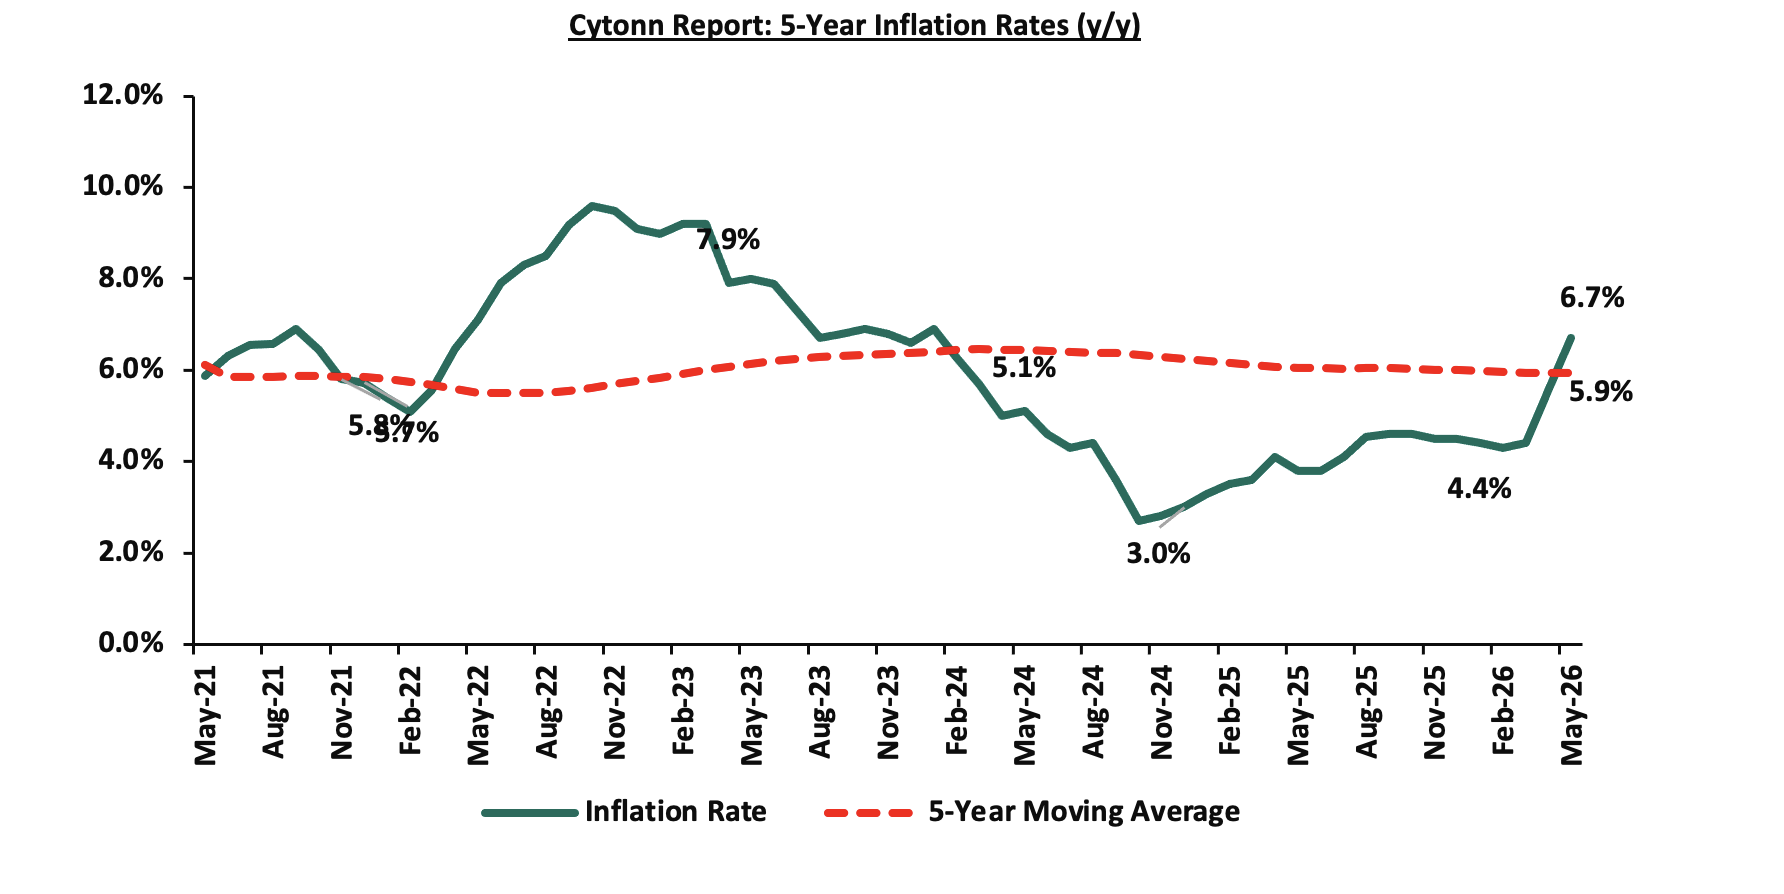
The ongoing US–Iran tensions continue to disrupt global oil logistics, particularly around the Strait of Hormuz, sustaining volatility and a persistent risk premium in crude oil prices. Although disruptions have shifted from acute shocks to more intermittent and structural supply frictions, Murban crude, Kenya’s key import grade, remains elevated and volatile, keeping upward pressure on future pump prices. Any pass through into fuel prices would have significant implications for inflation, given fuel’s central role in transport, logistics, and production costs. The conflict also affects electricity pricing through fuel cost adjustments and foreign exchange related generation costs, as global oil markets continue to price in heightened geopolitical uncertainty. Rising fuel and energy costs are expected to increase the cost of goods across the economy, particularly in manufacturing, agriculture, and distribution, as producers pass on higher input and transport expenses to consumers, thereby reinforcing cost push inflationary pressures. While the recent relative stability of the Kenya Shilling offers some temporary relief on imported inflation, this support remains vulnerable to renewed geopolitical risks and sustained oil price volatility. We however still expect inflationary pressures to remain anchored within the CBK’s target range of 2.5%-7.5%, but above the midpoint in the short to medium term.
Notable Monthly Highlights:
-
During the month, Stanbic Bank released its monthly Purchasing Manager’s Index (PMI), Kenya’s Purchasing Managers’ Index (PMI) stood at 49.4 in April 2026, up from the 47.7 in March, but remaining below the 50.0 neutral threshold for the second consecutive month, and, lower than 50.4 in February and the 55.0 peak recorded in November, indicating that business activity deteriorated. For more information, please see our Cytonn Weekly #18/2026
-
During the month, the National Treasury presented its Budget Estimates for the next fiscal year, FY’2026/27. Notably, the budget estimates recorded a 1.5% increase to Kshs 4.8 tn from the previous estimates of Kshs 4.7 tn in the Budget Policy Statement for FY’2026/27 and a 3.2% increase from the Kshs 4.6 tn in FY’2025/26 as per the Supplementary Budget I. For more information, please see our FY 2026/27 budget estimates note.
-
On 30th April 2026, the Cabinet Secretary for the National Treasury and Economic Planning presented the Finance Bill 2026 to the National Assembly for approval. For more information, please see our Finance Bill 2026 note.
-
During the month, the Energy and Petroleum Regulatory Authority (EPRA) released their monthly statement on the maximum retail fuel prices in Kenya, effective from 15th May 2026 to 14th June 2026. For more information please check our Cytonn Weekly #19/2026
-
During the month, I&M Bank released the results of the first tranche of its Kshs 20.0 bn Medium Term Note Programme, with tenors to maturity of 5.5 years, with maturity date of November 2031. The first tranche comprises Kshs 10.0 bn with a green shoe option of an additional Kshs 3.0 bn. For more information, please see our Cytonn Weekly #20/2026
Rates in the Fixed Income market have been on an upward trend due to tightening liquidity in the money market which has limited the government’s ability to front load its borrowing. The government is 15.2% ahead of its prorated net domestic borrowing target of Kshs 998.6 bn, having a net borrowing position of Kshs 1058.9 bn (inclusive of T-bills). We expect an upward shift in the the yield curve in the short and medium term, driven by the inflationary pressures and the government looking to increase its domestic borrowing to maintain the fiscal surplus.
Market Performance:
During the month of May, the equities market recorded a mixed performance, with NSE 10 and NASI gaining by 0.9% and 0.2% respectively, while NSE 20 and NSE 25 declined by 1.0% and 0.2%. The performance was mainly driven by losses recorded by large cap stocks such as BAT, Stanbic and ABSA of 9.4%, 5.8% and 5.7% respectively. However, the performance was supported by gains recorded by large-cap stocks such as Cooperative Bank, EABL and Equity Bank of 2.6%, 1.8% and 1.0% respectively.
During the week, the equities market recorded a mixed performance, with NSE 20 gaining by 0.7% while NSE10, NSE 25, and NASI declined by 0.4%, 04% and 0.3% respectively, taking the YTD performance to gains of 11.8%, 10.5%, 9.8% and 9.1% for NSE 20, NSE 25, NASI and NSE 10 respectively. The week-on-week equities market performance was driven by losses recorded by large-cap stocks such as Equity, Stanbic, and DTB-K of 2.3%, 1.8% and 1.5% respectively. The performance was however supported by gains recorded by large cap stocks such as BAT and EABL of 3.4% and 1.3% respectively.
Also, during the month, the banking sector index declined by 1.1% to close at 233.5 from the 236.1 recorded at the end of the April 2026. This was attributable to losses recorded by large-cap stocks such as Stanbic, Absa and Standard Chartered of 5.8%, 5.7% and 5.1% respectively. The performance was however supported by gains recorded by large cap stacks such as Cooperative Bank and Equity of 2.6% and 1.0% respectively.
During the week, the banking sector index declined by 1.4% to 233.5 from 236.9 recorded the previous week. This is attributable to losses recorded by large cap stocks such Equity, Stanbic, and DTB-K of 2.3%, 1.8% and 1.5% respectively.
During the month of May, equities turnover increased by 4.8% to USD 123.5mn from USD 117.8 mn recorded during the month of April 2026. Foreign investors became net buyers, with a net buying position of USD 2.2 mn, from a net selling position of USD 15.2 mn recorded in April 2026.
During the week, equities turnover increased by 29.3% to USD 37.2 mn from USD 28.8 mn recorded the previous week, taking the YTD total turnover to USD 681.3 mn. Foreign investors became net buyers for the first time in five weeks with a net buying position of USD 12.8 mn, from a net selling position of USD 1.9 mn recorded the previous week, taking the YTD foreign net selling position to USD 81.0 mn, compared to a net selling position of USD 92.9 mn recorded in 2025.
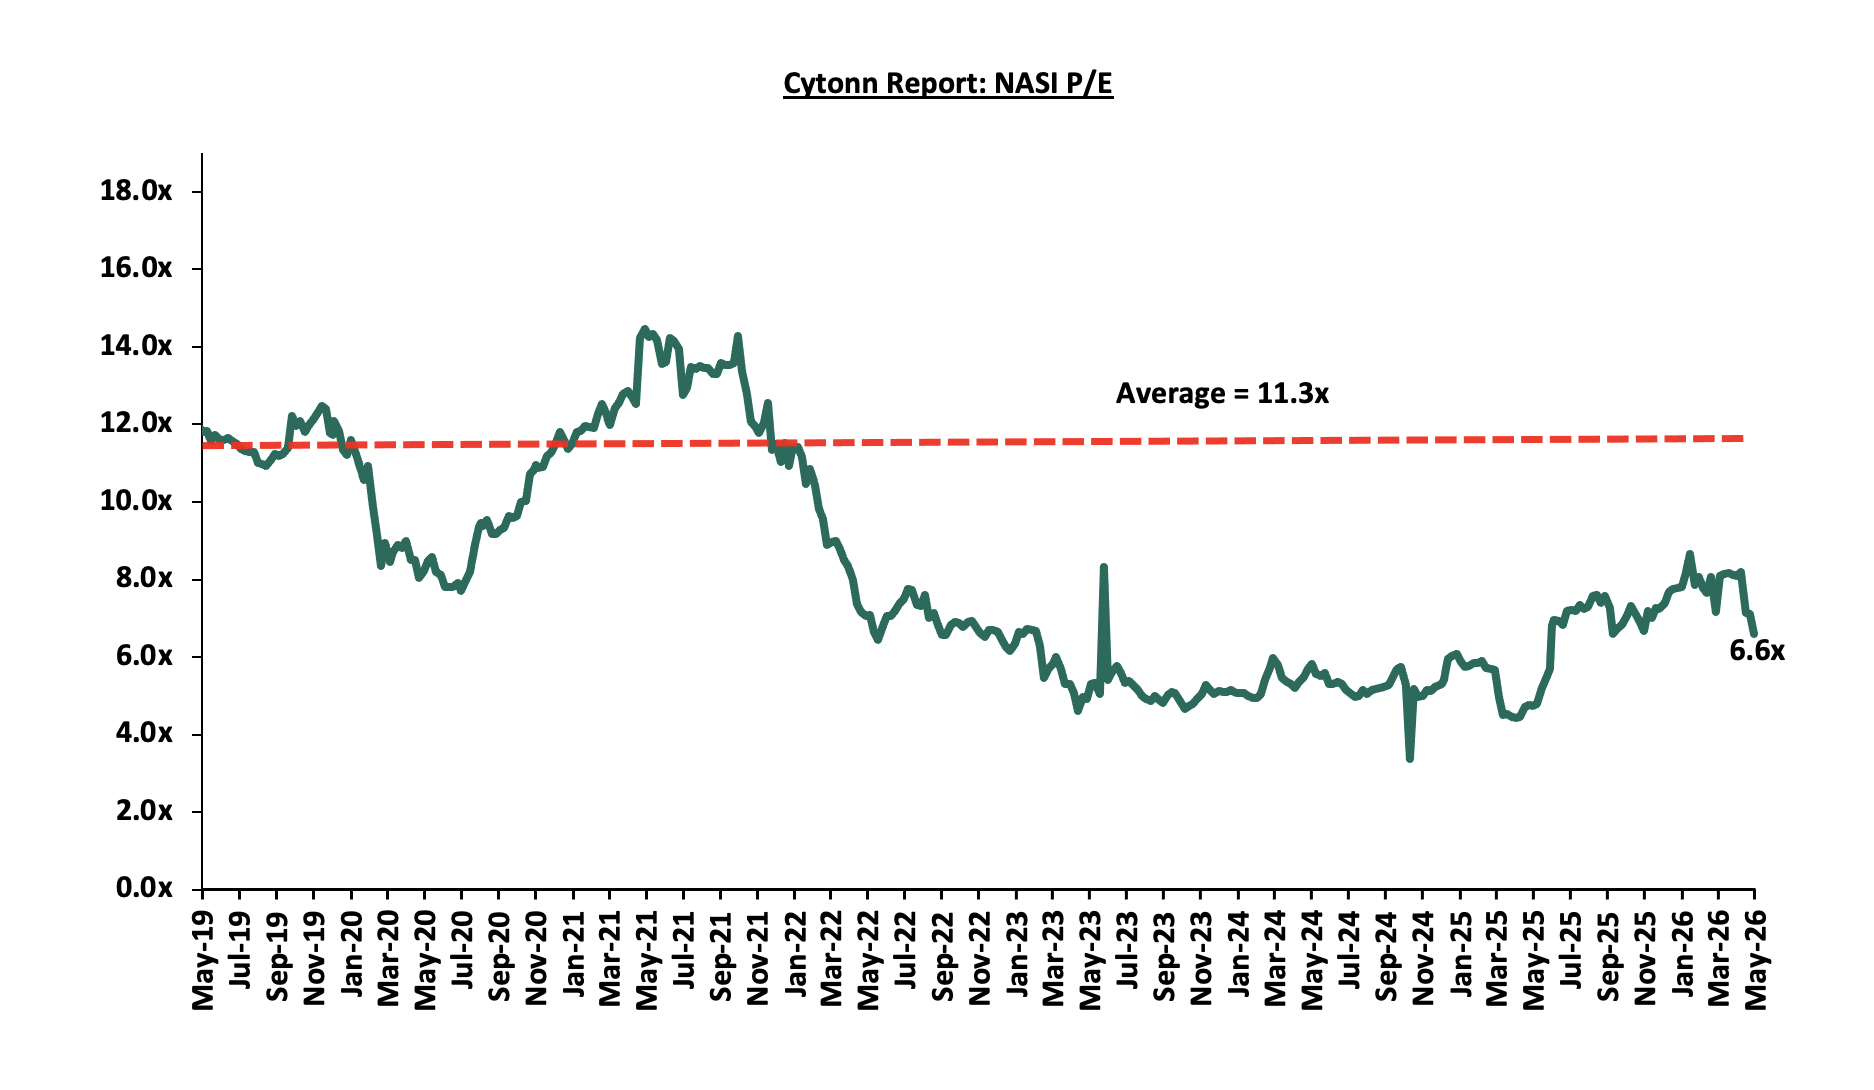
The market is currently trading at a price to earnings ratio (P/E) of 6.6x, 41.4% below the historical average of 11.3x, and a dividend yield of 6.8%, 2.1% points above the historical average of 4.7%. Key to note, NASI’s PEG ratio currently stands at 0.8x, suggesting that the market is undervalued relative to its expected earnings growth. A PEG ratio lower than 1.0x indicates the market may be undervalued while a PEG ratio greater than 1.0x indicates that the market is overvalued.
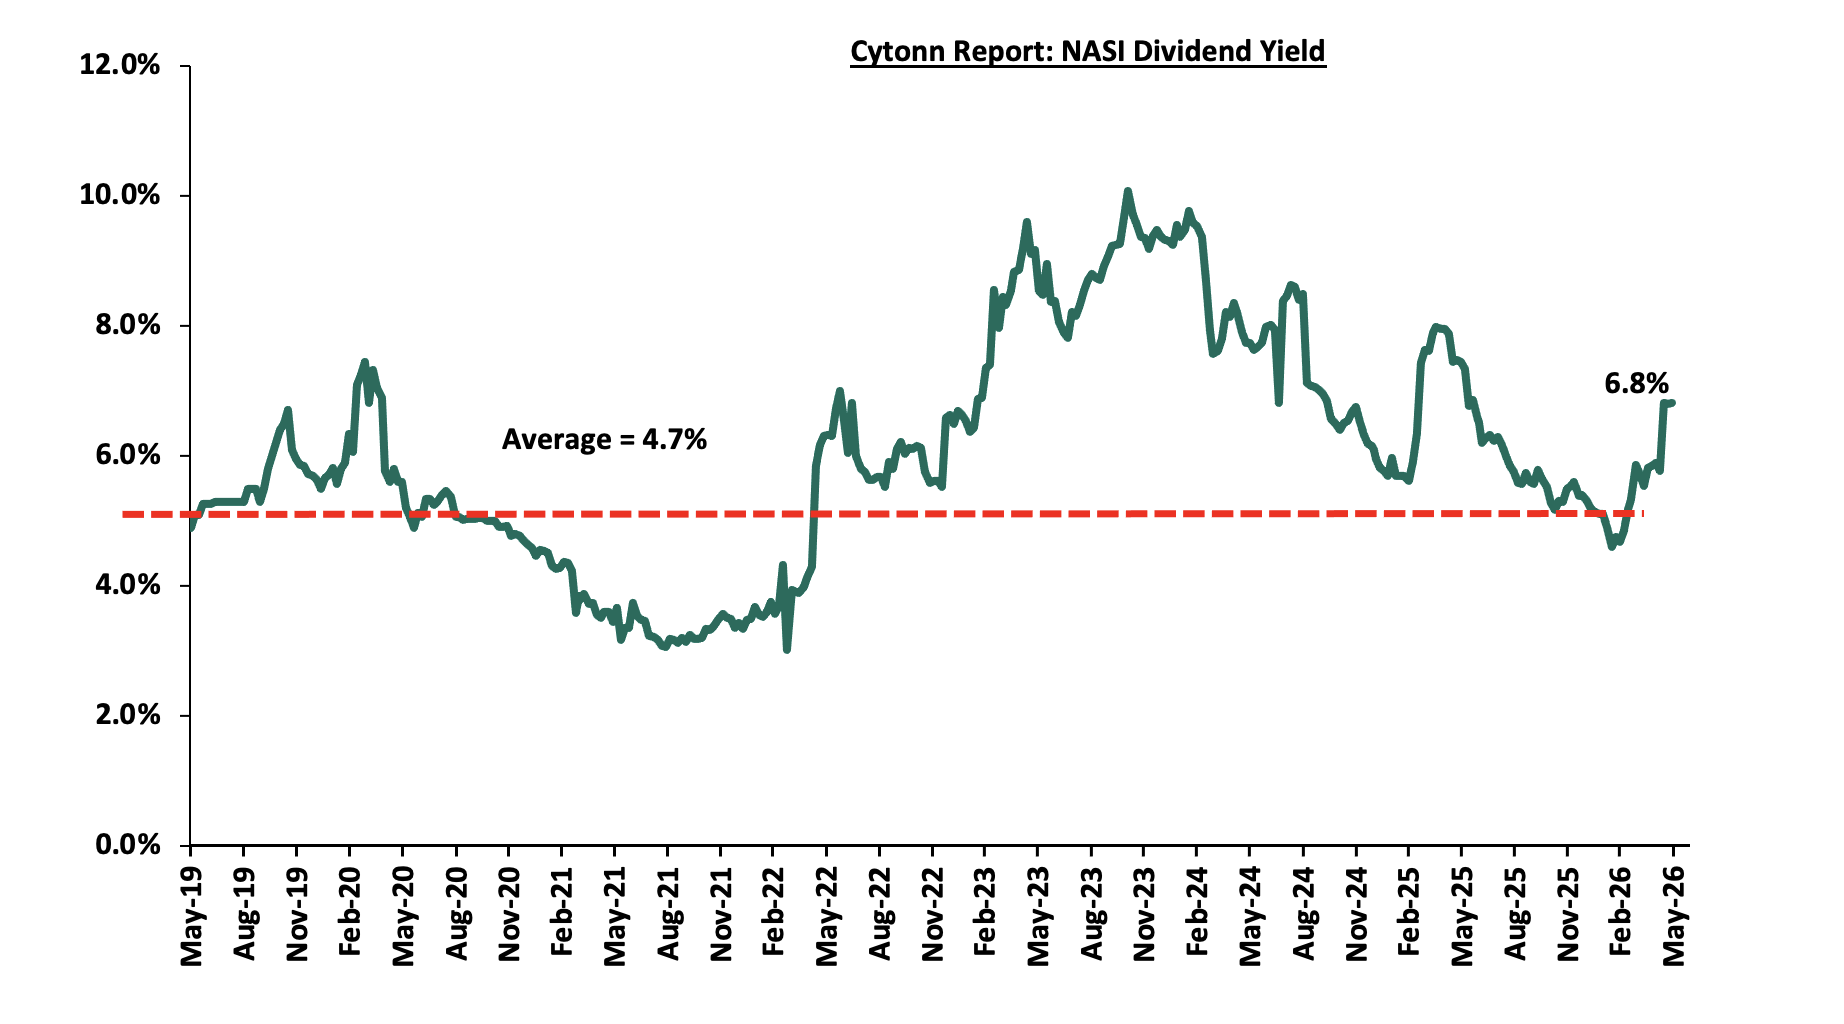
The charts below indicate the historical P/E and dividend yields of the market;
Universe of Coverage:
|
Cytonn Report: Equities Universe of Coverage |
|||||||||||
|
Company |
Price as at 22/05/2026 |
Price as at 29/05/2027 |
w/w change |
m/m change |
YTD Change |
Year Open 2026 |
Target Price* |
Dividend Yield |
Upside/ Downside** |
P/TBv Multiple |
Recommendation |
|
CIC Group |
4.2 |
4.2 |
0.7% |
(1.6%) |
(7.7%) |
4.5 |
5.5 |
3.1% |
34.4% |
1.1x |
Buy |
|
KCB Group |
66.8 |
66.8 |
0.0% |
(0.4%) |
1.5% |
65.8 |
81.1 |
10.5% |
32.0% |
0.7x |
Buy |
|
NCBA |
88.3 |
87.3 |
(1.1%) |
(2.0%) |
2.6% |
85.0 |
103.3 |
8.1% |
26.5% |
1.2x |
Buy |
|
Equity Group |
76.0 |
74.3 |
(2.3%) |
1.0% |
10.8% |
67.0 |
87.8 |
7.7% |
26.0% |
1.0x |
Buy |
|
Diamond Trust Bank |
149.5 |
147.3 |
(1.5%) |
(0.2%) |
28.3% |
114.8 |
175.1 |
6.1% |
25.0% |
0.4x |
Buy |
|
Co-op Bank |
32.3 |
32.1 |
(0.5%) |
2.6% |
34.3% |
23.9 |
37.2 |
7.8% |
23.6% |
1.2x |
Buy |
|
I&M Group |
50.0 |
50.8 |
1.5% |
2.5% |
18.6% |
42.8 |
56.7 |
7.4% |
19.0% |
0.8x |
Accumulate |
|
Stanbic Holdings |
274.5 |
269.5 |
(1.8%) |
(5.8%) |
36.3% |
197.8 |
297.5 |
8.3% |
18.7% |
1.5x |
Accumulate |
|
ABSA Bank |
28.8 |
28.8 |
0.0% |
(5.7%) |
15.7% |
24.9 |
31.7 |
7.1% |
17.5% |
1.6x |
Accumulate |
|
Jubilee Holdings |
365.3 |
367.3 |
0.5% |
(3.4%) |
13.9% |
322.5 |
407.5 |
4.1% |
15.0% |
0.5x |
Accumulate |
|
Standard Chartered Bank |
335.0 |
333.3 |
(0.5%) |
(5.1%) |
11.2% |
299.8 |
346.8 |
9.3% |
13.4% |
2.1x |
Accumulate |
|
Britam |
12.9 |
12.3 |
(4.3%) |
0.0% |
35.8% |
9.1 |
13.5 |
0.0% |
9.8% |
0.9x |
Hold |
|
*Target Price as per Cytonn Analyst estimates **Upside/ (Downside) is adjusted for Dividend Yield ***Dividend Yield is calculated using FY’2025 Dividends |
|||||||||||
Weekly Highlights
-
Earnings Releases
-
I&M Group’s Q1’2026 Financial Performance
During the week, I&M Group released their Q1’2026 financial results, recording a 19.4% increase in profit after tax to Kshs 5.0 bn in Q1’2026, from Kshs 4.2 bn in Q1’2025;
|
Balance Sheet Items (Kshs bn) |
Q1'2025 |
Q1'2026 |
y/y change |
|
Government Securities |
103.1 |
203.6 |
97.5% |
|
Net Loans and Advances |
293.7 |
322.9 |
10.0% |
|
Total Assets |
568.4 |
742.5 |
30.6% |
|
Customer Deposits |
407.0 |
512.1 |
25.8% |
|
Deposits/branch |
3.7 |
4.3 |
15.2% |
|
Total Liabilities |
461.5 |
611.9 |
32.6% |
|
Shareholders’ Funds |
99.9 |
123.3 |
23.5% |
|
Balance Sheet Ratios |
Q1'2025 |
Q1'2026 |
% points change |
|
Loan to Deposit Ratio |
72.1% |
63.1% |
(9.1%) |
|
Government Securities to Deposit Ratio |
25.3% |
39.8% |
14.4% |
|
Return on average equity |
13.9% |
17.4% |
3.5% |
|
Return on average assets |
2.5% |
3.2% |
0.6% |
|
Income Statement (Kshs bn) |
Q1'2025 |
Q1'2026 |
y/y change |
|
Net Interest Income |
9.4 |
12.3 |
31.1% |
|
Net non-Interest Income |
3.6 |
3.8 |
7.1% |
|
Total Operating income |
13.0 |
16.1 |
24.5% |
|
Loan Loss provision |
(1.6) |
(2.6) |
63.3% |
|
Total Operating expenses |
(7.3) |
(9.9) |
35.8% |
|
Profit before tax |
5.9 |
6.4 |
8.9% |
|
Profit after tax |
4.2 |
5.0 |
19.4% |
|
Core EPS |
2.6 |
3.0 |
19.4% |
|
Income Statement Ratios |
Q1'2025 |
Q1'2026 |
% points change |
|
Yield from interest-earning assets |
10.7% |
12.7% |
2.0% |
|
Cost of funding |
4.8% |
4.5% |
(0.3%) |
|
Net Interest Margin |
6.3% |
8.6% |
2.3% |
|
Net Interest Income as % of operating income |
72.3% |
76.2% |
3.9% |
|
Non-Funded Income as a % of operating income |
27.7% |
23.8% |
(3.9%) |
|
Cost to Income Ratio |
56.2% |
61.3% |
5.1% |
|
CIR without LLP |
43.9% |
45.2% |
1.3% |
|
Cost to Assets |
1.0% |
1.0% |
0.0% |
|
Capital Adequacy Ratios |
Q1'2025 |
Q1'2026 |
% points change |
|
Core Capital/Total Liabilities |
21.0% |
21.8% |
(0.1%) |
|
Minimum Statutory ratio |
8.0% |
8.0% |
0.0% |
|
Excess |
13.0% |
13.8% |
(0.1%) |
|
Core Capital/Total Risk Weighted Assets |
16.3% |
17.7% |
0.1% |
|
Minimum Statutory ratio |
10.5% |
10.5% |
0.0% |
|
Excess |
5.8% |
7.2% |
0.1% |
|
Total Capital/Total Risk Weighted Assets |
18.8% |
21.2% |
(0.1%) |
|
Minimum Statutory ratio |
14.5% |
14.5% |
0.0% |
|
Excess |
4.3% |
6.7% |
(0.1%) |
|
Liquidity Ratio |
50.4% |
65.0% |
14.6% |
|
Minimum Statutory ratio |
20.0% |
20.0% |
0.0% |
|
Excess |
30.4% |
(20.0%) |
0.0% |
Key Take-Outs:
-
Increased earnings - Core earnings per share grew by 19.4% to Kshs 3.0, from Kshs 2.6 in Q1’2025, driven by the 24.5% increase in total operating income to Kshs 16.1 bn, from Kshs 13.0 bn in Q1’2025. The performance was however weighed down by the 35.8% increase in total operating expenses to Kshs 9.9 bn from Kshs 7.3 bn in Q1’2025
-
Improved asset quality – The bank’s Asset Quality improved, with Gross NPL ratio decreasing by 1.8% points in Q1’2026, to 9.1% from 10.9% in Q1’2025, attributable to an 8.3% decrease in Gross non-performing loans to Kshs 31.6 bn, from Kshs 34.5 bn in Q1’2025, compared to the 6.2% increase in gross loans to Kshs 346.1 bn, from Kshs 315.6 bn recorded in Q1’2025,
-
Expanded Balanced sheet - The balance sheet registered an expansion as total assets increased by 30.6% to Kshs 742.5 bn in Q1’2026, from Kshs 568.4 bn in Q1’2025, mainly attributable to the growth in customer deposits that was largely channeled to investments in government securities.
-
Increased lending- Customer net loans and advances increased 10.0% Kshs 322.9 bn, from Kshs 293.7 bn in Q1’2025,
For a more detailed analysis, please see our I&M Group Q1’2026 Earnings Note.
-
Absa Bank’s Q1’2026 Financial Performance
During the week, Absa Bank released their Q1’2026 financial results, recording a 13.9% decrease in profit after tax to Kshs 5.3 bn in Q1’2026, from Kshs 6.2 bn in Q1’2025
|
Balance Sheet |
Q1'2025 (Kshs bn) |
Q1'2026 (Kshs bn) |
y/y change |
|
Government Securities |
144.0 |
174.5 |
21.2% |
|
Net Loans and Advances |
308.4 |
303.8 |
(1.5%) |
|
Total Assets |
520.2 |
571.3 |
9.8% |
|
Customer Deposits |
371.2 |
399.1 |
7.5% |
|
Deposit per Branch |
4.9 |
4.5 |
(8.2%) |
|
Total Liabilities |
427.7 |
465.2 |
8.8% |
|
Shareholder's Funds |
92.5 |
106.1 |
14.6% |
|
Balance sheet ratios |
Q1’2026 |
Q1’2025 |
% points change |
|
Loan to Deposit Ratio |
83.1% |
76.1% |
(7.0%) |
|
Govt Securities to Deposit ratio |
38.8% |
43.7% |
4.9% |
|
Return on average equity |
25.2% |
44.0% |
18.8% |
|
Return on average assets |
4.1% |
8.0% |
3.9% |
|
Income Statement |
Q1’2025 (Kshs bn) |
Q1'2026 (Kshs bn) |
y/y change |
|
Net Interest Income |
11.3 |
10.4 |
(7.9%) |
|
Net non-Interest Income |
4.5 |
4.3 |
(5.2%) |
|
Total Operating income |
15.8 |
14.7 |
(7.1%) |
|
Loan Loss provision |
(1.5) |
(1.5) |
(0.6%) |
|
Total Operating expenses |
(7.0) |
(7.2) |
2.4% |
|
Profit before tax |
8.8 |
7.5 |
(14.7%) |
|
Profit after tax |
6.2 |
5.3 |
(13.9%) |
|
Core EPS |
1.1 |
1.0 |
(13.9%) |
|
Income statement ratios |
Q1'2025 |
Q1'2026 |
% points change |
|
Yield from interest-earning assets |
13.9% |
11.5% |
(2.4%) |
|
Cost of funding |
4.4% |
3.2% |
(1.1%) |
|
Net Interest Spread |
0.9% |
0.7% |
(0.2%) |
|
Net Interest Margin |
10.1% |
8.7% |
(1.4%) |
|
Cost of Risk |
9.3% |
10.0% |
0.7% |
|
Net Interest Income as % of operating income |
71.4% |
70.8% |
(0.6%) |
|
Non-Funded Income as a % of operating income |
28.6% |
29.2% |
0.6% |
|
Cost to Income |
44.3% |
48.9% |
4.5% |
|
Cost to Income (Without LLPs) |
35.0% |
38.9% |
3.9% |
|
Cost to Assets |
1.1% |
1.0% |
(0.1%) |
|
Capital Adequacy Ratios |
Q1'2025 |
Q1'2026 |
% points change |
|
Core Capital/Total Liabilities |
20.5% |
21.4% |
0.9% |
|
Minimum Statutory ratio |
8.0% |
8.0% |
0.0% |
|
Excess |
12.5% |
13.4% |
0.9% |
|
Core Capital/Total Risk Weighted Assets |
17.3% |
18.6% |
1.3% |
|
Minimum Statutory ratio |
10.5% |
10.5% |
0.0% |
|
Excess |
6.8% |
8.1% |
1.3% |
|
Total Capital/Total Risk Weighted Assets |
20.4% |
21.0% |
0.6% |
|
Minimum Statutory ratio |
14.5% |
14.5% |
0.0% |
|
Excess |
5.9% |
6.5% |
0.6% |
|
Liquidity Ratio |
46.9% |
53.2% |
6.3% |
|
Minimum Statutory ratio |
20.0% |
20.0% |
0.0% |
|
Excess |
26.9% |
33.2% |
6.3% |
Key Take-Outs:
-
Decreased earnings - Core earnings per share declined by 13.9% to Kshs 1.0, from Kshs 1.1 in Q1’2026, driven by the 7.1% decrease in total operating income to Kshs 14.7bn, from Kshs 15.8 bn in Q1’2025, coupled with 2.4% increase in total operating expense to Kshs 7.2 bn from Kshs 7.0 bn in Q1’2025,
-
Improved asset quality – The bank’s Asset Quality improved, with Gross NPL ratio decreasing to 11.6% in Q1’2026, from 13.1% in Q1’2025, attributable to a 13.5% decrease in Gross non-performing loans to Kshs 38.1 bn, from Kshs 44.0 bn in Q1’2025, relative to the 2.3% decrease in gross loans to Kshs 38.1 bn, from Kshs 44.0 bn recorded in Q1’2025.
-
Expanded Balanced sheet - The balance sheet recorded an expansion as total assets increased by 9.8% to Kshs 571.3 bn, from Kshs 520.2 bn in Q1’2026, mainly driven by a 44.1% increase in cash and bank balance to Kshs 41.1 bn, from 28.5 bn in Q1’2025. Net loans and advances decreased by 1.5% to Kshs 303.8 bn, from Kshs 308.4 bn in Q1’2025.
-
Increased Government Holdings – Government Securities increased by 21.2% to Kshs 174.5 bn from Kshs 144.0 bn recorded in Q1’2025, owing to a 6.8% decrease in government securities interest income to Kshs 3.0 bn from Kshs 3.2 bn recorded in Q1’2025.
For a more detailed analysis, please see our Absa Group Q1’2026 Earnings Note.
-
HFCB Group Q1’2026 Financial Performance
During the week, HFCB Group released their Q1’2026 financial results, recording a 45.0% increase in profit after tax to Kshs 0.5 bn in Q1’2026, from Kshs 0.3 bn in Q1’2025;
|
Balance Sheet Items |
Q1'2025 |
Q1'2026 |
y/y change |
|
Net loans |
38.9 |
41.8 |
7.4% |
|
Government Securities |
20.4 |
33.7 |
64.9% |
|
Total Assets |
73.4 |
90.5 |
23.3% |
|
Customer Deposits |
50.1 |
65.5 |
30.7% |
|
Deposits Per Branch |
2.3 |
3.0 |
30.7% |
|
Total Liabilities |
57.2 |
72.0 |
25.9% |
|
Shareholder's Funds |
16.2 |
18.5 |
14.3% |
|
Balance Sheet Ratios |
Q1'2025 |
Q1'2026 |
y/y change |
|
Loan to deposit ratio |
77.6% |
63.8% |
(13.8%) |
|
Government Securities to deposit ratio |
40.7% |
51.4% |
10.7% |
|
Return on Average Equity |
5.6% |
9.1% |
3.5% |
|
Return on Average Assets |
1.0% |
1.9% |
0.9% |
|
Income Statement |
Q1'2025 |
Q1'2026 |
y/y change |
|
Net Interest Income |
1.0 |
1.3 |
27.9% |
|
Net non-Interest Income |
0.4 |
0.6 |
33.9% |
|
Total Operating income |
1.4 |
1.8 |
29.7% |
|
Loan Loss provision |
(0.1) |
(0.1) |
12.4% |
|
Total Operating expenses |
(1.1) |
(1.23) |
13.8% |
|
Profit before tax |
0.3 |
0.6 |
80.5% |
|
Profit after tax |
0.3 |
0.5 |
45.0% |
|
Core EPS |
0.1 |
0.2 |
67.0% |
|
Income Statement Ratios |
Q1'2025 |
Q1'2026 |
y/y change |
|
Yield from interest-earning assets |
12.2% |
9.7% |
(2.5%) |
|
Cost of funding |
7.1% |
6.1% |
(1.0%) |
|
Net Interest Spread |
5.1% |
3.6% |
(1.5%) |
|
Net Interest Margin |
5.4% |
6.8% |
1.3% |
|
Cost of Risk |
7.1% |
6.6% |
(0.5%) |
|
Net Interest Income as % of operating income |
70.0% |
69.0% |
(1.0%) |
|
Non-Funded Income as a % of operating income |
30.0% |
31.0% |
1.0% |
|
Cost to Income Ratio (with LLP) |
76.2% |
66.9% |
(9.3%) |
|
Cost to Income Ratio (without LLP) |
69.1% |
60.7% |
(8.4%) |
|
Capital Adequacy Ratios |
Q1'2025 |
Q1'2026 |
y/y change |
|
Core Capital/Total Liabilities |
18.1% |
15.7% |
(2.4%) |
|
Minimum Statutory ratio |
8.0% |
8.0% |
0.0% |
|
Excess |
10.1% |
7.7% |
(2.4%) |
|
Core Capital/Total Risk Weighted Assets |
21.3% |
21.6% |
0.3% |
|
Minimum Statutory ratio |
10.5% |
10.5% |
0.0% |
|
Excess |
10.8% |
11.1% |
0.3% |
|
Total Capital/Total Risk Weighted Assets |
24.3% |
23.1% |
(1.2%) |
|
Minimum Statutory ratio |
14.5% |
14.5% |
0.0% |
|
Excess |
9.8% |
8.6% |
(1.2%) |
|
Liquidity Ratio |
45.1% |
56.6% |
11.5% |
|
Minimum Statutory ratio |
20.0% |
20.0% |
0.0% |
|
Excess |
25.1% |
36.6% |
11.5% |
Key Take-Outs:
-
Improved Profitability – HFCB posted a 45.0% increase in Profit After Tax to Kshs 0.5 bn from Kshs 0.3 bn in Q1’2025, supported by a 27.9% growth in net interest income to Kshs 1.3 bn from Kshs 1.0 bn in Q1’2025 and a 33.9% increase in non-interest income to Kshs 0.6 bn from Kshs 0.4 bn in Q1’2025. However, operating expenses rose by 13.8% to Kshs 1.2 bn from Kshs 1.1 bn, weighing on performance.
-
Improved asset quality – The bank’s asset quality improved, as the Gross NPL ratio declined to 21.7% in Q1’2026 from 25.2% in Q1’2025. This was supported by a 6.5% growth in gross loans to Kshs 50.6 bn from Kshs 47.5 bn in Q1’2025, compared to the 8.4% decline in gross non-performing loans to Kshs 11.0 bn from Kshs 12.0 bn in Q1’2025
-
Expanded Balanced sheet - as total assets increased by 23.3% to Kshs 90.5 bn, from Kshs 73.4 bn in Q1’2025, mainly driven by a 64.9% increase in governments securities holdings to Kshs 33.7 bn, from 20.4 bn in Q1’2025, coupled with a 7.4% increase in net loans and advances to Kshs 41.8 bn, from Kshs 38.9 bn in Q1’2025.
-
Increased lending- Customer net loans and advances increased by 7.4% to Kshs 41.8 bn in Q1’2026, from Kshs 38.9 bn in Q1’2025.
For a more detailed analysis, please see our HFCB Group Q1’2026 Earnings Note
-
SCBK Q1’2026 Financial Performance
During the week, Standard Chartered Bank released their Q1’2026 financial results, recording a 26.3% decrease in profit after tax to Kshs 3.6 bn in Q1’2026, from Kshs 4.9 bn in Q1’2025.
|
Balance Sheet Items |
Q1'2025 |
Q1'2026 |
y/y change |
|
Net loans |
137.9 |
165.4 |
20.0% |
|
Government Securities |
95.7 |
100.4 |
5.0% |
|
Total Assets |
382.3 |
413.3 |
8.1% |
|
Customer Deposits |
285.2 |
321.2 |
12.6% |
|
Deposits per Branch |
11.4 |
14.6 |
28.0% |
|
Total Liabilities |
306.2 |
343.4 |
12.2% |
|
Shareholder's Funds |
76.1 |
69.8 |
(8.2%) |
|
Balance Sheet Ratios |
Q1'2025 |
Q1'2026 |
% points change |
|
Loan to deposit ratio |
48.3% |
51.5% |
3.2% |
|
Government securities to deposit ratio |
33.6% |
31.3% |
(2.3%) |
|
Return on Average Equity |
26.8% |
43.4% |
16.6% |
|
Return on Average Assets |
5.0% |
8.0% |
3.0% |
|
Income Statement |
Q1'2025 |
Q1'2026 |
y/y change |
|
Net Interest Income |
8.2 |
6.3 |
(23.3%) |
|
Net non-Interest Income |
3.4 |
3.7 |
10.3% |
|
Total Operating income |
11.6 |
10.0 |
(13.5%) |
|
Loan Loss provision |
0.4 |
0.3 |
(20.7%) |
|
Total Operating expenses |
5.0 |
4.9 |
(0.3%) |
|
Profit before tax |
6.6 |
5.1 |
(23.3%) |
|
Profit after tax |
4.9 |
3.6 |
(26.3%) |
|
Core EPS |
12.9 |
9.5 |
(26.3%) |
|
Income Statement Ratios |
Q1'2025 |
Q1'2026 |
%points change |
|
Yield from interest-earning assets |
11.2% |
9.0% |
(2.2%) |
|
Cost of funding |
1.8% |
1.2% |
(0.6%) |
|
Net Interest Spread |
9.4% |
7.8% |
(1.6%) |
|
Net Interest Margin |
9.6% |
7.9% |
(1.7%) |
|
Cost of Risk |
3.6% |
3.3% |
(0.3%) |
|
Net Interest Income as % of operating income |
70.8% |
62.7% |
(8.0%) |
|
Non-Funded Income as a % of operating income |
29.2% |
37.3% |
8.0% |
|
Cost to Income Ratio |
42.7% |
49.3% |
6.5% |
|
Cost to Income Ratio without LLP |
39.2% |
46.0% |
6.8% |
|
Cost to Assets |
1.2% |
1.2% |
(0.0%) |
|
Capital Adequacy Ratios |
Q1'2025 |
Q1'2026 |
% points change |
|
Core Capital/Total Liabilities |
19.8% |
17.6% |
(2.2%) |
|
Minimum Statutory ratio |
8.0% |
8.0% |
0.0% |
|
Excess |
11.8% |
9.6% |
(2.2%) |
|
Core Capital/Total Risk Weighted Assets |
20.6% |
18.8% |
(1.8%) |
|
Minimum Statutory ratio |
10.5% |
10.5% |
0.0% |
|
Excess |
10.1% |
8.3% |
(1.8%) |
|
Total Capital/Total Risk Weighted Assets |
20.6% |
18.9% |
(1.8%) |
|
Minimum Statutory ratio |
14.5% |
14.5% |
0.0% |
|
Excess |
6.1% |
4.4% |
(1.8%) |
|
Liquidity Ratio |
73.6% |
66.3% |
(7.3%) |
|
Minimum Statutory ratio |
20.0% |
20.0% |
0.0% |
|
Excess |
53.6% |
46.3% |
(7.3%) |
-
Declined earnings growth – Core earnings per share decreased by 26.3% to Kshs 3.6 in Q1’2026, from Kshs 4.9 in Q1’2025, mainly driven by the 13.5% decrease in total operating income to Kshs 10.0 bn in Q1’2026, from Kshs 11.6 bn in Q1’2025, which outpaced a 0.3% marginal decrease in Total Operating expense to Kshs 4.9 bn in Q1’2026, from Kshs 5.0 bn in Q1’2025,
-
Improved asset quality – The bank’s Asset improved, with Gross NPL ratio decreasing to 5.2% in Q1’2026, from 8.3% in Q1’2025, attributable to the 26.7% decrease in gross non-performing loans to Kshs 8.9 bn, from Kshs 12.2 bn in Q1’2025, which outpaced the 17.3% increase in gross loans to Kshs 173.0 bn, from Kshs 147.5 bn recorded in Q1’2025, and,
-
Non-Declaration of dividends- The Board of Directors did not recommend an interim dividend for the period consistent with Q1’2025.
For a more detailed analysis, please see our StanChart’s Q1’2026 Earnings Note.
Summary Performance
The table below shows the performance of listed banks that have released their Q1’2026 results using several metrics:
|
Bank |
Core EPS Growth |
Interest Income Growth |
Interest Expense Growth |
Net Interest Income Growth |
Net Interest Margin |
Non-Funded Income Growth |
NFI to Total Operating Income |
Growth in Total Fees & Commissions |
Deposit Growth |
Growth in Government Securities |
Loan to Deposit Ratio |
Loan Growth |
Return on Average Equity |
COF |
YIEA |
|
HF Group |
67.0% |
14.3% |
(2.4%) |
27.9% |
6.8% |
33.9% |
31.0% |
1.9% |
30.7% |
64.9% |
63.8% |
7.4% |
9.1% |
5.2% |
11.3% |
|
Equity Group |
24.0% |
4.6% |
(19.1%) |
15.6% |
7.9% |
13.7% |
40.3% |
27.4% |
12.6% |
7.5% |
59.0% |
8.6% |
27.4% |
3.0% |
10.5% |
|
Co-operative Bank |
21.3% |
4.8% |
(8.3%) |
12.2% |
8.9% |
16.3% |
33.6% |
14.4% |
16.6% |
12.7% |
71.3% |
13.6% |
18.9% |
4.7% |
13.0% |
|
I&M Group |
19.4% |
19.3% |
1.2% |
31.1% |
8.6% |
7.1% |
23.8% |
(5.1%) |
25.8% |
97.5% |
63.1% |
10.0% |
17.4% |
4.5% |
12.7% |
|
KCB Group |
10.0% |
2.1% |
(11.1%) |
8.6% |
8.5% |
8.3% |
31.7% |
6.7% |
15.7% |
18.5% |
73.1% |
18.6% |
21.6% |
3.6% |
11.8% |
|
NCBA Group |
8.8% |
3.0% |
(23.3%) |
22.0% |
7.7% |
6.3% |
39.2% |
6.6% |
9.8% |
15.6% |
59.6% |
13.0% |
19.1% |
4.2% |
11.5% |
|
Diamond Trust Bank |
7.7% |
10.3% |
(12.2%) |
30.9% |
7.0% |
(3.2%) |
22.6% |
2.1% |
10.4% |
16.7% |
63.2% |
13.8% |
11.4% |
5.0% |
11.7% |
|
Stanbic Group |
5.5% |
4.7% |
(6.4%) |
11.7% |
5.7% |
(13.7%) |
23.9% |
4.0% |
21.7% |
73.5% |
62.8% |
5.8% |
19.6% |
3.6% |
10.0% |
|
Absa Bank Kenya |
(13.9%) |
(10.2%) |
(17.1%) |
(7.9%) |
8.7% |
(5.2%) |
29.2% |
9.6% |
7.5% |
21.2% |
76.1% |
(1.5%) |
44.0% |
3.2% |
11.5% |
|
Standard Chartered Bank |
(26.3%) |
(22.3%) |
(15.1%) |
(23.3%) |
7.9% |
10.3% |
37.3% |
21.9% |
12.6% |
5.0% |
51.5% |
20.0% |
43.4% |
1.2% |
9.0% |
|
Q1'2026 Mkt Weighted Average* |
9.2% |
1.2% |
(13.5%) |
9.7% |
8.0% |
7.1% |
33.3% |
12.6% |
14.5% |
24.2% |
65.0% |
11.2% |
25.8% |
3.5% |
11.3% |
|
Q1'2025 Mkt Weighted Average** |
(0.7%) |
(1.4%) |
(14.4%) |
7.9% |
8.0% |
(11.2%) |
33.6% |
0.9% |
0.6% |
30.2% |
66.5% |
(2.3%) |
21.7% |
5.0% |
12.6% |
|
*Market cap weighted as at 29/05/2026 |
|||||||||||||||
|
**Market cap weighted as at 13/06/2025 |
|||||||||||||||
X
Key take-outs from the table include:
-
The listed banks recorded a 9.2% weighted average growth in core Earnings per Share (EPS) in Q1’2026, compared to the weighted average decline of 0.7% in Q1’2025.
-
Interest income recorded a weighted average increase of 1.2% in Q1’2026, compared to the 1.4% decline recorded in Q1’2025. Interest expenses recorded a market-weighted average decline of 13.5% in Q1’2026, compared to the 14.4% decline in Q1’2025.
-
The Banks’ net interest income recorded a weighted average growth of 9.7% in Q1’2026, from the 7.9% growth recorded over a similar period in 2025, while non-funded income increased by 7.1% in Q1’2026 compared to the 11.2% decline recorded in Q1’2025, and,
-
The Banks recorded a weighted average deposit growth of 14.5% in Q1’2026, compared to the market-weighted average deposit growth of 0.6% in Q1’2025.
Asset Quality:
The table below shows the asset quality of listed banks that have released their Q1’2026 results using NPL ratio and NPL coverage:
|
Bank |
Q1'2026 NPL Ratio* |
Q1'2025 NPL Ratio** |
% point change in NPL Ratio |
Q1'2026 NPL Coverage* |
Q1'2025 NPL Coverage** |
% point change in NPL Coverage |
|
KCB Group |
15.9% |
19.9% |
(4.0%) |
75.7% |
67.0% |
8.7% |
|
HF Group |
21.7% |
25.2% |
(3.5%) |
80.6% |
72.1% |
8.5% |
|
Equity Group |
11.5% |
15.0% |
(3.5%) |
68.5% |
60.5% |
7.9% |
|
Standard Chartered Bank |
5.2% |
8.3% |
(3.1%) |
85.5% |
78.7% |
6.8% |
|
Co-operative Bank |
14.7% |
17.1% |
(2.4%) |
67.7% |
64.2% |
3.5% |
|
I&M Group |
9.1% |
10.9% |
(1.8%) |
73.4% |
63.6% |
9.8% |
|
Absa Bank Kenya |
11.6% |
13.1% |
(1.5%) |
66.6% |
65.2% |
1.4% |
|
Diamond Trust Bank |
11.8% |
13.2% |
(1.5%) |
56.1% |
39.9% |
16.2% |
|
NCBA Group |
11.2% |
12.2% |
(0.9%) |
66.2% |
63.0% |
3.2% |
|
Stanbic Holdings |
8.4% |
8.7% |
(0.4%) |
85.4% |
80.8% |
4.6% |
|
Mkt Weighted Average |
11.8% |
14.0% |
(2.2%) |
72.0% |
66.3% |
5.7% |
|
*Market cap weighted as at 29/05/2026 |
||||||
|
**Market cap weighted as at 13/06/2025 |
||||||
Key take-outs from the table include;
-
Asset quality for the listed banks improved during Q1’2026, with the market-weighted average NPL ratio decreasing by 2.2% points to 11.8%, from 14.0% in Q1’2025. The improvement was supported by reduced NPL ratios across several banks, including KCB, HFCB, Equity Group, Standard Chartered, DTB, I&M Group, and NCBA.
-
Market-weighted average NPL coverage increased by 5.7% points to 72.0% in Q1’2026 from 66.3% recorded in Q1’2025. The increase was attributable to increases in coverage by individual banks such as Diamond Trust Bank by 16.2% points, I&M Group by 9.8% points, and KCB by 8.7% points.
Notable Monthly Highlights
-
During the month, Stanbic Bank, NCBA Group, Co-operative Bank, KCB Group, Equity Group Holdings, and DTB-K released their Q1 2026 financial results. For more information, please see their respective Earnings Notes;
-
During the month, Safaricom Plc released its FY’2026 financial results for the period ending 31st March 2026, highlighting that the profit after tax (PAT) for the Group increased by 61.0% to Kshs 73.7 bn, from 45.8 bn recorded in FY’2025. For more information, please see our Cytonn Weekly #18/2026;
We maintain a “cautiously optimistic” short-term outlook supported primarily earnings-led attractive valuations, lower yields on short-term government papers and expected global and local economic recovery, and, “neutral” in the long term as persistent foreign investor outflows continue to constrain market liquidity and limit broad-based market re-rating. With the market currently trading below its future growth prospects (PEG Ratio at 0.8x), where performance will be driven by company-specific fundamentals rather than general market direction, we believe that investors should reposition towards value stocks exhibiting strong earnings growth, attractive dividend yields, solid balance sheets, sustainable competitive advantages and trading at compelling discounts to their intrinsic value. While foreign investor sell-offs are expected to continue exerting pressure in the near term, we believe this will create selective entry opportunities for long-term investors.
-
Industry Report
-
February Leading Economic Indicators (LEI)
During the week, the Kenya National Bureau of Statistics (KNBS) released the Leading Economic Indicators (LEI) March 2026 Report, which highlighted the performance of major economic indicators. The key highlights related to the Real Estate sector include:
-
In Q1’2026, cement consumption reached 2.8 metric tonnes, representing a 17.9% y/y increase from 2.3 metric tonnes in Q1’2025. On a quarter to quarter basis cement consumption decreased by 2.9% in Q1’2026 from 2.8 in Q4’2025. Month-on-month, consumption increased by 3.9%, to 939,681 from 904,539 in February 2026 reflecting an increase in momentum in the construction sector. The y/y performance was anchored by (i) continued private sector construction activity in urban hubs such as Nairobi, Mombasa, and Kisumu, (ii) government-led infrastructure investments under the Bottom-Up Economic Transformation Agenda (BETA), including roads, affordable housing, water, and sanitation projects, and (iii) public works initiatives in rural and semi-urban areas, which both support livelihoods and expand critical infrastructure.
The chart below shows cement consumption in metric tonnes in Kenya between Q1’2023 and Q1’2026;
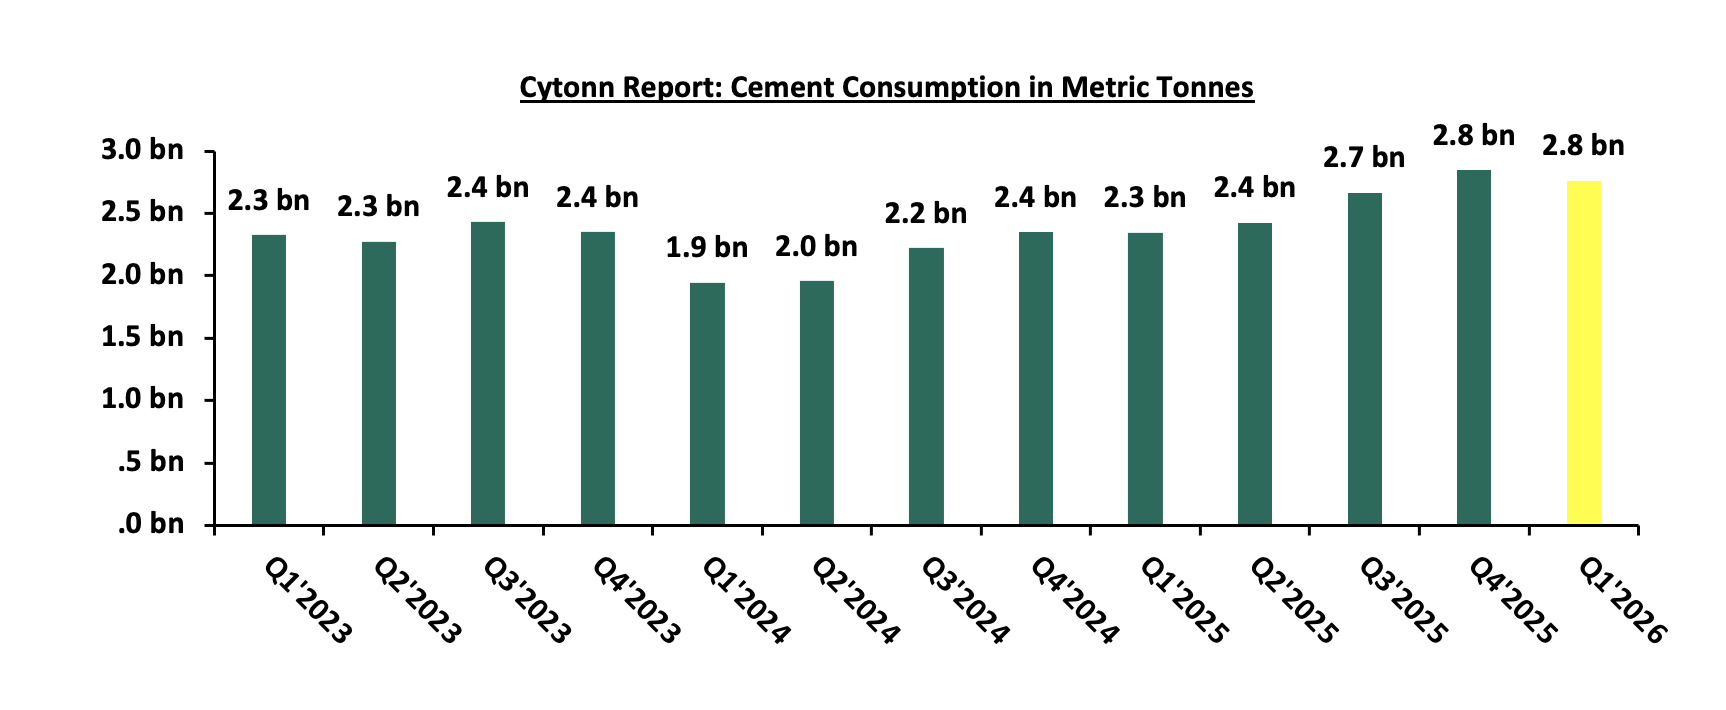
Source: Kenya National Bureau of Statistics (KNBS)
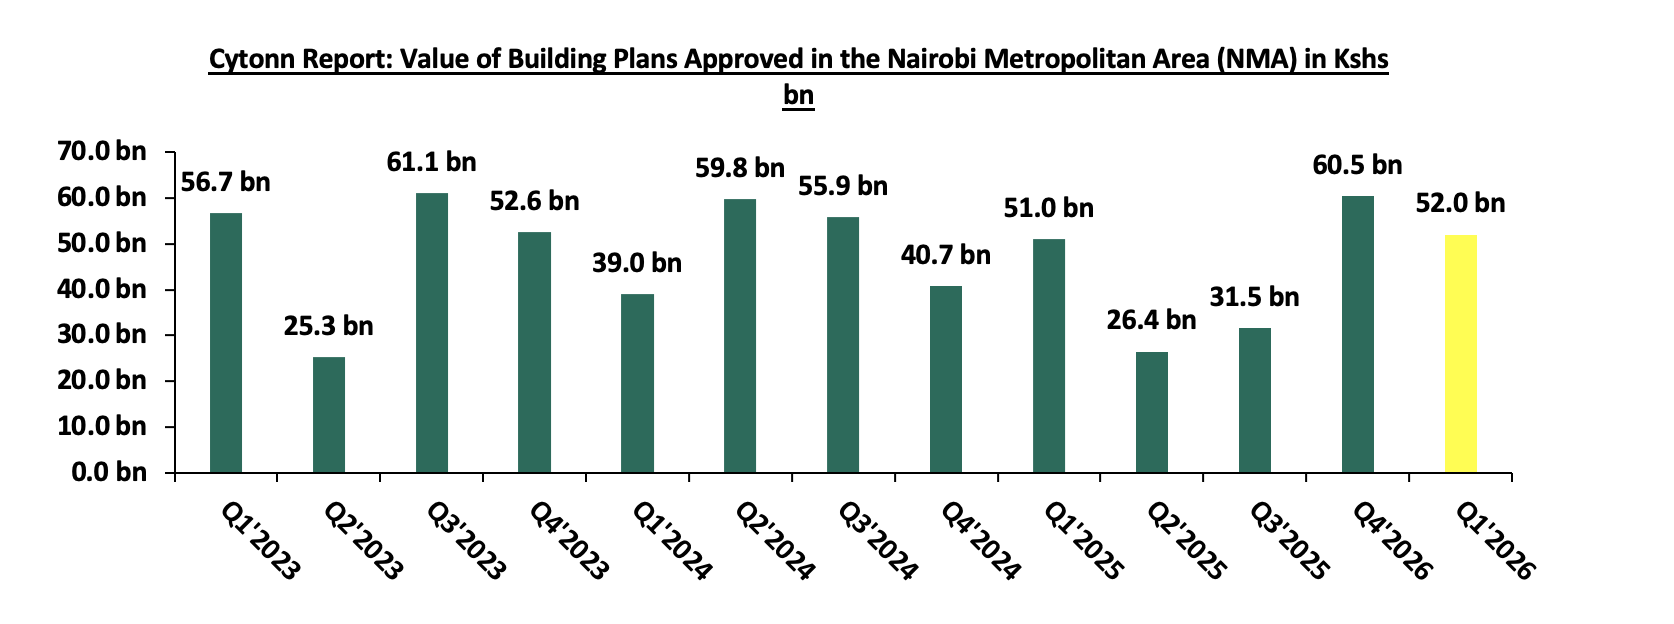
-
In Q1’2026, the value of building plans approved in Nairobi City County increased by 2.0% on year-on-year basis to Kshs 52.0 bn from Kshs 51.0 bn in Q1’2025. However, on a quarter to quarter basis it decreased by 14.0% to Kshs 52.0 in Q1’2026 from 60.5 in Q4’2025. On a month-on-month basis, approved building plans increased by 49.0% to Kshs 18.3 bn in March 2026 from Kshs 12.3 bn recorded in February 2026. The increase on month on month basis reflects a sustained recovery and growing confidence in the real estate and construction sector driven by (i) improved demand for residential and commercial developments, (ii) lower lending rates by financial institutions due to the consistent lowering of the CBR rate in 2025 by which currently stands at 8.75%. This has enabled more developers to initiate and submit construction projects for approval. (iii) the ongoing digitization and streamlining of the development approval process by the Nairobi City County Government, which has improved efficiency, reduced approval timelines, and encouraged more developers to formally submit building plans.
The chart below shows the building plans approved in billions in Kenya between Q1’2023 and Q1’2026;
Source: Kenya National Bureau of Statistics (KNBS)
They were no other notable highlights during the month.
-
Residential Sector
-
KMRC Lists Oversubscribed Kshs 3.0 bn Sustainability-Linked Green Bond on the NSE
During the week, the Kenya Mortgage Refinance Company (KMRC) listed its Kshs 3.0 bn sustainability-linked green bond on the fixed income segment of the Nairobi Securities Exchange (NSE), following an issuance that attracted subscriptions worth Kshs 9.4 bn, translating to a 312.8% oversubscription rate. The eight-year note, issued at a fixed coupon rate of 12.2%, marks the second tranche under KMRC’s approved Kshs 10.5 bn Medium-Term Note (MTN) programme, with proceeds earmarked for refinancing eligible green and social home loans aimed at supporting affordable and climate-resilient housing developments.
The strong subscription levels mirror KMRC’s inaugural bond issuance in 2022, which was oversubscribed by 480.0%, having received subscriptions worth approximately Kshs 8.1 bn against a target of Kshs 1.4 bn. The sustained strong uptake across both issuances highlights continued investor confidence in KMRC’s housing finance mandate, quasi-sovereign credit profile, and the growing attractiveness of Kenya’s sustainable finance market. Additionally, the successful listing further deepens Kenya’s ESG-linked capital markets segment amid improving investor appetite for long-term fixed-income instruments.
We expect the successful listing to support increased liquidity within Kenya’s mortgage financing market, particularly through enhanced access to long-term funding for primary mortgage lenders, potentially improving availability of affordable mortgage products. Additionally, the continued strong uptake of sustainability-linked instruments is likely to encourage more corporates and quasi-sovereign institutions to tap into Kenya’s green and sustainable finance market, further deepening the domestic debt capital markets. However, prevailing interest rate conditions, mortgage affordability levels, and investor appetite for long-term fixed-income securities will remain key factors influencing future issuances and secondary market performance.
-
KMRC plans to issue a third bond in 2028 following oversubscribed green bond listing in the Nairobi Securities Exchange (NSE)
During the week, the Kenya Mortgage Refinance Company (KMRC) announced plans to issue the third tranche of its Medium-Term Note (MTN) programme in 2028, following the successful listing of its oversubscribed Sh3.0 bn sustainability-linked green bond on the Nairobi Securities Exchange (NSE). The issuance attracted subscriptions worth Kshs 9.4 bn against a target of Kshs 3.0 bn, translating to a 312.8% oversubscription rate, highlighting sustained investor appetite for ESG-linked and housing finance-backed fixed-income instruments. The successful issuance brought KMRC’s cumulative proceeds under the MTN programme to Kshs 4.4 bn, following the inaugural 2022 tranche that raised Sh1.4 bn after attracting subscriptions worth approximately Kshs 8.1 bn. Notably, the second tranche was issued at a lower coupon rate of 12.2% compared to the inaugural bond’s 12.5%, despite the longer tenor, reflecting improved market conditions amid easing interest rates.
We expect KMRC’s planned return to the market in 2028 to further support the deepening of Kenya’s sustainable finance and corporate debt markets while enhancing liquidity within the mortgage financing sector through increased access to long-term funding for primary mortgage lenders. Additionally, the continued strong uptake of KMRC issuances highlights growing investor confidence in sustainability-linked instruments, which is likely to encourage more corporates and quasi-sovereign institutions to tap into Kenya’s green finance market. However, prevailing interest rate conditions, mortgage affordability levels, and investor appetite for long-term fixed-income securities will remain key factors influencing future issuance performance and overall market uptake.
There were four notable residential highlights during the month;
-
During the month, The Board of Directors of the Kenya Mortgage Refinance Company Plc successfully concluded the second tranche of its Kshs 10.5 bn Medium Term Note (MTN) Programme, with tenors to maturity of 8 years and a weighted average life of 5.1 years. The bond was oversubscribed, with an overall subscription rate coming in at 312.8% receiving bids worth Kshs 9.4 bn. KMRC accepted bids worth Kshs 3.0 bn. The note was offered at par at an issue price of 100.0% and carries a fixed coupon rate of 12.2% per annum payable semi-annually. For more information, please see our Cytonn Weekly #19/2026
-
During the month, apartment prices in Eastlands and Nairobi’s satellite towns recorded a decline over the past three years, reflecting a widening imbalance between supply and demand as buyer preferences gradually shift. According to the Kenya National Bureau of Statistics, average apartment prices in the lower income segment fell to Kshs 8.5 mn from Kshs 9.0 mn in 2022. For more information, please see our Cytonn Weekly #19/2026
-
During the month, Kenya Mortgage Refinancing Company set a fixed coupon rate of 12.2% for its Kshs 3.0 bn green bond, which is part of a larger Kshs 10.5 bn bond programme. Green bonds are debt instruments used to raise funds for environmentally sustainable projects, such as affordable green housing and energy-efficient developments. The eight-year note opened on April 28, 2026, and closed on May 12, 2026 with trading at the Nairobi Securities Exchange expected to begin on May 25, 2026. The company is also waiting for confirmation from the Kenya Revenue Authority on whether investors will qualify for a tax exemption on interest income from the bond. For more information, please see our Cytonn Weekly #18/2026
-
During the week, Centum Real Estate partnered with KCB Bank Kenya to offer discounted fixed-rate mortgages aimed at increasing sales of its housing units. The mortgages will carry an 8.9% fixed interest rate for periods of up to 25 years, which is lower than the 11.0% to 15.0% rates commonly charged by commercial banks as of March 2026. The company says the arrangement is intended to make home ownership more affordable for salaried and self-employed buyers. For more information, please see our Cytonn Weekly #18/2026
We expect the residential sector to remain supported by sustained housing demand, rapid urbanization, and continued government focus on affordable housing initiatives. The ongoing implementation of affordable housing projects across major urban centres is expected to increase housing supply, improve homeownership accessibility, and stimulate activity within the broader construction value chain. Additionally, population growth, rural-to-urban migration, and the expansion of satellite towns around major cities are likely to continue driving demand for residential developments, particularly in the middle-income and affordable housing segments. We also expect improvements in infrastructure, including road networks and transport connectivity, to support residential development by opening up new growth nodes and enhancing the attractiveness of previously underserved areas. As connectivity improves, land values and development activity are likely to increase in emerging residential corridors, encouraging both private developers and homebuyers to expand beyond traditional urban centres. These trends are expected to support the sector's long-term growth while addressing Kenya's persistent housing deficit.
-
Infrastructure Sector
There were three notable highlights during the month
-
During the month, the Nairobi Securities Exchange listed its first infrastructure fund on the unquoted securities platform on 19th May 2026, marking a structural milestone in the deepening of Kenya's capital markets. Sponsored by Spearhead Africa Asset Management, the fund listed 35.0 mn units at Kshs 100.0 per unit, implying a total listed value of Kshs 3.5 bn, with a minimum purchase of 1,000 units. The first series, anchored by institutional investors including the UK Government's MOBILIST programme and CPF Group, raised Kshs 3.5 bn in local currency. For more information, please see our Cytonn Weekly #20/2026,
-
During the month the Government of Kenya announced the expansion of Jomo Kenyatta International Airport (JKIA) through the National Infrastructure Fund. The government confirmed that Kshs 38.7 bn from the Kenya Pipeline Company (KPC) stake sale will be directed toward the project, forming part of a broader plan to mobilize funding for the estimated Kshs 193.7 bn airport upgrades. The fund is also expected to grow its seed capital base to Kshs 387.4 bn following proceeds from the Kenya Pipeline IPO and partial divestiture of Safaricom Plc, with the state contributing 20.0% of total project costs. For more information, please see our Cytonn Weekly #19/2026,
-
During the month, a Chinese firm, China Wu Yi Company Limited, secured a Kshs 7.5 bn contract to reconstruct and realign the dangerous Nithi Bridge section along the Kenol–Marua dual carriageway. The project will cover a 2.7 km stretch between Marima and Mitheru shopping centres, with the new bridge expected to span 880 metres. Construction is projected to take three years and is scheduled for completion by August 2029. For more information, please see our Cytonn Weekly #18/2026,
We expect the infrastructure sector to be supported by a combination of ongoing and planned projects. The issuance of the Kshs 175.0 bn infrastructure bond in February 2026 is expected to facilitate the settlement of pending bills, enabling the resumption and completion of stalled road projects. Additionally, the completion of funding agreements and compensation processes ahead of the extension of the Naivasha–Malaba SGR project is likely to spur economic activity, influence land values, and accelerate real estate development along the corridor as investors position themselves to benefit from improved connectivity. We also expect the ongoing development of the Rironi-Nakuru-Mau Summit Highway to strengthen Kenya’s transport infrastructure and enhance regional connectivity along the Northern Corridor. The project is expected to ease traffic congestion, improve road safety, reduce travel time, and facilitate the efficient movement of goods and passengers between Nairobi, Western Kenya, and neighboring countries. Beyond supporting trade and logistics, the highway is likely to unlock economic opportunities, stimulate development along the corridor, and reinforce Kenya’s position as a key regional trade and transit hub.
-
Mixed-Use Development Sector
There was one notable highlight during the month
-
During the week, Unaitas Sacco announced plans to construct a Kshs 521.6 mn mixed-use development in Runda, Nairobi. The project will sit on 16,266 SQM and feature twin towers a seven-storey office block and a three-storey strip mall alongside a banking hall, data centre, restaurant, and additional lettable office space. The development marks a significant strategic shift for the sacco, which currently operates its headquarters from Cardinal Otunga Plaza in the Nairobi Central Business District. For more information, please see our Cytonn Weekly #20/2026,
-
Real Estate Investments Trusts
-
REITs Weekly Performance
On the Unquoted Securities Platform Acorn D-REIT and I-REIT traded at Kshs 29.6 and Kshs 23.8 per unit, respectively, as per the last updated data on 22nd May 2026. The performance represented a 48.0% and 18.8% gain for the D-REIT and I-REIT, respectively, from the Kshs 20.0 inception price. The volumes traded for the D-REIT and I-REIT came in at 13.5 mn and 43.3 mn shares, respectively. Additionally, ILAM Fahari I-REIT traded at Kshs 13.8 per share as of 22nd May 2026, representing a 31.0% loss from the Kshs 20.0 inception price. The volume traded to date came in at 1.2 mn shares for the I-REIT,
REITs offer various benefits, such as tax exemptions, diversified portfolios, and stable long-term profits. However, the ongoing decline in the performance of Kenyan REITs and the restructuring of their business portfolios are hindering significant previous investments. Additional general challenges include:
-
Insufficient understanding of the investment instrument among investors leading to a slower uptake of REIT products,
-
Lengthy approval processes for REIT creation,
-
High minimum capital requirements of Kshs 100.0 mn for REIT trustees compared to Kshs 10.0 mn for pension funds Trustees, essentially limiting the licensed REIT Trustee to banks only
-
The rigidity of choice between either a D-REIT or and I-REIT forces managers to form two REITs, rather than having one Hybrid REIT that can allocate between development and income earning properties
-
Limiting the type of legal entity that can form a REIT to only a trust company, as opposed to allowing other entities such as partnerships, and companies,
-
We need to give time before REITS are required to list – they would be allowed to stay private for a few years before the requirement to list given that not all companies maybe comfortable with listing on day one, and,
-
Minimum subscription amounts or offer parcels set at Kshs 0.1 mn for D-REITs and Kshs 5.0 mn for restricted I-REITs. The significant capital requirements still make REITs relatively inaccessible to smaller retail investors compared to other investment vehicles like unit trusts or government bonds, all of which continue to limit the performance of Kenyan REITs.
There was one notable highlight during the month
-
During the month, Two Rivers Land Company SEZ Two Rivers Land Company launched the TRIFIC Green USD Income REIT, marking a notable development in Kenya’s capital markets through the introduction of a USD denominated, environmentally focused income REIT backed by institutional grade commercial real estate within the Two Rivers International Finance and Innovation Centre ecosystem. The REIT is being offered at a par value of USD 1 per unit, with 29,832,000 units available under the unrestricted offer and a minimum subscription of USD 1,000. The offer opened on 13 May 2026 and is set to close on 12th June 2026, with listing on the Nairobi Securities Exchange Nairobi Securities Exchange expected on 23rd June 2026. For more information, please see our Cytonn Weekly #19/2026,
We expect the performance of Kenya’s real estate sector to remain resilient, supported by several factors: i) Listing of KMRC Kshs 3.0 bn Sustainability-Linked Green Bond on the NSE ii) KMRC expected issuance of a Third Bond in 2028 Following Oversubscribed Green Bond Listing However, challenges such as rising construction costs, infrastructure constraints, weak investor appetite in listed REITs such as ILAM Fahari I-REIT, oversupply in select real estate classes, and high capital demands will continue to impede the sector’s optimal performance
-
Mastercard Strengthens Stablecoin Strategy With New York BitLicense Approval
During the week, Mastercard received the BitLicense from the New York State Department of Financial services marking a significant step in its broader strategy to integrate stablecoins and blockchain technology into mainstream payments infrastructure. The license, issued by one of the strictest crypto regulators in the United States, allows Mastercard to expand digital-asset and stablecoin-related services through its Mastercard Transaction Services unit. This positions the company to support blockchain-based settlement, tokenized payment systems, and stablecoin-enabled cross-border transactions within a regulated framework. The development signals that Mastercard no longer views digital assets as a peripheral innovation, but rather as a core component of the future payments ecosystem.
The move also shows an industry shift in which major payment networks are adapting to the growing influence of stablecoins instead of resisting them. Mastercard aims to remain central to the payments value chain by controlling critical infrastructure layers such as compliance, fraud prevention, merchant access, and interoperability between banks and blockchain networks. This strategy is reinforced by its planned acquisition of stablecoin infrastructure firm BVNK, which would strengthen its ability to connect traditional financial systems with blockchain-based settlement rails. As stablecoins increasingly emerge as a potential alternative to traditional card settlement, Mastercard is positioning itself to monetize the transition while preserving its role as a global payments intermediary.
-
SoFi Brings Stablecoins Into Mainstream Banking With First Consumer-Facing Bank-Issued Digital Dollar
This week, SoFi launched a U.S. dollar–pegged stablecoin, SoFiUSD, directly within its banking app, marking one of the first instances of a federally regulated bank distributing a stablecoin to retail users. The token allows customers to buy, hold, transfer, and convert digital dollars instantly inside the SoFi ecosystem, effectively integrating blockchain-based money movement into a mainstream banking interface. This positions the stablecoin as a consumer-facing product rather than a niche crypto instrument, with functionality designed to support real-time payments and transfers within a regulated banking environment.
The significance of the launch lies in its implications for the broader financial system: it signals a shift where traditional banks begin issuing tokenized money that competes with both crypto-native stablecoins and elements of conventional payments infrastructure. By embedding stablecoin functionality into its app, SoFi Technologies is effectively testing a model where programmable dollars coexist with deposits, potentially enabling faster cross-border payments and 24/7 settlement. More broadly, it highlights how stablecoins are moving from crypto markets into regulated banking rails, increasing competitive pressure on card networks and accelerating the convergence between fintech, banking, and blockchain-based payment systems.
Digital Payments Stock Performance
The table below presents a snapshot of NYSE-listed digital payments stocks, covering Visa, Mastercard, American Express (AXP), and Circle.
|
Company |
Year Open 2026 |
Price 5/22/2026 |
Price 5/29/2026 |
w/w change |
YTD change |
P/E |
|
American Express |
372.73 |
311.8 |
316.5 |
1.5% |
(15.1%) |
25.6x |
|
Visa |
346.48 |
328.9 |
326.4 |
(0.8%) |
(5.8%) |
16.5x |
|
Mastercard |
563.13 |
498.5 |
494.0 |
(0.9%) |
(12.3%) |
30.7x |
|
Circle |
83.47 |
113.1 |
113.0 |
(0.1%) |
35.4% |
62.1x |
|
Average |
|
|
|
|
|
33.7x |
Source: Visa, AXP, Circle, Mastercard financials
The stocks are currently trading at an average P/E of 33.7x, implying that investors are pricing in strong future earnings growth expectations and are willing to pay a significant premium for current earnings, which may also suggest that the stocks are richly valued relative to their near-term fundamentals.
Other notable digital payments sector highlights during the month of May Include:
-
The U.S. Securities and Exchange Commission (SEC) delayed a proposal that would have allowed crypto platforms to more broadly offer tokenized versions of publicly traded stocks, highlighting growing regulatory caution around the intersection of blockchain technology and traditional capital markets. The proposal was aimed at creating an “innovation exemption” framework that could enable blockchain-based trading of equities with features such as 24/7 trading, fractional ownership, and near-instant settlement. For more information see Cytonn Weekly #20.2026
-
A major development in Europe’s digital asset landscape came from the rapid expansion of a euro-denominated stablecoin initiative led by the Qivalis consortium. The project added 25 new banks, significantly widening institutional participation to more than three dozen financial institutions across multiple European jurisdictions. Participating banks reportedly include major names such as ABN Amro, Rabobank, Nordea, UniCredit, BNP Paribas, and Bank of Ireland. The expansion signals growing interest among traditional European lenders in building a shared, regulated stablecoin infrastructure to support future digital payments and settlement systems. For more information see Cytonn Weekly #20.2026
-
Circle Internet Group, the issuer of USDC released its Q1’2026 financial results which highlighted a 28.0% YoY increase in USDC circulation to USD 77.0 bn from the USD 55.4 bn recorded in Q1’2025. USDC on-chain transaction volume also increased by 263.0% to USD 21.5 tn from the USD 35.0 bn recorded in Q1 2026. For more information see our Cytonn Weekly #19/2026
-
The U.S. Senate Banking Committee released the full text of the Digital Markets Clarity Act. The bill was tabled for debate in the senate on 14th May 2026 with the key highlight of the bill being the prohibition of yield and interest payments for holding stablecoins. For more information see our Cytonn Weekly #19/2026
-
Mastercard and Yellow Card announced a partnership to advance stablecoin-based payment innovation across Eastern Europe, the Middle East, and Africa (EEMEA), targeting use cases such as cross-border remittances, B2B payments, treasury operations, and digital value transfers. Under the collaboration, Yellow Card will provide its regulated stablecoin infrastructure and regional distribution network across African markets, while Mastercard will leverage its global payments infrastructure, compliance systems, and identity tools to enable secure and interoperable transactions. Initial focus markets include Ghana, Kenya, Nigeria, South Africa, and the United Arab Emirates. For more information see our Cytonn Weekly #19/2026
Disclaimer: The views expressed in this publication are those of the writers where particulars are not warranted. This publication, which follows Section 2 of the Capital Markets Authority Act Cap 485A, is meant for general information only and is not a warranty, representation, advice or solicitation of any nature. Readers are advised in all circumstances to seek the advice of a registered investment advisor

- Talk to us
- Kenya
- P.O Box 20695 - 00200, Nairobi, Kenya
- Cell +254709101200
- Tel +254709101200
- WhatsApp +254741676635
- United States
- +254709101200
- DOWNLOAD OUR APP
-


- Kenya
- 8th Floor, Pinetree Plaza, Kaburu Drive, Ngong Road, Nairobi, Kenya
- USA
- Suite 1150, 1775 Eye Street NW, USA, Washington DC 20006, USA
- Investments
- High Yield
- Private Equity
- Real Estate
- Real Estate
- RiverRun Estates
- Cytonn Towers
- The Ridge
- Taraji Heights
- The Alma