
Cytonn Monthly – August 2026
By research team, Sep 6, 2026
Executive Summary
Fixed Income
During the month of August 2026, T-bills were oversubscribed, with the overall average subscription rate coming in at 161.8%, higher than the subscription rate of 154.7%, recorded in July 2026. The overall average subscription rates for the 182-day and 364-day papers increased to 145.6% and 92.3% from 95.2% and 56.3% in July 2026 respectively, while that for 91-day paper decreased to 269.0% from 413.9% recorded in July 2026. During the month, the average yields on the government papers registered a mixed performance with the 91-day papers decreasing the most by 3.3 bps to 8.78% from 8.81% recorded the previous month. The average yields on the 364-day and 182-day papers remained unchanged from the 9.0% recorded the previous month. For the month of August, the government accepted a total of Kshs 194.7 bn of the Kshs 226.5 bn worth of bids received in T-Bills, translating to an acceptance rate of 88.8%, compared to an acceptance rate of 69.3% in the month of July 2026;
During the week, T-bills were oversubscribed for the fifth consecutive week, with the overall subscription rate coming in at 200.9% slightly lower than the subscription rate of 202.6% recorded the previous week. Investors’ preference for the shorter 91-day paper persisted, with the paper receiving bids worth Kshs 34.2 bn against the offered Kshs 8.0 bn, translating to a subscription rate of 428.1% significantly higher than the subscription rate of 296.2%, recorded the previous week. The subscription rate for the 182-day paper decreased to 197.7% from 268.8% recorded the previous week, while that of the 364-day paper decreased significantly to 22.4% from 61.6% recorded the previous week. The government accepted a total of Kshs 51.0 bn worth of bids out of Kshs 56.3 bn bids received, translating to an acceptance rate of 90.7%. The yields on the government papers recorded a mixed performance with the yields on the 364- day paper increasing by 4.1 bps to 9.1% from 9.0% recorded the previous week. The yields on the 182-day paper decreased by 0.7 bps to 8.93% from 8.94% recorded the previous week. While the yields on the 91-day paper decreased marginally by 0.1 bps to remain relatively unchanged at 8.77% recorded the previous week;
Additionally, August 2026 bonds were oversubscribed, with the overall average subscription rate coming in at 102.3%, lower than the average subscription rate of 209.5%, recorded in July 2026. The reopened bonds IFB1/2019/016, IFB1/2021/018, IFB1/2021/021 and the switch bond FXD4/2019/010 with tenors to maturity of 9.3 years, 12.7 years, 16.2 years and 3.2 years respectively and fixed coupon rates of 11.8%, 12.7%, 12.7% and 12.3% respectively, received bids worth Kshs 460.4 bn against the offered Kshs 450.0 bn translating to an oversubscription rate of 102.3%. The government accepted bids worth Kshs 312.0 bn, translating to an acceptance rate of 67.8%. The weighted average yield for the accepted bids for the IFB1/2019/016, IFB1/2021/018, IFB1/2021/021 and FXD4/2019/010 came in at 12.2%, 12.7%, 13.1% and 11.2% respectively;
During the week, the Central Bank of Kenya released the auction results for the re-opened treasury bonds FXD3/2019/015 and SDB1/2011/030 with tenors to maturities of 7.9 years and 14.4 years respectively and fixed coupon rates of 12.3% and 12.0% respectively. The bonds were oversubscribed, with the overall subscription rate coming in at 113.7%, receiving bids worth Kshs 68.2 bn against the offered Kshs 60.0 bn. The government accepted bids worth Kshs 47.7 bn, translating to an acceptance rate of 70.0%. The weighted average yield for the accepted bids for the FXD3/2019/015 and SDB1/2011/030 came in at 12.8% and 13.7% respectively. Notably, the 12.8% yield on FXD3/2019/015 was lower than the 13.0% recorded at the last reopening in May 2026. However, the 13.7% yield on the SDB1/2011/030 was higher than the 13.0% recorded at the last reopening in April 2026. With the Inflation rate at 6.6% as of August 2026, the real returns of the FXD3/2019/015 and SDB1/2011/030 are 6.2% and 7.1% respectively. Given the 10.0% withholding tax on the bonds, the tax equivalent yields for shorter term bonds with 15.0% withholding tax are 13.1% for the FXD3/2019/015 and 12.7% for the SDB1/2011/030;
The year-on-year inflation in August 2026 increased by 0.1% points to 6.6% from the 6.5% recorded in August 2026;
Stanbic Bank released its monthly Purchasing Managers' Index (PMI), indicating that Kenya's Purchasing Managers' Index (PMI) declined by 1.6 points to 49.7 in August 2026, from 51.3 in July 2026,
Equities
During the month of August, the equities market was on an upward trajectory, with NSE 10, NSE 25, NASI, and NSE 20 gaining by 6.7%, 5.9%, 5.7% and 5.7% respectively. The performance was mainly driven by gains recorded by large-cap stocks such as DTB-K, KCB and Equity of 27.9%, 9.3%, and 8.4% respectively. The performance was however weighed down by losses recorded large-cap stocks such as Stanbic Bank, BAT and SCBK of 3.8%, 1.9% and 1.7% respectively;
During the week, the equities market was on an upward trajectory, with NSE 10, NSE 25, NASI, and NSE 20 gaining by 6.7%, 5.9%, 5.7% and 5.7% respectively, taking the YTD performance to gains of 43.4%, 43.2%, 40.7% and 36.3% for NSE 20, NSE 10, NSE 25 and NASI respectively. The week-on-week equities market performance was driven by gains recorded by large-cap stocks such as Equity, KCB and SCBK of 13.7%, 4.8% and 4.4% respectively. The performance was however weighed down by losses recorded by large cap stocks such as Stanbic Bank and Safaricom of 3.3% and 0.5% respectively;
Real Estate
During the week, residents of Mukuru raised concerns over the allocation of units under the Affordable Housing Programme, with some applicants reporting that they had paid deposits but were later informed that their preferred units had been sold out;
During the week, Tatu City planned to develop Jabali Towers in Ruiru, Kiambu County, set to become the tallest building outside Nairobi. The proposed mixed-use development will comprise two residential towers, with one rising 20 floors and the other 30 floors, reaching a height of 136.8 metres;
On the Unquoted Securities Platform Acorn D-REIT and I-REIT traded at Kshs 29.7 and Kshs 24.4 per unit, respectively, as per the last updated data on 28th August 2026. The performance represented a 48.5% and 22.0% gain for the D-REIT and I-REIT, respectively, from the Kshs 20.0 inception price. The volumes traded for the D-REIT and I-REIT came in at 0.1 mn and 1.5 mn shares, respectively. Additionally, ILAM Fahari I-REIT traded at Kshs 20.5 per share as of 28th August 2026, representing a 2.7% gain from the Kshs 20.0 inception price;
Digital Payments
During the week, the Kenya Revenue Authority (KRA) integrated its Electronic Tax Invoice Management System (eTIMS) with the Integrated Financial Management Information System (IFMIS), tightening tax compliance for public sector procurement by enforcing real-time invoice matching before payments are processed;
During the week, Visa Inc. launched an enhanced version of its A2A Protect solution, marking the company’s first unified fraud score integration incorporating Featurespace technology to stop account-to-account payment fraud before money leaves customer accounts;
During the week, Circle Internet Group Inc. experienced a 14.7% surge in its stock price following congressional testimony by its President, Heath Tarbert advocating for the passage of the GENIUS Act to establish a comprehensive federal payment stablecoin framework by January 2027;
During the week, Block, Inc. announced a strategic partnership with Nova Credit to open its proprietary Cash App Score to third-party lenders through Nova Credit’s Cash Flow Intelligence Platform, expanding credit access without requiring new consumer credentialing;
The digital payment stocks we track (AXP, Visa, Mastercard, Circle, Block, and PayPal) are currently trading at an average forward P/E of 24.6x, implying that investors continue to price in resilient earnings growth and strong digital payment adoption, although elevated operating costs and higher client incentives across legacy card networks may moderate valuation expansion in the near term.
Investment Updates:
-
Weekly Rates: Cytonn Money Market Fund closed the week at a yield of 11.14% p.a. To invest, dial *809# or download the Cytonn App from Google Play store here or from the Appstore here;
-
We continue to offer Wealth Management Training every Tuesday, from 7:00 pm to 8:00 pm. The training aims to grow financial literacy among the general public. To register for any of our Wealth Management Trainings, click here. If interested in our Private Wealth Management Training for your employees or investment group, please get in touch with us through wmt@cytonn.com;
-
Cytonn Asset Managers Limited (CAML) continues to offer pension products to meet the needs of both individual clients who want to save for their retirement during their working years and Institutional clients that want to contribute on behalf of their employees to help them build their retirement pot. To more about our pension schemes, kindly get in touch with us through pensions@cytonn.com;
Hospitality Updates:
-
We currently have promotions for Staycations. Visit cysuites.com/offers for details or email us at sales@cysuites.com;
Money Markets, T-Bills Primary Auction:
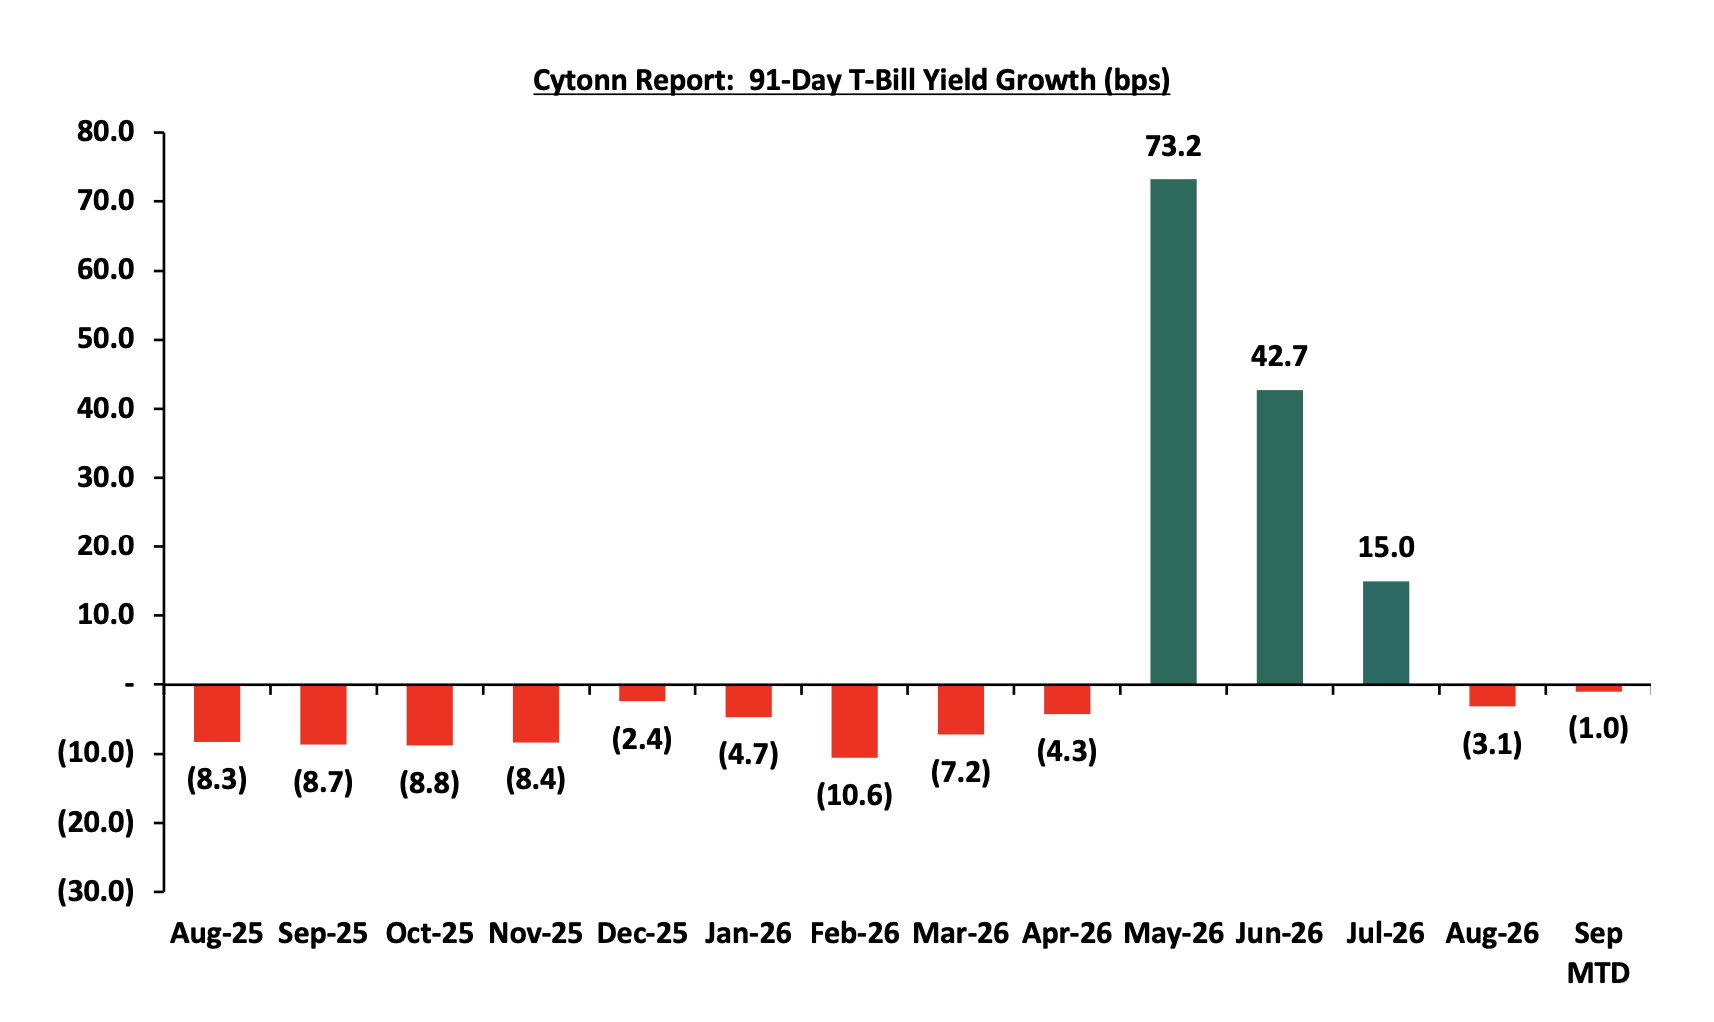
During the month of August 2026, T-bills were oversubscribed, with the overall average subscription rate coming in at 161.8%, higher than the subscription rate of 154.7%, recorded in July 2026. The overall average subscription rates for the 182-day and 364-day papers increased to 145.6% and 92.3% from 95.2% and 56.3% in July 2026 respectively, while that for 91-day paper decreased to 269.0% from 413.9% recorded in July 2026. During the month, the average yields on the government papers registered a mixed performance with the 91-day papers decreasing the most by 3.3 bps to 8.78% from 8.81% recorded the previous month. The average yields on the 364-day and 182-day papers remained unchanged from the 9.0% recorded the previous month. For the month of August, the government accepted a total of Kshs 194.7 bn of the Kshs 226.5 bn worth of bids received in T-Bills, translating to an acceptance rate of 88.8%, compared to an acceptance rate of 69.3% in the month of July 2026. The chart below shows the yield growth rate for the 91-day paper for the past one year:
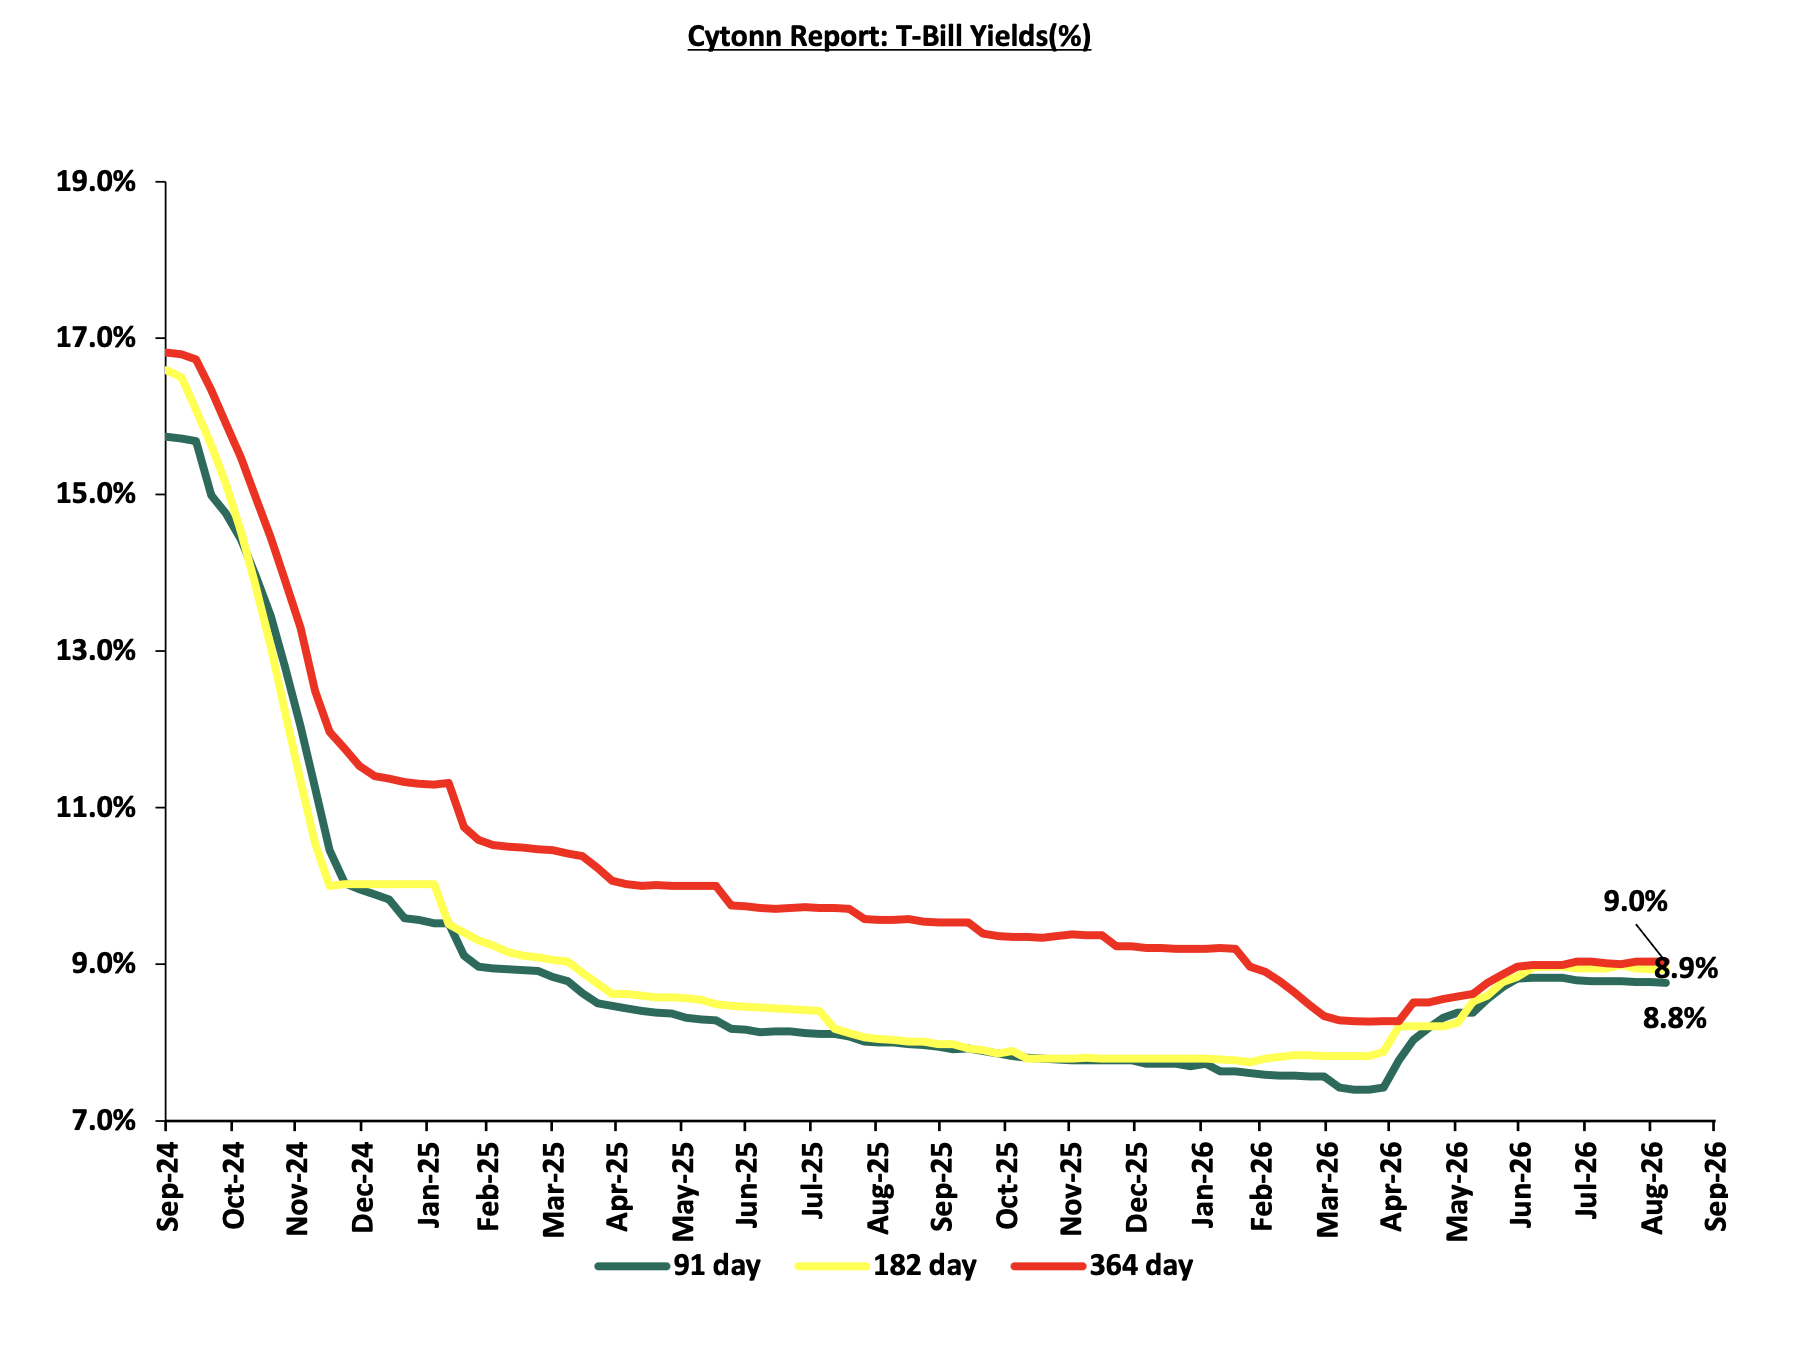
This week, T-bills were oversubscribed for the fifth consecutive week, with the overall subscription rate coming in at 200.9% slightly lower than the subscription rate of 202.6% recorded the previous week. Investors’ preference for the shorter 91-day paper persisted, with the paper receiving bids worth Kshs 34.2 bn against the offered Kshs 8.0 bn, translating to a subscription rate of 428.1% significantly higher than the subscription rate of 296.2%, recorded the previous week. The subscription rate for the 182-day paper decreased to 197.7% from 268.8% recorded the previous week, while that of the 364-day paper decreased significantly to 22.4% from 61.6% recorded the previous week. The government accepted a total of Kshs 51.0 bn worth of bids out of Kshs 56.3 bn bids received, translating to an acceptance rate of 90.7%. The yields on the government papers recorded a mixed performance with the yields on the 364- day paper increasing by 4.1 bps to 9.1% from 9.0% recorded the previous week. The yields on the 182-day paper decreased by 0.7 bps to 8.93% from 8.94% recorded the previous week. While the yields on the 91-day paper decreased marginally by 0.1 bps to remain relatively unchanged at 8.77% recorded the previous week. The charts below show the performance of the 91-day, 182-day and 364-day papers from September 2024 to September 2026:
So far in the current FY’2026/27, government securities totaling Kshs 611.0 bn have been advertised. The government has accepted bids worth Kshs 877.1 bn, of which Kshs 360.9 bn and Kshs 516.2 bn were treasury bills and bonds, respectively. Total redemptions so far in FY’2026/27 equal to Kshs 401.0 bn, with treasury bills accounting for Kshs 282.9 bn while treasury bonds accounted for Kshs 118.1 bn. As a result, the government has a domestic borrowing surplus of Kshs 476.1 bn in FY’2026/27.
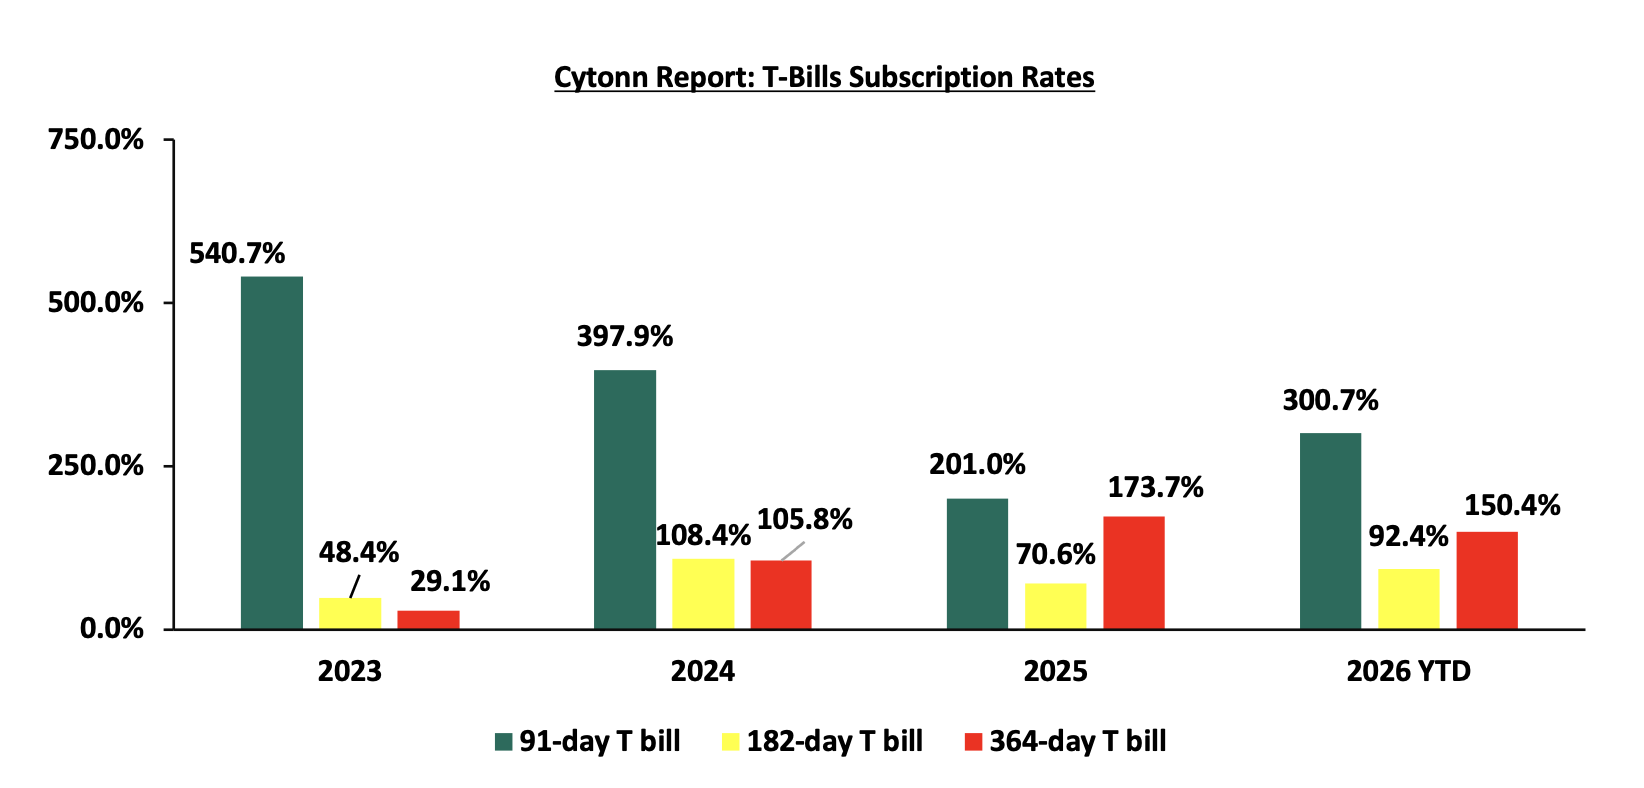
The chart below compares the overall average T-bill subscription rates obtained in 2023,2024, 2025 and 2026 Year-to-date (YTD):
T-bonds Primary Market
August 2026 bonds were oversubscribed, with the overall average subscription rate coming in at 102.3%, lower than the average subscription rate of 209.5%, recorded in July 2026. The reopened bonds IFB1/2019/016, IFB1/2021/018, IFB1/2021/021 and the switch bond FXD4/2019/010 with tenors to maturity of 9.3 years, 12.7 years, 16.2 years and 3.2 years respectively and fixed coupon rates of 11.8%, 12.7%, 12.7% and 12.3% respectively, received bids worth Kshs 460.4 bn against the offered Kshs 450.0 bn translating to an oversubscription rate of 102.3%. The government accepted bids worth Kshs 312.0 bn, translating to an acceptance rate of 67.8%. The weighted average yield for the accepted bids for the IFB1/2019/016, IFB1/2021/018, IFB1/2021/021 and FXD4/2019/010 came in at 12.2%, 12.7%, 13.1% and 11.2% respectively. The table below provides more details on the bonds issued in August 2026 and July 2026:
|
Cytonn Report: Bond Issuances for July 2026-August 2026 |
|||||||||
|
Issue Date |
Bond Auctioned |
Effective Tenor to Maturity (Years) |
Coupon |
Amount offered (Kshs bn) |
Actual Amount Raised/Accepted (Kshs bn) |
Total bids received (Subscription) |
Average Accepted Yield |
Subscription Rate |
Acceptance Rate |
|
12-Aug |
IFB1/2019/016-Reopened |
9.3 |
11.8% |
150.0 |
112.6 |
166.2 |
12.2% |
110.8% |
67.8% |
|
IFB1/2021/018-Reopened |
12.7 |
12.7% |
105.5 |
154.9 |
12.7% |
103.3% |
68.1% |
||
|
IFB1/2021/018-Reopened |
16.2 |
12.7% |
93.9 |
139.3 |
13.1% |
92.9% |
67.4% |
||
|
26-Aug |
FXD1/2012/020-Switch |
3.2 |
12.3% |
15.0 |
22.5 |
22.6 |
11.2% |
150.6% |
99.7% |
|
22-Jul |
FXD1/2019/020 - Reopened |
12.8 |
12.9% |
40.0 |
12.2 |
24.0 |
13.9% |
59.9% |
51.1% |
|
FXD1/2022/025-Reopened |
21.4 |
14.2% |
51.0 |
62.0 |
14.4% |
154.9% |
82.4% |
||
|
15-Jul |
FXD1/2012/020-Switch |
6.3 |
12.0% |
10.0 |
8.0 |
8.2 |
12.8% |
81.6% |
97.5% |
|
08-Jul |
FXD1/2022/010-Reopened |
5.8 |
13.5% |
70.0 |
51.0 |
104.0 |
12.8% |
148.5% |
49.1% |
|
FXD1/2021/020-Reopened |
15.2 |
13.4% |
13.5 |
20.9 |
14.3% |
29.8% |
64.9% |
||
|
August 2026 Average |
12.7 |
12.4% |
450.0 |
312.0 |
460.4 |
12.6% |
102.3% |
67.8% |
|
|
July 2026 Average |
16.9 |
13.3% |
110.0 |
133.9 |
230.4 |
14.0% |
209.5% |
58.1% |
|
|
2026 Average |
14.8 |
13.0% |
73.3 |
35.1 |
53.0 |
13.3% |
134.7% |
71.9% |
|
This week, the Central Bank of Kenya released the auction results for the re-opened treasury bonds FXD3/2019/015 and SDB1/2011/030 with tenors to maturities of 7.9 years and 14.4 years respectively and fixed coupon rates of 12.3% and 12.0% respectively. The bonds were oversubscribed, with the overall subscription rate coming in at 113.7%, receiving bids worth Kshs 68.2 bn against the offered Kshs 60.0 bn. The government accepted bids worth Kshs 47.7 bn, translating to an acceptance rate of 70.0%. The weighted average yield for the accepted bids for the FXD3/2019/015 and SDB1/2011/030 came in at 12.8% and 13.7% respectively. Notably, the 12.8% yield on FXD3/2019/015 was lower than the 13.0% recorded at the last reopening in May 2026. However, the 13.7% yield on the SDB1/2011/030 was higher than the 13.0% recorded at the last reopening in April 2026. With the Inflation rate at 6.6% as of August 2026, the real returns of the FXD3/2019/015 and SDB1/2011/030 are 6.2% and 7.1% respectively. Given the 10.0% withholding tax on the bonds, the tax equivalent yields for shorter term bonds with 15.0% withholding tax are 13.1% for the FXD3/2019/015 and 12.7% for the SDB1/2011/030
Secondary Bond Market:
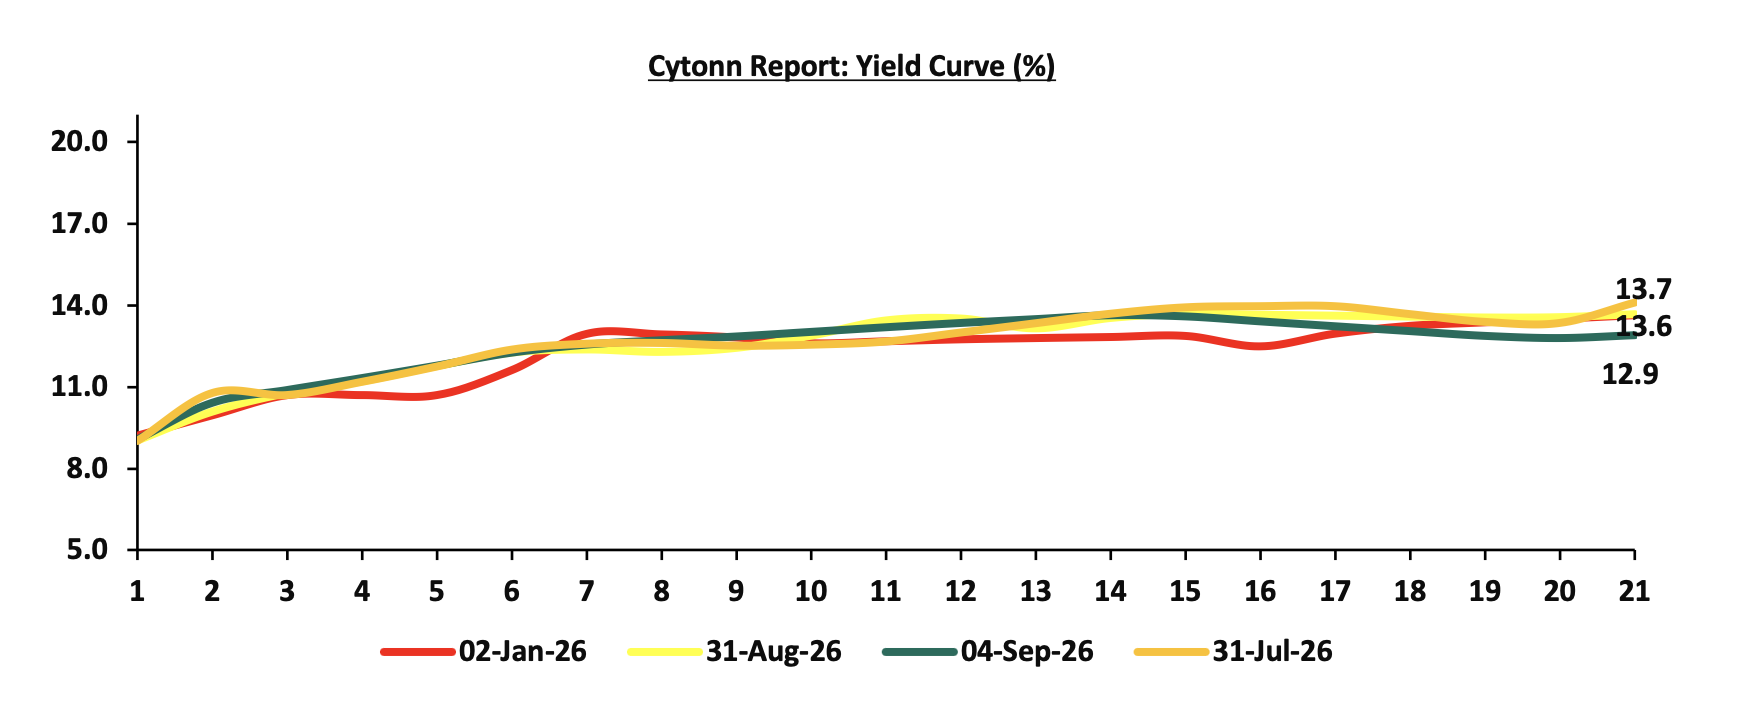
The yields on the government securities recorded a mixed performance during the month of August similar to July. This is attributable to a divergence between short-term monetary policy anchoring and rising medium to long-term risk premium. The Central Bank of Kenya’s decision to maintain the policy rate at 8.75% in August helped stabilize short-term rates by anchoring expectations on the near-term cost of funds, limiting significant movements in Treasury bill yields. However, upward pressure on inflation driven by elevated global fuel prices linked to the Middle East conflict, eroded real returns and heightened uncertainty around the inflation outlook. This led investors to demand higher compensation on longer-dated securities, pushing yields upward at the belly and long end of the curve. At the same time, intermittent liquidity conditions and selective demand for specific maturities created pockets of downward movement in some tenors, ultimately resulting in a mixed yield curve performance for the month. The chart below shows the yield curve movement during the period:
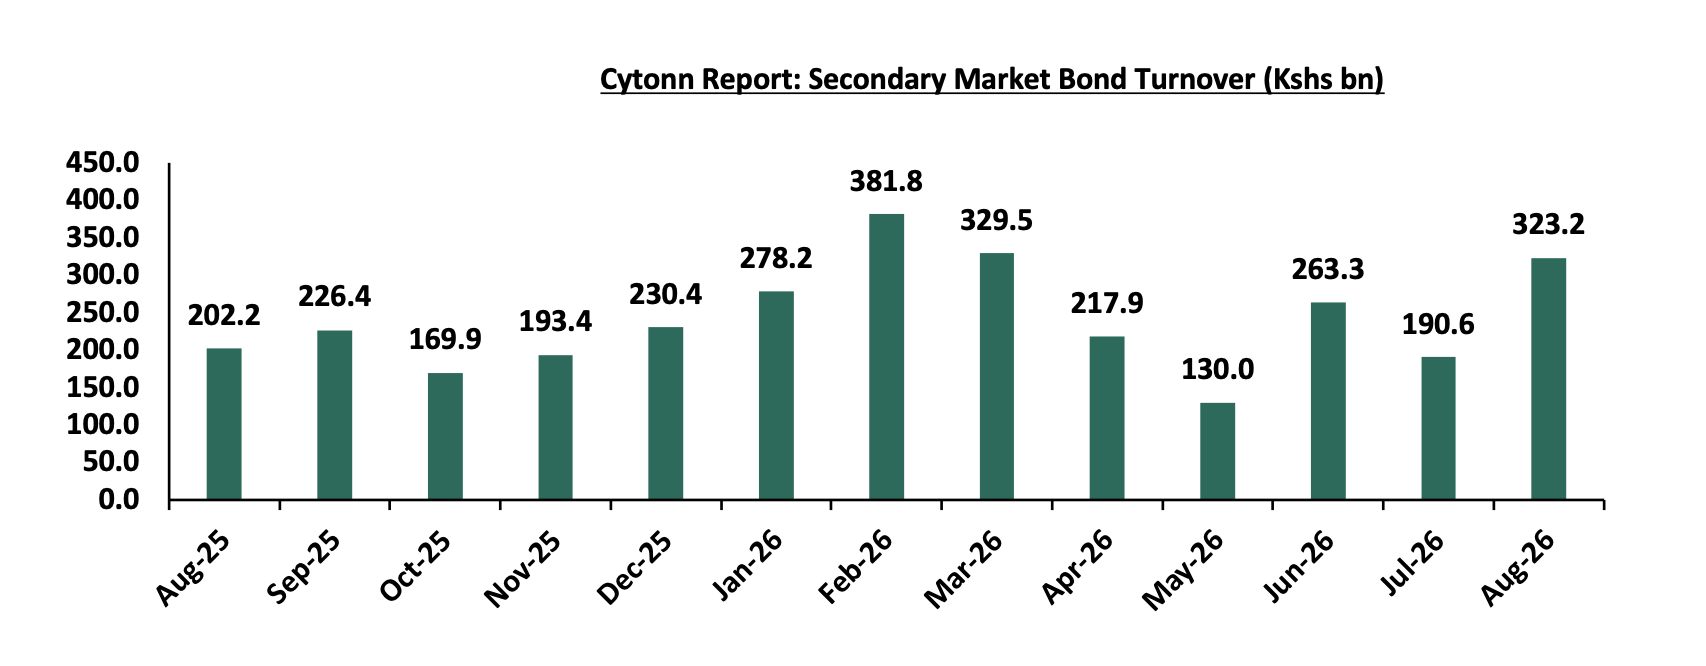
The secondary bond turnover increased by 69.5% to Kshs 323.2 bn, from Kshs 190.6 bn recorded in July 2026, pointing towards increased activities by commercial banks in the secondary bonds market for the month of August driven by eased liquidity during the month. On a year-on-year basis, the bond turnover increased by 59.8% from Kshs 202.2 bn worth of treasury bonds transacted over a similar period last year. The chart below shows the bond turnover over the past 12 months.
Money Market Performance:
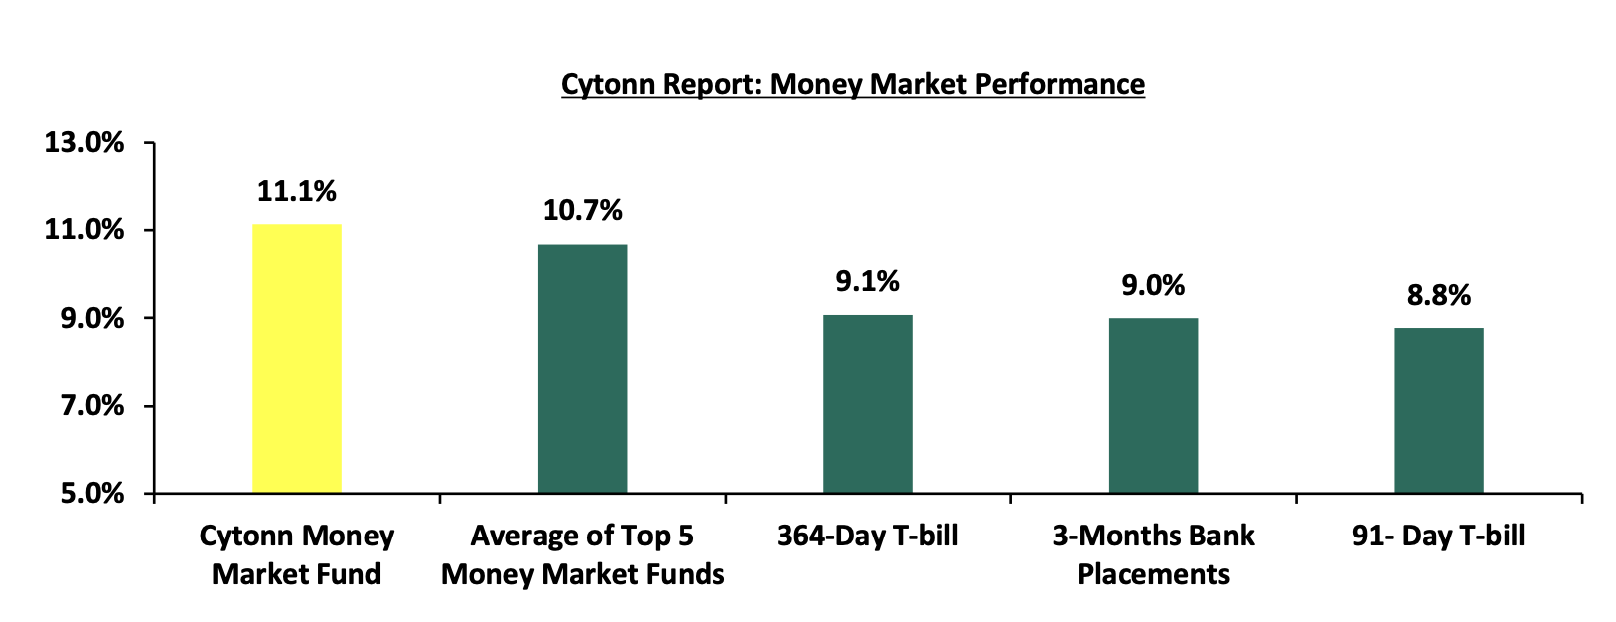
In the money markets, 3-month bank placements ended the week at 9.0% (based on what we have been offered by various banks). The yields on the government papers recorded a mixed performance with the yields on the 364-day paper increasing by 4.1 bps to 9.1% from 9.0% recorded the previous week while the yields on the 91-day paper decreased marginally by 0.1 bps to remain relatively unchanged at 8.77% recorded the previous week and the yield on the Cytonn Money Market Fund increased by 6.0 bps to 11.14% from the 11.08% recorded the previous week, while the average yields on the Top 5 Money Market Funds decreased by 23.0 bps to 10.7% from 10.9% recorded in the previous week.
The table below shows the Money Market Fund Yields for Kenyan Fund Managers as published on 4th September 2026:
Source: Business Daily
Liquidity:
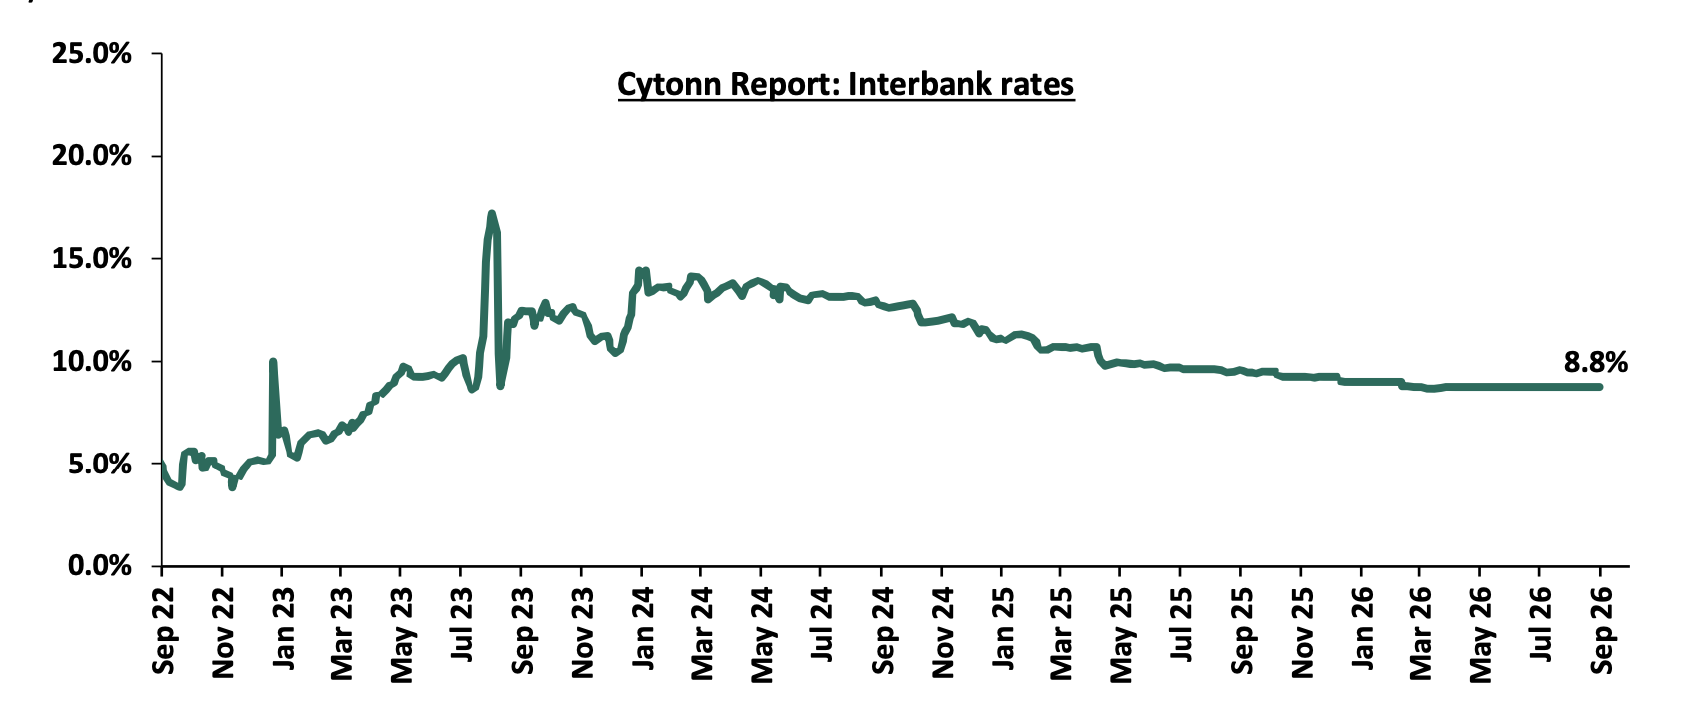
Liquidity in the money markets remained relatively stable in the month of August 2026, with the average interbank rate remaining unchanged from the 8.8% recorded the previous month. The average interbank volumes traded increased by 158.7% to Kshs 17.1 bn, from Kshs 6.6 bn recorded in July 2026. Additionally, during the week, liquidity in the money markets remained stable, with the average interbank rate remaining relatively unchanged from the 8.8% recorded the previous week, partly attributable to tax remittances that offset government payments. The average interbank volumes traded decreased by 49.8% to Kshs 9.6 bn from Kshs 19.2 bn recorded the previous week. The chart below shows the interbank rates in the market over the years:
Kenya Eurobonds:
During the month, the yields on the Eurobonds were on an upward trajectory, with the yield on the 7-year Eurobond issued in 2024 increasing the most by 170.0 bps to 9.0% from 7.3%. Also, during the week, the yields on the Eurobonds were on an upward trajectory, with the yield on the 30-year Eurobond issued in 2018 increasing by 6.3 bps to 9.0% from the 8.9% recorded the previous week. The table below shows the summary performance of the Kenyan Eurobonds as of 3rd September 2026:
|
|
2018 |
2019 |
2021 |
2024 |
|
|
Tenor |
10-year issue |
30-year issue |
12-year issue |
13-year issue |
7-year issue |
|
Amount Issued (USD) |
1.0 bn |
1.0 bn |
1.2 bn |
1.0 bn |
1.5 bn |
|
Years to Maturity |
2.5 |
22.5 |
6.7 |
8.8 |
5.5 |
|
Yields at Issue |
7.3% |
8.3% |
7.9% |
6.2% |
10.4% |
|
02-Jan-26 |
6.1% |
8.8% |
7.2% |
7.8% |
7.1% |
|
31-Jul-26 |
7.0% |
9.0% |
8.0% |
9.5% |
9.0% |
|
27-Aug-26 |
6.4% |
8.9% |
7.4% |
8.0% |
7.2% |
|
28-Aug-26 |
6.4% |
9.0% |
7.4% |
8.0% |
7.2% |
|
31-Aug-26 |
6.4% |
9.0% |
7.5% |
8.0% |
7.3% |
|
01-Sep-26 |
6.6% |
9.1% |
7.6% |
8.1% |
7.4% |
|
02-Sep-26 |
6.5% |
9.1% |
7.5% |
8.1% |
7.3% |
|
03-Sep-26 |
6.4% |
9.0% |
7.4% |
8.0% |
7.2% |
|
Weekly Change |
0.0% |
0.1% |
0.0% |
0.0% |
0.0% |
|
MoM Change |
0.6% |
0.0% |
0.5% |
1.5% |
1.7% |
|
YTD Change |
0.3% |
0.2% |
0.3% |
0.2% |
0.1% |
Source: Central Bank of Kenya (CBK) and National Treasury
Kenya Shilling:
During the month, the Kenya Shilling depreciated by 1.5 bps against the US Dollar, to Kshs 129.5 from the Kshs 129.4 recorded at the end of July. Also, during the week, the Kenya Shilling depreciated by 0.8 bps against the US Dollar, to remain relatively unchanged from the Kshs 129.5 recorded the previous week. On a year-to-date basis, the shilling has depreciated by 32.5 bps against the dollar, as compared to the 22.9 bps appreciation recorded in 2025.
We expect the shilling to be supported by:
-
Diaspora remittances standing at a cumulative USD 4,986.9 mn in the twelve months to July 2026, slightly lower than the USD 5,079.9 mn recorded over the same period in 2025. These have continued to cushion the shilling against further depreciation. In the July 2026 diaspora remittances figures, North America remained the largest source of remittances to Kenya accounting for 51.6% in the period,
-
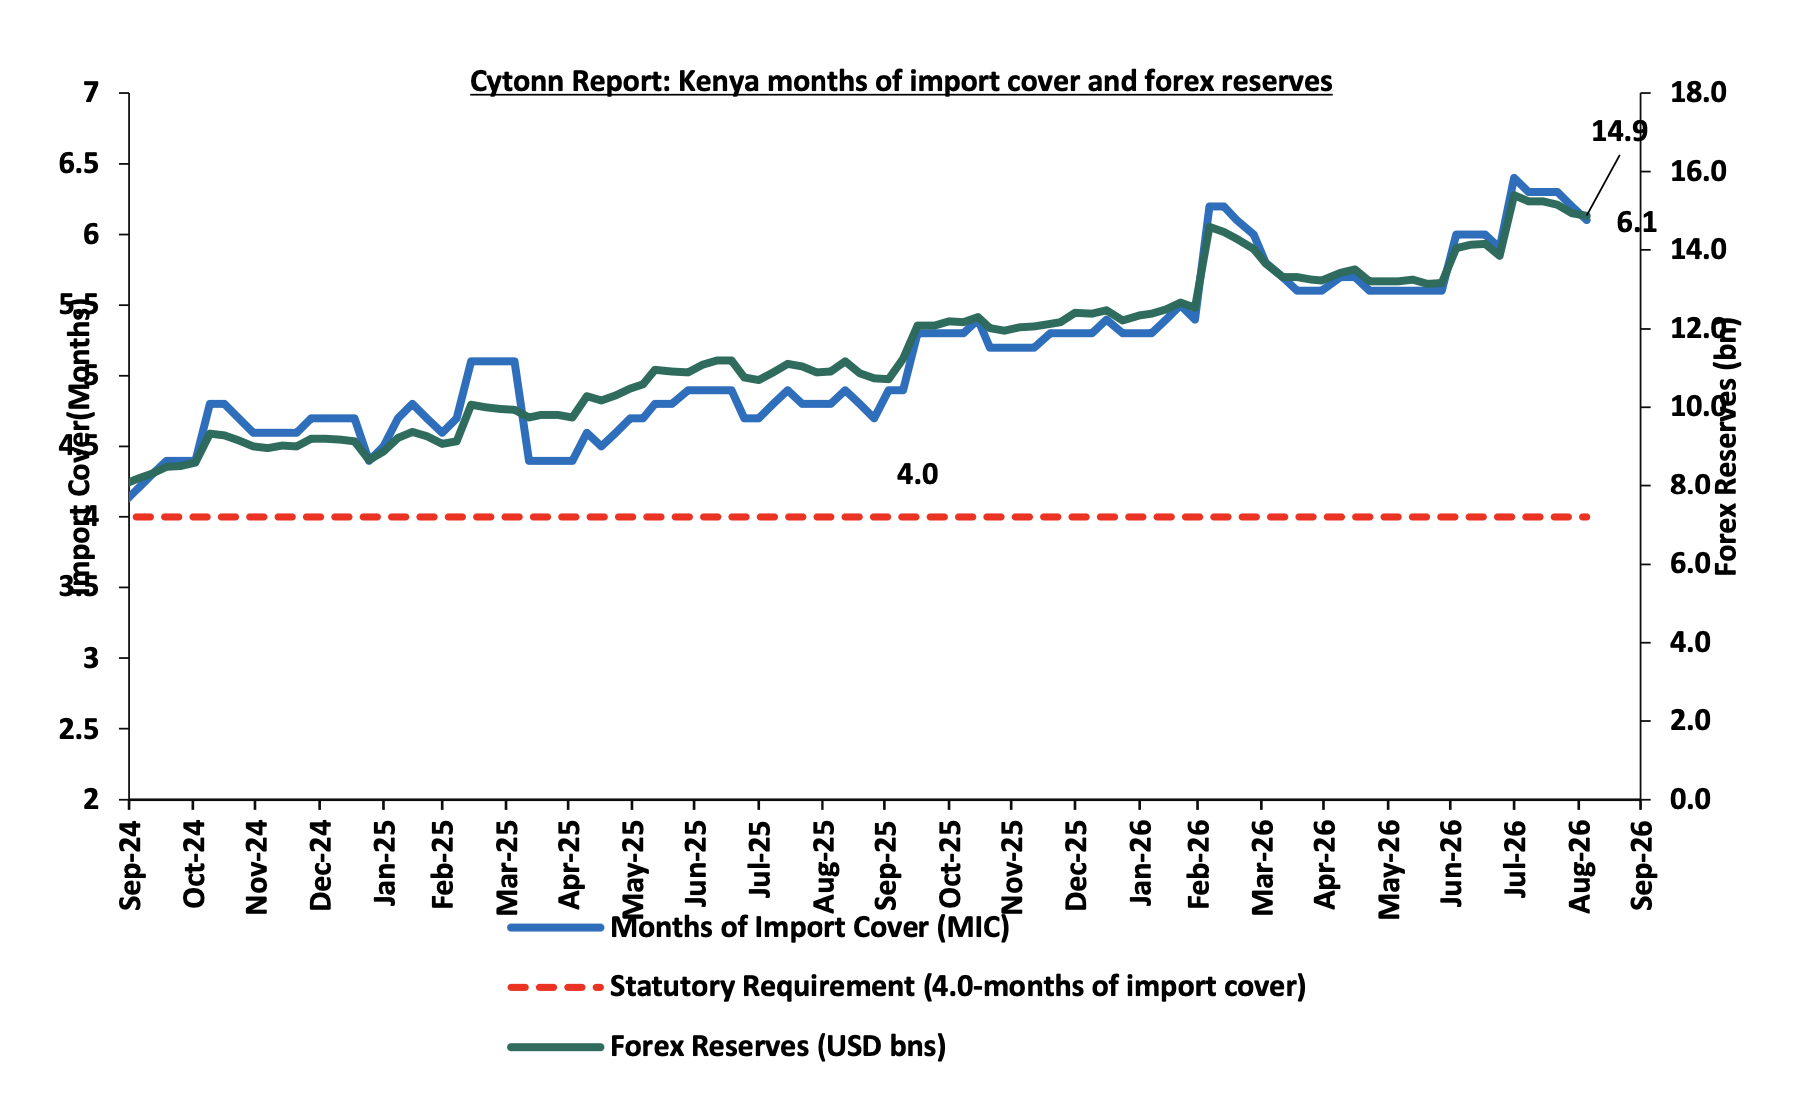
Improved forex reserves currently at USD 14.9 bn (equivalent to 6.1-months of import cover), which is above the statutory requirement of maintaining at least 4.0-months of import cover and above the EAC region’s convergence criteria of 4.5-months of import cover.
The shilling is however expected to remain under pressure in 2026 as a result of:
-
An ever-present current account deficit which widened to 3.0% of GDP in the 12 months to June 2026 compared to 1.9% of GDP in a similar period in 2025 and,
-
The need for government debt servicing, continues to put pressure on forex reserves given that 54.8% of Kenya’s external debt is US Dollar-denominated as of June 2026
-
Rising geopolitical tensions in the Middle East, which could exert pressure on the shilling through higher global oil prices and increased uncertainty in international markets. Given that Kenya is a net importer of petroleum products, any sustained increase in oil prices would widen the import bill, increase demand for US Dollars, and consequently put depreciation pressure on the shilling
Kenya’s forex reserves marginally decreased by 0.4% during the week to remain relatively unchanged at USD 14.9 bn recorded the previous week, equivalent to 6.1 months of import cover, and above the statutory requirement maintaining at least 4.0-months of import cover.
Weekly Highlights
-
August 2026 Inflation Highlight
The year-on-year inflation in July 2026 increased by 0.1% points to 6.6% from the 6.5% recorded in July 2026. The price increase was primarily driven by a rise in prices of items in the Food and Non-Alcoholic Beverages at 9.0%; Transport at 15.7%; and Housing, Water, Electricity, Gas and other fuels at 3.6%; over the one-year period. The month-on-month inflation rate stood at 0.4% in August 2026. The table below summarizes the performance of commodity indices both on a year-on-year and month-on-month basis:
|
Cytonn Report: Major Inflation Changes –August 2026 |
|||
|
Broad Commodity Group |
Price change m/m (August-2026/ July-2026) |
Price change y/y August-2026/August-2025) |
Reason |
|
Food and Non- Alcoholic Beverages |
0.6% |
9.0% |
The m/m increase was mainly driven by the rise in prices of Kale (Sukuma Wiki) and Irish potatoes by 4.3% and 4.1% respectively, and an increase in the price of beef with bones by 1.2%. However, the increase was weighed down by a decline in prices of sifted maize flour, tomatoes and fortified maize flour by 2.7%, 2.2% and 2.0% respectively. |
|
Transport |
0.7% |
15.7% |
The m/m increase was driven by a rise in local flight fares and country bus/matatu fares for inter-town travel by 4.1% and 2.1% respectively. However, the increase was weighed down by a decline in diesel prices by 2.2%. |
|
Housing, Water, Electricity, Gas and Other fuels |
0.1% |
3.6% |
The m/m increase was mainly due to an increase in the price of charcoal and electricity (200kWh) by 0.4% and 0.2% respectively. The increase was however weighed down by a decrease in the price of gas/LPG by 0.2%. |
|
Overall Inflation |
0.4% |
6.6% |
The m/m increase was mainly attributable to the 0.7% rise in Transport, coupled with a 0.6% increase in Food and Non-Alcoholic Beverages. |
In August 2026, overall inflation increased by 0.1% points to 6.6% from the 6.5% recorded in July 2026 on a y/y basis, signaling continued price pressure across major categories, but still remained within the Central Bank of Kenya's preferred range of 2.5%-7.5%, for the thirty-eighth consecutive month. Notably, the maximum allowed pump price for Diesel decreased by Kshs 5.0 per liter to Kshs 217.9 in Nairobi in the pricing cycle running from 15th August to 14th September 2026, while Super Petrol and Kerosene remained unchanged at Kshs 214.0 and Kshs 191.5 respectively, supported by additional Government Stabilization Support Measures of Kshs 938 mn. Electricity costs edged up further, with both the 50kWh and 200kWh tariffs increasing by 0.2% between July and August 2026. Additionally, the Monetary Policy Committee (MPC) of the Central Bank of Kenya (CBK) maintained the Central Bank Rate (CBR) at 8.75% for a third consecutive meeting on 11th August 2026, reflecting a cautious, data-dependent approach aimed at anchoring inflation expectations, preserving exchange rate stability, amid persistent geopolitical uncertainty stemming from the Middle East conflict. The chart below shows the inflation rates for the past 5 years:
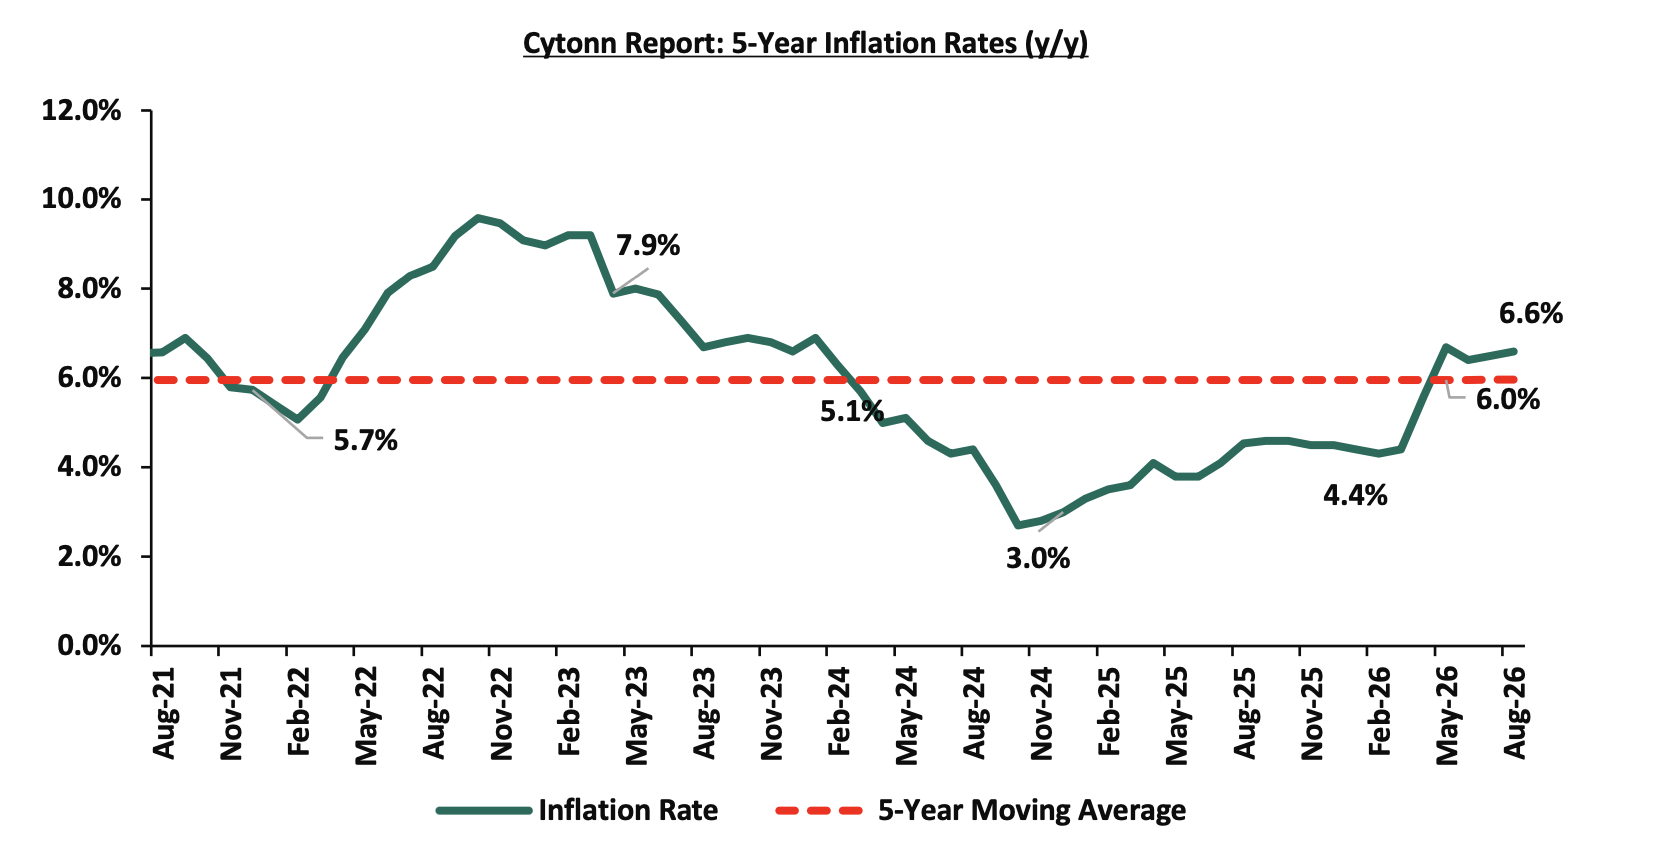
Going forward, we expect Kenya's inflation to remain above the midpoint of the CBK's target range of 2.5%–7.5%, in the short to medium term driven by persistent food price volatility due to weather-related supply disruptions, elevated fuel and electricity costs, fluctuations in global commodity prices, and exchange rate pass-through effects that increase the cost of imported goods and production inputs, majorly as a result of the Middle East War. Geopolitical tensions continue to trigger higher global oil prices exerting upward pressure on domestic fuel, transport, and production costs. Nevertheless, we expect the CBK's prudent monetary policy stance and relative exchange rate stability to help anchor inflation expectations and keep inflation within the target range over the medium term.
-
Stanbic Bank’s August 2026 Purchasing Manager’s Index (PMI)
Stanbic Bank released its monthly Purchasing Managers' Index (PMI), indicating that Kenya's Purchasing Managers' Index (PMI) declined by 1.6 points to 49.7 in August 2026, from 51.3 in July 2026, signaling a marginal deterioration in operating conditions. The latest reading was however higher than the 49.4 recorded in August 2025, reflecting a gradual recovery in private sector activity. The decline was primarily driven by persistent supply-side constraints, as elevated raw material costs, key material shortages, and tight cash flows prevented firms from converting stronger demand into higher output, with production contracting for a sixth consecutive month. Despite this, new orders grew for a third consecutive month, albeit at a slower pace than July, fuelling further backlog accumulation at a historically strong pace and prompting additional hiring for a third straight month. Supply chain pressures persisted, with delivery times lengthening and input buying declining for a fourth consecutive month as firms adopted a cautious purchasing stance amid limited liquidity. Nonetheless, the gradual moderation in input and output price inflation from their June peaks and business confidence rising to its highest level since February 2023 suggest that the conditions for a more sustainable recovery are slowly falling into place, provided liquidity conditions ease and supply chain disruptions are resolved in the months ahead. Key to note, a PMI reading of above 50.0 indicates an improvement in business conditions, while readings below 50.0 indicate a deterioration. The chart below shows Kenya's Purchasing Managers' Index for the last 24 months:
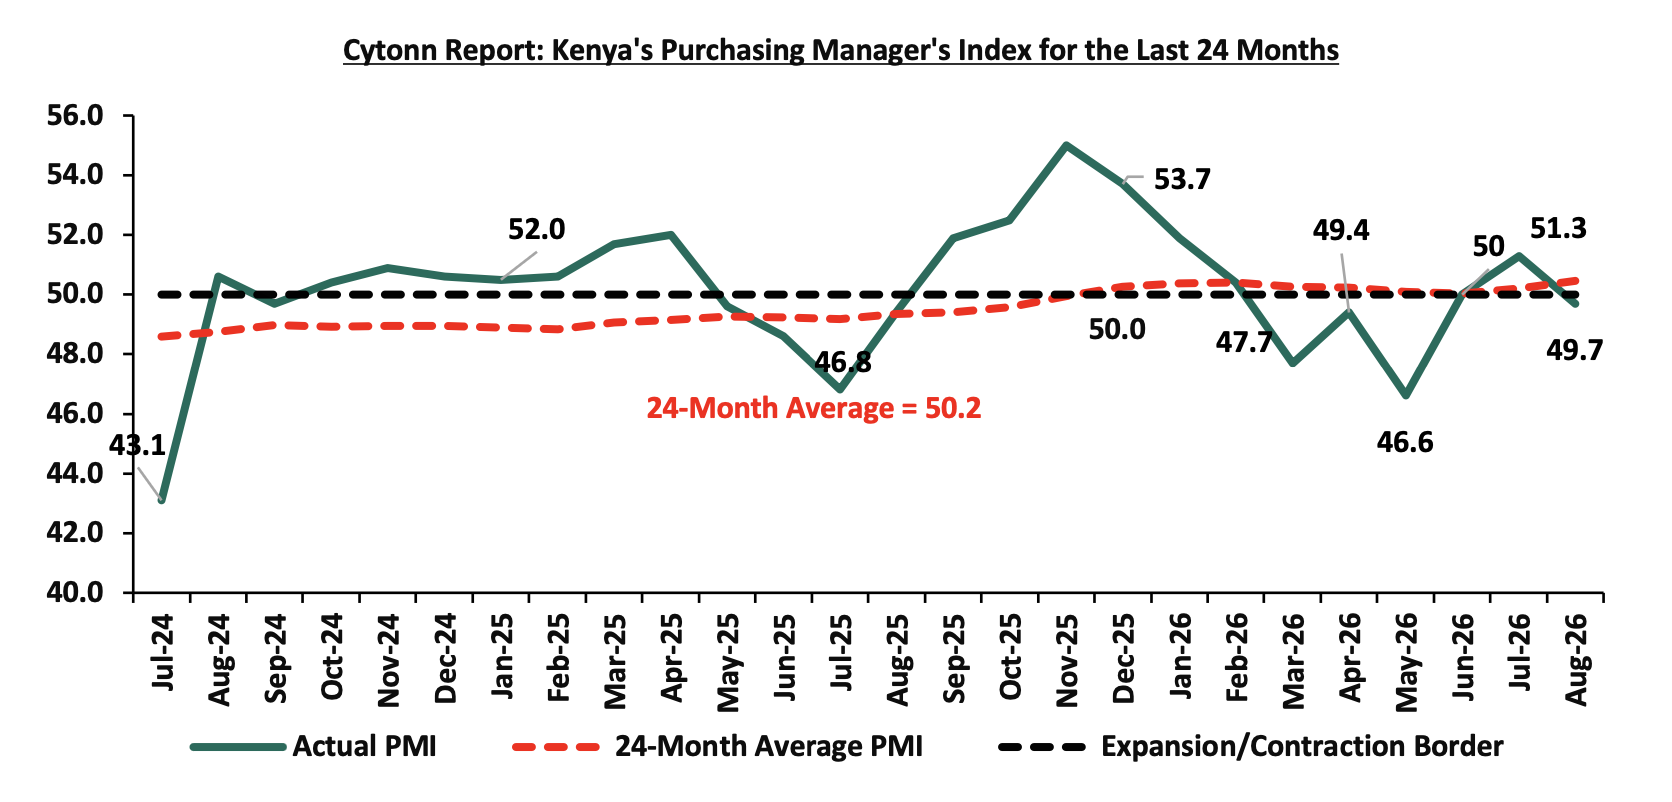
Going forward, the August PMI suggests that Kenya's private sector recovery remains fragile, as the return to contraction after just one month of expansion highlights the vulnerability of the current environment to persistent supply-side constraints and elevated cost pressures. While the third consecutive month of new order growth and sustained employment expansion signal that demand conditions are gradually improving, the continued inability of firms to translate stronger sales into higher output points to lingering liquidity challenges and material shortages that will need to be resolved before a more durable recovery can take hold. The moderation in input and output price inflation from their June peaks is an encouraging development and, if sustained, could progressively ease the margin pressures that have constrained production and purchasing activity. Business confidence rising to its highest level since February 2023, underpinned by planned investment in marketing, capacity improvements, and product diversification, provides a positive signal for the months ahead. However, a meaningful and sustained recovery in private sector activity will ultimately depend on a continued easing of cost pressures, improved access to liquidity, and resolution of supply chain disruptions that are preventing firms from fully capitalizing on the current strength in demand.
Notable Monthly Highlights:
-
The National Treasury gazetted the revenue and net expenditures for the first month of FY’2026/2027, ending 31st July 2026, highlighting that the total revenue collected as at the end of July 2026 amounted to Kshs 229.1 bn, equivalent to 7.7% of the original estimates of Kshs 2,985.7 bn for FY’2026/2027 and is 92.1% of the prorated estimates of Kshs 248.8 bn. For more information, please see our Cytonn Weekly #33/2026,
-
The Energy and Petroleum Regulatory Authority (EPRA) released their monthly statement on the maximum retail fuel prices in Kenya, effective from 15th August 2026 to 14th September 2026. For more information, please see our Cytonn Weekly #32/2026,
-
The Monetary Policy Committee (MPC) met on 11th August, 2026, to review the outcome of its previous policy decisions and decided to maintain the Central Bank Rate (CBR) at 8.75%, unchanged from the June 2026 meeting.For more information, please see our Cytonn Weekly #32/2026,
-
The National Treasury published the 2026 Budget Review and Outlook Paper (BROP), providing a review of the FY’2025/26 budget implementation and updated macroeconomic and fiscal projections for FY’2026/27 and the medium term. For more information, please see our Cytonn Weekly #32/2026, and,
-
S&P Global Ratings affirmed Kenya's long-term sovereign credit rating at 'B' with a stable outlook in August 2026, even as it warned that the fiscal deficit could widen to 7.1% of GDP in FY2026/27 on revenue shortfalls and pre-election spending, and trimmed its 2026 GDP growth forecast to 4.9% from 5.1% on the back of elevated import costs linked to the Middle East conflict.
Rates in the fixed income market remained relatively stable in August, holding steady after the recent upward trend. The stability comes even as the CBK paused its rate-cutting cycle at 8.75%, with inflation remaining elevated at 6.6% but within the CBK's target range. The government is 277.2% ahead of its prorated net domestic borrowing target of Kshs 171.7 bn, having a net borrowing position of Kshs 476.1 bn (inclusive of T-bills). We expect investors to maintain a preference for short to medium-term papers as they monitor the pace of government issuance and the path of inflation before committing further out on the curve, with the yield curve likely to remain under upward pressure rather than stabilize, at least until the inflation trajectory becomes clearer.
Market Performance:
During the month of August, the equities market was on an upward trajectory, with NSE 10, NSE 25, NASI, and NSE 20 gaining by 6.7%, 5.9%, 5.7% and 5.7% respectively. The performance was mainly driven by gains recorded by large-cap stocks such as DTB-K, KCB and Equity of 27.9%, 9.3%, and 8.4% respectively. The performance was however weighed down by losses recorded large-cap stocks such as Stanbic Bank, BAT and SCBK of 3.8%, 1.9% and 1.7% respectively.
During the week, the equities market was on an upward trajectory, with NSE 10, NSE 25, NASI, and NSE 20 gaining by 6.7%, 5.9%, 5.7% and 5.7% respectively, taking the YTD performance to gains of 43.4%, 43.2%, 40.7% and 36.3% for NSE 20, NSE 10, NSE 25 and NASI respectively. The week-on-week equities market performance was driven by gains recorded by large-cap stocks such as Equity, KCB and SCBK of 13.7%, 4.8% and 4.4% respectively. The performance was however weighed down by losses recorded by large cap stocks such as Stanbic Bank and Safaricom of 3.3% and 0.5% respectively.
Also, during the month, the banking sector index gained by 0.4 bps to close at 285.8 from the 269.4 recorded at the end of the July 2026. This was attributable to gains recorded by large-cap stocks such as DTB-K, KCB and Equity of 27.9%, 9.3%, and 8.4% respectively. The performance was however weighed down by losses recorded large-cap stocks such as Stanbic Bank, SCBK and NCBA of 3.8%, 1.7% and 0.8% respectively.
During the week, the banking sector index gained by 2.4 bps to 299.6 from 269.4 recorded the previous week. This is attributable to gains recorded by large cap stocks such as Equity, KCB and SCBK of 13.7%, 4.8% and 4.4% respectively. The performance was however weighed down by losses recorded by large cap stocks such as Stanbic Bank of 3.3%.
During the month of August, equities turnover increased by 71.5% to USD 213.3 mn from USD 124.4 mn recorded during the month of July 2026. Foreign investors became net sellers, with a net selling position of USD 35.1 mn, from a net selling position of USD 26.9 mn recorded in July 2026.
During the week, equities turnover increased by 44.2% to USD 64.8 mn from USD 44.8 mn recorded the previous week, taking the YTD total turnover to USD 2,876.4 mn. Foreign investors remained net sellers for the eighth consecutive week with a net selling position of USD 11.5 mn, from a net selling position of USD 7.1 mn recorded the previous week, taking the YTD foreign net selling position to USD 147.9 mn, compared to a net selling position of USD 92.9 mn recorded in 2025.
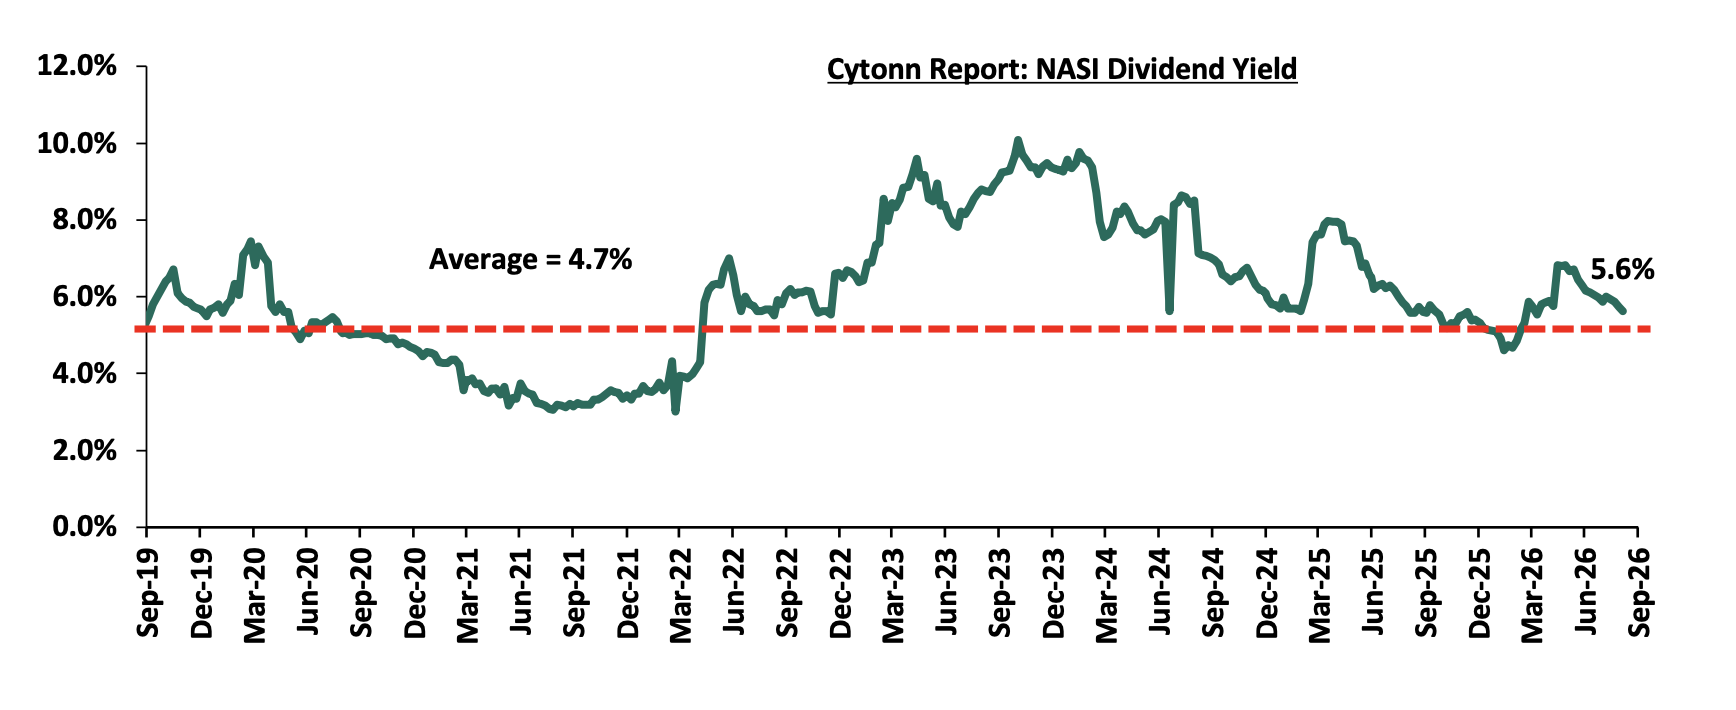
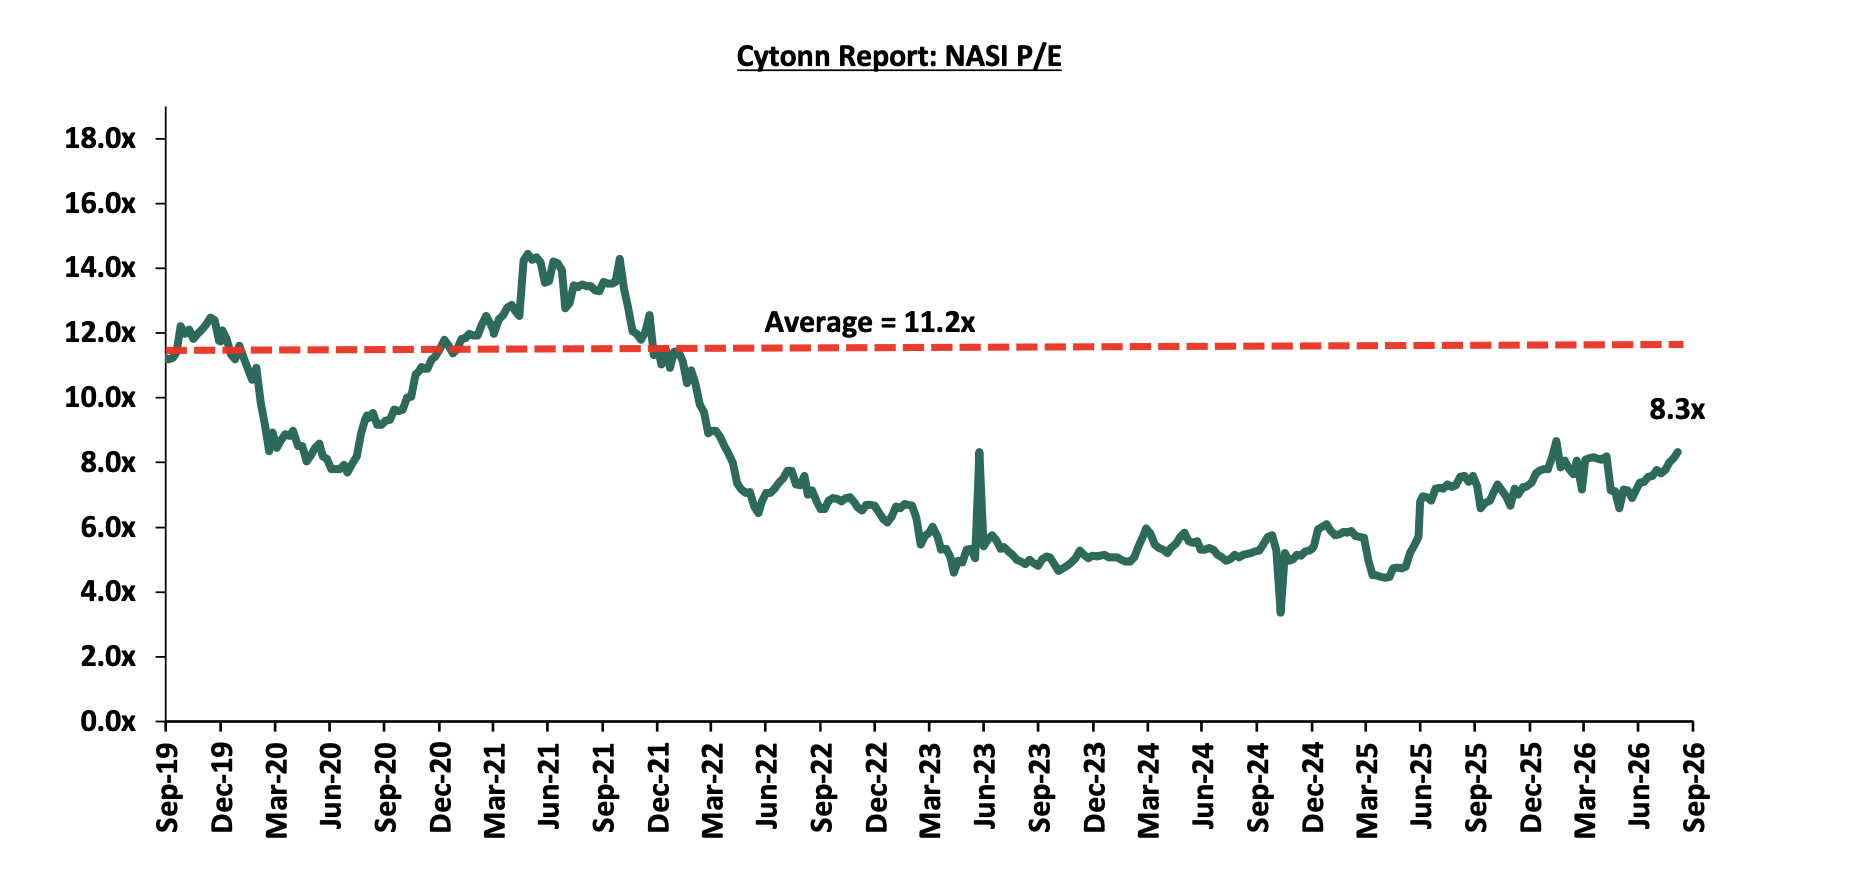
The market is currently trading at a price to earnings ratio (P/E) of 8.3x, 25.7% below the historical average of 11.2x, and a dividend yield of 5.6%, 0.9% points above the historical average of 4.7%. Key to note, NASI’s PEG ratio currently stands at 1.0x, suggesting that the market is fairly valued relative to its expected earnings growth. A PEG ratio lower than 1.0x indicates the market may be undervalued while a PEG ratio greater than 1.0x indicates that the market is overvalued. The charts below indicate the historical P/E and dividend yields of the market;
Universe of Coverage:
|
Cytonn Report: Equities Universe of Coverage |
|||||||||||
|
Price as at 28/08/2026 |
Price as at 04/09/2026 |
w/w change |
m/m change |
YTD Change |
Year Open 2026 |
Target Price* |
Dividend Yield*** |
Upside/ Downside** |
P/TBV Multiple |
Recommendation |
|
|
Co-op Bank |
37.3 |
38.6 |
3.5% |
3.5% |
61.3% |
23.9 |
46.1 |
6.5% |
26.1% |
1.4x |
Buy |
|
NCBA |
90.5 |
92.5 |
2.2% |
2.2% |
8.8% |
85.0 |
108.9 |
7.7% |
25.5% |
1.3x |
Buy |
|
Family Bank |
31.1 |
30.4 |
(2.1%) |
(2.1%) |
68.9% |
18.0 |
34.0 |
3.9% |
15.8% |
1.6x |
Accumulate |
|
Stanbic Holdings |
288.5 |
279.0 |
(3.3%) |
(3.3%) |
41.1% |
197.8 |
300.3 |
8.0% |
15.6% |
1.6x |
Accumulate |
|
KCB Group |
93.5 |
98.0 |
4.8% |
4.8% |
49.0% |
65.8 |
104.4 |
7.1% |
13.7% |
1.0x |
Accumulate |
|
ABSA Bank |
34.3 |
35.0 |
2.0% |
2.0% |
40.6% |
24.9 |
36.8 |
5.9% |
11.3% |
1.9x |
Accumulate |
|
CIC Group |
4.8 |
4.7 |
(1.9%) |
(1.9%) |
3.7% |
4.5 |
5.0 |
2.8% |
8.1% |
1.2x |
Hold |
|
Equity Group |
93.3 |
106.0 |
13.7% |
13.7% |
58.2% |
67.0 |
108.8 |
5.4% |
8.0% |
1.4x |
Hold |
|
Standard Chartered Bank |
334.5 |
349.3 |
4.4% |
4.4% |
16.5% |
299.8 |
345.8 |
8.9% |
7.9% |
2.2x |
Hold |
|
Jubilee Holdings |
402.5 |
415.0 |
3.1% |
3.1% |
28.7% |
322.5 |
420.5 |
3.6% |
4.9% |
0.6x |
Lighten |
|
I&M Group |
78.3 |
81.8 |
4.5% |
4.5% |
91.0% |
42.8 |
81.1 |
4.6% |
3.8% |
1.3x |
Lighten |
|
Diamond Trust Bank |
187.5 |
192.5 |
2.7% |
2.7% |
67.8% |
114.8 |
190.2 |
4.7% |
3.5% |
0.5x |
Lighten |
|
Britam |
18.6 |
20.4 |
9.7% |
9.7% |
125.2% |
9.1 |
18.5 |
0.0% |
(9.6%) |
1.5x |
Sell |
|
*Target Price as per Cytonn Analyst estimates **Upside/ (Downside) is adjusted for Dividend Yield ***Dividend Yield is calculated using FY’2025 Dividends |
|||||||||||
Notable highlights for August 2026:
-
During the month, the listed banks released their H1’2026 financial results, with the majority recording growth in profitability, recording a 16.8% weighted average growth in core Earnings per Share (EPS) in H1’2026, compared to the weighted average growth of 8.4% in H1’2025. Interest income recorded a weighted average increase of 4.8% in H1’2026, compared to the 2.0% decline recorded in H1’2025. Interest expenses recorded a market-weighted average decline of 5.6% in H1’2026, compared to the 20.7% decline in H1’2025. Overall, the results highlighted continued resilience in the banking sector, supported by strong earnings growth across most tier-one and tier-two banks, despite profitability pressures at some institutions. For more information, please see our Cytonn Weekly #34/2026;
We maintain a “cautiously optimistic” short-term outlook supported primarily earnings-led attractive valuations, despite rising yields on short-term government papers, which increase competition for capital by drawing investors towards risk-free government securities, as well as heightened geopolitical risks such as Iran war that may weigh on investor sentiment, and, “neutral” in the long term as persistent foreign investor outflows continue to constrain market liquidity and limit broad-based market re-rating. With the market currently trading at a discount to its future growth (PEG Ratio at 1.0x), where performance will be driven by company-specific fundamentals rather than general market direction, we believe that investors should reposition towards value stocks exhibiting strong earnings growth, attractive dividend yields, solid balance sheets, sustainable competitive advantages and trading at compelling discounts to their intrinsic value. While foreign investor sell-offs are expected to continue exerting pressure in the near term, we believe this will create selective entry opportunities for long-term investors.
-
Industry Report
There were four notable industry highlights during the month:
| Cytonn Report: Notable Industry Reports During the Month of August 2026 | |||
| Theme | Report | Key Take-outs | |
| 1. | Kenya Market Update H1'2026 Report | Knight Frank’s H1’2026 Kenya Market Update |
|
| 2. | Leading Economic Indicators | June Leading Economic Indicators (LEI) |
|
| 3. | Land Sector | Hass Consult Q2’2026 Land Index |
|
| 4. | Residential Sector | Hass Consult Q2’2026 Property Index |
|
-
Residential Sector
-
Mukuru residents seek resolution on housing allocation
During the week, residents of Mukuru raised concerns over the allocation of units under the Affordable Housing Programme, with some applicants reporting that they had paid deposits but were later informed that their preferred units had been sold out. Following the concerns, the Affordable Housing Board indicated that high demand had resulted in some applicants missing out on the available units. The Board identified 164 residents who had been enumerated before construction but had not received houses, alongside approximately 300 others verified Mukuru residents who had applied but were unsuccessful. The Board stated that some affordable housing units would be reclassified as social housing to accommodate the affected residents.
The developments are likely to have implications for homeownership among Mukuru residents, particularly given the role of the Affordable Housing Programme in improving access to formal housing for households that may otherwise face affordability constraints. Addressing the concerns could improve confidence among applicants and support greater participation in future affordable housing projects. Additionally, ensuring clear and transparent allocation processes, including effective verification of eligible beneficiaries, will be important in strengthening confidence in the programme and ensuring that available units reach the intended households.
Going forward, resolving the allocation concerns and providing housing to the affected eligible residents could support Mukuru’s transition towards formal housing by improving residential stability and encouraging the uptake of supporting amenities and services. A transparent and well managed allocation process could also enhance confidence in affordable housing initiatives and support greater homeownership uptake in the area. Conversely, prolonged uncertainty around allocations could delay these benefits and discourage participation among prospective homeowners, particularly if applicants remain uncertain about the outcome of their applications.
There were four notable residential highlights during the month;
-
During the month, KMRC released their H1’2026 financial results, recording a 35.6% decrease in profit after tax to Kshs 350.7 mn in HY’2026, from Kshs 544.2 mn in HY’2025. For a more detailed analysis, please see our Kenya Mortgage Refinance Company H1’2026 Earnings Note.
-
During the month, the Kenya Revenue Authority (KRA) moved to strengthen enforcement of the Affordable Housing Levy following amendments introduced under the Finance Act 2026. The changes give KRA clearer powers to recover unpaid or unremitted housing levy, including through measures such as bank account recovery, asset seizures and PIN deactivation. For more information, please see our Cytonn Weekly #33/2026
-
During the month, the Treasury reported that taxpayers have collectively contributed Kshs 206.5 bn into President Ruto's Affordable Housing Programme over three years, making it one of the largest payroll-funded public construction initiatives in Kenya's history. Treasury records show that the Housing Development Levy generated Kshs 54.2 bn in 2023/24, Kshs 73.2 bn in 2024/25, and Kshs 79.1 bn in 2025/26, lifting cumulative collections beyond Kshs 200.0 bn despite court battles and political resistance. For more information, please see our Cytonn Weekly #32/2026
-
During the month Reportage Kenya, a Real Estate developer, launched Enzo Residence, a 346-unit apartment development in Riverside, Nairobi, with the mix skewed towards smaller units studios account for which account for 63.6% (220 units), followed by one-bedroom units at 22.8% (79 units) and two-bedroom units at 13.6% (47 units), marking the developer's third project in Kenya following DG West and DG JKIA, both of which remain under construction. For more information, please see our Cytonn Weekly #31/2026
We expect the residential sector to continue recording sustained activity, supported by persistent housing demand, ongoing urbanization, with the urbanization rate at 29.0%, and continued investment in affordable housing. The implementation of affordable housing projects across major urban centres is expected to expand the housing stock and improve access to homeownership, while also supporting activity across the construction value chain. Population growth, rural to urban migration, and the continued expansion of satellite towns are likely to sustain demand for residential developments, particularly within the middle income and affordable housing segments. Meanwhile, ongoing improvements in infrastructure and transport connectivity should continue opening up emerging residential nodes, enhancing their attractiveness to both developers and homebuyers. This is likely to support further development beyond traditional urban centres and contribute to the gradual expansion of Kenya’s residential property market.
-
Infrastructure Sector
There were two notable highlights during the month
-
During the month, the government announced that Nairobi's long-delayed metro rail project, estimated to cost approximately Kshs 1.0 tn, is expected to begin construction with a 10-kilometre first phase linking the Central Business District (CBD) to Eastlands in 2028. The proposed underground and overground Mass Rapid Transit System (MRTS), whose full network is planned to cover 30 km, is being pursued as part of the current regime’s Vision 2060 agenda, with the Government arguing that more efficient public transport is necessary to support Nairobi's economic growth and development. For more information, please see our Cytonn Weekly #32/2026,
-
During the month, Kenya and Tanzania have renewed efforts to connect their Standard Gauge Railway (SGR) networks to landlocked neighbours Uganda, Rwanda, and Burundi, amid growing pressure to diversify funding sources for the undertakings. Kenya recently broke ground on the extension of its railway line from Naivasha to Kisumu and the border town of Malaba, six years after the project stalled, while Tanzania has initiated the extension of its SGR westward from Dodoma to Kigoma on the shores of Lake Tanganyika, with plans to add two new lines linking its port city of Tanga to Musoma on the shores of Lake Victoria and connecting to Rwanda, Burundi, and Uganda. For more information, please see our Cytonn Weekly #32/2026,
We expect the infrastructure sector to remain supported by continued government investment in transport networks and efforts to accelerate the implementation of ongoing projects. The recent mobilization of Kshs 139.0 bn to settle certified outstanding bills owed to road contractors is expected to facilitate the resumption and acceleration of road projects across the country, supporting activity within the construction value chain. Meanwhile, the ongoing development of the Naivasha–Kisumu–Malaba SGR is expected to strengthen connectivity between Nairobi, Western Kenya and neighboring markets, while improving the movement of goods and passengers along the corridor. We also expect continued investment in urban transport infrastructure, including planned mass rapid transit and commuter rail projects, to improve mobility within Nairobi and its surrounding areas. These developments are likely to support economic activity, enhance connectivity and unlock new development opportunities along emerging transport corridors, particularly where improved infrastructure increases accessibility and attracts residential, commercial and industrial investment.
-
Mixed-Use Development Sector
-
Tatu City plans landmark mixed-use development
During the week, it was reported that Tatu City plans to develop Jabali Towers in Ruiru, Kiambu County, set for the tallest building outside Nairobi. The proposed mixed-use development will comprise two residential towers, with one rising 20 floors and the other 30 floors, reaching a height of 136.8 metres. The project is expected to sit on approximately 9,518 square metres within Tatu Central’s Central Business District at an estimated cost of Kshs 7.1 bn. The development will primarily comprise studios and one, two, and three-bedroom apartments, alongside amenities including a fitness centre, swimming pool, wellness facilities, co working spaces, shops and restaurants.
The development is consistent with Tatu City’s masterplan, which promotes compact and high-density development within its mixed-use urban environment. Tatu City has continued to attract residential and commercial investment, with the development currently hosting more than 100 businesses and over 7,000 residents. The proposed towers therefore add to the growing pipeline of high rise residential developments within the Nairobi Metropolitan Area, as developers increasingly explore vertical development in locations outside Nairobi.
Going forward, the development of Jabali Towers could further strengthen Ruiru’s position as an emerging residential and commercial node within Kiambu County by increasing the supply of modern housing and supporting amenities. The project could also enhance the attractiveness of the wider Tatu City area to residents and businesses, potentially supporting demand for surrounding residential, retail and service developments as the area continues to urbanize. The continued expansion of high-density developments outside Nairobi could contribute to the decentralization of real estate activity within the Nairobi Metropolitan Area.
There was one notable highlight during the month
-
During the month, the National Social Security Fund (NSSF) announced plans to revive its approximately 1,000-acre landholding in Katani, Mavoko, Machakos County through the development of a mixed-use city. The fund is seeking a development partner to undertake feasibility studies, prepare a master plan and implement an initial phase of the project. Unlike its earlier proposals that largely centered on housing, the current concept brings together residential, commercial, industrial, institutional, warehousing and hospitality uses, creating a broader development model for the property. For more information, please see our Cytonn Weekly #33/2026
-
Real Estate Investments Trusts
-
REITs Weekly Performance
On the Unquoted Securities Platform Acorn D-REIT and I-REIT traded at Kshs 29.7 and Kshs 24.4 per unit, respectively, as per the last updated data on 28th August 2026. The performance represented a 48.5% and 22.0% gain for the D-REIT and I-REIT, respectively, from the Kshs 20.0 inception price. The volumes traded for the D-REIT and I-REIT came in at 0.1 mn and 1.5 mn shares, respectively. Additionally, ILAM Fahari I-REIT traded at Kshs 20.5 per share as of 28th August 2026, representing a 2.7% gain from the Kshs 20.0 inception price. REITs offer various benefits, such as tax exemptions, diversified portfolios, and stable long-term profits. However, the ongoing decline in the performance of Kenyan REITs and the restructuring of their business portfolios are hindering significant previous investments. Additional general challenges include:
-
Insufficient understanding of the investment instrument among investors leading to a slower uptake of REIT products,
-
Lengthy approval processes for REIT creation,
-
High minimum capital requirements of Kshs 100.0 mn for REIT trustees compared to Kshs 10.0 mn for pension funds Trustees, essentially limiting the licensed REIT Trustee to banks only
-
The rigidity of choice between either a D-REIT or and I-REIT forces managers to form two REITs, rather than having one Hybrid REIT that can allocate between development and income earning properties
-
Limiting the type of legal entity that can form a REIT to only a trust company, as opposed to allowing other entities such as partnerships, and companies,
-
We need to give time before REITS are required to list – they would be allowed to stay private for a few years before the requirement to list given that not all companies maybe comfortable with listing on day one, and,
-
Minimum subscription amounts or offer parcels set at Kshs 0.1 mn for D-REITs and Kshs 5.0 mn for restricted I-REITs. The significant capital requirements still make REITs relatively inaccessible to smaller retail investors compared to other investment vehicles like unit trusts or government bonds, all of which continue to limit the performance of Kenyan REITs.
There were two notable highlights during the month
-
During the month, Laptrust released the H1’2026 financial results for the Imara I-REIT for the period ended 30th June 2026. For more comprehensive analysis, please see our Laptrust Imara I-REIT Earnings Note
-
During the month, , warehousing developer Africa Logistics Properties (ALP) received a Kshs 228.0 mn stamp duty relief after transferring its properties into its recently listed Income Real Estate Investment Trust (I-REIT), following provisions under the Finance Act 2026 which exempted such transfers from the levy. For more information, please see our Cytonn Weekly #32/2026,
We expect the performance of Kenya’s real estate sector to remain resilient, supported by several factors: i) Resilience in the residential sector as the race for affordable housing intensifies ii) Continued infrastructure growth as supported by the construction of the Kenya-Tanzania SGR, The proposed underground and overground Mass Rapid Transit System (MRTS). However, challenges such as rising construction costs, infrastructure constraints, weak investor appetite in listed REITs such as ILAM Fahari I-REIT, oversupply in select real estate classes, and high capital demands will continue to impede the sector’s optimal performance
-
Kenya Integrates eTIMS with IFMIS to Enforce Automated Tax Checkpoints for Public Payments
During the week, the Kenya Revenue Authority (KRA), in partnership with the National Treasury, officially integrated its Electronic Tax Invoice Management System (eTIMS) with the government’s payment platform, the Integrated Financial Management Information System (IFMIS). Under the unified framework, suppliers doing business with public entities are now required to generate valid electronic tax invoices on eTIMS before submitting payment bills through IFMIS, creating an automated cross-validation checkpoint. KRA further cautioned that non-validated invoices will not be processed, urging suppliers to maintain up-to-date tax compliance records. The integration significantly reduces tax evasion and invoice tampering across public procurement by embedding tax compliance directly into the government's disbursements workflow. For payment service providers and financial institutions handling government supplier accounts, the move accelerates the adoption of digital tax-compliant invoicing and improves transactional transparency across public financial management.
-
Visa Launches Enhanced A2A Protect to Combat Account-to-Account Fraud
During the week, Visa Inc. announced an enhanced version of A2A Protect, introducing its first in-market unified fraud score integrated with Featurespace technology following its acquisition. Designed to address account-to-account payment fraud before funds leave accounts, the upgraded solution leverages real-time AI and transfer learning to reduce false alerts by over 40.0% and increase fraud detection by up to 75.0% within six months of deployment. The platform operates via a single API and offers network-level risk sharing to detect coordinated scam threats across participating institutions. The rollout strengthens risk mitigation for financial institutions as global account-to-account payments accelerate toward an estimated 5.8 trillion transactions by 2028. By providing instant network-level risk signals and reducing implementation friction via API integration, Visa positions itself to capture greater value across non-card payment rails while offering institutional clients advanced fraud prevention tools.
-
Circle Stock Surges 14.7% Following Congressional Testimony on the GENIUS Act
During the week, Circle Internet Group Inc. saw a 14.7% jump in its share price following testimony by its President, Heath Tarbert, before the U.S. House Financial Services Committee. Tarbert urged Congress to pass the GENIUS Act, which proposes establishing a federal regulatory framework for payment stablecoins covering reserve backing, redemption rights, and disclosure rules ahead of a January 27, 2027 compliance deadline. The positive market reaction underscores rising investor confidence that federal regulatory clarity will accelerate institutional adoption of USDC and Circle's blockchain payment infrastructure. Enactment of stablecoin legislation would lower regulatory uncertainty, solidify reserve standards, and enhance the U.S. dollar's dominance in cross-border digital transactions.
-
Block Opens Cash App Score to Third-Party Lenders via Nova Credit Partnership
During the week, Block, Inc. announced a strategic partnership with Nova Credit to distribute its proprietary Cash App Score to external lenders through Nova Credit’s Cash Flow Intelligence Platform. The real-time, cash-flow-based credit scoring model draws on first-party activity across the Cash App ecosystem including deposits, spending, and peer-to-peer transactions to evaluate consumer creditworthiness without requiring additional credentialing. Internal data indicates the model approves up to 38.0% more customers in Cash App Borrow at equivalent loss rates compared to traditional FICO models. By externalizing its proprietary scoring model into non-competing verticals such as auto lending and credit cards, Block monetizes its unique data ecosystem while broadening financial access for underbanked populations. The partnership enhances Block’s position as a core credit infrastructure provider and offers third-party lenders dynamic, real-time risk assessment tools that adapt to shifting macroeconomic conditions.
-
Digital Payments Stock Performance
The table below presents a snapshot of NYSE-listed digital payments stocks, covering Visa, Mastercard, American Express (AXP), Wise Plc, Block, Global Payments and PayPal:
|
Cytonn Report: Digital Payments NYSE and LSE Stock Performance |
|||||||||
|
Company |
Year Open 2026 |
Price 7/31/2026 |
Price 8/28/2026 |
Price 9/04/2026 |
w/w change |
m/m change |
YTD change |
Forward P/E |
|
|
American Express |
372.7 |
310.7 |
333.2 |
326.2 |
(2.1%) |
5.0% |
(12.5%) |
16.5x |
|
|
Visa |
346.5 |
366.1 |
381.6 |
375.1 |
(1.7%) |
2.4% |
8.3% |
25.3 x |
|
|
Mastercard |
563.1 |
573.1 |
595.3 |
595.3 |
0.0% |
3.9% |
5.7% |
25.3 x |
|
|
Circle |
83.5 |
62.6 |
87.1 |
102.1 |
17.2% |
63.1% |
22.3% |
71.9 x |
|
|
Block |
65.2 |
81.2 |
83.6 |
82.8 |
(0.9%) |
2.0% |
27.1% |
16.0 x |
|
|
PayPal Holdings |
58.1 |
57.2 |
53.7 |
55.0 |
2.5% |
(3.8%) |
(5.4%) |
9.8 x |
|
|
Global Payments Inc |
77.0 |
84.1 |
91.8 |
92.5 |
0.7% |
10.0% |
20.1% |
5.8 x |
|
|
Wise PLC |
11.8 |
12.0 |
13.1 |
12.8 |
(2.2%) |
6.6% |
8.6% |
26.0 x |
|
|
Average |
24.6 x |
||||||||
Source: Visa, AXP, Circle, Mastercard, Block, Wise and PayPal financials, NYSE, yahoo finance
The stocks are c trading at an average forward P/E multiple of 24.6x, indicating that investors are pricing in strong future earnings growth and are prepared to pay a substantial premium for current earnings. This also suggests that valuations may be stretched relative to near-term fundamentals.
Other notable digital payments sector highlights during the month of August 2026 include:
-
During the month, Visa enhanced its cybersecurity capabilities through updates to its open-source Visa Vulnerability Agentic Harness (VVAH) and expanded its Visa Consulting & Analytics (VCA) Cybersecurity Advisory Practice, introducing AI-driven remediation, vulnerability validation and specialized advisory services to help financial institutions address emerging AI-related security risks. Cytonn Weekly #34/2026
-
During the month, the Central Bank of Kenya (CBK) enhanced retail Treasury securities settlement through the integration of M-Pesa into its DhowCSD platform, enabling investors to directly settle Treasury bill and bond bids of up to Kshs 250,000.0 through mobile payments, reducing settlement friction and supporting greater retail participation in the domestic government securities market. Cytonn Weekly #33/2026
-
During the month, Mastercard Incorporated appointed Yasemin Bedir as President of its Eastern Europe, Middle East and Africa (EEMEA) region, effective 1 September 2026, with responsibility for driving digital payments adoption, expanding market penetration and strengthening strategic partnerships across the region. Cytonn Weekly #32/2026
We expect the global digital payments sector to continue evolving toward greater payment sovereignty, digital infrastructure modernization, and reduced reliance on traditional card-based payment networks as governments and financial institutions increasingly prioritize control over domestic payment ecosystems. Recent developments, particularly the European Central Bank’s progress toward launching the Digital Euro, signal a growing global shift toward central bank-backed digital payment infrastructure aimed at enhancing financial resilience, improving transaction efficiency, and strengthening monetary independence in an increasingly digital economy. This trend is likely to accelerate competition between public-sector digital currencies and established private payment networks such as Visa Inc. and Mastercard Incorporated, while driving broader innovation across digital finance infrastructure. However, despite these favorable long-term structural tailwinds, valuations within the sector remain relatively elevated, with the companies under coverage trading at an average forward P/E of 24.6x, suggesting that a significant portion of future growth expectations may already be priced in. As such, we expect near-term performance to remain sensitive to regulatory developments, execution risk, and the pace at which both incumbents and emerging digital payment infrastructure providers adapt to the rapidly changing payments landscape.
Disclaimer: The views expressed in this publication are those of the writers where particulars are not warranted. This publication, which follows Section 2 of the Capital Markets Authority Act Cap 485A, is meant for general information only and is not a warranty, representation, advice or solicitation of any nature. Readers are advised in all circumstances to seek the advice of a registered investment advisor.

- Talk to us
- Kenya
- P.O Box 20695 - 00200, Nairobi, Kenya
- Cell +254709101200
- Tel +254709101200
- WhatsApp +254741676635
- United States
- +254709101200
- DOWNLOAD OUR APP
-


- Kenya
- 8th Floor, Pinetree Plaza, Kaburu Drive, Ngong Road, Nairobi, Kenya
- USA
- Suite 1150, 1775 Eye Street NW, USA, Washington DC 20006, USA
- Investments
- High Yield
- Private Equity
- Real Estate
- Real Estate
- RiverRun Estates
- Cytonn Towers
- The Ridge
- Taraji Heights
- The Alma