Cytonn Monthly - May 2025
By Research Team, Jun 1, 2025
Executive Summary
Fixed Income
During the month of May 2025, T-bills were oversubscribed, with the overall average subscription rate coming in at 154.5%, albeit lower than the subscription rate of 183.0% recorded in April 2025. The overall average subscription rates for the 91-day, 182-day and 364-day paper decreased to 157.1%, 97.1% and 210.9% respectively, from 292.1%, 99.0% and 223.4% respectively recorded in April 2025. The average yields on the government papers were on a downward trajectory during the month, with the average 91-day, 182-day, and 364-day papers yields decreasing by 14.1 bps, 23.2 bps, and 17.2 bps to 8.4%, 8.6% and 10.0% respectively, from an average of 8.5%, 8.8% and 10.2% recorded the previous month. For the month of May, the government accepted a total of Kshs 136.4 bn of the Kshs 148.4 bn worth of bids received in T-Bills, translating to an acceptance rate of 92.0%, compared to an acceptance rate of 92.9% in the month of April;
During the week, T-bills were oversubscribed for the fourth consecutive week, with the overall subscription rate coming in at 229.6%, higher than the subscription rate of 142.4% recorded the previous week. Investors’ preference for the shorter 91-day paper persisted, with the paper receiving bids worth Kshs 19.2 bn against the offered Kshs 4.0 bn, translating to a subscription rate of 480.0%, significantly higher than the oversubscription rate of 113.2%, recorded the previous week. The subscription rates for the 182-day decreased to 97.7% from the 113.9% recorded the previous week while the 364-day papers increased to 261.3% from the 182.7% respectively recorded the previous week. The government accepted a total of Kshs 43.7 bn worth of bids out of Kshs 55.1 bn bids received, translating to an acceptance rate of 79.3%. The yields on the government papers were on a downward trajectory with the yields on the 91-day paper decreasing the most by 3.0 bps to 8.29% from the 8.32% recorded the previous week, while the yields on the 182-day and 364-day papers decreased by 1.1 bps and 0.3 bps to 8.56% and 10.00, from the 8.58% and 10.00% recorded the previous week;
Additionally, May 2025 bonds were oversubscribed, with the overall average subscription rate coming in at 147.7%, higher than the average subscription rate of 117.4% recorded in April 2025. The reopened bonds FXD1/2022/015 and FXD1/2022/025 with tenors to maturity of 12.0 years and 22.5 years respectively and fixed coupon rates of 13.9% and 14.2% respectively, received bids worth Kshs 57.1 bn against the offered Kshs 50.0 bn translating to an oversubscription rate of 114.2%. The government accepted bids worth Kshs 50.4 bn, translating to an acceptance rate of 88.2%, with the average accepted yields coming at 13.9% and 14.5% for the FXD1/2022/015 and FXD1/2022/025 respectively. Additionally, the reopened FXD1/2012/020, with a tenor to maturity of 7.6 years and a fixed coupon rate of 12.0%, received bids worth Kshs 54.4 bn against the offered Kshs 30.0 bn translating to an oversubscription rate of 181.3%, with the government accepting bids worth Kshs 43.5 bn, translating to an acceptance rate of 80.0%, with the average accepted yield coming in at 13.6%. For the month of May, the government accepted a total of Kshs 93.9 bn of the Kshs 111.5 bn worth of bids received in T-Bonds, translating to an acceptance rate of 85.8% compared to an acceptance rate of 98.4% in the month of April;
During the week, the National Treasury gazetted the revenue and net expenditures for the tenth month of FY’2024/2025, ending 30th April 2025, highlighting that the total revenue collected as at the end of April 2025 amounted to Kshs 1,940.4 bn, equivalent to 75.2% of the revised estimates II of Kshs 2,580.9 bn for FY’2024/2025 and is 90.2% of the prorated estimates of Kshs 2,150.8 bn.
During the week, KNBS released the y/y inflation in May 2025 decreased by 0.3% points to 3.8%, from the 4.1% recorded in April 2025. The headline inflation in May 2025 was majorly driven by increase in prices of commodities in the following categories; Food & Non-Alcoholic Beverages, Transport sector and Housing, water, electricity, gas and other fuels by 6.3%, 2.3% and 0.8% respectively;
Equities
During the month of May 2025, the equities market was on an upward trajectory, with NASI gaining the most by 6.4%, while NSE 10, NSE 25 and NSE 20 gained by 4.9%, 3.6% and 2.2% respectively. The equities market positive performance was driven by gains recorded by large-cap stocks such as Safaricom, KCB Bank and Co-operative Bank Kenya of 17.4%, 9.5%, and 7.6% respectively. The monthly performance was however weighed down by losses recorded by large cap stocks such as Stanbic Bank, Standard Chartered Bank and BAT of 12.9%, 10.5% and 6.3% respectively.
During the week, the equities market registered a mixed performance, with NASI gaining by 0.2% while NSE 10, NSE 25 and NSE 20 lost by 1.4%, 1.2% and 0.3% respectively, taking the YTD performance to gains of 7.1%, 6.1%, 2.2% and 1.6% for NASI, NSE 20, NSE 25 and NSE 10 respectively. The week on week equities market performance was driven by gains recorded by large-cap stocks such as NCBA, Safaricom and KCB Bank of 4.8%, 3.5%, and 3.2% respectively. The performance was however weighed down by losses recorded by large-cap stocks such as BAT, Equity Bank and DTB-Kenya of 13.1%, 11.1% and 5.9% respectively;
Additionally, in the regional equities market, the East African Exchanges 20 (EAE 20) share index gained by 0.6% to 100.6 from 100.0 recorded the previous week, attributable to gains recorded by large cap stocks such as NMB Bank, Bralirwa Limited and Safaricom of 5.6%, 4.9% and 3.5% respectively. However, the performance was weighed down by the losses recorded by large cap stocks such as Equity Bank, Co-operative Bank and Cimerwa Plc of 11.2%, 1.3% and 0.7% respectively.
During the week, Sanlam released the results of its earlier approved rights issue, announcing that the rights were fully subscribed including underwriting with a total subscription rate of 81.5% before underwriting, having received offers worth Ksh 2.0 bn against the offered Ksh 2.5 bn. Sanlam Allianz Africa Proprietary Limited, acquired an extra 92.3 mn shares at a cost of Kshs 461.6 mn in its role as the underwriter (buyer of last resort) in the rights issue. Notably, the Group accepted 402.6 million shares under the entitlement option against the offered 500.0 million, translating to an acceptance rate of 80.5%;
During the week, five of the listed banks released their Q1’2025 results. Equity bank released its Q1’2025 financial results, with its Core Earnings per Share (EPS) decreasing by 3.9% to Kshs 3.9, from Kshs 4.1 in Q1’2024
Absa bank released its Q1’2025 financial results, with its Core Earnings per Share (EPS) increasing by 3.7% to Kshs 1.14, from Kshs 1.09 in Q1’2024;
DTB-Kenya released its Q1’2025 financial results, with its Core Earnings per Share (EPS) increasing by 23.0% to Kshs 11.5, from Kshs 9.4 in Q1’2024.
I&M Group released its Q1’2025 financial results, with its Core Earnings per Share (EPS) increasing by 17.9% to Kshs 2.4, from Kshs 2.0 in Q1’2024.
Lastly, HF group released its Q1’2025 financial results, with its Core Earnings per Share (EPS) decreasing by 89.3% to Kshs 0.1, from Kshs 1.3 in Q1’2024, mainly on the back outstanding share increase following rights issue.
Real Estate
During the week, The World Bank recommended exempting Kenyan workers earning below Kshs 32,333 monthly from the 2.75% Social Health Insurance Fund (SHIF) and 1.5% Affordable Housing Levy deductions. This aims to increase disposable income for low-income workers, whose take-home pay has been significantly reduced by these levies and increased NSSF contributions,
During the week, President William Ruto and former Prime Minister Raila Odinga commissioned Phase One of the LAPFUND Makasembo Affordable Housing Project in Kisumu, a significant step in Kenya’s Affordable Housing Programme. This phase, built on an 11.6-acre site, delivered 910 housing units: 180 one-bedroom, 100 two-bedroom, and 290 three-bedroom low-cost units, plus 600 two-bedroom and 700 three-bedroom middle-cost units, with 1,754 parking spaces,
During the week, the Purple Tower, a 14-storey mixed-use development along Mombasa Road in Nairobi, was officially opened, marking a historic moment with Kenya’s first-ever drone light show. Developed by Purple Dot International, this eco-friendly skyscraper, located near the Melili/Mombasa Road junction and Jomo Kenyatta International Airport, integrates Grade A office spaces, showrooms, and retail areas across 197,800 square feet, including 12,330 square feet of showroom space and 8,306 square feet of restaurant space,
On the Unquoted Securities Platform, Acorn D-REIT and I-REIT traded at Kshs 26.7 and Kshs 22.9 per unit, respectively, as per the last updated data on 23rd May 2025. The performance represented a 33.4% and 14.5% gain for the D-REIT and I-REIT, respectively, from the Kshs 20.0 inception price. Additionally, ILAM Fahari I-REIT traded at Kshs 11.0 per share as of 23rd May 2025, representing a 45.0% loss from the Kshs 20.0 inception price. The volume traded to date came in at 1.2 mn shares for the I-REIT, with a turnover of Kshs 1.5 mn since inception in November 2015.
Investment Updates:
- Weekly Rates: Cytonn Money Market Fund closed the week at a yield of 13.60 % p.a. To invest, dial *809# or download the Cytonn App from Google Play store here or from the Appstore here;
- We continue to offer Wealth Management Training every Tuesday, from 7:00 pm to 8:00 pm. The training aims to grow financial literacy among the general public. To register for any of our Wealth Management Trainings, click here;
- If interested in our Private Wealth Management Training for your employees or investment group, please get in touch with us through wmt@cytonn.com;
- Cytonn Insurance Agency acts as an intermediary for those looking to secure their assets and loved ones’ future through insurance namely; Motor, Medical, Life, Property, WIBA, Credit and Fire and Burglary insurance covers. For assistance, get in touch with us through insuranceagency@cytonn.com;
- Cytonn Asset Managers Limited (CAML) continues to offer pension products to meet the needs of both individual clients who want to save for their retirement during their working years and Institutional clients that want to contribute on behalf of their employees to help them build their retirement pot. To more about our pension schemes, kindly get in touch with us through pensions@cytonn.com;
Hospitality Updates:
- We currently have promotions for Staycations. Visit cysuites.com/offers for details or email us at sales@cysuites.com;
Money Markets, T-Bills Primary Auction:
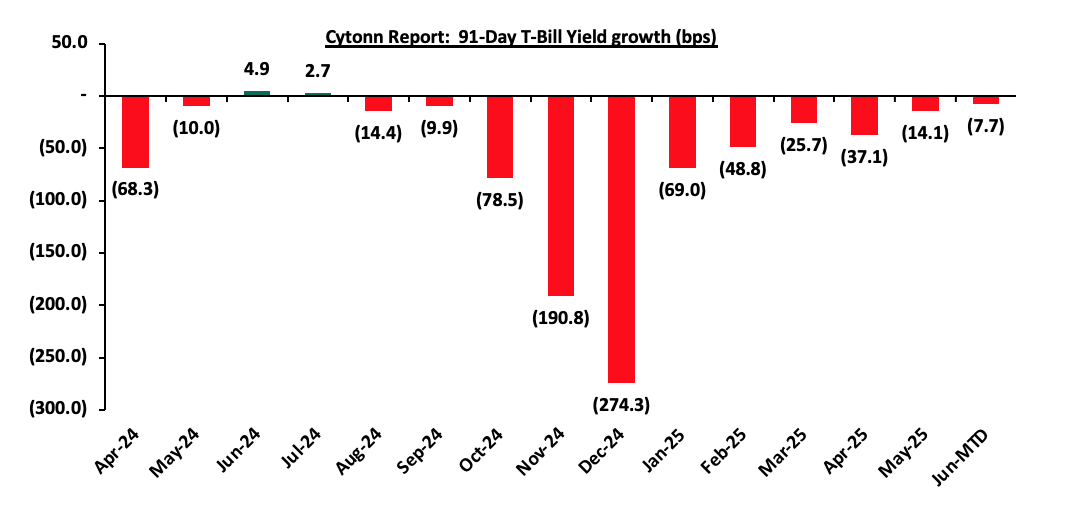
During the month of May 2025, T-bills were oversubscribed, with the overall average subscription rate coming in at 154.5%, albeit lower than the subscription rate of 183.0% recorded in April 2025. The overall average subscription rates for the 91-day, 182-day and 364-day paper decreased to 157.1%, 97.1% and 210.9% respectively, from 292.1%, 99.0% and 223.4% respectively recorded in April 2025. The average yields on the government papers were on a downward trajectory during the month, with the average 91-day, 182-day, and 364-day papers yields decreasing by 14.1 bps, 23.2 bps, and 17.2 bps to 8.4%, 8.6% and 10.0% respectively, from an average of 8.5%, 8.8% and 10.2% recorded the previous month. For the month of May, the government accepted a total of Kshs 136.4 bn of the Kshs 148.4 bn worth of bids received in T-Bills, translating to an acceptance rate of 92.0%, compared to an acceptance rate of 92.9% in the month of April. The chart below shows the yield growth rate for the 91-day paper in 2024 and during the year:
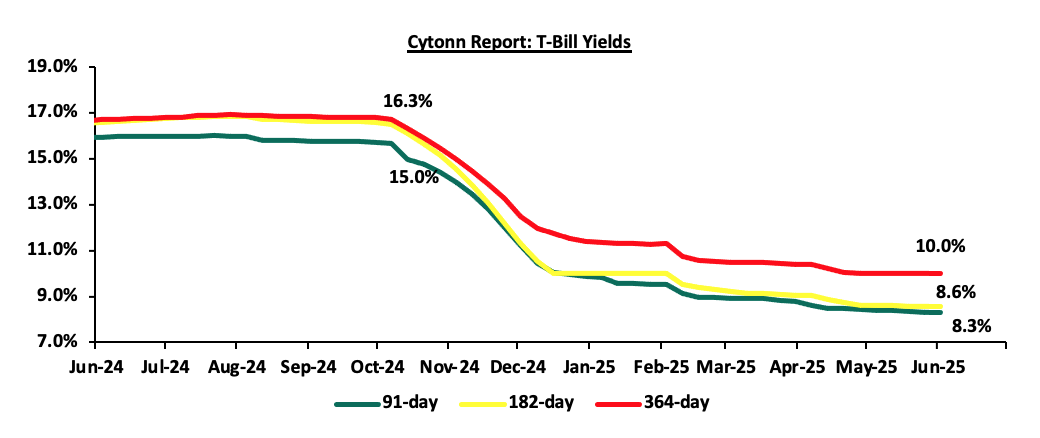
During the week, T-bills were oversubscribed for the fourth consecutive week, with the overall subscription rate coming in at 229.6%, higher than the subscription rate of 142.4% recorded the previous week. Investors’ preference for the shorter 91-day paper persisted, with the paper receiving bids worth Kshs 19.2 bn against the offered Kshs 4.0 bn, translating to a subscription rate of 480.0%, significantly higher than the oversubscription rate of 113.2%, recorded the previous week. The subscription rates for the 182-day decreased to 97.7% from the 113.9% recorded the previous week while the 364-day papers increased to 261.3% from the 182.7% respectively recorded the previous week. The government accepted a total of Kshs 43.7 bn worth of bids out of Kshs 55.1 bn bids received, translating to an acceptance rate of 79.3%. The yields on the government papers were on a downward trajectory with the yields on the 91-day paper decreasing the most by 3.0 bps to 8.29% from the 8.32% recorded the previous week, while the yields on the 182-day and 364-day papers decreased by 1.1 bps and 0.3 bps to 8.56% and 10.00, from the 8.58% and 10.00% recorded the previous week.
The charts below show the performance of the 91-day, 182-day and 364-day papers from June 2024 to June 2025:
So far in the current FY’2024/25, government securities totaling Kshs 1,741.0 bn have been advertised. The government has accepted bids worth Kshs 2,196.1 bn, of which Kshs 1,454.0 bn and Kshs 742.1 bn were treasury bills and bonds, respectively. The government has a domestic borrowing surplus of Kshs 362.3 bn in FY’2024/25, 60.7% ahead of its net domestic borrowing target of Kshs 597.2 bn for FY’2024/25.
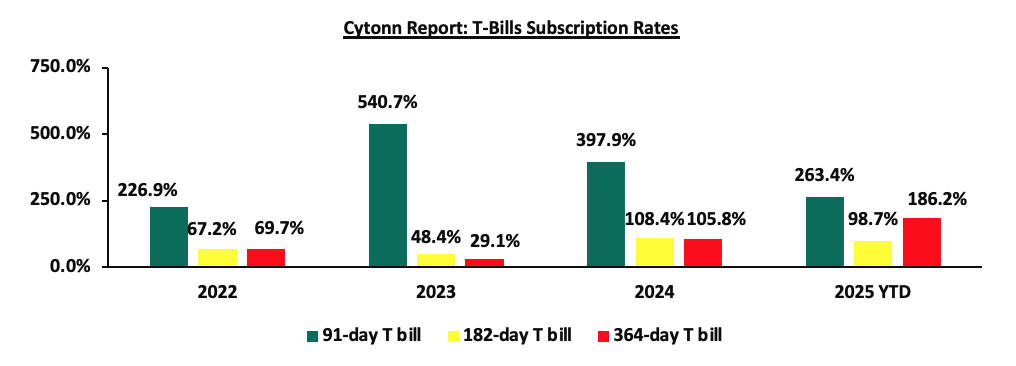
The chart below compares the overall average T-bill subscription rates obtained in 2022,2023, 2024 and 2025 Year-to-date (YTD):
Additionally, May 2025 bonds were oversubscribed, with the overall average subscription rate coming in at 147.7%, albeit higher than the average subscription rate of 117.4% recorded in April 2025. The reopened bonds FXD1/2022/015 and FXD1/2022/025 with tenors to maturity of 12.0 years and 22.5 years respectively and fixed coupon rates of 13.9% and 14.2% respectively, received bids worth Kshs 57.1 bn against the offered Kshs 50.0 bn translating to an oversubscription rate of 114.2%. The government accepted bids worth Kshs 50.4 bn, translating to an acceptance rate of 88.2%, with the average accepted yields coming at 13.9% and 14.5% for the FXD1/2022/015 and FXD1/2022/025 respectively. Additionally, the reopened FXD1/2012/020, with a tenor to maturity of 7.6 years and a fixed coupon rate of 12.0%, received bids worth Kshs 54.4 bn against the offered Kshs 30.0 bn translating to an oversubscription rate of 181.3%, with the government accepting bids worth Kshs 43.5 bn, translating to an acceptance rate of 80.0%, with the average accepted yield coming in at 13.6%. For the month of May, the government accepted a total of Kshs 93.9 bn of the Kshs 111.5 bn worth of bids received in T-Bonds, translating to an acceptance rate of 85.8% compared to an acceptance rate of 98.4% in the month of April.
The table below provides more details on the bonds issued in May 2025:
|
Issue Date |
Bond Auctioned |
Effective Tenor to Maturity (Years) |
Coupon |
Amount offered (Kshs bn) |
Actual Amount Raised/Accepted (Kshs bn) |
Total bids received (Subscription) |
Average Accepted Yield |
Subscription Rate |
Acceptance Rate |
|
07/05/2025 |
FXD1/2012/20- Reopened |
7.6 |
12.0% |
30.0 |
43.5 |
54.4 |
13.6% |
181.3% |
80.0% |
|
30/04/2025 |
FXD1/2022/025 - Reopened |
22.5 |
14.2% |
50.0 |
25.1 |
30.7 |
14.5% |
114.2% |
81.8% |
|
FXD1/2022/015 -Reopened |
12.0 |
13.9% |
25.3 |
26.4 |
13.9% |
95.7% |
|||
|
May 2025 Average |
14.0 |
13.4% |
80.0 |
93.9 |
111.5 |
14.0% |
147.7% |
85.8% |
|
|
April 2025 Average |
13.6 |
13.4% |
80.0 |
84.0 |
85.0 |
13.8% |
117.4% |
98.4% |
|
|
2024 Average
|
6.7 |
15.6% |
27.7 |
28.9 |
37.9 |
16.7% |
116.8% |
74.9% |
|
Secondary Bond Market:
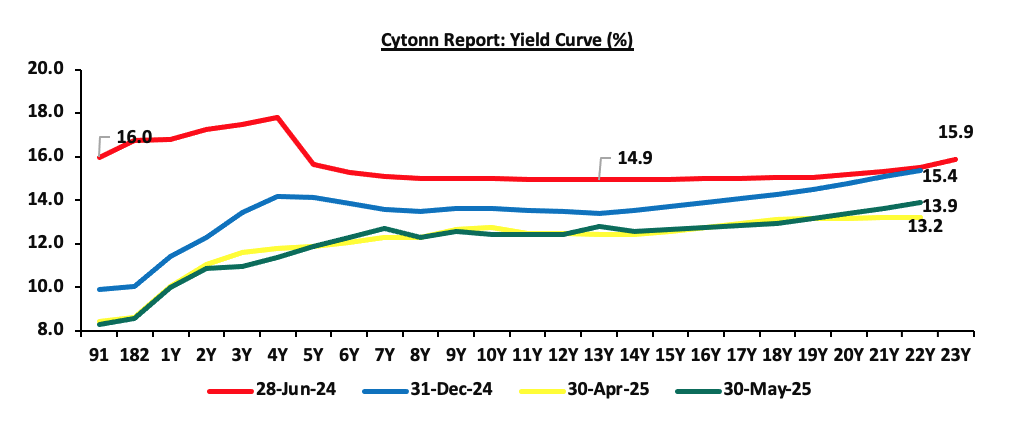
The yields on the government securities recorded a mixed performance during the month of May similar to April. Investors, apprehensive about the economic outlook in the long term, are demanding higher yields for bonds in the 14 to 20-year maturity range to compensate for the perceived risks as they anticipate potential fluctuations in economic conditions in the Kenyan market on the back of the government’s debt sustainability concerns. Notably, the yield curve has adjusted from a humped yield curve observed in 2023 and most part of 2024, towards a normal upward sloping curve, with long-term bonds registering highest yields. The shift in sentiment indicates increased confidence in the short-term economic landscape, in comparison to the last two years. The chart below shows the yield curve movement during the period:
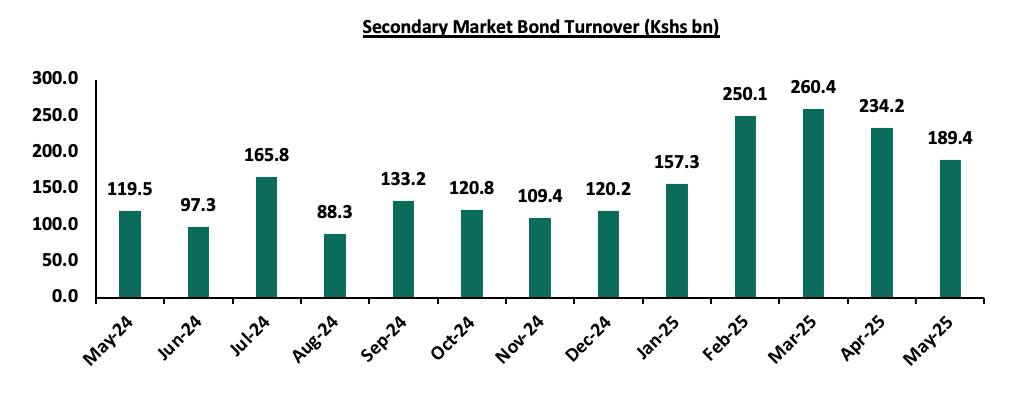
The secondary bond turnover decreased by 19.1% to Kshs 189.4 bn, from Kshs 234.2 bn recorded in April 2025, pointing towards decreased activities by commercial banks in the secondary bonds market for the month of May. However, on a year-on-year basis, the bond turnover increased by 58.5% from Kshs 119.5 bn worth of treasury bonds transacted over a similar period last year. The chart below shows the bond turnover over the past 12 months.
Money Market Performance:
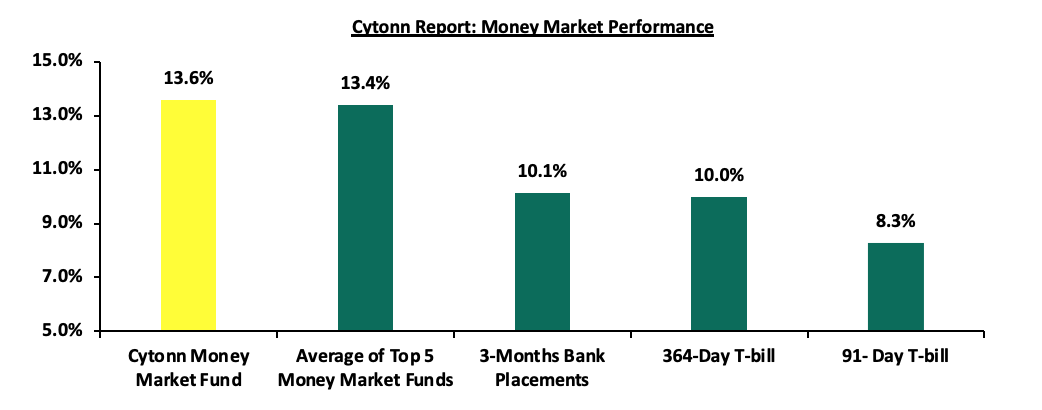
In the money markets, 3-month bank placements ended the week at 10.1% (based on what we have been offered by various banks), and yields on the government papers were on a downward trajectory with the yields on the 91-day paper and 364-day paper decreasing by 3.0 bps and 0.3 bps respectively to remain relatively unchanged from the 8.3% and 10.0% respectively recorded the previous week. The yield on the Cytonn Money Market Fund decreased by 3.0 bps to remain relatively unchanged, from the 13.6% recorded the previous week, while the average yields on the Top 5 Money Market Funds decreased by 0.2 bps to remain relatively unchanged from the 13.4% recorded the previous week.
The table below shows the Money Market Fund Yields for Kenyan Fund Managers as published on 30th May 2025:
|
Cytonn Report: Money Market Fund Yield for Fund Managers as published on 30th May 2025 |
||
|
Rank |
Fund Manager |
Effective Annual Rate |
|
1 |
Gulfcap Money Market Fund |
13.9% |
|
2 |
Cytonn Money Market Fund ( Dial *809# or download Cytonn App) |
13.6% |
|
3 |
GenAfrica Money Market Fund |
13.3% |
|
4 |
Kuza Money Market fund |
13.1% |
|
5 |
Ndovu Money Market Fund |
13.1% |
|
6 |
Arvocap Money Market Fund |
13.0% |
|
7 |
Etica Money Market Fund |
12.9% |
|
8 |
Lofty-Corban Money Market Fund |
12.8% |
|
9 |
Orient Kasha Money Market Fund |
12.7% |
|
10 |
Enwealth Money Market Fund |
12.0% |
|
11 |
British-American Money Market Fund |
11.8% |
|
12 |
Old Mutual Money Market Fund |
11.7% |
|
13 |
Madison Money Market Fund |
11.5% |
|
14 |
Jubilee Money Market Fund |
11.5% |
|
15 |
Nabo Africa Money Market Fund |
11.3% |
|
16 |
Genghis Money Market Fund |
11.3% |
|
17 |
Faulu Money Market Fund |
10.8% |
|
18 |
Dry Associates Money Market Fund |
10.7% |
|
19 |
Sanlam Money Market Fund |
10.6% |
|
20 |
Apollo Money Market Fund |
10.5% |
|
21 |
Absa Shilling Money Market Fund |
10.3% |
|
22 |
KCB Money Market Fund |
10.2% |
|
23 |
CIC Money Market Fund |
10.1% |
|
24 |
Co-op Money Market Fund |
10.0% |
|
25 |
ICEA Lion Money Market Fund |
9.9% |
|
26 |
Mali Money Market Fund |
9.7% |
|
27 |
Mayfair Money Market Fund |
9.2% |
|
28 |
AA Kenya Shillings Fund |
8.1% |
|
29 |
Stanbic Money Market Fund |
7.8% |
|
30 |
Ziidi Money Market Fund |
7.2% |
|
31 |
Equity Money Market Fund |
5.4% |
Source: Business Daily
Liquidity:
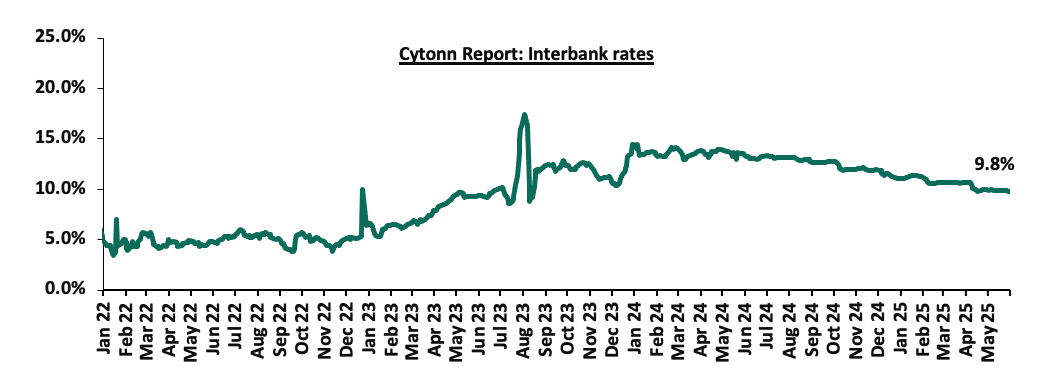
Liquidity in the money markets eased in the month of May 2025, with the average interbank rate decreasing by 0.3% to 9.9% from 10.2% recorded the previous month. However, during the month of May, the average interbank volumes traded decreased by 50.7% to Kshs 7.4 bn, from Kshs 15.0 bn recorded in April.
Additionally, during the week, liquidity in the money markets marginally eased, with the average interbank rate decreasing by 6.3 bps, to 9.8% from 9.9% the previous week, partly attributable to government payments that offset tax remittances. The average interbank volumes traded increased by 28.1% to Kshs 6.5 bn from Kshs 5.0 bn recorded the previous week. The chart below shows the interbank rates in the market over the years:
Kenya Eurobonds:
During the month, the yields on the Eurobonds were on a downward trajectory, with the yield on the 10-year Eurobond issued in 2018 decreasing the most by 140.3 bps to 8.7% from 10.1% recorded at the beginning of the month.
Similarly, during the week, the yields on Kenya’s Eurobonds were on a downward trajectory with the yield on the 10-year Eurobond issued in 2018 decreasing the most by 52.9 bps to 8.7% from 9.2% recorded the previous week. The table below shows the summary performance of the Kenyan Eurobonds as of 29th May 2025;
|
Cytonn Report: Kenya Eurobond Performance |
|||||||
|
|
2018 |
2019 |
2021 |
2024 |
2025 |
||
|
Tenor |
10-year issue |
30-year issue |
7-year issue |
12-year issue |
13-year issue |
7-year issue |
11-year issue |
|
Amount Issued (USD) |
1.0 bn |
1.0 bn |
0.9 bn |
1.2 bn |
1.0 bn |
1.5 bn |
1.5 bn |
|
Years to Maturity |
3.0 |
23.0 |
2.2 |
7.2 |
9.3 |
6.0 |
11.0 |
|
Yields at Issue |
7.3% |
8.3% |
7.0% |
7.9% |
6.2% |
10.4% |
9.9% |
|
02-Jan-25 |
9.1% |
10.3% |
8.5% |
10.1% |
10.1% |
10.1% |
|
|
01-May-25 |
10.1% |
11.4% |
8.4% |
11.1% |
10.9% |
11.2% |
|
|
22-May-25 |
9.2% |
11.0% |
- |
10.4% |
10.3% |
10.4% |
|
|
23-May-25 |
9.2% |
11.1% |
- |
10.5% |
10.4% |
10.4% |
|
|
26-May-25 |
9.2% |
11.1% |
- |
10.5% |
10.4% |
10.4% |
|
|
27-May-25 |
8.9% |
10.9% |
- |
10.2% |
10.2% |
10.1% |
|
|
28-May-25 |
8.8% |
10.8% |
- |
10.1% |
10.1% |
9.9% |
|
|
29-May-25 |
8.7% |
10.8% |
- |
10.0% |
10.0% |
9.9% |
|
|
Weekly Change |
(0.5%) |
(0.3%) |
- |
(0.4%) |
(0.3%) |
(0.5%) |
- |
|
MTD Change |
(1.4%) |
(0.6%) |
- |
(1.0%) |
(0.8%) |
(1.3%) |
- |
|
YTD Change |
(0.4%) |
0.5% |
- |
(0.0%) |
(0.0%) |
(0.2%) |
- |
Source: Central Bank of Kenya (CBK) and National Treasury
Kenya Shilling:
During the month, the Kenya Shilling appreciated by 7.9 bps against the US Dollar, to close the month at Kshs 129.2 from Kshs 129.3 recorded at the end of April.
During the week, the Kenya Shilling appreciated marginally against the US Dollar by 1.0 bps, to close the week at Kshs 129.2, from 129.3 recorded the previous week. On a year-to-date basis, the shilling has appreciated by 5.0 bps against the dollar, a contrast to the 17.4% appreciation recorded in 2024.
We expect the shilling to be supported by:
- Diaspora remittances standing at a cumulative USD 4,997.2 mn in the twelve months to April 2025, 12.1% higher than the USD 4,457.5 mn recorded over the same period in 2024. These has continued to cushion the shilling against further depreciation. In the April 2025 diaspora remittances figures, North America remained the largest source of remittances to Kenya accounting for 59.6% in the period,
- The tourism inflow receipts which came in at Kshs 452.2 bn in 2024, a 19.8% increase from Kshs 377.5 bn inflow receipts recorded in 2023, and owing to tourist arrivals that improved by 8.0% to 2,303,028 in the 12 months to February 2025 from 2,133,612 in the 12 months to February 2024, and,
- Improved forex reserves currently at USD 10.5 bn (equivalent to 4.7-months of import cover), which is above the statutory requirement of maintaining at least 4.0-months of import cover and above the EAC region’s convergence criteria of 4.5-months of import cover.
The shilling is however expected to remain under pressure in 2025 as a result of:
- An ever-present current account deficit which came at 3.1% of GDP in the twelve months to February 2025, and,
- The need for government debt servicing, continues to put pressure on forex reserves given that 62.0% of Kenya’s external debt is US Dollar-denominated as of December2024.
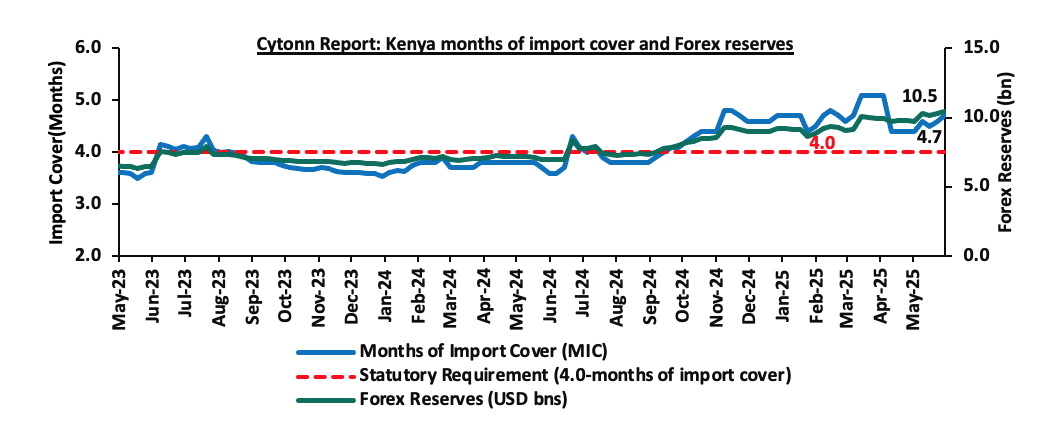
Key to note, Kenya’s forex reserves increased by 6.8% during the month of May 2025, to USD 10.5 bn, from the USD 9.7 bn recorded in the previous month, equivalent to 4.7 months of import cover and above the statutory requirement of maintaining at least 4.0-months of import cover. The increase in forex reserves increased due to strong diaspora remittances, multilateral financial inflows and the stable shilling. Additionally, during the month, the months of import cover increased to 4.7 from 4.4 recorded in the previous month. Additionally, Kenya’s forex reserves increased by 1.5% during the week to USD 10.5 bn from USD 10.3 bn recorded the previous week, equivalent to 4.7 months of import cover, and above the statutory requirement of maintaining at least 4.0-months of import cover.
The chart below summarizes the evolution of Kenya's months of import cover over the years:
Weekly Highlights
- Exchequer Highlight April 2025 Release
The National Treasury gazetted the revenue and net expenditures for the tenth month of FY’2024/2025, ending 30th April 2025. Below is a summary of the performance:
|
FY'2024/2025 Budget Outturn - As at 30th April 2025 |
|||||||
|
Amounts in Kshs Billions unless stated otherwise |
|||||||
|
Item |
12-months Original Estimates |
Revised Estimates I |
Revised Estimates II |
Actual Receipts/Release |
Percentage Achieved of the Revised Estimates II |
Prorated |
% achieved of the Prorated |
|
Opening Balance |
|
|
|
1.2 |
|
|
|
|
Tax Revenue |
2,745.2 |
2,475.1 |
2,400.7 |
1,800.8 |
75.0% |
2,000.6 |
90.0% |
|
Non-Tax Revenue |
172.0 |
156.4 |
180.2 |
138.5 |
76.8% |
150.2 |
92.2% |
|
Total Revenue |
2,917.2 |
2,631.4 |
2,580.9 |
1,940.4 |
75.2% |
2,150.8 |
90.2% |
|
External Loans & Grants |
571.2 |
593.5 |
718.4 |
322.9 |
45.0% |
598.7 |
53.9% |
|
Domestic Borrowings |
828.4 |
978.3 |
1,167.0 |
838.9 |
71.9% |
972.5 |
86.3% |
|
Other Domestic Financing |
4.7 |
4.7 |
8.5 |
4.4 |
52.1% |
7.1 |
62.6% |
|
Total Financing |
1,404.3 |
1,576.5 |
1,894.0 |
1,166.3 |
61.6% |
1,578.3 |
73.9% |
|
Recurrent Exchequer issues |
1,348.4 |
1,307.9 |
1,412.7 |
1,122.5 |
79.5% |
1,177.2 |
95.4% |
|
CFS Exchequer Issues |
2,114.1 |
2,137.8 |
2,289.0 |
1,414.0 |
61.8% |
1,907.5 |
74.1% |
|
Development Expenditure & Net Lending |
458.9 |
351.3 |
354.9 |
190.4 |
53.6% |
295.8 |
64.4% |
|
County Governments + Contingencies |
400.1 |
410.8 |
418.3 |
299.4 |
71.6% |
348.5 |
85.9% |
|
Total Expenditure |
4,321.5 |
4,207.9 |
4,474.9 |
3,026.3 |
67.6% |
3,729.1 |
81.2% |
|
Fiscal Deficit excluding Grants |
1,404.3 |
1,576.5 |
1,894.0 |
1,085.8 |
57.3% |
1,578.3 |
68.8% |
|
Total Borrowing |
1,399.6 |
1,571.8 |
1,885.4 |
1,161.8 |
61.6% |
1,571.2 |
73.9% |
|
Public Debt |
1,910.5 |
1,910.5 |
2,042.1 |
1,254.0 |
61.4% |
1,701.7 |
73.7% |
Amounts in Kshs bn unless stated otherwise
The Key take-outs from the release include;
- Total revenue collected as at the end of April 2025 amounted to Kshs 1,940.4 bn, equivalent to 75.2% of the revised estimates II of Kshs 2,580.9 bn for FY’2024/2025 and is 90.2% of the prorated estimates of Kshs 2,150.8 bn. Cumulatively, tax revenues amounted to Kshs 1,800.8 bn, equivalent to 75.0% of the revised estimates II of Kshs 2,400.7 bn and 90.0% of the prorated estimates of Kshs 2,000.6 bn,
- Total financing amounted to Kshs 1,166.3 bn, equivalent to 61.6% of the revised estimates II of Kshs 1,894.0 bn and is equivalent to 73.9% of the prorated estimates of Kshs 1,578.3 bn. Additionally, domestic borrowing amounted to Kshs 838.9 bn, equivalent to 71.9% of the revised estimates II of Kshs 1,167.0 bn and is 86.3% of the prorated estimates of Kshs 972.5 bn,
- The total expenditure amounted to Kshs 3,026.3 bn, equivalent to 67.6% of the revised estimates II of Kshs 4,474.9 bn, and is 81.2% of the prorated target expenditure estimates of Kshs 3,729.1 bn. Additionally, the net disbursements to recurrent expenditures came in at Kshs 1,122.5 bn, equivalent to 79.5% of the revised estimates II of Kshs 1,412.7 and are equivalent to 95.4% of the prorated estimates of Kshs 1,177.2 bn,
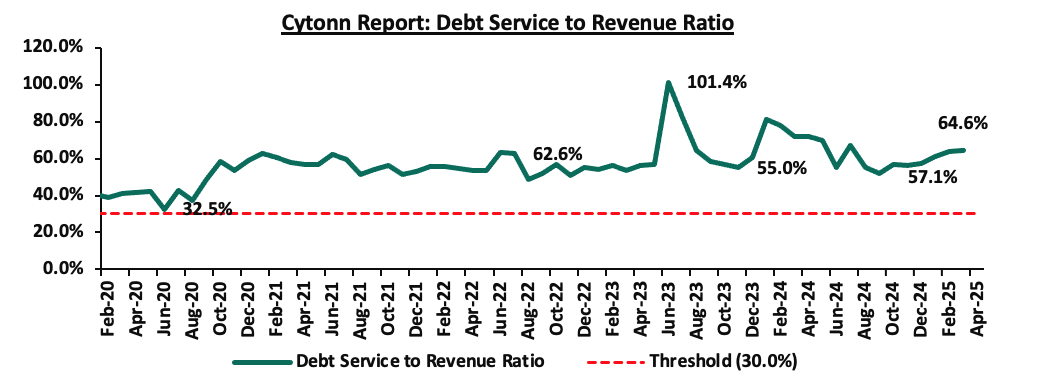
- Consolidated Fund Services (CFS) Exchequer issues came in at Kshs 1,414.0 bn, equivalent to 61.8% of the revised estimates II of Kshs 2,289.0 bn, and are 74.1% of the prorated amount of Kshs 1,907.5 bn. The cumulative public debt servicing cost amounted to Kshs 1,254.0 bn which is 61.4% of the revised estimates II of Kshs 2,042.1 bn, and is 73.7% of the prorated estimates of Kshs 1,701.7 bn. Additionally, the Kshs 1,254.0 bn debt servicing cost is equivalent to 64.6% of the actual cumulative revenues collected as at the end of April 2025. The chart below shows the debt servicing cost to revenue ratio over the period;
- Total Borrowings as at the end of April 2025 amounted to Kshs 1,161.8 bn, equivalent to 61.6% of the revised estimates II of Kshs 1,885.4 bn for FY’2024/2025 and are 73.9% of the prorated estimates of Kshs 1,571.2 bn. The cumulative domestic borrowing of Kshs 1,167.0 bn comprises of Net Domestic Borrowing Kshs 597.2 bn and Internal Debt Redemptions (Rollovers) Kshs 569.9 bn.
The government missed its prorated revenue targets for the tenth consecutive month in FY’2024/2025, however registering a significant performance, achieving 90.2% of the prorated revenue targets in April 2025, signaling an improvement in the business environment. The shortfall is largely due to the challenging business environment experienced in previous months with the Purchasing Managers’ Index (PMI), averaging at 49.2, below the 50.0 neutral mark, in the first half of the FY’2024/2025, exacerbated by high taxes and an elevated cost of living. However, the cost of credit has declined, providing some relief to businesses and households. The improved business environment is reflected in the Purchasing Managers’ Index (PMI), which increased marginally to 52.0 in April from 51.7 in March 2025, and an average of 51.2 in the second half of FY’2024/25 so far. While efforts to enhance revenue collection, such as broadening the tax base, curbing tax evasion, and suspending tax relief payments, are yet to yield full benefits, future revenue performance will depend on how quickly private sector activity gains momentum. This is expected to be supported by a stable Shilling, lower borrowing costs, and continued efforts to enhance economic growth. The reduction in the Central Bank Rate (CBR) by 75 basis points to 10.00% from 10.75%, following the Monetary Policy Committee’s (MPC) meeting on April 8th, 2025, is expected to further ease credit conditions and support private sector expansion.
- Inflation Highlight May 2025
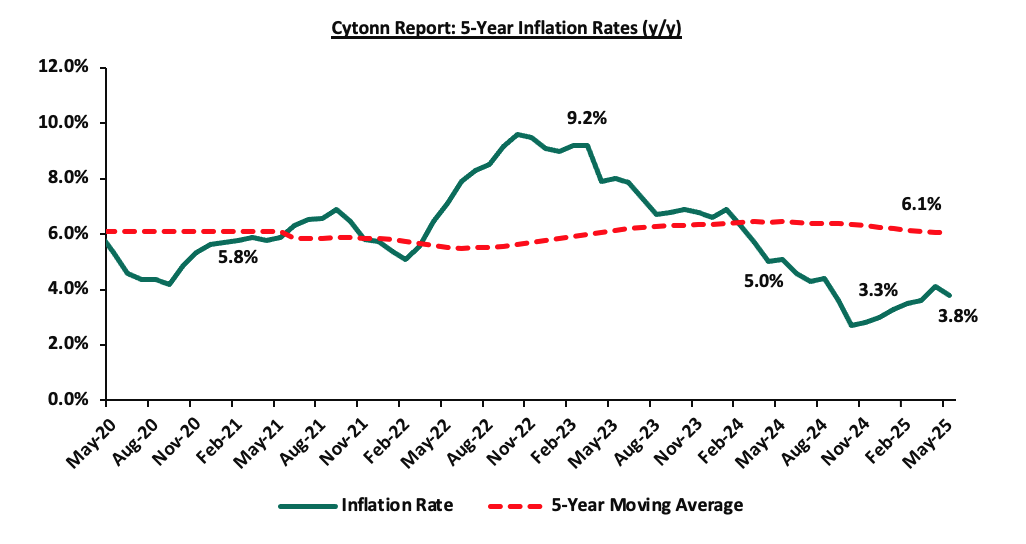
The y/y inflation in May 2025 decreased by 0.3% points to 3.8%, from the 4.1% recorded in April 2025. The headline inflation in May 2025 was majorly driven by increase in prices of commodities in the following categories; Food & Non-Alcoholic Beverages, Transport sector and Housing, water, electricity, gas and other fuels by 6.3%, 2.3% and 0.8% respectively.
|
Cytonn Report: Major Inflation Changes – May 2025 |
|||
|
Broad Commodity Group |
Price change m/m (May-2025/ April -2025) |
Price change y/y (May-2025/May-2024) |
Reason |
|
Food and non-alcoholic beverages |
1.2% |
6.3% |
The m/m increase was mainly driven by the increase in prices of sugar, sifted maize flour and kales by 4.3%, 3.9% and 3.5% respectively. However, the increase was supported by the decrease in prices of commodities such as Irish potatoes, oranges and fresh packeted cow milk by 3.7%, 1.8% and 0.6% respectively. |
|
Transport |
0.2% |
2.3% |
The transport index recorded a slight m/m increase mainly due to an increase in prices of international flights. Prices of Super Petrol and Diesel remained unchanged at Kshs 174.6 and Kshs 164.9 respectively |
|
Housing, water, electricity, gas and other fuels |
0.0% |
0.8% |
The m/m prices remained unchanged mainly driven by a decrease in prices of gas/LPG by 0.5% coupled which was offset by a decrease in prices of 50kWh electricity and 200kWh electricity by 1.0% and 0.9% respectively. |
|
Overall Inflation |
0.5% |
3.8% |
The m/m increase was mainly attributable to the 1.2% increase in food and non-alcoholic beverages. |
Notably, May’s overall headline inflation decreased for the first time in seven months, and remained within the CBK’s preferred range of 2.5%-7.5% for the twenty third consecutive month. The decrease in headline inflation in May 2025 comes amid the maximum allowed price for Super Petrol and Diesel remaining unchanged at Kshs 174.6 and Kshs 164.9 respectively. Despite fuel prices remaining unchanged, prices are still high, resulting in high production costs and high costs of goods and services. Additionally, the reduction in the CBR to 10.00% from 10.75% is likely to increase the money supply through lower borrowing costs, which may cause a gradual rise in inflation rates as the effects of the CBR gradually take hold in the broader economy. The Kenya Shilling also recorded a 7.9 bps appreciation as of 30th May 2025 to 129.2 from the Kshs 129.3 recorded at the end of April and a 5.0 bps year-to-date gain to Kshs 129.2 as of 30th May, 2025, from the Kshs 129.3 recorded at the beginning of the year. This stabilization in the exchange rate and fuel prices is expected to continue anchoring inflationary pressures in the country remaining within the CBK’s preferred range of 2.5%-7.5%. The chart below shows the inflation rates for the past 5 years:
Going forward, we expect inflation to remain within the CBK’s preferred range of 2.5%-7.5%, mainly on the back of a stable currency and stable fuel prices. Additionally, favourable weather conditions will also contribute to stabilizing food prices, further supporting stable inflation rates. The risk, however, lies in the fuel prices which despite their stability, still remain elevated compared to historical levels. Additionally, the cut in the Central Bank Rate is likely to elevate inflationary pressures gradually as consumer spending rises from increased money supply.
Monthly Highlights:
- During the month, Stanbic Bank released its monthly Purchasing Manager's Index (PMI) highlighting that the index for the month of April 2025 increased slightly, coming in at 52.0, up from 51.7 in March 2025, signaling another improvement in business conditions. This marked the seventh consecutive month that index fell above the 50.0 neutral mark. Increased output, new orders and increased sales supported the improvement. For more information, please see our Cytonn Weekly #19/2025
- During the month, the Kenya National Bureau of Statistics (KNBS) released the 2025 Economic Survey Report, highlighting that the Kenyan economy recorded a 4.7% growth in FY’2024, slower than the 5.7% growth recorded in FY’2023. The main contributor to Kenyan GDP remains to be the Agriculture, fishing and forestry sector which grew by 4.6% in FY’2024, lower than the 6.6% expansion recorded in FY’2023. All sectors in FY’2024, except Mining and Quarrying and Construction recorded positive growths, with varying magnitudes across activities. Most sectors recorded declining growth rates compared to FY’2023 with Accommodation and Food Services, Construction and Information and Communication recording the highest declines of 7.9%, 3.7% and 3.3% points, respectively. Other sectors that recorded a contraction in growth rate, from what was recorded in FY’2023 were Professional administration, Mining and Quarrying and Financial and Insurance services of 3.3%, 2.7% and 2.5% points respectively. For more information, please see our Cytonn weekly #19/2025
- During the month, the Kenya National Bureau of Statistics released the FY’2024 Economic Survey noting that, Kenya’s balance of payments position improved significantly by 231.0% in FY’2024, with a surplus of Kshs 176.7 bn, from a deficit of Kshs 134.8 bn in FY’2023. For more information, please see our Cytonn weekly #19/2025
- During the month, The Energy and Petroleum Regulatory Authority (EPRA) released their monthly statement on the maximum retail fuel prices in Kenya, effective from 15th May 2025 to 14th June 2025. Notably, the maximum allowed price for Super Petrol, Diesel and Kerosene remained unchanged at Kshs 174.6, Kshs 164.9 and Kshs 150.0 per litre respectively. For more information, please see our Cytonn weekly #20/2025
Rates in the Fixed Income market have been on a downward trend due to high liquidity in the money market which allowed the government to front load most of its borrowing. The government is 74.1% ahead of its prorated net domestic borrowing target of Kshs 551.2 bn, and 60.7% ahead of the total FY’2024/25 net domestic borrowing target of Kshs 597.2 bn, having a net borrowing position of Kshs 959.5 bn (inclusive of T-bills). However, we expect a stabilization of the yield curve in the short and medium term, with the government looking to increase its external borrowing to maintain the fiscal surplus, hence alleviating pressure in the domestic market. As such, we expect the yield curve to stabilize in the short to medium-term and hence investors are expected to shift towards the long-term papers to lock in the high returns
Market Performance:
During the month of May 2025, the equities market was on an upward trajectory, with NASI gaining the most by 6.4%, while NSE 10, NSE 25 and NSE 20 gained by 4.9%, 3.6% and 2.2% respectively. The equities market positive performance was driven by gains recorded by large-cap stocks such as Safaricom, KCB Bank and Co-operative Bank Kenya of 17.4%, 9.5%, and 7.6% respectively. The monthly performance was however weighed down by losses recorded by large cap stocks such as Stanbic Bank, Standard Chartered Bank and BAT of 12.9%, 10.5% and 6.3% respectively.
During the week, the equities market registered a mixed performance, with NASI gaining by 0.2% while NSE 10, NSE 25 and NSE 20 lost by 1.4%, 1.2% and 0.3% respectively, taking the YTD performance to gains of 7.1%, 6.1%, 2.2% and 1.6% for NASI, NSE 20, NSE 25 and NSE 10 respectively. The week on week equities market performance was driven by gains recorded by large-cap stocks such as NCBA, Safaricom and KCB Bank of 4.8%, 3.5%, and 3.2% respectively. The performance was however weighed down by losses recorded by large-cap stocks such as BAT, Equity Bank and DTB-Kenya of 13.1%, 11.1% and 5.9% respectively;
Additionally, in the regional equities market, the East African Exchanges 20 (EAE 20) share index gained by 0.1% to 100.02 from 99.96 recorded the previous week, attributable to gains recorded by large cap stocks such as Bralirwa Limited, Safaricom and KCB Bank of 9.9%, 3.8% and 3.5% respectively, the performance was weighed down by the losses recorded by large cap stocks such as Equity Bank, Co-operative Bank and Cimerwa Plc of 10.5%, 1.3% and 0.7% respectively.
Equities turnover increased by 19.2% in the month of May 2025 to USD 69.2 mn, from USD 58.0 mn recorded in April 2025. Foreign investors remained net sellers, with a net selling position of USD 1.1 mn, a decrease from a net selling position of USD 6.5 mn recorded in April 2025.
During the week, equities turnover decreased by 3.9% to USD 14.5 mn from USD 15.0 mn recorded the previous week, taking the YTD total turnover to USD 329.9 mn. Foreign investors remained net sellers for the second consecutive week with a net selling position of USD 2.7 mn, from a net selling position of USD 0.02 mn recorded the previous week, taking the YTD foreign net selling position to USD 32.8 mn, compared to a net selling position of USD 16.9 mn recorded in 2024.
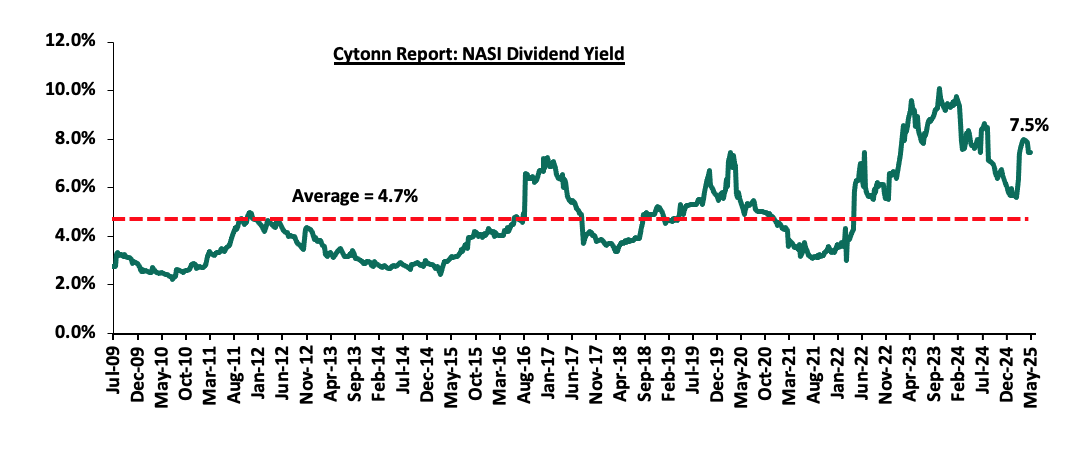
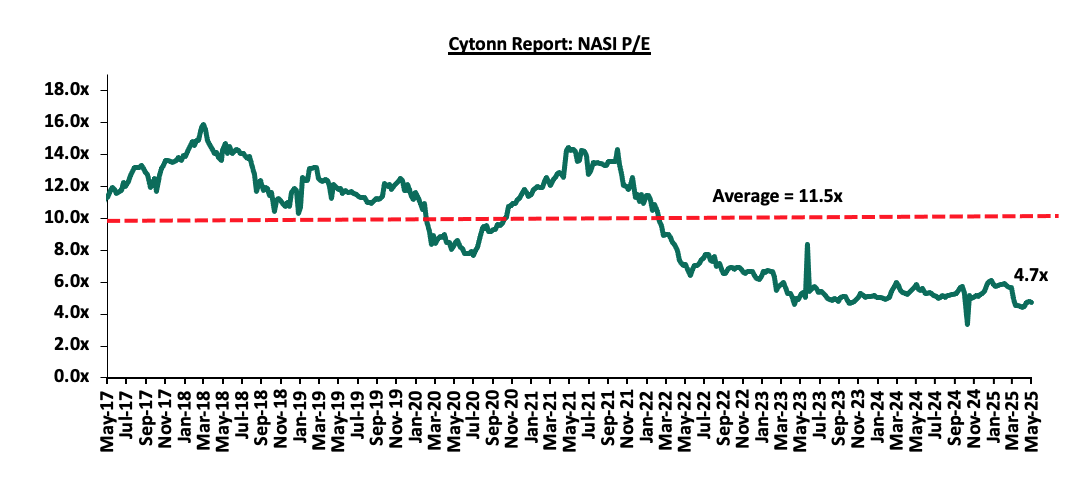
The market is currently trading at a price-to-earnings ratio (P/E) of 4.7x, 58.6% below the historical average of 11.5x. The dividend yield stands at 7.5%, 2.8% points above the historical average of 4.7%. Key to note, NASI’s PEG ratio currently stands at 0.6x, an indication that the market is undervalued relative to its future growth. A PEG ratio greater than 1.0x indicates the market is overvalued while a PEG ratio less than 1.0x indicates that the market is undervalued. The charts below indicate the historical P/E and dividend yields of the market;
Universe of Coverage:
|
|
Cytonn Report: Equities Universe of Coverage |
|||||||||||
|
Company |
Price as at 23/05/2026 |
Price as at 30/05/2025 |
w/w change |
m/m change |
YTD Change |
Year Open 2025 |
Target Price* |
Dividend Yield |
Upside/ Downside** |
P/TBv Multiple |
Recommendation |
|
|
Standard Chartered Bank |
269.3 |
268.5 |
(0.3%) |
(10.5%) |
(5.9%) |
285.3 |
328.8 |
16.8% |
39.2% |
1.5x |
Buy |
|
|
Stanbic Holdings |
148.8 |
152.8 |
2.7% |
(12.5%) |
9.3% |
139.8 |
185.3 |
13.6% |
34.9% |
0.9x |
Buy |
|
|
Equity Group |
48.5 |
43.1 |
(11.1%) |
(5.8%) |
(10.3%) |
48.0 |
52.8 |
9.9% |
32.5% |
0.7x |
Buy |
|
|
Diamond Trust Bank |
76.5 |
72.0 |
(5.9%) |
(3.0%) |
7.9% |
66.8 |
87.1 |
9.7% |
30.7% |
0.3x |
Buy |
|
|
Co-op Bank |
15.7 |
15.5 |
(1.3%) |
7.6% |
(11.2%) |
17.5 |
18.6 |
9.7% |
29.8% |
0.5x |
Buy |
|
|
KCB Group |
40.8 |
42.1 |
3.2% |
9.5% |
(0.7%) |
42.4 |
50.7 |
7.1% |
27.6% |
0.5x |
Buy |
|
|
ABSA Bank |
17.8 |
18.3 |
3.1% |
0.8% |
(2.9%) |
18.9 |
21.0 |
9.6% |
24.3% |
1.2x |
Buy |
|
|
Jubilee Holdings |
224.8 |
227.0 |
1.0% |
13.5% |
29.9% |
174.8 |
260.7 |
5.9% |
20.8% |
0.3x |
Buy |
|
|
NCBA |
52.0 |
54.5 |
4.8% |
0.9% |
6.9% |
51.0 |
60.2 |
10.1% |
20.6% |
0.9x |
Buy |
|
|
CIC Group |
2.7 |
2.7 |
0.4% |
(7.2%) |
26.6% |
2.1 |
3.1 |
4.8% |
19.2% |
0.7x |
Accumulate |
|
|
I&M Group |
34.5 |
34.0 |
(1.4%) |
13.0% |
(5.6%) |
36.0 |
36.8 |
8.8% |
17.1% |
0.6x |
Accumulate |
|
|
Britam |
7.3 |
6.7 |
(8.5%) |
(0.9%) |
15.1% |
5.8 |
7.5 |
0.0% |
11.9% |
0.6x |
Accumulate |
|
|
|
*Target Price as per Cytonn Analyst estimates **Upside/ (Downside) is adjusted for Dividend Yield ***Dividend Yield is calculated using FY’2024 Dividends |
|||||||||||
Weekly Highlights
- Sanlam Announces Rights Issue Results
During the week, Sanlam released the results of its earlier approved rights issue, announcing that the rights were fully subscribed including underwriting with a total subscription rate of 81.5% before underwriting, having received offers worth Ksh 2.0 bn against the offered Ksh 2.5 bn. Sanlam Allianz Africa Proprietary Limited, acquired an extra 92.3 million shares at a cost of Kshs 461.5 mn in its role as the underwriter (buyer of last resort) in the rights issue. Notably, the Group accepted 402.6 million shares under the entitlement option against the offered 500.0 million, translating to an acceptance rate of 80.5%
The rights issue offered a total of 500,000,000 new shares at an offer price of Ksh 5.0 per share. The entitlement ratio was 125 shares for every 36 ordinary shares held, with a minimum success rate of 50.0%. If fully subscribed, the rights issue was expected to raise gross proceeds of Ksh 2.5 bn.
The results revealed that a total of 402,623,246 shares were accepted under entitlement, representing a take-up rate of 80.5%, with a total value of Ksh 2.0 bn. Additionally, 5,062,718 shares were applied for under additional shares, valued at Kshs 25.3 mn. Despite the strong take-up, there remained 92,314,036 untaken shares, equivalent to 18.5% of the offer. In line with a pre-arranged underwriting agreement dated 3 April 2025 with Sanlam Allianz Africa Proprietary Limited (SAZ), these remaining shares were fully subscribed by the underwriter. This intervention ensured the company met its funding target, bringing the total gross proceeds of the Rights Issue to Kshs 2.5 bn, and raising the final subscription performance rate to 100.0%. The table below summarizes the rights issue results statistics;
|
Cytonn Report: Sanlam Rights Issue Results Summary |
|
|
Data |
Statistic |
|
Total number of new shares accepted under entitlement |
402,623,246 |
|
Total value of new shares accepted under entitlement |
Kshs 2,013,116,230 |
|
Take up percentage under entitlement |
80.5% |
|
Total number of additional new shares applied for under additional shares |
5,062,718 |
|
Total value of additional new shares applied for under additional shares |
Kshs 25,313,590 |
|
Grand total number of new shares applied for under the rights issue (entitlement shares + additional shares) |
407,685,964 |
|
Grand total value of new shares applied for under the rights issue (Entitlement shares + additional shares) |
Ksh 2,038,429,820 |
|
Total Subscription Rate before Underwriting (%) |
81.5% |
|
Total Number of Untaken Shares accepted under the Underwriting Agreement |
92,314,036 |
|
Total Value of Untaken Shares accepted under the Underwriting Agreement |
Kshs 461,570,180 |
|
Total Subscription Performance Rate including Underwriting |
100.0% |
Source: Sanlam
The proceeds from the rights issue will be directed towards several key areas aligned with Sanlam Kenya’s long-term strategy. Primarily, the Group aims to use this capital to reduce its long-term debt levels and support its return to profitability. Before the rights issue, Sanlam Kenya’s debt to equity ratio was significantly high, being the highest among peer insurance companies. Post-rights issue, Sanlam Kenya’s debt to equity will reduce by 56.5% to 7.9 from 19.4 attributable to the decline in its debt level. The table below shows the debt to equity ratio before and after the rights issue;
|
Sanlam Kenya's Leverage Ratio |
Before the rights issue |
After the rights issue |
Change (% points) |
|
Debt to Equity ratio |
19.4 |
7.9 |
(56.5%) |
Compared to peer insurance companies in Kenya, Sanlam Kenya will have a more balanced leverage position following the rights issue. The tables above illustrate Sanlam Kenya’s debt-to-equity ratios relative to its peers;
|
Cytonn Report: Listed Insurance Companies Debt to Equity ratios (FY’2024) |
|
|
Insurance Company |
Debt to Equity Ratio |
|
Kenya Re Insurance Corporation Ltd |
0.3 |
|
Jubilee Holdings Ltd |
3.2 |
|
Liberty Kenya Holdings Plc |
3.5 |
|
CIC Insurance Group Plc |
4.6 |
|
Britam Holdings Plc |
6.1 |
|
Sanlam Kenya Plc * |
19.4 |
|
Sanlam Kenya Plc ** |
7.9 |
*Before the rights issue
**After the rights issue
Going forward, it is our expectation that Sanlam Kenya’s success will hinge on its ability to effectively deploy the new capital to fuel growth and reduce its debt levels. In addition, the Group’s strategy of strengthening its capital and investments through divesting from real estate, restructuring its debt portfolio and closing dormant subsidiaries has proven to be effective. Following a return to profitability in 2024, with a significant 933.5% increase in Profit After Tax to Kshs 1.1 bn, from the Kshs 0.1 bn loss recorded in FY’2023 and the rights issue, shareholders will be watching closely for improved performance and increased market share in Kenya’s insurance sector
Earnings Release
- Equity Group’s Q1’2025 Financial Performance
Below is a summary of Equity Group’s Q1’2025 performance:
|
Balance Sheet Items |
Q1'2024 |
Q1'2025 |
y/y change |
|
Government Securities |
250.9 |
329.0 |
31.2% |
|
Net Loans and Advances |
779.2 |
804.7 |
3.3% |
|
Total Assets |
1685.9 |
1749.2 |
3.8% |
|
Customer Deposits |
1236.3 |
1322.8 |
7.0% |
|
Deposits/Branch |
3.5 |
3.3 |
(4.0%) |
|
Total Liabilities |
1467.1 |
1484.5 |
1.2% |
|
Shareholders’ Funds |
210.9 |
251.3 |
19.2% |
|
Balance Sheet Ratios |
Q1'2024 |
Q1'2025 |
% y/y change |
|
Loan to Deposit Ratio |
63.0% |
60.8% |
(2.2%) |
|
Government Securities to Deposit Ratio |
32.2% |
40.9% |
8.7% |
|
Return on average equity |
23.8% |
20.8% |
(3.0%) |
|
Return on average assets |
2.9% |
2.8% |
(0.1%) |
|
Income Statement (Kshs Bn) |
Q1'2024 |
Q1'2025 |
y/y change |
|
Net Interest Income |
27.8 |
28.6 |
2.6% |
|
Net non-Interest Income |
22.2 |
19.6 |
(11.8%) |
|
Total Operating income |
50.1 |
48.2 |
(3.8%) |
|
Loan Loss provision |
(6.1) |
(3.4) |
(44.4%) |
|
Total Operating expenses |
(29.7) |
(29.5) |
(0.6%) |
|
Profit before tax |
20.4 |
18.7 |
(8.5%) |
|
Profit after tax |
16.0 |
15.3 |
(4.2%) |
|
Core EPS |
4.1 |
3.9 |
(3.9%) |
|
Income Statement Ratios |
Q1'2024 |
Q1'2025 |
y/y change |
|
Yield from interest-earning assets |
12.4% |
11.5% |
(0.9%) |
|
Cost of funding |
4.2% |
4.3% |
0.1% |
|
Cost of risk |
12.1% |
7.0% |
(5.1%) |
|
Net Interest Margin |
8.2% |
7.4% |
(0.8%) |
|
Net Interest Income as % of operating income |
55.6% |
59.3% |
3.7% |
|
Non-Funded Income as a % of operating income |
44.4% |
40.7% |
(3.7%) |
|
Cost to Income Ratio |
59.2% |
61.2% |
2.0% |
|
CIR without LLP |
47.1% |
54.2% |
7.1% |
|
Cost to Assets |
1.5% |
1.5% |
0.1% |
|
Capital Adequacy Ratios |
Q1'2024 |
Q1'2025 |
% points change |
|
Core Capital/Total Liabilities |
17.1% |
18.2% |
1.1% |
|
Minimum Statutory ratio |
8.0% |
8.0% |
0.0% |
|
Excess |
9.1% |
10.2% |
1.1% |
|
Core Capital/Total Risk Weighted Assets |
15.9% |
16.5% |
0.6% |
|
Minimum Statutory ratio |
10.5% |
10.5% |
0.0% |
|
Excess |
5.4% |
6.0% |
0.6% |
|
Total Capital/Total Risk Weighted Assets |
19.3% |
18.3% |
(1.0%) |
|
Minimum Statutory ratio |
14.5% |
14.5% |
0.0% |
|
Excess |
4.8% |
3.8% |
(1.0%) |
|
Liquidity Ratio |
52.1% |
58.5% |
6.4% |
|
Minimum Statutory ratio |
20.0% |
20.0% |
0.0% |
|
Excess |
32.1% |
38.5% |
6.4% |
Key Take-Outs:
- Decreased earnings - Core earnings per declined by 3.9% to Kshs 3.9, from Kshs 4.1 in Q1’2024, driven by the 3.8% decrease in total operating income to Kshs 48.2 bn, from Kshs 50.1 bn in Q1’2024, which outpaced the 0.6% decrease in total operating expenses to Kshs 29.5 bn from Kshs 29.7 bn in Q1’2024,
- Deteriorated asset quality – The bank’s Asset Quality deteriorated, with Gross NPL increasing to 15.0% in Q1’2025, from 14.2% in Q1’2024, attributable to a 10.3% increase in Gross non-performing loans to Kshs 132.8 bn, from Kshs 120.4 bn in Q1’2024, relative to the 4.2% increase in gross loans to Kshs 885.1 bn, from Kshs 849.4 bn recorded in Q1’2024,
- Expanded Balanced sheet - The balance sheet recorded an expansion as total assets increased by 8% to Kshs 1,749.2 bn, from Kshs 1,685.9 bn in Q1’2024, mainly driven by a 31.2% increase in government securities holdings to Kshs 329.0 bn, from 250.9 bn in Q1’2024, coupled with a 3.3% increase in net loans and advances to Kshs 804.7 bn, from Kshs 779.2 bn in Q1’2024,
- Increased lending- Customer net loans and advances increased by 3.3% to Kshs 804.7 bn, from Kshs 779.2 bn in Q1’2024.
For a more detailed analysis, please see the Equity Group’s Q1’2025 Earnings Note
- Absa Bank’s Q1’2025 Financial Performance
Below is a summary of Absa Bank Kenya Plc Q1’2025 performance:
|
Balance Sheet Items |
Q1’2024 (Kshs bn) |
Q1’2025 (Kshs bn) |
y/y change |
|
Government Securities |
85.7 |
144.0 |
68.0% |
|
Net Loans and Advances |
326.8 |
308.4 |
(5.6%) |
|
Total Assets |
497.7 |
520.2 |
4.5% |
|
Customer Deposits |
355.0 |
371.2 |
4.6% |
|
Deposit per Branch |
4.7 |
4.4 |
(6.5%) |
|
Total Liabilities |
422.7 |
427.7 |
1.2% |
|
Shareholder's Funds |
69.2 |
92.5 |
33.7% |
|
Balance Sheet Ratios |
Q1’2024 |
Q1’2025 |
% points change |
|
Loan to Deposit Ratio |
92.1% |
83.1% |
(9.0%) |
|
Govt Securities to Deposit ratio |
24.2% |
38.8% |
14.7% |
|
Return on average equity |
25.0% |
25.2% |
0.2% |
|
Return on average assets |
3.5% |
4.1% |
0.6% |
|
Income Statement |
Q1’2024 (Kshs bn) |
Q1’2025 (Kshs bn) |
y/y change |
|
Net Interest Income |
11.4 |
11.3 |
(1.1%) |
|
Net non-Interest Income |
5.1 |
4.5 |
(11.1%) |
|
Total Operating income |
16.5 |
15.8 |
(4.2%) |
|
Loan Loss provision |
(2.4) |
(1.5) |
(39.0%) |
|
Total Operating expenses |
(8.0) |
(7.0) |
(12.5%) |
|
Profit before tax |
8.5 |
8.8 |
3.6% |
|
Profit after tax |
5.9 |
6.2 |
3.7% |
|
Core EPS (Kshs) |
1.1 |
1.1 |
3.7% |
|
Income Statement Ratios |
Q1’2024 |
Q1’2025 |
% points change |
|
Yield from interest-earning assets |
13.0% |
13.9% |
0.8% |
|
Cost of funding |
4.5% |
4.4% |
(0.2%) |
|
Net Interest Spread |
1.2% |
0.9% |
(0.3%) |
|
Net Interest Margin |
9.4% |
10.1% |
0.7% |
|
Cost of Risk |
14.6% |
9.3% |
(5.3%) |
|
Net Interest Income as % of operating income |
69.2% |
71.4% |
2.2% |
|
Non-Funded Income as a % of operating income |
30.8% |
28.6% |
(2.2%) |
|
Cost to Income |
48.5% |
44.3% |
(4.2%) |
|
Cost to Income (Without LLPs) |
33.9% |
35.0% |
1.1% |
|
Capital Adequacy Ratios |
Q1’2024 |
Q1’2025 |
% points change |
|
Core Capital/Total Liabilities |
18.0% |
20.5% |
2.5% |
|
Minimum Statutory ratio |
8.0% |
8.0% |
0.0% |
|
Excess |
10.0% |
12.5% |
2.5% |
|
Core Capital/Total Risk Weighted Assets |
14.2% |
17.3% |
3.1% |
|
Minimum Statutory ratio |
10.5% |
10.5% |
0.0% |
|
Excess |
3.7% |
6.8% |
3.1% |
|
Total Capital/Total Risk Weighted Assets |
17.9% |
20.4% |
2.5% |
|
Minimum Statutory ratio |
14.5% |
14.5% |
0.0% |
|
Excess |
3.4% |
5.9% |
2.5% |
|
Liquidity Ratio |
33.5% |
46.9% |
13.4% |
|
Minimum Statutory ratio |
20.0% |
20.0% |
0.0% |
|
Excess |
13.5% |
26.9% |
13.4% |
Key Take-Outs:
- Decreased earnings - Core earnings per share increased by 3.7% to Kshs 1.14, from Kshs 1.09 in Q1’2024, mainly driven by the 12.5% decrease in total operating expenses to Kshs 7.0 bn, from Kshs 8.0 bn in Q1’2024 which outpaced the 4.2% decrease in total operating income to Kshs 15.8 bn, from Kshs 16.5 bn in Q1’2024,
- Declined asset quality – The bank’s Asset Quality deteriorated, with Gross NPL ratio increasing to 13.1% in Q1’2025, from 11.1% in Q1’2024, attributable to the 13.4% increase in gross non-performing loans to Kshs 44.0 bn, from Kshs 38.8 bn in Q1’2024, relative to the 4.0% decrease in gross loans to Kshs 337.1 bn, from Kshs 351.0 bn recorded in Q1’2024
- Decreased Lending – The bank’s loan book recorded a contraction of 5.6% to Kshs 308.4 bn, from Kshs 326.8 bn in Q1’2024.
For a more detailed analysis, please see the Absa Banks’s Q1’2025 Earnings Note
- I&M Group’s Q1’2025 Financial Performance
Below is a summary of I&M Group’s Q1’2025 performance:
|
Balance Sheet Items |
Q1'2024 |
Q1'2025 |
y/y change |
|
Government Securities |
73.3 |
103.1 |
40.5% |
|
Net Loans and Advances |
291.5 |
293.7 |
0.7% |
|
Total Assets |
533.0 |
568.4 |
6.7% |
|
Customer Deposits |
383.9 |
407.0 |
6.0% |
|
Deposits/Branch |
4.1 |
3.8 |
(6.8%) |
|
Total Liabilities |
439.3 |
461.5 |
5.0% |
|
Shareholders’ Funds |
87.2 |
99.9 |
14.5% |
|
Balance Sheet Ratios |
Q1'2024 |
Q1'2025 |
% y/y change |
|
Loan to Deposit Ratio |
75.9% |
72.1% |
(3.8%) |
|
Government Securities to Deposit Ratio |
19.1% |
25.3% |
6.2% |
|
Return on average equity |
16.0% |
18.5% |
2.4% |
|
Return on average assets |
2.8% |
3.1% |
0.3% |
|
Income Statement (Kshs Bn) |
Q1'2024 |
Q1'2025 |
y/y change |
|
Net Interest Income |
8.4 |
9.4 |
11.8% |
|
Net non-Interest Income |
3.2 |
3.6 |
13.7% |
|
Total Operating income |
11.5 |
13.0 |
12.3% |
|
Loan Loss provision |
(1.5) |
(1.6) |
4.0% |
|
Total Operating expenses |
(6.6) |
(7.3) |
9.8% |
|
Profit before tax |
5.1 |
5.9 |
15.5% |
|
Profit after tax |
3.6 |
4.2 |
17.3% |
|
Core EPS |
2.0 |
2.4 |
17.9% |
|
Income Statement Ratios |
Q1'2024 |
Q1'2025 |
% pointschange |
|
Yield from interest-earning assets |
13.9% |
14.4% |
0.5% |
|
Cost of funding |
6.3% |
6.8% |
0.5% |
|
Net Interest Margin |
7.7% |
8.2% |
0.5% |
|
Net Interest Income as % of operating income |
72.6% |
72.3% |
(0.3%) |
|
Non-Funded Income as a % of operating income |
27.4% |
27.7% |
0.3% |
|
Cost to Income Ratio |
57.5% |
56.2% |
(1.3%) |
|
Cost to Income Ratio without LLP |
44.2% |
43.9% |
(0.3%) |
|
Cost to Assets |
0.96% |
1.00% |
0.04% |
|
Capital Adequacy Ratios |
Q1'2024 |
Q1'2025 |
% points change |
|
Core Capital/Total Liabilities |
19.9% |
21.0% |
1.1% |
|
Minimum Statutory ratio |
8.0% |
8.0% |
0.0% |
|
Excess |
11.9% |
13.0% |
1.1% |
|
Core Capital/Total Risk Weighted Assets |
14.6% |
16.3% |
1.7% |
|
Minimum Statutory ratio |
10.5% |
10.5% |
0.0% |
|
Excess |
4.1% |
5.8% |
1.7% |
|
Total Capital/Total Risk Weighted Assets |
17.9% |
18.8% |
1.0% |
|
Minimum Statutory ratio |
14.5% |
14.5% |
0.0% |
|
Excess |
3.4% |
4.3% |
1.0% |
|
Liquidity Ratio |
44.2% |
50.4% |
6.2% |
|
Minimum Statutory ratio |
20.0% |
20.0% |
0.0% |
|
Excess |
24.2% |
30.4% |
6.2% |
Key Take-Outs:
- Increased earnings - Core earnings per share (EPS) grew by 17.9% to Kshs 2.4, from Kshs 2.0 in Q1’2024, driven by the 12.3% increase in total operating income to Kshs 13.0 bn, from Kshs 11.5 bn in Q1’2024, which outpaced the 9.8% increase in total operating expenses to Kshs 7.3 bn from Kshs 6.6 bn in Q1’2024,
- Deteriorated asset quality –The bank’s Asset Quality deteriorated, with Gross NPL increasing to 10.9% in Q1’2025, from 10.8% in Q1’2024, attributable to a 2.2% increase in Gross non-performing loans to Kshs 34.5 bn, from Kshs 33.7 bn in Q1’2024, which outpaced the 1.4% increase in gross loans to Kshs 315.6 bn, from Kshs 311.1 bn recorded in Q1’2024,
- Expanded Balanced sheet - The balance sheet recorded an expansion as total assets increased by 7% to Kshs 568.4 bn, from Kshs 533.0 bn in Q1’2024, mainly driven by a 40.5% increase in governments securities holdings to Kshs 103.1 bn, from 73.3 bn in Q1’2024, coupled with a 0.7% increase in net loans and advances to Kshs 293.7 bn, from Kshs 291.5 bn in Q1’2024,
- Increased lending- Customer net loans and advances increased by 0.7% to Kshs 293.7 bn, from Kshs 291.5 bn in Q1’2024.
For a more detailed analysis, please see the I&M Group’s Q1’2025 Earnings Note
- DTB Bank’s Q1’2025 Financial Performance
Below is a summary of DTB-K Bank’s Q1’2025 performance:
|
Balance Sheet Items |
Q1'2024 |
Q1'2025 |
y/y change |
|
Government Securities |
115.4 |
136.9 |
18.6% |
|
Net Loans and Advances |
268.9 |
284.3 |
5.7% |
|
Total Assets |
571.9 |
595.1 |
4.1% |
|
Customer Deposits |
425.2 |
463.6 |
9.0% |
|
Deposits/ Branch |
2.8 |
2.9 |
4.9% |
|
Total Liabilities |
490.5 |
497.4 |
1.4% |
|
Shareholders’ Funds |
71.9 |
86.9 |
20.9% |
|
Balance Sheet Ratios |
Q1'2024 |
Q1'2025 |
y/y change |
|
Loan to Deposit Ratio |
63.3% |
61.3% |
(1.9%) |
|
Government Securities to Deposit ratio |
27.1% |
29.5% |
2.4% |
|
Return on average equity |
11.2% |
11.5% |
0.3% |
|
Return on average assets |
1.4% |
1.6% |
0.1% |
|
Income Statement |
Q1'2024 |
Q1'2025 |
y/y change |
|
Net Interest Income |
7.1 |
7.7 |
8.0% |
|
Net non-Interest Income |
3.7 |
3.0 |
(18.5%) |
|
Total Operating income |
10.8 |
10.7 |
(1.1%) |
|
Loan Loss provision |
1.5 |
0.9 |
(42.6%) |
|
Other Operating expenses |
3.0 |
3.0 |
0.2% |
|
Total Operating expenses |
6.8 |
6.6 |
(2.9%) |
|
Profit before tax |
4.0 |
4.1 |
1.7% |
|
Profit after tax |
2.9 |
3.2 |
9.9% |
|
Core EPS |
9.4 |
11.5 |
23.0% |
|
Income Statement Ratios |
Q1'2024 |
Q1'2025 |
% points change |
|
Yield from interest-earning assets |
11.4% |
12.0% |
0.6% |
|
Cost of funding |
6.0% |
6.5% |
0.5% |
|
Net Interest Spread |
5.4% |
5.5% |
0.1% |
|
Net Interest Income as % of operating income |
65.7% |
71.7% |
6.0% |
|
Non-Funded Income as a % of operating income |
34.3% |
28.3% |
(6.0%) |
|
Cost to Income Ratio (CIR) |
63.1% |
62.0% |
(1.1%) |
|
CIR without provisions |
48.8% |
53.7% |
4.9% |
|
Cost to Assets |
5.7% |
5.1% |
(0.5%) |
|
Net Interest Margin |
5.7% |
5.8% |
0.1% |
|
Capital Adequacy Ratios |
Q1'2024 |
Q1'2025 |
% Points Change |
|
Core Capital/Total Liabilities |
18.6% |
16.6% |
(2.0%) |
|
Minimum Statutory ratio |
8.0% |
8.0% |
|
|
Excess |
10.6% |
8.6% |
(2.0%) |
|
Core Capital/Total Risk Weighted Assets |
17.4% |
15.4% |
(2.0%) |
|
Minimum Statutory ratio |
10.5% |
10.5% |
|
|
Excess |
6.9% |
4.9% |
(2.0%) |
|
Total Capital/Total Risk Weighted Assets |
18.2% |
17.0% |
(1.2%) |
|
Minimum Statutory ratio |
14.5% |
14.5% |
|
|
Excess |
3.7% |
2.5% |
(1.2%) |
|
Liquidity Ratio |
50.5% |
54.6% |
4.1% |
|
Minimum Statutory ratio |
20.0% |
20.0% |
|
|
Excess |
30.5% |
34.6% |
4.1% |
Key Take-Outs:
- Increased earnings - Core earnings per share (EPS) grew by 0% to Kshs 11.5, from Kshs 9.5 in Q1’2024, driven by the 2.9% decrease in total operating expense to Kshs 6.6 bn, from Kshs 6.8 bn in Q1’2024, which outpaced the 1.1% decrease in total operating income to Kshs 10.7 bn from Kshs 10.8 bn in Q1’2024,
- Improved asset quality –The bank’s Asset Quality improved, with Gross NPL ratio decreasing to 13.2% in Q1’2025, from 14.9% in Q1’2024, attributable to a 7.7% decrease in Gross non-performing loans to Kshs 39.7 bn, from Kshs 43.0 bn in Q1’2024, coupled with the 4.2% increase in gross loans to Kshs 300.1 bn, from Kshs 287.9 bn recorded in Q1’2024,
- Expanded Balanced sheet - The balance sheet recorded an expansion as total assets increased by 4.1% to Kshs 595.1 bn, from Kshs 571.9 bn in Q1’2024, driven by a 5.7% increase in net loans and advances to Kshs 284.3 bn, from 268.9 bn in Q1’2024,
- Increased lending- Customer net loans and advances increased by 5.7% to Kshs 284.3 bn in Q1’2025, from Kshs 268.9 bn in Q1’2024 despite the increased credit risk with high NPLs in the industry, with the lender preferring to increase customer lending.
For a more detailed analysis, please see the DTB-K Banks’s Q1’2025 Earnings Note
- HF Group’s Q1’2025 Financial Performance
Below is a summary of HF Group’s Q1’2025 performance:
|
Balance Sheet Items |
Q1'2024 |
Q1'2025 |
y/y change |
|
Government Securities |
38.1 |
38.9 |
2.0% |
|
Net Loans and Advances |
10.1 |
20.4 |
102.2% |
|
Total Assets |
62.3 |
73.4 |
17.9% |
|
Customer Deposits |
43.8 |
50.1 |
14.5% |
|
Deposits/Branch |
2.0 |
2.3 |
14.5% |
|
Total Liabilities |
53.3 |
57.2 |
7.4% |
|
Shareholders’ Funds |
9.0 |
16.2 |
79.6% |
|
Balance Sheet Ratios |
Q1'2024 |
Q1'2025 |
% y/y change |
|
Loan to Deposit Ratio |
87.1% |
77.6% |
(9.6%) |
|
Government Securities to Deposit Ratio |
23.1% |
40.7% |
17.7% |
|
Return on average equity |
5.1% |
5.6% |
0.5% |
|
Return on average assets |
0.8% |
1.0% |
0.3% |
|
Income Statement (Kshs Bn) |
Q1'2024 |
Q1'2025 |
y/y change |
|
Net Interest Income |
0.7 |
1.0 |
46.1% |
|
Net non-Interest Income |
0.39 |
0.42 |
9.9% |
|
Total Operating income |
1.1 |
1.4 |
33.0% |
|
Loan Loss provision |
(0.1) |
(0.1) |
(7.9%) |
|
Total Operating expenses |
(0.9) |
(1.1) |
19.1% |
|
Profit before tax |
0.2 |
0.3 |
112.1% |
|
Profit after tax |
0.2 |
0.3 |
118.1% |
|
Core EPS |
1.3 |
0.1 |
(89.3%) |
|
Income Statement Ratios |
Q1'2024 |
Q1'2025 |
y/y change |
|
Yield from interest-earning assets |
11.4% |
12.2% |
0.8% |
|
Cost of funding |
6.1% |
7.1% |
1.0% |
|
Net Interest Spread |
5.3% |
5.1% |
(0.3%) |
|
Net Interest Margin |
5.4% |
5.4% |
0.1% |
|
Cost of Risk |
10.3% |
7.1% |
(3.2%) |
|
Net Interest Income as % of operating income |
63.7% |
70.0% |
6.3% |
|
Non-Funded Income as a % of operating income |
36.3% |
30.0% |
(6.3%) |
|
Cost to Income Ratio |
85.1% |
76.2% |
(8.9%) |
|
Cost to Income Ratio (without LLP) |
74.8% |
69.1% |
(5.7%) |
|
Capital Adequacy Ratios |
Q1'2024 |
Q1'2025 |
% points change |
|
Core Capital/Total Liabilities |
4.5% |
17.6% |
13.1% |
|
Minimum Statutory ratio |
8.0% |
8.0% |
0.0% |
|
Excess |
(3.5%) |
9.6% |
13.1% |
|
Core Capital/Total Risk Weighted Assets |
5.2% |
21.3% |
16.1% |
|
Minimum Statutory ratio |
10.5% |
10.5% |
0.0% |
|
Excess |
(5.3%) |
10.8% |
16.1% |
|
Total Capital/Total Risk Weighted Assets |
8.8% |
24.3% |
15.5% |
|
Minimum Statutory ratio |
14.5% |
14.5% |
0.0% |
|
Excess |
(5.7%) |
9.8% |
15.5% |
|
Liquidity Ratio |
24.9% |
45.1% |
20.2% |
|
Minimum Statutory ratio |
20.0% |
20.0% |
0.0% |
|
Excess |
4.9% |
25.1% |
20.2% |
Key Take-Outs:
- Decreased earnings - Core earnings per share declined by 89.3% to Kshs 0.1, from Kshs 1.3 in Q1’2024, mainly driven by a 33.0% increase in Total Operating Income to Kshs 1.4 bn from Kshs 1.1 bn in Q1’2024, which outpaced a 19.1% increase in total operating expenses to Kshs 1.1 bn from Kshs 0.9 bn in Q1’2024,
- Deteriorated asset quality – The bank’s Asset Quality deteriorated, with Gross NPL ratio increasing to 25.2% in Q1’2024, from 24.1% in Q1’2024, attributable to a 6.8% increase in Gross non-performing loans to Kshs 12.0 bn, from Kshs 11.2 bn in Q1’2024, which outpaced the 2.2% decrease in gross loans to Kshs 47.5 bn, from Kshs 46.5 bn recorded in Q1’2024,
- Expanded Balanced sheet - The balance sheet recorded an expansion as total assets increased by 9% to Kshs 73.4 bn, from Kshs 62.3 bn in Q1’2024, mainly driven by a 102.2% increase in governments securities holdings to Kshs 20.4 bn, from 10.1 bn in Q1’2024, coupled with a 2.0% increase in net loans and advances to Kshs 38.9 bn, from Kshs 38.1 bn in Q1’2024,
- Increased lending- Customer net loans and advances increased by 2.0% to Kshs 38.9 bn in Q1’2025, from Kshs 38.1 bn in Q1’2024.
For a more detailed analysis, please see the HF Group’s Q1’2025 Earnings Note
Asset Quality:
The table below shows the asset quality of listed banks that have released their Q1’2025 results using NPL ratio and NPL coverage:
|
Cytonn Report: Listed Banks Asset Quality in Q1’2025 |
||||||
|
|
Q1'2025 NPL Ratio* |
Q1'2024 NPL Ratio** |
% point change in NPL Ratio |
Q1'2025 NPL Coverage* |
Q1'2024 NPL Coverage** |
% point change in NPL Coverage |
|
Stanbic Holdings |
8.7% |
8.9% |
(0.2%) |
80.8% |
72.3% |
8.5% |
|
Cooperative Bank |
17.1% |
15.9% |
1.2% |
64.2% |
58.6% |
5.6% |
|
Standard Chartered Bank |
8.3% |
9.9% |
(1.6%) |
78.7% |
83.7% |
(5.0%) |
|
KCB Group |
19.9% |
17.9% |
2.0% |
67.0% |
62.0% |
5.0% |
|
NCBA Group |
12.2% |
11.7% |
0.5% |
63.0% |
55.7% |
7.3% |
|
I&M Group |
10.9% |
10.8% |
0.1% |
63.6% |
58.3% |
5.3% |
|
Diamond Trust Bank |
13.2% |
14.9% |
(1.7%) |
39.9% |
44.0% |
(4.1%) |
|
HF Group |
25.2% |
24.1% |
1.1% |
72.1% |
74.4% |
(2.3%) |
|
Absa Bank Kenya |
13.1% |
11.1% |
2.0% |
65.2% |
62.3% |
2.9% |
|
Equity Group |
15.0% |
14.2% |
0.8% |
60.5% |
58.3% |
2.2% |
|
Mkt Weighted Average* |
14.0% |
13.5% |
0.5% |
66.4% |
62.7% |
3.7% |
|
*Market cap weighted as at 30/05/2025 |
||||||
|
**Market cap weighted as at 13/06/2024 |
||||||
Key take-outs from the table include;
- Asset quality for the listed banks declined during Q1’2025, with market-weighted average NPL ratio for the listed banks increasing by 0.5% points to 14.0% from 13.5% in Q1’2024 largely due to KCB Group’s numbers, and,
- Market-weighted average NPL Coverage for the five listed banks increased by 3.7% points to 66.4% in Q1’2025 from 62.7% recorded in Q1’2024. The increase was largely attributable to Stanbic Bank’s coverage ratio increasing by 8.5% points to 80.8% from 72.3% in Q1’2024, coupled with NCBA Group’s NPL coverage ratio increasing by 7.3% points to 63.0% from 55.7% in Q1’2024.
Summary Performance
The table below shows the performance of listed banks that have released their Q1’2025 results using several metrics:
|
Cytonn Report: Listed Banks Performance in Q1’2025 |
||||||||||||||
|
Bank |
Core EPS Growth |
Interest Income Growth |
Interest Expense Growth |
Net Interest Income Growth |
Net Interest Margin |
Non-Funded Income Growth |
NFI to Total Operating Income |
Growth in Total Fees & Commissions |
Deposit Growth |
Growth in Government Securities |
Loan Growth |
Loan to Deposit Ratio |
Return on Average Equity |
|
|
Diamond Trust Bank |
23.0% |
0.1% |
(7.2%) |
8.0% |
5.8% |
(18.5%) |
28.3% |
3.4% |
9.0% |
18.6% |
5.7% |
61.3% |
11.5% |
|
|
I&M Group |
17.9% |
(0.6%) |
(15.1%) |
11.8% |
8.2% |
13.7% |
27.7% |
4.5% |
6.0% |
40.5% |
0.7% |
72.1% |
18.5% |
|
|
Co-operative Bank |
5.3% |
14.4% |
3.3% |
21.7% |
8.3% |
(1.9%) |
32.8% |
6.7% |
9.0% |
20.9% |
1.7% |
73.2% |
18.2% |
|
|
Absa Bank Kenya |
3.7% |
(7.4%) |
(21.9%) |
(1.1%) |
10.1% |
(11.1%) |
28.6% |
4.1% |
4.6% |
68.0% |
(5.6%) |
83.1% |
25.2% |
|
|
NCBA Group |
3.4% |
(10.1%) |
(33.5%) |
20.6% |
6.3% |
(4.5%) |
42.5% |
(2.8%) |
(9.6%) |
5.3% |
(10.4%) |
57.9% |
21.2% |
|
|
KCB Group |
0.4% |
2.2% |
(8.6%) |
8.5% |
8.2% |
(9.8%) |
31.8% |
0.4% |
(4.9%) |
(12.1%) |
0.1% |
71.7% |
23.4% |
|
|
Equity Group |
(3.9%) |
(2.7%) |
(12.4%) |
2.6% |
7.4% |
(11.8%) |
40.7% |
(1.4%) |
7.0% |
31.2% |
3.3% |
60.8% |
20.8% |
|
|
Standard Chartered Bank |
(13.5%) |
(2.4%) |
(13.1%) |
(0.8%) |
9.6% |
(29.3%) |
29.2% |
(3.1%) |
(6.8%) |
38.8% |
(10.2%) |
48.3% |
26.8% |
|
|
Stanbic Group |
(16.6%) |
(8.9%) |
(24.6%) |
4.6% |
5.9% |
(27.2%) |
28.9% |
1.2% |
(5.0%) |
89.6% |
(4.6%) |
72.3% |
20.0% |
|
|
HF Group |
(89.3%) |
18.6% |
(3.7%) |
46.1% |
5.4% |
9.9% |
30.0% |
20.1% |
14.5% |
102.2% |
2.0% |
77.6% |
5.6% |
|
|
Q1'2025 Mkt Weighted Average* |
(1.8%) |
(1.18%) |
(14.3%) |
8.3% |
8.0% |
(10.9%) |
33.5% |
1.1% |
0.8% |
31.3% |
(2.3%) |
66.6% |
21.6% |
|
|
Q1’2024 Mkt Weighted Average** |
29.8% |
35.3% |
64.7% |
22.8% |
8.0% |
10.9% |
38.6% |
10.7% |
14.1% |
3.1% |
7.5% |
68.4% |
21.9% |
|
|
*Market cap weighted as at 30/05/2025 |
||||||||||||||
|
**Market cap weighted as at 13/06/2024 |
||||||||||||||
Key take-outs from the table include:
- The listed banks’ Q1’2025 results recorded a 1.8% decline in core Earnings per Share (EPS) in Q1’2025, compared to the weighted average growth of 29.8% in Q1’2024,
- Interest income recorded a weighted average decline of 1.2% in Q1’2025, compared to 35.3% growth in Q1’2024. Similarly, interest expenses recorded a market-weighted average decline of 14.3% in Q1’2025 compared to a growth of 64.7% in Q1’2025,
- The Banks’ net interest income recorded a weighted average growth of 8.3% in Q1’2025, a decline from the 22.8% growth recorded over a similar period in 2024, while the non-funded income declined by 10.9% in Q1’2025 compared to the 10.9% growth recorded in Q1’2024, and,
- The Banks recorded a weighted average deposit growth of 0.8%, compared to the market-weighted average deposit growth of 14.1% in Q1’2024.
Monthly Highlights
- During the month, Safaricom Plc released its FY’2025 financial results for the period ending 31st March 2025, highlighting that the profit after tax (PAT) for the Group increased by 7.3% to Kshs 45.8 bn, from 42.7 bn recorded in FFY’2024, largely attributable to a 11.2% increase in Total Revenue to Kshs 388.7 bn from Kshs 349.4 bn recorded in FY’2024, The performance was however weighed down by aa 16.3% increase in Operating cost to Kshs 216.5 bn from 186.2 bn recorded in FY’2024. Please see our Cytonn Weekly #19/2025 for more info
- During the month Standard Chartered Bank Kenya released their Q1’2025 financial results, highlighting that Profit After Tax (PAT) decreased by 13.5% to Kshs 4.9 bn, from Kshs 5.6 bn in Q1’2024. KCB Group released their Q1’2025 financial results, highlighting that their profit after tax (PAT) increased by 0.4% to Kshs 16.54 bn, from Kshs 16.48 bn in Q1’2024. NCBA Group released their Q1’2025 financial results, highlighting that their profit after tax (PAT) increased by 3.4% to Kshs 5.5 bn, from Kshs 5.3 bn in Q1’2024. Please see our Cytonn Weekly #21/2025 for more info.
We are “Bullish” on the Equities markets in the short term due to current cheap valuations, lower yields on short-term government papers and expected global and local economic recovery, and, “Neutral” in the long term due to persistent foreign investor outflows. With the market currently trading at a discount to its future growth (PEG Ratio at 0.6x), we believe that investors should reposition towards value stocks with strong earnings growth and that are trading at discounts to their intrinsic value. We expect the current high foreign investors sell-offs to continue weighing down the economic outlook in the short term.
- Industry Report
During the month of May, the following industry reports were released and the key take-outs were as follows;
|
Cytonn Report: Notable Industry Reports During the Month of May 2025 |
|||
|
# |
Theme |
Report |
Key Take-outs |
|
1. |
Leading Economic Indicators |
Leading Economic Indicators (LEI) March 2025 Reports by the Kenya National Bureau of Statistics |
· In March 2025, Cement consumption in Q1’2025 decreased slightly by 0.2% to 2.3 bn metric tonnes from 2.4 bn metric tonnes in Q4’2024. · On a year-on-year basis, cement consumption in Q1’2025 increased by 20.7% to 2.3 bn metric tonnes, up from 1.9 bn metric tonnes recorded in Q1’2024. · For more information, please see our Cytonn Weekly #20/2025
|
|
2 |
Quarterly Economic Review |
Quarterly Economic Review Q4’2024, By the Central Bank of Kenya (CBK) released the |
· The gross loans advanced to the Real Estate sector increased quarter-on-quarter (q/q) by 1.1% to Kshs 513.0 bn in Q4’2024, up from Kshs 507.6 bn in Q3’2024. On a year-on-year (y/y) basis, this represented a 0.8% increase from Kshs 509.0 bn in Q4’2023 · The gross loans advanced to the Hospitality sector (Tourism, Restaurants & Hotels) stood at Kshs 107.0 bn in Q4’2024, a 7.9% q/q decrease from Kshs 116.2 bn in Q3’2024, and a 13.0% y/y decrease from Kshs 123.0 bn in Q4’2023 · Gross loans advanced to the Building and Construction sector increased by 1.0% q/q to Kshs 140.0 bn in Q4’2024, from Kshs 138.6 bn in Q3’2024 · Gross NPLs in the Building and Construction sector rose on q/q by 0.8% to Kshs 52.1 bn in Q4’2024, from Kshs 51.7 bn in Q3’2024 · Gross NPLs in the Hospitality sector on q/q increased by 7.1% to Kshs 16.7 bn in Q4’2024, down from Kshs 15.6 bn in Q3’2024 · Gross NPLs in the Real Estate sector increased by 1.4% q/q to Kshs 118.6 bn in Q4’2024, from Kshs 117.0 bn in Q3’2024, and by 16.6% y/y from Kshs 101.7 bn in Q4’2023 · For more information, please see our Cytonn Weekly #20/2025 |
|
3 |
Economic Survey 2025 and GDP performance |
The Kenya National Bureau of Statistics (KNBS) 2025 Economic Survey |
· The Real Estate sector recorded a growth of 5.3% in 2024, according to the KNBS 2025 Economic Survey · Number of international arrivals increased by 14.7% to 2.4 mn in 2024 from 2.1 mn in 2023 · Hotel bed occupancy in the country saw growth, with December recording the highest in 2024 at 36.3%. This was different from 2023 where bed occupancy peak was recorded in November 2024 at 36.3% · The Real Estate sector posted steady growth of 3.6% in Q4’2024, which is 3.7% points slower than the 7.3% growth registered in Q4’2023. · The construction sector grew by 2.9% in Q4’2024, which is 2.0% points slower than the 4.9% growth in Q4’2023 · The accommodation and restaurant services grew by 10.9% during Q4’2024, representing an 8.0% points y/y decline from the 18.9% growth recorded in Q4’2023. · For more information, please see our Cytonn Weekly #19/2025 |
- Residential Sector
- World bank Proposal to withdraw SHIF and Housing Levy deduction for low income workers
During the week, the World Bank recommended exempting Kenyan workers earning below Kshs 32,333 monthly from the 2.8% Social Health Insurance Fund (SHIF) and 1.5% Affordable Housing Levy deductions. This aims to increase disposable income for low-income workers, whose take-home pay has been significantly reduced by these levies and increased NSSF contributions. Currently, these deductions risk violating employment laws by pushing net pay below one-third of gross salary. The exemption seeks to boost purchasing power, encourage formal employment, and stimulate economic growth, though it may strain funding for universal health coverage and housing programs.
Exempting low-income workers from SHIF and housing levy deductions could increase their disposable income, potentially boosting demand for affordable housing units under the government’s 250,000-unit annual target. Enhanced consumer spending may drive economic activity, encouraging real estate development in urban and peri-urban areas. However, reduced levy collections could limit funding for the Affordable Housing Scheme, potentially slowing housing projects unless alternative financing is secured. A financially stable workforce could indirectly spur demand for residential and commercial properties, particularly in urban areas.
- New Makasembo Phase 1 Affordable housing commissioning
During the week, President William Ruto and former Prime Minister Raila Odinga commissioned Phase One of the LAPFUND Makasembo Affordable Housing Project in Kisumu, a significant step in Kenya’s Affordable Housing Programme. This phase, built on an 11.6-acre site, delivered 910 housing units: 180 one-bedroom, 100 two-bedroom, and 290 three-bedroom low-cost units, plus 600 two-bedroom and 700 three-bedroom middle-cost units, with 1,754 parking spaces. Valued at Kshs 3.5 bn, the project is a collaboration between the Kisumu County Government and the Local Authorities Pension Fund (LAPFUND), initiated in 2021. The event also marked the groundbreaking for Phase Three, expanding the project’s total of 1,870 units to meet Kisumu’s rising housing demand. The estate includes modern amenities such as preschools, a daycare, boreholes, solar-powered streetlights, high-speed lifts, landscaped gardens, and playgrounds, fostering a comprehensive living environment.
Phase Two is in progress, with completion expected by 2026. The project supports Kenya’s affordable housing Agenda, focusing on affordable housing for low- and middle-income earners. Original tenants, relocated with Kshs 96,000 compensation each, are prioritized for ownership. The initiative enhances Kisumu’s urban development and supports the general affordable housing initiative. Environmental sustainability, through solar energy and green spaces, aligns with global trends, attracting eco-conscious residents. The project’s success hinges on addressing potential challenges like cost overruns and ensuring equitable access for local communities.
We expect that the Makasembo estate will increase affordable housing supply in Kisumu, raise local property values, and stimulate demand for commercial and retail spaces. Enhanced amenities and connectivity via regional infrastructure projects will drive urban growth, attracting developers and investors.
We expect the Affordable Housing initiatives witnessed in all cities and towns to greatly transform Kenya’s housing sector by making homeownership more accessible to low- and middle-income earners. By requiring payslips and proof of income for allotment, the government is introducing a more structured and transparent system that ensures homes are allocated to genuine beneficiaries who can sustainably manage repayments. This move is likely to strengthen public confidence in the programme and promote financial discipline among applicants. Additionally, the structured rent-to-own model, combined with initiatives to support those earning below Ksh20,000, is expected to create a more inclusive housing market.
There were five notable highlights during the month;
- President William Ruto officiated the handover of 1,080 housing units at the Mukuru Affordable Housing Project in Nairobi’s Embakasi South, marking a pivotal moment in Kenya’s housing sector. Spanning 56 acres, this ambitious initiative, the largest of its kind in the country, aims to deliver 13,248 units by March 2026. The project, valued at over Kshs 7.0 bn and funded through the Housing Levy Fund, offers bedsitters at Kshs 3,900, one-bedroom units at Kshs 4,000, and two-bedroom units at Kshs 5,000 monthly under a rent-to-own scheme. This milestone follows the reclamation of the land, previously grabbed illegally, by the Ethics and Anti-Corruption Commission in 2020. For more information, please see our Cytonn Weekly #21/2025,
- Superior Homes Kenya (SHK), a real estate developer, and KCB Bank Kenya, formalized a strategic partnership through a Memorandum of Understanding (MOU), that aims to bridge the gap between property development and financing, addressing long-standing challenges in Kenya’s Real Estate sector that include massive housing deficit, unaffordability, widespread informal settlements, land tenure insecurity, and limited financing. By leveraging KCB’s financial expertise and SHK’s innovative housing projects, the partnership seeks to empower middle-income earners while contributing to Kenya’s housing agenda of reducing the housing deficit which currently stands at 80%. For more information, please see our Cytonn Weekly #20/2025,
- The national Treasury projected to collect Kshs 95.8 bn from the housing development levy in financial year starting July, indicating President Ruto’s plan to put up 200,000 subsidized housing units annually for middle and lower-income households. The forecasted Kshs 30.3 bn increase has clashed with employer’s call on the Ruto administration to consider slashing the levy by 1.0% to 0.5% from 1.5% of the gross income, citing the continued hit on workers’ net income amid rising inflation. Workers in the informal sector will also contribute to the housing levy at 1.5% of the gross income under the housing law, unlike the previous framework under the employment law which had left out the informal workers. This will help achieve equity which is one of the core principles of taxation. For more information, please see our Cytonn Weekly #19/2025, and,
- The government tabled a Kshs 119.6 bn budget for the State Department for Housing and Urban Development for the 2025/26 financial year, including Kshs2.8 bn for research and feasibility studies to support the Affordable Housing Programme. This marks a Kshs1.0 bn increase from the 2024/25 allocation. For more information, please see our Cytonn Weekly #19/2025.
We expect continued vibrant performance in the residential sector within the country sustained by; i)ongoing residential developments under the Affordable Housing Agenda, aiming to reduce the housing deficit in the country currently estimated at 80.0%, ii) increased investment from local and international investors in the housing sector, iii) favorable demographics in the country, shown by high population and urbanization rates of 3.8% p.a and 2.0% p.a, respectively, leading to higher demand for housing units. However, challenges such as rising construction costs, strain on infrastructure development, and limited access to financing will continue to restrict the optimal performance of the residential sector.
- Mixed use Sector
During the week, the Purple Tower, a 14-storey mixed-use development along Mombasa Road in Nairobi, was officially opened, marking a historic moment with Kenya’s first-ever drone light show. Developed by Purple Dot International, this eco-friendly skyscraper, located near the Melili/Mombasa Road junction and Jomo Kenyatta International Airport, integrates Grade A office spaces, showrooms, and retail areas across 197,800 square feet, including 12,330 square feet of showroom space and 8,306 square feet of restaurant space.
The Purple Tower, with its tagline “Purple is the New Green,” sets a new standard for sustainable architecture in East Africa, achieving EDGE certification from the International Finance Corporation. It incorporates high-performance thermal glass, energy-efficient lighting with occupancy sensors, and a smart building management system, reducing energy consumption by 27%, water usage by 41%, and embodied material energy by 33%. Low-flow plumbing, rainwater harvesting, and sustainable, locally sourced materials further minimize its carbon footprint. These features address Nairobi’s oversupply of commercial spaces by prioritizing tenant experience, cost efficiency, and environmental responsibility, appealing to businesses seeking lower utility costs and enhanced brand image through eco-conscious occupancy.
Strategically positioned near the Nairobi Expressway, the tower offers seamless access to the CBD, Upper Hill, Industrial Area, and JKIA, with multiple entry and exit points reducing travel time to Mlolongo, Athi River, Westlands, and Limuru Road. The design, a collaboration with architects like Design Partnership Ltd and DLR Group, includes flexible office layouts starting at 1,771 square feet, meeting spaces for 12 to 240 people, and a grab-and-go café. The project, supported by financiers like Diamond Trust Bank and Stanbic Bank, offers flexible payment plans for investors, enhancing its appeal in a competitive market.
The Purple Tower will elevate property values along Mombasa Road, spur demand for commercial and retail spaces, and drive urban development near the Expressway. Its sustainable design attracts eco-conscious tenants, but environmental concerns require ongoing mitigation.
There was one notable highlight during the month;
- Property developer Mi Vida Homes announced a strategic partnership with Space Master Properties to construct Habitat, a 24-story mixed-use facility along Ralph Bunche Road in Nairobi’s Westlands. This ambitious project, developed in collaboration with Parklane Construction, marks a pioneering effort in Kenya’s real estate market by integrating healthcare with residential and commercial spaces. The development will feature 42 medical suites for sale to healthcare providers, a residential component with assisted living options, and retail areas, targeting Nairobi’s growing medical tourism sector. For more information, please see our Cytonn Weekly #21/2025,
- Infrastructure
- El Wak-Modogashe Highway launch
During the week, the Kenya National Highways Authority (KeNHA) begun constructing the 749-kilometer El Wak-Modogashe Highway, part of the Isiolo-Mandera corridor, following funding from the World Bank and the African Development Bank (AfDB). The Kshs 85 bn project, connects Isiolo, Garissa, Wajir, and Mandera counties, spanning key towns like Kulamawe, Samatar, Tarbaj, Kutulo, El Wak, Rhamu, and Mandera. Implemented in four phases, the first 200-kilometer Isiolo-Kulamawe-Modogashe section is 40% complete, with the entire corridor expected to be finished by June 2028. The project also includes laying a 748-kilometer fiber optic cable to boost digital connectivity and social infrastructure like dispensaries, schools, and water projects, enhancing socio-economic growth
This highway development is poised to significantly benefit the Real Estate sector in Kenya’s northeastern region. Improved connectivity will enhance access to previously marginalized areas, increasing land value and attracting property development. The road will facilitate faster movement of goods and people, making these counties more appealing for commercial and residential investments. Enhanced infrastructure, coupled with better digital connectivity, will support the establishment of businesses, retail centers, and housing projects, catering to growing populations and economic activity. The social infrastructure projects, such as water supply and electrification, will further improve livability, encouraging real estate developers to invest in urban and peri-urban settlements along the corridor. Additionally, the highway’s role in boosting trade with Somalia and Ethiopia will drive demand for warehouses, logistics hubs, and commercial properties, fostering economic hubs. By reducing travel times and improving security, the project will create a stable environment for long-term real estate growth, unlocking the region’s economic potential.
- NSSF plans to invest Kshs 25.0 bn Rironi-Mau Summit road
During the week, the National Social Security Fund (NSSF) announced its plan to invest up to Kshs 25.0 bn for a 50% stake in a consortium with China Road and Bridge Corporation (CRBC) to construct a 175-kilometer dual carriageway from Rironi to Mau Summit, part of the Nairobi-Nakuru-Mau Summit highway. This Kshs 170.0 bn public-private partnership (PPP) project, funded by Kshs 120.0 bn in debt and Kshs 50.0 bn in equity, aims to transform the single-lane road into a four-lane highway, easing congestion and enhancing trade along the Northern Corridor connecting Kenya to Uganda, Rwanda, and beyond. The project, set to begin in June 2025, includes rehabilitating the 58-kilometer Rironi-Maai Mahiu-Naivasha road and constructing a four-kilometer viaduct through Nakuru town.
NSSF expects to recoup investments through toll charges over 30 years, promising higher returns than Treasury securities. The consortium faces competition from Shandong Hi-Speed Road & Bridge International Engineering Co., with bids under review by the Kenya National Highways Authority (KeNHA). The project aligns with Kenya’s Vision 2030, addressing traffic bottlenecks and safety issues on a route handling 20,000 vehicles daily.
The decision follows the termination of a Kshs 190.0 bn deal with a French consortium led by Vinci SA in 2024, due to high toll fees (Kshs 780–Kshs 6,450) and unfavourable risk terms. Critics have raised concerns about using pension funds for such projects, citing risks to workers’ savings. Community consultations and traffic management technologies, like surveillance cameras, will support the project’s rollout.
The highway will boost property values in Kiambu, Nyandarua, and Nakuru, spur demand for commercial and residential developments near interchanges, and support urban growth along the Northern Corridor. Sustainable features and connectivity will attract investors, though community displacement risks need mitigation.
There was one notable highlight during the month;
- The National Treasury proposed an allocation of Kshs 16.5 bn to facilitate the extension of the Standard Gauge Railway from Naivasha to Kisumu and Malaba actualizing the vision of having a seamless rail transport from the Mombasa port to Malaba. The allocation which will be complemented by funding from China has set the stage for the plan to extend the SGR to neighbouring Uganda, ending years of uncertainty on whether the modern rail would connect the two countries. The facilitation from China comes after their decision to reject Kenya’s proposal to fully fund the entire project. This has saved the Kenyan taxpayer from further increase in the debt that Kenya owes China whose repayments account for the biggest portion of the money that Kenya pays in foreign debt. For more information, please see our Cytonn Weekly #19/2025
- Hospitality
There was one notable highlight during the month;
- Africa Travel Investments, a tourism investment firm trading as Africa Travel and backed by a wealthy figure such as Aliko Dangote, has made a 100% acquisition worth Kshs 4.0 bn of Pollman’s Tours and Safaris Limited (Pollman’s) following an unconditional approval from the Competition Authority of Kenya (CAK). The acquisition, facilitated through private equity fund Alterra Capital marks a strategic entry into Kenya’s tourism sector, signalling strong confidence in its long-term growth prospects. For more information, please see our Cytonn Weekly #20/2025
We expect that tourism growth will continue to support this upcountry expansion, with international arrivals rising by over 13.5% in the past year. However, the success of this trend will depend on continued infrastructure improvements, such as roads, power, and water supply, which remain inconsistent in many rural regions. While developers are capitalizing on the promise of new markets, the shift is also partially influenced by challenges in Nairobi, including financial constraints, high loan default rates, and a rise in property auctions. Some developers may see upcountry locations as a strategic move to reduce exposure to the economic pressures affecting the capital. This ongoing redistribution of hospitality investment presents both opportunities for regional development and challenges that must be addressed to ensure long-term sustainability.
- Real Estate Investments Trusts (REITs)
On the Unquoted Securities Platform, Acorn D-REIT and I-REIT traded at Kshs 26.7 and Kshs 22.9 per unit, respectively, as per the last updated data on 23rd May 2025. The performance represented a 33.4% and 14.5% gain for the D-REIT and I-REIT, respectively, from the Kshs 20.0 inception price. The volumes traded for the D-REIT and I-REIT came in at Kshs 12.8 mn and Kshs 36.1 mn shares, respectively, with a turnover of Kshs 323.5 mn and Kshs 791.5 mn, respectively, since inception in February 2021. Additionally, ILAM Fahari I-REIT traded at Kshs 11.0 per share as of 23rd May 2025, representing a 45.0% loss from the Kshs 20.0 inception price. The volume traded to date came in at 1.2 mn shares for the I-REIT, with a turnover of Kshs 1.5 mn since inception in November 2015.
REITs offer various benefits, such as tax exemptions, diversified portfolios, and stable long-term profits. However, the ongoing decline in the performance of Kenyan REITs and the restructuring of their business portfolios are hindering significant previous investments. Additional general challenges include:
- Insufficient understanding of the investment instrument among investors leading to a slower uptake of REIT products,
- Lengthy approval processes for REIT creation,
- High minimum capital requirements of Kshs 100.0 mn for REIT trustees compared to Kshs 10.0 mn for pension funds Trustees, essentially limiting the licensed REIT Trustee to banks only
- The rigidity of choice between either a D-REIT or and I-REIT forces managers to form two REITs, rather than having one Hybrid REIT that can allocate between development and income earning properties
- Limiting the type of legal entity that can form a REIT to only a trust company, as opposed to allowing other entities such as partnerships, and companies,
- We need to give time before REITS are required to list – they would be allowed to stay private for a few years before the requirement to list given that not all companies maybe comfortable with listing on day one, and,
- Minimum subscription amounts or offer parcels set at Kshs 0.1 mn for D-REITs and Kshs 5.0 mn for restricted I-REITs. The significant capital requirements still make REITs relatively inaccessible to smaller retail investors compared to other investment vehicles like unit trusts or government bonds, all of which continue to limit the performance of Kenyan REITs.
We expect the performance of Kenya’s Real Estate sector to remain resilient supported by several factors: i) heightened activities from both private and government sectors, ii) an expanding population driving the need for housing, iii) government efforts under the Affordable Housing Program and the incentives advanced to developers aligned with the program, iv) an increase in deals in the commercial office sector likely to boost occupancy, v) increased investment by international and local investors in the retail sector, and vi) increased international arrivals in the country boosting the hospitality and tourism sector. However, challenges such as rising construction costs, an oversupply in select Real Estate classes, strain on infrastructure development, and high capital demands in REITs sector will continue to impede the real estate sector’s optimal performance by restricting developments and investments.
Disclaimer: The views expressed in this publication are those of the writers where particulars are not warranted. This publication, which is in compliance with Section 2 of the Capital Markets Authority Act Cap 485A, is meant for general information only and is not a warranty, representation, advice, or solicitation of any nature. Readers are advised in all circumstances to seek the advice of a registered investment advisor.

- Talk to us
- Kenya
- P.O Box 20695 - 00200, Nairobi, Kenya
- Cell +254709101200
- Tel +254709101200
- WhatsApp +254741676635
- United States
- +254709101200
- DOWNLOAD OUR APP
-


- Kenya
- 8th Floor, Pinetree Plaza, Kaburu Drive, Ngong Road, Nairobi, Kenya
- USA
- Suite 1150, 1775 Eye Street NW, USA, Washington DC 20006, USA
- Investments
- High Yield
- Private Equity
- Real Estate
- Real Estate
- RiverRun Estates
- Cytonn Towers
- The Ridge
- Taraji Heights
- The Alma