Cytonn Monthly - February 2026
By Research Team, Mar 1, 2026
Executive Summary
Fixed Income
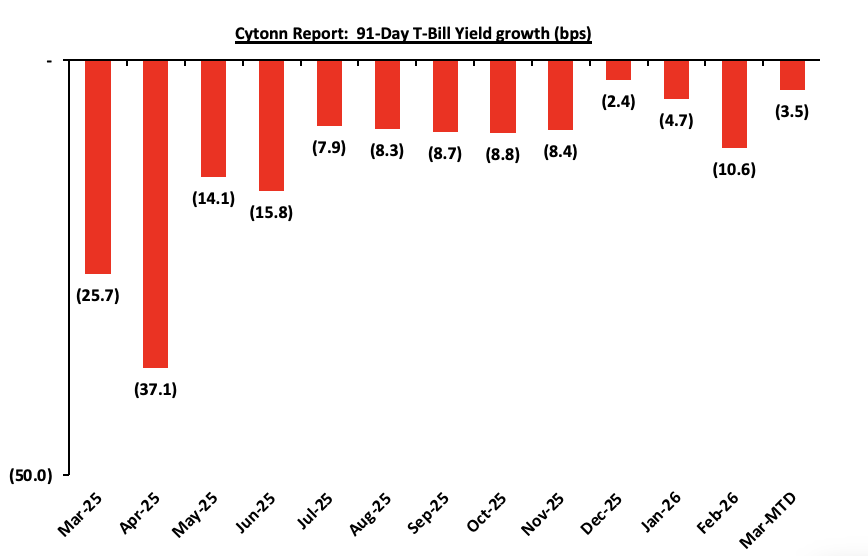
During the month of February 2026, T-bills were oversubscribed, with the overall average subscription rate coming in at 267.2%, higher than the subscription rate of 110.8% recorded in January 2026. The overall average subscription rates for the 182-day papers decreased to 52.5% from 75.8% recorded in January 2026 respectively while the subscription rates for the 91-day and 364-day papers increased to 247.1% and 490.0% from 81.3% and 157.6% recorded in January 2026. The average yields on the government papers were on a downward trajectory during the month, with the average 364-day, 91-day and 182-day papers yields decreasing by 13.4 bps, 10.6 bps, and 2.1 bps to 9.1%, 7.6% and 7.8% respectively, from an average of 9.2%, 7.7% and 7.8% recorded the previous month. For the month of February, the government accepted a total of Kshs 191.1 bn of the Kshs 256.5 bn worth of bids received in T-Bills, translating to an acceptance rate of 74.5%, compared to an acceptance rate of 92.9% in the month of January;
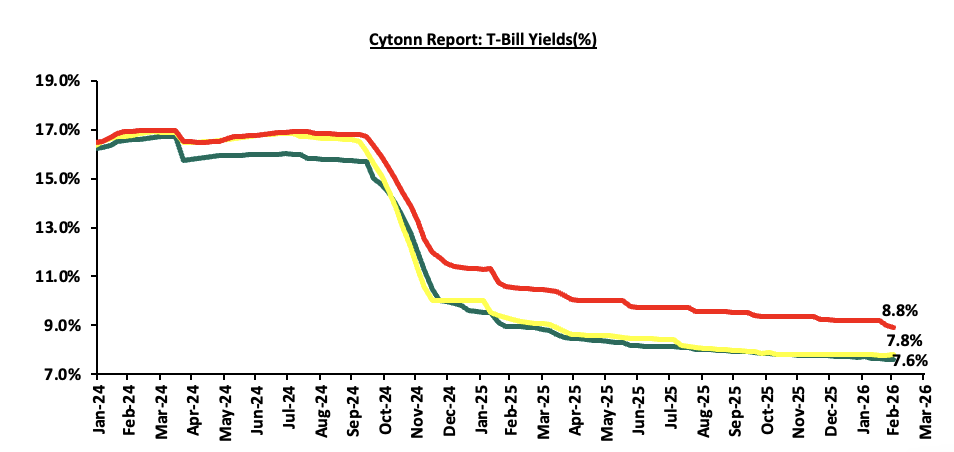
During the week, T-bills were oversubscribed for the fifth consecutive week, with the overall subscription rate coming in at 243.9%, lower than the subscription rate of 295.6% recorded the previous week. Investors’ preference for the shorter 91-day paper slightly waned, with the paper receiving bids worth Kshs 12.3 bn against the offered Kshs 4.0 bn, translating to a subscription rate of 308.5%, lower than the subscription rate of 326.2%, recorded the previous week. The subscription rate for the 182-day paper decreased significantly to 7.9% from the 113.6% recorded the previous week, while that of the 364-day papers decreased to 454.0% from 465.4% recorded the previous week. The government accepted a total of Kshs 41.8 bn worth of bids out of Kshs 58.5 bn bids received, translating to an acceptance rate of 71.4%. The yields on the government papers showed mixed performance with the yield on the 182-day papers gained by 5.0 bps to 7.80% from the 7.75% recorded the previous week. However, the yields on the 364-day paper decreased by 11.2 bps to 8.8% from 8.9% recorded the previous week, while the yields on the 91-day decreased by 1.0 bps to remain relatively unchanged from the 7.6% recorded the previous week;
Additionally, February 2026 bonds were oversubscribed, with the overall average subscription rate coming in at 427.5%, higher than the average subscription rate of 125.8% recorded in January 2025. The reopened bonds FXD3/2019/015 and FXD1/2018/025 with tenors to maturity of 8.4 years and 17.3 years respectively and fixed coupon rates of 12.3% and 13.4% respectively, received bids worth Kshs 133.8 bn and Kshs 79.9 bn respectively against the offered Kshs 50.0 bn translating to an average subscription rate of 267.6%. The government accepted bids worth Kshs 100.5 bn, translating to an average acceptance rate of 49.1%. The weighted average yield for the accepted bids for the FXD3/2019/015 and FXD1/2018/025 came in at 12.2% and 13.4% respectively;
During the week, the Government of Kenya released the results of the Eurobond buyback USD 1.0 bn notes due in 2028 and USD 1.2 bn due in 2032, at USD 1,035.0 and USD 1,055.0 per USD 1,000.0 respectively, plus the accrued interest payments on the notes, with the offer closing on 25th February 2026. The government had received tenders of USD 90.5 mn and USD 892.1 mn for the 2028 and 2032 notes respectively. As a result, Kenya was unable to fully retire the bond as planned, leaving USD 307.9 mn of the bond still outstanding, which will need to be repaid at maturity;
During the week, The year-on-year inflation in February 2026 decreased by 0.1% points to 4.3% from the 4.4% recorded in January 2026 which is in line with our projection of a decrease to a range of 4.3%-4.4%. The price increase was primarily driven by a by a rise in prices of items in the Food and Nonalcoholic Beverages (7.3%); Transport (4.0%); and Housing, Water, Electricity, Gas and other fuels (1.8%); over the one-year period. The month-on-month inflation rate stood at 0.2% in February 2026;
Equities
During the month of February, the equities market was on an upward trajectory, with NSE 20, NSE 25, NSE 10 and NASI gaining by 13.7%, 11.8%, 10.8% and 10.6% respectively. The equities market performance was mainly driven by gains recorded by large-cap stocks such as, Stanbic, KCB, and DTB-K of 29.5%, 20.7% and 20.0% respectively;
During the week, the equities market was on an upward trajectory, with NSE 10, NSE 25, NSE 20, and NASI gaining by 4.4%, 4.3%, 3.5% and 3.0% respectively, taking the YTD performance to gains of 19.4%, 16.2%, 15.3% and 14.8% for NSE 20, NSE 25, NASI and NSE 10 respectively. The week-on-week equities market performance was driven by gains recorded by large-cap stocks such as ABSA, BAT, and SCB-K of 13.2%, 10.1% and 7.7% respectively;
Also, during the month, the banking sector index gained by 14.4% to close at 245.9 from the 215.0 recorded at the end of the January 2026. This was attributable to gains recorded by large-cap stocks such as Stanbic, KCB, and DTB-K of 29.5%, 20.7% and 20.0% respectively;
During the week, the banking sector index gained by 5.7% to 245.9 from 232.5 recorded the previous week. This is attributable to gains recorded by large cap stocks such as ABSA, SCB-K and KCB of 13.2%, 7.7%, and 7.4% respectively;
During the week, British American Tobacco Kenya Plc released their FY’2025 financial results, recording 17.0% increase in Profits after Tax (PAT) to Kshs 5.2 bn, from Kshs 4.5 bn recorded in FY’2024. The increase in PAT was mainly attributed to the 14.6% decrease in the cost of sales to Kshs 15.7 bn in FY’2025, from Kshs 18.4 bn recorded in FY’2024, as well as the 123.6% decrease in the finance cost to a finance income of Kshs 0.2 bn, from a finance loss of Kshs 0.8 bn in FY’2024 which outweighed the 12.5% decrease in the gross sales to Kshs 35.9 bn from Kshs 41.1 bn;
Real Estate
Nairobi posted lower yields on prime office rents than Kampala and Dar es Salaam in the second half of 2025, according to Knight Frank data, with average yields at 8.0% compared with 9.0% in both cities. Prime office rents averaged USD 13.0 per square metre per month in Nairobi, USD 16.5 in Kampala, and USD 15.0 in Dar es Salaam;
During the week, Tana River County announced plans to develop a Kshs 39.0 mn organic city comprising 25,000 modern housing units, alongside agribusiness and renewable energy projects;
During the week, McCullogh Real Estate Limited commenced construction of Manyanja Mall, a Kshs 400.0 mn mixed use commercial development in Nairobi’s Eastlands area;
Kenya will next month resume construction of its stalled Standard Gauge Railway (SGR) extension but without taking new sovereign loans from Beijing. Instead, the government plans to raise up to USD 4.0 bn by securitizing its 2.0% Railway Development Levy on imports to fund the remaining 369.0 km stretch from Suswa to Kisumu and onward to Malaba at the Ugandan border;
On the Unquoted Securities Platform, Acorn D-REIT and I-REIT traded at Kshs 27.4 and Kshs 23.2 per unit, respectively, as per the last updated data on 27th February 2026. Additionally, ILAM Fahari I-REIT traded at Kshs 11.0 per share as of 27th February 2026, representing a 45.0% loss from the Kshs 20.0 inception price.
Investment Updates:
- Weekly Rates: Cytonn Money Market Fund closed the week at a yield of 11.6% p.a. To invest, dial *809# or download the Cytonn App from Google Play store here or from the Appstore here;
- We continue to offer Wealth Management Training every Tuesday, from 7:00pm to 8:00 pm. The training aims to grow financial literacy among the general public. To register for any of our Wealth Management Trainings, click here;
- If interested in our Private Wealth Management Training for your employees or investment group, please get in touch with us through wmt@cytonn.com;
- Cytonn Insurance Agency acts as an intermediary for those looking to secure their assets and loved ones’ future through insurance namely; Motor, Medical, Life, Property, WIBA, Credit and Fire and Burglary insurance covers. For assistance, get in touch with us through insuranceagency@cytonn.com;
- Cytonn Asset Managers Limited (CAML) continues to offer pension products to meet the needs of both individual clients who want to save for their retirement during their working years and Institutional clients that want to contribute on behalf of their employees to help them build their retirement pot. To more about our pension schemes, kindly get in touch with us through pensions@cytonn.com;
Hospitality Updates:
- We currently have promotions for Staycations. Visit cysuites.com/offers for details or email us at sales@cysuites.com;
Money Markets, T-Bills Primary Auction:
For the month of February 2026, T-bills were oversubscribed, with the overall average subscription rate coming in at 267.2%, higher than the subscription rate of 110.8% recorded in January 2026. The overall average subscription rates for the 182-day papers decreased to 52.5% from 75.8% recorded in January 2026 respectively while the subscription rates for the 91-day and 364-day papers increased to 247.1% and 490.0% from 81.3% and 157.6% recorded in January 2026. The average yields on the government papers were on a downward trajectory during the month, with the average 364-day, 91-day and 182-day papers yields decreasing by 13.4 bps, 10.6 bps, and 2.1 bps to 9.1%, 7.6% and 7.8% respectively, from an average of 9.2%, 7.7% and 7.8% recorded the previous month. For the month of February, the government accepted a total of Kshs 191.1 bn of the Kshs 256.5 bn worth of bids received in T-Bills, translating to an acceptance rate of 74.5%, compared to an acceptance rate of 92.9% in the month of January. The chart below shows the yield growth rate for the 91-day paper for the past one year:
This week, T-bills were oversubscribed for the fifth consecutive week, with the overall subscription rate coming in at 243.9%, lower than the subscription rate of 295.6% recorded the previous week. Investors’ preference for the shorter 91-day paper slightly waned, with the paper receiving bids worth Kshs 12.3 bn against the offered Kshs 4.0 bn, translating to a subscription rate of 308.5%, lower than the subscription rate of 326.2%, recorded the previous week. The subscription rate for the 182-day paper decreased significantly to 7.9% from the 113.6% recorded the previous week, while that of the 364-day papers decreased to 454.0% from 465.4% recorded the previous week. The government accepted a total of Kshs 41.8 bn worth of bids out of Kshs 58.5 bn bids received, translating to an acceptance rate of 71.4%. The yields on the government papers showed mixed performance with the yield on the 182-day papers gained by 5.0 bps to 7.80% from the 7.75% recorded the previous week. However, the yields on the 364-day paper decreased by 11.2 bps to 8.8% from 8.9% recorded the previous week, while the yields on the 91-day decreased by 1.0 bps to remain relatively unchanged from the 7.6% recorded the previous week. The charts below show the performance of the 91-day, 182-day and 364-day papers from January 2024 to February 2026:
So far in the current FY’2025/26, government securities totaling Kshs 1,370.0 bn have been advertised. The government has accepted bids worth Kshs 1,816.7 bn, of which Kshs 1,010.3 bn and Kshs 806.4 bn were treasury bills and bonds, respectively. Total redemptions so far in FY’2025/26 equal to Kshs 920.1 bn, with treasury bills accounting for the entire amount. As a result, the government has a domestic borrowing surplus of Kshs 471.0 bn in FY’2025/26.
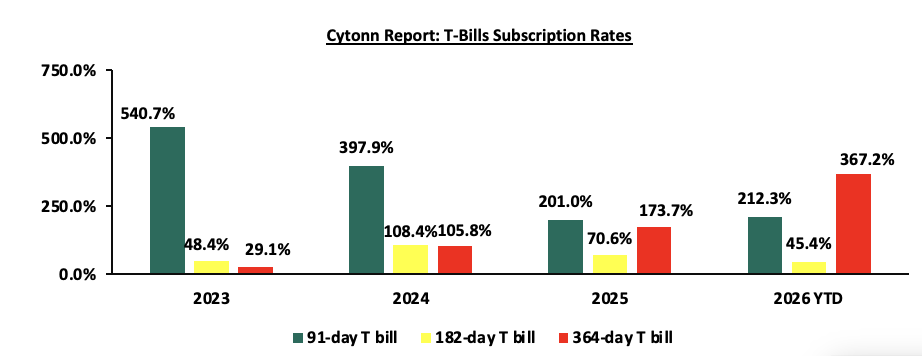
The chart below compares the overall average T-bill subscription rates obtained in 2023,2024, 2025 and 2026 Year-to-date (YTD):
Additionally, February 2026 bonds were oversubscribed, with the overall average subscription rate coming in at 427.5%, higher than the average subscription rate of 125.8% recorded in January 2025. The reopened bonds FXD3/2019/015 and FXD1/2018/025 with tenors to maturity of 8.4 years and 17.3 years respectively and fixed coupon rates of 12.3% and 13.4% respectively, received bids worth Kshs 133.8 bn and Kshs 79.9 bn respectively against the offered Kshs 50.0 bn translating to an average subscription rate of 267.6%. The government accepted bids worth Kshs 100.5 bn, translating to an average acceptance rate of 49.1%. The weighted average yield for the accepted bids for the FXD3/2019/015 and FXD1/2018/025 came in at 12.2% and 13.4% respectively. The table below provides more details on the bonds issued in January 2026 and February 2026:
|
Cytonn Report: Bond Issuances for February 2026-February 2026 |
|||||||||||||||||
|
Issue Date |
Bond Auctioned |
Effective Tenor to Maturity (Years) |
Coupon |
Amount offered (Kshs bn) |
Actual Amount Raised/Accepted (Kshs bn) |
Total bids received (Subscription) |
Average Accepted Yield |
Subscription Rate |
Acceptance Rate |
||||||||
|
09-Feb |
FXD3/2019/015- Reopened |
8.4 |
12.3% |
50.0 |
54.8 |
133.8 |
12.2% |
427.47% |
41.0% |
||||||||
|
FXD1/2018/025-Reopened |
17.3 |
13.4% |
45.7 |
79.9 |
13.4% |
||||||||||||
|
19-Jan |
FXD1/2022/015-Switch |
11.3 |
13.9% |
20.0 |
25.2 |
26.5 |
13.2% |
132.46 |
95.0% |
||||||||
|
12-Jan |
FXD1/2019/020 - Reopened |
13.2 |
12.9% |
60.0 |
20.2 |
23.4 |
13.3% |
119.24% |
86.6% |
||||||||
|
FXD1/2022/025-Reopened |
21.8 |
14.2% |
40.3 |
48.2 |
13.8% |
83.7% |
|||||||||||
|
February 2026 Average |
12.9 |
12.9% |
50.0 |
100.5 |
213.7 |
12.8% |
427.5% |
40.9% |
|||||||||
|
January 2026 Average |
15.4 |
13.7% |
80.0 |
85.8 |
98.0 |
13.4% |
125.8% |
88.5% |
|||||||||
|
2025 Average |
14.4 |
13.3% |
43.3 |
35.1 |
58.0 |
13.1% |
226.4% |
76.6% |
|||||||||
Secondary Bond Market:
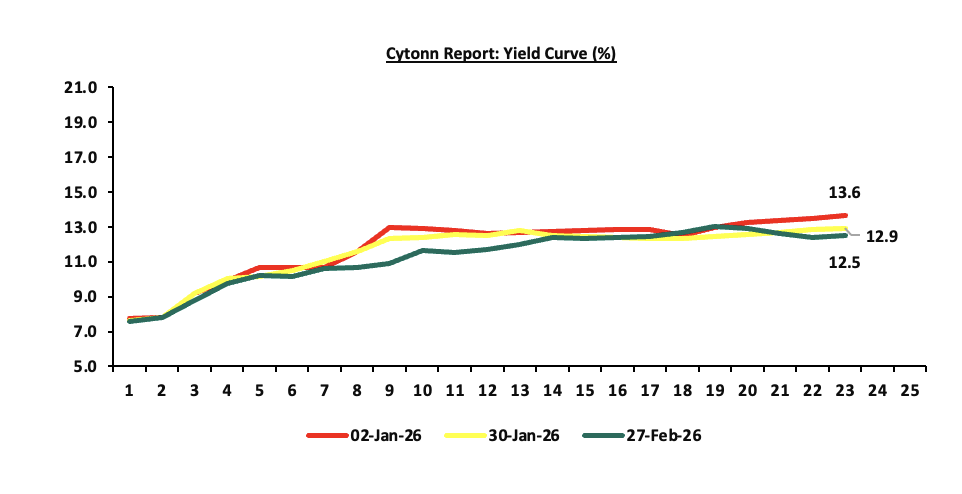
The yields on the government securities recorded a mixed performance during the month of February similar to January. Investors, apprehensive about the economic outlook in the long term, are demanding higher yields for bonds in the 15 to 21-year maturity range to compensate for the perceived risks as they anticipate potential fluctuations in economic conditions in the Kenyan market on the back of the government’s long-term debt sustainability concerns. Notably, the yield curve adjusted to a normal upward sloping curve, with long-term bonds registering highest yields. The shift in sentiment indicates increased confidence in the short-term economic landscape, in comparison to the last two years. The chart below shows the yield curve movement during the period:
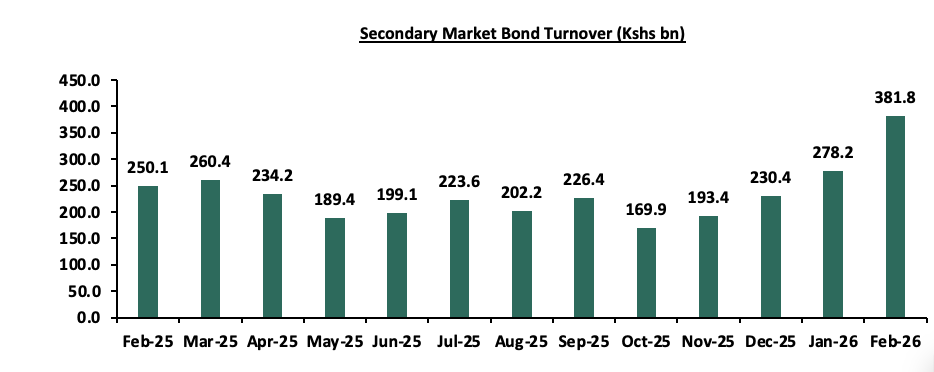
The secondary bond turnover increased by 37.2% to Kshs 381.8 bn, from Kshs 278.2 bn recorded in January 2026, pointing towards increased activities by commercial banks in the secondary bonds market for the month of February. On a year-on-year basis, the bond turnover increased by 52.7% from Kshs 157.3 bn worth of treasury bonds transacted over a similar period last year. The chart below shows the bond turnover over the past 12 months:
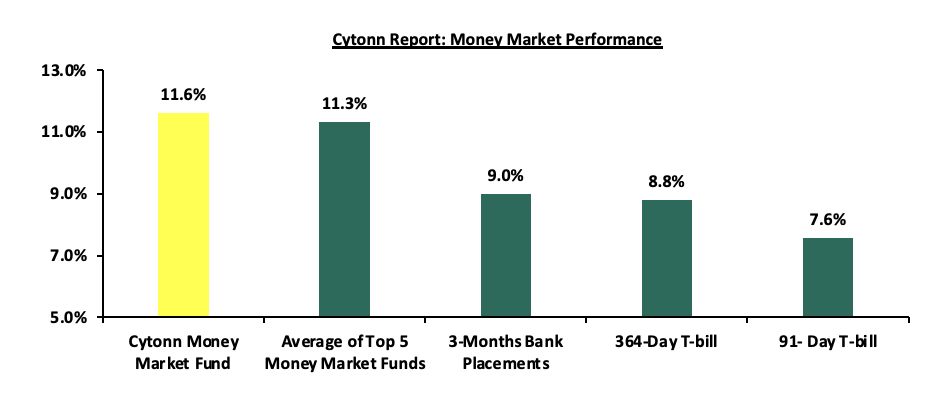
Money Market Performance:
In the money markets, 3-month bank placements ended the week at 9.0% (based on what we have been offered by various banks). The yields on the 364-day papers decreased by 0.6 bps to 8.8% from the 9.2% recorded the previous week, while the 91-day paper decreased by 1.5 bps to 7.6% from the 7.6% recorded the previous week and the yield on the Cytonn Money Market Fund increased by 6.0 bps to 11.6% to remain relatively unchanged from 11.6% recorded in the previous week, while the average yields on the Top 5 Money Market Funds decreased by 18.0 bps to 10.75% from the 10.84% recorded the previous week
The table below shows the Money Market Fund Yields for Kenyan Fund Managers as published on 27th February 2026:
|
Money Market Fund Yield for Fund Managers as published on 27 th February 2026 |
||
|
Rank |
Fund Manager |
Effective Annual Rate |
|
1 |
Nabo Africa Money Market Fund |
11.9% |
|
2 |
Cytonn Money Market Fund (Dial *809# or download Cytonn App) |
11.6% |
|
3 |
Gulfcap Money Market Fund |
11.4% |
|
4 |
Arvocap Money Market Fund |
11.0% |
|
5 |
Lofty-Corban Money Market Fund |
10.8% |
|
6 |
Ndovu Money Market Fund |
10.5% |
|
7 |
Kuza Money Market fund |
10.5% |
|
8 |
Jubilee Money Market Fund |
10.4% |
|
9 |
Madison Money Market Fund |
10.4% |
|
10 |
Enwealth Money Market Fund |
10.3% |
|
11 |
Old Mutual Money Market Fund |
10.1% |
|
12 |
Etica Money Market Fund |
10.1% |
|
13 |
British-American Money Market Fund |
10.0% |
|
14 |
Faulu Money Market Fund |
9.9% |
|
15 |
Orient Kasha Money Market Fund |
9.7% |
|
16 |
Dry Associates Money Market Fund |
9.6% |
|
17 |
GenAfrica Money Market Fund |
9.5% |
|
18 |
KCB Money Market Fund |
9.2% |
|
19 |
SanlamAllianz Money Market Fund |
9.2% |
|
20 |
Genghis Money Market Fund |
9.1% |
|
21 |
Apollo Money Market Fund |
8.5% |
|
22 |
CIC Money Market Fund |
8.5% |
|
23 |
Co-op Money Market Fund |
8.3% |
|
24 |
CPF Money Market Fund |
8.2% |
|
25 |
Mali Money Market Fund |
8.2% |
|
26 |
ICEA Lion Money Market Fund |
8.1% |
|
27 |
Absa Shilling Money Market Fund |
7.3% |
|
28 |
Mayfair Money Market Fund |
7.0% |
|
29 |
Ziidi Money Market Fund |
6.1% |
|
30 |
AA Kenya Shillings Fund |
5.9% |
|
31 |
Stanbic Money Market Fund |
5.4% |
|
32 |
Equity Money Market Fund |
4.9% |
Source: Business Daily
Liquidity:
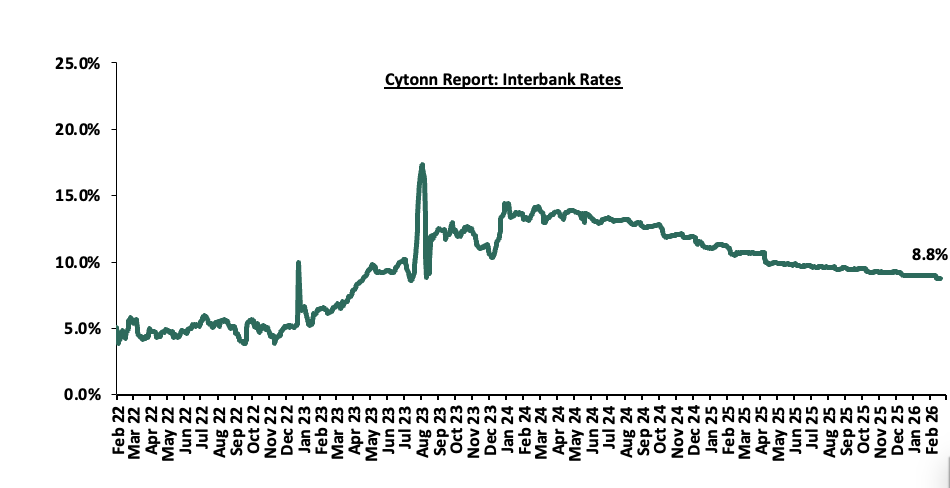
Liquidity in the money markets eased in the month of February 2026, with the average interbank rate decreasing by 13.0 bps to 8.9% from 9.0% recorded the previous month. The average interbank volumes traded decreased by 30.5% to Kshs 8.1 bn, from Kshs 11.6 bn recorded in January 2026. Additionally, during the week, liquidity in the money markets eased, with the average interbank rate decreasing by 0.3 bps, to remain relatively unchanged from the 8.8% from recorded the previous week, partly attributable to government payments that offset tax remittances. The average interbank volumes traded decreased by 1.4% to Kshs 9.0 bn from Kshs 9.1 bn recorded the previous week. The chart below shows the interbank rates in the market over the years:
Kenya Eurobonds:
During the month, the yields on the Eurobonds showed a mixed performance with the yield on the 13-year Eurobond issued in 2021 gaining the most by 37.0 bps to 8.1% from 7.7% recorded at the end of January 2026 while the yield on the 10-yr Eurobond issued in 2018 decreased the most by 16.0 bps to 5.9% from 6.1 recorded at the end of January 2026. Similarly, during the week, the yields on the Eurobonds showed a mixed performance with the yield on the 30-year Eurobond issued in 2018 gained the most by 11.0 bps to 8.9% from 8.8% recorded the previous week, while the yield on the 10-yr Eurobond issued in 2021 decreased the most by 14.0 bps to 5.9% from 6.1% recorded the previous week. The table below shows the summary performance of the Kenyan Eurobonds as of 26th February 2026;
|
|
2018 |
2019 |
2021 |
2024 |
||
|
Tenor |
10-year issue |
30-year issue |
12-year issue |
13-year issue |
7-year issue |
|
|
Amount Issued (USD) |
1.0 bn |
1.0 bn |
1.2 bn |
1.0 bn |
1.5 bn |
|
|
Years to Maturity |
2.5 |
22.5 |
6.7 |
8.8 |
5.5 |
|
|
Yields at Issue |
7.3% |
8.3% |
7.9% |
6.2% |
10.4% |
|
|
02-Jan-26 |
6.1% |
8.8% |
7.2% |
7.8% |
7.1% |
|
|
30-Jan-26 |
6.1% |
8.7% |
7.1% |
7.7% |
6.8% |
|
|
19-Feb-26 |
6.1% |
8.8% |
7.0% |
8.1% |
6.8% |
|
|
20-Feb-26 |
6.0% |
8.9% |
7.0% |
8.2% |
6.9% |
|
|
23-Feb-26 |
6.0% |
8.9% |
7.0% |
8.1% |
6.9% |
|
|
24-Feb-26 |
6.0% |
9.0% |
7.0% |
8.2% |
6.9% |
|
|
25-Feb-26 |
5.9% |
8.9% |
7.0% |
8.0% |
6.9% |
|
|
26-Feb-26 |
0.0% |
8.9% |
7.0% |
8.1% |
6.9% |
|
|
Weekly Change |
(0.1%) |
0.1% |
0.0% |
0.0% |
0.1% |
|
|
MTD Change |
(6.1%) |
0.2% |
(0.0%) |
0.4% |
0.1% |
|
|
YTD Change |
(6.1%) |
0.1% |
(0.1%) |
0.3% |
(0.2%) |
|
Source: Central Bank of Kenya (CBK) and National Treasury
Kenya Shilling:
During the month, the Kenya Shilling appreciated marginally by 0.8 bps against the US Dollar, to remain Kshs 129.02 from the Kshs 129.03 recorded at the end of January.During the week, the Kenya Shilling remained relatively unchanged from the Kshs 129.0 recorded the previous week. On a year-to-date basis, the shilling has appreciated by 2.3 bps against the dollar, lower than the 22.9 bps appreciation recorded in 2025. We expect the shilling to be supported by:
-
Diaspora remittances standing at a cumulative USD 5,020.7 mn in the twelve months to January 2026, 1.2% higher than the USD 4,960.2 mn recorded over the same period in 2025. These have continued to cushion the shilling against further depreciation. In the January 2026 diaspora remittances figures, North America remained the largest source of remittances to Kenya accounting for 51.3% in the period, and,
-
Tourism inflows, which strengthened significantly. Tourism receipts reached Kshs 560.0 bn in 2025, up from Kshs 452.2 bn in 2024, representing a 23.9% increase, supported by improved international arrivals through the country’s major airports, and,
-
Improved forex reserves currently at USD 12.5 bn (equivalent to 5.4-months of import cover), which is above the statutory requirement of maintaining at least 4.0-months of import cover and above the EAC region’s convergence criteria of 4.5-months of import cover.
The shilling is however expected to remain under pressure in 2026 as a result of:
-
An ever-present current account deficit which came at 2.2% of GDP in the twelve months to October 2025, and,
-
The need for government debt servicing, continues to put pressure on forex reserves given that 52.0% of Kenya’s external debt is US Dollar-denominated as of September 2025.
Key to note, Kenya’s forex reserves increased by 1.6% during the month of February 2026, to USD 12.5 bn, from the USD 12.3 bn recorded in the previous month, equivalent to 5.4 months of import cover and above the statutory requirement of maintaining at least 4.0-months of import cover. Additionally, during the month, the months of import cover increased to 5.4 from 5.3 months recorded in the previous month. During the week, Kenya’s forex reserves decreased by 1.0% to USD 12.5 bn from the USD 12.7 bn recorded the previous week, equivalent to 5.4 months of import cover, and above the statutory requirement of maintaining at least 4.0-months of import cover.
The chart below summarizes the evolution of Kenya's months of import cover over the years: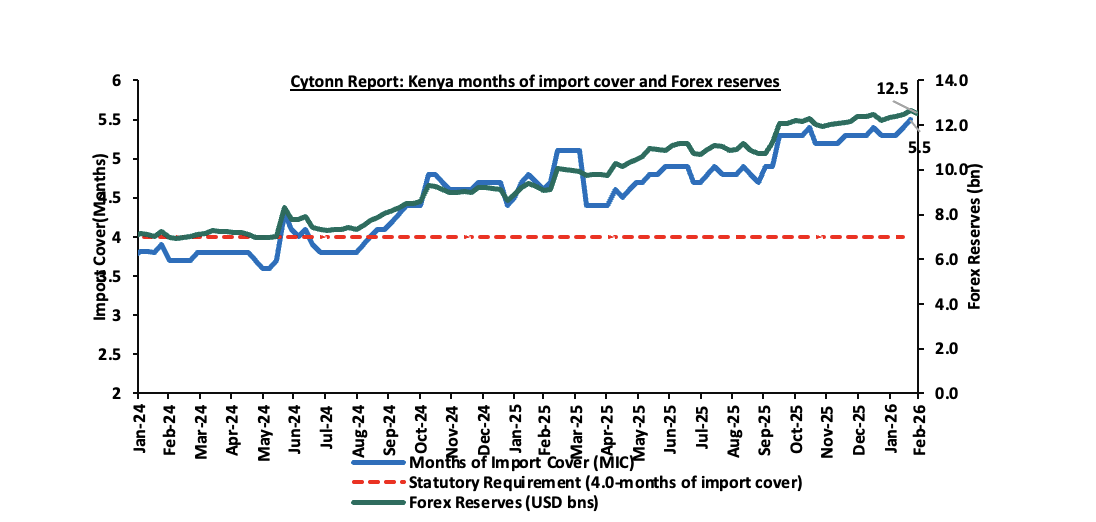
Weekly Highlights
-
Kenya’s Eurobond Buyback Results
During the week the Government of Kenya released the results of the Eurobond buyback 7.25%, USD 1.0 bn notes due in 2028 and 8.0%, USD 1.2 bn due in 2032, at USD 1,035.0 and USD 1,055.0 per USD 1,000.0 respectively, plus the accrued interest payments on the notes. Out of the USD 150.0 mn and USD 350.0 mn advertised for the 2028 and 2032 notes, the government received tenders of USD 90.5 mn and USD 892.1 mn for the 2028 and 2032 notes respectively. This translates to an undersubscription rate of 60.3% for the 2028 notes and an oversubscription of 154.9% for the 2032 notes. The 2028 notes registered a 100.0% acceptance rate with the government accepting the tenders in full while the 2032 notes received an acceptance rate of 36.4% with the government accepting bids worth USD 324.8 bn. While more than half of the bondholders chose to sell their bonds back to the government, some opted to retain them, likely anticipating better returns in the future. As a result, Kenya was unable to fully retire the bond as planned, leaving USD 307.9 mn of the bond still outstanding, which will need to be repaid at maturity. Once settled, the repurchased bonds will be permanently cancelled, while any remaining bonds will continue to trade as usual.
To fund this buyback, the government raised USD 2.3 bn through a new dual-tranche Eurobond issuance comprising a USD 900.0 mn 7-year Eurobond priced at 7.9% and maturing in 2034 with amortization in 2032–2034, and a USD 1.4 bn 12-year note priced at 8.7% maturing in 2039 with amortization in 2037–2039. Kenya’s Eurobond buyback was a strategic effort to manage its external debt and reduce debt repayment pressure. However, concerns about the country’s overall debt sustainability remain. As of January 2026, Kenya’s public debt-to-GDP ratio stood at 68.8%, exceeding the IMF-recommended limit of 50.0%. This also marks the second buyback by the government since October 2025. While repeated Eurobond buybacks have strengthened market confidence and helped smooth the external debt maturity profile, their long-term sustainability depends on whether they materially reduce debt vulnerabilities rather than simply shift repayment timelines. Sustained effectiveness therefore hinges on maintaining adequate reserve coverage, improving revenue mobilization, and advancing structural reforms under programs such as those supported by the International Monetary Fund, ensuring buybacks remain a risk-management tool rather than a recurring financing necessity
-
Inflation Highlight February 2026
The year-on-year inflation in February 2026 decreased by 0.1% points to 4.3% from the 4.4% recorded in January 2026 which is in line with our projection of a decrease to a range of 4.3%-4.4%. The price increase was primarily driven by a by a rise in prices of items in the Food and Nonalcoholic Beverages (7.3%); Transport (4.0%); and Housing, Water, Electricity, Gas and other fuels (1.8%); over the one-year period. The month-on-month inflation rate stood at 0.2% in February 2026. The table below summarizes the performance of commodity indices both on a year-on-year and month-on-month basis:
|
Cytonn Report: Major Inflation Changes –February 2026 |
|||
|
Broad Commodity Group |
Price change m/m (February-2026/ January -2026) |
Price change y/y February-2026/February-2025) |
Reason |
|
Food and Non- Alcoholic Beverages |
0.6% |
7.3% |
The m/m increase was mainly driven by the rise in prices of cabbage and potatoes increased by 4.0% each while the price of kale/sukuma wiki by 2.4%. However, the increase was weighed down by a decline in prices of sugar, mangoes and wheat flour-white of 4.4%, 3.2% and 0.8% respectively. |
|
Transport |
(0.7%) |
4.0% |
The m/m decrease was driven by the 1.4% decrease in country bus and matatu fares for travel between towns coupled with the decrease in prices for petrol and diesel by 2.3% each. |
|
Housing, Water, Electricity, Gas and Other fuels |
(0.4%) |
1.8% |
The m/m decrease was mainly due to decrease in electricity prices, with 50 kWh and 200 kWh decreasing by 2.9% and 2.7% respectively. The was also due to decrease in the price of kerosene and gas/LPG by 0.6% and 0.4% respectively. |
|
Overall Inflation |
0.2% |
4.3% |
The m/m increase was mainly attributable to the 0.6% increase in Food and non- alcoholic beverages. |
In February 2026, overall inflation decreased by 0.1% points to 4.3% from the 4.4% recorded in January 2026 on a y/y basis, signaling a mild moderation in price pressures across major categories. Additionally, the inflation rate remained within the Central Bank of Kenya’s preferred range of 2.5%–7.5% for the thirty second consecutive month, reflecting sustained macroeconomic stability. Prices for Super Petrol, Diesel and Kerosene decreased by Kshs 3.1, Kshs 2.8 and Kshs 0.2 per litre to Kshs 179.4, Kshs 167.7 and Kshs 154.0 per litre from Kshs 182.5, Kshs 170.5 and Kshs 153.8 per litre respectively in February 2026 effective from 14th February 2026 to 14th March 2026. Electricity costs decreased during the month, with 50 kWh and 200 kWh decreasing by 2.9% and 2.7%, respectively. However, the recent reduction in the Central Bank Rate to 8.75% from 9.0% in January is expected to continue to stimulate credit uptake and increase money supply, which could gradually exert upward pressure on inflation in the coming months as monetary easing transmits through the broader economy. The chart below shows the inflation rates for the past 5 years: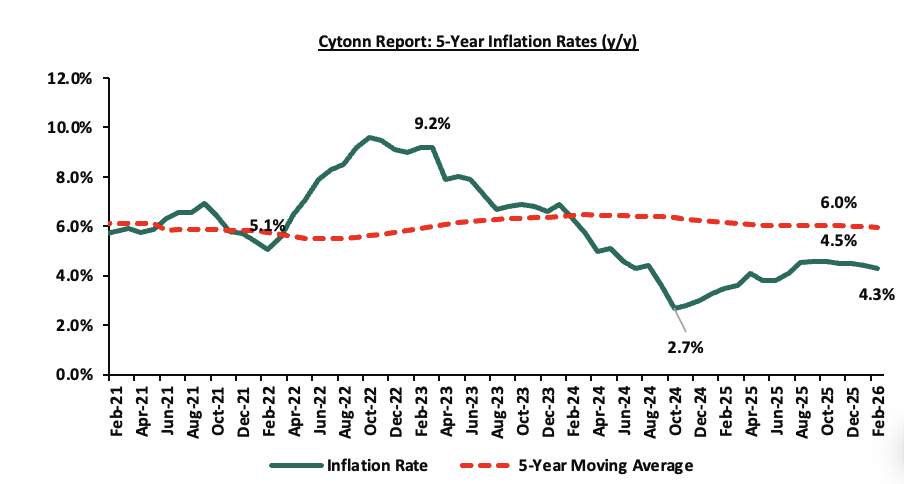
Going forward, we expect inflation to remain within the CBK’s preferred range of 2.5%-7.5%, mainly on the back of a stable currency and stable fuel prices. Additionally, favorable weather conditions will also contribute to stabilizing food prices, further supporting stable inflation rates. The risk, however, lies in the fuel prices which despite their stability still remain elevated compared to historical levels. Additionally, the Monetary Policy Committee cut the Central Bank Rate by 25.0 bps to 8.75% from 9.0% in its February 2026 meeting. This consistent accommodative monetary policy stance is likely to elevate inflationary pressures gradually as consumer spending rises from increased money supply. The committee is expected to adopt a more cautious approach to rate adjustments in the coming meetings in a bid to continue supporting the private sector, while also keeping an eye on the effect on the inflation and exchange rate.
Notable Monthly Highlights:
-
During the month, the National Treasury released the 2026 Budget Policy Statement (BPS) in line with Section 25 of the Public Finance Management (PFM) Act, CAP 412A, highlighting that total revenue was projected to increase by 5.4% to Kshs 3,533.7 bn in FY’2026/27 from Kshs 3,352.1 bn in FY’2025/26. For more information, please see our Cytonn Report #07/2026 and our BPS Note 2026
-
During the month, the Monetary Policy Committee met on February 10th, 2026, to review the outcome of its previous policy decisions and decided to lower the CBR rate by 25.0 bps to 8.75%, from 9.00% in December 2026. For more information, please see our Cytonn Weekly #06/2025
-
During the month, the National Treasury gazetted the revenue and net expenditures for the seventh month of FY’2025/2026, ending 30th January 2026, highlighting that the total revenue collected as at the end of January 2026 amounted to Kshs 1,437.2 bn, equivalent to 52.2% of the original estimates of Kshs 2,754.7 bn for FY’2025/2026 and is 89.4% of the prorated estimates of Kshs 1,606.9 bn. For more information please check our Cytonn Weekly #06/2026
-
During the month, the Energy and Petroleum Regulatory Authority (EPRA) released their monthly statement on the maximum retail fuel prices in Kenya, effective from 15th February 2026 to 14th March 2026. For more information please check our Cytonn Weekly #06/2026
-
During the month, Stanbic Bank released its monthly Purchasing Manager’s Index (PMI), highlighting that the index for the month of January 2026 remained in expansion territory, coming in at 51.9, albeit lower than 53.7 recorded in December 2025. For more information, please see our Cytonn weekly #05/2026.
Rates in the Fixed Income market have been on a downward trend due to high liquidity in the money market which allowed the government to front load most of its borrowing. The government is 110.7% ahead of its prorated net domestic borrowing target of Kshs 425.5 bn, having a net borrowing position of Kshs 896.5bn (inclusive of T-bills). However, we expect a stabilization of the yield curve in the short and medium term, with the government looking to increase its external borrowing to maintain the fiscal surplus, hence alleviating pressure in the domestic market. As such, we expect the yield curve to stabilize in the short to medium-term and hence investors are expected to shift towards the long-term papers to lock in the high returns
Market Performance:
During the month of February, the equities market was on an upward trajectory, with NSE 20, NSE 25, NSE 10 and NASI gaining by 13.7%, 11.8%, 10.8% and 10.6% respectively. The equities market performance was mainly driven by gains recorded by large-cap stocks such as, Stanbic, KCB, and DTB-K of 29.5%, 20.7% and 20.0% respectively.
During the week, the equities market was on an upward trajectory, with NSE 10, NSE 25, NSE 20, and NASI gaining by 4.4%, 4.3%, 3.5% and 3.0% respectively, taking the YTD performance to gains of 19.4%, 16.2%, 15.3% and 14.8% for NSE 20, NSE 25, NASI and NSE 10 respectively. The week-on-week equities market performance was driven by gains recorded by large-cap stocks such as ABSA, BAT, and SCB-K of 13.2%, 10.1% and 7.7% respectively.
Also, during the month, the banking sector index gained by 14.4% to close at 245.9 from the 215.0 recorded at the end of the January 2026. This was attributable to gains recorded by large-cap stocks such as Stanbic, KCB, and DTB-K of 29.5%, 20.7% and 20.0% respectively
During the week, the banking sector index gained by 5.7% to 245.9 from 232.5 recorded the previous week. This is attributable to gains recorded by large cap stocks such as ABSA, SCBK and KCB of 13.2%, 7.7%, and 7.4% respectively.
Equities turnover increased by 75.0% in the month of February to USD 182.9 mn from USD 104.5 mn recorded during the month of January 2026. Foreign investors remained net sellers, with a net selling position of USD 29.4 mn, from a net selling position of USD 8.4 mn recorded in January 2026.
During the week, equities turnover increased by 21.6% to USD 54.7 mn from USD 45.0 mn recorded the previous week, taking the YTD total turnover to USD 297.8 mn. Foreign investors remained net sellers for the fourth consecutive week with a net selling position of USD 10.0 mn, from a net selling position of USD 6.6 mn recorded the previous week, taking the YTD foreign net selling position to USD 37.8 mn, compared to a net selling position of USD 92.9 mn recorded in 2025.
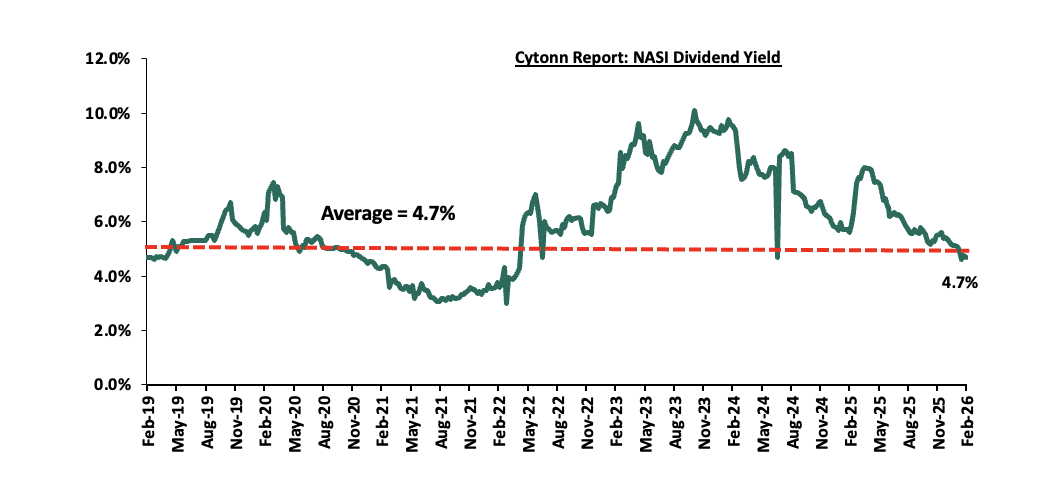
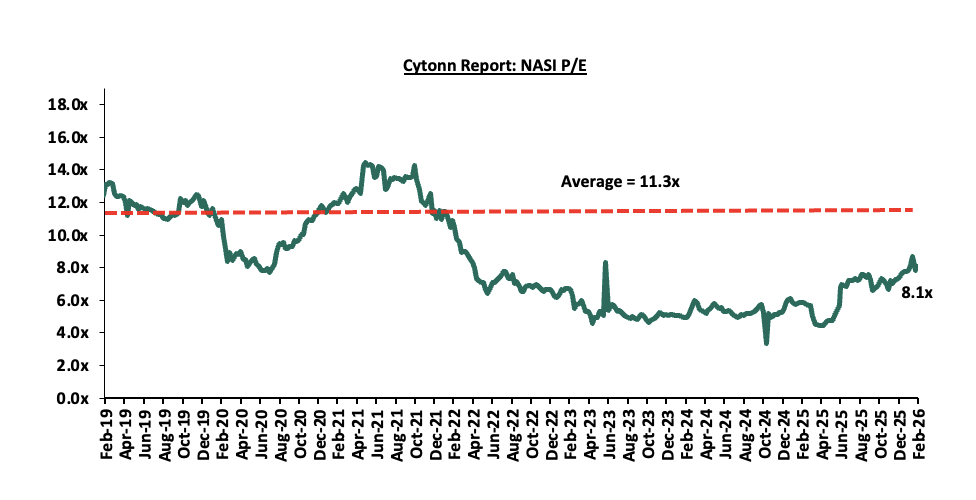
The market is currently trading at a price to earnings ratio (P/E) of 8.1x, 28.6% below the historical average of 11.3x, and a dividend yield of 4.7%, at par with the historical average of 4.7%. Key to note, NASI’s PEG ratio currently stands at 1.0x, an indication that the market is fairly valued relative to its future growth. A PEG ratio greater than 1.0x indicates the market may be overvalued while a PEG ratio less than 1.0x indicates that the market is undervalued.
The charts below indicate the historical P/E and dividend yields of the market;
Universe of Coverage:
|
Cytonn Report: Equities Universe of Coverage |
||||||||||||
|
Company |
Price as at 20/02/2026 |
Price as at 27/02/2026 |
w/w change |
m/m change |
YTD Change |
Year Open 2026 |
Target Price* |
Dividend Yield |
Upside/ Downside** |
P/TBv Multiple |
Recommendation |
|
|
I&M Group |
48.4 |
51 |
5.5% |
13.3% |
19.2% |
42.8 |
57.7 |
5.9% |
19.0% |
0.9x |
Accumulate |
|
|
CIC Group |
6.2 |
5.4 |
(13.5%) |
18.6% |
18.1% |
4.5 |
6.2 |
2.4% |
18.1% |
1.5x |
Accumulate |
|
|
Equity Group |
73.3 |
77.3 |
5.5% |
15.3% |
15.3% |
67.0 |
85.3 |
5.5% |
16.0% |
1.3x |
Accumulate |
|
|
NCBA |
88.3 |
92.5 |
4.8% |
0.0% |
8.8% |
85.0 |
101.3 |
5.9% |
15.5% |
1.5x |
Accumulate |
|
|
Diamond Trust Bank |
151.5 |
154.8 |
2.1% |
20.0% |
34.9% |
114.8 |
170.0 |
4.5% |
14.4% |
0.5x |
Accumulate |
|
|
ABSA Bank |
28.5 |
32.2 |
13.2% |
15.2% |
29.6% |
24.9 |
34.9 |
5.4% |
13.8% |
2.1x |
Accumulate |
|
|
Standard Chartered Bank |
336.3 |
362.3 |
7.7% |
16.9% |
20.9% |
299.8 |
366.6 |
12.4% |
13.6% |
2.1x |
Accumulate |
|
|
Co-op Bank |
29.1 |
29.2 |
0.5% |
7.4% |
22.2% |
23.9 |
31.5 |
5.1% |
13.0% |
1.2x |
Accumulate |
|
|
KCB Group |
74.8 |
80.3 |
7.4% |
20.7% |
22.1% |
65.8 |
86.9 |
3.7% |
12.1% |
1.0x |
Accumulate |
|
|
Stanbic Holdings |
253.5 |
256.5 |
1.2% |
29.5% |
29.7% |
197.8 |
262.4 |
8.1% |
10.4% |
1.6x |
Accumulate |
|
|
Jubilee Holdings |
359.0 |
374.5 |
4.3% |
15.2% |
16.1% |
322.5 |
380.0 |
3.6% |
5.1% |
0.6x |
Hold |
|
|
Britam |
11.9 |
12.95 |
8.8% |
33.5% |
42.9% |
9.1 |
13.5 |
0.0% |
4.2% |
1.2x |
Lighten |
|
|
*Target Price as per Cytonn Analyst estimates **Upside/ (Downside) is adjusted for Dividend Yield ***Dividend Yield is calculated using FY’2024 Dividends |
||||||||||||
Weekly Highlights
-
British American Tobacco (BAT) FY’2025 Financial performance
During the week, British American Tobacco Kenya Plc released their FY’2025 financial results, recording a 17.0% increase in Profits after Tax (PAT) to Kshs 5.2 bn, from Kshs 4.5 bn recorded in FY’2024. The increase in PAT was mainly attributed to the 14.6% decrease in the cost of sales to Kshs 15.7 bn in FY’2025, from Kshs 18.4 bn recorded in FY’2024, as well as the 123.6% decrease in the finance cost to a finance income of Kshs 0.2 bn, from a finance loss of Kshs 0.8 bn in FY’2024 which outweighed the 12.5% decrease in the gross sales to Kshs 35.9 bn from Kshs 41.1 bn. The tables below show the breakdown of BAT’s FY’2025 financial performance;
|
Cytonn Report: British American Tobacco (BAT) Summarized Income Statement |
|||
|
Income Statement |
FY'2024 Kshs (bn) |
FY'2025 Kshs (bn) |
Y/Y Change |
|
Gross Sales including Indirect Taxes |
41.1 |
35.9 |
(12.5%) |
|
Excise Duty and Value-Added Taxes |
(15.4) |
(12.8) |
(17.0%) |
|
Net Revenue |
25.7 |
23.2 |
(9.8%) |
|
Cost of operations |
(18.4) |
(15.7) |
(14.6%) |
|
Profit from operations |
7.3 |
7.5 |
2.2% |
|
Net Finance Costs |
(0.8) |
0.2 |
(123.6%) |
|
Profit Before Income Tax |
6.5 |
7.7 |
18.3% |
|
Income Tax Expenses |
(2.0) |
(2.4) |
21.2% |
|
Profit After Tax |
4.5 |
5.2 |
17.0% |
|
Dividend Per Share (Kshs) |
50.0 |
70.0 |
40.0% |
|
Dividend Yield |
13.3% |
13.0% |
(0.3%) points |
|
Dividend Payout |
111.5% |
133.4% |
21.9% points |
|
Earnings Per Share (Kshs) |
44.8 |
52.5 |
17.0% |
Source: British American Tobacco (BAT) Kenya Plc FY’2025 Financial Report
|
Cytonn Report: British American Tobacco Plc (BAT) Summarized Balance Sheet |
|||
|
Balance Sheet |
FY'2024 |
FY'2025 |
Y/Y Change |
|
Kshs (bn) |
Kshs (bn) |
||
|
Current Assets |
13.6 |
13.9 |
2.2% |
|
Non-Current Assets |
10.1 |
9.7 |
(3.7%) |
|
Total Assets |
23.7 |
23.6 |
(0.3%) |
|
Current Liabilities |
6.0 |
6.2 |
2.9% |
|
Non-Current Liabilities |
1.9 |
1.9 |
0.3% |
|
Total Liabilities |
7.9 |
8.1 |
2.3% |
|
Total Equity |
15.7 |
15.5 |
(1.6%) |
Source: British American Tobacco (BAT) Kenya Plc FY’2025 Financial Report
Key take outs from the financial performance include;
-
Net Revenue decreased by 9.8% to Kshs 23.2 bn in FY’2025 from Kshs 25.7 bn in FY’2024, mainly attributed to a 12.5% decline in gross sales to Kshs 35.9 bn from Kshs 41.1 bn recorded in FY’2024.
-
Net finance costs decreased significantly by 123.6% to a net finance income of Kshs 0.2 bn in FY’2025, from a net finance loss of Kshs 0.8 bn in FY’2024. This reversal was largely attributable to Kenyan Shilling stability against the US Dollar and prudent cash management.
-
Cost of operations decreased by 14.6% to Kshs 15.7 bn in FY’2025, from Kshs 18.4 bn in FY’2024, mainly attributed to lower sales volumes, effective cost management and productivity initiatives implemented during the period.
-
The Group’s balance sheet position weakened slightly, with total assets decreasing by 0.3% to Kshs 23.6 bn in FY’2025, from Kshs 23.7 bn in FY’2024, mainly attributable to a 3.7% decrease in non-current assets to Kshs 9.7 bn, from Kshs 10.1 bn, which weighed down a 2.2% increase in current assets to Kshs 13.9 bn, from Kshs 13.6 bn in FY’2025, suggesting asset disposals or depreciation-related declines,
-
The Group’s total liabilities increased by 2.3% to Kshs 8.1 bn in FY’2025, from Kshs 7.9 bn in FY’2024, driven by a 2.9% increase in current liabilities to Kshs 6.2 bn, from Kshs 6.0 bn and 0.3% increase in non-current liabilities to remain relatively unchanged at Kshs 1.9 bn. This reflects increased short-term obligations, possibly linked to trade or operational financing.
-
Earnings per share increased by 17.0% to Kshs 52.5 in FY’2025, from Kshs 44.8 in FY’2024, reflecting enhanced profitability per unit of shareholding. The strong improvement in EPS was largely driven by the significant increase in net earnings during the period, supported by reduced finance cost and effective cost management. The rise in EPS signals improved shareholder value generation and reinforces the Group’s underlying financial strength in the face of a complex operating environment.
-
The Group declared a final dividend of Kshs 60.0, in addition to the interim dividend of Kshs 10.0 translating to a total dividend of Kshs 70.0 in FY’2025, marking a 40.0% increase from the Kshs 50.0 paid in a similar period in FY’2024 translating to 0.3% points decrease in dividend yield to 13.0% from 13.3% and increase in dividend payout ratio by 21.9% points to 133.4% in FY’2025, from 111.5% in FY’2024. The increase in the final dividend payout, alongside a 17.0% increase in earnings per share to Kshs 52.5 from Kshs 44.8, underscores the Group’s strong profitability, liquidity position and reflects enhanced value delivered to shareholders during the period.
BAT’s profit after tax increased by 17.0% to Kshs 5.2 bn in FY’2025, up from Kshs 4.5 bn recorded in FY’2024, marking a significantly improved full year performance. The growth in profitability was largely driven by a 14.6% decline in the cost of operations to Kshs 15.7 bn in FY’2025 from Kshs 18.4 bn in FY’2024. Additionally, the bottom line was supported by a 123.6% decrease in net finance costs, which shifted to a net finance income of Kshs 0.2 bn in FY’2025 from a net finance loss of Kshs 0.8 bn in FY’2024, reflecting favourable changes in financing dynamics. Despite the improved earnings, BAT continues to operate in a challenging environment marked by regulatory and market pressures. In particular, the ongoing consideration of the Tobacco Control (Amendment) Bill, 2024 by Parliament of Kenya introduces potential changes to approval requirements, marketing restrictions, and compliance obligations for nicotine products, creating uncertainty around future operating conditions and investment planning. At the same time, persistent illicit trade in tobacco products continues to erode legitimate market share, distort pricing dynamics, and place downward pressure on volumes in the formal sector. Together, these factors are shaping the company’s strategic decisions as it seeks to safeguard shareholder value and optimize resource allocation in an evolving regulatory and competitive landscape.
Looking ahead, profit margins remain under pressure due to persistent market distortions from illicit cigarette trade, weak legal sales volumes, and continued exposure to exchange-rate movements given the Group’s significant export contribution. Nevertheless, BAT’s disciplined cost management, operational efficiencies, and focus on protecting pricing in the formal market are expected to partly cushion the impact of these structural pressures. Furthermore, the Group’s consistent dividend policy is likely to support investor sentiment in the stock despite ongoing domestic demand softness and enforcement gaps that continue to undermine the legal tobacco market.
Monthly Highlights
-
During the month, Kenya Power & Lighting Company Plc (KPLC) released its HY’2026 financial results, recording an 4.3% increase in profitability to Kshs 10.4 bn, up from Kshs 10.0 bn in HY’2025. The performance was mainly attributable to a 5.9% increase in gross profit to Kshs 38.2 bn, from Kshs 36.0 bn in HY’2025 coupled with a 25.0% decrease in finance costs to Kshs 1.5 bn from the Kshs 2.0 bn in H1’ 2025. For more information, please see our Cytonn Weekly #05/2026
-
During the month, Kenya Electricity Generating Company (KenGen), released its H1'2026 financial results for the period ended 31st December 2025, recording a profit after tax of Kshs 4.2 bn, a 20.2% decrease from the Kshs 5.3 bn recorded in H1’2025, majorly attributable to the 7.4% increase in operating expenses to Kshs 19.0 bn from Kshs 17.7 bn recorded in H1’2025, which was mainly driven by higher depreciation expense arising from additional asset capitalization as well as increased plant operating and steam costs. For more information, please see our Cytonn Weekly #06/2026.
-
During the month, Leapfrog Investments revealed plans to acquire 24.1% minority stake of ICEA Lion Insurance Holdings valued at Kshs 2.4 bn. This comes after the Competition Authority of Kenya approved a 24.1% acquisition of ICEA Lion by Eastern Africa Holdings Limited in October 2025. For more information, please see our Cytonn Weekly #07/2026
-
During the month, Limuru Tea Plc issued its third consecutive profit warning on February 27, 2026, notifying shareholders that its net earnings for the year ended December 31, 2025, are expected to be at least 25.0% lower than the previous year. According to the board, this projected decline is primarily due to high labour and operational costs and lower tea prices realized at the Mombasa Tea Auction during the period under review.
-
During the month, CIC Insurance Group issued a profit warning on February 24, 2026, signaling that its 2025 full-year profit is projected to drop by at least 25.0% compared to the Kshs 2.9 bn reported in 2024. The group attributed the downturn to the non-recurrence of a one-off gain of Kshs 1.0 bn from their Kiambu land revaluation surplus recorded in 2024, alongside elevated insurance claims and higher finance costs.
We maintain a “cautiously optimistic” short-term outlook supported primarily earnings-led attractive valuations, lower yields on short-term government papers and expected global and local economic recovery, and, “neutral” in the long term as persistent foreign investor outflows continue to constrain market liquidity and limit broad-based market re-rating. With the market currently trading at par to its future growth (PEG Ratio at 1.0x), where performance will be driven by company-specific fundamentals rather than general market direction, we believe that investors should reposition towards value stocks exhibiting strong earnings growth, attractive dividend yields, solid balance sheets, sustainable competitive advantages and trading at compelling discounts to their intrinsic value. While foreign investor sell-offs are expected to continue exerting pressure in the near term, we believe this will create selective entry opportunities for long-term investors.
-
Statutory Review
There were two notable highlights during the month.
-
The National Infrastructure Fund Bill, 2025 seeks to establish a statutory framework for the creation and operation of a National Infrastructure Fund (NIF). Its primary objective is to mobilise, manage and deploy long-term capital for infrastructure development. By formalising infrastructure financing within a legally recognised institutional structure, the Bill attempts to move away from fragmented, project-by-project financing toward a consolidated national investment mechanism. This is the second bill under the current regime that will directly impact the real estate sector after the Affordable Housing Bill of 2023. For more information, please see our Cytonn Weekly #07/2026,
-
During the month, the Nairobi City County Government announced plans to redesign and replan Westlands following a surge in high-rise developments that has strained infrastructure and social amenities in the area. The county has advertised a tender for the preparation of a Local Physical and Land Use Development Plan for the Westlands zone, which will guide and regulate future developments after City Hall noted that construction activity had deviated from the area’s original low- to medium-rise residential zoning. For more information, please see our Cytonn Weekly #05/2026,
The National Infrastructure Fund Bill, 2025 presents a potentially transformative opportunity to institutionalize long-term infrastructure financing in Kenya by creating a structured, professionally managed vehicle capable of pooling capital, accelerating project delivery, improving preparation standards, and crowding in private sector participation beyond the constraints of annual budget allocations. At the same time, the model introduces material risks that require careful scrutiny: it could enable off-balance sheet borrowing and the accumulation of contingent liabilities if not fully integrated into the national debt framework; political influence may distort project selection and weaken commercial discipline; overlapping mandates may duplicate existing institutions and complicate delivery; and channeling domestic pension and insurance capital into large, illiquid projects could expose savers to concentration and performance risks. The ultimate impact of the Bill will therefore depend not only on its developmental ambition, but on the robustness of its governance architecture, fiscal transparency, and oversight safeguards.
-
Industry Reports
-
Kampala and Dar es Salaam Outperform Nairobi in Prime Office Yields
Nairobi posted lower yields on prime office rents than Kampala and Dar es Salaam in the second half of 2025, according to Knight Frank data, with average yields at 8.0% compared with 9.0% in both cities. Prime office rents averaged USD 13.0 per SQM per month in Nairobi, USD 16.5 in Kampala, and USD 15.0 in Dar es Salaam. Kenya’s office market continued to record stagnated growth during the period, although Grade A occupancy rose from 77.7% to 80.3%, with rents remaining broadly flat.
The performance gap highlights stronger rental returns in Kampala and Dar es Salaam, supported by sustained tenant demand and higher occupancy levels. In Kampala, more than 100,000 SQM of new office space is expected by the end of 2025, while Tanzania’s occupancy rose to about 80.0% from 76.0% in the first half of the year. Across the three markets, landlords are offering incentives such as fit out contributions and rent-free periods, with demand shifting toward flexible workspaces and smaller office units.
The lower prime office yields and flat rental growth in Nairobi imply a relatively stable but subdued market for residents and businesses. With landlords facing limited pricing power despite rising occupancy, tenants are likely to benefit from steady rents and continued incentives such as rent-free periods and fit out contributions. However, the weaker performance compared to Kampala and Dar es Salaam may signal slower momentum in new office developments, pointing to cautious investment activity rather than rapid expansion in Nairobi’s commercial property sector.
b) Tana River Launches Ambitious Kshs 39.0 bn Organic City Project
During the week, Tana River County announced plans to develop a Kshs 39.0 bn organic city comprising 25,000 modern housing units, alongside agribusiness and renewable energy projects. The proposed development will integrate residential areas with commercial spaces and green zones, with county officials saying it will operate on clean energy and environmentally sustainable systems. The project is expected to run for 12 years and is positioned as a flagship urban transformation plan for the coastal county.
The initiative signals growing investment in large scale, master planned urban developments outside Kenya’s major cities, reflecting efforts by county governments to attract capital and expand local economic activity. If implemented as outlined, the project could stimulate construction, agribusiness value chains, and renewable energy uptake while reshaping Tana River’s property market and positioning it as an emerging investment destination.
We expect the Tana River to drive positive development outcomes, supported by a combination of large-scale housing, agribusiness opportunities, and renewable energy initiatives. The integration of residential, commercial, and green spaces reflects growing interest in sustainable urban development outside Kenya’s major cities. However, challenges such as long implementation timelines, infrastructure gaps, and funding constraints could limit the project’s full impact on the county’s economic and property growth
|
Cytonn Report: Notable Industry Reports during February 2026 |
|||
|
# |
Theme |
Report |
Key Take-outs |
|
1 |
Real Estate, Hospitality, Building and Construction |
Knight Frank report for Kenya market update H2’2025 |
In the residential sector, the average selling prices for prime housing units increased by 6.2% points in H2’2025, the performance was lower than the 8.3% surge recorded in H2’2024. The average monthly asking rents for prime commercial office spaces remained relatively unchanged at USD 1.2 per SQFT in H2’2025 from H2’2024. Commercial office space occupancy slightly increased by 5.0% to 81.6% in H1’2025 from 77.7% recorded in H1’2024. For more information, please see our Cytonn Weekly #05/2026 |
|
2 |
Hospitality, Building and Construction |
KNBS LEI report for December 2025 |
In December 2025, cement consumption reached 938,302 metric tonnes, representing a 24.7% y/y increase from the same month in 2024. Month-on-month, consumption decreased by 1.4%, to 938,302 from 951,901 in November 2025 reflecting a decline in momentum in the construction sector. The y/y performance was anchored by (i) continued private sector construction activity in urban hubs such as Nairobi, Mombasa, and Kisumu, (ii) government-led infrastructure investments under the Bottom-Up Economic Transformation Agenda (BETA), including roads, affordable housing, water, and sanitation projects, and (iii) public works initiatives in rural and semi-urban areas, which both support livelihoods and expand critical infrastructure. For more information, please see our Cytonn Weekly #07/2026 |
-
Hospitality Sector
There was one notable hospitality highlight during the month;
-
During the month, airlines began auditing the financial impacts of the strike by Kenya Aviation Workers Union (KAWU) which disrupted operations at Jomo Kenyatta International Airport, affecting seven carriers, leading to aircraft groundings, flight cancellations, and passenger refunds. Jambojet operated 23 return flights out of the scheduled 64 return flights between Monday and Tuesday, with approximately 5,000 passengers affected over the two days. For more information please see our Cytonn Weekly #07/2026
We expect the hospitality sector to record positive performance, supported by a combination of rising international and domestic tourism demand, stronger investment interest, and strategic positioning as a hub for both leisure and business travel. The launch of direct charter flights from Budapest, Hungary, to Mombasa, Kenya, reflect a growing interest in Kenya’s coastal tourism from Eastern Europe in January 2026. However, inconsistent infrastructure in rural areas and financial constraints in urban markets remain key challenges that could limit the sector’s optimal growth.
-
Infrastructure Sector
i) Kenya Revives Standard Gauge Railway
Kenya will next month resume construction of its stalled Standard Gauge Railway (SGR) extension but without taking new sovereign loans from Beijing. Instead, the government plans to raise up to Kshs 516.1 bn (USD 4.0 bn) by securitizing its 2.0% Railway Development Levy (RDL) on imports to fund the remaining 369.0 km stretch from Suswa to Kisumu and onward to Malaba at the Ugandan border. The final leg is estimated to cost about Kshs 645.1 bn (USD 5 bn) and would complete a corridor long envisioned as a regional trade artery linking Kenya to landlocked East Africa.
The original Mombasa-Nairobi line, completed in 2017 at roughly Kshs 464.5 bn (USD 3.6 bn), and the 2019 extension to Naivasha, costing about Kshs 193.5 bn (USD 1.5 bn), were largely financed by Chinese loans. Construction of the western leg halted in 2019 when funding ran out, leaving the line incomplete and turning it into a symbol of Kenya’s rising debt burden amid a global slowdown in Chinese Belt and Road financing, which has exceeded Kshs 15,482.4 bn (USD 120 bn) across Africa. Kenya currently spends around Kshs 129.0 bn (USD 1.0 bn) annually servicing Chinese loans, though a recent shift from dollar- to yuan-denominated debt reduced yearly costs by roughly Kshs 27.7 bn (USD 215.0 mn.)
Rather than take on new external debt, Kenya’s securitization plan effectively borrows against future import levy revenue, turning anticipated domestic tax collections into upfront construction funding. This allows Nairobi to continue critical infrastructure development while limiting foreign-exchange exposure and addressing political concerns over additional borrowing, especially after widespread protests in 2024 against tax hikes and economic hardship. The IMF is monitoring whether the structure counts as public debt, highlighting the delicate balance between financing and fiscal responsibility.
We expect the western extension, if completed and operationally efficient, to deepen trade integration with Uganda and the wider East African region, increase freight volumes and reinforce Kenya’s position as a regional logistics gateway. This could stimulate industrial growth along the corridor particularly around Naivasha and Kisumu, while boosting demand for warehousing, logistics parks and mixed-use developments as land values rise near key stations and inland depots. However, these gains hinge on execution and sustained trade flows. If projected volumes fail to materialize or regional connectivity remains incomplete, Kenya may face prolonged levy-backed repayments without fully capturing the anticipated economic and real estate upside.
There were two notable highlights during the month
-
During the month, the Government of Kenya stepped up preparations for the construction of two expressways linking Kenya to Uganda, aimed at easing congestion and improving trade efficiency along the Northern Corridor. A consortium comprising CPCS of Canada and Avatech Engineering of Kenya commenced pre-feasibility studies to expand the 243-kilometre Mau Summit-Eldoret-Malaba highway from a two-lane road to a four-lane dual carriageway under a Public-Private Partnership (PPP) model, with the study funded by the Asia Infrastructure Investment Bank (AIIB). The project will complement the Kshs 170.0 bn Rironi-Mau Summit dual carriageway, strengthening road connectivity to Uganda and the wider Great Lakes region. For more information please see our Cytonn Weekly #05/2026.
-
During the month, the National Social Security Fund (NSSF) took a Kshs 9.5bn stake in Nairobi-Nakuru toll road, marking its first investment in a public road as part of a diversification strategy. The state-owned pension fund is participating through a consortium with China Road and Bridge Corporation (CRBC), contributing 40.0% of the equity portion for the section of the highway they are developing together. The overall 170.0bn project is split between two Chinese firms with the other section awarded to Shandong Hi-Speed Road and Bridge International Engineering (SDRBI). For more information please see our Cytonn Weekly #06/2026
We expect the infrastructure sector to be supported by a combination of new road projects like the issuance of the Kshs 175.0 bn infrastructure bond in February 2026 which will help pay pending bills and facilitate resumption of works and completion of the funding agreements and compensation processes in preparation of extension of the Naivasha-Malaba SGR project will typically influence land values and development activity along the corridor. We also expect that the reopening of the Kijabe railway line will go beyond disaster recovery and signals progress in building a more resilient and efficient infrastructure system in Kenya. It strengthens freight logistics, supports regional trade, and reduces pressure on roads, all while aligning with sustainable transport objectives.
-
Mixed-Use Development Sector
i) MRE Unveils Kshs 400.0 mn Mall Project in Eastlands
During the week, McCullogh Real Estate Limited commenced construction of Manyanja Mall, a Kshs 400.0 mn mixed use commercial development in Nairobi’s Eastlands area. The project will include a supermarket anchor, petrol station, convenience retail outlets, pharmacy and healthcare services, food and beverage outlets, flexible units for small and medium enterprises, and family recreational areas. The investment covers land acquisition and construction, with about 80.0% of the retail space already pre-leased. Completion is scheduled for August 2026. The developer says the mall will cluster complementary services in one location to drive daily foot traffic and serve the area’s growing residential population.
The project covers both land acquisition and construction costs and is strategically positioned to serve Eastlands’ growing population base. Its integrated design clusters complementary services within one location to enhance consumer convenience and drive steady daily foot traffic. The strong pre-leasing levels indicate retailer confidence in the area’s purchasing power and reinforce the viability of community focused retail formats anchored on essential goods and services.
We expect the development to support continued expansion of Nairobi’s retail real estate segment, particularly within residential nodes experiencing population growth. However, rising construction costs, competition from existing and upcoming retail centers, and shifts in consumer spending patterns could influence long term occupancy rates and investment returns. Overall, the project reflects sustained private sector participation in Kenya’s commercial property market despite prevailing macroeconomic headwinds.
There was one notable highlight during the month
-
During the month, the National Social Security Fund (NSSF) announced plans to develop a Ksh30.0 bn mixed-use real estate project in Nairobi’s Central Business District (CBD), comprising office blocks and luxury apartments, as part of efforts to promote a work-and-stay city centre. The proposed development, to be undertaken on NSSF’s 3.85-acre parcel along Kenyatta Avenue, will consist of twin towers of 35 and 60 floors, and will also incorporate conference facilities, retail space, and a hotel, with the 60-storey tower expected to be the tallest building in Nairobi.
We expect the proposed mixed-use development to support the revitalisation of the Nairobi CBD by increasing residential presence, encouraging longer activity hours, and strengthening demand for retail, hospitality, and office space within the city centre, while potentially setting a benchmark for large-scale, institution-led mixed-use developments in the CBD.
-
Real Estate Investments Trusts
-
REITs Weekly Performance
On the Unquoted Securities Platform, Acorn D-REIT and I-REIT traded at Kshs 27.4 and Kshs 23.2per unit, respectively, as per the last updated data on 27th February 2025. The performance represented a 33.4% and 14.5% gain for the D-REIT and I-REIT, respectively, from the Kshs 20.0 inception price. The volumes traded for the D-REIT and I-REIT came in at 13.4 mn and 42.0 mn shares, respectively. Additionally, ILAM Fahari I-REIT traded at Kshs 11.0 per share as of 27th February, representing a 45.0% loss from the Kshs 20.0 inception price. The volume traded to date came in at 1.2 mn shares for the I-REIT, REITs offer various benefits, such as tax exemptions, diversified portfolios, and stable long-term profits. However, the ongoing decline in the performance of Kenyan REITs and the restructuring of their business portfolios are hindering significant previous investments. Additional general challenges include
REITs offer various benefits, such as tax exemptions, diversified portfolios, and stable long-term profits. However, the ongoing decline in the performance of Kenyan REITs and the restructuring of their business portfolios are hindering significant previous investments. Additional general challenges include:
-
Insufficient understanding of the investment instrument among investors leading to a slower uptake of REIT products,
-
Lengthy approval processes for REIT creation,
-
High minimum capital requirements of Kshs 100.0 mn for REIT trustees compared to Kshs 10.0 mn for pension funds Trustees, essentially limiting the licensed REIT Trustee to banks only
-
The rigidity of choice between either a D-REIT or and I-REIT forces managers to form two REITs, rather than having one Hybrid REIT that can allocate between development and income earning properties
-
Limiting the type of legal entity that can form a REIT to only a trust company, as opposed to allowing other entities such as partnerships, and companies,
-
We need to give time before REITS are required to list – they would be allowed to stay private for a few years before the requirement to list given that not all companies maybe comfortable with listing on day one, and,
-
Minimum subscription amounts or offer parcels set at Kshs 0.1 mn for D-REITs and Kshs 5.0 mn for restricted I-REITs. The significant capital requirements still make REITs relatively inaccessible to smaller retail investors compared to other investment vehicles like unit trusts or government bonds, all of which continue to limit the performance of Kenyan REITs.
We expect the performance of Kenya’s real estate sector to remain resilient, supported by several factors: i) Large-scale county-led developments such as Tana River’s KSh39.0 bn organic city, which integrates 25,000 housing units, commercial spaces, agribusiness, and renewable energy projects ii) private sector projects like MRE’s Kshs 400 mn Manyanja Mall in Eastlands, Nairobi, featuring a supermarket anchor, retail outlets, flexible SME units, and family recreational spaces, with about 80.0% of retail space already pre-leased. However, challenges such as rising construction costs, infrastructure constraints, weak investor appetite in listed REITs such as ILAM Fahari I-REIT, oversupply in select real estate classes, and high capital demands will continue to impede the sector’s optimal performance.
Disclaimer: The views expressed in this publication are those of the writers where particulars are not warranted. This publication, which is in compliance with Section 2 of the Capital Markets Authority Act Cap 485A, is meant for general information only and is not a warranty, representation, advice, or solicitation of any nature. Readers are advised in all circumstances to seek the advice of a registered investment advisor.

- Talk to us
- Kenya
- P.O Box 20695 - 00200, Nairobi, Kenya
- Cell +254709101200
- Tel +254709101200
- WhatsApp +254741676635
- United States
- +254709101200
- DOWNLOAD OUR APP
-


- Kenya
- 8th Floor, Pinetree Plaza, Kaburu Drive, Ngong Road, Nairobi, Kenya
- USA
- Suite 1150, 1775 Eye Street NW, USA, Washington DC 20006, USA
- Investments
- High Yield
- Private Equity
- Real Estate
- Real Estate
- RiverRun Estates
- Cytonn Towers
- The Ridge
- Taraji Heights
- The Alma