Cytonn Monthly - April 2018
By Cytonn Research Team, May 6, 2018
Executive Summary
Fixed Income
During the month of April, T-bill auctions recorded an oversubscription, with the average subscription rate coming in at 115.7%, a decline from 141.2% recorded in March. The yield on the 91 and 364-day papers remained unchanged at 8.0% and 11.1%, respectively, while the yields on the 182-day paper declined by 10 bps to 10.3% from 10.4% the previous month. The inflation rate for the month of April declined to 3.7%, from 4.2% in March, its lowest level since January 2013, driven by a slowdown in food inflation to 0.3% from 2.2% in March on account of improved weather conditions;
Equities
During the month, the equities market was on a downward trend, with NASI, NSE 20 and NSE 25 losing 6.1%, 2.9%, and 7.1%, respectively, taking their YTD performance to 4.9%, 0.6% and 5.8%. For the last twelve months (LTM), NASI, NSE 20 and NSE 25 gained 34.7%, 18.0% and 35.6%, respectively. SBM Bank Kenya Ltd completed the acquisition of certain assets and liabilities of Chase Bank Limited, which was under receivership;
Private Equity
During the month of April, we witnessed increased private equity activity through fundraising majorly in the Technology and FinTech sector. International Finance Corporation (IFC), alongside Orange Digital Ventures led a series A equity investment in Kenya’s mobile tech company Africa’s Talking. FinTech lending companies Branch International and Tala each raised capital through Series B and Series C funding, respectively. In Real Estate, South African mezzanine fund manager Vantage Capital, acquired an undisclosed stake in the Rosslyn Riviera Shopping Mall located along Limuru Road Nairobi;
Real Estate
The real estate sector continued to show signs of recovery with increased activity being witnessed across all themes as follows; (i) In residential, Cytonn Real Estate and Krishna Developers broke ground on projects in Ruiru and Thindigua, respectively, (ii) In the commercial sector, French based retailer, Carrefour opened a new store at Sarit Center in Westlands, and announced plans to open another store in Village Market, and (iii) In hospitality, Swiss Hotelier, Movenpick Hotels and Resorts launched its first hotel in Kenya, The Movenpick Hotels and Residences Nairobi, along Mkungu Close in Westlands Area, Nairobi.
- Cytonn Investments Management Plc and Cytonn Cash Management Solutions LLP, shall hold their Annual General Meeting for the year that ended December 2017, on Friday, 18th May 2018, at 7:30 am at Radisson Blu Hotel, Upperhill. See the agenda here
- Cytonn Diaspora hosted an investment forum in London for Kenyans in the UK interested in investing back in Kenya. For more information, email diaspora@cytonn.com
- Our Chief Investments Officer Elizabeth Nkukuu, discussed the expectations from President Uhuru Kenyatta's State of the Nation address. Watch Elizabeth on NTV here
- Our Senior Investments Manager, Maurice Oduor discussed the expected economic areas of focus by President Uhuru Kenyatta's State of the Nation address. Watch Maurice on Citizen TV here
- Our Senior Investments Analyst, Caleb Mugendi, discussed the performance of the Kenyan Shilling. Watch Caleb on CNBC here
- We continue to hold weekly workshops and site visits on how to build wealth through real estate investments. The weekly workshops and site visits target both investors looking to invest in real estate directly and those interested in high yield investment products to familiarize themselves with how we support our high yields. Watch progress videos and pictures of The Alma, Amara Ridge, The Ridge, and Taraji Heights. Key to note is that our cost of capital is priced off the loan markets, where all-in pricing ranges from 16.0% to 20.0%, and our yield on real estate developments ranges from 23.0% to 25.0%, hence our top-line gross spread is about 6.0%. If interested in attending the site visits, kindly register here
- We continue to see very strong interest in our weekly Private Wealth Management Training (largely covering financial planning and structured products). The training is at no cost and is open only to pre-screened participants. We also continue to see institutions and investment groups interested in the trainings for their teams. The Wealth Management Trainings are run by the Cytonn Foundation under its financial literacy pillar. If interested in our Private Wealth Management Training for your employees or investment group please get in touch with us through wmt@cytonn.com or book through this link Wealth Management Training. To view the Wealth Management Training topics, click here
- For recent news about the company, see our news section here
- We have 10 investment-ready projects, offering attractive development and buyer targeted returns of around 23.0% to 25.0% p.a. See further details here: Summary of Investment-Ready Projects
- We continue to beef up the team with ongoing hires for: Full Stack Software Engineer, Application Security Engineer and Distribution and Unit Managers for Nakuru and Kisumu, among others. Visit the Careers section at Cytonn’s Website to apply
During the month of April, T-bill auctions recorded an oversubscription, with the average subscription rate coming in at 115.7%, a decline from 141.2% recorded in March. The subscription rates for the 91, 182 and 364-day papers came in at 68.5%, 109.1% and 141.1%, from 102.9%, 126.4% and 171.8%, the previous month, respectively. The yields on the 91 and 364-day papers remained flat at 8.0% and 11.1%, respectively, while the yield on the 182-day paper declined by 10 bps to 10.3% from 10.4% the previous month. The T-bills acceptance rate came in at 87.9% during the month, compared to 86.9% in March, with the Kenyan Government accepting a total of Kshs 97.6 bn of the Kshs 111.0 bn worth of bids received, indicating that bids were largely within ranges the Central Bank of Kenya (CBK) deemed acceptable. The government is currently ahead of its domestic borrowing target for the current fiscal year, having borrowed Kshs 324.1 bn, against a target of Kshs 251.8 bn (assuming a pro-rated borrowing target throughout the financial year of Kshs 297.6 bn).
This week, T-bills were oversubscribed with a subscription rate coming in at 136.8%, compared to 106.1% recorded the previous week. Yields on the 91, 182 and 364-day papers remained unchanged at 8.0%, 10.3% and 11.1%, respectively. The acceptance rate increased to 81.1%, from 76.7% the previous week, with the government accepting Kshs 26.6 bn of the Kshs 32.8 bn worth of bids received.
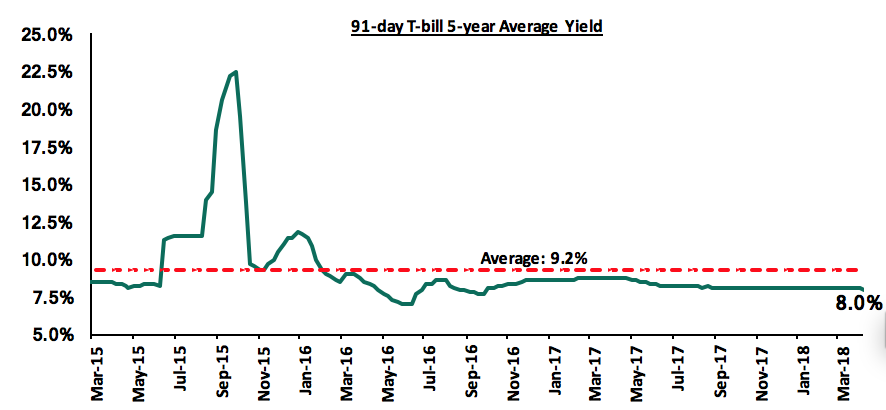
The 91-day T-bill is currently trading at 8.0%, which is below its 5-year average of 9.2%. The lower yield on the 91-day paper is mainly attributable to the low interest rate environment experienced since the passing of the law capping interest rates. We expect this to continue in the short-term, given (i) the discipline of the CBK in stabilizing interest rates in the auction market by rejecting aggressive bids that are priced above market, for both T-bills and T-bonds, and (ii) the government being under no pressure to borrow from the local market as it is currently ahead of its domestic borrowing target, and from the foreign markets where it has met approx. 86.1% of its prorated target.
Liquidity levels declined in the money market as indicated by the increase in the average interbank rate to 4.84% from 4.75% recorded the previous week, following net payments for government securities and tax remittances by banks. There was an increase in the average volumes traded in the interbank market by 7.2% to Kshs 14.8 bn, from Kshs 13.8 bn the previous week.
During the month, the Kenyan Government re-opened two bonds, FXD 1/2008/15 and FXD 1/2018/20, with 4.9 years and 19.9 years to maturity, and coupons of 12.5% and 13.2%, respectively, in a bid to raise Kshs 40.0 bn for budgetary support. The overall subscription rate for the issue came in at 81.9%, with the market weighted average bid rates coming in at 12.3% and 13.3%, respectively, in line with our expectations. The government accepted only Kshs 26.9 bn of the Kshs 32.8 bn worth of bids received, translating to an acceptance rate of 82.2%. We do not expect the government to come under pressure to borrow for the current fiscal year given they are ahead of their domestic borrowing target and have also borrowed approximately 86.1% of their pro-rated foreign borrowing target.
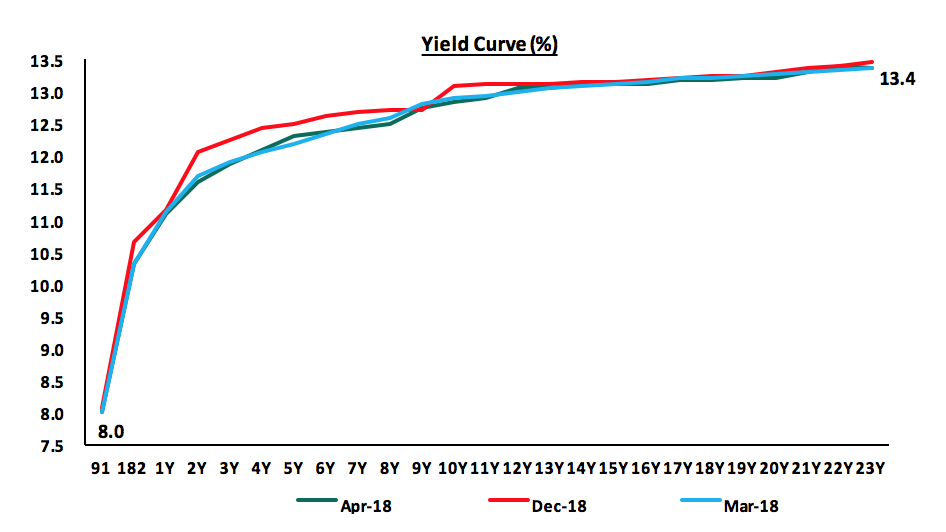
The yields on government securities in the secondary market remained relatively stable during the month as Central Bank continues to reject expensive bids in the primary market. According to the FTSE NSE Bond Index, Treasury bonds listed at the Nairobi Securities Exchange (NSE) gained 1.4% during the month, bringing the YTD performance to 4.0%.
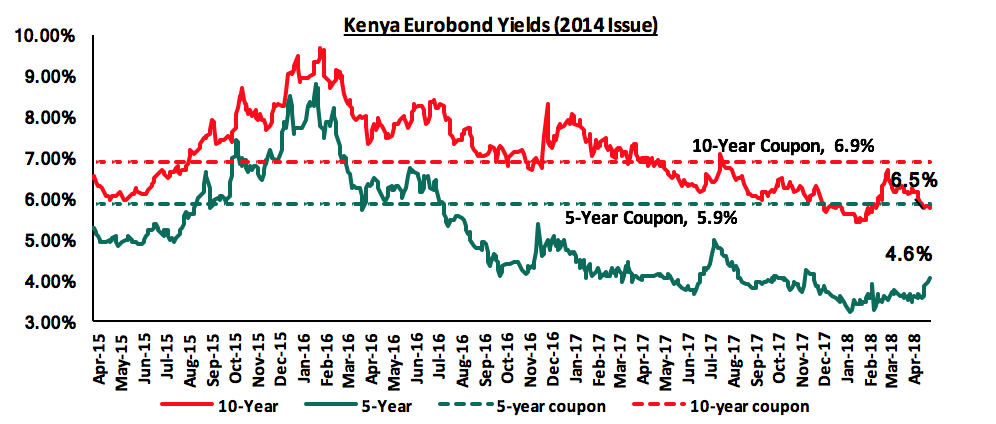
According to Bloomberg, the yield on the 5-year Eurobond issued in June 2014 increased by 60 bps to 4.1% during the month of April from 3.5% in March, while the yield on the 10-year Eurobond (2014) increased by 20 bps to close at 6.1% from 5.9% during the same period. During the week, yield on the 5-year and 10- Year Eurobonds issued in 2014 rose by 50 bps and 40 bps to 4.6% and 6.5% from 4.1% and 6.1%, respectively. Since the mid-January 2016 peak, yields on the Kenya Eurobonds have declined by 4.2% points and 3.2% points for the 5-year and 10-year Eurobonds, respectively, due to the relatively stable macroeconomic conditions in the country. Key to note is that yields on Kenya Eurobond have recently been increasing on account of varying market sentiments.
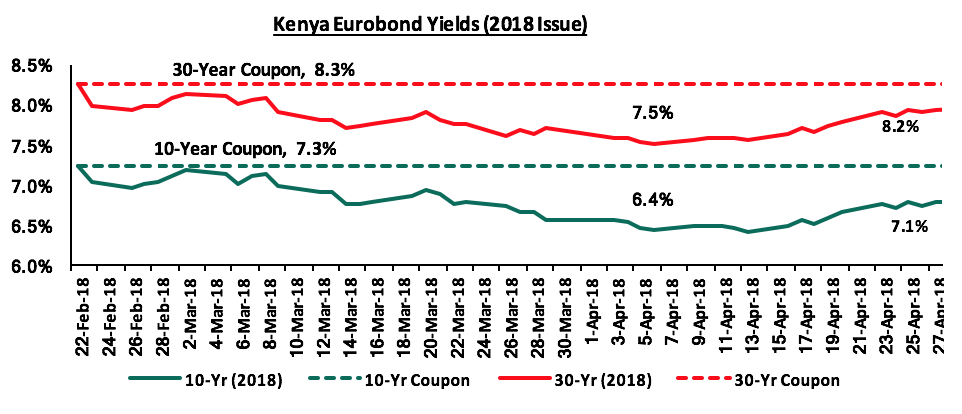
During the month, the yields on the 10-year and 30-Year Eurobond issued in February increased by 20 and 30 bps to 6.8% and 8.0% from 6.6% and 7.7% in March, respectively. During the week, the yields on the 10-year and 30-year Eurobonds increased by 30 bps and 20 bps to 7.1% and 8.2% from 6.8% and 7.9% last week, respectively. Since the issue date, yields on the 10-year and 30-year Eurobonds have declined by 0.1% points each indicating foreign investor confidence in Kenya’s macro-economic prospects.
The Kenya Shilling appreciated by 0.5% against the US Dollar during the month of April to Kshs 100.4, from Kshs 100.8 at the end of March, mainly as a result of increased offshore investor inflows, which stood at USD 222.2 mn in March 2018. During the week, the Shilling gained 0.1% against the USD to Kshs 100.2 from Kshs 100.3, the previous week, on the back of increased dollar supply from offshore investors. On a YTD basis, the shilling has gained 2.9% against the USD. In our view, the shilling should remain relatively stable against the dollar in the short term, supported by:
- Stronger horticulture export inflows driven by increasing production and improving global prices,
- Improving diaspora remittances, which increased by 47.5% to USD 210.4 mn in February 2018 from USD 142.7 mn in February 2017, and,
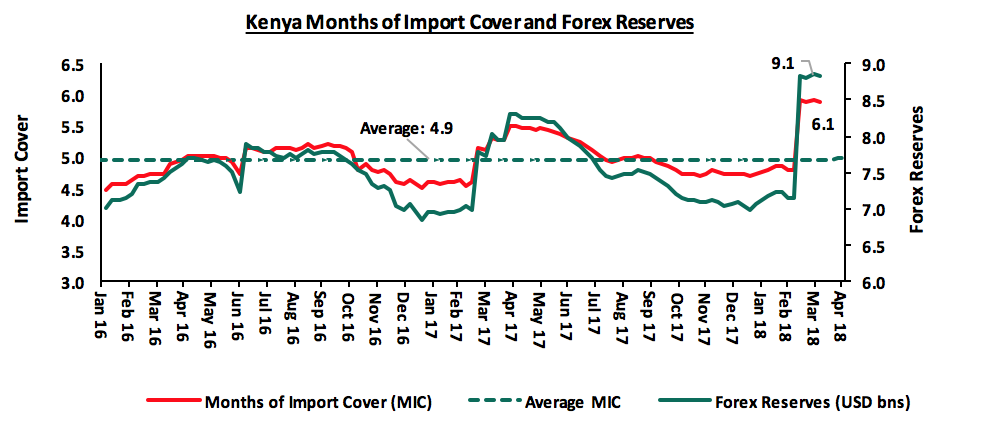
- High forex reserves, currently at USD 9.1 bn (equivalent to 6.1 months of import cover), and the USD 1.5 bn stand-by credit and precautionary facility by the IMF, still available until September 2018, after which a new facility will be discussed.
The year on year inflation rate for the month of April declined to 3.7%, from 4.2% in March, its lowest level since January 2013 driven by (i) Year on year food inflation declining to 0.3% from 2.2% in March on account of improved weather conditions, while the m/m inflation declined to 1.435% from 1.439% in March attributed to the transport index declining by 0.2%, as a result of reduction in petrol and diesel prices, (ii) Housing, Water, Electricity, Gas and Other Fuels’ Index, increasing by 3.2% in April 2018 compared to 3.8% in March 2018 mainly attributed to significant increase in prices of cooking fuels with charcoal recording the highest increase of 16.9%. Below is a summary of key changes in the Consumer Price Index (CPI) in April;
|
Major Inflation Changes in the Month of February 2018 |
|||
|
Broad Commodity Group |
Price change m/m (April-18/ March-18) |
Price change y/y (April -18/April 17) |
Reason |
|
Food & Non-Alcoholic Beverages |
1.6% |
0.3% |
The increase to 1.6% from 1.5% in March was attributed to an increase in prices of some foodstuffs outweighing decreases recorded in respect of others. |
|
Transport Cost |
-0.2% |
7.0% |
The 0.2% decline in April was on account of reduction in pump prices of petrol and diesel. |
|
Housing, Water, Electricity, Gas and Other Fuels |
3.2% |
11.8% |
The 3.2% change in prices was mainly attributed to a significant increase in prices of cooking fuels with charcoal recording the highest increase of 16.9%. |
|
Overall Inflation |
1.4% |
3.7% |
The decline to 3.7% from 4.2% in March was due to a decline in y/y food inflation which has a CPI weight of 36.0%, to 0.3 from 2.1 in March |
The World Bank released their World Economic Update, April 2018, during the month. As per the update, Kenya’s GDP growth is expected to recover and grow at 5.5% in 2018 and steadily rise to 6.1% by 2020, driven by (i) improved agricultural output on account of better rains, (ii) the improved political climate after the prolonged electioneering period, and (iii) recovery in the global economy. The implementation of the government’s big four agenda, (which focuses on agricultural and food security, real estate and affordable housing, manufacturing, and Universal Health Coverage) is expected to help Kenya advance towards becoming an upper middle-income economy with high standards of living. The growth is however expected to be impacted by the rise in oil prices currently at USD 67.7 per barrel up from USD 66.9 at the end of 2017, and the weak private sector credit growth that stood at 2.1% as at February 2018 following implementation of the rate cap in 2016.Going forward, we expect inflation to average 7.0% over the course of the year down from 8.0% in 2017, which is within the government target range of 2.5% - 7.5%. Upward pressure on the inflation rate is likely to come from fuel and transport prices as the Treasury plans on imposing 16.0% Value Added Tax (VAT) on petroleum products, effective September 2018, as per the deal made with the IMF to reduce the budget deficit.
During the week, Stanbic released their PMI index, which indicated that the private sector had the greatest significant improvement in April since January 2016 with output growth having risen at the fastest rate since the survey’s inception in January 2014. The adjusted PMI rose to 56.4 in April from 55.7 in March driven by favorable macroeconomic conditions and greater inflows from new orders from both external and domestic markets attributed to a higher customer turnout and improved demand. Readings above 50.0 signal an improvement in business conditions on the previous month, while readings below 50.0 show a deterioration. The rate of job growth was solid and the strongest reported since the end of 2016 due to a rise in staffing levels
attributed to firms expanding their capacities in response to the rising output requirements during the month. The private sector however experienced higher input costs due to a general rise in cost of imported raw materials attributed to the strengthening of the US dollar with food and fuel prices also reportedly up since March. Going forward, output is expected to continue rising, driven by a recovery in agricultural produce, mainly horticulture, as the Eurozone, which is Kenya’s main horticultural export destination, continues to recover thus boosting demand. Of concern however, the combination of rising demand with the continued rise in input costs and job growth have the potential to exert meaningful and durable upward pressures on inflation.
The Kenya National Bureau of Statistics (KNBS) released the Economic Survey 2018, with key take-outs from the report being:
- Kenya’s economy grew by 4.9% in 2017, compared to 5.9% in 2016 in line with our expectation of between 4.7% - 5.2%. The decline in performance was attributed to (a) adverse effects of weather conditions due to the widespread drought experienced in Q4’2016 and suppressed long rains in 2017 that led to a decline in agriculture sector growth, and (b) uncertainty associated with the prolonged election period that led to a deceleration of growth in the manufacturing sector. The growth in Q1, Q2 and Q3 came in at 4.7%, 5.0% and 4.4% from 5.9%, 6.2% and 5.7% in 2016, respectively. The first quarter of 2017 suffered from subdued growth in agriculture due to the effects of the 2016/17 drought, while the third quarter’s growth suffered the negative effects of uncertainty in the political environment brought about by the prolonged election period. For more details, see our Kenya 2017 GDP Growth and Outlook Note,
- Exports increased by 2.8% to Kshs 594.1 bn in 2017 from Kshs 578.1 bn in 2016 with the major earners being tea and horticulture, collectively accounting for 49.1% of total domestic export earnings. Despite being the major earners, the total export volumes of tea and horticulture declined by 5.8% to 924,234 tons from 981,542 tons in 2016, on account of the adverse weather conditions experienced in the first half of 2017.
- Imports grew by 20.5% to Kshs 1.7 tn in 2017 from Kshs 1.4 tn in 2016, driven by an increase in importation of industrial machinery, petroleum products, motor vehicles, and iron & steel. Asia accounted for 64.2% of total imports in 2017 with China, India, United Arab Emirates and Saudi Arabia having the lion’s share, accounting for 73.5% of the total Asian imports,
- Average deposit rates increased to 8.2% in December 2017 from 7.3% in December 2016, while commercial bank average lending rates remained unchanged at 13.6% in December 2017. Total domestic credit rose by 7.9% compared to 6.4% in 2016, primarily due to a 12.1% growth in credit to the national government, compared to the decline in private sector credit growth to 2.4% from 4.1% in 2016, indicating increased lending to the government. The slower growth in the financial & insurance sector is mainly attributed to effects of the interest rate cap, eroding interest income earned by banks in 2017.
Below is a table showing that the Kenyan economy is expected to grow at an average of 5.5% in 2018 according to updated projections by the organizations that we track as at Q2’2018, updated with our own projection. We have since revised our GDP growth projection upwards to a range of 5.4% - 5.6%, from 5.3% - 5.5% previously, driven by a recovery in the agriculture and manufacturing sectors, and continued growth in tourism, real estate and construction sectors. We shall continue to update this table as these organizations release their updated 2018 projections:
|
Kenya 2018 Annual GDP Growth Outlook |
|||
|
No. |
Organization |
Q1'2018 |
Q2'2018 |
|
1 |
Central Bank of Kenya | 6.2% | |
|
2 |
Kenya National Treasury | 5.8% | |
|
3 |
Oxford Economics | 5.7% | |
|
4 |
African Development Bank (AfDB) |
5.6% |
|
|
5 |
Stanbic Bank | 5.6% | 5.6% |
|
6 |
Citibank |
5.6% |
|
|
7 |
International Monetary Fund (IMF) |
5.5% |
|
|
8 |
World Bank |
5.5% |
5.5% |
|
9 |
Fitch Ratings |
5.5% |
|
|
10 |
Barclays Africa Group Limited |
5.5% |
|
|
11 |
Cytonn Investments Management Plc |
5.4% |
5.5% |
|
12 |
Focus Economics |
5.3% |
|
|
13 |
BMI Research |
5.3% |
5.2% |
|
14 |
Standard Chartered |
4.6% |
|
|
Average |
5.5% |
5.5% |
|
Rates in the fixed income market have remained stable as the government rejects expensive bids. With the government under no pressure to borrow for this fiscal year as (i) they are currently ahead of their pro-rated domestic borrowing target by 28.7%, (ii) have met approx. 86.1% of their pro-rated foreign borrowing target, and (iii) the KRA is not significantly behind target in revenue collection, and therefore we expect interest rates to remain stable. With the expectation of a relatively stable interest rate environment, our view is that investors should be biased towards medium to long-term fixed income instruments.
During the month, the equities market was on a downward trend, with NASI, NSE 20 and NSE 25 losing 6.1%, 2.9%, and 7.1% respectively, driven by profit taking by investors and most stocks going ex-dividend taking their YTD performance to 4.9%, 0.6% and 5.8%. The performance was driven by declines in select large-cap stocks namely Safaricom, Equity Group Holdings and Standard Chartered Bank, which declined by 8.9%, 8.8%, and 8.3%, respectively. For the last twelve months (LTM), NASI, NSE 20 and NSE 25 gained 34.7%, 18.0% and 35.6% respectively. For this week, the equities market was on a downward trend with NASI, NSE 20 and NSE 25 declining by 0.1%, 0.3%, and 0.1%, respectively. The performance during the week was driven by declines in select large cap stocks such as Barclays, KCB Group and Diamond Trust Bank, which declined by 9.4%, 3.0%, and 2.3%, respectively. The decline is as a result of the counters trading at ex-dividend prices as book closure was on 30th April, 2018.
Equities turnover decreased by 33.9% to USD 149.6 mn in April compared to USD 226.2 mn in March. We expect the market to remain supported by positive investor sentiment this year, as investors take advantage of the attractive stock valuations on select counters.
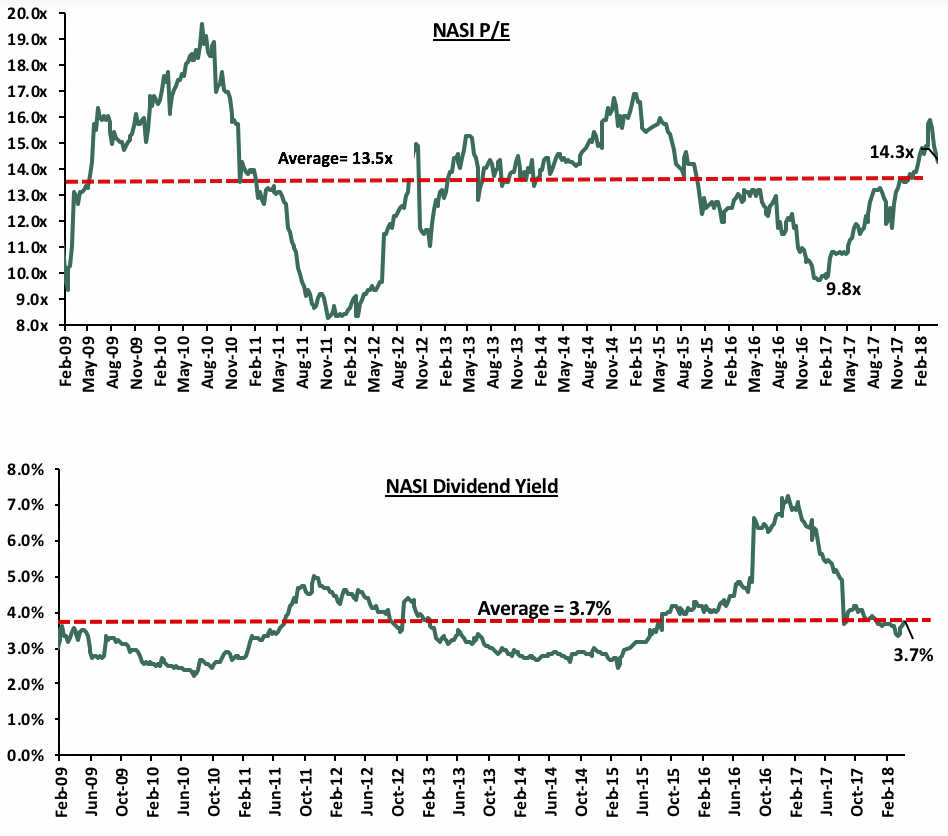
The market is currently trading at a price to earnings ratio (P/E) of 14.3x, which is 5.9% above the historical average of 13.5x, and a dividend yield of 3.7%, similar to the historical average of 3.7%. The current P/E valuation of 14.3x is 45.9% above the most recent trough valuation of 9.8x experienced in the first week of February 2017, and 72.3% above the previous trough valuation of 8.3x experienced in December 2011.
During the month, The Nairobi Securities Exchange (NSE) Board reviewed the NSE 20 and NSE 25 share indices to ensure they paint an accurate picture of the market performance. The review was done according to four parameters namely (i) trading activity, (ii) market capitalization, (iii) shares traded, and (iv) number of deals and turnover. The review of the NSE 20 share index saw the removal of CIC Insurance Group, Stanbic Holdings Plc and Sasini Limited. The new constituent securities of the index are: Kenya Reinsurance Corporation, NIC Group Plc and Nairobi Securities Exchange Plc. For the NSE 25 share Index, Housing Finance Group was removed and replaced with Nairobi Securities Exchange Plc. The NSE 20 Share index is a price-weighted index. This means that constituent companies are selected based on market performance and trading activity during the period under review. The NSE 25 share Index on the other hand is a market capitalization weighted index. In order for inclusion on this index, a company should have the share quoted for at least 1 year and have at least 20% of the shares quoted on the NSE.
Following the review, the respective Index constituent securities are highlighted in the table below:
|
Sector |
NSE 25 Constituents |
NSE 20 Constituents |
|
Commercial & Service Sector |
1. Nation Media Group |
1. Nation Media Group |
|
2. WPP Scangroup Limited |
2. WPP Scangroup Limited |
|
|
Banking |
3. KCB Group Plc |
3. KCB Group Plc |
|
4. Cooperative Bank |
4. Cooperative Bank |
|
|
5. Diamond Trust Bank |
5. Diamond Trust Bank |
|
|
6. Barclays Bank of Kenya |
6. Barclays Bank of Kenya |
|
|
7. Equity Group Holdings Plc |
7. Equity Group Holdings Plc |
|
|
8. NIC Group Plc |
8. NIC Group Plc |
|
|
9. Stanbic Holdings |
|
|
|
10. I&M Holdings |
|
|
|
11. Standard Chartered Bank |
|
|
|
Manufacturing & Allied |
12. East African Breweries |
9. East African Breweries |
|
13. British American Tobacco |
10.British American Tobacco |
|
|
14. ARM Cement Plc |
11. ARM Cement Plc |
|
|
15.Bamburi Cement Limited |
12.Bamburi Cement Limited |
|
|
Energy & Petroleum |
16. Kenol Kobil Limited |
13. Kenol Kobil Limited |
|
17.Kenya Power & lighting Ltd |
14.Kenya Power & lighting Ltd |
|
|
18. Kengen Limited |
15. Kengen Limited |
|
|
Insurance Sector |
19. Britam Holdings Ltd |
16. Britam Holdings Ltd |
|
20. Kenya Reinsurance Ltd |
17. Kenya Reinsurance Ltd |
|
|
21.CIC Insurance Group Limited |
|
|
|
22. Liberty Kenya Holdings |
|
|
|
Telecommunications and Technology Sector |
23.Safaricom Plc |
18.Safaricom Plc |
|
Investment Sector |
24. Centum Investment Co. |
19. Centum Investment Co. |
|
Investment Services Sector |
25. Nairobi Securities Exchange |
20. Nairobi Securities Exchange |
SBM Bank Kenya Ltd completed the acquisition of certain assets and liabilities of Chase Bank Limited, which was under receivership. Following the agreement between the Central Bank of Kenya (CBK) and Kenya Deposit Insurance Corporation (KDIC) and SBM Bank Kenya, 75% of the value of all moratorium deposits at Chase Bank will be transferred to SBM Bank Kenya. The remaining 25% will remain with Chase bank Limited.
This is a major milestone as this is the first successful instance, in the history of Kenya, of a bank being successfully brought out of receivership. Chase Bank was taken under receivership of the CBK in 2016, with customer deposits in excess of Kshs 100 bn. The acquisition will see SBM take control of the 62 Chase Bank branches, significantly increasing the bank’s foothold in the country. SBM Bank has injected Kshs 2.6 bn in Chase Bank, and is planning to inject a further Kshs 6 bn after the acquisition to revive the collapsed bank. The entire acquisition amount is yet to be disclosed. In addition to this, the bank is expected to absorb all the 1,300 former employees of Chase Bank Limited. This is the bank’s second acquisition in the country, having previously acquired Fidelity Bank in 2016. The bank is adopting an inorganic growth model driven by acquisitions, in its plan to establish a strong regional presence across geographies in Kenya and West Africa especially Ghana and Nigeria. The transaction will see SBM Bank Kenya change status to a Tier II bank, ranked 11th on asset base, since Chase Bank’s assets have been valued in excess of Kshs 100 bn. Kenya has seen 7 acquisitions in the recent past. The acquisitions are highlighted below, with their respective transaction multiples:
|
Acquirer |
Bank Acquired |
Book Value at Acquisition (Kshs bn) |
Transaction Stake |
Transaction Value (Kshs bn) |
P/Bv Multiple |
Date |
|
Diamond Trust Bank Kenya |
Habib Bank Limited Kenya |
2.4 |
100.0% |
1.8 |
0.8x |
17-Mar |
|
SBM Holdings |
Fidelity Commercial Bank |
1.8 |
100.0% |
2.8 |
1.6x |
16-Nov |
|
M Bank |
Oriental Commercial Bank |
1.8 |
51.0% |
1.3 |
1.4x |
16-Jun |
|
I&M Holdings |
Giro Commercial Bank |
2.9 |
100.0% |
5.0 |
1.7x |
16-Jun |
|
Mwalimu SACCO |
Equatorial Commercial Bank |
1.2 |
75.0% |
2.6 |
2.3x |
15-Mar |
|
Centum |
K-Rep Bank |
2.1 |
66.0% |
2.5 |
1.8x |
14-July |
|
GT Bank |
Fina Bank Group |
3.9 |
70.0% |
8.6 |
3.2x |
13-Nov |
|
Average |
80.3% |
1.8x |
During the month, a number of banks received funding from international institutions.
- KCB Group received USD 80 mn of the USD 100 m long-term line of credit from the African Development Bank (AFDB). The credit is expected to be used to facilitate onward lending to Micro, Small and Medium Enterprises (MSMEs) as well as issuing finance to deserving corporate entities across the agriculture value chain,
- Victoria Commercial Bank (VCB) also received USD 5 mn of subordinated tier II compliant loan from SwedFund, a Swedish development finance institution. The loan is expected to shore up the bank’s capital position and thereby improve the company’s lending capacity to Small and Medium Enterprises (SMEs), and,
- Stanbic Bank Kenya has also raised a USD 100 mn dual-tranche syndicated loan, that was coordinated by UAE-based bank Mashreq bank. The loan will have a two and three-year maturity for the two tranches. The proceeds of the loan will be devoted towards new lending and general corporate purposes. The syndicated loan involved 14 financial institutions and was two and a half times oversubscribed.
Banks have been seeking external funding due to the time horizon mismatch between issued loans that tend to be relatively long term and deposits that tend to be relatively short term. This then results in an asset liability mismatch, and to balance this out, banks have been obtaining attractively priced credit facilities from external finance institutions. Previous issues such as that of the International Finance Corporation to Co-operative Bank were priced at the London Inter-Bank Offered rate (LIBOR), plus an unspecified premium. The current 12-month LIBOR rate is at 2.8%.
Below we highlight credit extended to banking institutions in the country:
|
No. |
Issuer |
Bank |
Amount of Loan (Kshs bn) |
Term of Credit |
|
1 |
IFC |
Cooperative Bank |
15.2 |
7-years |
|
2 |
Africa Development Bank |
Kenya Commercial Bank |
10.4 |
Not specified |
|
3 |
SwedFund |
Victoria Commercial Bank |
0.5 |
Not specified |
|
4 |
14 International Banks |
Stanbic Bank Kenya |
10.0 |
2 and 3 years |
|
|
Total |
|
36.1 |
|
Stanbic Bank released Q1’ 2018 results
Stanbic Bank released Q1’2018 results, recording a 79.0% increase in the profit after tax to Kshs 1.9 bn in Q1’2018 from Kshs 1.1 bn in Q1’2017. The performance was driven by a faster 33.8% increase in total operating income, which outpaced the 4.9% increase in operating expenses. Key highlights for the performance from Q1’2017 to Q1’2018 include:
- Total operating income increased by 33.8% to Kshs 2.8 bn from Kshs 1.8 bn in Q1’2017, driven by a 17.9% increase in Net Interest Income to Kshs 2.9 bn in Q1’2018 from Kshs 2.4 bn in Q1' 2017, coupled with a 55.4% increase in Non-Funded Income to Kshs 2.8 bn from Kshs 1.8 bn in Q1’2017,
- Interest income increased by 17.7% to Kshs 4.6 bn in Q1’2018 from Kshs 3.9 bn in Q1’ 2017. This was largely due to the interest income on loans and advances, which increased by 14.8% y/y to Kshs 3.3 bn in Q1’2018 from Kshs 2.9 bn and also due to the increase in interest income on government securities that increased by 35.0% to Kshs 1.2 bn from Kshs 0.9 bn. The yield on interest-earning assets came in at 10.9% from 9.6% in Q1’2017,
- Interest expense increased by 17.4% to Kshs 1.7 bn from Kshs 1.4 bn in Q1’2017, following a 29.0% increase in the interest expense on customer deposits to Kshs 1.1 bn from Kshs 0.8 bn in Q1’2017. Despite the increase in interest expense, the cost of funds came in at 3.3%, lower than the 3.6% recorded in Q1’2017, owing to a faster increase in interest bearing liabilities. The Net Interest Income increased by 17.9% to Kshs 2.9 bn from Kshs 2.4 bn. The Net Interest Margin thus also increased to 7.0% from 6.5% in Q1’2017,
- Non-Funded Income (NFI) increased by 55.4% to Kshs 2.8 bn in Q1’2018 from Kshs 1.8 bn in Q1’2017. The growth in NFI was driven by a 183.2% increase in other income to Kshs 0.9 bn from Kshs 0.3 bn in Q1’2017, and a 37.4% increase in other fees and commissions to Kshs 1.0 bn from Kshs 0.7 bn in Q1’2017. The current revenue mix stands at 51:49 funded to non-funded income in Q1’2018 from the 58:42 ratio recorded in Q1’2017, owing to a faster increase in NFI,
- Total operating expenses increased by 4.9% to Kshs 2.9 bn in Q1’2018 from Kshs 2.7 bn in Q1’2017, largely driven by a 29.5% increase in the staff costs to Kshs 1.5 bn from Kshs 1.2 bn in Q1’2017. Loan Loss provisions (LLP) however declined by 80.6% from Kshs 0.3 bn in Q1’2017 to Kshs 0.06 bn in Q1’2018. Other expenses also increased 8.3% to Kshs 1.0 bn in Q1’2018 from Kshs 0.9 bn in Q1’2017,
- The Cost to income ratio improved to 50.5% in Q1’2018 from 64.4% in Q1’2017. Without LLP, the Cost to income ratio also improved to 49.4% in Q1’2018 from 56.7% in Q1’2017,
- Profit before tax increased by 86.1% to Kshs 2.8 bn, up from Kshs 1.5 bn in Q1’2017. Profit after tax increased by 79.0% to Kshs 1.9 bn in Q1’2018 from Kshs 1.1 bn in Q1’2017.
- Total assets increased by 17.1% to Kshs 249.0 bn from Kshs 212.6 bn in Q1’2017. This growth was largely driven by an 11.4% increase in the loan book to Kshs 128.5 bn from Kshs 115.4 bn and investment in government securities that increased by 83.5% to stand at Kshs 46.8 bn from 25.5 bn in Q1’2017,
- Total liabilities rose by 17.8% to Kshs 215.9 bn from Kshs 183.4 bn in Q1’2017, largely driven by a 520% increase in placements by other banking institutions to Kshs 24.3 bn in Q1’2018 from Kshs 3.9 bn in Q1’ 2017.
- Borrowed funds also increased by 72.1% to Kshs 12.0 bn in Q1’2018 from Kshs 7.0 bn in Q1’2017. In April 2018, Stanbic Bank Kenya raised a USD 100 million dual-tranche syndicated loan with maturities of 2 and 3 years, for lending and trade related finance for the bank. The syndicated loan was coordinated by Mashreq Bank, and 14 financial institutions that participated in the facility,
- Customer deposits also increased by 13.2% to Kshs 147.8 bn in Q1’2018 from Kshs 130.6 bn in Q1’2018, the faster increase in deposits as compared to the loans lead to the decrease in the loan to deposit ratio to 87.0% in Q1’2018 from 88.4% in Q1’2017,
- Shareholders’ funds increased by 12.9% to Kshs 33.0 bn in Q1’2018 from Kshs 29.3 bn in Q1’2017,
- Gross non-performing loans increased by 47.3% to Kshs 10.4 bn from Kshs 7.1 bn in Q1’2017. The NPL ratio as a consequence deteriorated to 4.0% in Q1’2018 from 3.5% in Q1’2017, as NPLs increased at a faster rate than the loan book,
- Stanbic bank is currently sufficiently capitalized with a core capital to risk weighted assets ratio of 15.5%, 5.0% above the statutory requirement. In addition, the total capital to risk weighted assets ratio was 18.5%, exceeding the statutory requirement by 4.0%. The adjusted core capital to risk weighted assets ratio was at 16.1% while the adjusted total capital to risk weighted assets was 19.0%. The adjusted ratios arise from the bank taking into consideration the provisions for expected credit losses in line with the implementation of IFRS 9,
Below is our equities Universe of coverage:
all prices in Kshs unless stated otherwise
|
No. |
Company |
Price as at 06/04/18 |
Price as at 13/04/18 |
m/m Change |
YTD Change |
LTM Change |
Target Price* |
Dividend Yield |
Upside/ (Downside)** |
P/TBv Multiple |
||
|
1. |
NIC Group*** |
37.5 |
37.3 |
(0.6%) |
2.8% |
53.2% |
56.0 |
2.7% |
52.9% |
0.8x |
||
|
2. |
KCB Group |
52.5 |
50.0 |
(4.8%) |
17.0% |
58.7% |
63.7 |
4.0% |
31.3% |
1.5x |
||
|
3. |
Zenith Bank Plc |
29.3 |
27.5 |
(6.3%) |
7.1% |
84.2% |
33.3 |
9.8% |
31.2% |
1.1x |
||
|
4. |
Union Bank Plc |
6.7 |
6.3 |
(6.7%) |
(19.9%) |
45.7% |
8.2 |
0.0% |
30.4% |
0.7x |
||
|
5. |
Diamond Trust Bank |
219.0 |
214.0 |
(2.3%) |
11.5% |
71.2% |
272.9 |
1.2% |
28.7% |
1.1x |
||
|
6. |
Ghana Commercial |
6.1 |
6.3 |
4.0% |
25.0% |
21.3% |
7.7 |
6.0% |
28.4% |
1.5x |
||
|
7. |
I&M Holdings |
125.0 |
125.0 |
0.0% |
(1.6%) |
37.4% |
151.2 |
2.8% |
23.8% |
1.2x |
||
|
8. |
Stanbic Bank Uganda |
30.0 |
30.8 |
2.5% |
12.8% |
13.9% |
36.3 |
3.8% |
21.8% |
2.5x |
||
|
9. |
CRDB |
170.0 |
180.0 |
5.9% |
12.5% |
(2.7%) |
207.7 |
0.0% |
15.4% |
0.6x |
||
|
10. |
Co-operative Bank |
19.6 |
18.6 |
(5.4%) |
15.9% |
59.0% |
20.5 |
4.3% |
15.0% |
1.6x |
||
|
11. |
Equity Group |
54.0 |
49.3 |
(8.8%) |
23.9% |
49.2% |
54.3 |
4.1% |
14.4% |
2.2x |
||
|
12. |
Barclays Bank |
12.6 |
13.3 |
5.6% |
38.0% |
61.6% |
13.7 |
7.5% |
10.9% |
1.7x |
||
|
13. |
Bank of Kigali |
290.0 |
290.0 |
0.0% |
(3.3%) |
18.4% |
299.9 |
4.8% |
8.2% |
1.6x |
||
|
14. |
National Bank |
9.2 |
8.0 |
(13.1%) |
(15.0%) |
38.7% |
8.6 |
0.0% |
8.1% |
0.4x |
||
|
15. |
UBA Bank |
11.8 |
11.6 |
(1.7%) |
12.1% |
98.5% |
10.7 |
13.0% |
5.6% |
0.8x |
||
|
16. |
Stanbic Holdings |
92.5 |
90.0 |
(2.7%) |
11.1% |
44.0% |
87.1 |
5.8% |
2.7% |
1.1x |
||
|
17. |
HF Group*** |
10.6 |
10.1 |
(5.1%) |
(3.4%) |
9.5% |
11.0 |
3.2% |
12.4% |
0.4x |
||
|
18. |
Bank of Baroda |
120.0 |
134.0 |
11.7% |
18.6% |
21.8% |
130.6 |
1.9% |
(0.7%) |
1.2x |
||
|
19. |
Standard Chartered KE |
228.0 |
209.0 |
(8.3%) |
0.5% |
7.7% |
192.6 |
6.0% |
(1.9%) |
1.7x |
||
|
20. |
Ecobank |
11.2 |
11.5 |
3.1% |
51.3% |
53.5% |
10.7 |
0.0% |
(6.7%) |
3.3x |
||
|
21. |
SBM Holdings |
7.8 |
7.7 |
(1.8%) |
2.7% |
1.3% |
6.6 |
3.9% |
(10.9%) |
1.1x |
||
|
22. |
Access Bank |
11.1 |
11.2 |
1.4% |
7.2% |
68.4% |
9.5 |
3.6% |
(11.6%) |
0.6x |
||
|
23. |
Guaranty Trust Bank |
44.7 |
45.0 |
0.7% |
10.4% |
69.0% |
37.2 |
5.3% |
(12.0%) |
2.5x |
||
|
24. |
Stanbic IBTC Holdings |
48.5 |
49.5 |
2.1% |
19.3% |
88.6% |
37.0 |
1.2% |
(24.0%) |
2.7x |
||
|
25. |
CAL Bank |
1.5 |
2.0 |
29.6% |
82.4% |
173.6% |
1.4 |
0.0% |
(28.9%) |
1.7x |
||
|
26. |
Stanchart GH |
35.1 |
35.0 |
(0.4%) |
38.5% |
124.5% |
19.5 |
0.0% |
(44.3%) |
4.4x |
||
|
27. |
FBN Holdings |
12.5 |
12.5 |
0.0% |
42.0% |
294.3% |
6.6 |
2.0% |
(45.0%) |
0.7x |
||
|
28. |
Ecobank Transnational |
16.4 |
20.1 |
22.9% |
18.2% |
160.7% |
9.3 |
0.0% |
(53.8%) |
0.7x |
||
|
*Target Price as per Cytonn Analyst estimates |
||||||||||||
|
**Upside / (Downside) is adjusted for Dividend Yield |
||||||||||||
|
***Banks in which Cytonn and/or its affiliates holds a stake. For full disclosure, Cytonn and/or its affiliates holds a significant stake in NIC Bank, ranking as the 5th largest shareholder |
||||||||||||
We are “NEUTRAL” on equities for investors with a short-term investment horizon since the market has rallied and brought the market P/E slightly above its’ historical average. However, pockets of value exist, with a number of undervalued sectors such as Financial Services, which provide an attractive entry point for long-term investors, and with expectations of higher corporate earnings this year, we are “POSITIVE” for investors with a long-term investment horizon.
During the month of April, we witnessed increased private equity activity through fundraising majorly in the FinTech sector and acquisition in the real estate sector.
Fundraising
In FinTech fundraising, France-based Proparco, the private sector financing arm of the French Development Agency (Agence Française de Dévelopement), announced an equity investment of USD 3.0 mn in JUMO, an emerging market technology start-up that offers access to credit through their mobile application. JUMO currently operates in Africa (Tanzania, Kenya, Uganda, Zambia and Ghana) and had recently launched its first activities in Asia (Pakistan). In 2017 alone, the start-up handled 12.2 mn loan transactions to customers. For more information, see our Cytonn Weekly #14/2018
Branch International, a mobile-based Microfinance Institution (MFI) operating in Kenya, Tanzania, Nigeria and California, raised USD 70.0 mn in Series B funding, which combined USD 50.0 mn in debt and USD 20.0 mn in equity of an undisclosed stake. The funds will enable the mobile loan app company to expand its services beyond credit access, to savings and payments, and to start operations in India. The funding was led by California-based Trinity Ventures, a venture capital firm specializing in growth capital investments. The Series B investment brings Branch’s total funding to USD 80.0 mn in the three-years since it was founded. Similar investments in the past include debt financing led by Nabo Capital in 2017 of Kshs 200.0 mn (USD 2.0 mn), a Series A equity funding round for Branch International, the company's first significant round of venture capital financing, of USD 9.6 mn led by Andreessen Horowitz, US-based venture capital firm in 2016, which was used for expansion into Nigeria, and an undisclosed seed capital from US-based Formation 8 and Khosla Ventures. For more information, see our Cytonn Weekly #15/2018
Tala, a mobile-based lending firm headquartered in California raised Kshs 6.5 bn (USD 64.8 mn) in Series C funding (the third round of capital injection from external investors). Tala has operations in Kenya, Tanzania, USA and the Philippines. The funding is to be spent on product development and personnel development ahead of the planned product launch in Mexico and India later this year. Tala raised Kshs 1.0 bn (USD 10.0 mn) in Series A funding on Sep 3rd, 2015, Kshs 3.0 bn (USD 29.9 mn) in Series B funding on Feb 22nd, 2017, bringing the total amount raised since it began its operations to Kshs 10.5 bn (USD 104.7 mn). Tala’s latest funding comprised of Kshs 5.0 bn (USD 49.9 mn) in equity funding and Kshs 1.5 bn (USD 15.0 mn) debt. For more information, see our Cytonn Weekly #15/2018
Digital Financial Services (DFS) Lab, a Fintech accelerator supported by The Bill and Melinda Gates Foundation, announced an investment of USD 200,000 (Kshs 20.0 mn) in four African start-ups, two of which are Kenyan: (i) Cherehani Africa, which relies on mobile-based tech to provide credit and distribute personalized financial literacy content to women and adolescent girls who own micro-enterprises, and (ii) another unnamed startup that focuses on digital lending. DFS Lab identifies promising entrepreneurs and invests in for-profit companies that focus on consumers in sub-Saharan Africa and Asia. Products from the four companies have been found to simplify processes for accessing financial information and cash via mobile phone. Cherehani Africa provides access to finances to women and adolescent girls with basic level education, aged 17-45 years. For more information, see our Cytonn Weekly #17/2018
The continued increase in investments and funding of microfinance institutions in Kenya is in a bid to grow the institutions’ loan books. Lack of access to finance is a major issue for entrepreneurs and small businesses across Africa as Interest rate capping in Kenya has compelled banks to increase their risk mitigation measures. Tightening of credit standards by banks has reduced credit facilities granted to individuals and SME’s. Microfinance institutions aim to bridge this gap by offering convenient access to credit.
In the technology sector, technology investment fund Orange Digital Ventures, the strategic Corporate Venture Fund of the Orange Group invested Kshs 260.0 mn (USD 2.6 mn) in Kenya’s mobile tech company Africa’s Talking, alongside California-based venture capital firm Social Capital. Founded in 2010, Nairobi based Africa’s Talking provides a platform for businesses and developers who want to integrate mobile communication and payment services to their applications. The new funding brings the total investment received by Africa’s Talking to Kshs 860.0 mn (USD 8.6 mn), in addition to Kshs 600 mn (USD 6.0 mn) by International Finance Corporation (IFC) announced in 25th April 2018. The new capital injection is set to accelerate expansion strategies and scale up its operations on the continent. Beyond Kenya, the company has started working in Uganda, Rwanda, Tanzania, Malawi, Nigeria and Ethiopia. For more information, see our Cytonn Weekly #17/2018
Asoko Insight, a London-headquartered provider of corporate intelligence with research bases in Accra, Lagos, Nairobi, Addis Ababa and Abidjan completed a USD 3.6 mn Series A fundraising round, as it moves into the next stage of its Pan-African expansion plan. The round of funding was led by early shareholders, including North Base Media, CRE Venture Capital, Singularity Investments and Lateral Capital joined by new participants including LC Partners, Spice Fund, Outlierz Ventures, and Zephyr Acorn. The round was oversubscribed by 20%. For more information, see our Cytonn Weekly #14/2018
The continued interest by foreign investors in Africa is driven by expected strong economic growth in Sub-Saharan Africa whose GDP is expected to grow by 3.3% in 2018, and 3.5% in 2019, from an expected 2.7% in 2017.
Acquisition
South African-based Vantage Capital, Africa’s largest mezzanine fund manager with funds in excess of Kshs 50.0 bn invested in projects across Africa, has acquired an undisclosed stake in the Rosslyn Riviera Shopping Mall for USD 8.0 mn (Kshs 800.0 mn). The Kshs 2.9 bn mall located along Limuru Road sits on a 4.5-acre piece of land and measures approximately 116,000 SQFT. For more information, see our Cytonn Weekly #17/2018
Exits
According to the 2018 survey by EY and AVCA, the number of annual PE exits in Africa have steadily increased from 30 in 2011 to peak at 50 in 2016. Despite challenging exit environments in key African markets in 2017 (with elevated political uncertainty and a weak economic environment in South Africa, the repeated Kenyan elections and continuing Nigerian currency challenges), PE activity remained resilient recording 49 exits, only slightly below the peak in 2016 (50 exits). Regionally, PE exit activity in North Africa increased in the last two years, while South Africa remained the market with the most PE exits. From 2016-2017, besides South Africa (45%) and Nigeria (6%), PE exit activity was high in the three large North African economies; Egypt (8%), Morocco (6%) and Tunisia (6%).
Exits to PE and other financial buyers continued to increase in 2017 (37%) compared to 34 % in 2016 and now represent the most common exit route. This is likely to be due to the large amount of capital raised by PE firms in 2014-2016 and PE firms needing to invest the capital raised. Looking forward, we expect to see investment in the Fintech, Education, Consumer Products and services and Energy sector.
Private equity investments in Africa remains robust as evidenced by the increasing investor interest, which is attributed to; (i) rapid urbanization, a resilient and adapting middle class and increased consumerism, (ii) the attractive valuations in Sub Saharan Africa’s private markets compared to its public markets, (iii) the attractive valuations in Sub Saharan Africa’s markets compared to global markets, and (iv) better economic projections in Sub Sahara Africa compared to global markets. We remain bullish on PE as an asset class in Sub-Sahara Africa. Going forward, the increasing investor interest and stable macro-economic environment will continue to boost deal flow into African markets.
In our Q1’ 2018 Market Review, we stated that the real estate sector exuded signs of recovery following the end of the protracted electioneering period. This was evident this month, with; i) a number of reports being released showing positive growth in the sector, and ii) an increase in activities, both expansionary, and development as expounded below;
Industry Reports
During the month, a number of reports were released that indicated the real estate sector in Kenya was recovering from the slump witnessed last year. The recovery is mainly as a result of i) increased government support and ii) favourable operating environment following the conclusion of the protracted electioneering period. The various reports are as explained in the table below;
|
Report |
Theme |
Key Take Outs |
|
Hass Consult House Price Indices |
Residential |
· The residential market picked up in Q1’ 2018 following the conclusion of the prolonged electioneering period, · The asking prices for residential property sales increased by 2.4% during the quarter, while the asking rents also increased by 1.0% during the same period, |
|
Hass Consult Land Price Indices |
Land |
· Land recorded a slow annual growth rate of 7.4% which represents a 4.7% points y/y decline from a growth rate of 12.1% in Q1’ 2016, |
|
Hass Consult County Land Index |
· Land recorded an overall 1.4% q/q increase in asking prices, with satellite towns recording a 2.4% q/q growth in land prices, outperforming Nairobi suburbs, which recorded a 0.2% q/q increase, |
|
|
· Land prices in Nairobi Metropolitan Area grew by 3.7% in 2017, down from growth with a 6-Year CAGR of 17.0%, as a result of the extended electioneering period. The prices are however expected to grow by 10.2% in 2018, as a result of expected increased activity in real estate, due to conclusion of the electioneering period, |
||
|
Hospitality |
· Nairobi’s performance in 2017, was subdued, registering the sharpest decline in RevPAR in East Africa, of 17.8% to USD 60 in 2017, · However, the sector’s performance is expected to recover in 2018, on the back of growth in tourist arrivals, public sector support for tourism, as well as new air routes in the long term, |
|
|
· Hospitality sector contribution to GDP grew by 0.1% points y/y, from 1.1% in 2016 to 1.2% in 2017, · The sector remained resilient to the tough political environment in 2017, and grew by 14.7%, from a 13.3% growth recorded in 2016, · The number of international arrivals grew by 8.1% to come in at 1.4 mn in 2017 from 1.3 mn in 2016, |
||
|
KNBS Economic Survey 2018 |
Macros |
· Real Estate and Construction sector performance improved with i) real estate contribution to GDP increasing by 0.3% y/y to 14.1% from 13.8% in 2016, ii) value of buildings issued with occupancy certificates by the Nairobi City Council (NCC) growing by 10.2% from Kshs 77.7 bn to Kshs 85.6 bn y/y from 2016 to 2017, and iii) the number of completed public developments increasing by 9.6% y/y to 1,164 units between 2016 and 2017, · This is despite a decrease in activities that led to an 8.2% decline in cement consumption y/y, leading to a decline in growth of the real estate sector of 2.7% points y/y, to 6.1% in 2017, from 8.8% in 2016 |
During the month of April, the performance and activities of the various real estate themes are as highlighted below:
- Residential
The residential sector recorded an increase in activities mainly driven by the government focus on affordable housing. During the month, a number of developers broke ground on real estate projects or announced plans to undertake development. These included:
- Cytonn Real Estate, the development affiliate of Cytonn Investments broke ground on a Kshs 15.0 bn, 100-acre master planned project, in Ruiru, Kiambu County. The development will feature apartments, residential villas, recreational facilities such as a water park and swimming pools as well as a convenience centre, with approximately 1,000 SQM of retail space,
- Krishna Estates Limited, announced plans to put up a Kshs 1.2 bn residential flats project on 2-acres, comprising of 64 two-bedrooms, and 180 three-bedroom units, in Thindigua, along Kiambu Road, Cytonn Weekly #14 ,
- Rendeavour, the developer of Tatu City, announced plans to include a 300-acre affordable housing project within Tatu City. The development is set to commence in April 2019, and will see the development of 10,000 affordable housing units priced between Kshs 1.5 mn to 5.0 mn, Cytonn Weekly #17 ,
- Five joint venture firms including Kesa, Meridiam, JV Unicamp, PDM-Roko-CBA Capital Consortiums and a Chinese company, Chinese Overseas Engineering, have been chosen to build 23,400 hostel rooms in various universities across the country including; Moi University, Embu University and South Eastern Kenya Universities (SEKU). Moi University intends to build a 14,000-unit facility; Embu University will have a 4,000-bed facility while SEKU will have a 5,400-unit facility. Under the proposed PPP model, the hostels developers will gain returns on their investment through a built to rent operation for 15-20 years, after which they will recover their principal and interest then hand over the facility to the respective institutions of learning. The public-private partnership model has been floated over the last couple of years as the most efficient way to address the housing shortage in local universities but most partnerships such as the Kenyatta University and US-based Africa Integra for the construction of a 10,000-room facility at a tune of Kshs 5.1 bn announced in year2015, are yet to materialize due to the various challenges that face PPP models, but remain unaddressed, such as the inability to transfer public land to Special Purpose Vehicle, the long-term nature of PPPs, as well as vague compensation models for the private partners, Cytonn Weekly #17. The government is however planning to review this law and others to streamlined PPPs and affordable housing agenda, and,
- The government through a concept paper in regards to the affordable housing initiative, intends to work with county governments and the National Social Security Fund (NSSF) to fasten the provision of affordable housing. The county governments will aid in creating the much-needed land banks as per the government target of a total of 6,800 acres across various counties that is 3,000 acres in Nairobi, 1,200 in Mombasa, 1,000 in Kisumu, 800 in Eldoret and 800 in Nakuru. To this end, the County Government of Homa Bay signed a memorandum of understanding during the month, with the National Government, for the development of 2,000 affordable homes where the County will provide 18 acres for the cause. Cytonn Weekly #17
We expect to continue witnessing increased activities in the residential sector in the year boosted by i) government initiatives, such as the focus on affordable housing ii) an available market given the shortage of housing units that stand at 2.0mn units with an effective annual shortfall of 200,000 units, and iii) positive demographic trends such as a rapid population growth of 2.6% p.a higher than global averages of 1.2%, and rapid urbanisation rates of 4.4% p.a compared to global average of 2.1% thereby creating demand for housing units in the country.
- Retail
In retail sector, foreign retailers continue making inroads in the Kenyan retail sector capitalizing on the financial woes of some of the major local retail chains. During the month, French-based retailer, Carrefour, opened its 5th outlet at the Sarit Centre Shopping Mall and announced plans to open a 6th outlet at the Village Market, taking up space vacated by Uchumi and Nakumatt, for Sarit Centre and Village Market, respectively. In addition to these stores, the retail store has four other stores at The Hub in Karen, Two Rivers Mall along Limuru Road, Thika Road Mall along Thika Superhighway and the Junction Mall along Ngong Road. The retailer ventured into the Kenyan market in May 2016, and has recorded revenues of up to Kshs 1.5 bn in the first seven-months of operations in its first outlet in The Hub Karen, hence supporting the aggressive expansion in the Kenyan market. The expansion activities by retailers indicate a healthy retail sector, which is supported by; (i) positive demographics evidenced by high population growth rate of 2.6% against global average of 1.2% that has led to sustained demand, (ii) high urbanization rates of 4.4% higher than global rates of 2.1% that has resulted in the need for more retail stores, (iii) high economic growth rates with a GDP growth rate averaging above 5.0% over the last 5 years thus boosting disposable incomes, and increasing purchasing power, (iv) rapid growth of infrastructure making more areas accessible to investors, (v) Kenya’s growing position as a regional and continental hub hence witnessing an increase in multinationals operating in the county, (vi) huge opportunity, with Kenya having a formal retail penetration of 35% according to Oxford Business Group, compared to markets like South Africa with a penetration of 60%, and (vii) e-commerce as seen through the increased digitization of cash systems and a rise in mobile money and access to internet.
We thus have a positive outlook for the retail sector in Kenya. However, retailers, especially local chains will have to institute better financial and supply chain management processes, and strong corporate governance frameworks, in order to avoid pitfalls that Nakumatt and Uchumi are struggling with.
- Hospitality
During the month of April, the hospitality sector continued to attract investment from global players, this was seen through Movenpick, a 5-star brand by Movenpick Hotels and Resorts, and owned by the Kampala based, Golf Course Hotel, opening a new brand in Westlands. The 5-star hotel will feature 128 guest rooms of 54, 1 and 2 bed residential apartments, 94 suites, and 4,000 SQM of conference space. The brand will be joining other top brands currently operating in the country such as: Accor Hotel, Four Points by Sheraton, RadisonBlu Hotel, and Kempinski. The hotel industry in Kenya has been recording increased investment by both local and foreign retailers, with the total room nights in Nairobi growing with a 7-year CAGR of 4.6% from 1.5mn room nights in 2011 to 1.9mn room nights in 2017. The city has a cumulative supply of 5,620 top-rated hotel rooms and 2,945 more rooms are expected to come into the market in the next two years, with the completion of hotels such as: Avic Towers and Pullman in Westlands, and Radisson Residence in Kilimani. We, therefore, project further growth in the hospitality sector as a result of i) restoration of political calm, ii) the revision of negative travel advisories, warning international citizens, e.g. from the United States against visiting Kenya, iii) positive reviews from travel advisories such as Trip Advisor who ranked Nairobi as the 3rd best place to visit in 2018, only behind Ishigaki Island in Japan and Kapaa in Hawaii, and The Travel Corporation who ranked travel to Kenya as one of the top 10 transformative travel experiences in the world, iv) improved hotel standards as hotels rebrand while some embark on refurbishment and expansion, and v) improved flight operations and systems such as direct flights from the USA which are set to commence this year.
Other highlights of the real estate sector during the month of April 2018 include:
- High Court Judge Wilfrida Okwany suspended a notice published on April 4, 2018, by the Ministry of Lands discontinuing manual transactions at both the Nairobi and Central Registries to pave way for online transactions. The digitization move was disputed by the Law Society of Kenya (LSK), which termed it as illegal on the basis that; i) it is against section 34 of the Advocates Act, which states, “no unqualified person shall, either directly or indirectly, take instructions or draw or prepare any document or instrument relating to the conveyancing of property”, (ii) Parliament was yet to pass a law that supports online land transactions, (iii) many Kenyans have no access to internet and using an online portal will expose them to the risk of being dispossessed of their lands, and (iv) online processing of land transactions would expose the property owners to risk of fraud and loss of property through acts such as hacking, Cytonn weekly #16 ,
- The National Assembly majority leader tabled a bill in Parliament seeking to amend the Stamp Duty Act to exempt first time home buyers from paying stamp duty. Stamp duty tax is paid on the market value of a property at the rate of 4.0% for urban areas and 2.0% for rural areas and is payable within 30-days of signing of the sale agreement. In our opinion, if the bill is passed, it will be a move in the right direction, as despite the minimal effect on the total house price, it will reduce the first time home buyers’ financial burden, Cytonn weekly #16 , and,
- In a bid to increase home affordability, the government, proposed the following legal amendments; i) the NSSF Act to raise member’s contribution from current rates of Kshs 400.0 to Kshs 1,080.0 and ii) the Income Tax Act that proposes to raise tax rebates to Kshs 8,000 under the Home Ownership Savings Plan, to employees who save with mortgage institutions from current Kshs 4,000. Cytonn Weekly #17
Our outlook for the real estate sector is positive given the conducive operating environment following the conclusion of the general elections, increased investor confidence as evidenced by inroads and expansion by both local and international retailers, as well as increased government interest as seen through the various incentives by the state such as the tabling of a bill to scrap off stamp duty for first time home buyers, inclusion of affordable housing among the top 4 key pillars of focus in the next 5-years, and the income tax act that proposes to raise tax rebates to Kshs 8,000 under the home ownership savings plan.
Disclaimer: The views expressed in this publication are those of the writers where particulars are not warranted. This publication, which is in compliance with Section 2 of the Capital Markets Authority Act Cap 485A, is meant for general information only and is not a warranty, representation, advice or solicitation of any nature. Readers are advised in all circumstances to seek the advice of a registered investment advisor.

- Talk to us
- Kenya
- P.O Box 20695 - 00200, Nairobi, Kenya
- Cell +254709101200
- Tel +254709101200
- WhatsApp +254741676635
- United States
- +254709101200
- DOWNLOAD OUR APP
-


- Kenya
- 8th Floor, Pinetree Plaza, Kaburu Drive, Ngong Road, Nairobi, Kenya
- USA
- Suite 1150, 1775 Eye Street NW, USA, Washington DC 20006, USA
- Investments
- High Yield
- Private Equity
- Real Estate
- Real Estate
- RiverRun Estates
- Cytonn Towers
- The Ridge
- Taraji Heights
- The Alma