Cytonn Monthly – February 2022
By Cytonn Research, Mar 6, 2022
Executive Summary
Fixed Income
During the month of February, T-bills were undersubscribed, with the overall subscription rate coming in at 93.6%, a decline from the 120.1% recorded in January 2022. The decline in the subscription rate is partly attributable to the tightened liquidity in the money market with the average interbank rate increasing to 4.7% from 4.5% recorded in January, coupled with the concurrent government and corporate bond issues during the month, which recorded oversubscriptions as investors preferred the higher yields on offer. The overall subscription rates for the 91-day, 182-day and 364-day papers declined to 61.1%, 72.1% and 128.2%, from 84.3%, 94.3% and 160.2%, respectively, recorded in January 2022. The yields on the 364-day and 182-day papers increased by 19.9 bps and 1.1 bps to 9.7% and 8.1%, respectively, while the yield on the 91-day paper declined by 5.5 bps to 7.3%. In the Primary Bond Market, the government reopened three bonds, FXD1/2021/05, FXD1/2020/15 and FXD1/2021/25, with tenors to maturity of 4.7 years, 12.9 years, and 24.2 years, respectively, whose period of sale runs from 24th February 2022 to 8th March 2022;
The y/y inflation for the month of February 2022 declined to 5.1%, from the 5.4% recorded in January 2022, mainly attributable to the slower 4.5% growth in the transport index compared to the 6.8% growth recorded in January 2022. Additionally, Stanbic Bank released its monthly Purchasing Manager’s Index (PMI) highlighting that the index for the month of February 2022 increased to 52.9 following a nine months low of 47.6 recorded in January 2022. The index points towards strengthened business environment in the country on the back of continued economic recovery as COVID-19 cases continue to decline;
Equities
During the month of February, the equities market was on a downwards trajectory, with NASI, NSE 20 and NSE 25 declining by 1.9%, 0.1% and 1.6%, respectively. The equities market performance was driven by losses recorded by large cap stocks such as NCBA, Bamburi, EABL and Safaricom of 6.8%, 4.8%, 3.6% and 2.6%, respectively. The losses were however mitigated by gains recorded by stocks such as Stanbic Holdings and BAT Kenya of 5.6% and 4.6%, respectively;
During the month, Standard Africa Holdings Limited, (SAHL), the majority shareholder in Stanbic Holdings announced that it had received regulatory approval from the Capital Markets Authority, for further extension of the exemption from making a full take-over under the Capital Markets (Take over and Mergers) Regulations, 2002. Under the exemption, SAHL aims to acquire a maximum of 10.6 mn ordinary shares in Stanbic to bring its total shareholding to up to 75.0%, from 72.3% as of 31st December 2021. Additionally, during the month, Moody’s Rating Agency rated the Kenyan banking sector as stable following the banks’ impressive performance in the eleven months to November 2021, with the profits before tax coming in at Kshs 178.8 bn, exceeding the pre-pandemic earnings of Kshs 150.1 bn over the same period in 2019;
During the week, Stanbic Holdings released their FY’2021 results, with the core Earnings per Share (EPS) growing by 38.8% to Kshs 18.2 from Kshs 13.1 in FY’2020;
Real Estate
During the month of February, two industry reports were released, namely; Kenya Market Update H2’2021, by Knight Frank Kenya, and, Leading Economic Indicators (LEI)-December 2021 by the Kenya National Bureau of Statistics (KNBS). In the retail sector, QuickMart supermarket, a local retail chain opened its 50th outlet in the country in Machakos County along Wote Road. Additionally, Optica opened a new store at Imaara Mall bringing the total outlets in Kenya to 55. In the land sector, the Lands Cabinet Secretary, Farida Karoney announced that the digitization of the land records in the Nairobi County will be completed in June 2022 and by the end of 2024 for the entire country. For listed Real Estate, ILAM Fahari I-REIT closed the week trading at an average price of Kshs 6.5 per share, up from Kshs 6.2 recorded last week;
Investment Updates:
- Weekly Rates:
- Cytonn Money Market Fund closed the week at a yield of 10.58%. To invest, dial *809#;
- Cytonn High Yield Fund closed the week at a yield of 13.91% p.a. To invest, email us at sales@cytonn.com and to withdraw the interest, dial *809#;
- We continue to offer Wealth Management Training every Wednesday and every third Saturday of the month, from 9:00 am to 11:00 am, through our Cytonn Foundation. The training aims to grow financial literacy among the general public. To register for any of our Wealth Management Trainings, click here;
- If interested in our Private Wealth Management Training for your employees or investment group, please get in touch with us through wmt@cytonn.com;
- Any CHYS and CPN investors still looking to convert are welcome to consider one of the five projects currently available for conversion, click here for the latest conversion term sheet;
- Cytonn Insurance Agency acts as an intermediary for those looking to secure their assets and loved ones’ future through insurance namely; Motor, Medical, Life, Property, WIBA, Credit and Fire and Burglary insurance covers. For assistance, get in touch with us through insuranceagency@cytonn.com;
- Cytonnaire Savings and Credit Co-operative Society Limited (SACCO) provides a savings and investments avenue to help you in your financial planning journey. To enjoy competitive investment returns, kindly get in touch with us through clientservices@cytonn.com;
Real Estate Updates:
- For an exclusive tour of Cytonn’s real estate developments, visit: Sharp Investor's Tour, and for more information, email us at sales@cytonn.com;
- Phase 3 of The Alma is now ready for occupation. To rent please email properties@cytonn.com;
- We have 8 investment-ready projects, offering attractive development and buyer targeted returns; See further details here: Summary of Investment-ready Projects;
- For recent news about the group, see our news section here;
Hospitality Updates:
- We currently have promotions for Staycations. Visit cysuites.com/offers for details or email us at sales@cysuites.com;
Money Markets, T-Bills & T-Bonds Primary Auction:
During the month of February, T-bills were undersubscribed, with the overall subscription rate coming in at 93.6%, a decline from the 120.1% recorded in January 2022. The decline in the subscription rate is partly attributable to the tightened liquidity in the money market with the average interbank rate increasing to 4.7% from 4.5% recorded in January coupled with the concurrent government and corporate bond issues during the month, which recorded oversubscriptions, as investors preferred the higher yields on offer. The overall subscription rates for the 91-day, 182-day and 364-day papers declined to 61.1%, 72.1% and 128.2%, from 84.3%, 94.3% and 160.2%, respectively, recorded in January 2022. The yields on the 364-day and 182-day papers increased by 19.9 bps and 1.1 bps to 9.7% and 8.1%, respectively, while the yield on the 91-day paper declined by 5.5 bps to 7.3%. For the month of February, the government accepted a total of Kshs 84.5 bn out of the Kshs 89.9 bn worth of bids received, translating to a 94.0% acceptance rate.
During the week, T-bills were oversubscribed, with the overall subscription rate coming in at 122.1%, up from the 63.6% recorded the previous week. The oversubscription is partly attributable to the ample liquidity in the money market with the interbank rate remaining unchanged at 5.5%, similar to what was recorded last week, coupled with the rising yields on the government papers, pointing towards higher returns for investors. The 91-day paper recorded the highest subscription rate, receiving bids worth Kshs 9.8 bn against the offered Kshs 4.0 bn, translating to a subscription rate of 246.0%, an increase from the 50.3% recorded the previous week partly attributable to the higher return on a risk-adjusted basis. The subscription rate for the 182-day paper increased to 126.0%, from 40.3% recorded the previous week, while that of the 364-day paper declined to 68.7%, from 92.2% recorded last week. The yields on the government papers were on an upward trajectory, with the yields on the 91-day, 182-day and the 364-day papers increasing by 1.1 bps, 0.1 bps and 1.0 bps to 7.3%, 8.1% and 9.8%, respectively. The government accepted bids worth Kshs 26.5 bn, out of the Kshs 29.3 bn worth of bids received, translating to an acceptance rate of 90.6%.
During the month, the government released the auction results for the recently issued nineteen-year Treasury bond, IFB1/2022/19, which recorded an oversubscription of 176.3%. The oversubscription was attributable to the tax-free nature of the bond coupled with the relatively high yield of 13.0% on offer. The government was keen on maintaining low rates and thus accepted only Kshs 98.6 bn of the Kshs 132.3 bn worth of bids received, translating to an acceptance rate of 74.6%. The table below provides more details on the bond issued during the month:
|
Issue Date |
Bond Auctioned |
Effective Tenor to Maturity (Years) |
Coupon |
Amount offered (Kshs bn) |
Actual Amount Raised (Kshs bn) |
Total bids received |
Average Accepted Yield |
Subscription Rate |
Acceptance Rate |
|
21/02/2022 |
IFB1/2022/19 |
19.0 |
13.0% |
75.0 |
98.6 |
132.3 |
13.0% |
176.3% |
74.6% |
|
February 2022 Average |
19.0 |
13.0% |
75.0 |
98.6 |
132.3 |
13.0% |
176.3% |
74.6% |
|
|
January 2022 Average |
10.0 |
12.5% |
30.0 |
31.2 |
33.4 |
12.6% |
111.0% |
93.6% |
|
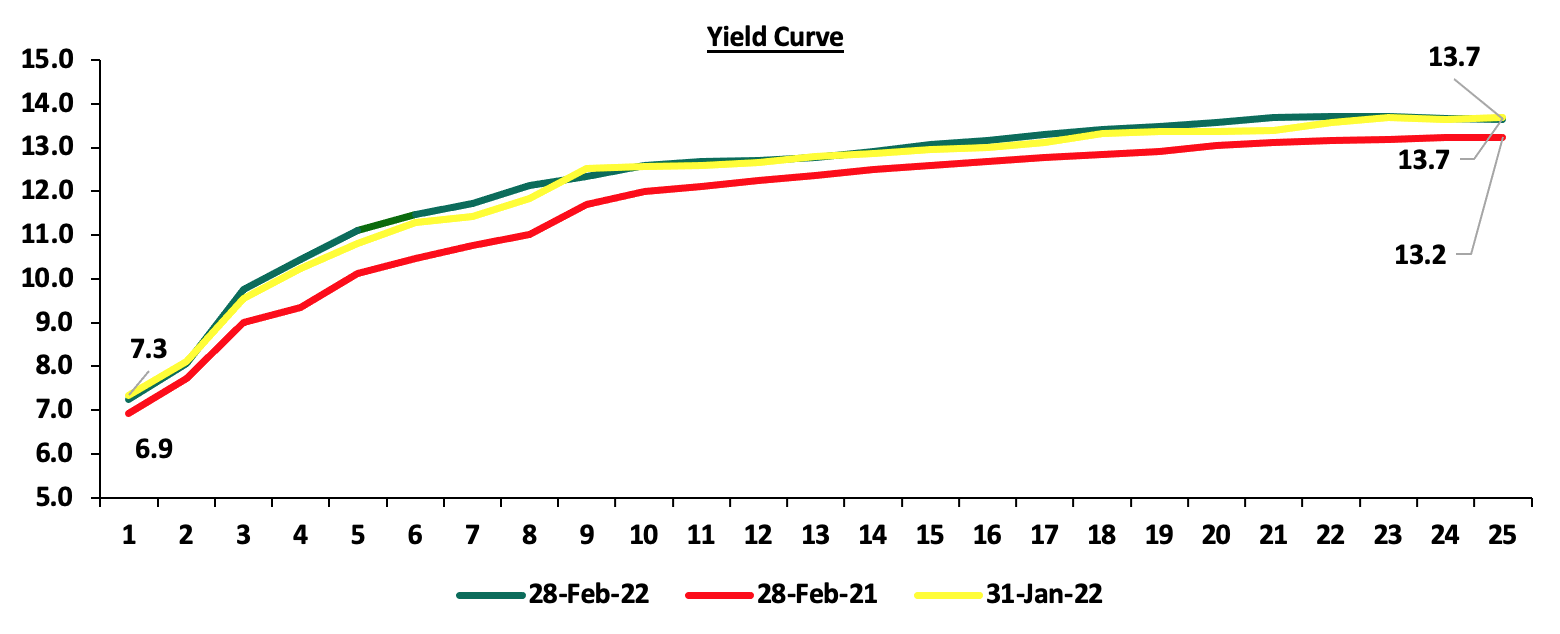
For the month of March 2022, the government reopened three bonds, FXD1/2021/05, FXD1/2020/15 and FXD1/2021/25, with tenors to maturity of 4.7 years, 12.9 years, and 24.2 years, respectively, in a bid to raise Kshs 50.0 bn for budgetary support. The period of sale for the issue runs from 24th February 2022 to 8th March 2022. The coupon rates are 11.3%, 12.8% and 13.9% for FXD1/2021/05, FXD1/2020/15 and FXD1/2021/25, respectively. We expect investors to prefer the longer dated paper, FXD1/2021/25, in search of higher yields. The bonds are currently trading in the secondary market at yields of 11.5%, 13.1% and 13.8%, for FXD1/2021/05, FXD1/2020/15 and FXD1/2021/25, respectively, and as such, our recommended bidding range for the three bonds is: 11.3%-11.7% for FXD1/2021/05, 12.9%-13.3% for FXD1/2020/15 and 13.6%-14.0% for FXD1/2021/25 within which range bonds of a similar tenor are trading at.
Secondary Bond Market:
In the month of February 2022, the yields on government securities in the secondary market remained relatively stable, with the FTSE NSE bond index gaining marginally by 0.2% to close the month at Kshs 96.5, from Kshs 96.4 recorded in January 2022, bringing the YTD performance to a gain of 0.5%. The chart below shows the yield curve movement during the period:
The secondary bond turnover increased by 14.9% to Kshs 53.8 bn, from Kshs 46.8 bn recorded in January 2022, pointing towards increased activity by commercial banks in the secondary bonds market. On a year on year basis, the bonds turnover increased by 25.9% to Kshs 892.9 bn, from Kshs 709.4 bn worth of T-bonds transacted over a similar period last year.
Money Market Performance
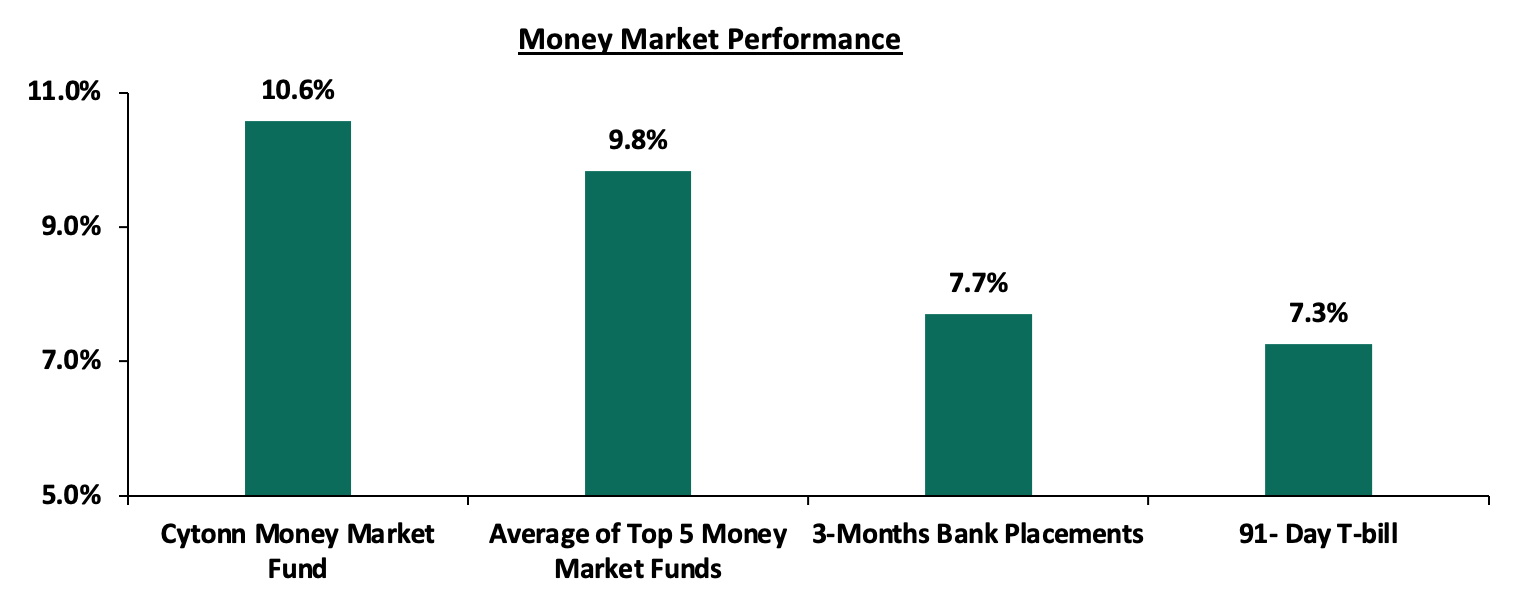
In the money markets, 3-month bank placements ended the week at 7.7% (based on what we have been offered by various banks), while the yield on the 91-day T-bill increased by 1.1 bps to 7.3%. The average yield of the Top 5 Money Market Funds remained relatively unchanged at 9.8%, as recorded the previous week while the yield on the Cytonn Money Market Fund increased marginally by 0.2% points to 10.6%, from 10.4% recorded the previous week.
The table below shows the Money Market Fund Yields for Kenyan Fund Managers as published on 4th March 2022:
|
Money Market Fund Yield for Fund Managers as published on 4th March 2022 |
||
|
Rank |
Fund Manager |
Effective Annual Rate |
|
1 |
Cytonn Money Market Fund |
10.6% |
|
2 |
Zimele Money Market Fund |
9.9% |
|
3 |
Nabo Africa Money Market Fund |
9.7% |
|
4 |
Sanlam Money Market Fund |
9.6% |
|
5 |
GenCap Hela Imara Money Market Fund |
9.3% |
|
6 |
Madison Money Market Fund |
9.3% |
|
7 |
Apollo Money Market Fund |
9.3% |
|
8 |
Dry Associates Money Market Fund |
8.9% |
|
9 |
CIC Money Market Fund |
8.9% |
|
10 |
Orient Kasha Money Market Fund |
8.7% |
|
11 |
Co-op Money Market Fund |
8.6% |
|
12 |
ICEA Lion Money Market Fund |
8.4% |
|
13 |
NCBA Money Market Fund |
8.4% |
|
14 |
British-American Money Market Fund |
8.3% |
|
15 |
AA Kenya Shillings Fund |
7.7% |
|
16 |
Old Mutual Money Market Fund |
7.3% |
Source: Business Daily
Liquidity:
Liquidity in the money markets tightened in the month of February 2022, with the average interbank rate increasing to 4.7%, from 4.5% recorded in January 2022, partly attributable to tax remittances which offset government payments. During the week, liquidity in the money markets remained ample, with the average interbank rate remaining unchanged at 5.5%, as recorded the previous week, partly attributable to government payments which offset tax remittances. The average interbank volumes traded increased by 139.0% to Kshs 12.0 bn, from Kshs 5.0 bn recorded the previous week.
Kenya Eurobonds:
During the month, the yields on the Eurobonds were on an upward trajectory partly attributable to increased selloffs by foreign investors. The yield on the 30-year Eurobond issued in 2018 increased by 0.9% points to 9.6% from 8.7%, recorded in January 2022 while the yields on the 10-year Eurobonds issued in 2014 and 2018 gained by 1.2% points and 1.5% points to 5.4% and 8.1%, from 4.2% and 6.6%, respectively. Similarly, yields on the 7-year and the 12-year Eurobonds issued in 2019 and the 12-year Eurobond issued in 2021, increased by 1.8% points, 1.6% points and 1.5% points to 8.2%, 8.8% and 8.6%, from 6.3%, 7.2% and 7.1%, respectively, recorded in January 2022.
During the week, the yields on Eurobonds were on an upward trajectory partly attributable to increased sell offs by foreign investors partly due to the rising geopolitical tension between Russia and Ukraine, with investors preferring safer havens. The yields on the 10-year Eurobond issued in 2014 and the 12-year bond issued in 2021, both increased by 0.4% points to 5.5% and 8.7%, respectively. Similarly, the 7-year and 12-year Eurobonds issued in 2019 increased by 0.6% points and 0.1% points to 8.4% and 9.0%, respectively. The 10-year Eurobond issued in 2018 increased by 0.2% points to 8.4% while the 30-year 2018 issue remained unchanged at 9.7% as recorded the previous week:
|
Kenya Eurobond Performance |
||||||
|
|
2014 |
2018 |
2019 |
2021 |
||
|
Date |
10-year issue |
10-year issue |
30-year issue |
7-year issue |
12-year issue |
12-year issue |
|
3-Jan-22 |
4.4% |
5.8% |
8.1% |
5.6% |
6.7% |
6.6% |
|
31-Jan-22 |
4.2% |
6.6% |
8.7% |
6.3% |
7.2% |
7.1% |
|
25-Feb-22 |
5.1% |
8.2% |
9.7% |
7.8% |
8.9% |
8.3% |
|
28-Feb-22 |
5.4% |
8.1% |
9.6% |
8.1% |
8.8% |
8.6% |
|
1-March-22 |
5.3% |
8.2% |
9.7% |
8.2% |
8.2% |
8.5% |
|
2-March-22 |
5.4% |
8.4% |
9.7% |
8.3% |
8.9% |
8.5% |
|
3-March-22 |
5.5% |
8.4% |
9.7% |
8.4% |
9.0% |
8.7% |
|
Weekly Change |
0.4% |
0.2% |
0.0% |
0.6% |
0.1% |
0.4% |
|
M/M Change |
1.2% |
1.5% |
0.9% |
1.8% |
1.6% |
1.5% |
|
YTD Change |
1.1% |
2.6% |
1.6% |
2.8% |
2.3% |
2.1% |
Source: CBK
Kenya Shilling:
During the month, the Kenya Shilling depreciated by 0.2% against the US Dollar, to close the month at Kshs 113.8, from Kshs 113.6 recorded at the end of January 2022, driven by the increased dollar demand from oil and merchandise importers on the back of increased global oil prices against slower recovery in the exports and tourism sector.
During the week, the Kenyan shilling remained relatively stable, depreciating marginally by 0.1% against the US dollar to close the week at Kshs 113.9, from Kshs 113.8 recorded the previous week, partly attributable to increased dollar demand from the oil and energy sectors. Key to note, this is the lowest the Kenyan shilling has ever depreciated against the dollar. On a year to date basis, the shilling has depreciated by 0.7% against the dollar, in comparison to the 3.6% depreciation recorded in 2021. We expect the shilling to remain under pressure in 2022 as a result of:
- Increased demand from merchandise traders as they beef up their hard currency positions in anticipation for more trading partners reopening their economies globally,
- An ever present current account deficit due to an imbalance between imports and exports, with Kenya’s current account deficit estimated to come in at 5.4% of GDP in 2021, having expanded by 27.4% in Q3’2021 to Kshs 184.6 bn, from Kshs 145.0 bn recorded in Q3’2020, attributable to a robust increase in merchandise imports by 39.6% to Kshs 321.8 bn in Q3’2021, from Kshs 230.5 bn in Q3’2020,
- The aggressively growing government debt, with Kenya’s public debt having increased at a 10-year CAGR of 18.4% to Kshs 8.0 tn in December 2021, from Kshs 1.5 tn in December 2011 thus putting pressure on forex reserves to service some of the public debt, and,
- Rising global crude oil prices on the back of supply constraints at a time when demand is picking up with the easing of COVID-19 restrictions and as economies reopen. Key to note, risks abound this global recovery following the emergence of the new COVID-19 variants.
The shilling is however expected to be supported by:
- High Forex reserves currently at USD 7.9 bn (equivalent to 4.8-months of import cover), which is above the statutory requirement of maintaining at least 4.0-months of import cover, and the EAC region’s convergence criteria of 4.5-months of import cover. In addition, the reserves were boosted by the USD 1.0 bn proceeds from the Eurobond issued in July 2021 coupled with the USD 972.6 mn IMF disbursement and the USD 130.0 mn World Bank loan financing received in June 2021, and,
- Improving diaspora remittances evidenced by a 21.7% y/y increase to USD 338.7 mn in January 2022, from USD 278.3 mn recorded over the same period in 2021, which has continued to cushion the shilling against further depreciation.
Weekly Highlights:
- February 2022 Inflation
The y/y inflation for the month of February 2022 declined for the fifth consecutive month to 5.1%, from the 5.4% recorded in January 2022, lower than our expectation of 5.3% - 5.7%. The decline is mainly attributable to the slower 4.5% growth in the transport index compared to the 6.8% growth recorded in January 2022. On a month on month basis, the inflation rate came in at 0.4%, driven by a 0.8% increase in food & non-alcoholic beverages coupled with a 0.7% increase in furnishings, household equipment and routine household maintenance. The table below shows a summary of both the year on year and month on month commodity groups’ performance;
|
Major Inflation Changes – February 2022 |
|||
|
Broad Commodity Group |
Price change m/m (February-22/ January-22) |
Price change y/y (February-22/ February-21) |
Reason |
|
Food & Non-Alcoholic Beverages |
0.8% |
8.7% |
The m/m increase was mainly contributed by increase in prices of cooking fat, capsicum, potatoes and sifted maize flour, among other food items. The increase was, however, mitigated by a decline in prices of mangoes, goat milk and cabbages. |
|
Housing, Water, Electricity, Gas and other Fuel |
0.1% |
4.8% |
The m/m increase was mainly attributable to a 0.2% increase in house rent for a single room in February 2022. |
|
Transport Cost |
0.1% |
4.5% |
The m/m marginal increase was as a result of unchanged prices for super petrol, diesel and kerosene during the month. |
|
Overall Inflation |
0.4% |
5.1% |
The m/m increase was driven by a 0.8% increase in food & non-alcoholic beverages coupled with a 0.7% increase in furnishings, household equipment and routine household maintenance. |
Source: KNBS
We expect the inflation rate to remain within the government’s set range of 2.5% - 7.5%. Despite the decline in February’s inflations rates, concerns remain high on the widening trade deficit as global fuel prices continue to rise due to supply bottlenecks. The rising global fuel price, which stood at USD 117.1 per barrel as of 3rd March 2022, marking a 10-year high, is expected to deplete the fuel subsidy program currently in place and further lead to a depreciation of the local currency.
- Stanbic Bank’s Monthly Purchasing Manager’s Index (PMI)
During the week, Stanbic Bank released its monthly Purchasing Manager’s Index (PMI) highlighting that the index for the month of February 2022 increased to 52.9 following a nine-month low of 47.6 recorded in January 2022. The index points towards a strengthened business environment in the country on the back of continued economic recovery as COVID-19 cases continue to decline. Notably, purchasing activity grew at the fastest rate in 16 months, allowing businesses to build their inventories amid greater confidence that sales would continue to rise. However, overall input cost pressures in the Kenyan private sector remained elevated in February 2022 marking a 42 month high since September 2018 occasioned by a rise in input demand coupled with higher taxes as well as rising global fuel prices. Additionally, employment growth declined for the first time in ten months on the back of strained cash flows. The chart below summarizes the evolution of the PMI over the last 24 months:
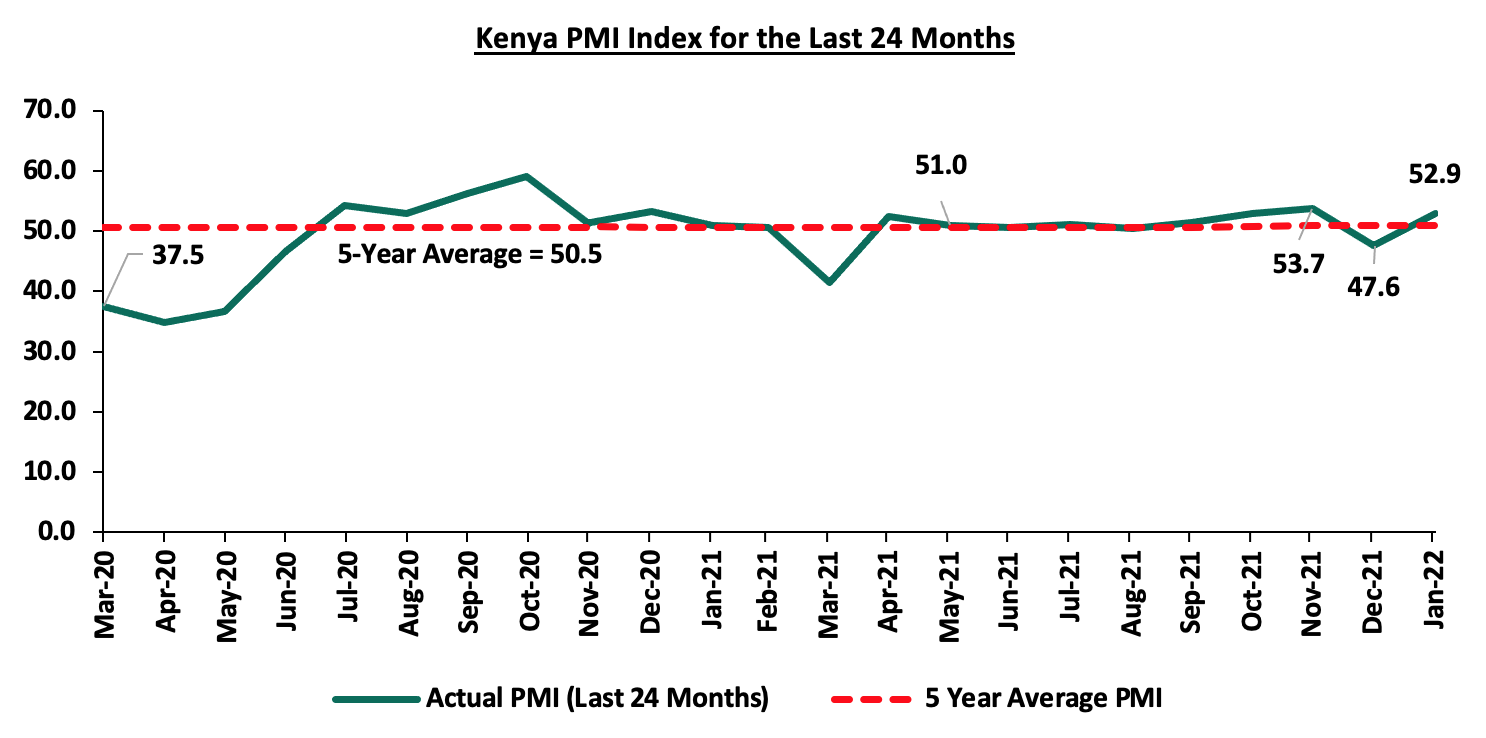
*** Key to note, a reading above 50.0 signals an improvement in business conditions, while readings below 50.0 indicate a deterioration.
Despite the improvement in the PMI index in February 2022, we maintain a cautious outlook in the short-term owing to the increasing cost pressures, high cost of living and political pressures ahead of the August 2022 elections. The existence and emergence of new COVID-19 variants still pose economic uncertainty as it may lead to another wave of infections and consequently tighter restrictions that will further negatively affect the general business environment. In the FY'2021/2022 Supplementary Budget I, the Ministry of Health was allocated Kshs 136.0 bn, a 12.3% increase from the Kshs 121.1 bn original estimates to aid in combating the COVID-19 pandemic and curb its spread through the acquisition of more vaccines. As such, we look forward to see these efforts support the economic recovery and consequently trickle down to improving the country’s PMI as already seen in the February PMI. However, we note that the private sector credit growth has remained relatively muted, coming in at 8.6% in December 2021, lower than the historical average of 10.3%. Further, with fuel being a major input cost to many businesses, we expect the increasing global fuel prices to further contribute to the deterioration of business conditions in the country. Additionally, we believe the stabilization under the fuel subsidy program by the National Treasury is unsustainable given the continued rise in global fuel prices coupled with the diversion of funds under the program to cater for other government expenditure.
Monthly Highlights:
- The National Treasury gazetted the revenue and net expenditures for the first seven months of FY’2021/2022, ending 31st January 2022, highlighting that the total revenue collected as at the end of January 2022 amounted to Kshs 1.1 tn, equivalent to 60.6% of the original estimates of Kshs 1.8 tn and is 103.8% of the prorated estimates of Kshs 1.0 tn while the total expenditure amounted to Kshs 1.6 tn, equivalent to 50.2% of the original estimates of Kshs 3.2 tn, and is 86.1% of the prorated expenditure estimates of Kshs 1.9 tn. For more information, see our Cytonn Weekly #07/2022.
Rates in the Fixed Income market have remained stable due to the relatively ample liquidity in the money market. The government is 11.4% ahead of its prorated borrowing target of Kshs 455.9 bn having borrowed Kshs 508.0 bn of the Kshs 658.5 bn borrowing target for the FY’2021/2022. We expect a gradual economic recovery as evidenced by the revenue collections of Kshs 1.1 tn during the first seven months of the current fiscal year, which was equivalent to 103.8% of the prorated revenue collection target. However, despite the projected high budget deficit of 11.4% and the lower credit rating from S&P Global to 'B' from 'B+', we believe that the support from the IMF and World Bank will mean that the interest rate environment will remain stable since the government is not desperate for cash. Owing to this, our view is that investors should be biased towards short-term fixed-income securities to reduce duration risk.
Markets Performance
During the month of February, the equities market was on a downwards trajectory, with NASI, NSE 20 and NSE 25 declining by 1.9%, 0.1% and 1.6%, respectively. The equities market performance was driven by losses recorded by large cap stocks such as NCBA, Bamburi, EABL and Safaricom of 6.8%, 4.8%, 3.6% and 2.6%, respectively. The losses were however mitigated by gains recorded by stocks such as Stanbic Holdings and BAT of 5.6% and 4.6%, respectively.
During the week, the equities market was on an upward trajectory, with NASI, NSE 20 and NSE 25 gaining by 2.9%, 0.8% and 1.9%, respectively, taking their YTD performance to losses of 1.5%, 0.9% and 1.4% for NASI, NSE 20 and NSE 25, respectively. The equities market performance was driven by gains recorded by large cap stocks such as Safaricom and NCBA of 5.2% and 2.1%, respectively. The gains were however weighed by losses recorded by stocks such as EABL and BAT which both declined by 1.4%.
Equities turnover increased by 20.6% during the month to USD 87.7 mn, from USD 72.7 mn recorded in January 2022. Foreign investors turned net buyers during the month, with a net buying position of USD 1.6 mn, compared to January’s net selling position of USD 3.7 mn.
During the week, equities turnover declined by 0.7% to USD 20.4 mn, from USD 20.5 mn recorded the previous week, taking the YTD turnover to USD 176.2 mn. Foreign investors remained net sellers, with a net selling position of USD 3.0 mn, from a net selling position of USD 3.6 mn recorded the previous week, taking the YTD net selling position to USD 5.4 mn.
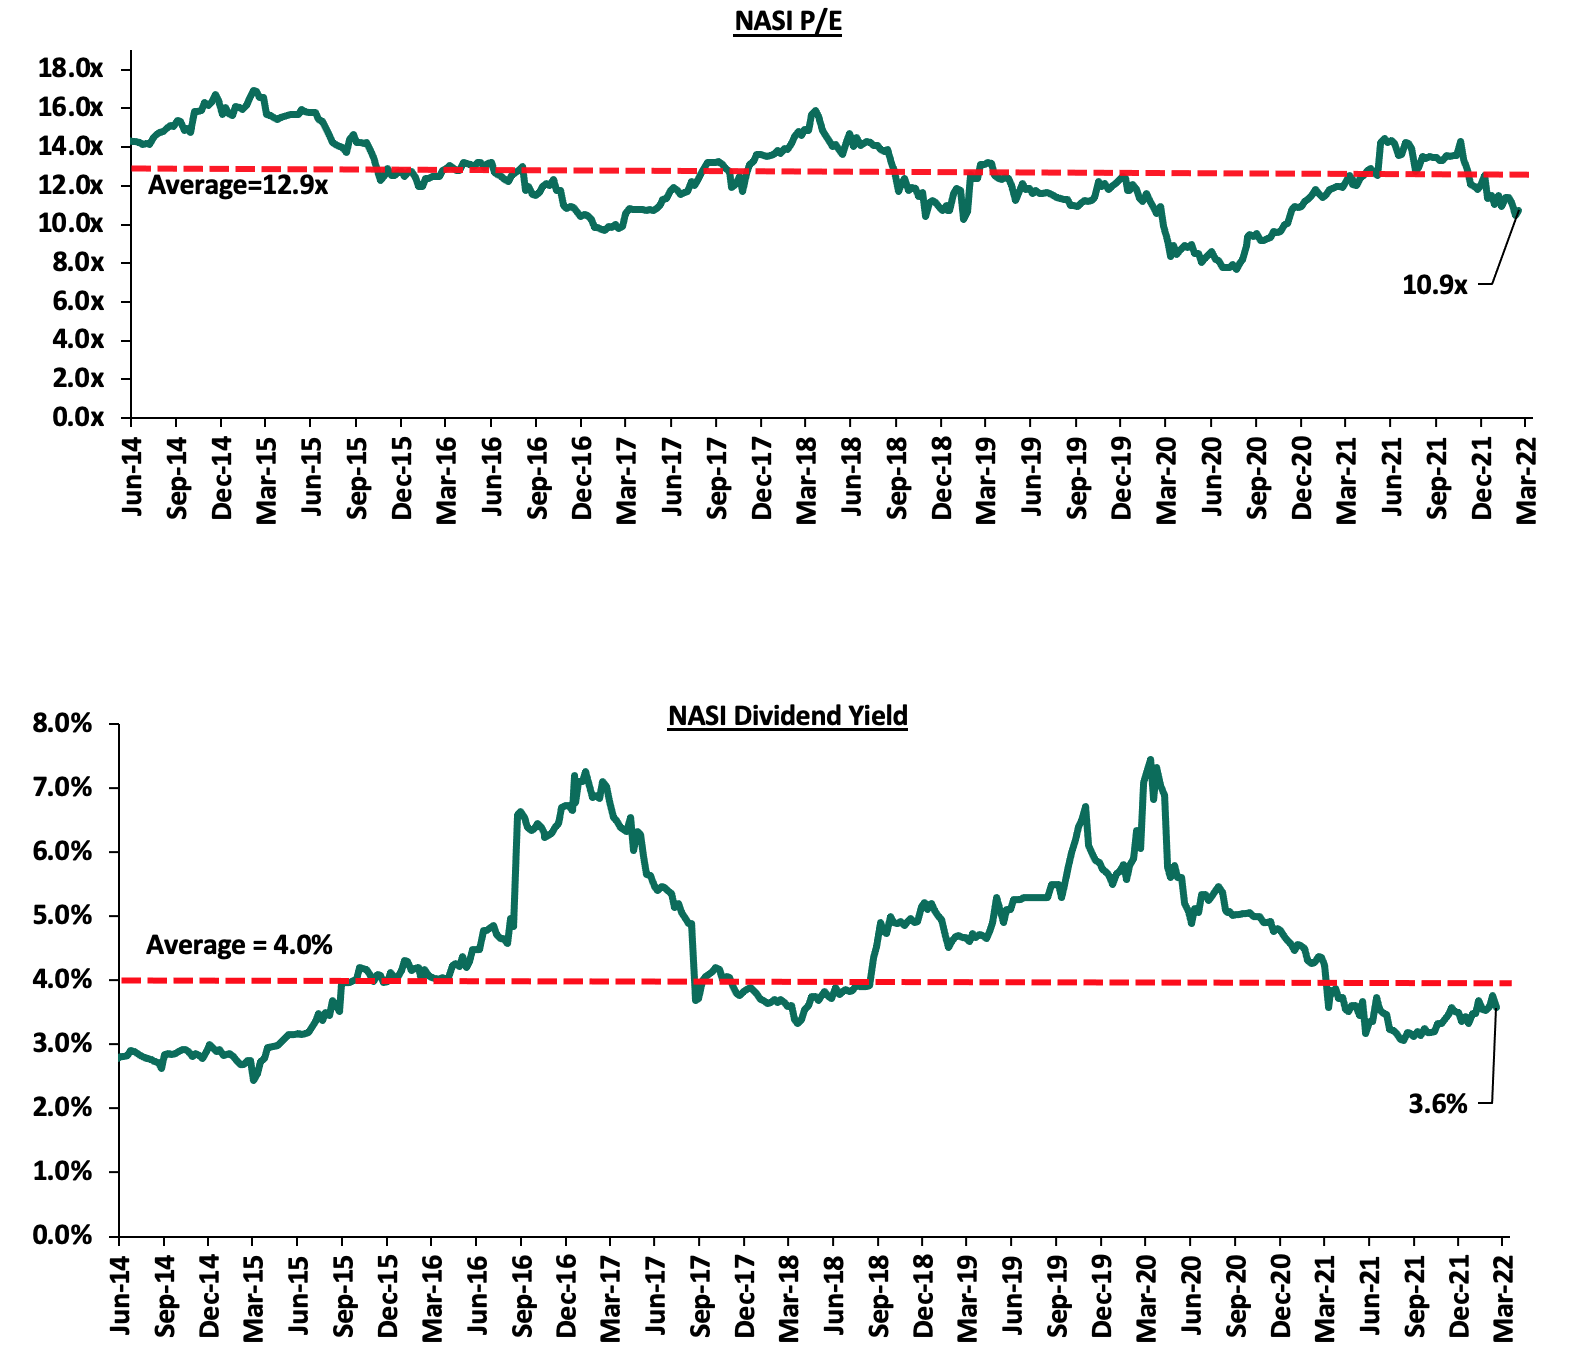
The market is currently trading at a price to earnings ratio (P/E) of 10.9x, 15.8% below the historical average of 12.9x, and a dividend yield of 3.6%, 0.4% points below the historical average of 4.0%. Key to note, NASI’s PEG ratio currently stands at 1.4x, an indication that the market is trading at a premium to its future earnings growth. A PEG ratio greater than 1.0x indicates the market may be overvalued while a PEG ratio less than 1.0x indicates that the market is undervalued. The current P/E valuation of 10.9x is 41.0% above the most recent trough valuation of 7.7x experienced in the first week of August 2020. The charts below indicate the historical P/E and dividend yields of the market.
Monthly highlights:
- Moody’s Rating Agency rated the Kenyan banking sector as stable following the banks’ impressive performance in the eleven months to November 2021, with the profits before tax coming in at Kshs 178.8 bn exceeding the pre-pandemic earnings of Kshs 150.1 bn over the same period in 2019. The gradual economic recovery is expected to support banks in improving their loan quality and profitability, while capital, funding, and liquidity will remain strong, in line with our Q3’2021 Banking Sector report. For more information, please see our Cytonn Weekly #06/2022, and,
- Standard Africa Holdings Limited (SAHL), the majority shareholder in Stanbic Holdings, announced that it had received regulatory approval from the Capital Markets Authority for further extension to acquire increased stake of up to 75.0% in Stanbic Holdings. This comes after SAHL had received an exemption from making a full take-over under the Capital Markets (Take over and Mergers) Regulations, 2002 in July 2018. Under the exemption, SAHL aims to bring its total shareholding to up to 75.0% of Stanbic Holdings’ ordinary shares, from 72.3% as of 31st December 2021. For more information, please see our Cytonn Weekly #07/2022.
Weekly highlight:
Earnings release - Stanbic Holdings
During the week, Stanbic Holdings released its FY’2021 financial results. Below is a summary of the group’s performance;
|
Stanbic Holdings FY’2021 Key Highlights |
||||
|
Balance Sheet |
||||
|
Balance Sheet |
FY'2020 |
FY'2021 |
y/y % change |
|
|
Net Loans |
196.3 |
229.3 |
16.8% |
|
|
Total Assets |
328.6 |
328.9 |
0.1% |
|
|
Deposits |
260.0 |
254.6 |
(2.1%) |
|
|
Deposits per branch |
10.4 |
10.2 |
(2.1%) |
|
|
Total Liabilities |
276.9 |
272.4 |
(1.6%) |
|
|
Shareholders' Funds |
51.7 |
56.5 |
9.1% |
|
|
Income Statement |
||||
|
Income Statement items |
FY'2020 |
FY'2021 |
y/y % change |
|
|
Net interest Income |
12.8 |
14.4 |
12.3% |
|
|
Net non-interest income |
10.4 |
10.6 |
1.7% |
|
|
Total Operating income |
23.2 |
25.0 |
7.5% |
|
|
Loan loss provision |
(4.9) |
(2.5) |
(48.2%) |
|
|
Total Operating expenses |
(12.1) |
(12.7) |
4.7% |
|
|
Profit before tax |
6.2 |
9.8 |
56.7% |
|
|
Profit after tax |
5.2 |
7.2 |
38.8% |
|
|
Core EPS |
13.1 |
18.2 |
38.8% |
|
|
Key Ratios |
||||
|
Ratios |
FY'2020 |
FY'2021 |
y/y % points change |
|
|
Yield from interest-earning assets |
7.2% |
7.0% |
(0.2%) |
|
|
Cost of funding |
3.0% |
2.4% |
(0.6%) |
|
|
Non-Performing Loans (NPL) Ratio |
11.8% |
9.3% |
(2.5%) |
|
|
NPL Coverage |
60.6% |
58.1% |
(2.5%) |
|
|
Loan to Deposit Ratio |
75.5% |
90.1% |
14.6% |
|
|
Net Interest Margin |
5.1% |
5.0% |
(0.1%) |
|
|
Net Interest Income as % of operating income |
55.1% |
57.5% |
2.4% |
|
|
Non-Funded Income as a % of operating income |
44.9% |
42.5% |
(2.4%) |
|
|
Cost to Income Ratio |
52.2% |
50.9% |
(1.3%) |
|
|
Cost to Income Ratio without LLP |
31.2% |
40.8% |
9.5% |
|
|
Return on Average Assets |
1.6% |
2.2% |
0.6% |
|
|
Return on Average Equity |
11.3% |
13.3% |
2.0% |
|
|
Equity to Assets |
12.7% |
15.2% |
2.5% |
|
|
Capital Adequacy Ratios |
||||
|
Ratios |
FY'2020 |
FY'2021 |
% points change |
|
|
Core Capital/Total Liabilities |
18.5% |
18.2% |
(0.3%) |
|
|
Minimum Statutory ratio |
8.0% |
8.0% |
- |
|
|
Excess |
10.5% |
10.2% |
(0.3%) |
|
|
Core Capital/Total Risk Weighted Assets |
16.0% |
15.3% |
(0.7%) |
|
|
Minimum Statutory ratio |
10.5% |
10.5% |
- |
|
|
Excess |
5.5% |
4.8% |
(0.7%) |
|
|
Total Capital/Total Risk Weighted Assets |
18.1% |
17.3% |
(0.8%) |
|
|
Minimum Statutory ratio |
14.5% |
14.5% |
- |
|
|
Excess |
3.6% |
2.8% |
(0.8%) |
|
Key take-outs from the earnings release include;
- Profit after tax increased by 38.8% to Kshs 7.2 bn in FY’2021, from Kshs 5.2 bn in FY’2020. The performance was driven by a 7.5% increase in total operating income to Kshs 25.0 bn in FY’2021, from Kshs 23.2 bn in FY’2020. The increase was however weighed down by the 4.7% increase in total operating expenses to Kshs 12.7 bn, from Kshs 12.1 bn in FY’2020,
- The bank’s interest income grew by 2.1% to Kshs 20.1 bn, from Kshs 19.7 bn in FY’2020 due to a 4.7% increase on interest income from loans and advances to Kshs 15.1 bn, from Kshs 14.4 bn in FY’2020, coupled with a 2.3% growth in interest income from government securities to Kshs 4.6 bn, from Kshs 4.5 bn in FY’2020. The growth in interest income was however weighed down by a 46.6% decline in interest income from deposits with banking institutions to Kshs 0.4 bn, from Kshs 0.8 bn in FY’2020,
- Yield on Interest-Earning Assets (YIEA) declined to 7.0%, from 7.2% in FY’2020 following the 15.9% growth in the average interest earning assets, which outpaced the 2.1% increase in interest income,
- Stanbic Bank’s interest expense declined by 17.2% to Kshs 6.2 bn, from Kshs 7.5 bn in FY’2020, following 13.3% decline in the interest expense on customer deposits to Kshs 5.4 bn, from Kshs 6.3 bn in FY’2020, coupled with a 27.1% decline in interest expenses on Deposits and placements from banking institutions to Kshs 0.4 bn, from Kshs 0.6 bn in FY’2020,
- Net Interest Margin declined to 5.0%, from 5.1% in FY’2020 on the back of the 15.9% increase in the average interest earning assets to Kshs 288.8 bn from Kshs 249.3 bn in FY’2020, which outpaced the 12.3% increase in trailing Net Interest Income to Kshs 4 bn in FY’2021 from Kshs 12.8 bn in FY’2020,
- Total Operating Expenses increased by 4.7% to Kshs 12.7 bn in FY’2021, from Kshs 12.1 bn in FY’2020, attributable to an 8.8% increase in the bank’s staff costs to Kshs 6.2 bn in FY’2021, from Kshs 5.5 bn recorded in Q3’2020 coupled with a 17.2% increase in other expenses to Kshs 5.2 bn, from Kshs 4.4 bn in FY’2020. The increase in total operating expenses was however mitigated by a 48.2% decline in Loan Loss Provisions (LLP) to Kshs 2.5 bn in FY’2021, from Kshs 4.9 bn in FY’2020,
- The balance sheet recorded a slight expansion as total assets grew by 0.1% to Kshs 328.9 bn, from Kshs 328.6 bn in FY’2020. The increase was largely driven by a 16.8% increase in net loans to Kshs 229.3 bn, from Kshs 196.3 bn in FY’2020, as Stanbic focused more on lending, due to the improvement in the business environment as evidenced by the 48.2% reduction in the group’s Loan Loss Provisions (LLPs). The increase was however weighed down by a 32.0% decline in investment securities to Kshs 59.5 bn, from Kshs 87.6 bn in FY’2020,
- Total liabilities declined by 1.6% to Kshs 272.4 bn, from Kshs 276.9 bn in FY’2020, largely driven by a 2.1% decline in the group’s deposits to Kshs 254.6 bn, from Kshs 260.0 bn in FY’2020. On the other hand, borrowings increased by 3.6% to Kshs 5.7 bn from Kshs 5.5 bn in FY’2020,
- Deposits per branch decreased by 2.1% to Kshs 10.2 bn, from Kshs 10.4 bn in FY’2020, as the number of branches remained unchanged at 25,
- Gross Non-Performing Loans (NPLs) decreased by 10.1% to Kshs 22.5 bn, from Kshs 25.0 bn in FY’2020, taking the NPL ratio to 9.3% in FY’2021, from 11.8% in FY’2020. The improvement in the group’s asset quality is attributable to the 10.1% decline in Gross Non-Performing Loans (NPLs) coupled with the 14.6% increase in Gross Loans,
- General Loan Loss Provisions declined by 10.4% to Kshs 8.8 bn, from Kshs 9.8 bn in FY’2020. Consequently, the NPL coverage ratio declined to 58.1% in FY’2021, from 60.6% in FY’2020, an indication of reduced provisioning levels by the bank, and,
- Stanbic Bank is currently sufficiently capitalized with a core capital to risk weighted assets ratio of 15.3%, 4.8% points above the statutory requirement of 10.5%. In addition, the total capital to risk weighted assets ratio stood at 17.3%, exceeding the statutory requirement of 14.5% by 2.8% points. Adjusting for IFRS 9, core capital to risk weighted assets ratio was at 15.4% while total capital to risk weighted assets came in at 17.0%.
For a comprehensive analysis, please see our Stanbic Holdings’ FY’2021 Earnings Note.
Universe of coverage:
|
Company |
Price as at 25/02/2022 |
Price as at 04/03/2022 |
w/w change |
m/m change |
YTD Change |
Year Open 2022 |
Target Price* |
Dividend Yield |
Upside/ Downside** |
P/TBv Multiple |
Recommendation |
|
Kenya Reinsurance |
2.3 |
2.3 |
0.9% |
0.4% |
0.0% |
2.3 |
3.2 |
8.7% |
47.5% |
0.2x |
Buy |
|
Jubilee Holdings |
275.8 |
275.0 |
(0.3%) |
(8.1%) |
(13.2%) |
316.8 |
381.7 |
3.3% |
42.1% |
0.5x |
Buy |
|
I&M Group*** |
21.3 |
21.1 |
(0.9%) |
(0.5%) |
(1.4%) |
21.4 |
24.4 |
10.7% |
26.2% |
0.6x |
Buy |
|
Liberty Holdings |
7.3 |
6.6 |
(8.8%) |
(1.8%) |
(6.2%) |
7.1 |
7.7 |
0.0% |
15.7% |
0.5x |
Accumulate |
|
KCB Group*** |
45.0 |
45.4 |
0.9% |
0.0% |
(0.4%) |
45.6 |
51.4 |
2.2% |
15.4% |
0.9x |
Accumulate |
|
Britam |
6.9 |
6.9 |
0.9% |
(2.0%) |
(8.2%) |
7.6 |
7.9 |
0.0% |
13.5% |
1.1x |
Accumulate |
|
NCBA*** |
24.2 |
24.7 |
2.1% |
(6.8%) |
(2.9%) |
25.5 |
26.4 |
6.1% |
12.9% |
0.6x |
Accumulate |
|
Standard Chartered*** |
132.3 |
132.0 |
(0.2%) |
0.0% |
1.5% |
130.0 |
137.7 |
8.0% |
12.3% |
1.0x |
Accumulate |
|
Equity Group*** |
51.8 |
51.8 |
0.0% |
(1.0%) |
(1.9%) |
52.8 |
56.6 |
0.0% |
9.4% |
1.3x |
Hold |
|
Diamond Trust Bank*** |
57.0 |
56.5 |
(0.9%) |
(2.6%) |
(5.0%) |
59.5 |
61.8 |
0.0% |
9.3% |
0.2x |
Hold |
|
Co-op Bank*** |
12.9 |
13.0 |
0.8% |
(0.4%) |
(0.4%) |
13.0 |
13.1 |
7.7% |
8.6% |
1.0x |
Hold |
|
Stanbic Holdings |
94.3 |
99.8 |
5.8% |
5.6% |
14.7% |
87.0 |
94.7 |
9.0% |
4.0% |
0.9x |
Lighten |
|
Sanlam |
15.0 |
11.9 |
(20.7%) |
38.6% |
3.0% |
11.6 |
12.1 |
0.0% |
1.4% |
1.3x |
Lighten |
|
ABSA Bank*** |
12.0 |
12.0 |
(0.4%) |
0.4% |
1.7% |
11.8 |
11.9 |
0.0% |
(0.3%) |
1.2x |
Sell |
|
CIC Group |
2.2 |
2.0 |
(6.5%) |
(0.9%) |
(6.5%) |
2.2 |
1.9 |
0.0% |
(7.2%) |
0.7x |
Sell |
|
HF Group |
3.4 |
3.4 |
(1.7%) |
(2.6%) |
(11.1%) |
3.8 |
3.0 |
0.0% |
(12.6%) |
0.2x |
Sell |
|
*Target Price as per Cytonn Analyst estimates **Upside/ (Downside) is adjusted for Dividend Yield ***For Disclosure, these are stocks in which Cytonn and/or its affiliates are invested in |
|||||||||||
We are “Neutral” on the Equities markets in the short term. With the market currently trading at a premium to its future growth (PEG Ratio at 1.4x), we believe that investors should reposition towards value stocks with strong earnings growth and that are trading at discounts to their intrinsic value. We expect the discovery of new COVID-19 variants, the upcoming Kenyan general elections and the slow vaccine rollout to continue weighing down the economic outlook. On the upside, we believe that the relaxation of lockdown measures in the country will lead to improved investor sentiments in the economy.
- Industry Reports
During the month of February, two industry reports were released, namely:
|
# |
Theme |
Report |
Key Take-outs |
|
1 |
General Real Estate |
Leading Economic Indicators (LEI)-December 2021, by the Kenya National Bureau of Statistics (KNBS) |
|
|
Kenya Market Update H2’2021, by Knight Frank Kenya
|
|
The overall Real Estate sector continues to demonstrate pockets of recovery evidenced by the improving performance in key themes such as; i) the retail sector whose prime rental rates increased by 2.6% in H2’2021, ii) the commercial office sector whose prime rental rates increased by 9.0% in H2’2021, and, iii) residential sector which witnessed a 1.2% improvement in the average prime selling prices in H2’2021. This is also supported by the increasing number of visitor arrivals into the country by 15.2% to 90,504 in December 2021, from the 76,706 recorded the previous month coupled with improved construction activities evidenced by the increase in the value of approvals. As such, we expect the performance of the Real Estate sector to pick up during the year.
- Residential Sector
Notable highlights in the sector during the month include;
- The Nairobi Metropolitan Services (NMS) began the redevelopment of 10 various estates in Nairobi County, with an aim of constructing 60,000 affordable housing units. These units are part of the second phase of the Nairobi estates redevelopment programme. They are expected to; i) provide low cost homes to residents targeting affordable developments, ii) improve living standards of residents through easing the accessibility to decent homes, and, iii) improve the low home ownership rates in Kenya which is currently at 21.3% in urban areas as at 2020. For more information, see Cytonn Weekly #08/2022,
- The Capital Markets Authority (CMA) announcedthat the first tranche of the Kshs 10.5 bn Kenya Mortgage Refinance Company’s (KMRC) Medium Term Note (MTN) program recorded an oversubscription of 478.6%, attributable to the attractive returns offered by the bond of 12.5%. KMRC aimed to raise a total of Kshs 1.4 bn in the first tranche, received bids worth Kshs 8.1 bn and only accepted bids worth Kshs 1.4 bn. For more information, see Cytonn Weekly #08/2022,
- Centum Real Estate completed and handed over Riverbank apartments to clients. The project broke ground in August 2019 and has taken approximately 36 months to complete. This marks the handover of 160 units in a project that has a deal pipeline of more than 1,500 residential units planned within the 102-Acre master-planned Two Rivers Development. For more information, see Cytonn Weekly #07/2022,
- Shelter Afrique, a Pan African housing company announced plans to issue a bond in East Africa, in the Kenyan Capital Market through the NSE aiming to raise USD 500.0 mn (Kshs 56.9 bn). The funds raised from the bond will be used to finance upcoming affordable housing projects within East Africa with a keen eye on the Kenyan market. (Details about the tenor and the interest rates of the bond are yet to be disclosed.) For more information, see Cytonn Weekly #07/2022,
- Property developer Acorn Group began construction of two new hostels worth Kshs 2.5 bn next to the University of Nairobi Chiromo Campus along Science Crescent Road, off Riverside Road, following an announcement they made in November 2020. The focus on modern student housing continues to gain traction supported by: (i) Student housing deficit, (ii) The need to accommodate and attract international students seeking higher education, and, (iii) Attractive returns evidenced by relatively high yields of 7.3% as per the Cytonn Student Housing Market Kenya Research. For more information, see Cytonn Weekly #06/2022, and,
- Royal Group Industries, a fully Kenyan-owned company, through its Director Yusuf Hassanali, announced that approximately 202 of the 605 units at the Bondeni Affordable Housing Project in Nakuru City, were sold to clients. For more information, see Cytonn Weekly #06/2022.
The residential sector is expected to continue recording more activities as a result of; i) efforts by investors to complete and hand over developments, ii) continued focus on affordable housing, iii) efforts by the government through KMRC to provide affordable mortgages, and, iv) investor focus on student housing.
- Retail Sector
During the week, QuickMart Supermarket, a local retail chain opened its 50th outlet in Machakos County along Wote Road. This marks the retailer’s first store in Machakos County thereby expanding its presence into 14 counties within the country. The move signals stiff competition against key retailers such as Naivas and Carrefour who have also been on an aggressive expansion drive having opened 12 and 7 outlets, respectively since the beginning of 2021, compared to the 13 outlets opened by QuickMart in the same period. The move to open a new store in Machakos is supported by;
- Positive demographics evidenced by the 29.4% population growth in Machakos country to a population 4 mn in 2019 from 1.1 mn people in 2009 according to the Kenya population and Housing Census Report by the Kenya National Bureau (KNBS),
- The strategic location of the outlet, which is opposite the Machakos Level 5 hospital targeting shoppers around the region, and,
- Availability of infrastructure servicing the area such as Wote Road hence promoting accessibility.
In terms of performance, according to our Kenya Retail Report-2021, the retail sector recorded an average rental yield of 6.8% in 2021 0.1% points higher than the 6.7% recorded in 2020 signaling improvement in the Kenyan retail market. The table below shows a summary of the performance of the retail sector in key urban Regions in Kenya;
|
Summary of Retail Performance in Key Regions in Kenya - 2021 |
|||
|
Region |
Rent per SQM (Kshs) 2021 |
Occupancy Rate 2021 |
Rental yield 2021 |
|
Mount Kenya |
128 |
81.7% |
7.9% |
|
Nairobi |
168 |
75.8% |
7.5% |
|
Mombasa |
119 |
77.6% |
6.8% |
|
Kisumu |
101 |
74.6% |
6.4% |
|
Eldoret |
131 |
80.8% |
6.3% |
|
Nakuru |
59 |
80.0% |
6.1% |
|
Average |
118 |
78.4% |
6.8% |
Source: Cytonn Research 2021
The table below shows the summary of the number of stores of the key local and international retailer supermarket chains in Kenya;
|
Main Local and International Retail Supermarket Chains |
||||||||||
|
Name of Retailer |
Category |
Highest number of branches that have ever existed as at FY’2018 |
Highest number of branches that have ever existed as at FY’2019 |
Highest number of branches that have ever existed as at FY’2020 |
Highest number of branches that have ever existed as at FY’2021 |
Number of branches opened in 2022 |
Closed branches |
Current number of Branches |
Number of branches expected to be opened |
Projected number of branches FY’2022 |
|
Naivas |
Local |
46 |
61 |
69 |
79 |
2 |
0 |
81 |
0 |
81 |
|
QuickMart |
Local |
10 |
29 |
37 |
48 |
2 |
0 |
50 |
0 |
50 |
|
Chandarana |
Local |
14 |
19 |
20 |
23 |
1 |
1 |
24 |
4 |
28 |
|
Carrefour |
International |
6 |
7 |
9 |
16 |
0 |
0 |
16 |
0 |
16 |
|
Cleanshelf |
Local |
9 |
10 |
11 |
12 |
0 |
0 |
12 |
0 |
12 |
|
Tuskys |
Local |
53 |
64 |
64 |
3 |
0 |
61 |
3 |
0 |
3 |
|
Game Stores |
International |
2 |
2 |
3 |
3 |
0 |
0 |
3 |
0 |
3 |
|
Uchumi |
Local |
37 |
37 |
37 |
2 |
0 |
35 |
2 |
0 |
2 |
|
Choppies |
International |
13 |
15 |
15 |
0 |
0 |
13 |
0 |
0 |
0 |
|
Shoprite |
International |
2 |
4 |
4 |
0 |
0 |
4 |
0 |
0 |
0 |
|
Nakumatt |
Local |
65 |
65 |
65 |
0 |
0 |
65 |
0 |
0 |
0 |
|
Total |
|
257 |
313 |
334 |
186 |
5 |
179 |
191 |
4 |
195 |
Source: Online Search
Additionally, Optica Limited, a local eyewear retailer opened a new outlet at Imaara Mall in Imara Daima along Mombasa Road bringing its total outlets in the country to 55. This move as part of the retailer’s expansion plan is driven by:
- Strategic location of the store, along Mombasa Road guaranteeing a high footfall,
- Availability of prime retail space for uptake, and,
- Demand of eyewear as the public is also adopting prescription sunglasses for vision correction and protection against UV rays.
In terms of performance, according to the Cytonn Annual Markets Review 2021, Mombasa Road where Imaara Mall lies recorded an average rent per SQFT of Kshs 148 in FY’2021 compared to the market average of Kshs 170 per SQFT, thereby supporting the retailer’s decision to open the new store in the area due to affordability. The table below shows the submarket performance of nodes in the Nairobi Metropolitan Area (NMA);
|
Nairobi Metropolitan Area Retail Market Performance FY’2021 |
|||
|
Area |
Rent Kshs /SQFT FY’2021 |
Occupancy FY’2021 |
Rental Yield FY’2021 |
|
Westlands |
213 |
78.8% |
10.0% |
|
Karen |
202 |
84.0% |
9.8% |
|
Kilimani |
183 |
86.0% |
9.8% |
|
Ngong Road |
171 |
79.0% |
7.7% |
|
Kiambu road |
180 |
74.2% |
7.7% |
|
Mombasa road |
148 |
75.0% |
6.8% |
|
Thika Road |
161 |
74.0% |
6.7% |
|
Satellite towns |
142 |
69.0% |
6.2% |
|
Eastlands |
133 |
71.6% |
5.6% |
|
Average |
170 |
76.8% |
7.8% |
Source: Cytonn Research 2021
Other notable highlights in the retail sector during the month include;
- Naivas Supermarket, a local retail chain opened two new outlets, one at new Imaara Mall along Mombasa road and the other one at Greenspan Mall in Donholm in a space that was previously occupied by Tuskys supermarket. This brings the retailer’s total operating outlets to 81 having opened 10 outlets in 2021. For more information, see Cytonn Weekly #08/2022, and, Cytonn Weekly #07/2022,
- Chicken Cottage, a UK fast-food chain announced a partnership deal with Express Kitchen, a subsidiary of AAH Limited to open 50 outlets at Hass Petroleum’s service stations in Kenya, Rwanda, Tanzania and Uganda this year. The first outlet is scheduled to be opened in Nairobi in April 2022. For more information, see Cytonn Weekly #06/2022, and,
- Chandarana Foodplus Supermarket, a local retail chain, announced plans to open 4 outlets over the next four months leading to June 2022. Three of these will be large size convenience stores which will be located in Riverside, Thigiri, and General Mathenge in Westlands, and 1 will be located in an undisclosed mall outside Nairobi. This move will see Chandarana expand its footprint in the country and increase its outlets to 28. For more information, see Cytonn Weekly #06/2022.
The performance of the retail sector is expected to be supported by; i) the rapid expansion by key local and international retailers taking up new and previous spaces left by troubled retailers, ii) positive demographics evidenced by Kenya’s high urbanization and population growth rates of 4.0% p.a. and 2.3% p.a., respectively, against the global average of 1.8% p.a. and 1.0% p.a., respectively, as at 2020 according to the World Bank, iii) improvement in infrastructure promoting accessibility to retail centers, and, iv) improved business environment following the reopening of the economy. However, the sector’s performance continues to be subdued by; i) the existing oversupply of 1.7mn SQFT in the Kenyan retail sector, and, 3.0 mn SQFT in the (NMA) Nairobi Metropolitan Area retail sector, ii) the growing popularity of e-commerce, and, iii) business uncertainties brought about by the incoming elections.
- Land
The Lands Cabinet Secretary, Farida Karoney announced that the digitization of the land records in Nairobi County will be completed in June 2022 and by the end of 2024 for the entire country. The aim of digitizing land records is to ease registration of properties and to improve transparency when conducting land transactions. To facilitate the process, President Uhuru Kenyatta launched the National Land Information Management System (NLIMS) named “Ardhi Sasa” in April 2021. This new platform is also expected to reduce fraudulent transactions such as land grabbing that have plagued the sector for decades. For more analysis on the digitization of land records, see Cytonn Monthly April-2021
- Listed Real Estate
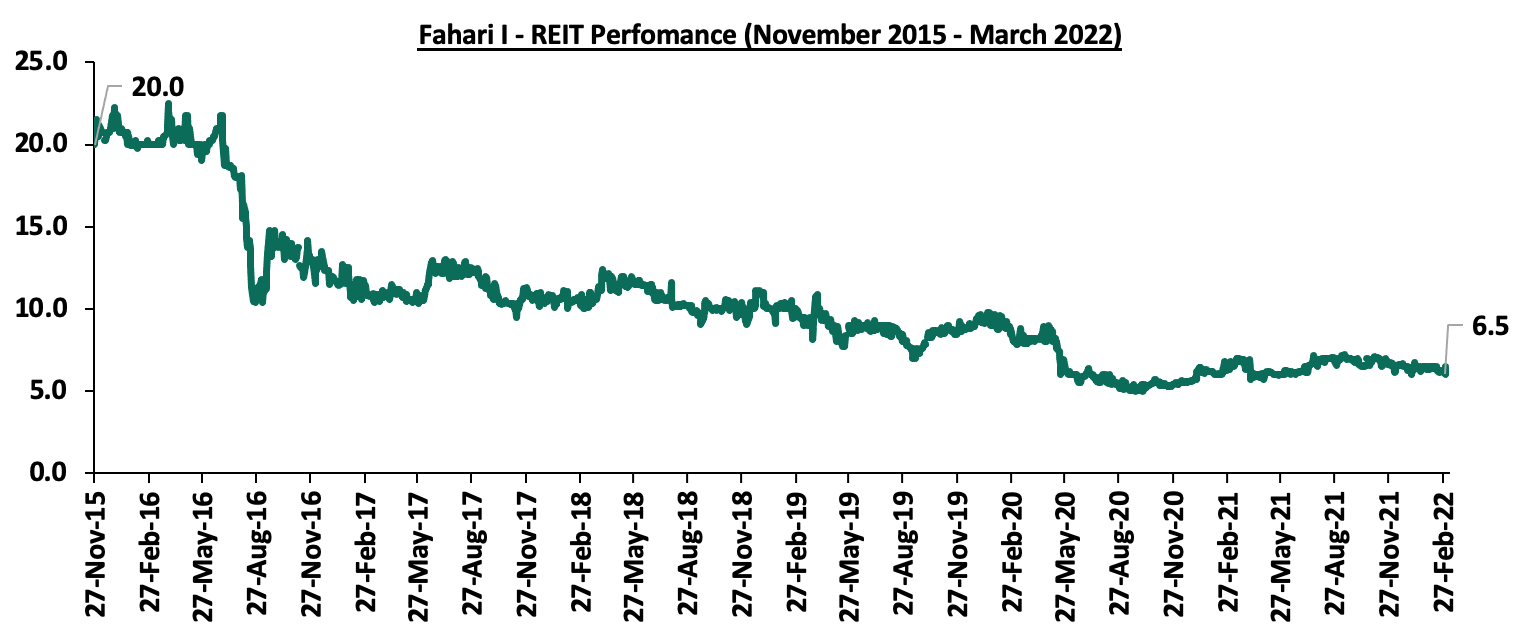
In the Nairobi Stock Exchange, ILAM Fahari I-REIT closed the week trading at an average price of Kshs 6.5 per share. This represented a 4.6% and 1.5% Week-to-Date (WTD) and Year-to-Date (YTD) increase, from Kshs 6.2 per share and Kshs 6.4 per share, respectively. On Inception-to-Date (ITD) basis, the REIT’s performance continues to be weighed down having realized a 67.5% decline from Kshs 20.0. The Kenyan REIT market performance continues to be weighed down by; i) a general lack of knowledge on the financing instrument, ii) general lack of interest of the REIT by investors, and, iii) lengthy approval processes to get all the necessary requirements thus discouraging those interested in investing in it. The graph below shows Fahari I-REIT’s performance from November 2015 to March 2022:
The Kenyan Real Estate market is expected to be on an upward trajectory driven by; i) increased visitor arrivals which is expected to boost the performance of hotels and serviced apartments, ii) an increase in construction activities, iii) continued focus on affordable housing, iv) efforts by the government to avail mortgages at affordable rates through the KMRC, v) aggressive expansion by local and international retailers and vi) efforts by the government to streamline land transactions through the National Land Information Management System (NLIMS). However, the performance of the sector is expected to be weighed down by the low investor appetite in REITS.
Disclaimer: The views expressed in this publication are those of the writers where particulars are not warranted. This publication, which is in compliance with Section 2 of the Capital Markets Authority Act Cap 485A, is meant for general information only and is not a warranty, representation, advice or solicitation of any nature. Readers are advised in all circumstances to seek the advice of a registered investment advisor.

- Talk to us
- Kenya
- P.O Box 20695 - 00200, Nairobi, Kenya
- Cell +254709101200
- Tel +254709101200
- WhatsApp +254741676635
- United States
- +254709101200
- DOWNLOAD OUR APP
-


- Kenya
- 8th Floor, Pinetree Plaza, Kaburu Drive, Ngong Road, Nairobi, Kenya
- USA
- Suite 1150, 1775 Eye Street NW, USA, Washington DC 20006, USA
- Investments
- High Yield
- Private Equity
- Real Estate
- Real Estate
- RiverRun Estates
- Cytonn Towers
- The Ridge
- Taraji Heights
- The Alma