Cytonn Monthly - May 2020
By Cytonn Research Team, May 31, 2020
Executive Summary
Fixed Income
During the month of May, T-bill auctions recorded an oversubscription, with the overall subscription rate coming in at 103.7%, compared to 72.8% recorded in the month of April. The oversubscription is attributable to high liquidity in the money markets during the month supported by government payments. The subscription rates for the 91-day, 182-day and 364-day paper rose to 151.3%, 61.5% and 126.8%, respectively. The inflation for May 2020 declined marginally to 5.5%, from 5.6% recorded in April, in line with our projections of 5.5% - 5.7%. The decrease was due to a higher base effect despite which offset the 0.9% increase in the food and non-alcoholic drinks’ index. The Monetary Policy Committee (MPC) met on 27th May 2020 to review the prevailing macroeconomic conditions and decide on the direction of the Central Bank Rate (CBR). The MPC maintained the CBR at 7.0%, which in line with our expectations in our MPC May 2020 Note;
Equities
During the month of May, the equities market was on a downward trajectory, with NASI, NSE 20 and NSE 25 declining by 1.8%, 0.5% and 2.7%, respectively. The equities market performance during the month was driven by losses recorded by Diamond Trust Bank (DTBK), Standard Chartered Bank, Equity Group and EABL, of 14.2%, 11.5%, 6.4% and 6.2%, respectively. During the week, the market was on a downward trajectory, with both NASI and the NSE 25 declining by 2.3%, while the NSE 20 declined by 3.3%, taking their YTD performance to losses of 17.6%, 21.9% and 26.6%, respectively. The performance of the NASI was driven by losses recorded by large-cap stocks such as Standard Chartered Bank, Diamond Trust Bank (DTBK), Safaricom, Equity and KCB of 4.2%, 3.7%, 2.7%, 2.5% and 2.3%, respectively. During the month, the Central Bank of Kenya (CBK), disclosed that Kenya’s seven largest banks had restructured loans amounting to Kshs 176.0 bn in April, equivalent to 6.4% of the industry’s total gross loan book of Kshs 2.8 tn as at January 2020. KCB Group, Co-operative Bank, NCBA Group, Diamond Trust Bank, Equity Group, HF Group, I&M, ABSA, Stanbic Bank and Standard Chartered Bank released their Q1’2020 financial results;
Real Estate
During the month of May, various real estate industry reports were released, namely: the Housing Price Index Q1’2020 report, Hass Property Index Q1’2020, and, Hass Land Price Index Q1’2020. In the residential sector, the Kitui County Government rolled out an affordable housing programme aimed at developing approximately 1,980 modern houses for its residents. In the retail sector, local retailer, Tuskys Supermarket, closed down their branch in Mtwapa, Mombasa, attributed to strained revenues due to reduced demand, while local retailer, Quickmart supermarket, opened its first store in Nairobi’s Central Business District (CBD), along Tom Mboya Street. In the hospitality sector, Fairmont Hotels and Resorts, announced indefinite closure of Norfolk Hotel in Nairobi due to uncertainties and financial constraints in the wake of the coronavirus pandemic, while hotel chain, Sarova Hotels, announced that it would stop managing Sarova Taita Hills Game Lodge and Sarova Salt Lick Game Lodge after 13 years of the management deal. In the industrial sector, Sameer Africa, a local company whose principal business is the importation and sale of tyres, announced that it would be turning its focus to its real estate business after closing its tyre distribution business citing losses as a result of stiff competition from cheap imports. In infrastructure, Water and Sanitation Cabinet Secretary, Sicily Kariuki unveiled a Kshs 1.3 bn Kiambu-Ruaka water supply and sewerage project whereas in statutory review, National Treasury Cabinet Secretary, Ukur Yatani published regulations aimed at guiding the recent amendment to Section 38 of the Retirement Benefits Act, allowing pensioners to use a portion of their pension savings to purchase a residential home. Finally, in listed real estate, Stanlib Fahari I-REIT’s price per share declined by 30.0% to close at Kshs 6.3 at the end of May, compared to Kshs 9.0 at the end of April 2020, in addition to ICEA Lion Asset Management (ILAM) announcing that it had completed a transaction with Stanlib Kenya Limited (SKL) that will see it acquire the latter’s role of managing property fund Stanlib Fahari I-REIT.
- Weekly Rates:
- Cytonn Money Market Fund closed the week at a yield of 10.77% p.a. To subscribe, just dial *809#;
- Cytonn High Yield Fund closed the week at a yield of 14.20% p.a. To subscribe, email us at sales@cytonn.com;
- David King'oo, Senior Internal Audit Associate at Cytonn Investments, was on NTV to talk about the effect of Corona pandemic on the business community. Watch David here;
- Phase 1 of The Alma is now 100% sold with early buyers having achieved up to 55% capital appreciation. We are now running promotions:
- For Phase 2: Buy a unit in Phase 2 with a 15-year payment plan and 0% deposit;
- For Phase 1: Get a 10% rent discount on units we manage for investors;
- For inquiries, please email us on clientservices@cytonn.com;
- For an exclusive tour of Cytonn’s real estate developments, visit: Sharp Investor's Tour and for more information, email us at sales@cytonn.com;
- We continue to offer Wealth Management Training daily, from 9:00 am to 11:00 am, through our Cytonn Foundation. The aim of the training is to grow financial literacy among the general public. To register for any of our Wealth Management Training, click here;
- If interested in our Private Wealth Management Training for your employees or investment group, please get in touch with us through wmt@cytonn.com;
- For recent news about the company, see our news section here;
- We have 10 investment-ready projects, offering attractive development and buyer targeted returns. See further details here: Summary of Investment-ready Projects.
Money Markets, T-Bills & T-Bonds Primary Auction:
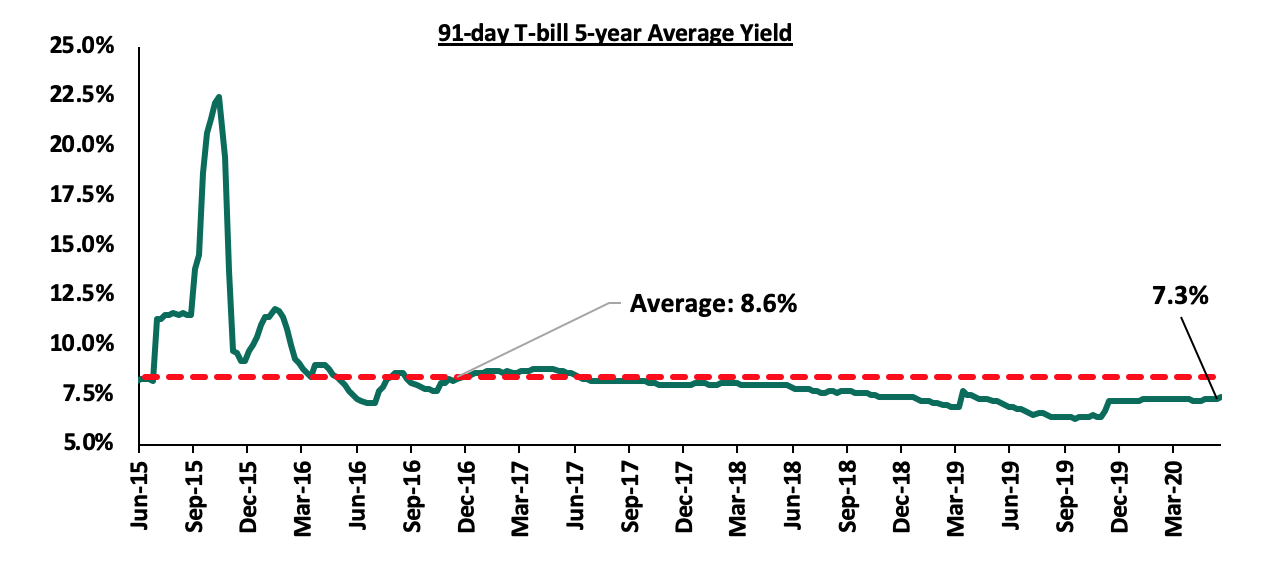
During the month of May, T-bill auctions recorded an oversubscription, with the overall subscription rate coming in at 103.7%, compared to 72.8% recorded in the month of April. The oversubscription is attributable to high liquidity in the money markets during the month supported by government payments. The subscription rates for the 91-day, 182-day and 364-day paper rose to 151.3%, 61.5% and 126.8%, respectively, from the 86.8%, 28.4% and 111.7% recorded in April. The Central Bank remained disciplined in rejecting expensive bids in order to ensure the stability of interest rates as evidenced by them rejecting expensive bids and therefore leading to a marginal increase of 0.1% points to 7.3%, 8.2% and 9.2%, respectively across the various tenors 91-day, 182-day and 364-day papers. The T-bills acceptance rate came in at 80.1% during the month, compared to 97.2% recorded in April, with the government accepting a total of Kshs 79.7 bn of the Kshs 99.5 bn worth of bids received.
During the week, T-bills were oversubscribed, with the subscription rate coming in at 102.5%, down from 149.3% the previous week. The subscription rate of the 91-day and 182-day papers declined to 81.3% and 58.4%, respectively, from 271.0% and 104.9% recorded the previous week, respectively. The subscription rate for the 364-day paper however improved to 155.0%, from 145.0% recorded the previous week. The yields on the 91-day, 182-day and 364-day papers remained unchanged at 7.3%, 8.2% and 9.2%, respectively. The acceptance rate declined to 58.5%, from 74.1% recorded the previous week, with the government accepting Kshs 14.4 bn of the Kshs 24.6 bn bids received.
The 91-day T-bill is currently trading at a yield of 7.3%, which is below its 5-year average of 8.6%. The yield has, however, increased surpassing the 2019 average of 6.9% mainly attributable to the repeal of interest rate cap, which has seen increased lending to the private sector, forcing the government to accept expensive bids in order to secure funds from investors to meet their domestic borrowing target.
For the month of May and away from the norm of issuing a bond once in a month the government initially issued a Five-year bond and later re-opened the same bond; FXD1/2020/5 with a coupon of 11.7% which was market-determined. The initial amount they sought to raise was Kshs 50 bn and the subsequent amount was Kshs 30bn. The bond was undersubscribed in both the issues receiving subscriptions of 69.1% and 68.6% during the initial issue and the reopen, respectively. The under subscription was partly attributable to investors' uncertainty and increased risk perception as the country was downgraded by Moody’s and the expectation of high rates due to increased need by the government to borrow more in line with the budget for 2019/2020. The yield on the 5-year bond came in at 11.8% and 11.7% respectively for the issue and re-open, with the government accepting Kshs 20.8 bn out of the Kshs 34.5 bn worth of bids received, translating to an acceptance rate of 60.2%, and Kshs 8.9 bn out of the Kshs 20.6 bn worth of bids received, translating to an acceptance rate of 43.5%, respectively.
The government also issued an infrastructure bond, IFB1/2020/6 with an effective tenor of 6.0 years and a coupon rate of 10.2% in a bid to raise Kshs 25.6 bn for funding of infrastructure projects in the FY’2019/20 budget estimates. The bond was undersubscribed with the subscription rate coming in at 82.7%, with the government receiving bids worth Kshs 21.2 bn out of the Kshs 25.6 bn offered. The yield came in at 11.6% with the government accepting Kshs 19.3 bn worth of bids received, translating to an acceptance rate of 91.1%.
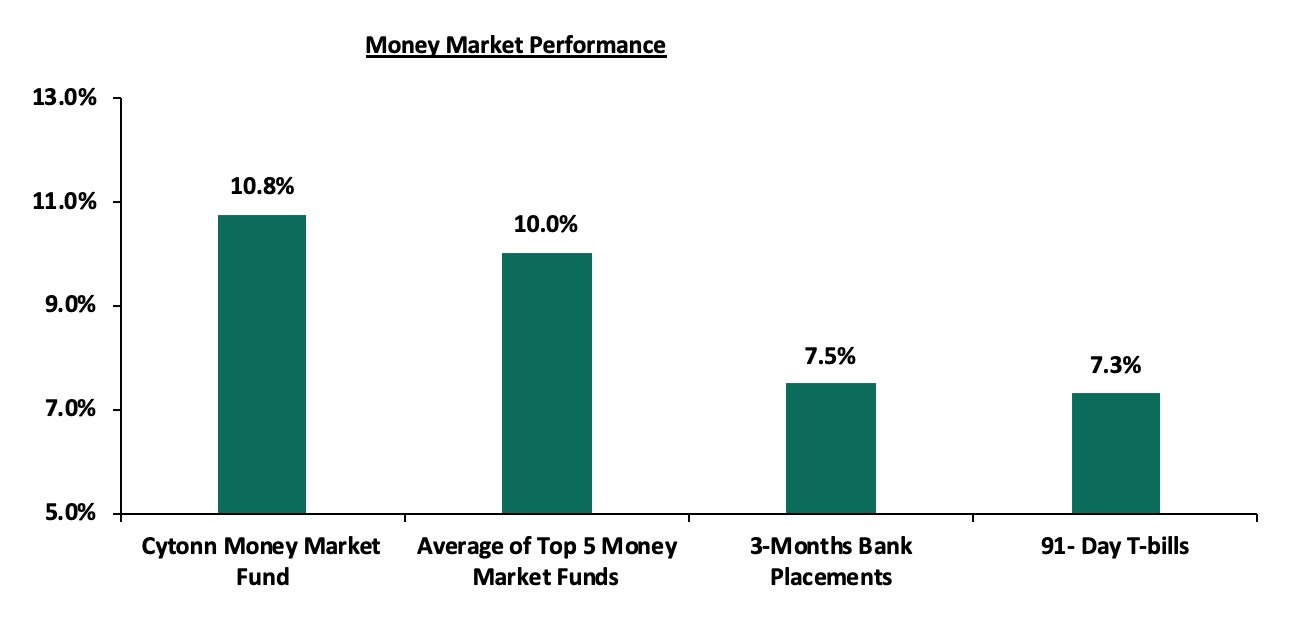
In the money markets, yields on the short term papers remained unchanged at 7.3% and 10.0% for the 91-day T-bill and the average yield of top 5 money market funds, while the yield on 3-month bank placements declined to 7.5% from 7.9% recorded the previous week. The yield on the Cytonn Money Market Fund increased marginally by 0.1% points to close the week at 10.8% from 10.7% recorded the previous week.
Secondary Bond Market:
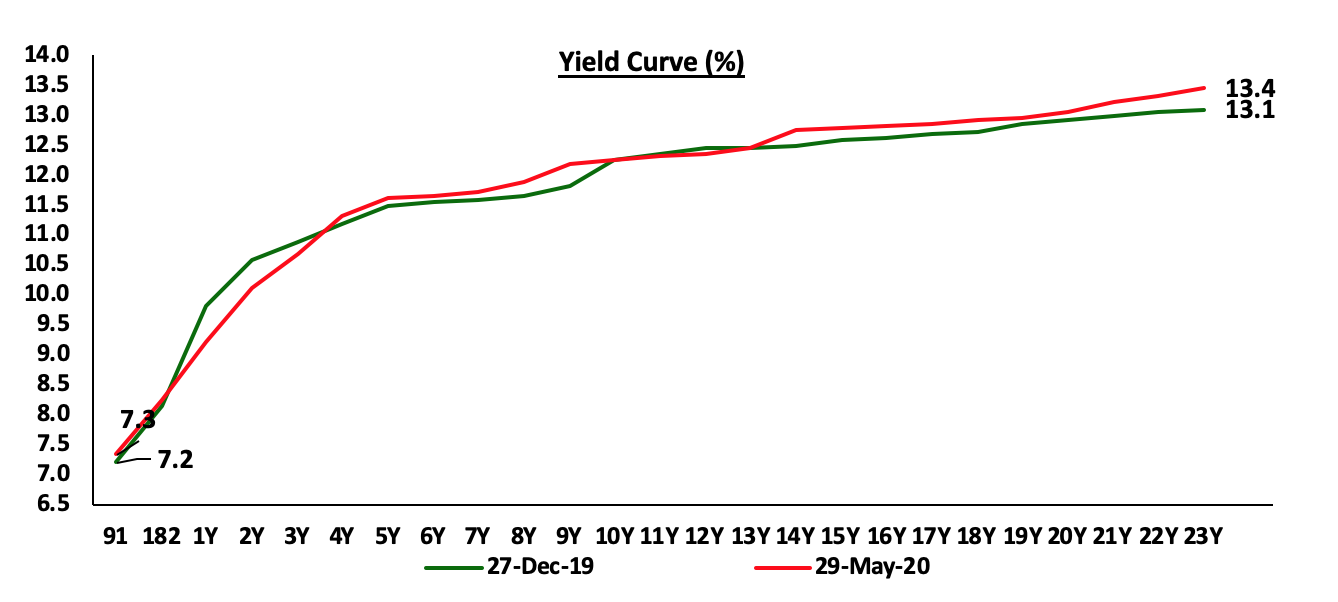
According to the FTSE NSE Kenya Government Bond Index, the secondary market lost by 0.2% during the month closing the month at 96.5 from 96.7, recorded in April, with most papers having declined YTD as yields readjust upwards with the exception of the 1 – 3 year papers and 11 – 13 year papers.
Liquidity:
Liquidity in the money markets eased during the month of May with the average interbank rate declining to 4.1%, from 5.3% recorded in April mainly supported government payments and tax refunds done during the month, and the reduction of the Cash Reserve Ratio (CRR) to 4.25%, from 5.25% previously, by the Monetary Policy Committee (MPC) during its March 2020 sitting. The reduction in (CRR) freed up Kshs 35.2 bn to provide additional liquidity to commercial banks for onward lending to distressed borrowers during the COVID-19 pandemic. During the week, the average interbank rate declined to 3.5% from 4.2% recorded the previous week, due to increased liquidity in the money markets due to pending bill payments and tax refunds. The average interbank volumes rose by 80.4% to Kshs 20.7 bn, from Kshs 11.5 bn recorded the previous week.
Kenya Eurobonds:
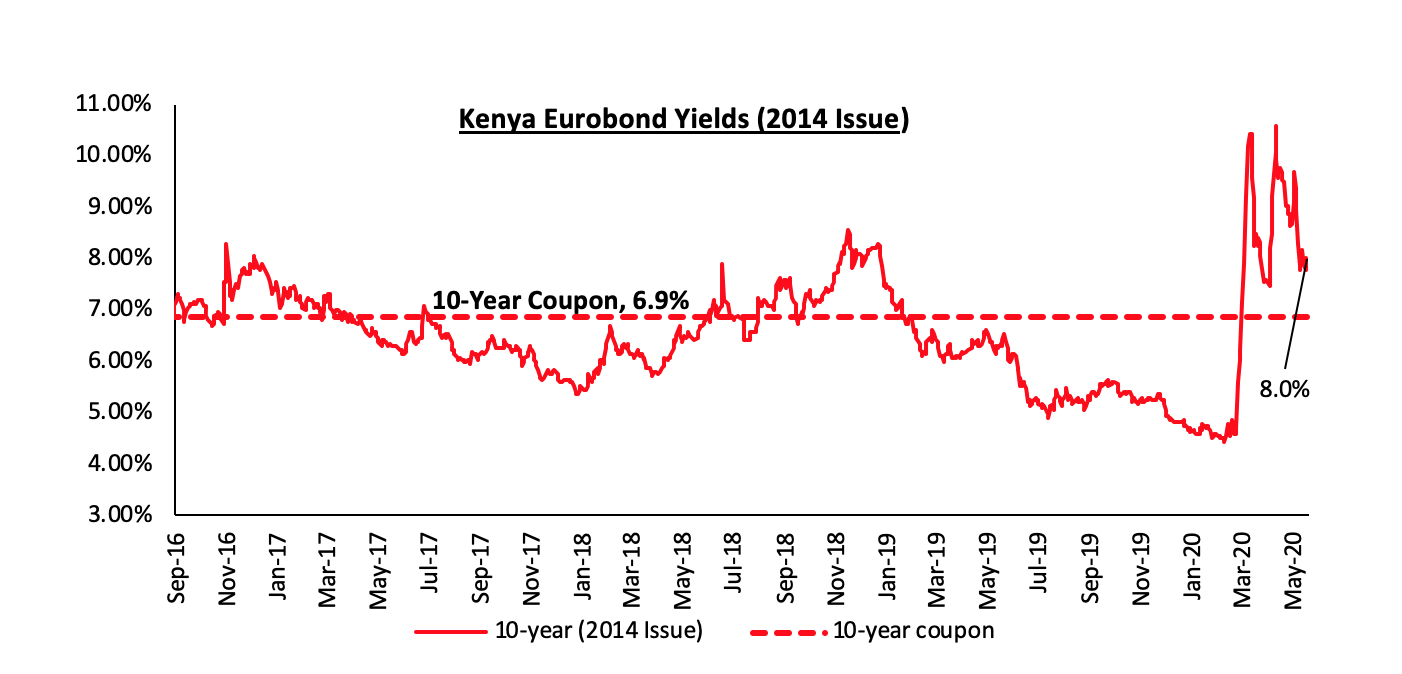
According to Reuters, the yield on the 10-year Eurobond issued in June 2014 declined by 1.5% points to 8.0% in May, from 9.5% in April. During the week, the yield on the 10-year Eurobond remained unchanged at 8.0%, similar to what was recorded the previous week. Notably, all the Eurobonds yields declined significantly in May. The performance was mainly driven by improved investor sentiments as the market reacted to the news by the World Bank that they had approved USD 1.0 bn funding to support the economy as well as the Rapid Credit Facility (RCF) which reaffirmed investors’ confidence despite the recent downgrade by Moody’s where Kenya’s sovereign credit outlook was changed to negative from stable.
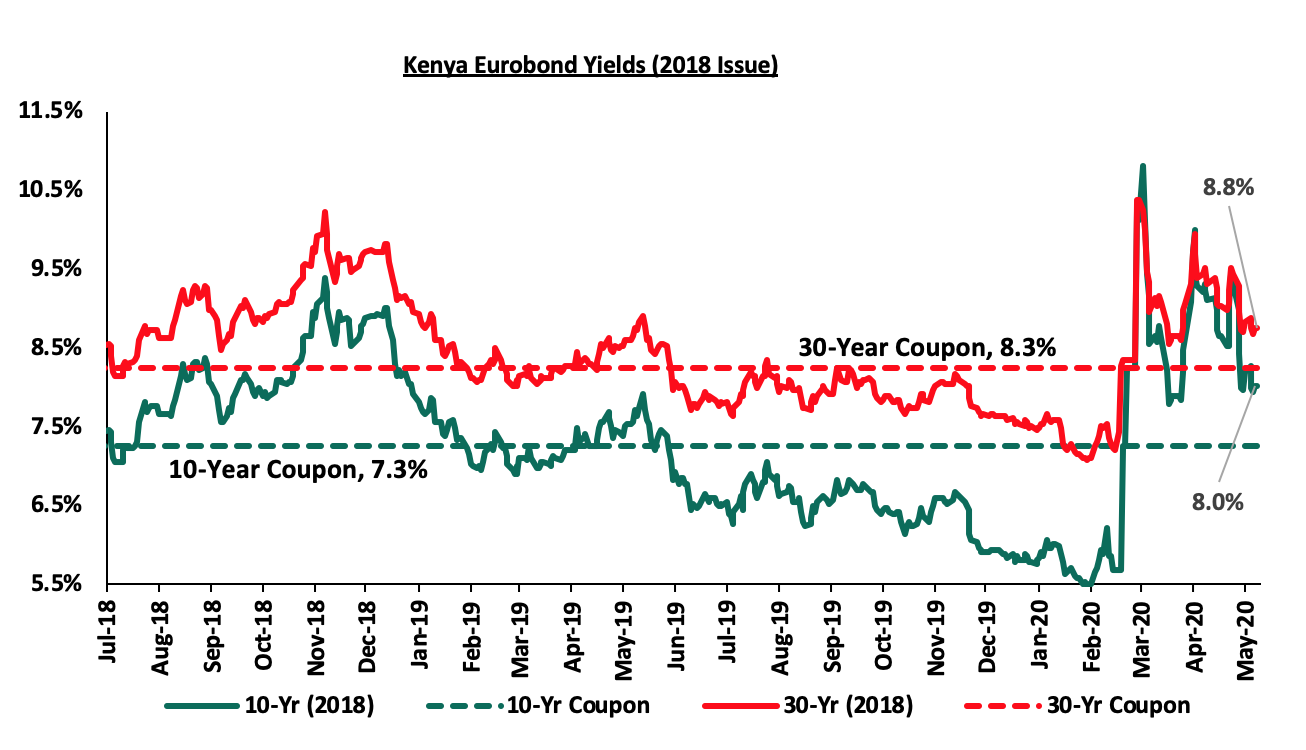
During the month, the yields on the 10 and 30 year Eurobonds issued in February 2018 declined by 1.1% points and 0.5% points to close at 8.0% and 8.8%, respectively, from 9.1% and 9.3% in April. During the week, the yield on the 10-year Eurobond declined by 0.2% points to close at 8.0% from 8.2% recorded the previous week. The 30-year Eurobond remained unchanged at 8.8% similar to what was recorded the previous week.
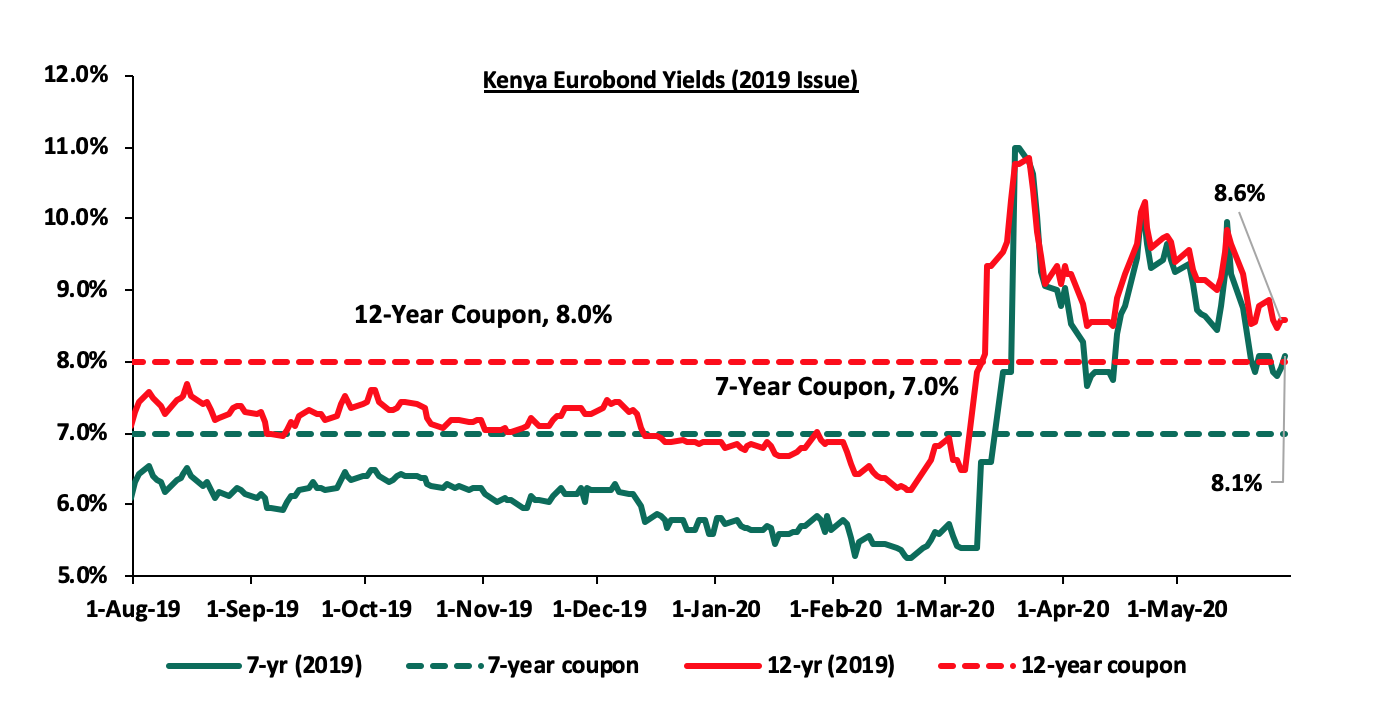
During the month, the yields on the newly issued dual-tranche Eurobond with 7-years declined by 1.2% points to 8.1% from 9.3% in April. The 12-year Eurobond decreased by 0.8% points to 8.6% from 9.4% in April. During the week, the yields on the 7-year remained unchanged at 8.1% while that of the 12-year Eurobond declined by 0.2% points to 8.6% from 8.8% recorded the previous week.
Kenya Shilling:
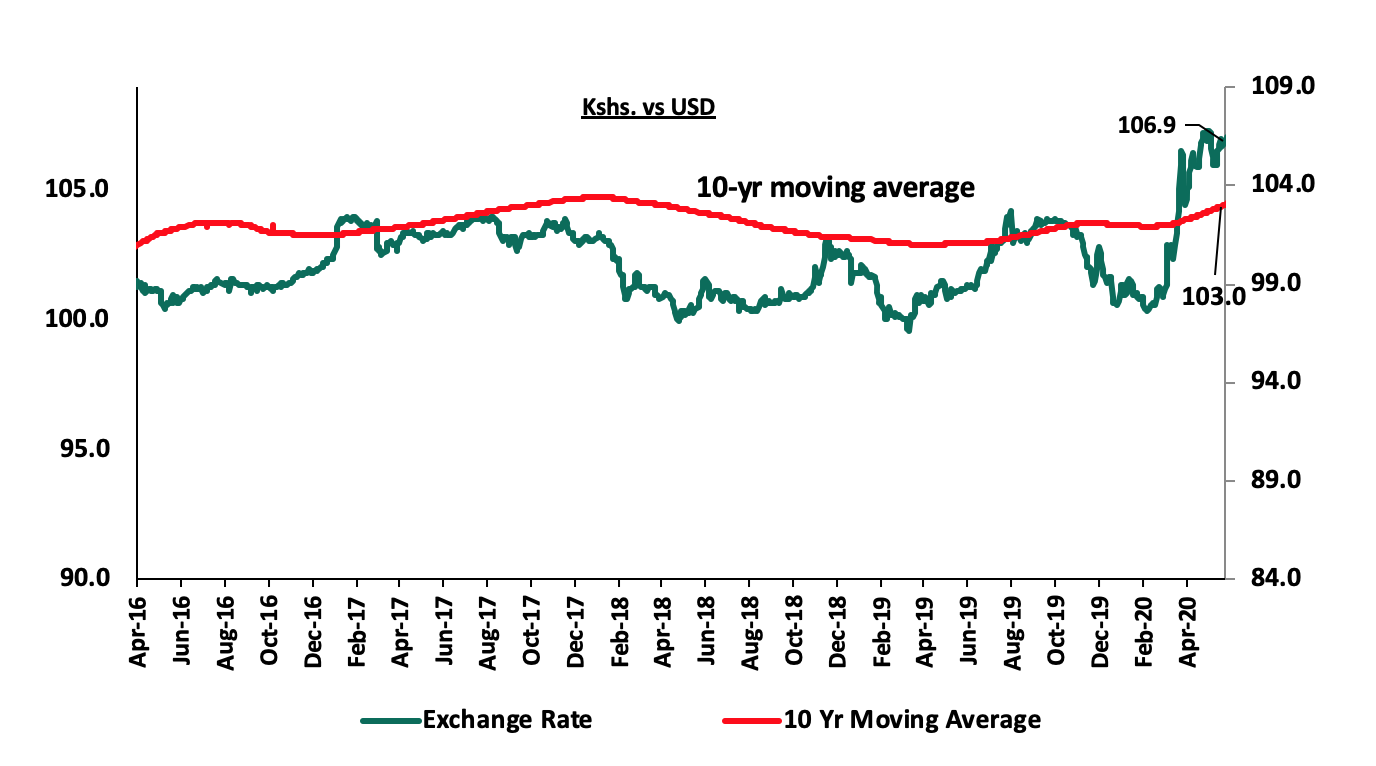
During the month, the Kenya Shilling appreciated by 0.3% against the US Dollar to close at Kshs 106.9, from Kshs 107.3 recorded at the end of April, mostly attributable to the increased forex reserves which rose to a four-month high USD 8.5 bn as the Central bank received the USD 750.0 mn from the International Monetary Fund for economic support cushioning the shilling from the hard currency dollar demand. During the week, the Kenya Shilling remained unchanged against the US Dollar to close the week at Kshs 106.9 similar to what was recorded the previous week. The shilling was supported by some USD flows from USD amidst reduced demand from merchandise importers. On an YTD basis, the shilling has depreciated by 5.5% against the dollar, in comparison to the 0.5% appreciation in 2019. We expect continued pressure on the shilling due to:
- High dollar demand from foreigners exiting the market as they direct their funds to safer havens,
- Increased demand as merchandise and energy sector importers beef up their hard currency positions amid a slowdown in foreign dollar currency inflows, and,
- Subdued diaspora remittances evidenced by the 9.0% decline to USD 208.2 mn in April 2020, from USD 228.8 seen the previous month, mainly due to the decline in economic activities globally, coupled with increased prices of household items leading to lower disposable income. The CBK expects a 12.0% decline in remittances in 2020.
The shilling is however expected to be supported by:
- High levels of forex reserves, currently at USD 8.5 mn (equivalent to 5.1-months of import cover), above the statutory requirement of maintaining at least 4.0-months of import cover, and the EAC region’s convergence criteria of 4.5-months of import cover. As a result of inflows from the IMF Rapid Credit Facility (RCF) approved during the week reserves rose by 8.7% to USD 8.4 mn from USD 7.8 mn,
Monetary Policy
The Monetary Policy Committee (MPC) met on 27th May 2020 to review the prevailing macroeconomic conditions and decide on the direction of the Central Bank Rate (CBR). The MPC maintained the CBR at 7.00%, which in line with our expectations in our MPC May 2020 Note. The MPC indicated that the previous cut in CBR rate in their 29th April 2020 meeting, from 7.25% to the current 7.00%, was having the intended outcome but they noted that the Coronavirus pandemic had continued to affect economic growth and as such, there would be a need further cushion the economy. After their sitting on Wednesday, the committee highlighted that;
- Inflation is expected to remain within the Government’s 2.5% - 7.5% target range, largely supported by the improving food supply due to favourable weather conditions, lower international oil prices, the impact of the reduction of VAT and muted demand pressures,
- Taking into consideration the impact of COVID-19, the current account deficit is expected to remain at 5.8% of GDP in 2020, with the lower oil imports more than offsetting the projected reduction in remittances. However, horticulture exports and receipts from transport and tourism services are expected to decline due to the impact of COVID-19, and,
- There was an Improvement in private sector credit growth, coming in at 9.0% in the 12-months to April 2020, above the 5-Year historical average, of 8.0%. Strong credit growth was observed in the Manufacturing sector (20.1%), trade (10.3%) and transport and communication (9.1%).
The committee noted that the policy measures put in place in March and April were having the intended effect on the economy and are still being transmitted. They concluded that the current accommodative stance is appropriate. We maintain our view that monetary policy stimulus measures may not be highly effective in combating the effects emanating from the COVID-19 pandemic especially in some sectors such as the tourism sector which have been hit by demand-side issues. We believe what businesses and the economy as a whole needs is financial relief as highlighted in our report on COVID-19 Economic Containment Policies in order to ensure survival during this period of uncertainties.
Inflation
The y/y inflation for the month of May declined marginally to 5.5%, from 5.6% recorded in April 2020 (based on the new CPI base period, February 2019), which was in line with our projections of 5.5% - 5.7%. The decrease was due to a high base effect and despite slight increases in some major components the inflation decreases: Month-on-month inflation came in at 0.6%, and the key things to note:
- There was 0.9% increase in the food and non-alcoholic drinks’ index, due to an increase in prices of significant food items such as onions, carrots, oranges, spinach and Sukuma wiki which increased by 4.5%, 3.3%, 2.6%, 2.2% and 2.0%, respectively,
- A 0.8% increase in the housing, water, electricity, gas and other fuels index, as a result the 3.2% increase in the price of kerosene, and,
- A 0.02% increase in the transport index on account of increases in the prices of matatu and taxi fares despite the decline in petrol and diesel prices by 9.8% and 19.1%, respectively.
|
Major Inflation Changes – May 2020 |
|||
|
Broad Commodity Group |
Price change m/m (May-20/April-20) |
Price change y/y (May-20/May-19) |
Reason |
|
Food & Non-Alcoholic Beverages |
0.9% |
10.6% |
The m/m increase was due to an increase in prices of significant food items such as onions, carrots, oranges, spinach and Sukuma wiki |
|
Transport Cost |
0.0% |
5.2% |
The m/m change was mainly on account that the benefits from a decrease in pump prices was largely wiped out by the increase in the prices of matatu and taxi fares due to the Covid-19 containment measures |
|
Housing, Water, Electricity, Gas and other Fuels |
0.8% |
2.6% |
The m/m increase was as a result the 3.2% increase in the price of kerosene |
|
Overall Inflation |
0.6% |
5.5% |
The m/m increase was due to a 0.9% increase in the food index which has a revised CPI weight of 32.9% and a 0.8% increase in housing, water, electricity, gas and other fuels. |
Going forward, we expect the inflation rate to remain within the government set range of 2.5% - 7.5%. We expect inflation to remain stable despite supply side disruption due to COVID-19 as low demand for commodities compensates for the cost-push inflation, coupled with the low oil prices in the international markets.
Monthly Highlights
- Global credit rating agency, Moody’s released its rating outlook where it changed Kenya’s sovereign credit outlook to “negative”, from a previous outlook of “stable”, and also affirmed the B2 credit rating. The agency pointed out that the negative outlook was a result of rising financial risks brought about by the country’s large borrowing requirements especially during this time where the fiscal outlook is deteriorating given the erosion of the revenue base and the high debt and interest burden. For more information, see our Cytonn Weekly #19/2020,
- The International Monetary Fund (IMF) Executive Board approved a USD 739.0 mn (Kshs 78.7 bn) disbursement to Kenya to be drawn under the Rapid Credit Facility (RCF) to help the country address the impact of COVID-19. In the press release, the IMF highlighted that the Coronavirus pandemic is slowly but surely taking a toll on the Kenyan economy by significantly reducing its growth prospects as well as widening the fiscal and financial needs of the country. For more information, see our Cytonn Weekly #19/2020,
- The Committee on Finance and Planning tabled their proposals in the National Assembly during the first reading of the Finance Bill, 2020. The amendment was necessitated by the need to legalize the measures announced by the president in March to help cushion the economy against the Coronavirus pandemic. For more information, see our Cytonn Weekly #19/2020,
- Moody’s changed Acorn Group’s Kshs 5.0 bn green bond outlook from ‘B1 stable’ to ‘B1 negative’. The bond had a rating of B1 stable when it was issued in 2019 higher than Kenya’s sovereign rating of B2 stable at the time. The initial higher rating was informed by a partial guarantee to investors through GuarantCo which assured investors of recovery of up to 50.0% of principal and interest in the case of a default. For more information, see our Cytonn Weekly #20/2020,
- The International Monetary Fund (IMF) raised Kenya’s risk of distress to “High” from “Moderate” due to the effects of the Coronavirus pandemic which has worsened the existing vulnerabilities within the Kenyan economy. Some of the key issues raised include the increased budget deficit and debt vulnerability. For more information, see our Cytonn Weekly #20/2020, and,
- The World Bank approved US Dollar 1.0 bn financing for Kenya to address the COVID-19 financing gap and support the economy through this period. This is the second-ever such lending from the World Bank after the first in May 2019 where the government received USD 750.0 mn for budgetary support. The country undertook policy reforms to secure the financing and ultimately, directly benefit low-income households in the country. Through this policy, small scale farmers will benefit from better targeting of subsidized agricultural inputs through electronic vouchers. For more information, see our Cytonn Weekly #21/2020.
Rates in the fixed income market have remained relatively stable as the government rejects expensive bids. The government is 16.1% behind of its current domestic borrowing target of 404.4bn, having borrowed Kshs 300.0 bn against a prorated target of Kshs 357.7 bn. The government had also borrowed 98.4 bn (42.3%) of the 232.8 bn foreign borrowing target, as at 31st March 2020. The uncertainty brought about by the novel Coronavirus will make it harder for the government to access foreign debt due to uncertainty affecting the global markets which might see investors attaching a high-risk premium on the country. A budget deficit is likely to result from the depressed revenue collection with the revenue target for FY’2019/2020 at Kshs 2.1 tn, creating uncertainty in the interest rate environment as additional borrowing from the domestic market goes to plug the deficit. Owing to this uncertain environment, our view is that investors should be biased towards short-term fixed income securities to reduce duration risk.
Markets Performance
During the month of May, the equities market was on a downward trajectory, with NASI, NSE 20 and NSE 25 declining by 1.8%, 0.5% and 2.7%, respectively. The equities market performance during the month was driven by losses recorded by Diamond Trust Bank (DTBK), Standard Chartered Bank, Equity Group and EABL, of 14.2%, 11.5%, 6.4% and 6.2%, respectively. During the week, the market was on a downward trajectory, with both NASI and the NSE 25 declining by 2.3%, while the NSE 20 declined by 3.3%, taking their YTD performance to losses of 17.6%, 21.9% and 26.6%, respectively. The performance of the NASI was driven by losses recorded by large-cap stocks such as Standard Chartered Bank, Diamond Trust Bank (DTBK), Safaricom, Equity and KCB of 4.2%, 3.7%, 2.7%, 2.5% and 2.3%, respectively.
Equities turnover increased by 15.3% during the month to USD 136.6 mn, from USD 118.5 mn in April 2020. During the month, foreign investors remained net sellers with a net selling position of USD 41.9 mn, compared to April’s net selling position of USD 36.4 mn. During the week, equities turnover declined by 1.7% to USD 22.2 mn, from USD 22.5 mn recorded the previous week, taking the YTD turnover to USD 693.7 mn. Foreign investors remained net sellers during the week, with the net selling position increasing by 5.9% to USD 7.5 mn, from a net selling position of USD 7.1 mn recorded the previous week.
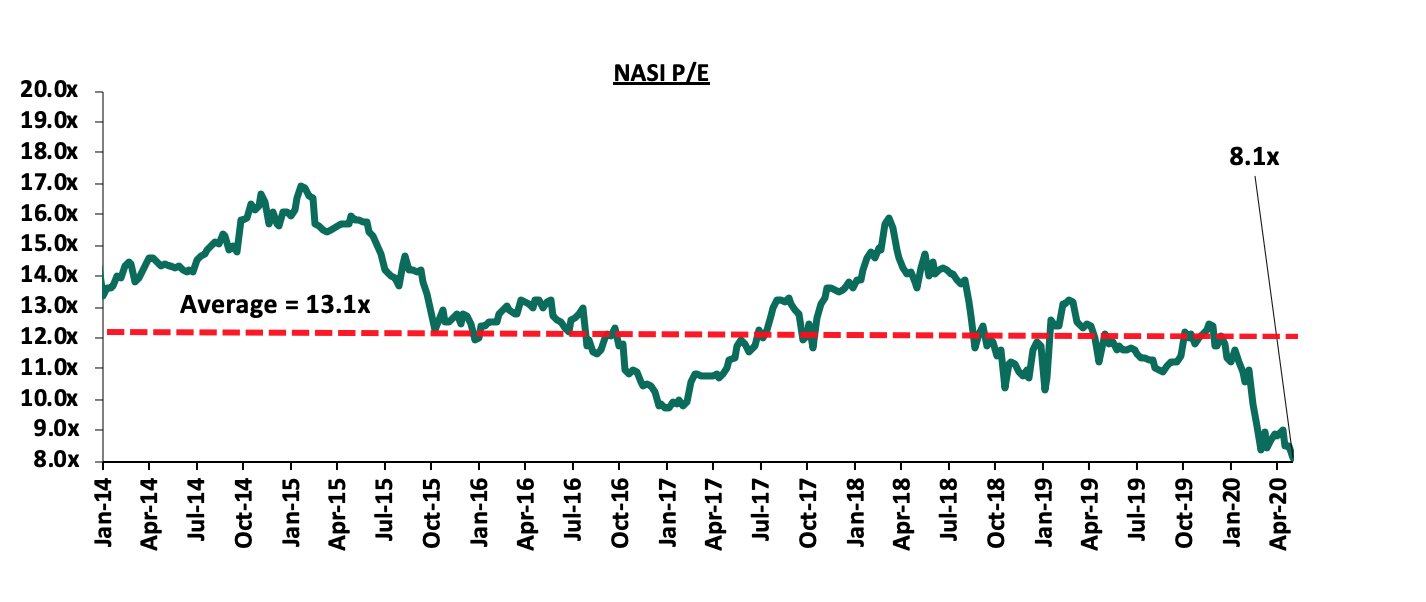
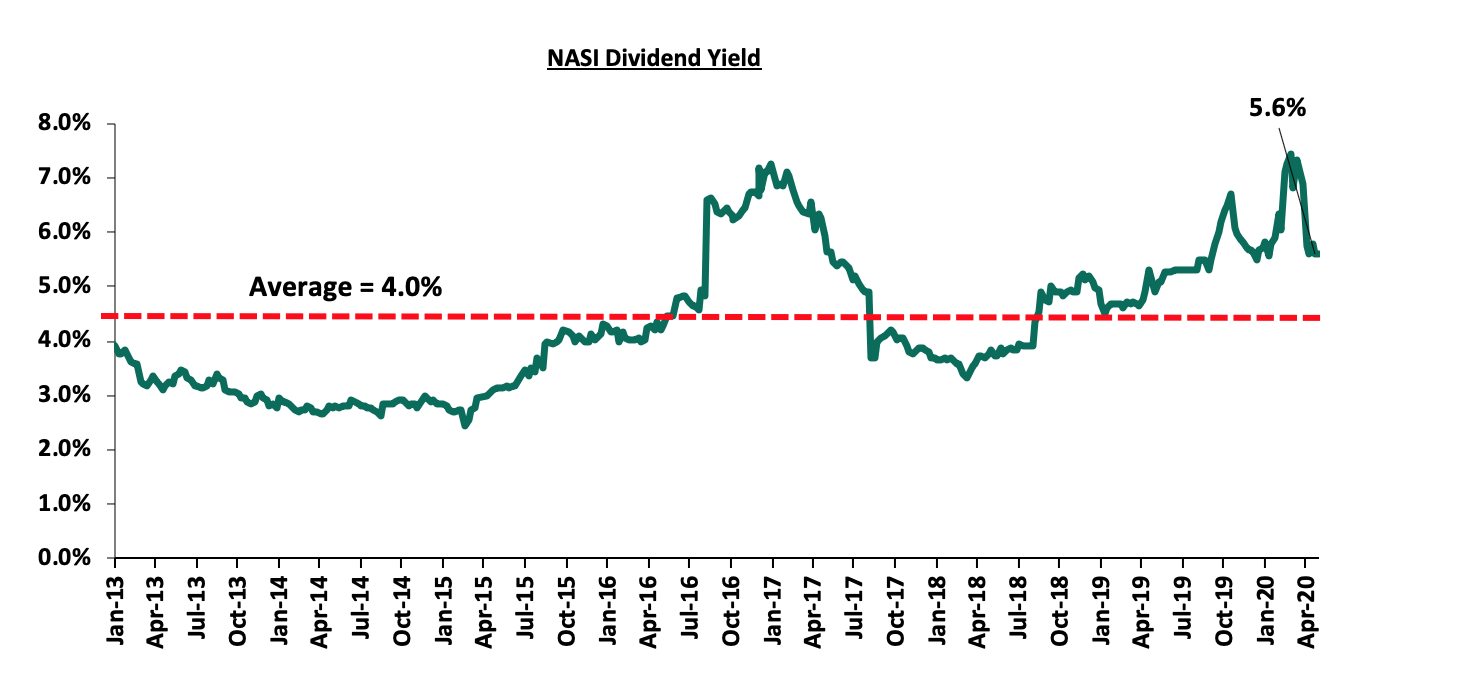
The market is currently trading at a price to earnings ratio (P/E) of 8.1x, 38.5% below the historical average of 13.1x, and a dividend yield of 5.6%, 1.6% points above the historical average of 4.0%. With the market trading at valuations below the historical average, we believe there are pockets of value in the market for investors with higher risk tolerance and are willing to wait it out through the pandemic. The current P/E valuation of 8.1x is 3.8% below the most recent trough valuation of 8.4x experienced in the last week of March 2020. The charts below indicates the historical P/E and dividend yields of the market.
Earnings Releases:
During the week, Equity Group, HF Group, ABSA, I&M Holdings and Standard Chartered Bank released their Q1’2020 financial results. Below is a summary of their earnings:
ABSA Bank Kenya
Income Statement
- Core earnings per share (excluding exceptional items), increased by 17.0% to Kshs 0.46, from Kshs 0.39 in Q1’2019, above our expectation of a 2.6% increase to Kshs 0.40. Earnings per share inclusive of exceptional items increased by 3.0% to Kshs 0.36, from Kshs 0.35 in Q1’2019. The one-off exceptional item of Kshs 0.6 bn relates to separation costs incurred by the bank following the separation of ABSA Group from Barclays PLC. The performance was driven by an 8.1% increase in total operating income, which grew faster than the 5.0% growth in total operating expenses. The variance in core earnings per share growth against our expectations was largely due to the 8.1% increase in the total operating income to Kshs 8.6 bn, from Kshs 8.0 bn in Q1’2019, against our expectation of a 6.4% increase to Kshs 8.5 bn,
- Total operating income rose by 8.1% to Kshs 8.6 bn, from Kshs 8.0 bn in Q1’2019. This was due to a 15.8% rise in Non-Funded Income (NFI) to Kshs 3.0 bn, from Kshs 2.6 bn in Q1’2019, coupled with a 4.5% rise in Net Interest Income (NII) to Kshs 5.6 bn, from Kshs 5.4 bn in Q1’2019,
- Interest income rose by 2.8% to Kshs 7.6 bn, from Kshs 7.4 bn in Q1’2019. This was driven by a 7.5% growth in interest income from government securities to Kshs 2.1 bn, from Kshs 1.9 bn in Q1’2019, and a 1.0% increase in interest income on loans and advances to Kshs 5.5 bn, from Kshs 5.4 bn in Q1’2018. The yield on interest-earning assets, however, declined to 9.9%, from 11.0% in Q1’2019, attributed to the faster 17.4% y/y increase in average interest earning assets to Kshs 315.2 bn, from Kshs 268.5 bn in Q1’2019, that outpaced the 2.8% growth in interest income,
- Interest expenses declined by 1.9% to Kshs 1.99 bn, from Kshs 03 bn in Q1’2019, following a 13.2% decline in interest expense on customer deposits to Kshs 1.5 bn, from Kshs 1.8 bn in Q1’2019. The decline was however weighed down by a 54.6% increase in placement liabilities to Kshs 0.4 bn from Kshs 0.3 bn in Q1’2019. Cost of funds, on the other hand, declined to 3.3%, from 3.6% in Q1’2019, owing to the faster 13.8% growth in average interest bearing liabilities, which outpaced the 1.9% decline in interest expense. Net Interest Margin (NIM) on the other hand declined to 7.4%, from 8.2% in Q1’2019, owing to the faster 17.4% growth in average interest earning assets which outpaced the 4.5% growth in Net Interest Income (NII),
- Non-Funded Income (NFI) rose by 15.8% to Kshs 3.0 bn, from Kshs 2.6 bn in Q1’2019. The growth was mainly driven by a 47.4% rise in forex trading income to Kshs 1.1 bn, from Kshs 0.8 bn in Q1’2019. Total fees and commissions remained unchanged at Kshs 1.5 bn. As a result, the revenue mix adjusted to 66:35 from 68:32 recorded in Q1’2019, funded to non-funded income, owing to the faster 15.8% growth in NFI, that outpaced the 4.5% growth in NII,
- Total operating expenses rose by 5.0% to Kshs 5.2 bn, from Kshs 4.9 bn in Q1’2019, largely driven by a 75.2% increase in Loan Loss Provisions (LLP) to Kshs 1.1 bn in Q1’2020, from Kshs 0.6 bn in Q1’2019, coupled with a 6.6% increase in staff costs to Kshs 2.5 bn in Q1’2020, from Kshs 2.3 bn in Q1’2019. The increased provisions is attributed to the bank adopting a cautious stance on the back of the expected increase in defaults across sectors caused by the COVID-19 pandemic. The rise in operating expenses was however mitigated by a 19.9% decline in other operating expense to Kshs 1.6 bn from Kshs 2.0 bn in Q1’2019,
- The Cost to Income Ratio (CIR) improved to 60.1%, from 61.9% in Q1’2019, owing to the faster 8.1% rise in total operating income to Kshs 8.6 bn, from Kshs 8.0 bn in Q1’2019, which outpaced the 5.0% rise in total operating expenses to Kshs 5.2 bn, from Kshs 4.9 bn in Q1’2019. Without LLP, the cost to income ratio also improved to 47.1%, from 53.9% in Q1’2019, an indication of improved efficiency, and,
- Profit before tax rose by 13.3% to Kshs 3.4 bn, from Kshs 3.0 bn in Q1’2019. Profit after tax before exceptional items grew by 17.0% to Kshs 2.5 bn in Q1’2020, from Kshs 2.1 bn in Q1’2019, while profit after tax and exceptional items, which relates to one-off separation cost of Kshs 0.6 bn, grew by 3.0% to Kshs 1.96 bn in Q1’2020, from Kshs 1.9 bn in Q1’2019, with the effective tax rate increasing to 32.0% from 31.8% in Q1’2019.
Balance Sheet
- The balance sheet recorded an expansion as total assets increased by 10.4% to Kshs 381.5 bn, from Kshs 345.4 bn in Q1’2019. This growth was largely driven by a 12.4% increase in their loan book to Kshs 203.0 bn, from Kshs 180.5 bn in Q1’2019, coupled with a 7.2% increase in government securities to Kshs 125.4 bn, from Kshs 117.0 bn in Q1’2019,
- Total liabilities rose by 13.3% to Kshs 339.2 bn, from Kshs 299.4 bn in Q1’2019, driven by a 6.6% increase in customer deposits to Kshs 238.7 bn, from Kshs 224.0 bn in Q1’2019, coupled with a 32.7% increase in deposits and balances due to foreign banking institutions to Kshs 2.1 bn, from Kshs 0.9 bn in Q1’2019. The growth in liabilities was mitigated by a 32.4% decline in placement liabilities to Kshs 4.9 bn, from Kshs 7.2 bn in Q1’2019. Deposits per branch increased by 11.7% to Kshs 2.8 bn, from Kshs 2.5 bn in Q1’2019, with the number of branches having reduced to 84 in Q1’2020, from 88 in Q1’2019,
- The faster 12.4% growth in loans, which outpaced the 6.6% growth in deposits led to an increase in the loan to deposit ratio to 85.0% from 80.6%, recorded in Q1’2019,
- Gross Non-Performing Loans (NPLs) increased by 12.4% to Kshs 17.3 bn in Q1’2020, from Kshs 15.4 bn in Q1’2019. The NPL ratio thus deteriorated marginally to 8.10% in Q1’2020, from 8.07% in Q1’2019, owing to the faster 12.4% growth in gross NPLs, which marginally outpaced the 12.1% growth in gross loans (after adding back interest suspense). General Loan Loss Provisions rose by 18.0% to Kshs 8.8 bn, from Kshs 7.5 bn in Q1’2019. Consequently, the NPL coverage declined to 64.5% in Q1’2020, from 67.8% in Q1’2019, owing to the 18.0% increase in general loan loss provisions, which was outpaced by the 12.1% growth in gross non-performing loans,
- Shareholders’ funds declined by 8.2% to Kshs 42.3 bn in Q1’2020 from Kshs 46.1 bn in Q1’2019, driven by a 54.5% decline in revaluation reserves to Kshs 0.3 bn, from Kshs 0.7 bn in Q1’2019. However, the decline was mitigated by a 3.9% increase in retained earnings to Kshs 39.1 bn from Kshs 37.6 bn in Q1’2019, coupled with a 9.7% increase in other reserves to Kshs 0.21 bn, from Kshs 0.19 bn in Q1’2019,
- ABSA Bank Kenya is currently sufficiently capitalized with a core capital to risk-weighted assets ratio of 13.8%, 3.3% points above the 10.5% statutory requirement. In addition, the total capital to risk-weighted assets ratio was 16.5%, exceeding the 14.5% statutory requirement by 2.0% points. Adjusting for IFRS 9, the core capital to risk weighted assets stood at 14.0%, while total capital to risk-weighted assets came in at 16.7%, and,
- The bank currently has a Return on Average Assets (ROaA) of 2.1%, and a Return on Average Equity (ROaE) of 17.0%.
Key Take-Outs:
- There was an improvement in efficiency levels as the cost to income ratio without LLP improved to 47.1% from 53.9% in Q1’2019. The improvement was largely attributable to an 84.0% decline in the bank’s rental charges to Kshs 23.7 mn in Q1’2020, from Kshs 148.5 mn in Q1’2019 with the number of branches reducing to 84 in Q1’2020, from 88 in Q1’2019,
- The bank’s asset quality was maintained at the same level, with the NPL ratio remaining at 8.10%. The bank embraced prudent risk assessment with secured lending targeted on key sectors, as well as focus on big ticket recoveries, which has seen the bank maintain its NPL ratio, which in comparison to the other banks has performed well. The bank continued to demonstrate prudence, as the coverage remained relatively high, at 64.5%, despite being lower than the 67.8% recorded in Q1’2019,
- The banks’ reported earnings per share increased by 3.0% to Kshs 0.36, from Kshs 0.35 in Q1’2019, despite being weighed down by the Kshs 0.6 bn one-off exceptional item that the bank incurred in separation costs. However, core earnings per share recorded a 17.0% growth to Kshs 0.46, from Kshs 0.39 in Q1’2019, and,
- The bank recorded a relatively strong growth in its balance sheet, as deposits grew by 6.6% y/y, and were channelled to loans and advances, which grew, by 12.4% y/y, and government securities investments, which grew by 7.2%. The growth in interest earning assets helped support increased interest income revenue, despite the decline in yields of government securities.
Going forward, we expect the bank’s growth to be driven by:
- Increased Channel diversification, which is likely to help the bank to continue improving its operational efficiency. The benefits of this are already being felt with “Timiza” already recording accelerated growth, and consequently higher Non-Interest Revenue. This coupled with the expansion of its agent-banking network and product offerings such as bancassurance and fixed income trading will see the bank expand its top-line revenue, going forward.
For a comprehensive analysis, please see our ABSA Bank Kenya Q1’2020 Earnings Note
Equity Group
Income Statement
- Core earnings per share declined by 14.1% to Kshs 1.41, from Kshs 1.64 in Q1’2019, worse than our projections of a 2.0% decline to Kshs 1.61. The performance was driven by a 46.4% increase in total operating expenses, which grew faster than the 12.7% growth recorded in total operating income. The variance in core earnings per share growth against our expectations was largely due to the 660.4% rise in Loan Loss Provisions (LLPs) to Kshs 3.1 bn, from Kshs 0.3 bn in Q1’2019, which was higher than our expectation of a 129.7% increase to Kshs 0.9 bn. The increased provisions is attributed to the bank adopting a cautious stance on the back of the expected impact of the COVID-19 pandemic,
- Total operating income rose by 12.7% to Kshs 19.9 bn, from Kshs 17.6 bn in Q1’2019. This was driven by a 15.8% rise in Non-Funded Income (NFI) to Kshs 8.3 bn, from Kshs 7.2 bn in Q1’2019, coupled with a 10.6% increase in Net Interest Income (NII) to Kshs 11.5 bn, from Kshs 10.4 bn in Q1’2019,
- Interest income rose by 14.3% to Kshs 15.4 bn, from Kshs 13.5 bn in Q1’2019. This was driven by an 18.7% increase in interest income on loans and advances to Kshs 10.8 bn, from Kshs 9.1 bn in Q1’2019, coupled with a 9.0% increase in interest income on government securities to Kshs 4.5 bn, from Kshs 4.1 bn in Q1’2019. The growth in interest income was however weighed down by a 55.1% decline in interest income from placements to Kshs 0.1 bn, from Kshs 0.3 bn in Q1’2020. The slightly stronger growth in interest income on loans as compared to interest from government securities is indicative of the benefits accruing to Equity Group Holding’s strategy to increase lending to the private sector, focusing on Small and Medium Enterprises. The yield on interest-earning assets declined marginally to 11.0%, from 11.1% in Q1’2019, due to the faster 15.0% growth in average interest- earning assets, which outpaced the 14.3% growth in interest income,
- Interest expenses rose by 26.7% to Kshs 3.9 bn from Kshs 3.1 bn in Q1’2019, following the 12.0% increase in the interest expense on customer deposits to Kshs 2.8 bn, from Kshs 2.5 bn in Q1’2019, coupled with a 143.4% increase in other interest expenses to Kshs 0.9 bn, from Kshs 0.4 bn in Q1’2019. The growth was mitigated by a 19.1% decline in interest expense from placement liabilities to Kshs 0.1 bn, from Kshs 0.2 bn in Q1’2019. The cost of funds increased to 3.0%, from 2.6% in Q1’2019, owing to the faster 26.7% increase in interest expense, which outpaced the 13.4% increase in average interest-bearing liabilities to Kshs 518.8 bn, from Kshs 457.3 bn in Q1’2019. The Net Interest Margin (NIM) declined to 8.2% from 8.6% in Q1’2019, owing to the faster 15.0% growth in average interest earning assets which outpaced the 10.6% growth in Net Interest Income (NII),
- Non-Funded Income (NFI) recorded a 15.8% growth to Kshs 8.3 bn, from Kshs 7.2 bn in Q1’2019. The growth was mainly driven by a 34.3% increase in forex trading income to Kshs 1.1 bn, from Kshs 0.8 bn in Q1’2019, coupled with a 12.5% increase in total fees and commissions on loans to Kshs 5.4 bn, from Kshs 4.8 bn. As a result, the revenue mix shifted to 58:42 from 59:41 funded to non-funded income, owing to the faster 15.8% growth in NFI as compared to the 10.6% growth in NII,
- Total operating expenses rose by 46.4% to Kshs 12.9 bn, from Kshs 8.8 bn in Q1’2019, largely driven by a 660.4% increase in Loan Loss Provisions (LLP) to Kshs 3.1 bn, from Kshs 0.4 bn in Q1’2019. The increased provisions is attributed to the bank adopting a cautious stance on the back of the expected impact of the COVID-19 pandemic, coupled with an 23.0% rise in staff costs to Kshs 3.2 bn, from Kshs 2.6 bn in Q1’2019, and a 13.3% growth in other operating expenses to Kshs 6.5 bn, from Kshs 5.7 bn in Q1’2019,
- As a result of the 660.4% rise in Loan Loss Provisions (LLP), Cost to Income Ratio (CIR) deteriorated by 14.9% points to 64.7%, from 49.8% in Q1’2019. Without LLP, the CIR deteriorated by 1.5% points to 49.0%, from 47.5% in Q1’2019 an indication of a decline in the Banks efficiency levels,
- Profit before tax declined by 20.7% to Kshs 7.0 bn, down from Kshs 8.8 bn in Q1’2019. Profit after tax recorded a 14.1% decline to Kshs 5.3 bn, from Kshs 6.2 bn, with the effective tax rate declining to 24.0% from 29.9% in Q1’2019, and,
- The board of directors announced that it was changing its earlier recommendation of paying a first and final dividend of Kshs 2.5 per share for FY’2019, and instead recommends to the shareholders that no dividends be paid for FY’2019. This decision was made considering the effects of the COVID-19 pandemic and the need to conserve cash to enable the company to respond appropriately to the unfolding crisis in terms of supporting its customers through the crisis and directing cash resources to potential opportunities that may arise as economies in which the group operates begin to recover.
Balance Sheet
- The balance sheet recorded an expansion as total assets increased by 14.4% to Kshs 693.2 bn, from Kshs 605.7 bn in Q1’2019. The growth was supported by a 24.1% increase in the loan book to Kshs 379.2 bn, from Kshs 305.5 bn, coupled with a 14.2% increase in government securities to Kshs 157.6 bn from Kshs 137.9 bn in Q1’2019. The growth was subdued by a 15.3% decrease in placements to Kshs 35.1 bn, from Kshs 41.4 bn in Q1’2019, coupled with a 2.7 % decline in property and equipment to Kshs 11.4 bn, from Kshs 11.7 bn,
- Total liabilities rose by 13.0% to Kshs 576.8 bn from Kshs 510.2 bn in Q1’2019, driven by a 16.5% increase in customer deposits to Kshs 499.3 bn, from Kshs 428.5 bn in Q1’2019. Deposits per branch increased by 9.9% to Kshs 1.7 bn, from Kshs 1.5 bn in Q1’2019, with the number of branches increasing by 17 to 300 branches in Q1’2020, from 283 in Q1’2019. Borrowings, on the other hand, rose by 3.2% to Kshs 52.6 bn, from Kshs 51.0 bn in Q1’2019,
- The faster 24.1% growth in loans as compared to the 16.5% growth in deposits, led to a growth in the loan to deposit ratio to 75.9%, from 71.3% in Q1’2019,
- Gross Non-Performing Loans (NPLs) rose by 51.9% to Kshs 44.6 bn in Q1’2020, from Kshs 29.4 bn in Q1’2019. Consequently, the NPL ratio deteriorated to 11.2% in Q1’2020, from 9.2% in Q1’2019, attributable to a faster 51.9% growth in Non-Performing Loans, which outpaced the 25.5% growth in gross loans. The main sectors that contributed to the deterioration in asset quality were large enterprises and SMEs sectors contributing 13.2% and 12.5%, respectively, to total NPLs. The group’s South Sudan and Tanzania subsidiaries recorded high NPL ratios of 40.8% and 40.5%, respectively. With general Loan Loss Provisions increasing by 57.2% to Kshs 15.1 bn, from Kshs 9.6 bn in Q1’2019, the NPL coverage improved to 45.8% in Q1’2020 from 43.9% in Q1’2019,
- Shareholders’ Funds grew by 22.0% to Kshs 115.3 bn in Q1’2020 from Kshs 94.5 bn in Q1’2019, supported by a 24.9% increase in retained earnings to Kshs 104.4 bn from Kshs 83.6 bn,
- Equity Group remains sufficiently capitalized with a core capital to risk-weighted assets ratio of 17.5%, 7.0% points above the statutory requirement of 10.5%. In addition, the total capital to risk-weighted assets ratio came in at 21.0%, exceeding the statutory requirement of 14.5% by 6.5% points. Adjusting for IFRS 9, the core capital to risk-weighted assets stood at 17.8%, while total capital to risk-weighted assets came in at 21.3%, and,
- The bank currently has a Return on Average Assets (ROaA) of 3.3%, and a Return on Average Equity (ROaE) of 20.7%.
Key Take-Outs:
- The bank’s geographical diversification strategy has continued to emerge as a net positive, with the bank’s various subsidiaries in Uganda, DRC, Rwanda, Tanzania and South Sudan cumulatively contributing 25.0% of the bank’s total profitability and 28.0% of the group’s total asset base. However, given the high NPL ratios in the group’s South Sudan and Tanzania subsidiaries of 40.8% and 40.5% respectively, the group will need to improve its credit assessment in these countries to bring down the high NPL ratios. Cumulatively, the group’s subsidiaries recorded an 18.2% increase in their Profit after Tax (PAT) to Kshs 1.3 bn, from Kshs 1.1 bn in Q1’2019, with the Tanzanian branch recording a loss of Kshs 0.07 bn in Q1’2020 from the earlier recorded PAT of Kshs 0.10 bn in Q1’2019. Total assets in the bank’s regional subsidiaries grew by 27.2% to Kshs 206.6 bn in Q1’2020, from Kshs 162.4 bn in Q1’2019. Improved efficiencies in the subsidiaries saw their cost structure contribution to the Group, improve to 36.0%, from 37.0% in Q1’2019.
- Increased innovation and digitization have seen 97.0% of all transactions of the bank being done on alternative channels, with mobile transactions taking up 79.0% of all loan transactions, and agency banking contributing 11.0% of all transactions. However, in terms of the value of transactions, branches contributed 49.0% of the value of all transactions, while mobile and agency banking contributed 26.0% and 17.0%, respectively. This highlights the transformation of branches to handle high-value transactions. This transformation aids the bank by offering its ecosystem banking products to corporate and SME clients,
- The Group’s Non-Funded Income recorded a 15.8% growth to Kshs 8.3 bn, from Kshs 7.2 bn in Q1’2019. The growth was mainly driven by a 34.3% increase in forex trading income to Kshs 1.1 bn, from Kshs 0.8 bn in Q1’2019, coupled with a 12.5% increase in total fees and commissions on loans to Kshs 5.4 bn, from Kshs 4.8 bn. However, with the bank’s alternative channels gaining prominence in the frequency of transactions, we expect this to contribute positively towards the NFI revenue stream. With the banks’ NFI contribution to total income currently at 41.9%, it is still way above the current industry average of 22.8%, and,
- The bank’s asset quality deteriorated, with the NPL ratio deteriorating to 11.2% in Q1’2020 from 9.2% in Q1’2019. The main sectors that contributed to the deterioration in asset quality were large enterprises and SMEs sectors contributing 13.2% and 12.5%, respectively, to total NPLs. Key to note, South Sudan and Tanzania subsidiaries recorded high NPL ratios at 40.8% and 40.5%, respectively. The two countries cumulatively contributed 3.5% of the group's loan book. With the repeal of interest rate cap law, the bank has ramped up its loan disbursement to its customers in the region and will have to be more prudent on its credit assessment in these markets to bring down the high NPL ratios in some of its regional subsidiaries.
Going forward, the factors that would drive the bank’s growth would be:
- Channeled diversification is likely to further improve on efficiency with emphasis on alternative channels of transactions, as the bank rides on the digital revolution wave, thereby further improving the cost to income ratio by cost rationalization and revenue expansion. This will likely propel the bank’s prospects of achieving sustainable growth, as it replicates its successful business model across its various regional subsidiaries, and,
- The bank’s operating model of enhancing balance sheet agility is likely to place the bank in a prime position to take advantage of any opportunities that may arise, such as attractive inorganic growth via acquisitions or fast lending with the repeal of the interest rate cap law. The bank’s balance sheet agility is seen with a liquidity ratio of 51.6%, a loan deposit ratio of 75.9% and a core capital to risk-weighted asset ratio of 17.5%.
For a comprehensive analysis, please see our Equity Group Q1’2020 Earnings Note
I&M Holdings
Income Statement
- Core earnings per share declined by 29.7% to Kshs 2.0, from Kshs 2.9 in Q1’2019, not in line with our projections of a 2.2% increase to Kshs 2.9. The performance was driven by a 5.7% increase in total operating income, which was weighed down by the 24.5% increase in total operating expenses. The variance in core earnings per share growth against our expectations was largely due to the 5.7% rise in total operating income to Kshs 5.7 bn, from Kshs 5.4 bn in Q1’2019, which was slower than our expectation of an 33.3% rise,
- Total operating income rose by 5.7% to Kshs 5.7 bn, from Kshs 5.4 bn in Q1’2019. This was driven by a 7.4 % increase in Non-Funded Income (NFI) to Kshs 2.2 bn, from Kshs 2.1 bn in Q1’2019, coupled with a 4.6% increase in Net Interest Income (NII) to Kshs 3.5 bn, from Kshs 3.3 bn in Q1’2019,
- Interest income rose by 5.7% to Kshs 6.5 bn, from Kshs 6.1 bn in Q1’2019. This was driven by a 7.2% increase in interest income from Loans and Advances to 5.3 bn from 5.0 bn in Q1’2019, as well as, a 20.8% growth in interest income from placements to Kshs 147.9 mn, from Kshs 122.4 mn in Q1’2019. Interest income from government securities declined by 2.0% to Kshs 1.01 bn from Kshs 1.03 bn in Q1’2019. The yield on interest-earning assets, however, declined to 10.1%, from 11.2% in Q1’2019, largely attributable to a faster 15.1% increase in average interest earning assets as compared to the 5.7% growth in Net Interest Income,
- Interest expense rose by 7.1% to Kshs 3.0 bn, from Kshs 2.8 bn in Q1’2019, following a 58.4% increase in interest expense on placements to Kshs 0.2 bn, from Kshs 0.1 bn in Q1’2019, offsetting the 8.0% decline in interest expense on deposits to Kshs 2.6 bn from Kshs 2.4 bn in Q1’2019. Other Expenses declined by 22.9% to Kshs 0.2 bn, from Kshs 0.3 bn in Q1’2019. Cost of funds declined to 4.7% from 5.0% in Q1’2019, owing to a faster 16.7% increase in interest-bearing liabilities, to Kshs 252.4 bn from Kshs 216.3 bn in Q1’2019 that outpaced the 7.1% growth in interest expense. Net Interest Margin (NIM) on the other hand declined to 5.8%, from 6.6% in Q1’2019 due to the slower 4.6% increase in NII, that was outpaced by the 15.1% increase in average interest-earning assets,
- Non-Funded Income rose by 7.4% to Kshs 2.2 bn, from Kshs 2.1 bn in Q1’2019. The increase was mainly due to a 20.9% increase in fees and commissions on loans to Kshs 470.0 mn from Kshs 388.9 mn in Q1’2019. In addition, other income increased by 7.7% to Kshs 511.0 mn from Kshs 427.4 mn in Q1’2019. Foreign exchange trading income however declined by 9.1% to Kshs 586.6 mn from Kshs 645.3 mn. The revenue mix shifted to 61:39 funded to non-funded income, from 62:38, owing to the faster 7.4% growth in NFI, compared to the 4.6% growth in NII,
- Total operating expenses rose by 24.5% to Kshs 3.0 bn from Kshs 2.4 bn in Q1’2019, largely driven by a 178.4% increase in Loan Loss Provisions (LLP) to Kshs 555.3 mn from Kshs 199.4 mn in Q1’2019, coupled with a 36.0% rise in Staff costs to Kshs 1.2 bn from Kshs 1.1 bn in Q1’2019, and,
- Cost to Income Ratio (CIR), with LLP deteriorated to 52.9%, from 44.9% in Q1’2019. Without LLP, cost to income ratio deteriorated as well to 43.1% from 41.2% in Q1’2019, an indication of reduced efficiency, and,
- Profit before tax declined by 23.8% to Kshs 2.5 bn, down from Kshs 3.3 bn in Q1’2019. Profit after tax declined by 31.1% to Kshs 1.6 bn in Q1’2020 from Kshs 2.3 bn in Q1’2019, with the effective tax rate increasing to 33.1%, from 27.5% in Q1’2019.
Balance Sheet
- The balance sheet recorded an expansion as total assets grew by 12.1% to Kshs 182.9 bn, from Kshs 168.9 bn in Q1’2019. Growth was supported by a 50.1% increase in placements to Kshs 49.4 bn from Kshs 32.9 bn in Q1’2019, coupled with an 8.3% loan book expansion to Kshs 182.9 bn from Kshs 168.9 bn in Q1’2019. Government securities on the other hand declined by 2.6% to Kshs 54.1 bn from Kshs 55.5 bn in Q1’2019,
- Total liabilities rose by 10.9% to Kshs 273.3 bn, from Kshs 246.5 bn in Q1’2019, driven by a 78.1% increase in placements to Kshs 13.2 bn from Kshs 7.4 bn in Q1’2019, coupled with an 8.8% rise in customer deposits to Kshs 240.7 bn from Kshs 221.2 bn in Q1’2019. Deposits per branch increased by 8.8% to Kshs 3.6 bn from Kshs 3.3 bn in Q1’2019, with the number of branches remaining unchanged at 67 branches. Borrowings increased by 11.2% to Kshs 11.8 bn, from Kshs 10.6 bn in Q1’2019,
- The faster 8.8% growth in deposits as compared to the 8.3% growth in loans led to a decline in the loan to deposit ratio to 76.0% from 76.4% in Q1’2019,
- Gross non-performing loans declined by 6.4% to Kshs 22.2 bn in Q1’2020 from Kshs 23.7 bn in Q1’2018. Consequently, the NPL ratio, thus, improved to 11.3% in Q1’2020 from 13.0% in Q1’2019 as the 6.4% decline in Non-Performing Loans, was outpaced by the 7.3% growth in gross loans. The NPL coverage improved to 58.8% in Q1’2020 from 57.4% in Q1’2019 as general Loan Loss Provisions increased by 28.0% to Kshs 9.0 bn from Kshs 7.1 bn in Q1’2019, despite a 6.4% decline in gross non-performing loans,
- Shareholders’ funds increased by 18.4% to Kshs 59.3 bn in Q1’2020, from Kshs 50.1 bn in Q1’2019, supported by an 18.9% increase in retained earnings to Kshs 34.8 bn, from Kshs 29.3 bn,
- I&M Holdings Plc remains sufficiently capitalized with a core capital to risk-weighted assets ratio of 16.8%, 6.3% points above the statutory requirement. In addition, the total capital to risk-weighted assets ratio came in at 21.1%, exceeding the statutory requirement by 6.6% points. Adjusting for IFRS 9, the core capital to risk-weighted assets stood at 16.9%, while total capital to risk-weighted assets came in at 21.2%,
- The bank currently has a Return on Average Assets (ROaA) of 3.0%, and a Return on Average Equity (ROaE) of 17.5%.
Key Take-Outs:
- The bank maintained its continued rise in NFI recording a 7.4% growth to Kshs 2.2 bn, from Kshs 2.1 bn in Q1’2019. This resulted in the revenue contribution mix shifting to 61:39 funded to non-funded income, from 62:38, owing to the high growth in NFI that outpaced growth in NII. The NFI contribution to total income rose by 0.6% points to 38.8% from 38.2% in Q1’2019. This is however above the current industry average of 22.8%,
- The bank’s asset quality improved, with the NPL ratio improving to 11.3%, from 13.0% in Q1’2019. NPL coverage also improved to 58.8%, up from 57.4% in Q1’2019 as the 28.0% rise in general provisions to Kshs 9.0 bn, from Kshs 7.1 bn in Q1’2019, outpaced the 6.4% decline in gross NPL to Kshs 22.2 bn in Q1’2020 from Kshs 23.7 bn in Q1’2019, and,
- There was a decline in efficiency levels as the cost to income ratio without LLP worsened to 52.9% from 44.9% in Q1’2020. The deterioration was largely attributable to a 178.4% rise in loan loss provision, which depressed the bottom line.
Going forward, the factors that would drive the bank’s growth would be:
- Non-Funded Income Growth Initiatives – I&M Holdings’ NFI growth is improving as the bank focuses on digital innovation to augment transaction volumes and increase fee income. The bank needs to increase the capacity of its brokerage and advisory businesses to increase income contribution from investment and advisory services, and,
- Geographical Diversification – The bank has been aggressively expanding into other regions, namely Tanzania, Rwanda, and Uganda. This is expected to drive growth in the near future.
For a comprehensive analysis, please see our I&M Holdings Plc Q1’2020 Earnings Note
Standard Chartered Bank Kenya
Income Statement
- Core earnings per share declined by 16.6% to Kshs 5.9, from Kshs 7.0 in Q1’2019, driven by a 5.6% decline in total operating income to Kshs 7.0 bn, from Kshs 7.4 bn in Q1’2019, coupled with a 5.7% rise in total operating expenses to Kshs 4.0 bn, from Kshs 3.8 bn in Q1’2019. The growth in core earnings per share was not in line with our expectations of a 0.3% decline, with the variance being attributable to the 5.6% decline in total operating income to Kshs 7.0 bn, from Kshs 7.4 bn in Q1’2020, against our expectations of an 8.7% increase,
- Total operating income declined by 5.6% to Kshs 7.0 bn, from Kshs 7.4 bn in Q1’2019. This was driven by a 6.5% decline in Non-Funded Income (NFI) to Kshs 2.2 bn, from Kshs 2.4 bn in Q1’2019, coupled with a 5.1% decline in Net Interest Income (NII) to Kshs 4.7 bn, from Kshs 5.0 bn in Q1’2019,
- Interest income was down by 4.3% to Kshs 6.1 bn, from Kshs 6.4 bn in Q1’2019. This was driven by 7.4% decline in interest income from government securities to Kshs 2.5 bn from Kshs 2.7 bn in Q1’2019, coupled with a 5.9% decline in interest income on loans and advances to Kshs 3.2 bn, from Kshs 3.4 bn in Q1’2019. Consequently, the yield on interest-earning assets declined to 9.4% from 10.6% in Q1’2019, attributable to the faster 6.1% y/y growth in average interest earning assets to Kshs 265.2 bn, from Kshs 250.0 bn in Q1’2019, that outpaced the 4.3% growth in interest income,
- Interest expense declined by 1.3% to Kshs 1.39 bn, from Kshs 1.40 bn in Q1’2019, following a 7.7% decline in interest expense on customer deposits to Kshs 1.2 bn from Kshs 1.3 bn in Q1’2019. Cost of funds, on the other hand, declined to 3.3%, from 3.6% in Q1’2019, owing to the faster 13.8% growth in average interest bearing liabilities, which outpaced the 1.9% decline in interest expense.
- Consequently, cost of funds declined to 2.4% from 3.4% in Q1’2019 owing to a 16.3% decline in trailing interest expense, despite a 17.1% rise in the average interest-bearing liabilities to Kshs 238.6 bn from Kshs 203.8 bn. Net Interest Margin (NIM) on the other hand declined to 7.2% from 7.8% in Q1’2019, owing to a 5.1% decline in Net Interest Income (NII), despite a 6.1% growth in average interest-earning assets,
- Non-Funded Income (NFI) declined by 6.5% to Kshs 2.2 bn, from Kshs 2.4 bn in Q1’2019. The decline was mainly driven by a 12.5% decline in Foreign Exchange Trading Income to Kshs 695.2 mn from Kshs 817.8 mn in Q1’2019. Fees and commissions on loans also declined by 12.5% to Kshs 73.5 mn from Kshs 76.4 mn in Q1’2019. The revenue mix remained unchanged at 68:32 funded to non-funded income owing to comparable declines both in Non-Funded Income (NFI) and Net Interest Income (NII),
- Total operating expenses grew by 5.7% to Kshs 4.0 bn, from Kshs 3.8 bn, largely driven by 116.8% rise in amortization charges to Kshs 170.0 mn in Q1’2020, from Kshs 78.4 mn in Q1’2019, coupled with a 3.1% rise in Loan Loss Provisions (LLP) to Kshs 0.43 bn in Q1’2020, from Kshs 0.42 bn in Q1’2019,
- Cost to Income Ratio (CIR) deteriorated to 58.1%, from 51.9% in Q1’2019 owing to the faster 5.7% rise in total operating expenses to Kshs 4.0 bn from Kshs 3.8 bn in Q1’2019, coupled with the 5.6% decline in total operating income to Kshs 7.0 bn, from Kshs 7.4 bn in Q1’2019. Without LLP, cost to income ratio deteriorated as well to 52.0%, from 46.3% in Q1’2019, an indication of reduced efficiency levels and,
- Profit before tax declined by 17.8% to Kshs 2.9 bn, from Kshs 3.5 bn in Q1’2019. Profit after tax also declined by 16.6% to Kshs 2.0 bn in Q1’2020, from Kshs 2.4 bn in Q1’2019 with the effective tax rate declining to 31.0% from 32.0% in Q1’2019,
Balance Sheet
- The balance sheet recorded an expansion as total assets grew by 3.4% to Kshs 311.5 bn, from Kshs 301.4 bn in Q1’2019. This growth was largely driven by a 49.5% increase in placements from banking institutions to Kshs 48.bn in Q1’2020, from Kshs 32.3 bn in Q1’2019. The loan book also recorded a 6.8% growth to Kshs 125.5 bn, from Kshs 117.6 bn in Q1’2019. Investment in government and other securities however, declined by 13.6% to Kshs 95.0 bn, from Kshs 110.0 bn in Q1’2019,
- Total liabilities rose by 3.7% to Kshs 261.6 bn, from Kshs 252.2 bn in Q1’2019, driven by a 4.6% increase in customer deposits to Kshs 243.6 bn, from Kshs 232.8 bn in Q1’2019. Deposits per branch rose by 4.6% to Kshs 6.8 bn from Kshs 6.5 bn in Q1’2019, with the number of branches remaining unchanged at 36 branches,
- Loans to deposit ratio increased to 51.5% from 50.0% in Q1’2019, owing to the 6.8% growth in net loans which outpaced the 4.6% in customer deposits during the same period,
- Gross Non-Performing Loans (NPLs) declined by 5.6% to Kshs 20.0 bn in Q1’2020, from Kshs 21.2 bn in Q1’2019, attributable to the bank’s conservative lending strategies. The NPL ratio thus improved to 14.2%, from 15.9% in Q1’2019, due to the faster growth in loans, which outpaced the growth in Gross Non-Performing Loans (NPLs),
- General Loan Loss Provisions declined by 2.9% to Kshs 7.8 bn, from Kshs 8.0 bn in Q1’2019. The NPL coverage thus increased to 78.1%, from 76.5% in Q1’2019, as the Interest in suspense declined by 4.5% to Kshs 7.8 bn, from Kshs 8.2 bn in Q1’2019, coupled with a 5.6% decline in the Gross Non-Performing Loans to Kshs 20.0 bn, from Kshs 21.2 bn in Q1’2019,
- Shareholders’ funds increased by 1.4% to Kshs 49.8 bn in Q1’2020, from Kshs 49.1 bn in Q1’2019, supported by a 6.1% increase in the proposed dividends to Kshs 5.2 bn, from Kshs 4.9 bn in Q1’2019. However, retained earnings declined by 16.6% y/y to Kshs 2.0 bn, from Kshs 2.4 bn in Q1’2019,
- Standard Chartered is currently sufficiently capitalized with a core capital to risk-weighted assets ratio of 15.0%, 4.5% points above the statutory requirement. In addition, the total capital to risk-weighted assets ratio was 18.0%, exceeding the statutory requirement by 3.5% points. Adjusting for IFRS 9, the core capital to risk-weighted assets stood at 15.0% while total capital to risk-weighted assets came in at 18.1%, and,
- The bank currently has a Return on Average Assets (ROaA) of 2.6%, and a Return on Average Equity (ROaE) of 15.8%.
Key Take-Outs:
- Asset Quality – the bank’s asset quality improved owing to the 14.2% decline in the NPL ratio in Q1’2020 from 15.9% recorded in Q1’2019. The improvement of the NPL ratio is attributable to the 5.6% decline in Gross Non-Performing Loans to Kshs 20.0 bn from Kshs 21.2 bn recorded in Q1’2019. The improvement was mainly attributable to the faster growth in gross loans which outpaced the growth in non-performing loans,
- Operating Efficiency - There was a decline in the bank’s operating efficiency as the cost to income ratio without LLP deteriorated to 52.0%, from 46.3% in Q1’2019. The deterioration was largely attributable to the 19.7% increase in other expenses to Kshs 1.9 bn, from Kshs 1.6 bn in Q1’2019, which were on the back on investments in their retail digital platform.
Going forward, we expect the bank’s growth to be driven by:
- Continued focus on promoting the usage of the bank’s alternative channels is likely to continue boosting the company’s Non-Funded Income (NFI) as well as aiding in improving operational efficiency levels, which deteriorated in Q1’2020 as evidenced by the worsening of the cost to income ratio to 58.1% from 51.9% in Q1’2019. Revenue expansion coupled with cost containment will be key in boosting the bank’s bottom line.
For a comprehensive analysis, please see our Standard Chartered Q1’2020 Earnings Note
HF Group
Income Statement
- HF Group released their Q1’2020 financial results, recording a loss per share of Kshs 0.016 in Q1’2020, an improvement from a loss per share of Kshs 4.1 recorded in Q1’2019, not in-line with our expectations of a Kshs 3.6 loss per share. This variance can be attributed to a 13.7% increase in Net interest income to Kshs 580.7mn from Kshs 510.8 mn higher than the 13.0% expected decline to Kshs 444.2 mn. The performance of the group can be attributed to a faster 10.8% decline in total operating expenses coupled with an 8.4% increase in total operating income,
- Total Operating Income rose by 8.4% to Kshs 0.83 bn in Q1’2020 from Kshs 0.77 bn, this can be attributed to a 13.7% increase in Net Interest Income (NII) to Kshs 0.6 bn from Kshs 0.5 bn recorded in Q1’2019, outpacing a 2.0% decline in Non-funded Income (NFI) to Kshs 253.5 mn from Kshs 258.7 mn seen in Q1’2020,
- Interest income declined by 7.8% to Kshs 1.2 bn, from Kshs 1.4 bn in Q1’2019. This was driven by a 10.8% decline in interest income from loans and advances to Kshs 1.1 bn, from Kshs 1.3 bn in Q1’2019. Interest income on government securities, however, recorded a 24.6% increase to Kshs 113.7mn, from Kshs 91.2 mn in Q1’2019. The yield on interest-earning assets declined to 11.0%, from 11.4% in Q1’2019, due to the faster 13.4% decline in trailing interest income compared with the 9.7% decline in the average interest-earning assets (IEA). Net Interest Margin (NIM) increased to 4.5%, from 4.1% in Q1’2019, following the slower 2.0% decline in Trailing NII, that outpaced the 9.7% decline in IEA,
- Interest expense declined by 20.9% to Kshs 0.7 bn, from Kshs 0.8 bn in Q1’2019, following a 58.8% decline in other interest income to Kshs 0.1 bn in Q1’2020 from Kshs 0.4 bn in Q1’2019. Interest
- Income on customer deposits, however, increased by 5.9% to Kshs 0.48 bn, from Kshs 0.46 bn in Q1’2019. Cost of funds declined to 6.5% from the 7.3% recorded in Q1’2019, following the faster 20.9% decline in interest expense that outpaced the 8.4% decline in the average interest-bearing liabilities (IBL),
- Non-Funded Income declined by 2.0% to Kshs 253.5 mn from Kshs 258.7 mn in Q1’2019. The decline was mainly due to a 61.9 % decline in Fees & Commissions to Kshs 24.4 mn, from Kshs 64.1 mn, coupled with a 10.3% decline in Other Income to Kshs 114.3 mn from Kshs 127.4 mn. Forex Trading Income however increased by 198.6% to Kshs 18.8 mn in Q1’2020 to Kshs 6.3 mn in Q1’2019. The revenue mix shifted to 70:30 funded to non-funded income, from 66:34, owing to the 13.7% increase in NII, with NFI declining by 2.0%,
- Total operating expenses declined by 10.8% to Kshs 0.8 bn from Kshs 0.9 bn seen in Q1’2019. This is attributable to a 23.4% decline in Loan Loss Provisions to Kshs 0.2 bn from Kshs 0.1 bn in Q1’2019, coupled with a 12.0% decline in Other Operating Expenses from Kshs 0.5 bn to Kshs 0.4 bn in Q1’2020. Staff Costs however increased by 0.5% to Kshs 256.4 mn from Kshs 255.0 mn in Q1’2019, and,
- The Cost to Income Ratio (CIR) improved to 99.2%, from 120.5% in Q1’2019. Without LLP, the cost to income ratio also improved, to 82.7% from 97.1% in Q1’2019, an indication of improved efficiency and,
- HF Group recorded a profit before tax of Kshs 7.0 mn an improvement from a loss before tax of Kshs 157.7 mn in Q1’2019. The Group’s Loss after Tax improved to Kshs 0.6 mn in Q1’2020, from the Kshs 158.3 mn loss recorded in Q1’2019.
Balance Sheet
- The company’s balance sheet recorded a contraction as total assets declined by 4.1% from Kshs 59.1 bn to Kshs 56.6 bn in Q1’2020. This is attributable to an 8.5% decline in the loan book to Kshs 38.4 bn from Kshs 42.0 bn recorded in Q1’2019, coupled with a, 26.0% decline in Placements to Kshs 1.0 bn from Kshs 2.0 bn recorded in Q1’2019. Government securities, however, increased by 39.3% to Kshs 5.0 bn from the Kshs 3.6 bn recorded in Q1’2019,
- Total liabilities declined by 4.9% to Kshs 46.4 bn, from Kshs 48.8 bn in Q1’2019, driven by a 55.2% decline in borrowings to Kshs 5.8 bn, from Kshs 13.0 bn in Q1’2019. This drop can be attributed to the Kshs 3.0 bn corporate bond that was retired during the last quarter of 2019. Customer deposits on the other hand increased by 11.8% to Kshs 38.0 bn from Kshs 34.0 bn in Q1’2019. Deposits per branch increased from Kshs 1.5 bn to Kshs 1.8 bn in Q1’2019 as the number of branches declined by 1 to 21 branches from 22 branches in Q1’2019,
- The loan to deposit ratio declined to 101.1% from 123.5% in Q1’2019 owing to the 8.5% decline in loans, despite the 11.5% increase in deposits,
- The bank’s Non-performing Loans (NPLs) declined by 5.8% to Kshs 12.2 bn from Kshs 13.0 bn recorded in Q1’2019. Consequently, the NPL ratio improved marginally to 27.3% from the 27.5% following the faster 5.8% decline in NPLs that outpaced the 5.0% decline in gross loans that came in at Kshs 44.8 bn in Q1’2020 from Kshs 47.1 bn recorded in Q1’2019,
- Shareholders’ funds declined by 4.9% to Kshs 10.2 bn in Q1’2020, from Kshs 10.3 bn in Q1’2019, this is attributable to the 0.1 bn negative Retained earnings recorded in Q1’2020 compared to the Kshs 0.8 bn recorded in Q1’2019. This effect was however mitigated by a 37.3% increase in statutory loan loss reserves to Kshs 3.1 bn from Kshs 2.2 bn recorded in Q1’2019,
- HF Group remains sufficiently capitalized with a core capital to risk-weighted assets ratio of 12.4%, 1.9% points above the statutory requirement of 10.5%. In addition, the total capital to risk-weighted assets ratio came in at 13.7% below the statutory requirement by 0.8% points. Adjusting for IFRS 9, the core capital to risk-weighted assets stood at 12.2%, while total capital to risk-weighted assets came in at 13.4%, and,
- The bank currently has a Return on Average Assets (ROaA) of 0.1%, and a Return on Average Equity (ROaE) of 0.5%.
Key Take-Outs:
- Despite the tough economic times amid the Coronavirus Pandemic, the bank experienced an improvement in asset quality unlike most listed banks with Non-performing Loans (NPLs) declined by 5.8% to Kshs 12.2 bn from Kshs 13.0 bn recorded in Q1’2019. Consequently, the NPL ratio improved marginally to 27.3% from the 27.5% following the faster 5.8% decline in NPLs that outpaced the 5.0% decline in gross loans that came in at Kshs 44.8 bn in Q1’2020 from Kshs 47.1 bn recorded in Q1’2019. Putting into consideration the current state of affairs regarding the COVID-19 pandemic, there is a lot more to be done to mitigate the effects experienced in the economy.
- The bank recorded a decline on the NFI income segment, which recorded a 2.0% decline y/y, largely due to a 61.9 % decrease in Fees & Commissions to Kshs 24.4 mn, from Kshs 64.1 mn, coupled with a 10.3% decrease in Other Income to Kshs 114.3 mn from Kshs 127.4 mn. Consequently, NFI contribution to total income declined by 3.2% points to 30.4% from 33.6% in Q1’2019. This is however above the current industry average of 22.8%, and,
- There was an improvement in efficiency levels as the cost to income ratio without LLP improved to 82.7%, from 97.1% in Q1’2019. The improvement was largely attributable to a 23.4% decline in Loan Loss Provisions.
Going forward, the factors that would drive the bank’s growth would be:
- Although HF Group has a long way to go as a conventional bank, it has recorded commendable performance with the bank beginning to show signs of profitability They will ultimately have to adjust their business model, or couple up with a strong bank with a sizeable asset base, and a strong deposit gathering capability, in an effort to capitalize on HF’s strength in mortgages and real estate development.
For a comprehensive analysis, please see our HF Group Q1’2020 Earnings Note
The table below highlights the performance of the banks’ earnings releases, showing the performance using several metrics, and the key take-outs of the performance.
|
Bank |
Core EPS Growth |
Interest Income Growth |
Interest Expense Growth |
Net Interest Income Growth |
Net Interest Margin |
Non-Funded Income Growth |
NFI to Total Operating Income |
Growth in Total Fees & Commissions |
Deposit Growth |
Growth in Government Securities |
Loan to Deposit Ratio |
Loan Growth |
Return on Average Equity |
|
I&M |
29.7% |
5.7% |
7.1% |
4.6% |
5.8% |
7.4% |
38.8% |
20.9% |
8.8% |
(2.6%) |
76.0% |
8.3% |
17.5% |
|
ABSA |
17.0% |
2.8% |
1.9% |
4.5% |
7.4% |
15.8% |
34.5% |
(0.2%) |
6.6% |
7.2% |
85.0% |
12.4% |
17.0% |
|
KCB |
8.4% |
20.4% |
26.6% |
18.5% |
8.1% |
30.5% |
34.4% |
23.8% |
34.1% |
52.0% |
74.8% |
19.3% |
20.1% |
|
DTBK |
3.7% |
(2.4%) |
(9.0%) |
2.9% |
5.7% |
3.4% |
25.4% |
39.3% |
(0.9%) |
1.9% |
73.8% |
6.7% |
12.6% |
|
Co-op |
(0.3%) |
4.5% |
(4.4%) |
8.5% |
8.2% |
19.0% |
39.9% |
14.0% |
6.9% |
11.5% |
81.3% |
9.8% |
18.5% |
|
Equity |
(14.1%) |
14.3% |
26.7% |
10.6% |
8.2% |
15.8% |
41.9% |
12.5% |
16.5% |
14.2% |
75.9% |
24.1% |
20.7% |
|
SCBK |
(16.6%) |
(4.3%) |
(1.3%) |
(5.1%) |
7.1% |
(6.5%) |
32.1% |
(12.5%) |
4.6% |
(13.6%) |
51.5% |
6.8% |
15.8% |
|
NCBA*** |
(26.8%) |
6.8% |
8.3% |
5.5% |
3.3% |
49.7% |
49.7% |
130.0% |
12.6% |
21.1% |
63.0% |
5.5% |
10.6% |
|
Stanbic |
(33.5%) |
(7.1%) |
0.5% |
(11.0%) |
5.5% |
(29.2%) |
49.9% |
10.0% |
6.4% |
(11.5%) |
79.8% |
11.8% |
14.5% |
|
HF Group |
N/A |
(7.8%) |
(20.9%) |
13.7% |
4.5% |
(2.0%) |
30.4% |
(61.9%) |
11.8% |
39.3% |
101.1% |
(8.5%) |
0.5% |
|
Q1'20 Mkt Weighted Average* |
(3.5%) |
8.2% |
11.8% |
7.4% |
7.2% |
15.8% |
22.8% |
21.4% |
14.6% |
15.4% |
74.0% |
14.5% |
17.7% |
|
Q1'19Mkt Weighted Average** |
12.2% |
3.6% |
2.5% |
4.5% |
8.0% |
10.7% |
36.0% |
11.2% |
11.0% |
16.1% |
74.0% |
7.7% |
19.2% |
|
*Market cap weighted as at 29/05/2020 **Market cap weighted as at 31/05/2019 *** The financial statements of the bank have been prepared on a prospective basis (assuming a continuation of CBA), representing Q1’2020 results of NCBA bank (merged bank) with prior year comparatives (Q1’2019) being those of CBA bank. Hence, the results are not comparable on a like for like basis. As such, we have used proforma-combined financials for the two entities. |
|||||||||||||
Key takeaways from the table above include:
- Listed banking sector recorded an average (3.5%) decrease in core Earnings Per Share (EPS), compared to a growth of 12.2% in Q1’2019, the depressed earnings recorded in the listed banking sector is partly attributed to the tough operating environment occasioned by the ongoing Coronavirus pandemic,
- The sector recorded a deposit growth of 14.6%, faster than the 11.0% growth recorded in Q1’2019. The faster growth in deposits led to a faster 11.8% growth in interest expenses, compared to 2.5% in Q1’2019, indicating that banks struggled to mobilize relatively cheaper deposits amid the ongoing pandemic as most customers prefer liquidity,
- Average loan growth came in at 14.5%, which was faster than the 7.7% recorded in Q1’2019, with the growth in loans being accelerated following the repeal of interest rate cap in November 2019, coupled with increased demand in funding, as businesses demand working capital to operate in the tough operating environment as a result of the pandemic. Government securities, on the other hand, recorded a growth of 15.4% y/y, which was faster compared to the loans, albeit slower than the 16.1% growth recorded in Q1’2019. This highlights banks’ continued preference towards investing in government securities, which offer better risk-adjusted returns,
- Interest income increased by 8.2%, compared to a growth of 3.6% recorded in Q1’2019. The faster growth in interest income may be attributable to the 14.5% growth in loans and increased allocation to government securities. Consequently, the Net Interest Margin (NIM) declined to 7.2%, compared to the 8.0% recorded in Q1’2019 for the whole listed banking sector, and,
- Non-Funded Income grew by 15.8% y/y, faster than 10.7% recorded in Q1’2019. The growth in NFI was supported by the 21.4% average increase in total fee and commission income, which was faster than the 11.2% growth recorded in Q1’2019.
Other Earning Releases:
- KCB Group released their Q1’2020 financial results, with their core earnings per share recording an 8.4% increase to Kshs 1.95 in Q1’2020, from Kshs 1.80 in Q12019, not in-line with our expectations of Kshs 1.79 earnings per share. The performance can be attributed 22.4% growth in total operating income to Kshs 23.0 bn, from Kshs 18.8 bn in Q1’2019. The balance sheet recorded an expansion as total assets grew by 30.5% to Kshs 947.1 bn, from Kshs 725.7 bn in Q1’2019. This growth was largely driven by a 52.0% increase in investment in government and other securities to Kshs 202.6 bn, from Kshs 133.3 bn in Q1’2019. The loan book also recorded a 19.3% growth to Kshs 553.9 bn, from Kshs 464.3 bn in Q1’2019. The strong balance sheet growth is also partly attributable to KCB consolidating assets following the acquisition of NBK. For more information, see our KCB Group Q1’2020 Earnings Note.
- Co-operative Bank released their Q1’2020 financial results, with their core earnings per share recording a 0.3% decrease to Kshs 0.612 in Q1’2020, from Kshs 0.613 in Q1’2019, which was in line with our projections. The performance was driven by the 20.6% increase in total operating expenses, which grew faster than the 12.5% growth in total operating income in Q1’2020. The balance sheet recorded an expansion as total assets grew by 10.5% to Kshs 470.4 bn in Q1’2020 from Kshs 425.7 bn in Q1’2019, mainly attributable to the 11.5% growth in government securities to Kshs 115.9 bn in Q1’2020 from Kshs 103.9 bn, coupled with a 9.8% growth in net loans and advances to Kshs 276.2 bn in Q1’2020 from Kshs 251.6 bn in Q1’2019. Deposits placements also rose by 27.0% to Kshs 19.3 bn from Kshs 15.2bn. For more information, see our Co-operative Bank Q1’2020 Earnings Note.
- Diamond Trust Bank released their Q1’2020 financial results, with core earnings per share increasing by 3.7% to Kshs 7.3, from Kshs 7.0 in Q1’2019, in line with our expectations. The performance was driven by the 3.0% increase in total operating income to Kshs 6.3 bn from Kshs 6.1 bn in Q1’2019 despite the 5.2% rise in total expenses. The balance sheet recorded an expansion as total assets increased by 4.0% to Kshs 385.0 bn from Kshs 370.1 bn in Q1’2019. This growth was largely driven by a 6.7% increase in net loans to Kshs 201.3 bn from Kshs 188.6 bn in Q1’2019, coupled with a 1.9% increase in government securities to Kshs 128.2 bn from Kshs 125.8 bn in Q1’2019. The growth in assets was however slowed down by a 21.9% decline in placements to Kshs 8.6 bn from Kshs 11.1 bn in Q1’2019. For more information, see our DTBK Q1’2020 Earnings Note.
- NCBA Group released their Q1’2020 financial results, with core earnings per share declining 26.8% to Kshs 2.3 from Kshs 3.2 in Q1’2019, which was not in line with our projections of Kshs 1.6. The performance can be attributed to a 23.6% increase in total operating income to Kshs 10.9 bn from Kshs 8.8 bn in Q1’2019, coupled with the 49.8% increase in total operating expenses from Kshs 5.5 bn in Q1’2019 to Kshs 8.3 bn in Q1’2020 by 3.7% to Kshs 7.3, from Kshs 7.0 in Q1’2019, in line with our expectations. The balance sheet recorded an expansion with a total assets growth of 9.2% to Kshs 509.6 bn from Kshs 466.8 bn in Q1’2019. This growth was largely driven by a 21.1% increase in government securities to Kshs 153.5 bn from the Kshs 126.8 bn recorded in Q1’2019. The loan book expanded by 3.9% to Kshs 245.9 bn in Q1’2020 from Kshs 240.6 bn in Q1’2019.
Key to note is that the financial statements of NCBA Group were prepared on a prospective basis (assuming a continuation of CBA), representing Q1’2020 results of NCBA bank (merged bank) with prior year comparatives (Q1’2019) being those of CBA bank. Hence, the results are not comparable on a like for like basis. As such, we used proforma-combined financials for the two entities. For more information, see our NCBA Q1’2020 Earnings Note.
Monthly Highlights
- During the month, the Central Bank of Kenya (CBK), disclosed that Kenya’s seven largest banks had restructured loans amounting to Kshs 176.0 bn in April, equivalent to 6.4% of the industry’s total gross loan book of Kshs 2.8 tn as at January 2020, as the economy continues to suffer from the pandemic it is expected to impact borrowers’ ability to repay and service their loans. For more information, please see Cytonn Weekly #19/2020,
- During the month, global rating agency Moody’s changed the outlook for KCB, Equity and Co-operative Bank to “Negative” from “Stable” but affirmed all three banks’ local currency deposit ratings at B2, citing the link between their rating and that of the state due to the top banks’ large exposure to government securities, which poses a risk to their credit profile. For more information, please see Cytonn Weekly #20/2020,and,
- During the month, KCB Group disclosed it had restructured loans amounting to Kshs 80.0 bn, equivalent to 14.9% of its net loans, which stood at Kshs 535.4 bn in FY’2019. The loan restructuring involves placing moratoriums on both interest and principal payments for three months, in effect giving reprieve to its customers who found it difficult to repay their loans due to the impact caused by the pandemic. For more information, please see Cytonn Weekly #20/2020.
Weekly Highlight
During the week, the Board of Directors for Equity Group withdrew their recommendation to pay a first and final dividend of Kshs 2.50 per share for FY’2019, and instead recommended to shareholders that no dividend be paid for FY2019. This decision was made after considering the effects of the COVID-19 pandemic and the need to conserve cash to enable the company to respond appropriately to the unfolding crisis in terms of supporting its customers through the crisis and directing cash resources to potential opportunities that may arise as economies in which the group operates begin to recover. Equity Group is among the NSE-Listed Companies such as NCBA and Nation Media Group, which have suspended their dividend payments for FY’2019. The announcement of the suspension of dividend payment on 26th May 2020 led to bank’s share prices recording a 5.4% decline to close at Kshs 34.2 from Kshs 36.2 recorded on 25th May 2020. We believe that the suspension of dividend payment will offer the bank enough capital buffer against the effects of the coronavirus. Additionally, Standard Chartered Bank announced the postponement of the proposed final dividend payments of Kshs 15.0 per share for FY’2019 that was scheduled to be paid on 28th May 2020. The lender indicated that given that their 34th Annual General Meeting (AGM) which was to take place on 28thMay 2020, remained postponed, the payment of the final dividend would be delayed because approval of the final dividend payment would be at the AGM. Below are some of the corporate actions, in relation to dividend payments, by companies listed in the stock exchange:
|
Company |
Corporate Actions |
Dividend Amount Withheld (Kshs bn) |
|
Equity Group |
Suspends payment of first and final dividend |
9.4 |
|
NCBA |
Suspends Cash Dividend, and does a Bonus Issue |
2.2 |
|
Nation Media Group |
Suspends Cash Dividend, and does a Bonus Issue |
0.3 |
|
Co-operative Bank |
Advanced payment of proposed dividends |
- |
|
BAT Kenya |
Advanced payment of proposed dividends |
- |
|
Kakuzi |
Advanced payment of proposed dividends |
- |
|
Standard Chartered |
Postpones the payment of final dividends to a later date |
- |
|
Total |
11.9 |
|
Given the impact of the coronavirus that has disrupted business operations, we expect more firms to mirror the approach taken by NCBA and Equity Group in order to provide adequate buffer to their capital.
Universe of Coverage
|
Banks |
Price at 30/04/2020 |
Price at 29/05/2020 |
w/w change |
m/m change |
YTD Change |
Year Open |
Target Price* |
Dividend Yield |
Upside/ Downside** |
P/TBv Multiple |
Recommendation |
|
Diamond Trust Bank |
74.0 |
71.3 |
(3.7%) |
(14.2%) |
(34.6%) |
109.0 |
179.7 |
3.8% |
156.0% |
0.4x |
Buy |
|
Kenya Reinsurance |
2.4 |
2.4 |
0.9% |
(6.0%) |
(21.8%) |
3.0 |
4.8 |
4.6% |
107.2% |
0.2x |
Buy |
|
Jubilee Holdings |
250.0 |
250.0 |
0.0% |
(4.9%) |
(28.8%) |
351.0 |
453.4 |
3.6% |
84.9% |
0.9x |
Buy |
|
KCB Group*** |
36.3 |
35.5 |
(2.3%) |
(4.2%) |
(34.4%) |
54.0 |
55.8 |
9.9% |
67.3% |
0.9x |
Buy |
|
I&M Holdings*** |
49.4 |
47.4 |
(4.1%) |
(7.6%) |
(12.3%) |
54.0 |
73.6 |
5.4% |
60.8% |
0.7x |
Buy |
|
Equity Group*** |
36.2 |
35.3 |
(2.5%) |
(6.4%) |
(34.1%) |
53.5 |
55.3 |
0.0% |
56.9% |
1.2x |
Buy |
|
Co-op Bank*** |
12.6 |
12.4 |
(1.6%) |
(2.0%) |
(24.5%) |
16.4 |
18.2 |
8.1% |
55.5% |
1.0x |
Buy |
|
NCBA |
27.2 |
27.0 |
(0.6%) |
(5.3%) |
(26.7%) |
36.9 |
39.4 |
0.9% |
46.9% |
0.7x |
Buy |
|
Standard Chartered |
173.3 |
166.0 |
(4.2%) |
(11.5%) |
(18.0%) |
202.5 |
223.6 |
12.0% |
46.7% |
1.4x |
Buy |
|
Stanbic Holdings |
85.8 |
85.0 |
(0.9%) |
(8.1%) |
(22.2%) |
109.3 |
109.8 |
8.3% |
37.5% |
1.0x |
Buy |
|
Sanlam |
16.1 |
16.0 |
(0.3%) |
6.7% |
(7.0%) |
17.2 |
21.7 |
0.0% |
35.6% |
1.3x |
Buy |
|
ABSA Bank*** |
10.4 |
10.8 |
4.3% |
1.9% |
(19.1%) |
13.4 |
12.6 |
10.2% |
26.9% |
1.2x |
Buy |
|
Liberty Holdings |
8.3 |
8.2 |
(1.2%) |
(1.7%) |
(20.8%) |
10.4 |
10.1 |
0.0% |
22.7% |
0.7x |
Buy |
|
HF Group |
4.1 |
4.0 |
(1.5%) |
2.6% |
(38.2%) |
6.5 |
4.3 |
0.0% |
7.8% |
0.2x |
Hold |
|
CIC Group |
2.3 |
2.5 |
4.7% |
8.4% |
(8.6%) |
2.7 |
2.6 |
0.0% |
7.7% |
0.8x |
Hold |
|
Britam |
6.6 |
6.6 |
(0.3%) |
(3.5%) |
(26.7%) |
9.0 |
6.8 |
3.8% |
6.1% |
0.7x |
Hold |
|
*Target Price as per Cytonn Analyst estimates **Upside/ (Downside) is adjusted for Dividend Yield ***Banks in which Cytonn and/or its affiliates are invested in |
|||||||||||
We are “Neutral” on equities for investors because, despite the sustained price declines, which have seen the market P/E decline to below its historical average presenting investors with attractive valuations in the market, the economic outlook remains grim.
- Industry Reports
During the month, the Kenyan Bankers Association (KBA) released their Housing Price Index Q1’2020 report, and the key take-outs from the report were as follows:
- House prices contracted by 0.5% in Q1’2020, 0.1% points lower than the 0.6% recorded in Q4’2019. The sluggish growth is attributed to the normalization of house prices as the market comes into balance after a prolonged period of sustained price growth, and,
- Townhouses accounted for 45.0% of the units sold during the quarter while apartments, bungalows and maisonettes accounted for 33.0%, 12.0% and 10.0%, respectively, with 78.0% of market activity occurring in cluster 2 which included areas such as: Thindigua (Kiambu Road), Kiambu, South B, South C, Kabete, Komarock, Ngong Road, Lang’ata and Waiyaki Way, fuelled by the affordability of the units mainly to the middle class population.
This is in line with our Cytonn Q1'2020 Markets Review report, which showed, returns to investors in Q1’2020 recorded a 1.0% points decline coming in at 5.1%, compared to 6.1% recorded in Q4’2019, attributable to a 0.1% correction in prices owing to a decline in demand in the face of a challenging economic environment. Moreover, the upper mid-end market of the detached housing segment recorded the highest returns coming in at 5.1%, 0.9% points and 0.4% points higher than 4.2% and 4.7% recorded by the high-end and lower mid-end segments, respectively. We expect a decline in transaction volumes and an overall dampening of the sector’s performance going forward owing to the COVID-19 global pandemic. However, we expect the high demand for affordable housing and positive demographics to cushion the sector.
Other real estate related reports released during the month include:
|
Theme |
Report |
Take-outs |
|
|
1. |
Residential |
Hass Property Index Q1’2020 report, by Hass Consult |
· Detached units and apartments recorded an average y/y price correction of 1.6% and 2.0%, respectively, and a 1.3% q/q appreciation for detached units and a 0.4% correction for apartments, · Semi-detached units registered a q/q and y/y price appreciation of 0.9% and 5.8%, respectively. For more analysis see, Cytonn Weekly #19/2020. |
|
2. |
Land |
Land Price Index Q1’2020 Report, by Hass Consult |
· Land prices recorded a marginal decline for both suburbs and satellite towns in Q1’2020, at 0.9% and 0.2%, respectively, · Annually, land prices in Nairobi's suburbs marginally increased by 0.3% while for the satellite towns prices increased by 6.5%. For more analysis see, Cytonn Weekly #19/2020. |
- Residential sector
During the month, the National Government, through the Treasury, failed to allocate funds to the State Department for Housing for disbursement of loans to Civil servants under the Civil Servants Housing Scheme (CSHS), marking the second consecutive year that the government has failed to do so. The Civil Servants Housing Scheme fund, a tenant purchase scheme, was established by the government in 2004 to provide housing loan facilities to civil servants for the purpose of either; (i) purchase, improvement or development of a residential house for the occupation of the applicant, (ii) purchase of land for development, and, (iii) equity release for the improvement or development of a residential property. Since its inception, CSHS has facilitated more than 3,000 civil servants’ access to housing through housing finance loans or sale of houses constructed through the Scheme. The Scheme has also partnered with two mortgage finance institutions, Home and Loan of KCB and Housing Finance, who have advanced loans worth Kshs 2.95 bn and Kshs 1.52 bn, respectively, as at June 2018. Housing loans provided under the scheme have the following features;
- The maximum amount of loan that can be granted to a civil servant ranges between Kshs 4 mn to Kshs 20 mn depending on seniority and affordability,
- The loan is repayable within a period of twenty (20) years or before the loanee attains the age of 60 years whichever is earlier,
- The interest payable on the loan is at the rate of 5.0% per annum on a monthly reducing balance,
- The applicant is facilitated up to 90.0% of the property value but is expected to pay a down payment of 10.0%, and,
- The loan repayment is through a check-off system which reduces lending risk and administrative cost.
In our view, the delay of government funding to the Civil Servants Housing Scheme is part of its austerity measures geared towards plugging fiscal gaps brought about by reduced revenue collection, high debt payments and redeployment of funds towards efforts to mitigate the impact of COVID-19 on the economy. This, in addition to a slash on development expenditure for the current fiscal year, will further retard the progress of the National Government’s development of affordable housing as one of its pillars under the big four agenda, dealing a blow to its earlier intention of offering civil servants subsidized housing which was intended to divest the government of the responsibility of direct housing to employees except those involved in essential services,
Shelter Afrique, a Pan-African housing development financier, announced that it had restructured loans worth Kshs 3.1 bn granted to seven Kenyan home developers after the latter requested for a deferral, citing construction delays, stoppages and shrinking returns in the wake of the COVID-19 pandemic. The adverse effects of the pandemic continue to be witnessed across all sectors in real estate as demand for commercial retail space, offices and residential units remains low due to a slowdown in economic activities, declining disposable incomes and changing consumer behaviour through measures such as working from home and e-commerce. Some of the challenges experienced by the real estate and construction sector include;
- Constrained financing for developers as financiers such as banks aim to limit exposure amidst increasing loan deferrals and defaults,
- Slow uptake of housing units and probable low returns from available occupied units either from tenant turnover or downward pressure on effective rents from the existing tenants through delayed payment,
- Creation of pending bills as a result of contracts running through the COVID-19 period,
- Shortage of labour as employees avoid work to avert contracting the virus in addition to adhering to government directives on social distancing, and,
- Supply chain constraints as the import of supplies required by builders and developers are interrupted.
The real estate and construction sectors continue to experience the adverse effects of the ongoing pandemic evidenced by reduced borrowers’ inability to service their loans on time. In April this year, Kenya’s seven largest banks restructured loans worth Kshs 176 bn, with real estate and construction sectors accounting for 34.2% of the total loans restructured which will give borrowers tailored terms such as suspension of interests and/or principal, change of collateral or extension of the tenor. The pandemic has continued to impact on the real estate sector, resulting in reduced development activities and uptake. However, we expect liquidity in the sector to be cushioned by, among others, the National Government’s economic stimulus programme intended to enhance economic activity and the decision by the Monetary Policy Committee (MPC) to retain the Central Bank Rate (CBR) at 7.0% a step that has seen the private sector credit grew by 9.0% in the 12 months leading to April 2020 with building and construction accounting for 7.7% of the same.
The Kitui County Government rolled out an affordable housing program aimed at developing approximately 1,980 modern houses for its residents. The two housing projects situated at Kalawa Road and Manyenyoni, in Kitui County will be undertaken under a public-private partnership between the county and two private developers, namely, Tecnofin Kenya Limited and Keiwa Group, respectively. For more information, see Cytonn Weekly #20/2020, and,
The Ministry of Transport, Infrastructure, Housing and Urban Development published the National Housing Development Fund Regulations 2020. The regulations are aimed at guiding the operationalization of the National Housing Development Fund (NHDF), which was established in 2018 in line with the government’s affordable housing initiative and under the mandate of the National Housing Corporation (NHC), to help bridge the affordable housing gap in Kenya. For more information, see Cytonn Weekly #21/2020.
We expect the residential sector to record increased public-private partnerships between the national government, county governments, and private developers geared towards developing more affordable housing units. However, on overall, we expect a decline in transaction volumes and a sluggish growth of returns owing to the COVID-19 global pandemic.
- Retail Sector
During the month, the retail sector recorded several activities;
- Local retailer, Tuskys Supermarket, closed down their branch in Mtwapa, Mombasa, attributed to strained revenues due to reduced demand as a result of constrained spending power among consumers due to a tough financial environment. We expect, occupancy rates of major retail centers to drop during this period as most retailers are shutting down their operations to cushion themselves against the impact of the pandemic. However, we expect to see retailers invest in their e-commerce infrastructure and also decentralize to locations that are easily accessible from people’s homes. For more information, see Cytonn Weekly #20/2020,
- Quickmart Supermarket, a local retailer, opened its first store in Nairobi’s Central Business District (CBD), along Tom Mboya Street, taking up space previously occupied by Botswana-based Choppies, who has since exited the Kenyan market due to financial difficulties in an increasingly competitive retail market. In our view, the retailer will leverage on the relatively high footfall within the CBD. For more information, see Cytonn Weekly #20/2020, and,
- Car and General Kenya, a local supplier of power generation, automotive and engineering products, announced that it had secured Carrefour supermarket as the anchor tenants for its refurbished Nairobi Mega property off Uhuru Highway. The 170,000 SQFT property was previously anchored by Nakumatt, which had occupied 40,000 SQFT. For more information, see Cytonn Weekly #21/2020.
We expect occupancy rates of major retail centers to drop during this period as most retailers are shutting down their operations to cushion themselves against the impact of the Coronavirus pandemic. However, we expect to see retailers invest in their e-commerce infrastructure and also decentralize to locations that are easily accessible from people’s homes.
- Hospitality Sector
During the month, Fairmont Hotels and Resorts, which owns the iconic Norfolk Hotel in Nairobi, announced plans to close its local hotels indefinitely and fire its staff due to uncertainties and financial constraints in the wake of the coronavirus pandemic. Hotels expected to be closed include; Fairmont Mount Kenya Safari Club, Fairmont the Norfolk, and, Fairmont Mara Safari Club. This follows the suspension of operations in other major hotels such as The Tribe and Ole Sereni, as the hospitality sector continues to grapple with the effects of the Coronavirus pandemic, mainly due to its reliance on tourism, as travel restrictions and social distancing rules continue to result in reduced demand for hospitality services, coupled by the current ban on international flights, reduced local direct flights, and, cancellation of meetings, conferences, and events.
Hotel chain Sarova Hotels announced that it would stop managing Sarova Taita Hills Game Lodge and Sarova Salt Lick Game Lodge after 13 years of the management deal. In March this year, the hotel chain also suspended operations in four of its local hotels and lodges indefinitely as a result of reduced demand for hotel accommodation due to the COVID-19 pandemic. For more information, see Cytonn Weekly #19/2020.
We expect the sector’s recovery to commence in the near term on the back of government policies aimed at cushioning the sector such as the government’s directive to re-open hotels and restaurants in major towns, the Ministry of Tourism’s post-corona recovery strategy fund of Kshs 500.0 mn, the government’s 8-point stimulus programme which, among others, seeks to offer soft loans to hotels and related establishments through the Tourism Finance Corporation (TFC) thus stimulating the hospitality sector, and, the tourism sector’s plan to repackage their products in order to appeal to a wider scope of domestic tourists.
- Industrial Sector
During the month, Africa Logistics Properties (ALP) announced plans to continue investing in modern grade-A warehousing across the country, with the planned completion of their 50-acre warehousing complex at Tilisi Industrial Park, Limuru, by December this year. The move indicates the continued demand for modern industrial space fuelled by, among other factors, the government focus on boosting the manufacturing sector under the Big Four Agenda. For more information, see Cytonn Weekly #19/2020,
Local construction firm, Jilk Construction Company Limited set up a new plant in Tatu Industrial Park. The plant is expected to produce asphalt concrete, paving blocks, and road furniture for civil works and construction projects across Kenya thus signaling the continued growth of local production of construction materials. We expect this to help reduce construction costs thus relieve the financial burden on developers and boost the government’s goal of providing affordable housing. For more information, see Cytonn Weekly #20/2020, and,
Sameer Africa, a local company whose principal business is the importation and sale of tyres, announced that it would be turning its focus to its real estate business after closing its tyre distribution business citing losses as a result of stiff competition from cheap imports. The move is an indication of investor confidence in the real estate sector which has continued to record growth despite a tough economic environment. For more information, see Cytonn Weekly #20/2020.
We expect to see an increase in demand for modern industrial space fuelled by; (i) Increased online shopping trends and the resultant growth of e-commerce businesses, (ii) government focus on manufacturing as part of its Big 4 Agenda, (iii) improving infrastructure, and, (iv) a shift in activities from the existing Industrial Area due to challenges such as poor infrastructure and high land costs, to satellite towns such as Ruiru and Limuru supported by increased demand for centralized warehouses by retailers.
- Infrastructure
During the month, Water and sanitation Cabinet Secretary, Sicily Kariuki unveiled a Kshs 1.3 bn Kiambu-Ruaka water supply and sewerage project. The project will be implemented by the Athi Water Works Development Agency through funding by the African Development Bank (AfDB). We expect this to enhance the appeal of areas such as Ruaka and Kiambu, subsequently supporting the areas’ continued real estate growth and performance. For more information, see Cytonn Weekly #21/2020.
We expect the continued improvement of infrastructure to boost the real estate sector as the availability of facilities such as sewerage systems remains a key factor of consideration by both investors and homebuyers.
- Statutory Review
During the month, National Treasury Cabinet Secretary, Ukur Yatani published regulations aimed at guiding the new amendment to Section 38 of the Retirement Benefits Act which was amended through the Tax Act 2020, allowing pensioners to use a portion of their pension savings to purchase a residential home. As per the regulations, pensioners will be allowed to use the lower of 40.0% of their pension savings or a maximum of Kshs 7.0 mn towards purchasing a home, in addition to the using 60.0% of their accumulated pension savings as mortgage collateral. For more information, see Cytonn Weekly #19/2020,
The Ministry Of Lands and Physical Planning invited the public for participation in the regulatory impact statement for the proposed Land Transactions (Electronic) Regulations 2020. The proposed regulations seek to affect the development and implementation of a National Land Information System and the maintenance of a land register, with the aim of enabling Kenyans to access land-related information electronically through the use of online portals and carry out all registry transactions under the Act through the electronic registry system. For more information, see Cytonn Weekly #20/2020,
The Nairobi City County Government announced the suspension of the existing e-construction development application pending development of a new system, and, annulment of all applications processed through the e-construction development management system from 18th March 2020 going forward (The County Government later announced that all applications processed between 18th March and 14th May would be valid but would be subjected to verification). This followed the handing over of the functions of the Nairobi County Government to the National Government in February this year, with the changes aimed at enhancing the efficiency of operations especially with the current delays in the issuance of construction permits. For more information, see Cytonn Weekly #20/2020, and,
The Ministry of Transport, Infrastructure, Housing, Urban Development, and Public Works gazetted the National Construction Authority (Defects Liability) Regulations 2020, which introduced various changes to the defects liability period with regards to commercial buildings. Amongst the changes introduced, was a latent defects liability period for commercial buildings which shall be a minimum period of six years from completion of the regular defects liability period (which will now be referred to as the patent defects liability period). For more information, see Cytonn Weekly #21/2020.
We expect the government to continue formulating policies geared towards enhancing the ease of doing business in addition to enhancing homeownership, thus a resultant boost to the real estate sector.
- Listed Real Estate
On the bourse, Stanlib Fahari I-REIT’s price per share declined by 30.0% to close at Kshs 6.3 at the end of May, from Kshs 9.0 at the end of April 2020. On average, the REIT traded at Kshs 7.5 per share, a 10.7% decline from an average of Kshs 8.4 per share in April 2020. We expect the performance of listed real estate to be in line with the general performance of the markets due to the ongoing COVID-19 pandemic.
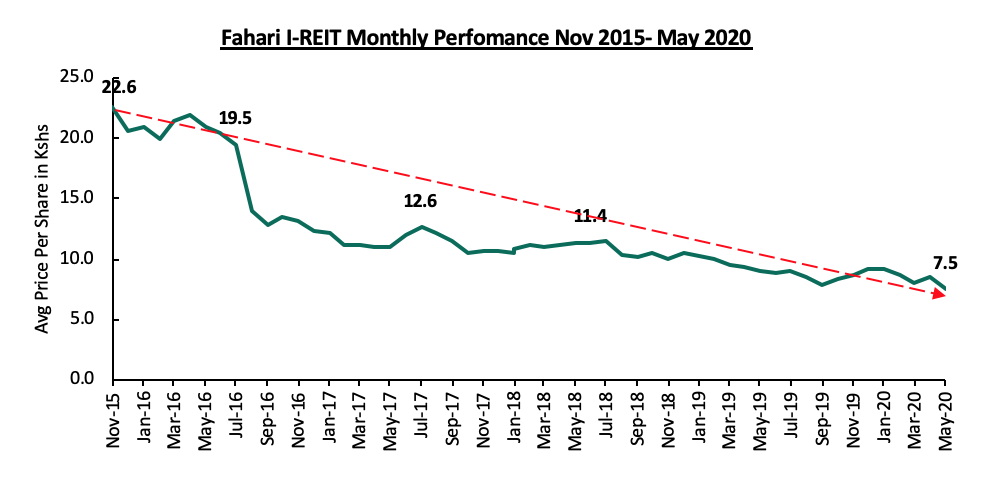
During the month, Fund manager, ICEA Lion Asset Management (ILAM) announced that it had completed a transaction with Stanlib Kenya Limited (SKL) that will see it acquire the latter’s role of managing property fund Stanlib Fahari I-REIT, from South Africa based Liberty Holdings Ltd. ILAM will now acquire all rights, obligations, and benefits of SKL in connection with SKL’s role as promoter and REIT manager. For more information, see Cytonn Weekly #21/2020.
Despite the continued negative impact of the COVID-19 pandemic on the real estate sector and the economy as a whole, we expect the sector to be cushioned by; (i) the expansion of local retailers, (ii) continued public-private partnerships between County governments and private developers with the aim of driving the affordable housing initiative, (iii) supportive government policies geared towards enhancing homeownership, (iv) continued investment towards infrastructure, and, (v) the National Government’s use of monetary and fiscal policies to sustain liquidity in the economy.
Disclaimer: The views expressed in this publication are those of the writers where particulars are not warranted. This publication is meant for general information only and is not a warranty, representation, advice or solicitation of any nature. Readers are advised in all circumstances to seek the advice of a registered investment advisor.

- Talk to us
- Kenya
- P.O Box 20695 - 00200, Nairobi, Kenya
- Cell +254709101200
- Tel +254709101200
- WhatsApp +254741676635
- United States
- +254709101200
- DOWNLOAD OUR APP
-


- Kenya
- 8th Floor, Pinetree Plaza, Kaburu Drive, Ngong Road, Nairobi, Kenya
- USA
- Suite 1150, 1775 Eye Street NW, USA, Washington DC 20006, USA
- Investments
- High Yield
- Private Equity
- Real Estate
- Real Estate
- RiverRun Estates
- Cytonn Towers
- The Ridge
- Taraji Heights
- The Alma