Cytonn Q1’2023 Markets Review
By Cytonn Research, Apr 2, 2023
Executive Summary
Global Market Review
According to the January 2023 World Economic Outlook Report by the International Monetary Fund (IMF), the global economy is projected to grow at a rate of 2.9% in 2023, 0.5% points slower than the growth of 3.4% recorded in 2022. The latest projection is 0.2% points higher than the IMF’s earlier projection of 2.7% growth, with the upward revision being on the back of full reopening of China coupled with expected easing of global inflation as the Central Banks around the world continue to tighten their monetary policies. Notably, advanced economies are expected to record a 1.2% growth in 2023, which is a significant decline from the 2.7% expansion recorded in 2022. However, the emerging markets and developing economies are projected to expand by 4.0% in 2023, marginally upwards from an estimated growth of 3.9% in 2022;
Sub-Saharan Africa Region Review
According to the International Monetary Fund (IMF), the Sub Saharan economy is projected to grow at a moderate rate of 3.8% in 2023, unchanged from 3.8% in 2022. Notably, the projection is an upward revision from both the World Bank’s Global Economic Prospects - 2023 and the initial IMF Regional outlook projection of 3.6%. The upward revision of the regional growth by the IMF is mainly as a result of expected easing of inflationary pressures in line with the ongoing reduction of global inflation as the central banks around the world continue to tighten the monetary policies aimed at bringing down the inflation rate to the target ranges. However, the growth is expected to be significantly weighed down by sustained supply constraints worsened by the geopolitical tensions arising from the Russia-Ukraine invasion given that most countries in the Sub-Saharan African are net importers, adverse weather conditions that have undermined agricultural productivity, and elevated risk of debt distress in the region;
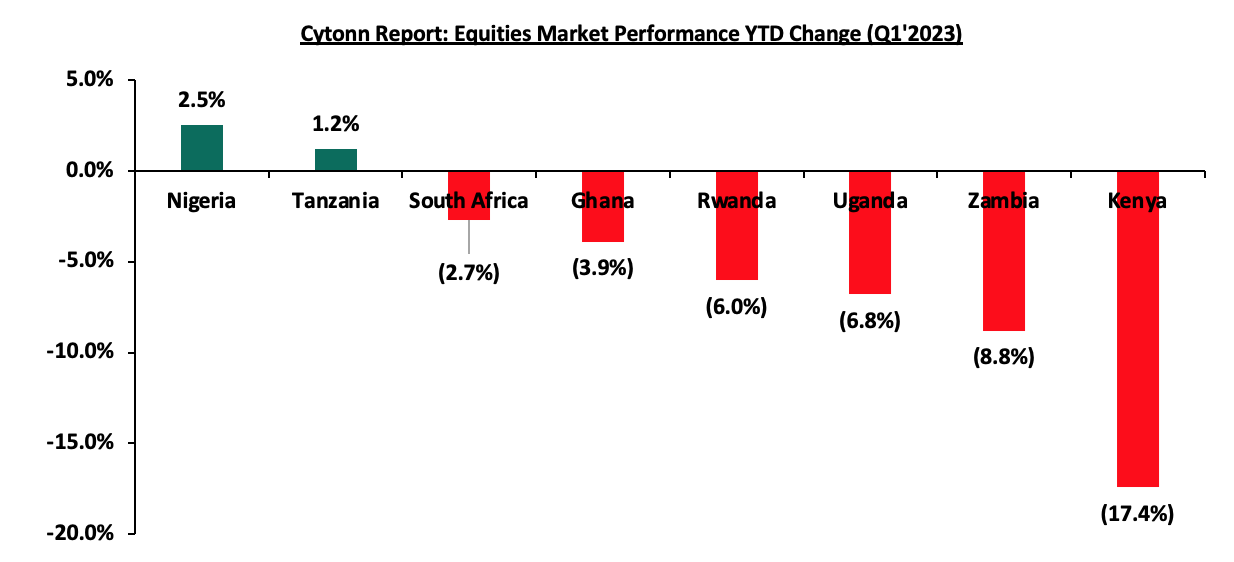
In Q1’2023, all of the selected Sub-Saharan currencies depreciated against the US Dollar, similar to the trend witnessed in FY’2022. The currency depreciation trend is attributable to the elevated inflationary pressures in region, high debt servicing costs that continue to dwindle foreign exchange reserves and monetary policy tightening by advanced economies. Additionally, Sub-Saharan Africa (SSA) stock markets recorded mixed performance in Q1’2023, with Nigeria’s stock market (NGSEASI) being the best performing market gaining by 2.5% YTD due to rallying of global fuel prices with the country being a net fuel exporter;
Kenya Macro Economic Review
The Kenyan is economy projected to grow at an average of 5.3% in 2023, 0.3% points lower than the 5.6% growth recorded in 2022, attributable to the sustained inflationary pressures, elevated global risks and erratic weather conditions. The average inflation rate increased to 9.1% in Q1’2023, compared to 5.3% in Q1’2022, attributable to increase in food and fuel prices during the period under review. The sustained inflationary pressures reflected in deterioration of general business environment in Q1’2023, with the average Purchasing Manager’s Index for the first two months of the quarter coming at 49.3, compared to 51.7 recorded in a similar period in 2022, mainly on the back of elevated commodity prices, which have resulted in reduced consumer spending. Additionally, in a bid to contain the elevated inflation rate which came at 9.2% in March 2023 similar to what was recorded in February 2023, and 1.7% points above the CBK upper ceiling of 7.5%, the Monetary Policy Committee (MPC) decided to raise the Central Bank Rate (CBR) by 75.0 bps to 9.50% in their March 2023 sitting from 8.75% in January 2023. The action to tighten the monetary policy was in line, although higher than our expectation of a 25.0 bps increase;
Fixed Income
During Q1’2023, T-bills were oversubscribed, with the overall subscription rate coming in at 135.8%, up from 108.5% in Q4’2022. Investor’s preference for the shorter 91-day paper persisted as they sought to avoid duration risk, with the paper receiving bids worth Kshs 217.8 bn against the offered Kshs 48.0 bn, translating to an oversubscription rate of 453.5%, higher than 364.9% recorded the previous quarter. Overall subscriptions for the 182-day and 364-day papers increased to 95.1% and 49.5% from 65.9% and 48.5% in Q4’2022, respectively. The yields on all the papers were on an upward trajectory with the average yields on the 364-day, 182-day and the 91-day papers increasing by 48.3 bps, 34.2 bps and 41.8 bps to 10.6%, 10.1% and 9.6%, from 10.1%, 9.7% and 9.2%, respectively, recorded in Q4’2022. The government also issued one new Treasury bond and one infrastructure bond, re-opened three bonds and offered five of them on tap sale, seeking to raise Kshs 190.0 bn. The bonds were generally undersubscribed, receiving bids worth Kshs 164.1 bn against the offered Kshs 190.0 bn, translating to a subscription rate of 86.4%;
During the week, T-bills were undersubscribed, with the overall subscription rate coming in at 34.4%, a continued decline from the 49.2% recorded the previous week, attributable to persistent tightened liquidity in the money market evidenced with the average interbank rate increasing to 7.6% from 7.2% recorded the previous week. Investor’s preference for the shorter 91-day paper persisted as they sought to avoid duration risk, with the paper receiving bids worth Kshs 2.9 bn against the offered Kshs 4.0 bn, translating to an undersubscription rate of 72.6%, significantly lower than the 179.4% recorded the previous week. Notably, the 182-day and 364-day papers recorded undersubscriptions of 35.5% and 18.1% from an undersubscription rate of 87.7% and 43.7%, respectively, recorded the previous week. The government accepted bids worth Kshs 8.0 bn and rejected Kshs 0.3 bn out of the total Kshs 8.3 bn bids received, translating to an acceptance rate of 97.2%. The yields on the government papers were on an upward trajectory, with the yields on the 364-day paper, 182-day and 91-day papers increasing by 1.3 bps, 5.5 bps and 7.8 bps to 10.8%, 10.4% and 9.9%, respectively;
Equities
During Q1’2023, the equities market was on a downward trajectory, with NASI, NSE 20 and NSE 25 declining by 11.5%, 3.2% and 5.4%, respectively. The equities market performance during the quarter was driven by losses recorded by large caps such as Safaricom, Bamburi, KCB Group, and NCBA Group of 25.1%, 11.0%, 6.8% and 6.7%, respectively. The losses were however mitigated by gains recorded by banking stocks such as Standard Chartered Bank (SCBK), Co-operative Bank, ABSA Bank and NCBA Group of 19.1%, 6.9%, 4.1% and 2.5%, respectively;
During the first quarter of 2023, listed banks in Kenya released their FY’2022 results, recording an increase in their earnings growth, with their average core Earnings per share (EPS) recording a weighted average growth of 26.5%, compared to a weighted average growth of 83.2% in FY’2021. The performance is however largely skewed by the strong EPS growth from HF Group, Diamond Trust Bank of Kenya and NCBA Group of 138.9%, 53.9% and 34.8%, respectively;
Real Estate
In Q1’2023, Kenya’s Real Estate sector recorded notable growth in terms of activity compared to the similar period in 2022, attributable to continued growth of the Kenyan economy enabling increased Real Estate property transactions. In the Nairobi Metropolitan Area (NMA), the residential sector recorded improved performance with a 0.4% points y/y increase in average total returns to 6.1% from the 5.7% recorded in Q1’2022. The commercial office sector recorded average rental yields of 7.6% in Q1’2023, representing a 0.3% points y/y increase from 7.3% recorded in Q1’2022. The retail sector recorded average rental yields of 8.0% in Q1’2023, representing a 0.1% points y/y increase from 7.9% recorded in Q1’2022. The land sector recorded an average annualized capital appreciation of 5.7% in Q1’2023, with un-serviced land prices in satellite towns realizing the highest capital appreciation at 14.2% y/y;
Investment Updates:
- Weekly Rates:
- Cytonn Money Market Fund closed the week at a yield of 11.10%. To invest, dial *809# or download the Cytonn App from Google Playstore here or from the Appstore here;
- Cytonn High Yield Fund closed the week at a yield of 13.92% p.a. To invest, email us at sales@cytonn.com and to withdraw the interest, dial *809# or download the Cytonn App from Google Playstore here or from the Appstore here;
- We continue to offer Wealth Management Training every Wednesday and every third Saturday of the month, from 9:00 am to 11:00 am, through our Cytonn Foundation. The training aims to grow financial literacy among the general public. To register for any of our Wealth Management Trainings, click here;
- If interested in our Private Wealth Management Training for your employees or investment group, please get in touch with us through wmt@cytonn.com;
- Cytonn Insurance Agency acts as an intermediary for those looking to secure their assets and loved ones’ future through insurance namely; Motor, Medical, Life, Property, WIBA, Credit and Fire and Burglary insurance covers. For assistance, get in touch with us through insuranceagency@cytonn.com;
- Cytonn Asset Managers Limited (CAML) continues to offer pension products to meet the needs of both individual clients who want to save for their retirement during their working years and Institutional clients that want to contribute on behalf of their employees to help them build their retirement pot. To more about our pension schemes, kindly get in touch with us through pensions@cytonn.com;
Real Estate Updates:
- For an exclusive tour of Cytonn’s real estate developments, visit: Sharp Investor's Tour, and for more information, email us at sales@cytonn.com;
- Phase 3 of The Alma is now ready for occupation and the show house is open daily. To join the waiting list to rent, please email properties@cytonn.com;
- For Third Party Real Estate Consultancy Services, email us at rdo@cytonn.com;
- For recent news about the group, see our news section here;
Hospitality Updates:
- We currently have promotions for Staycations. Visit cysuites.com/offers for details or email us at sales@cysuites.com;
Global Economic Growth:
According to the January 2023 World Economic Outlook Report by the International Monetary Fund (IMF), the global economy is projected to grow at a rate of 2.9% in 2023, 0.5% points slower than the growth of 3.4% recorded in 2022. The latest projection is 0.2% points higher than the IMF’s earlier projection of 2.7% growth, with the upward revision being on the back of full reopening of China coupled with expected easing of global inflation as the Central Banks around the world continue to tighten their monetary policies. Notably, advanced economies are expected to record a 1.2% growth in 2023, which is a significant decline from the 2.7% expansion recorded in 2022. However, the emerging markets and developing economies are projected to expand by 4.0% in 2023, marginally upwards from an estimated growth of 3.9% in 2022.
The expected slowed down in global economic growth in 2023 as compared to 2022 is majorly attributable to;
- The elevated global inflationary pressures which have necessitated hiking of interest rates by central banks around the world with the aim of anchoring inflation. As such, the global inflation is forecasted to ease slightly to 6.6% in 2023, from 8.8% in 2022,
- Persistent supply chain constraints worsened by the ongoing Russia-Ukraine conflict which have led to increase in global fuel and energy prices. Consequently, the high energy prices have increased inflationary pressures as well as contributed to currency depreciation as dollar demand increases in majority of the world economies, and,
- Tight global financial conditions occasioned by high cost of borrowing which have increased risks of debt distress in emerging economies as most advanced economies continue to tighten their monetary policies.
The global economy is expected to remain subdued in the short term mainly as a result of persistent inflationary pressures as well as tightening of monetary policies which are expected to curtail economic growth.
Global Commodities Market Performance:
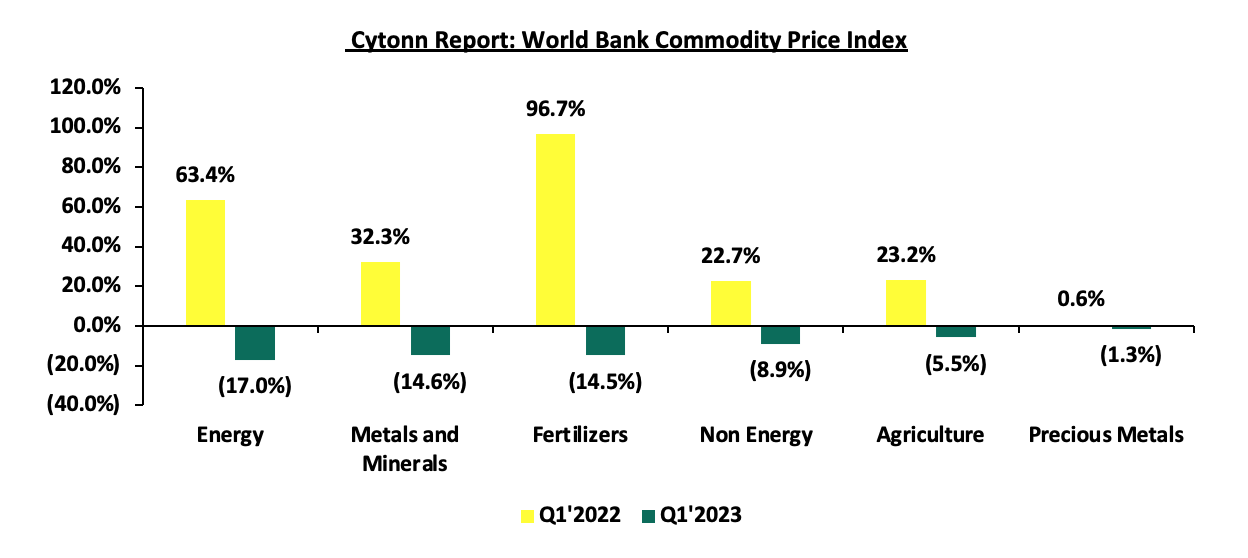
Global commodity prices were on a downward trajectory in Q1’2023, with prices of energy declining the most, by 17.0% compared to the 63.4% increase recorded in Q1’2022, mainly as a result of weaker global demand. Similarly, prices of metals and minerals, fertilizers, Non-energy, Agriculture and Precious metals declined by 14.6%, 14.5%, 8.9%, 5.5% and 1.3%, respectively, on the back of reduced global demand coupled with easing supply chain constraints. Below is a summary performance of various commodities;
Source: World Bank
Global Equities market performance:
Global stock market recorded mixed performance in Q1’2023, with most indices in developing economies declining attributable to capital flights following interest rate hikes in advanced economies aimed at curbing the inflationary pressures. Consequently, investors have resorted to place their investments in less risky markets such as government papers and other investments alternatives. On the other hand, most indices in the developed countries recorded gains during the quarter largely attributable to increased investor sentiments as a results of continued economic recovery following full reopening of the economies coupled with investor preference of the stock markets in the developed countries. Notably, FTSE Euro 300 recorded the largest gain at 9.7% in Q1’2023 driven by gains recorded by blue- chip financial companies as the European Central Bank continue to hike the central bank rates which has increased investor sentiments on financial stocks. NASI was the largest decliner recording losses of 17.4%, mainly due to capital flight as investors foreign investors sold off their investments in the Kenyan equities market. Additionally, investors have continued to attached a higher risk premium to the country as a result of deteriorated business environment as evidenced by average Purchasing Managers Index (PMI) of 49.0 in the first two months of 2023, with February’s PMI coming in at 46.6, mainly attributable to the high inflation at 9.2% as of March 2022 and continued weakening of the Kenyan Shilling which has depreciated by 7.2% on year to date basis in 2023. Below is a summary of the performance of key indices:
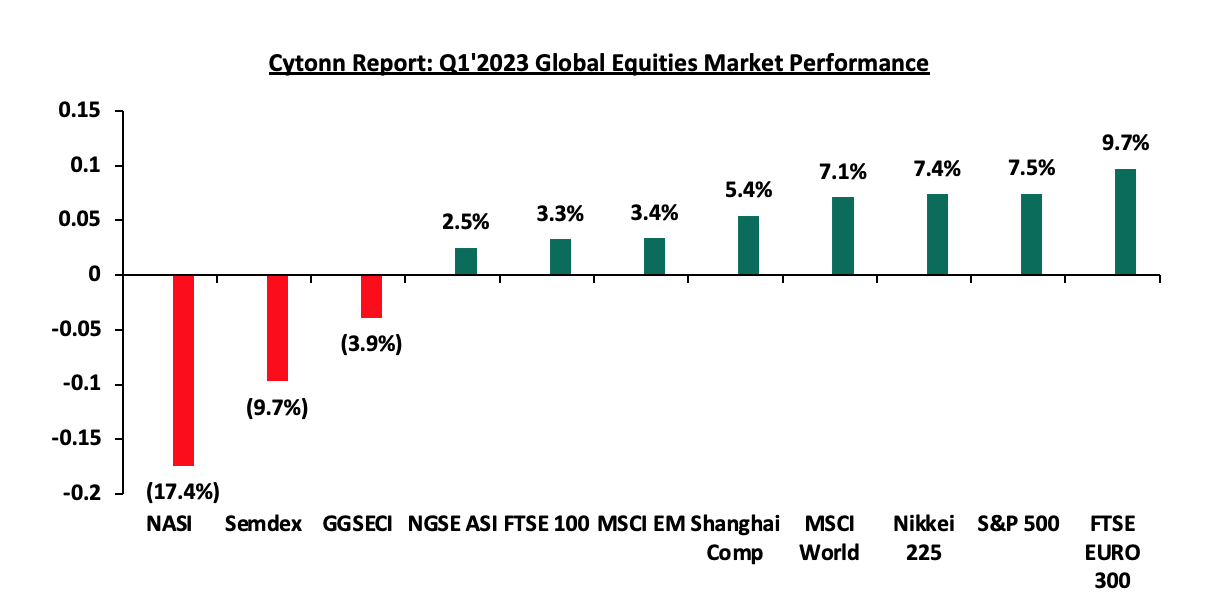
*Dollarized performance
According to the International Monetary Fund (IMF), the Sub Saharan economy is projected to grow at a moderate rate of 3.8% in 2023, unchanged from the estimated economic growth of 3.8% in 2022. Notably, the projection is an upward revision from both the World Bank’s Global Economic Prospects - 2023 and the initial IMF Regional outlook projection of 3.6%. The upward revision of the regional growth by the IMF is mainly as a result of expected easing of inflationary pressures in line with the ongoing reduction of global inflation as the central banks around the world continue to tighten the monetary policies aimed at bringing down the inflation rate to the target ranges. However, the growth is expected to be significantly weighed down by sustained supply constraints worsened by the geopolitical tensions arising from the Russia-Ukraine invasion given that most countries in the Sub-Saharan African are net importers, adverse weather conditions that have undermined agricultural productivity, and elevated risk of debt distress in the region;
Currency Performance
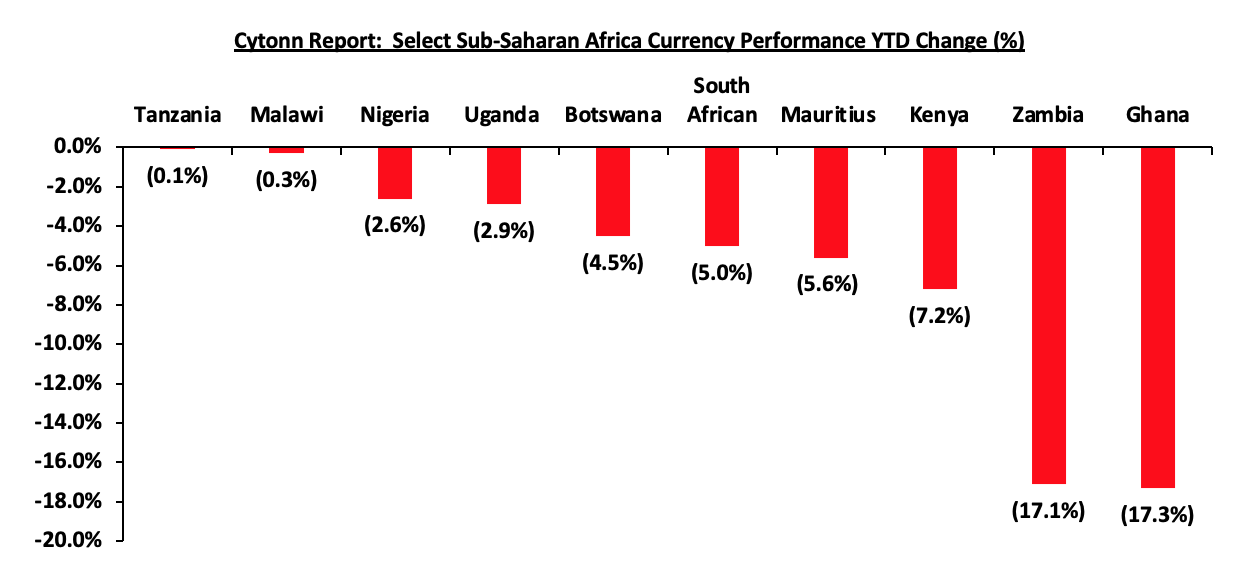
In Q1’2023, all of the select Sub-Saharan currencies depreciated against the US Dollar, similar to the trend witnessed in FY’2022. The depreciation trend is attributable to the elevated inflationary pressures in region, high debt servicing costs that continue to dwindle foreign exchange reserves and monetary policy tightening by advanced economies such as the United States Federal reserve and the European Central Bank. For instance, in March 2023, the USA increased its interest rate by 25.0 bps to the rage of 4.75%-5.00% from 4.50% -4.75%. Similarly, in March 2023, the European Central Bank increased its benchmark rate by 50.0 bps to 3.50%, from 3.00%. The high interest rates in developed countries has led to massive capital outflows as investors both institutional and individual seek to take advantage of the higher returns offered in developed economies. Further, the elevated inflationary pressures in most economies in the region puts pressure on the value of local currencies due to expensive importation. Below is a table showing the performance of select African currencies against the US Dollar:
|
Cytonn Report: Select Sub Saharan Africa Currency Performance vs USD |
|||||
|
Currency |
Mar-22 |
Jan-23 |
Mar-23 |
Last 12 Months change (%) |
YTD change (%) |
|
Tanzanian Shilling |
2320.0 |
2,332.0 |
2,334.0 |
(0.6%) |
(0.1%) |
|
Malawian Kwacha |
802.0 |
1,009.0 |
1,012.1 |
(26.2%) |
(0.3%) |
|
Nigerian Naira |
415.3 |
447.6 |
459.0 |
(10.5%) |
(2.6%) |
|
Ugandan Shilling |
3553.5 |
3,678.1 |
3,785.1 |
(6.5%) |
(2.9%) |
|
Botswana Pula |
11.3 |
12.6 |
13.2 |
(16.8%) |
(4.5%) |
|
South African Rand |
14.5 |
16.9 |
17.7 |
(22.5%) |
(5.0%) |
|
Mauritius Rupee |
43.4 |
43.0 |
45.4 |
(4.6%) |
(5.6%) |
|
Kenyan Shilling |
115.0 |
123.4 |
132.3 |
(15.1%) |
(7.2%) |
|
Zambian Kwacha |
19.9 |
18.1 |
21.2 |
(6.1%) |
(17.1%) |
|
Ghanaian Cedi |
7.3 |
9.8 |
11.5 |
(57.5%) |
(17.3%) |
Source: Yahoo Finance
Key take outs from the table include:
- The Ghanaian Cedi was the worst performing currency in Q1’2023 and the largest decliner over the last twelve months, depreciating by 17.3% and 57.5%, respectively, mainly as result a deteriorated macro-economic environment driven by the high debt unsustainability concerns, with the total public debt to GDP as of March 2023 coming in at 93.5%, similar to what was recorded in November 2022. Additionally, the country’s currency performance has been weighed down by the elevated inflationary pressures with February 2023 inflation coming in at 52.8%, way above the Ghana Central Bank target rate of 8.0% - 10.0%, and,
- The Kenya Shilling depreciated by 7.2% in Q1’2023 to close at Kshs 132.3 against the US Dollar, compared to Kshs 123.4 recorded at the beginning of the year, driven by increased dollar demand from importers, especially oil and energy sectors against a slower supply of hard currency. Additionally, the declining foreign reserves has continued to weigh down on the value of the shilling, with foreign exchange reserves currently standing at USD 6.4 as at 31 March 2023, equivalent to 3.6 months of import cover and below the statutory requirement of maintaining at least 4.0 months of import.
The chart below shows the year to date performance of different sub-Saharan African countries in Q1’2023;
African Eurobonds
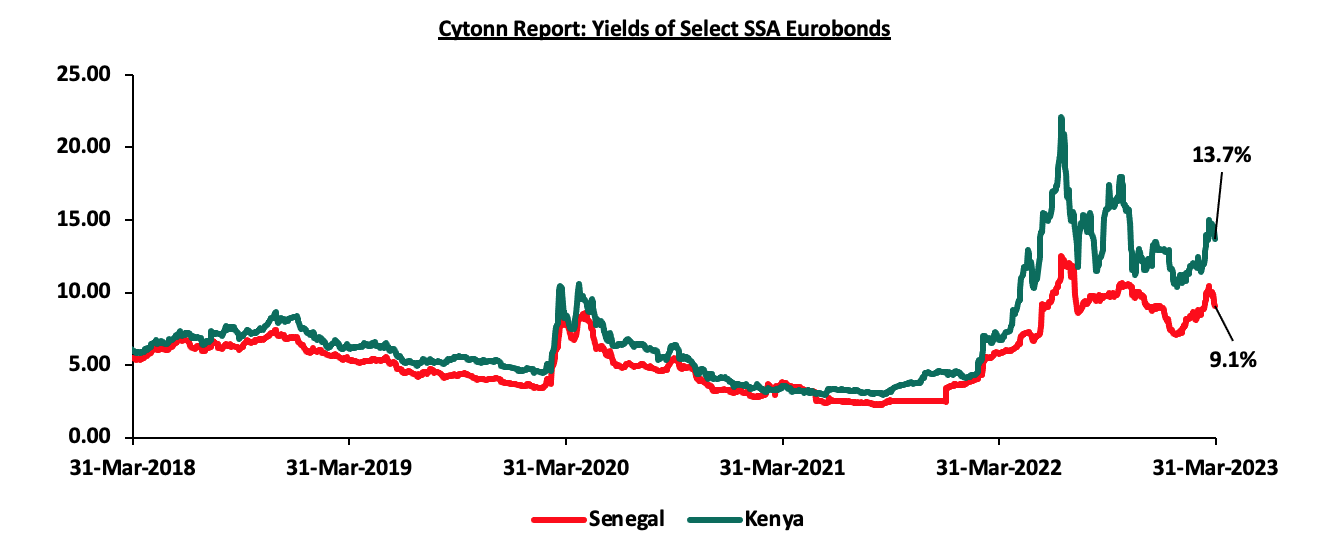
Africa’s appetite for foreign-denominated debt has continued to decline in recent times with no issuer during Q1’2023, with most countries shying away from the Eurobonds market due to sustained high yields and tough macroeconomic conditions. The significant increase in yields was partly attributable to investors attaching higher risk premium on Sub-Saharan Countries, driven by the region’s elevated inflationary pressures, public debt distress and continued depreciation of local currencies. Yields on the Kenyan and Senegal Eurobonds increased by 0.8% points and 1.1% points in Q1’2023 to 13.7% and 9.1%, from 12.9% and 8.9%, respectively, recorded at the end of December 2022. Below is a 5-year graph showing the Eurobond secondary market performance of select 10-year Eurobonds issued by the respective countries:
Equities Market Performance
Sub-Saharan Africa (SSA) stock markets recorded mixed performance in Q1’2023, with Nigeria’s stock market (NGSEASI) being the best performing market gaining by 2.5% YTD driven by the high global fuel prices with the country being a net fuel exporter. Kenya’s NASI was the worst performing stock market, declining by 17.4% at the end of Q1’2023, mainly attributable increased capital flight with investors chasing higher returns from advanced economies following hiking of interest rates as well as deterioration in investor confidence in country on the back of macroeconomic uncertainties occasioned by the high inflation at 9.2% as of March 2022 and continued weakening of the Kenyan Shilling which has depreciated by 7.2% on year to date basis in 2023. Below is a summary of the performance of key indices:
|
Cytonn Report: Equities Market Performance Q1’2023 (Dollarized*) |
||||||
|
Country |
Index |
Mar-22 |
Jan-23 |
Mar-23 |
Last 12 Months change (%) |
YTD change (%) |
|
Nigerian |
NGSEASI |
113.00 |
115.3 |
118.2 |
4.6% |
2.5% |
|
Tanzanian |
DARSDEI |
1.5 |
1.7 |
1.8 |
17.9% |
1.2% |
|
South Africa |
JALSH |
5160.0 |
4,408.4 |
4,289.8 |
(16.9%) |
(2.7%) |
|
Ghana |
GGSECI |
375.6 |
245.2 |
238.7 |
(36.4%) |
(3.9%) |
|
Rwanda |
RSEASI |
0.1 |
0.1 |
0.1 |
29.2% |
(6.0%) |
|
Uganda |
USEASI |
0.4 |
0.33 |
0.3 |
(24.0%) |
(6.8%) |
|
Zambia |
LASILZ |
377.2 |
406.2 |
370.6 |
(1.8%) |
(8.8%) |
|
Kenya |
NASI |
1.5 |
1.03 |
0.9 |
(41.2%) |
(17.4%) |
|
*The index values are dollarized for ease of comparison |
||||||
Source: Cytonn Research, Kwayisi, Yahoo Finance
The chart below shows the YTD Performance of the sub-Saharan Equities Market;
GDP growth in Sub-Saharan Africa region is expected to record moderate growth, in line with the rest of the global economy. Additionally, public debt continues to be a major headwind, with high debt levels experienced in the region on the back of continued weakening of local currencies, which will make debt servicing costlier, making the region less attractive to foreign capital.
The Kenyan is economy projected to grow at an average of 5.3% in 2023, 0.3% points lower than the 5.6% growth recorded in 2022, attributable to the sustained inflationary pressures, elevated global risks and erratic weather conditions. The table below shows the projections according to various organizations:
|
Cytonn Report: Kenya 2023 growth Projections |
||
|
No. |
Organization |
2023 GDP Projections |
|
1 |
International Monetary Fund |
5.1% |
|
2 |
National Treasury |
6.1% |
|
3 |
World Bank |
5.0% |
|
4 |
Fitch Solutions |
5.1% |
|
5 |
Cytonn Investments Management PLC |
5.0% |
|
Average |
5.3% |
|
Source: Cytonn Research
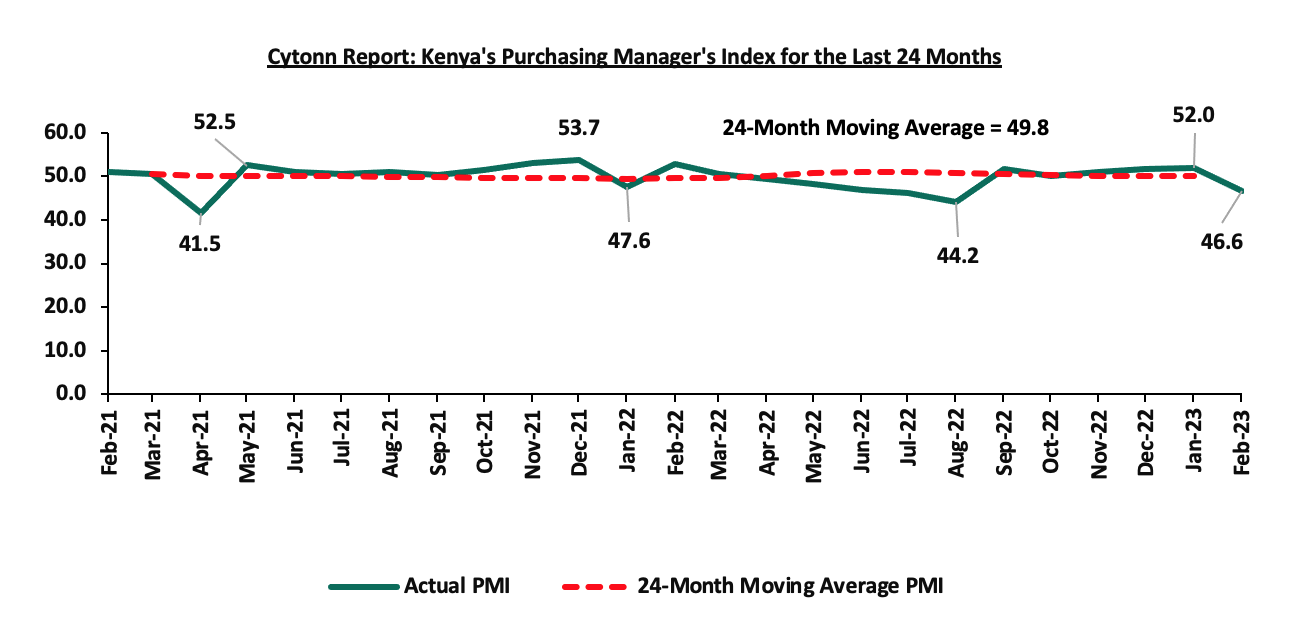
Key to note, Kenya’s general business environment deteriorated in Q1’2023, with the average Purchasing Manager’s Index for the first two months of the quarter coming at 49.3, compared to 51.7 recorded in a similar period in 2022, mainly on the back of elevated commodity prices, which have seen consumers cut back on spending. Additionally, during the quarter, S&P Global Ratings downgraded Kenya’s outlook to negative from stable, signaling increased risks of defaults in debt repayments amid weakening liquidity position aggravated by dwindling foreign exchange reserves as well as high debt servicing obligations in the next fiscal year. The chart below summarizes the evolution of PMI over the last 24 months. (A reading above 50.0 signal an improvement in business conditions, while readings below 50.0 indicate a deterioration):
Inflation:
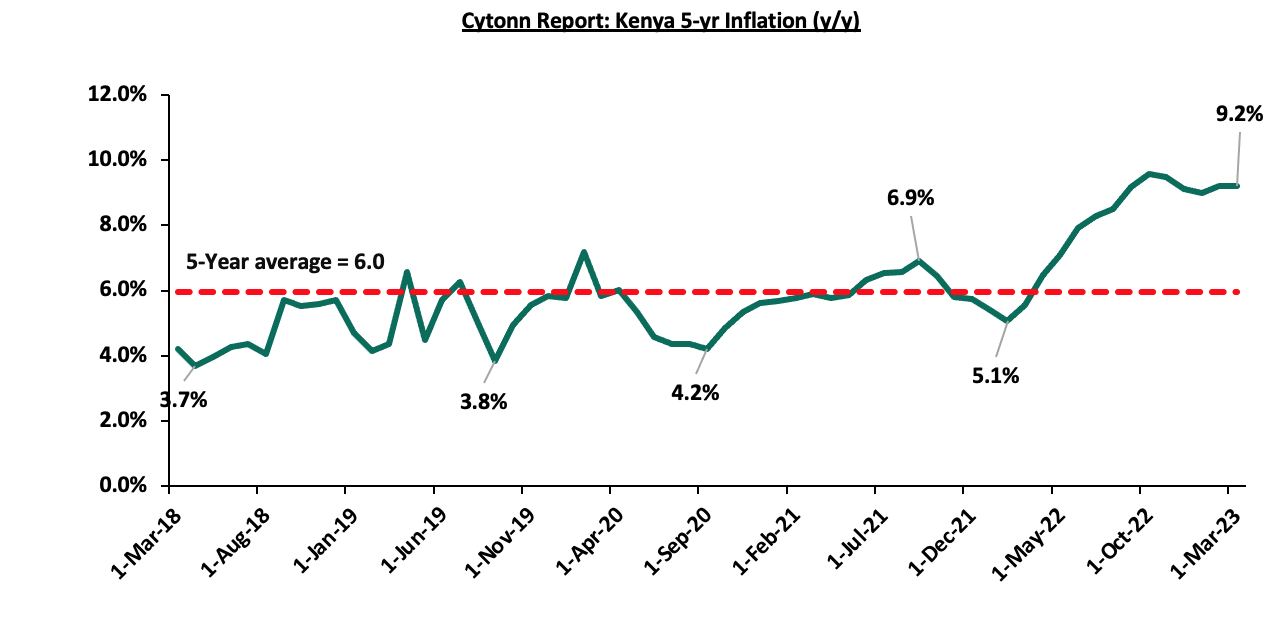
The average inflation rate increased to 9.1% in Q1’2023, significantly higher than the 5.3% in Q1’2022, mainly attributable to the elevated food and fuel prices in the period under review. Notably, the prices of super petrol increased by Kshs 2.0 in March 2023, to Kshs 179.3 per litre representing a 1.1% year-to-date increase, while diesel and kerosene remained unchanged at Kshs 162.0 and Kshs 149.5 per litres from what was recorded at the beginning of the year. Below is the chart showing the inflation trend for the last five years:
March 2023 Inflation
The year on year inflation rate in the month of March 2023 remained constant at 9.2%, from what was recorded in the month of February 2023, while the monthly inflation rate for March 2023 was 0.8%. It was against our expectation of an ease within a range of 8.6%-9.0%. The headline inflation was largely driven by increase in prices of commodities in the following categories, food and non-alcoholic beverages; housing, water, electricity, gas and other fuels; and transport. The table below shows a summary of both the year on year and month on month commodity indices performance:
|
Cytonn Report: Major Inflation Changes – March 2023 |
|||
|
Broad Commodity Group |
Price change m/m (February-2023/March-2023) |
Price change y/y (Mach-2022/March-2023) |
Reason |
|
Food and Non-Alcoholic Beverages |
1.6% |
13.4% |
The m/m increase was mainly driven by increase in price commodities such as cabbages, carrots, potatoes, kales, and fortified maize flour. The increase was, however, mitigated by drop in prices of commodities such onions, cooking oil and tomatoes |
|
Housing, Water, Electricity, Gas and Other Fuel |
0.6% |
7.5% |
The m/m change was mainly due to increase in prices of electricity, cooking gas and monthly house rent |
|
Transport cost |
0.3% |
12.6% |
The m/m change was mainly due to increase in prices of super petrol |
|
Overall Inflation |
0.8% |
9.2% |
The m/m was mainly driven by 1.6% increase in prices of food and non-alcoholic Beverages |
Inflationary pressures in the country remain worryingly above the Central Bank of Kenya target range of 2.5%-7.5% for a tenth consecutive month to March 2023, with commodities under food and non-alcoholic beverages being the largest contributors of inflation. The sustained inflationary pressures continue despite the monetary policy committee intervening with subsequent hikes in the Central Bank Rate, raising the CBR rate by a cumulative of 200.0 bps since July 2022 to 9.50% in March 2023. Notably, in move to combat food inflation the government through the Kenya Revenue Authority issued an exemption on duty to Kenya National Trading Corporation for importation of cooking oil, rice, beans and sugar. The state agency will sell the commodities directly to shops, reducing the long value chain that consequentially make commodities expensive. The importation of duty free commodities is also expected to increase competition among other local manufacturers and producers, forcing them to lower prices of commodities.
Going forward, we expect inflationary pressures in the country to persist in the short term due to high fuel and electricity prices following the scaling down of fuel subsidies as well as higher electricity tariffs. However, we expect food inflationary pressures to ease in the medium term following the expected long rains in the coming months. Furthermore, we are of the view that the eventual slowdown in inflationary pressures is largely pegged on how quickly the elevated global inflationary pressure ease.
The Kenyan Shilling:
The Kenyan Shilling depreciated against the US Dollar by 7.3% in Q1’2023, to close at Kshs 132.3, from Kshs 123.4 at the end of 2022, partly attributable to increased dollar demand in the energy, oil and manufacturing sectors. Key to note, this is the lowest the Kenyan shilling has traded against the dollar. During the week, the Kenya Shilling depreciated against the US Dollar by 0.8% to close at 132.3 from 131.3 the previous week. We expect the shilling to remain under pressure in 2023 because of:
- High global crude oil prices on the back of persistent supply chain bottlenecks coupled with high demand. The high crude oil prices have inflated Kenya’s import bill and as a result, petroleum products imports have continued to weigh heavily on the country’s import bill, and accounted for 27.6% of the total import bill in Q3’2022, up from 25.6% in Q2’2022 and much higher than 15.2% recorded in Q3’2021,
- An ever-present current account deficit projected at 5.4% of GDP in 2023 from the estimate of 4.9% of GDP in 2022,
- The need for Government debt servicing which continues to put pressure on forex reserves given that 69.3% of Kenya’s External debt was US Dollar denominated as of October 2022, and,
- A continued interest rate hikes in the USA and the Euro Area with the Fed and European Central Bank increasing their benchmark rates to 4.75%-5.00% and 3.50% respectively in March 2023, which has strengthened the dollar and sterling pound against other currencies following capital outflows from other global emerging markets.
However, the shilling is expected to be supported by:
- Diaspora remittances standing at a cumulative USD 658.6 mn in 2023 as of February 2023, albeit 0.3% lower than the USD 660.3 mn recorded over the same period in 2022, and,
- The tourism inflow receipts that came in at USD 268.1 bn in 2022, a significant 82.9% increase from USD 146.5 bn inflow receipts recorded in 2021.
Monetary Policy:
The Monetary Policy Committee (MPC) met on March 29th, 2023 to review the outcome of its previous policy decisions and recent economic developments, and to decide the direction of the Central Bank Rates (CBR). Notably, the MPC decided to raise the Central Bank Rate (CBR) by 75.0 bps to 9.50% from 8.75% in their January2023 sitting, in a bid to contain the elevated inflation rate, which came at 9.2% in March 2023, similar to what was recorded in February 2023, and 1.7% points above the CBK ceiling of 7.5%. The action to tighten the monetary policy was in line, although higher than our expectation of a 25.0 bps increase. Below are some of the key highlights from the meeting:
- Overall Inflation increased to 9.2% in February 2023 from 9.0% in January 2023 on the back of high food prices in the country. Food inflation rose to 13.3 percent in February from 12.8 percent in January, mainly due to increases in the prices of vegetables, attributed to erratic weather conditions witnessed in the period. Additionally, fuel inflation remained elevated at 13.8% in February 2023 attributable to scaling down of the fuel subsidy and high electricity prices due to higher tariffs. The MPC projected the inflation to remain elevated in the near term partly attributed to increases in electricity prices. However, the anticipated long rains are expected to moderate food inflation in the medium to long term,
- The MPC noted that leading economic indicators pointed to a strong performance of the Kenyan economy in the Q1’2023, reflecting robust activity in services sector particularly wholesale and retail trade, accommodation and food services among others. The economy is expected to remain resilient in 2023 supported by continued strong performance of the services sector and expected recovery in agriculture sector,
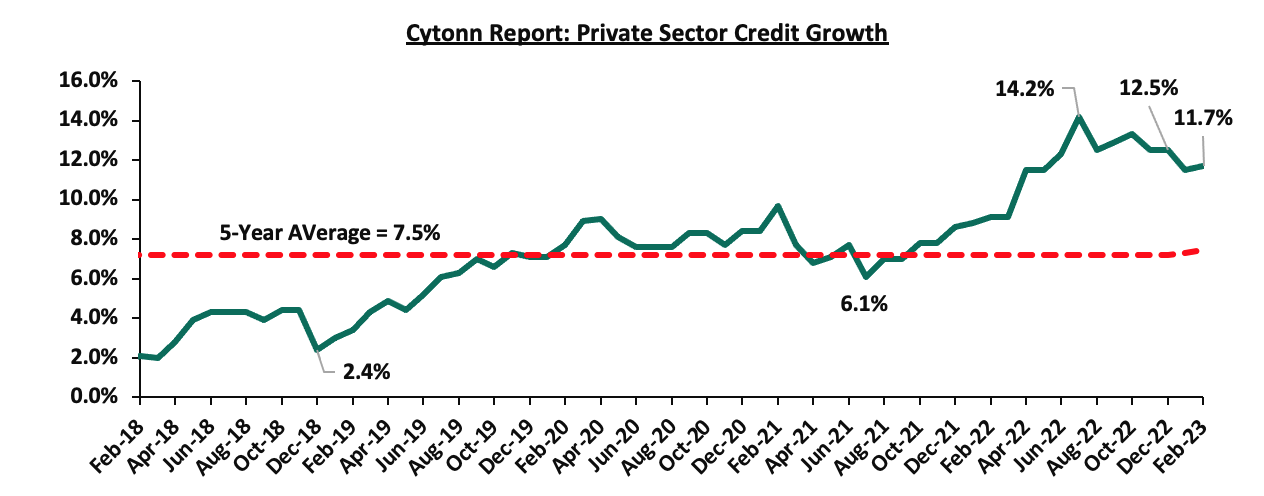
- Private sector credit growth stood at 11.7% in February 2023 compared to 12.7% in December 2022. Key sectors that recorded strong credit growth were transport and communication, manufacturing, consumer durables, and trade of 16.5%, 15.2%, 12.4%, and 11.8%. Consequentially, the number of loan application and approval declined reflecting, reduced demand. The chart below shows the movement of the private sector credit growth of the last five years.
Source: Central Bank of Kenya
- Goods exports remained strong having grown by 11.0% in the 12 months to February 2023 compared to 12.1% recorded in a similar period in 2022. Notably, receipts from tea and manufacturing goods exports increased by 13.4% and 27.2%, respectively during the period. The increase in receipts from tea exports is attributed to improved prices due to increased demand from traditional markets. In addition, imports grew by 2.1% in the 12 months to February 2023 compared to 27.3% growth recorded in a similar period in 2022, on the back of lower imports of infrastructure related equipment due to completion of major projects. Remittances stood at USD 4.0 bn in 12 months to February 2023, 4.9% higher than USD 3.8 bn recorded in a similar period in 2022. The current account deficit is projected at 5.4% of GDP in 2023 from the estimate of 4.9% of GDP in 2022, and,
- The banking sector remains resilient, stable, with strong liquidity, and capital adequacy ratios, despite the deterioration in asset quality. The gross non-performing loans to gross loans ratio increased to 14.0% in February 2023, compared to 13.3% in December 2022. The increase in non-performing loans was noted in sectors such as trade, personal and household, manufacturing and building and construction. However, banks have continued to make adequate provisioning for the NPLs.
The MPC concluded that following the sustained inflationary pressures, the elevated global risks and their potential impact on the domestic economy, there was a need for further tightening of the monetary policy in order to anchor inflation within its target range of 2.5% to 7.5%. Going forward, we expect the inflationary pressures to endure in the short term mainly on the back of elevated fuel prices following the scaling down of fuel subsidies coupled with high electricity prices due to higher tariffs. Additionally, we expect inflationary pressures to persistent as a result of sustained depreciation of the Kenya shilling against the US dollar which continues to inflate the cost of importation and production, forcing manufacturers to transfer the cost to consumers through hike in prices. The Committee will meet again in May 2023, but will closely monitor the impact of the policy measures and remains ready to re-convene earlier if necessary.
Q1’2023 Highlights:
- Stanbic Bank released its monthly Purchasing Manager’s Index (PMI), highlighting that the index for the month of December picked up to a three-month high of 51.6, from 50.9 in November 2022, pointing towards a sustained improvement in the business environment for a fourth consecutive month. The rebound in business activity in the country was linked to factors such as increase in demand, favourable weather conditions and softer price pressures as firms saw input costs increase at the slowest rate in 12 months. For more information, please see our Cytonn Weekly #01/2023,
- The National Treasury gazetted the revenue and net expenditures for the first half of FY’2022/2023, ending 30th December 2022, highlighting that the total revenue collected as at the end of December 2022 amounted to Kshs 987.9 bn, equivalent to 92.3% of the prorated estimates of Kshs 1070.8 bn. For more information, please see our Cytonn Weekly #02/2023,
- The Energy and Petroleum Regulatory Authority (EPRA) released their monthly statement on the maximum retail fuel prices in Kenya effective 15th January 2023 to 14th February 2023. Notably, fuel prices remained unchanged for the second consecutive month at Kshs 177.3, Kshs 162.0 and Kshs 145.9 per litres of Super Petrol, Diesel and Kerosene, respectively. For more information, please see our Cytonn Weekly #02/2023,
- The Kenya Revenue Authority released the draft regulations for the Excise Duty (Excisable Goods Management Systems)(Amendment) Regulations, 2023 having reviewed the previous Excise Duty (Excisable Goods Management Systems)(Amendment) Regulations, 2017, under the Excise Duty Act No. 23 of 2015, seeking to increase the stamp duty fees on various commodities. For more information, please see our Cytonn Weekly #03/2023, and,
- The National Treasury released the Draft 2023 Budget Policy Statement, projecting a 59.2% increase in tax revenue in the medium term to Kshs 4.0 tn by the end of FY’2026/27 from the Kshs 2.5 tn original FY’2022/23 budget estimates. For more information, please see our Cytonn Weekly #03/2023,
- The y/y inflation in January 2023 came at 9.0%, marginally easing from the 9.1% recorded in December 2022. This was against our expectations of an increase within a range of 9.2%-9.6%, driven by an expected increase in the Housing, water Electricity, Gas and other fuel index following the increase in electricity prices. For more information, please see our January 2023 Cytonn Monthly,
- The Monetary Policy Committee (MPC) met on January 30th, 2023 to review the outcome of its previous policy decisions and recent economic developments, and to decide on the direction of the Central Bank Rate (CBR). The MPC retained the CBR rate at 8.75%, which was against our expectation of a 25.0 bps increase to 9.0%. For more information, please see our January 2023 Cytonn Monthly,
- Stanbic bank released its monthly Purchasing Managers Index (PMI), highlighting that the index for the month of January 2023 came in at 52.0, up from 51.6 recorded in December 2022, pointing towards a sustained improvement in the business environment for a fifth consecutive month. The improvement was largely attributable to rising demand levels, as well as improved operating conditions which boosted business confidence. For more information, please see our January 2023 Cytonn Monthly,
- The National Treasury presented the Supplementary Budget for FY’2022/23 to the National Assembly, seeking to slightly increase the gross total budget by 0.4% to Kshs 3,373.3 bn, from the previous estimates of Kshs 3,358.6 bn. Mainly due to an increase in the recurrent expenditure by 6.6% to Kshs 1,496.9 bn in the Supplementary estimates from Kshs 1,403.9 bn in the Original estimates. On the other hand, Development expenditure was set to reduce by 14.9% to Kshs 609.1 bn in the supplementary estimates from Kshs 715.4 bn in the original estimates. For more information, please see our Cytonn weekly #06/2023,
- The National Treasury gazetted the revenue and net expenditures for the seven months of FY’2022/2023, ending 31th January 2023. In addition, the National Treasury released the Final 2023 Budget Policy Statement, which was the first to be prepared under the new administration. This follows the release of the Draft of the 2023 Budget Policy Statement in January 2023. The policy statement stipulates the administration priority programs, policies and reforms to be implemented in the Medium-Term Expenditure Framework (MTEF). For more information, please see our Cytonn weekly #07/2023, and,
- The Energy and Petroleum Regulatory Authority (EPRA) released their monthly statement on the maximum retail fuel prices in Kenya effective 15th February 2023 to 14th March 2023. Notably, fuel prices remained unchanged for the third consecutive month at Kshs 177.3, Kshs 162.0 and Kshs 145.9 per litres of Super Petrol, Diesel and Kerosene, respectively. For more information, please see our Cytonn weekly #07/2023,
- S&P Global Ratings downgraded Kenya’s outlook to negative from stable, signaling increased risks of defaults in debt repayments amid weakening liquidity position aggravated by sustained decline in foreign exchange reserves as well as high debt servicing obligations in the next fiscal year. Furthermore, the recent undersubscription of domestic bond issuances, as well as constrained access to international capital markets, have heightened Kenya’s medium term fiscal and external refinancing risks. For more information, please see our February 2023 Cytonn Monthly,
- The Kenya National Bureau of Statistics (KNBS) released the y/y inflation for February 2023, which came in at 9.2%, up from the 9.0% recorded in January 2023. This was in contrast to our expectations of an ease within a range of 8.6%-9.0%. For more information, please see our February 2023 Cytonn Monthly,
- Stanbic Bank Kenya released its monthly Purchasing Managers Index (PMI), highlighting that the index for the month of February 2023 came at 46.6, down from an 11-month high of 52.0 recorded in January 2023. This is the first time in six months that the index has registered below the 50.0 no change threshold, pointing towards a solid deterioration in operating conditions. For more information, please see our February 2023 Cytonn Monthly,
- The National Treasury gazetted the revenue and net expenditures for the eight months of FY’2022/2023, ending 28th February 2023. For more information, please see our Cytonn weekly #11/2023,
- The Energy and Petroleum Regulatory Authority (EPRA) released their monthly statement on the maximum retail fuel prices in Kenya effective 15th March 2023 to 14th April 2023. Notably, prices of Super Petrol increased by Kshs 2.0 per litre to Kshs 179.3, while prices of Diesel and Kerosene remained unchanged for the fourth consecutive month at Kshs 162.0 and Kshs 145.9 per litres, respectively. For more information, please see our Cytonn weekly #11/2023, and,
- The Central Bank of Kenya announced the issuance of the Foreign Exchange Code (the FX Code) on 22nd March 2023 to commercial banks, in a move to regulate wholesale transactions of the foreign exchange market in Kenya.
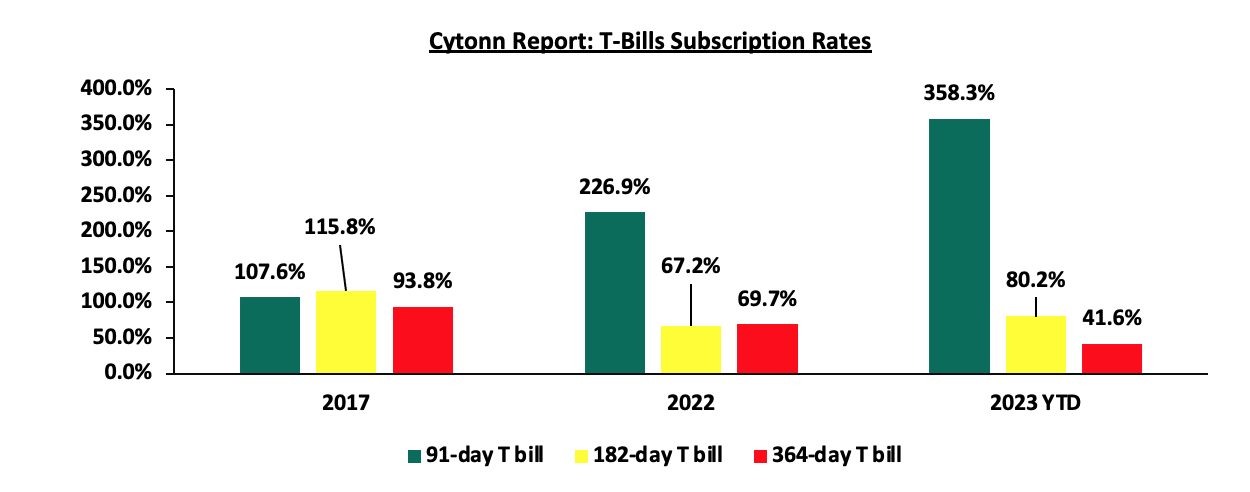
During Q1’2023, T-bills were oversubscribed, with the overall subscription rate coming in at 135.8%, up from 108.5% in Q4’2022. Investor’s preference for the shorter 91-day paper persisted as they sought to avoid duration risk, with the paper receiving bids worth Kshs 217.8 bn against the offered of Kshs 48.0 bn, translating to an oversubscription rate of 453.5%, higher than 364.9% recorded the previous quarter. Overall subscriptions for the 182-day and 364-day papers increased to 95.1% and 49.5% from 65.9% and 48.5% in Q4’2022, respectively. The yields on all the papers were on an upward trajectory with the average yields on the 364-day, 182-day and the 91-day papers increasing by 48.3 bps, 34.2 bps and 41.8 bps to 10.6%, 10.1% and 9.6%, from 10.1%, 9.7% and 9.2%, respectively, recorded in Q4’2022. The upward trajectory in the yields is mainly on the back of investors attaching higher risks with high inflation, currency depreciation and tight liquidity position hence the need to demand higher returns to cushion against the possible loss. The acceptance rate for the quarter increased to 91.8% from 81.3% in Q4’2022, with the government accepting a total of Kshs 351.9 bn of the Kshs 391.2 bn worth of bids received during the quarter.
During the week, T-bills were undersubscribed, with the overall subscription rate coming in at 34.4%, a continued decline from the 49.2% recorded the previous week, attributable to persistent tightened liquidity in the money market evidenced by the average interbank rate increasing to 7.6% from 7.2% recorded the previous week. Investor’s preference for the shorter 91-day paper persisted as they sought to avoid duration risk, with the paper receiving bids worth Kshs 2.9 bn against the offered Kshs 4.0 bn, translating to an undersubscription rate of 72.6%, significantly lower than the 179.4% recorded the previous week. Notably, the 182-day and 364-day papers recorded undersubscriptions of 35.5% and 18.1% from an undersubscription rate of 87.7% and 43.7%, respectively, recorded the previous week. The government accepted bids worth Kshs 8.0 bn and rejected Kshs 0.3 bn out of the total Kshs 8.3 bn bids received, translating to an acceptance rate of 97.2%. The yields on the government papers were on an upward trajectory, with the yields on the 364-day paper, 182-day and 91-day papers increasing by 1.3 bps, 5.5 bps and 7.8 bps to 10.8%, 10.4% and 9.9%, respectively. The chart below compares the overall average T- bills subscription rates obtained in 2017, 2022 and 2023 Year to Date (YTD):
Primary T-bond auctions in Q1’2023:
In Q1’2023, the government issued one new Treasury bond and one infrastructure bond, re-opened three and offered five of them on tap sale, seeking to raise Kshs 190.0 bn. The bonds were generally undersubscribed, receiving bids worth Kshs 164.1 bn against the offered Kshs 190.0 bn, translating to a subscription rate of 86.4%. The government was keen on rejecting expensive bids and thus accepted only Kshs 141.7 bn of the Kshs 164.1 bn worth of bids received, translating to an acceptance rate of 86.4%. The table below provides more details on the bonds issued during the quarter:
|
Cytonn Report: Q1’2023 T-bonds auction results |
|||||||||
|
Issue Date |
Bond Auctioned |
Effective Tenor to Maturity (Years) |
Coupon |
Amount offered (Kshs bn) |
Actual Amount Raised (Kshs bn) |
Total bids received |
Average Accepted Yield |
Subscription Rate |
Acceptance Rate |
|
16/01/2023 |
FXD1/2020/005 (re-opened) |
2.4 |
11.7% |
50.0 |
31.5 |
41.6 |
12.9% |
83.3% |
75.7% |
|
FXD1/2022/015 (re-opened) |
14.3 |
13.9% |
14.3% |
||||||
|
20/01/2023 |
FXD1/2020/005 - Tapsale |
2.4 |
11.7% |
10.0 |
17.6 |
18.0 |
13.9% |
180.2% |
97.8% |
|
FXD1/2022/015 - Tapsale |
14.3 |
13.9% |
14.2% |
||||||
|
13/02/2023 |
FXD1/2017/10 (re-opened) |
4.4 |
13.0% |
50.0 |
16.7 |
19.5 |
13.9% |
38.9% |
86.1% |
|
FXD1/2023/10 |
10.0 |
14.2% |
14.2% |
||||||
|
20/02/2023 |
FXD1/2020/005 - Tapsale |
4.4 |
13.0% |
10.0 |
12.2 |
12.5 |
13.9% |
124.6% |
97.9% |
|
FXD1/2022/015 - Tapsale |
10.0 |
14.2% |
14.2% |
||||||
|
8/3/2023 |
IFB1/2023/017 |
17.0 |
14.4% |
50.0 |
50.9 |
59.8 |
14.4% |
119.5% |
85.1% |
|
IFB1/2023/017-Tapsale |
17.0 |
14.4% |
20.0 |
12.7 |
12.7 |
14.4% |
63.6% |
100.0% |
|
|
Q1'2023 Total |
|
|
190.0 |
141.7 |
164.1 |
|
|
|
|
|
Q1'2023 Average |
9.6 |
13.4% |
31.7 |
23.6 |
27.3 |
14.0% |
101.7% |
90.4% |
|
|
Q4'2022 Average |
12.9 |
13.6% |
37.8 |
26.9 |
31.2 |
13.8% |
110.8% |
87.3% |
|
Source: CBK
Secondary Bond Market Activity:
- Bond Turnover
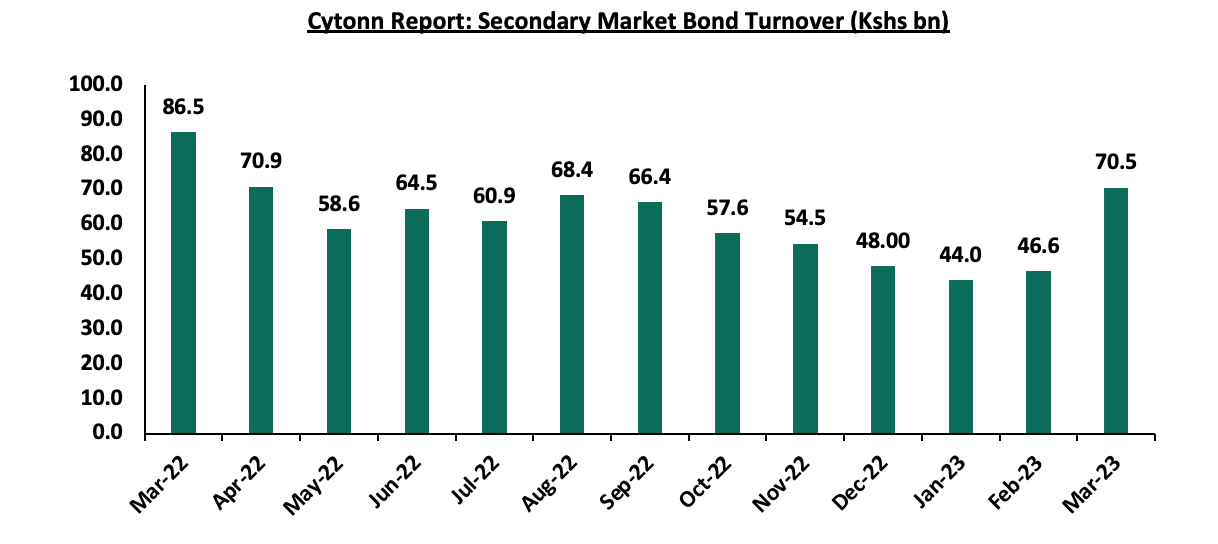
In the secondary bond market, activity increased slightly, with the turnover increasing by 0.7% to Kshs 161.1 bn, from Kshs 160.1 bn in Q4’2022, partially attributable to the increased allocation to treasury bonds by local institutional investors as they sought for higher yield in the market. The chart below shows the bond turnover over the last one year:
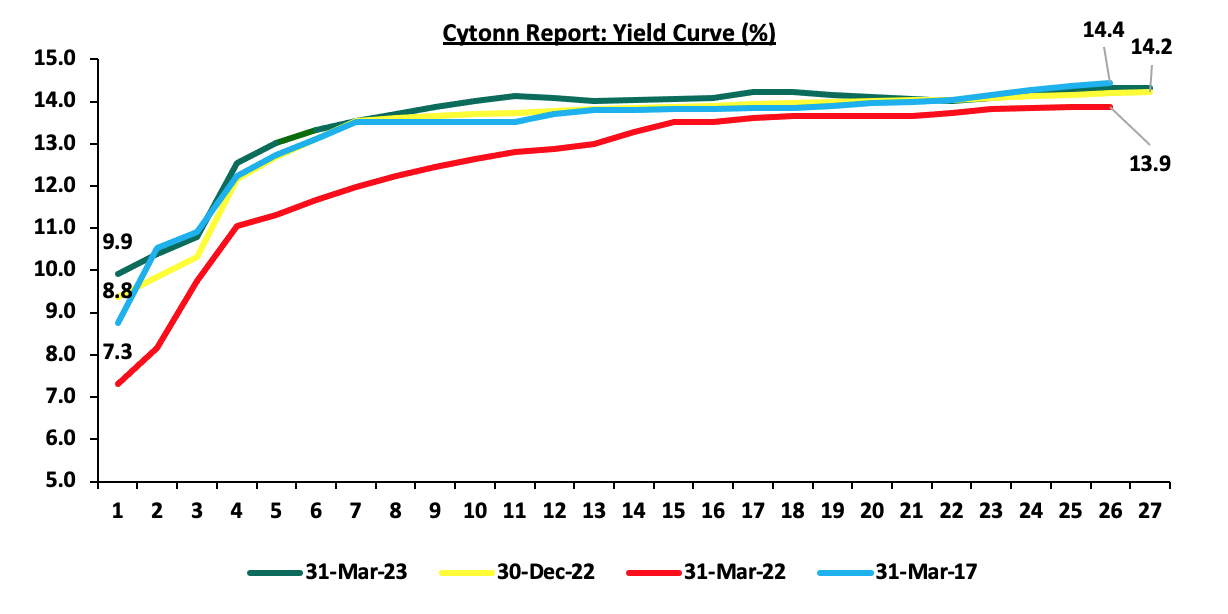
- Yield Curve
The yield curve was on an upward trajectory in Q1’2023 with a notable increase in the yields on all bonds, however the shorter end of the yield curve increased more than the longer end, signaling a flatter curve, hence reflecting short-term risk sentiments. The chart below shows the yield curve movement during the quarter;
Money Market Performance
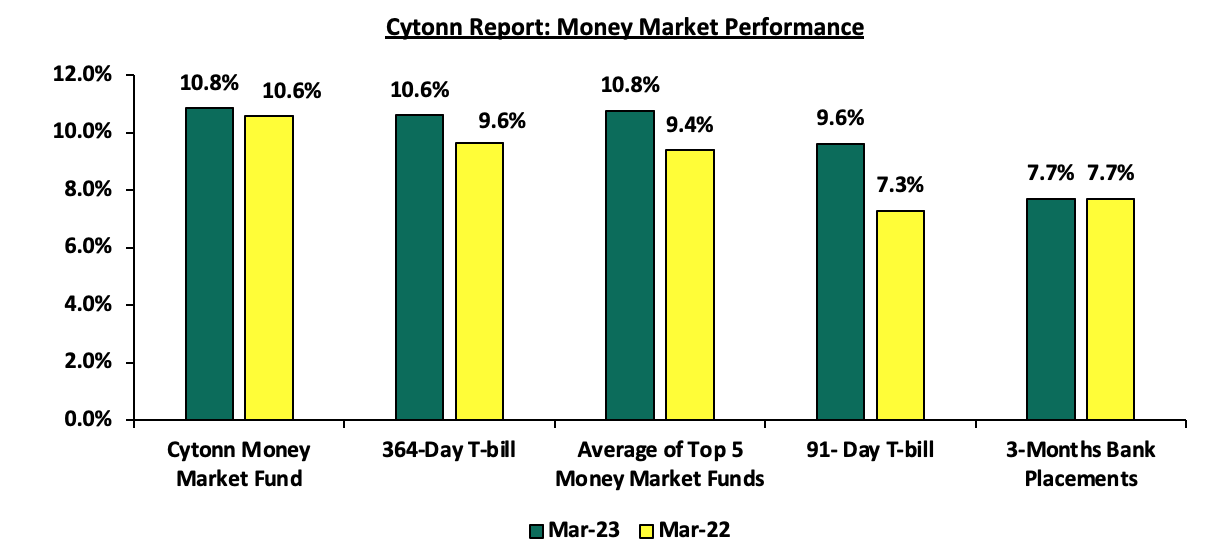
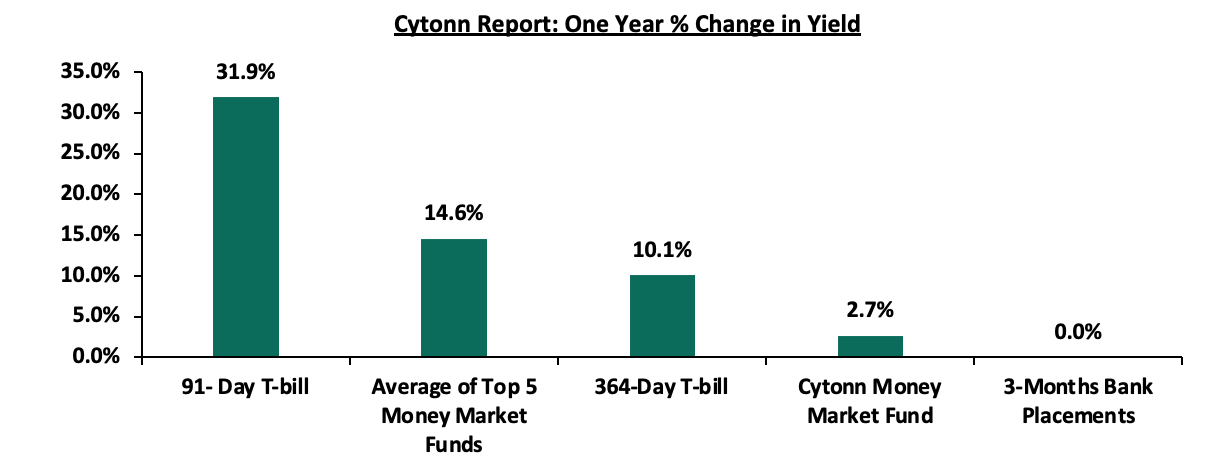
The 3-month bank placements recorded 7.7% as at the end of Q1’2023, similar to what was recorded at the end of Q1’2022 (based on what we have been offered by various banks). The average yield on the 91-day T-bill and the average Top 5 Money Market Funds increased by 2.3% points and 1.4% points to 9.6% and 10.8% in Q1’2023 from 7.3% and 9.4% in Q1’2022, respectively. The average yield on the Cytonn Money Market (CMMF) increased by 0.2% points to 10.8% in Q1’2023 from 10.6% in Q1’2022.
Notably, in the past one year, the yield on 91-day T-bill increased the most, recording an increase of 31.9% followed by average of Top 5 Money Market Funds which recorded a 14.6% change. However, the 3-months bank placement remained constant recording no percentage change during the period. The chart below shows the one year percentage change in yields of various asset classes:
The table below shows the Money Market Fund Yields for Kenyan Fund Managers as published on 31st March 2023:
|
Cytonn Report: Money Market Fund Yield for Fund Managers as published on 31st March 2023 |
||
|
Rank |
Fund Manager |
Effective Annual Rate |
|
1 |
Cytonn Money Market Fund (dial *809# or download Cytonn App) |
11.10% |
|
2 |
Madison Money Market Fund |
10.84% |
|
3 |
Jubilee Money Market Fund |
10.73% |
|
4 |
Apollo Money Market Fund |
10.59% |
|
5 |
Dry Associates Money Market Fund |
10.52% |
|
6 |
Old Mutual Money Market Fund |
10.18% |
|
7 |
NCBA Money Market Fund |
10.16% |
|
8 |
Nabo Africa Money Market Fund |
10.11% |
|
9 |
Kuza Money Market fund |
10.10% |
|
10 |
Zimele Money Market Fund |
9.91% |
|
11 |
AA Kenya Shillings Fund |
9.88% |
|
12 |
Sanlam Money Market Fund |
9.80% |
|
13 |
KCB Money Market Fund |
9.79% |
|
14 |
Co-op Money Market Fund |
9.78% |
|
15 |
GenCap Hela Imara Money Market Fund |
9.65% |
|
16 |
GenAfrica Money Market Fund |
9.44% |
|
17 |
CIC Money Market Fund |
9.33% |
|
18 |
British-American Money Market Fund |
9.18% |
|
19 |
ICEA Lion Money Market Fund |
8.93% |
|
20 |
Orient Kasha Money Market Fund |
8.93% |
|
21 |
Mali Money Market Fund |
8.67% |
|
22 |
Absa Shilling Money Market Fund |
8.64% |
|
23 |
Equity Money Market Fund |
6.73% |
Liquidity:
In Q1’2023, liquidity in the money market tightened, evidenced by the 1.4% points increase in the average interbank rate to 6.5%, from 5.1% the previous quarter, partly attributable to tax remittances that outweighed government payments, consequently leading to reduced liquidity in the money market as more money were paid to the government compared to maturities payments. As such, the interbank rate rose due to high demand with low liquidity in the market. The tightened liquidity is also attributable to the tightened monetary policy, with the MPC rate being hiked by 75.0 bps to 9.50 in March 2023 from 8.75% in January 2023. The average volumes traded in the interbank market increased by 6.3% to Kshs 226.7 bn, from Kshs 213.2 bn recorded in Q4’2022.
During the week, liquidity in the money markets continued to tighten, with the average interbank rate increasing to 7.6% from 7.2% recorded the previous week, partly attributable to tax remittances that offset government payments. The average interbank volumes traded declined by 12.6% to Kshs 22.0 bn from Kshs 25.1 bn recorded the previous week.
Kenya Eurobonds:
During Q1’2023, the yields on Eurobonds were on an upward trajectory, with the 7-year Eurobond issued in 2019 increasing the most, having increased by 2.4% points to 13.3% from 10.9% recorded in Q4’2022. The increase in yields is partly attributable to increased perceived risks in the economy amid the country’s dwindling forex reserves raising concerns on the country’s ability to meet its debt obligations. The continued currency depreciation and the elevated inflationary pressures are affecting investors’ sentiments hence the need to cushion against possible losses.
During the week, the yields on Eurobonds were on a downward trajectory with the yields on the 10-year Eurobond issued in 2018, 12-year Eurobond issued in 2019 and 12-year Eurobond issued in 2021 declining the most, having declined by 0.5% points each to 13.7%, 11.8% and 11.2% from 14.2%, 12.3% and 11.7% recorded the previous week. The decline followed an announcement by the Permanent Secretary to the National Treasury that the government is keen on prioritizing the payment of debt obligations and had settled all debt due in March 2023 amounting to Kshs 150.0 bn. The table below shows the summary of the performance of the Kenyan Eurobonds as of 30th March 2023;
|
Cytonn Report: Kenya Eurobonds Performance |
||||||
|
2014 |
2018 |
2019 |
2021 |
|||
|
Date |
10-year issue |
10-year issue |
30-year issue |
7-year issue |
12-year issue |
12-year issue |
|
Amount Issued (USD bn) |
2.0 |
1.0 |
1.0 |
0.9 |
1.2 |
1.0 |
|
Years to Maturity |
1.3 |
5.0 |
25.0 |
4.2 |
9.2 |
11.3 |
|
Yields at Issue |
6.6% |
7.3% |
8.3% |
7.0% |
7.9% |
6.2% |
|
2-Jan-23 |
12.9% |
10.5% |
10.9% |
10.9% |
10.8% |
9.9% |
|
30-Dec-22 |
12.9% |
10.5% |
10.9% |
10.9% |
10.8% |
9.8% |
|
23-Mar-23 |
14.2% |
12.8% |
12.0% |
13.7% |
12.3% |
11.7% |
|
24-Mar-23 |
14.7% |
13.1% |
12.1% |
14.1% |
12.6% |
11.8% |
|
27-Mar-23 |
14.4% |
13.1% |
12.1% |
14.0% |
12.6% |
11.7% |
|
28-Mar-23 |
14.5% |
13.2% |
12.2% |
14.4% |
12.6% |
11.8% |
|
29-Mar-23 |
14.3% |
12.9% |
12.1% |
14.3% |
12.5% |
11.6% |
|
30-Mar-23 |
13.7% |
12.4% |
11.6% |
13.3% |
11.8% |
11.2% |
|
Weekly Change |
(0.5%) |
(0.4%) |
(0.4%) |
(0.4%) |
(0.5%) |
(0.5%) |
|
Q/Q Change |
0.8% |
1.9% |
0.7% |
2.4% |
1.0% |
1.4% |
|
YTD Change |
0.8% |
1.9% |
0.8% |
2.3% |
1.0% |
1.4% |
Source: Central Bank of Kenya (CBK) and National Treasury
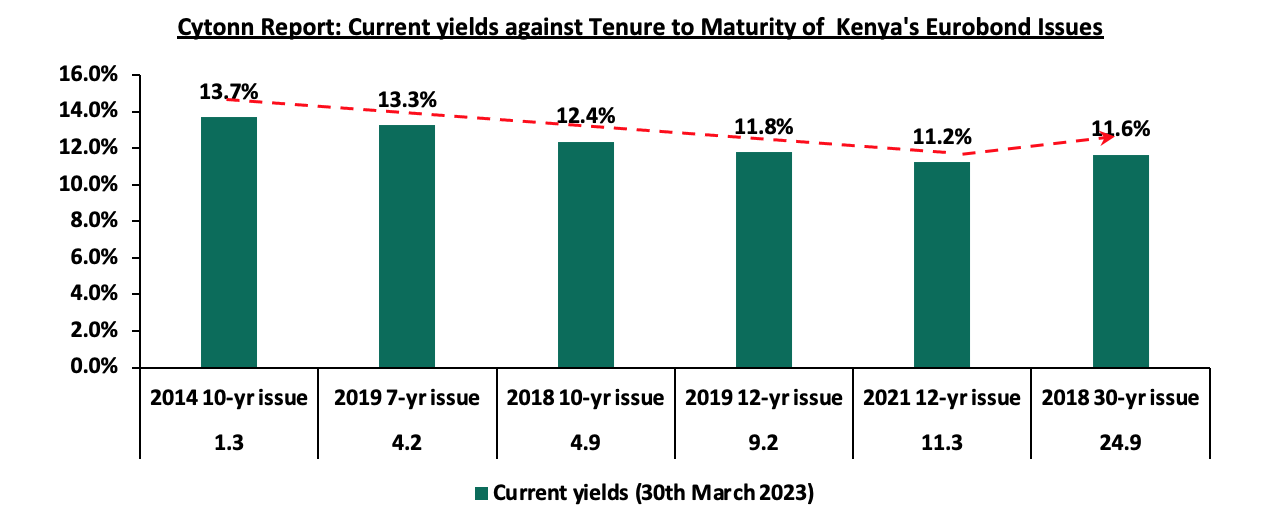
The chart below compares the current yields to the tenure to maturity of the various Eurobond issuances by Kenya, highlighting that the shorter-tenure issuances have higher yields as compared to the long-tenure Eurobonds, attributable to servicing concerns;
Rates in the Fixed Income market have remained relatively stable due to the relatively ample liquidity in the money market. The government is 17.3% ahead of its prorated borrowing target of Kshs 322.3 bn having borrowed Kshs 378.2 bn of the new domestic borrowing target of Kshs 425.1 bn as per the February 2023 revised domestic borrowing target for FY’2022/23. We believe that the projected budget deficit of 5.7% is relatively ambitious given the downside risks and deteriorating business environment occasioned by high inflationary pressures. Further, revenue collections are lagging behind, with total revenue as at February 2023 coming in at Kshs 1.3 tn in the FY’2022/2023, equivalent to 59.8% of its target of Kshs 2.1 tn and 89.7% of the prorated target of Kshs 1.4 tn. Therefore, we expect a continued upward readjustment of the yield curve in the short and medium term, with the government looking to bridge the fiscal deficit through the domestic market. Owing to this, our view is that investors should be biased towards short-term fixed-income securities to reduce duration risk.
Market Performance:
During Q1’2023, the equities market was on a downward trajectory, with NASI, NSE 20 and NSE 25 declining by 11.5%, 3.2% and 5.4%, respectively. The equities market performance during the quarter was driven by losses recorded by large caps such as Safaricom, Bamburi, KCB Group, and NCBA Group of 25.1%, 11.0%, 6.8% and 6.7%, respectively. The losses were however mitigated by gains recorded by banking stocks such as Standard Chartered Bank (SCBK), Co-operative Bank, ABSA Bank and NCBA Group of 19.1%, 6.9%, 4.1% and 2.5%, respectively.
Equities turnover increased by 151.6% during the quarter to USD 348.4 mn, from USD 138.4 mn in Q4’2022. Foreign investors remained net sellers during the quarter, with a net selling position of USD 41.0 mn, from a net selling position of USD 40.1 mn recorded in Q4’2022.
During the week, the equities market was on an upward trajectory, with NASI, NSE 20 and NSE 25 gaining by 1.2%, 3.7% and 4.8%, respectively, taking the YTD performance to losses of 11.4%, 3.2%, and 5.5% for NASI, NSE 20, and NSE 25, respectively. The equities market performance was mainly driven by gains recorded by large cap stocks such as Equity Group, NCBA, BAT Group and ABSA Bank of 17.7%, 12.1%, 9.1% and 7.6%, respectively. The gains were however weighed down by losses recorded by other large stocks such as Safaricom and EABL of 4.2% and 0.4% respectively.
During the week, equities turnover declined by 93.3% to USD 13.3 mn from USD 197.0 mn recorded the previous week taking the YTD turnover to USD 348.4 mn. Foreign investors remained net sellers, recording a net selling position of USD 3.4 mn, from a net selling position of USD 1.6 mn recorded the previous week, taking the YTD net selling position to USD 41.0 mn.
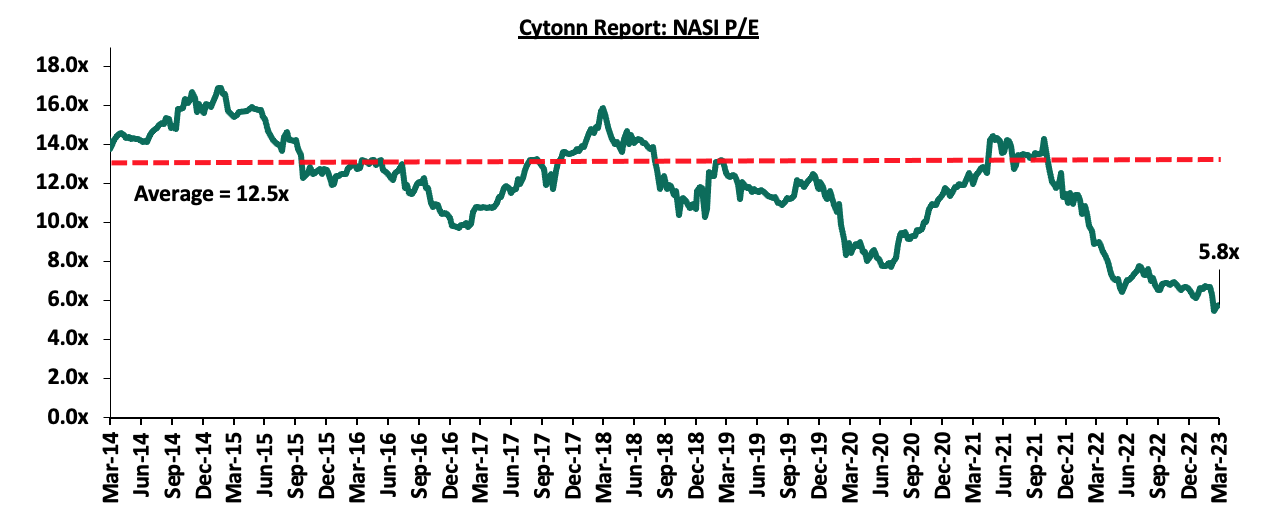
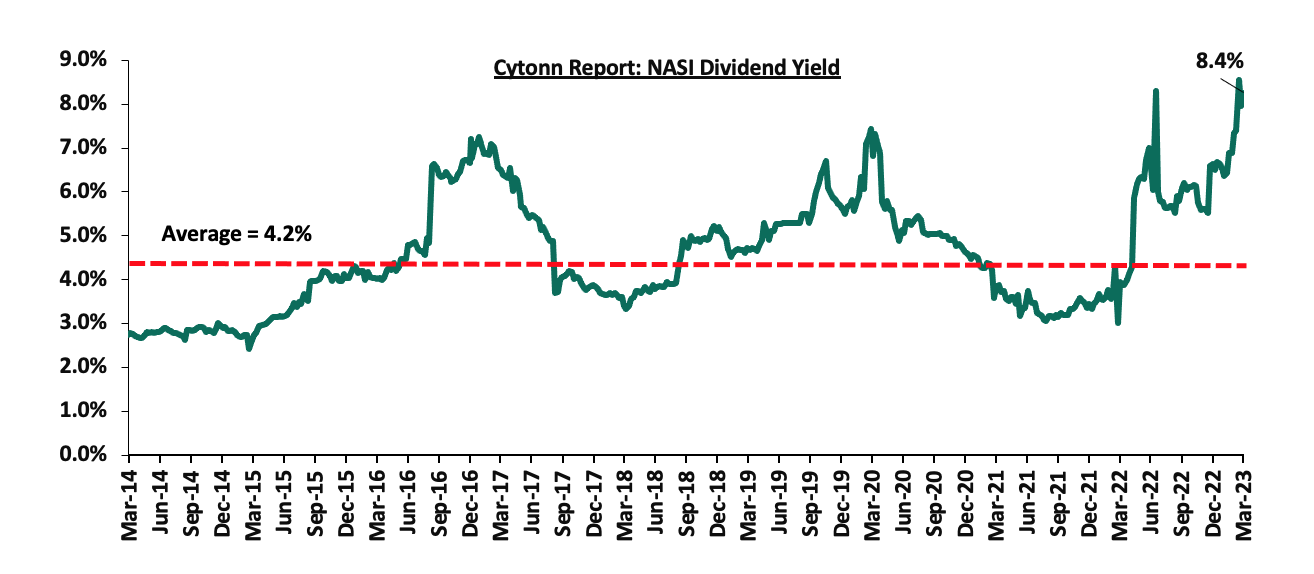
The market is currently trading at a price to earnings ratio (P/E) of 5.8x, 53.6% below the historical average of 12.5x. The dividend yield stands at 8.4%, 4.2% points above the historical average of 4.2%. Key to note, NASI’s PEG ratio currently stands at 0.7x, an indication that the market is undervalued relative to its future growth. A PEG ratio greater than 1.0x indicates the market is overvalued while a PEG ratio less than 1.0x indicates that the market is undervalued. The charts below indicate the historical P/E and dividend yields of the market;
Earnings Releases
During the first quarter of 2023, listed banks in Kenya released their FY’2022 results, recording an increase in their earnings growth, with their average core Earnings per share (EPS) recording a weighted average growth of 26.5%, compared to a weighted average growth of 83.2% in FY’2021. The performance is however largely skewed by the strong EPS growth from HF Group, Diamond Trust Bank of Kenya and NCBA Group of 138.9%, 53.9% and 34.8%, respectively.
- Equity Group Holdings Plc FY’2022 performance
During the week, Equity Group Holdings Plc released their FY’2022 financial results. Below is a summary of the performance:
|
Balance Sheet Items |
FY’2021 (Kshs bn) |
FY’2022 (Kshs bn) |
y/y change |
|
Government Securities |
228.5 |
219.2 |
(4.1%) |
|
Net Loans and Advances |
587.8 |
706.6 |
20.2% |
|
Total Assets |
1,304.9 |
1,447.0 |
10.9% |
|
Customer Deposits |
959.0 |
1,052.2 |
9.7% |
|
Deposits per Branch |
2.8 |
3.0 |
4.4% |
|
Total Liabilities |
1,128.7 |
1,264.8 |
12.1% |
|
Shareholders’ Funds |
169.2 |
176.2 |
4.2% |
|
Balance Sheet Ratios |
FY’2021 |
FY’2022 |
% points y/y change |
|
Loan to Deposit Ratio |
61.3% |
67.2% |
5.9% |
|
Gov’t Securities to Deposit Ratio |
23.8% |
20.8% |
(3.0%) |
|
Return on average equity |
26.6% |
26.7% |
0.1% |
|
Return on average assets |
3.5% |
3.4% |
(0.1%) |
|
Income Statement |
FY’2021 (Kshs bn) |
FY’2022 (Kshs bn) |
y/y change |
|
Net Interest Income |
68.8 |
86.0 |
25.0% |
|
Net non-Interest Income |
44.6 |
59.9 |
34.5% |
|
Total Operating income |
113.4 |
145.9 |
28.7% |
|
Loan Loss provision |
(5.8) |
(15.4) |
163.7% |
|
Total Operating expenses |
(61.5) |
(86.1) |
40.0% |
|
Profit before tax |
51.9 |
59.8 |
15.3% |
|
Profit after tax |
40.1 |
46.1 |
15.1% |
|
Core EPS |
10.6 |
12.2 |
15.1% |
|
Income Statement Ratios |
FY’2021 |
FY’2022 |
% points y/y change |
|
Yield from interest-earning assets |
9.3% |
10.0% |
0.7% |
|
Cost of funding |
2.7% |
2.9% |
0.2% |
|
Cost of risk |
5.2% |
10.6% |
5.4% |
|
Net Interest Margin |
6.8% |
7.2% |
0.4% |
|
Net Interest Income as % of operating income |
60.7% |
58.9% |
(1.8%) |
|
Non-Funded Income as a % of operating income |
39.3% |
41.1% |
1.8% |
|
Cost to Income Ratio |
54.2% |
59.0% |
4.8% |
|
Cost to Income Ratio without LLP |
49.1% |
48.4% |
(0.7%) |
|
Cost to Assets |
4.8% |
5.1% |
0.3% |
|
Capital Adequacy Ratios |
FY’2021 |
FY’2022 |
% Points Change |
|
Core Capital/Total Liabilities |
14.2% |
16.9% |
2.7% |
|
Minimum Statutory ratio |
8.0% |
8.0% |
- |
|
Excess |
6.2% |
8.9% |
2.7% |
|
Core Capital/Total Risk Weighted Assets |
12.9% |
15.6% |
2.7% |
|
Minimum Statutory ratio |
10.5% |
10.5% |
- |
|
Excess |
2.4% |
5.1% |
2.7% |
|
Total Capital/Total Risk Weighted Assets |
17.7% |
20.2% |
2.5% |
|
Minimum Statutory ratio |
14.5% |
14.5% |
- |
|
Excess |
3.2% |
5.7% |
2.5% |
|
Liquidity Ratio |
63.4% |
52.1% |
(11.3%) |
|
Minimum Statutory ratio |
20.0% |
20.0% |
- |
|
Excess |
43.4% |
32.1% |
(11.3%) |
|
Adjusted core capital/ total deposit liabilities |
14.2% |
16.9% |
2.7% |
|
Adjusted core capital/ total risk weighted assets |
12.9% |
15.6% |
2.7% |
|
Adjusted total capital/ total risk weighted assets |
17.7% |
20.2% |
2.5% |
Key Take-Outs:
Earnings Growth- Core earnings per share increased by 15.1% to Kshs 12.2 in FY’2022, from Kshs 10.6 recorded in FY’2021, higher than our projections of a 10.1% increase to Kshs 11.7. The performance was driven by a 28.7% growth in total operating income to Kshs 145.9 bn, from Kshs 113.4 bn in FY’2021 higher than our projections of 25.1%. However, the performance was weighed down by the 40.0% growth in total operating expenses to Kshs 86.1 bn, from Kshs 61.5 bn in FY’2021,
Equity Group’s directors recommended a final dividend per share of Kshs 4.0 in FY’2022, representing a dividend yield of 8.8% as at 31st March 2023. The dividends recommended represent a 33.3% increase from dividend per share of Kshs 3.0 paid in FY’2021. Additionally, the dividend payout ratio increased to 33.6% in FY’2022, from 28.9% in FY’2021,
Increased profitability as a result of Group’s Geographical diversification- The Group’s geographical diversification strategy has continued to emerge as a net positive, with the bank’s various subsidiaries in Uganda, DRC, Rwanda, Tanzania, and South Sudan cumulatively contributing 30.0% to the bank’s total profitability and 44.0% to the group’s total asset base. Cumulatively, the group’s subsidiaries, excluding Equity Bank Kenya Ltd, recorded an 61.1% growth in their Profit after Tax (PAT) to Kshs 12.7 bn, from Kshs 7.9 bn in FY’2021, with the Equity Bank South Sudan recording the highest year on year growth of 1381.0% in PAT to Kshs 2.3 bn from a loss of Kshs 0.2 bn in FY’2021, mainly driven by favorable operating business environment following reduction in political instability in the country. However, concerns remain high on the high NPL levels in the group’s Tanzanian subsidiary of 18.9% and we expect the group to improve its credit assessment in the country to bring down the high NPL ratio,
Increased Provisioning – The Group increased its Loans Loss Provision (LLPs) by 163.7% to Kshs 15.4 bn in FY’2022, from Kshs 5.8 bn recorded in FY’2021 aimed at mitigating increased credit risk on the back of the elevated inflationary pressures. Additionally, the NPL coverage increased to 70.5%, from 68.7% in FY’2021 as a result of the 13.9% increase in general provisions, coupled with a 39.2% increase in interest in suspense which outpaced the 17.2% growth in Gross non-performing loans. We expect the high provisioning to cushion the Group against high credit risk on the tough operating business environment which has curtailed recovery in some sectors locally and the high NPL ratios in some of the group’s subsidiaries,
Improved Lending – FY’2022 was characterized by a 20.2% growth in loans with investments in government securities declining by 4.1%, highlighting the Group’s strategy to increase lending despite the tough operating business environment. Notably, the Group diversified risk by extending credit to various sectors in the economy with high lending recorded in sectors such as trade, personal household, and real estate at 23.0%, 22.0% and 14.0%, respectively.
For a comprehensive analysis, please see our Equity Group Holding Plc’s FY’2022 Earnings Note
- NCBA Group FY’2022 performance
During the week, NCBA Group released their FY’2022 financial results. Below is a summary of NCBA Group FY’2022 performance:
|
Balance Sheet Items (Kshs bn) |
FY’2021 |
FY’2022 |
y/y change |
|
Net Loans and Advances |
244.0 |
278.9 |
14.3% |
|
Government Securities |
196.1 |
205.4 |
4.8% |
|
Total Assets |
591.1 |
619.7 |
4.8% |
|
Customer Deposits |
469.9 |
502.7 |
7.0% |
|
Deposits per Branch |
4.5 |
5.8 |
29.4% |
|
Total Liabilities |
513.1 |
537.2 |
4.7% |
|
Shareholders’ Funds |
77.9 |
82.4 |
5.9% |
|
Balance Sheet Ratios |
FY’2021 |
FY’2022 |
y/y change |
|
Loan to Deposit Ratio |
51.9% |
55.5% |
3.6% |
|
Gov’t Securities to Deposit Ratio |
41.7% |
40.9% |
(0.8%) |
|
Return on average equity |
13.6% |
17.2% |
3.6% |
|
Return on average assets |
1.8% |
2.3% |
0.4% |
|
Income Statement (Kshs bn) |
FY’2021 |
FY’2022 |
y/y change |
|
Net Interest Income |
27.0 |
30.7 |
13.5% |
|
Net non-Interest Income |
22.1 |
30.3 |
36.8% |
|
Total Operating income |
49.2 |
60.9 |
24.0% |
|
Loan Loss provision |
12.7 |
13.1 |
2.7% |
|
Total Operating expenses |
33.4 |
37.9 |
13.4% |
|
Profit before tax |
15.0 |
22.5 |
49.6% |
|
Profit after tax |
10.2 |
13.8 |
34.8% |
|
Core EPS |
6.2 |
8.4 |
34.8% |
|
Dividend Per Share |
3.0 |
4.3 |
41.7% |
|
Dividend payout ratio |
48.3% |
50.8% |
2.5% |
|
Income Statement Ratios |
FY’2021 |
FY’2022 |
Y/Y Change |
|
Yield from interest-earning assets |
9.8% |
10.1% |
0.3% |
|
Cost of funding |
4.2% |
4.3% |
0.1% |
|
Net Interest Spread |
5.6% |
5.7% |
0.1% |
|
Net Interest Margin |
5.7% |
5.9% |
0.2% |
|
Cost of Risk |
25.9% |
21.4% |
(4.5%) |
|
Net Interest Income as % of operating income |
55.0% |
50.3% |
(4.7%) |
|
Non-Funded Income as a % of operating income |
45.0% |
49.7% |
4.7% |
|
Cost to Income Ratio |
68.1% |
62.2% |
(5.9%) |
|
Cost to Income Ratio without LLP |
42.2% |
40.8% |
(1.4%) |
|
Capital Adequacy Ratios |
FY’2021 |
FY’2022 |
% points change |
|
Core Capital/Total Liabilities |
16.8% |
16.3% |
(0.5%) |
|
Minimum Statutory ratio |
8.0% |
8.0% |
- |
|
Excess |
8.8% |
8.3% |
(0.5%) |
|
Core Capital/Total Risk Weighted Assets |
19.0% |
18.4% |
(0.6%) |
|
Minimum Statutory ratio |
10.5% |
10.5% |
- |
|
Excess |
8.5% |
7.9% |
(0.6%) |
|
Total Capital/Total Risk Weighted Assets |
19.1% |
18.4% |
(0.7%) |
|
Minimum Statutory ratio |
14.5% |
14.5% |
- |
|
Excess |
4.6% |
3.9% |
(0.7%) |
|
Liquidity Ratio |
61.7% |
53.2% |
(8.5%) |
|
Minimum Statutory ratio |
20.0% |
20.0% |
|
|
Excess |
41.7% |
33.2% |
(8.5%) |
|
Adjusted core capital/ total deposit liabilities |
17.5% |
16.6% |
(0.9%) |
|
Adjusted core capital/ total risk weighted assets |
19.8% |
18.8% |
(1.1%) |
|
Adjusted total capital/ total risk weighted assets |
19.9% |
18.8% |
(1.1%) |
Key Take-Outs:
Earnings Growth- Core earnings per share rose by 34.8% to Kshs 8.4 from Kshs 6.2 in FY’2021, slightly higher than our expectations of a 31.8% increase to Kshs 8.2, with the variance stemming from the 24.0% increase in total operating income which was higher than our projection of a 13.5% increase. The performance was driven by a 24.0% increase in total operating income to Kshs 60.9 bn, from Kshs 49.2 bn in FY’2021, which outpaced the 13.4% increase in the total operating expenses to Kshs 37.9 bn in FY’2022, from Kshs 33.4 bn in FY’2021,
NCBA Group board recommended the payment of a final dividend for the year of Kshs 2.25 per share which added to the interim dividend of Kshs 2.00 per share paid on 30th September 2022, bringing the total dividend for the year 2022 to Kshs 4.25 per share, and a dividend yield of 11.8% as at 31st March 2023. The total dividends for FY’2022 represent a 41.7% increase from the total dividend of Kshs 3.00 per share paid in 2021. Additionally, the dividend payout ratio increased to 50.8%, from 48.3% in FY’2021,
Growth in non-funded income – The total non-funded income grew by 36.8% to Kshs 30.3 bn in FY’2022 from Kshs 22.1 bn in FY’2021, which was higher than the 13.5% increase in net interest income. The growth was mainly driven by a 147.1% increase in foreign exchange income to Kshs 12.5 bn from Kshs 5.1 bn in FY’2021 attributed to increased demand for the dollar amid widening margins. As such, the revenue mix for funded to non-funded income shifted to 50:50 from 55:45, and,
Improvement in Asset Quality – The group’s asset quality improved, with the NPL ratio improving by 3.0% points to 13.0% from 16.0% in FY’2021, owing to the 11.7% decline in gross non-performing loans to Kshs 39.1 bn in FY’2022 from Kshs 44.3 bn in FY’2021, while gross loans increased by 9.1% to Kshs 301.8 bn in FY’2022 from 276.7 bn in FY’2021. However, the NPL ratio increase on a q/q from 12.6% recorded in Q3’2022. The y/y decline in gross non-performing loans is an indication of reducing credit risk in the bank loan portfolio.
For a comprehensive analysis, please see our NCBA Group’s FY’2022 Earnings Note
- Diamond Trust Bank Kenya’s FY’2022 performance
During the week, Diamond Trust Bank Kenya released their FY’2022 financial results. Below is a summary of the performance:
|
Balance Sheet Items (Kshs bn) |
FY’2021 |
FY’2022 |
y/y change |
|
Government Securities |
124.3 |
131.5 |
5.8% |
|
Net Loans and Advances |
220.4 |
253.7 |
15.1% |
|
Total Assets |
456.8 |
527.0 |
15.4% |
|
Customer Deposits |
331.5 |
387.6 |
16.9% |
|
Deposits per Branch |
2.6 |
3.0 |
16.0% |
|
Total Liabilities |
382.3 |
449.3 |
17.5% |
|
Shareholders’ Funds |
67.3 |
69.0 |
2.5% |
|
Balance Sheet Ratios |
FY’2021 |
FY’2022 |
y/y change |
|
Loan to Deposit Ratio |
66.5% |
65.5% |
(1.0%) |
|
Gov’t Securities to Deposit Ratio |
37.5% |
33.9% |
(3.6%) |
|
Return on average equity |
6.8% |
10.0% |
3.2% |
|
Return on average assets |
1.0% |
1.4% |
0.4% |
|
Income Statement (Kshs bn) |
FY’2021 |
FY’2022 |
y/y change |
|
Net Interest Income |
20.0 |
22.9 |
14.5% |
|
Non-Interest Income |
6.3 |
9.1 |
43.5% |
|
Total Operating income |
26.3 |
31.9 |
21.4% |
|
Loan Loss provision |
7.6 |
7.1 |
(5.5%) |
|
Total Operating expenses |
19.9 |
22.1 |
11.1% |
|
Profit before tax |
6.6 |
9.5 |
43.8% |
|
Profit after tax |
4.4 |
6.8 |
53.9% |
|
Earnings per share (Kshs) |
15.8 |
24.3 |
53.9% |
|
Income Statement Ratios |
FY’2021 |
FY’2022 |
Y/Y Change |
|
Yield from interest-earning assets |
8.7% |
9.2% |
0.5% |
|
Cost of funding |
3.9% |
4.3% |
0.4% |
|
Net Interest Spread |
4.8% |
5.0% |
0.2% |
|
Net Interest Income as % of Total Income |
76.0% |
71.7% |
(4.3%) |
|
Non-Funded Income as a % of Total Income |
24.0% |
28.3% |
4.3% |
|
Cost to Income |
75.6% |
69.1% |
(6.5%) |
|
Cost to Income Ratio without provisions |
46.9% |
46.8% |
(0.1%) |
|
Cost to Assets |
4.5% |
4.5% |
- |
|
Net Interest Margin |
5.1% |
5.3% |
0.2% |
|
Capital Adequacy Ratios |
FY’2021 |
FY’2022 |
% points change |
|
Core Capital/Total deposit Liabilities |
22.0% |
21.1% |
(0.9%) |
|
Minimum Statutory ratio |
8.0% |
8.0% |
- |
|
Excess |
14.0% |
13.1% |
(0.9%) |
|
Core Capital/Total Risk Weighted Assets |
19.9% |
19.8% |
(0.1%) |
|
Minimum Statutory ratio |
10.5% |
10.5% |
- |
|
Excess |
9.4% |
9.3% |
(0.1%) |
|
Total Capital/Total Risk Weighted Assets |
21.2% |
20.7% |
(0.5%) |
|
Minimum Statutory ratio |
14.5% |
14.5% |
- |
|
Excess |
6.7% |
6.2% |
(0.5%) |
|
Liquidity Ratio |
61.6% |
58.2% |
(3.4%) |
|
Minimum Statutory ratio |
20.0% |
20.0% |
- |
|
Excess |
41.6% |
38.2% |
(3.4%) |
|
Adjusted Core Capital/Total Deposit Liabilities |
22.1% |
21.1% |
(1.0%) |
|
Adjusted Core Capital/Total Risk Weighted Assets |
20.0% |
19.8% |
(0.2%) |
|
Adjusted Total Capital/Total Risk Weighted Assets |
21.3% |
20.7% |
(0.6%) |
Key Take-Outs:
Earnings Growth - Core earnings per share increased by 53.9% to Kshs 24.3 in FY’2022, from Kshs 15.8 in FY’2021, higher than our projections of 51.3% increase to Kshs 23.9 per share. The performance was driven by a 21.4% increase in total operating income to Kshs 31.9 bn in FY’2022, from Kshs 26.3 bn in FY’2021. However, the growth was weighed down by the 11.1% increase in the total operating expenses to Kshs 22.1 bn in FY’2022, from Kshs 19.9 bn in FY’2021,
DTB-K’s directors recommended a first and final dividend per share of Kshs 5.0 in FY’2022, representing a dividend yield of 10.8% as at 31st March 2023. The dividends recommended represents a 66.7% increase from dividend per share of Kshs 3.0 paid in FY’2021. Additionally, the dividend payout ratio increased to 20.6% in FY’2022, from 19.0% in FY’2021, and,
Improved Asset Quality – The group’s asset quality improved, with the NPL ratio improving to 12.0% in FY’2022, from 12.9% in FY’2021, owing to the faster 15.3% growth in gross loans, which outpaced the 7.2% increase in gross non-performing loans to Kshs 32.2 bn, from Kshs 30.1 bn in FY’2021. The improvement in asset quality is attributable to proactive credit management strategies leading to increased loan repayment and the declining credit risk in the Kenya’s banking sector, with sector’s gross NPLs to gross loans ratio improving to 13.3% in Q4’2022 from 13.7% in Q3’2022, and,
For a comprehensive analysis, please see our Diamond Trust Bank Kenya’s FY’2022 Earnings Note
- I&M Group FY’2022 performance
During the week, I&M Group released their FY”2022 financial results. Below is a summary of I&M Group FY’2022 performance:
|
Balance Sheet Items (Kshs bn) |
FY’2021 |
FY’2022 |
y/y change |
|
Net Loans and Advances |
210.6 |
238.6 |
13.3% |
|
Government Securities |
125.5 |
113.1 |
(9.9%) |
|
Total Assets |
415.2 |
436.6 |
5.2% |
|
Customer Deposits |
296.7 |
312.3 |
5.3% |
|
Deposits per Branch |
3.3 |
3.8 |
12.9% |
|
Total Liabilities |
341.1 |
355.0 |
4.1% |
|
Shareholders’ Funds |
69.6 |
76.5 |
9.9% |
|
Balance Sheet Ratios |
FY’2021 |
FY’2022 |
y/y change |
|
Loan to Deposit Ratio |
71.0% |
76.4% |
5.4% |
|
Gov’t Securities to Deposit Ratio |
29.6% |
21.8% |
(7.8%) |
|
Return on average equity |
12.2% |
15.3% |
3.1% |
|
Return on average assets |
2.1% |
2.6% |
0.5% |
|
Income Statement (Kshs bn) |
FY’2021 |
FY’2022 |
y/y change |
|
Net Interest Income |
20.9 |
22.9 |
9.9% |
|
Net non-Interest Income |
8.7 |
12.7 |
45.7% |
|
Total Operating income |
29.6 |
35.7 |
20.4% |
|
Loan Loss provision |
(4.2) |
(5.2) |
24.9% |
|
Total Operating expenses |
(17.7) |
(21.3) |
20.2% |
|
Profit before tax |
12.4 |
15.0 |
20.8% |
|
Profit after tax |
8.6 |
11.6 |
34.3% |
|
Core EPS |
5.2 |
7.0 |
34.3% |
|
Dividend Per Share |
1.5 |
2.25 |
9.9% |
|
Dividend payout ratio |
28.8% |
32.1% |
3.4% |
|
Income Statement Ratios |
FY’2021 |
FY’2022 |
Y/Y Change |
|
Yield from interest-earning assets |
10.0% |
10.3% |
0.3% |
|
Cost of funding |
3.9% |
4.2% |
0.3% |
|
Cost of risk |
14.2% |
14.7% |
0.5% |
|
Net Interest Margin |
6.3% |
6.3% |
- |
|
Net Interest Income as % of operating income |
70.5% |
64.3% |
(6.2%) |
|
Non-Funded Income as a % of operating income |
29.5% |
35.7% |
6.2% |
|
Cost to Income Ratio |
59.9% |
59.8% |
(0.1%) |
|
CIR without LLP |
45.8% |
45.1% |
(0.6%) |
|
Cost to Assets |
3.3% |
3.7% |
0.4% |
|
Capital Adequacy Ratios |
FY’2021 |
FY’2022 |
% points change |
|
Core Capital/Total Liabilities |
20.9% |
22.6% |
1.7% |
|
Minimum Statutory ratio |
8.0% |
8.0% |
- |
|
Excess |
12.9% |
14.6% |
1.7% |
|
Core Capital/Total Risk Weighted Assets |
16.6% |
16.3% |
(0.3%) |
|
Minimum Statutory ratio |
10.5% |
10.5% |
- |
|
Excess |
6.1% |
5.8% |
(0.3%) |
|
Total Capital/Total Risk Weighted Assets |
21.5% |
20.5% |
(0.9%) |
|
Minimum Statutory ratio |
14.5% |
14.5% |
- |
|
Excess |
7.0% |
6.0% |
(0.9%) |
|
Liquidity Ratio |
52.3% |
46.1% |
(6.1%) |
|
Minimum Statutory ratio |
20.0% |
20.0% |
- |
|
Excess |
32.3% |
26.1% |
(6.1%) |
|
Adjusted core capital/ total deposit liabilities |
21.0% |
22.6% |
1.7% |
|
Adjusted core capital/ total risk weighted assets |
16.6% |
16.3% |
(0.3%) |
|
Adjusted total capital/ total risk weighted assets |
21.5% |
20.5% |
(1.0%) |
Key Take-Outs:
Earnings Growth- Core earnings per share rose by 34.3% to Kshs 7.0 from Kshs 5.2 in FY’2021, higher than our expectations of a 10.1% increase to Kshs 5.2, with the variance stemming from the 20.4% increase in total operating income, higher than our projection of a 14.2% increase. The group’s overall performance was mainly driven by the 20.4% increase in total operating income to Kshs 35.7 bn in FY’2022 from Kshs 29.6 bn in FY’2021, which outpaced the 20.2% increase in the total operating expenses to Kshs 21.3 bn in FY’2022 from Kshs 17.7 bn in FY’2021,
I&M Group board recommended the payment of a first and final dividend for the year of Kshs 2.25 per share which represents a dividend yield of 10.8% as at 31st March 2023, and dividend payout ratio of 32.1%, an improvement from 28.8% in 2021. The dividends recommended represent a 50.0% increase from the dividend of Kshs 1.5 per share paid in 2021.
Increase in foreign exchange income – The group recorded a 191.0% increase in foreign exchange income to Kshs 5.0 bn from Kshs 1.7 bn in FY’2021. As such, the total non-funded income grew by 45.7% to Kshs 12.7 bn in FY’2022 from Kshs 8.7 bn in FY’2021 which was higher than the 9.9% increase in net interest income, as such, the revenue mix for funded to non-funded income shifted to 64:36 in FY’2022 from 71:29 in FY’2021,
For a comprehensive analysis, please see our I&M Group’s FY’2022 Earnings Note
- HF Group Plc FY’2022 performance
During the week, HF Group Plc released their FY’2022 financial results. Below is a summary of the performance:
|
Balance Sheet Items |
FY'2021 |
FY'2022 |
y/y change |
|
Net loans |
34.7 |
36.3 |
4.6% |
|
Government Securities |
6.6 |
8.5 |
30.4% |
|
Total Assets |
53.2 |
57.0 |
7.1% |
|
Customer Deposits |
37.7 |
39.8 |
5.5% |
|
Deposits Per Branch |
1.7 |
1.8 |
5.5% |
|
Total Liabilities |
44.9 |
48.2 |
7.3% |
|
Shareholder's Funds |
8.3 |
8.8 |
6.0% |
|
Balance Sheet Ratios |
FY'2021 |
FY'2022 |
y/y change |
|
Loan to deposit ratio |
92.0% |
91.2% |
(0.8%) |
|
Gov’t Securities to Deposit Ratio |
17.4% |
21.5% |
4.1% |
|
Return on Average Equity |
(8.1%) |
3.1% |
11.2% |
|
Return on Average Assets |
(1.3%) |
0.5% |
1.8% |
|
Income Statement |
FY'2021 |
FY'2022 |
y/y change |
|
Net Interest Income |
1.8 |
2.2 |
18.2% |
|
Net non-Interest Income |
0.5 |
0.9 |
63.5% |
|
Total Operating income |
2.4 |
3.0 |
28.5% |
|
Loan Loss provision |
(0.3) |
(0.2) |
(30.8%) |
|
Total Operating expenses |
(3.3) |
(2.8) |
(14.3%) |
|
Profit before tax |
(1.0) |
0.2 |
119.7% |
|
Profit after tax |
(0.7) |
0.3 |
138.9% |
|
Core EPS |
(1.8) |
0.7 |
138.9% |
|
Income Statement Ratios |
FY'2021 |
FY'2022 |
y/y change |
|
Yield from interest-earning assets |
9.0% |
9.9% |
0.9% |
|
Cost of funding |
4.8% |
4.9% |
0.1% |
|
Net Interest Spread |
4.3% |
5.0% |
0.7% |
|
Net Interest Margin |
4.2% |
5.0% |
0.8% |
|
Cost of Risk |
11.9% |
6.4% |
(5.5%) |
|
Net Interest Income as % of operating income |
77.3% |
71.1% |
(6.2%) |
|
Non-Funded Income as a % of operating income |
22.7% |
28.9% |
6.2% |
|
Cost to Income Ratio |
140.1% |
93.5% |
(46.6%) |
|
Cost to Income Ratio without LLP |
128.3% |
87.1% |
(41.1%) |
|
Cost to Assets |
5.7% |
4.6% |
(1.1%) |
|
Capital Adequacy Ratios |
FY'2021 |
FY'2022 |
% Change |
|
Core Capital/Total Liabilities |
8.3% |
8.0% |
(0.3%) |
|
Minimum Statutory ratio |
8.0% |
8.0% |
- |
|
Excess |
0.3% |
0.0% |
(0.3%) |
|
Core Capital/Total Risk Weighted Assets |
8.3% |
8.3% |
- |
|
Minimum Statutory ratio |
10.5% |
10.5% |
- |
|
Excess |
(2.3%) |
(2.3%) |
0.1% |
|
Total Capital/Total Risk Weighted Assets |
12.1% |
12.2% |
0.1% |
|
Minimum Statutory ratio |
14.5% |
14.5% |
- |
|
Excess |
(2.4%) |
(2.3%) |
0.1% |
|
Liquidity Ratio |
22.9% |
25.2% |
2.3% |
|
Minimum Statutory ratio |
20.0% |
20.0% |
- |
|
Excess |
2.9% |
5.2% |
2.3% |
|
Adjusted core capital/ total deposit liabilities |
8.4% |
8.1% |
(0.3%) |
|
Adjusted core capital/ total risk weighted assets |
8.4% |
8.4% |
0.0% |
|
Adjusted total capital/ total risk weighted assets |
12.3% |
12.4% |
0.1% |
Key Take Outs
Earnings Growth- Core earnings per share rose by 138.9% to Kshs 0.7, from a loss of Kshs 1.8 registered in FY’2021. This was higher than our expectations of a 116.6% increase to an EPS of Kshs 0.3, with the variance stemming from the 28.5% growth in total operating income to Kshs 3.0 bn, higher than our expected projection of a 22.7% growth to Kshs 2.9 bn. As such, the core earnings per share performance was driven by the 28.5% growth in total operating income to Kshs 3.0 bn, from Kshs 2.4 bn in FY’2021, coupled with the 14.3% decline in total operating expenses to Kshs 2.8 bn from Kshs 3.3 bn in FY’2021. HF Group’s directors did not recommend a dividend payment for the FY’2022,
Full Year Profits – HF Group made a profit after tax of Kshs 0.3 bn, a 138.9% increase from a loss after tax of Kshs 0.7 bn recorded in FY’2021, ending a four-year loss making performance. The performance of the Group is attributable to efficient operations to minimize costs, evidenced by the total operating expenses declining by 14.3% to Kshs 2.8 bn, from Kshs 3.3 bn in FY’2021,
Improved Asset Quality - The group’s asset quality improved significantly, with the gross NPL ratio improving to 19.7% in FY’2022, from 21.1% in FY’2021, attributable to the 2.1% decline in gross non-performing loans to Kshs 8.5 bn, from Kshs 8.7 bn in FY’2021, coupled with 4.7% growth in Gross loans during the year to Kshs 43.0 from Kshs 41.1 bn in FY’2021. The asset quality improvement was a continuing trend from the Group’s Q3’2022 performance where Gross NPL ratio came in at 20.3%, down from 22.0% in Q3’2021. Notably, on a q/q basis, HF Group’s Asset quality improved by 0.5% points to 19.7%, from 20.3% recorded in Q3’2022,
Sustained Efficiency – Cost to Income Ratio (CIR) improved by 46.6% points to 93.5%, from 140.1% in FY’2021, attributable to the 28.5% increase in total operating income to Kshs 3.0 bn in FY’2022, from Kshs 2.4 bn in FY’2021, coupled with the 14.3% decline in total operating expenses to Kshs 2.8 bn, from Kshs 3.3 bn recorded in FY’2021. Key to note, this is the first full year that HF Group’s total operating expenses have been lower than its total operating income, evidenced by the Cost to Income ratio of below 100.0% in all the four quarters of FY’2022, and,
Cautious Lending – HF Group’s FY’2022 result was characterized by a faster 63.5% growth in government securities as compared to the 18.2% rise in net loans, depicting the group’s adoption of conservative lending strategy to take advantage of the higher interest rates in Fixed Income, coupled with the fact that Real Estate credit risk remains elevated, with the Real Estate Gross Non-performing loans of Kshs 80.3 bn in Q4’2022 contributing to 16.5% of the total banking gross NPLs loans of Kshs 487.7 bn in FY’2022. Key to note, this was a 7.5% increase in Real Estate Gross Non-Performing Loans from Kshs 74.7 bn in Q4’2021, compared to the total banking sector gross NPL loans of Kshs 426.8 bn in FY’2021.
For a comprehensive analysis, please see our HF Group’s FY’2022 Earnings Note
Asset Quality
The table below is a summary of the listed banks that have released their FY’2022 results:
|
Cytonn Report: Q1’2023 Listed Banks Asset Quality |
||||||
|
|
FY'2022 NPL Ratio* |
FY'2021 NPL Ratio** |
% point change in NPL Ratio |
FY'2022 NPL Coverage* |
FY'2021 NPL Coverage** |
% point change in NPL Coverage |
|
ABSA Bank Kenya |
7.5% |
7.9% |
(0.4%) |
80.5% |
77.7% |
2.8% |
|
Equity Group |
8.4% |
8.6% |
(0.2%) |
70.5% |
68.7% |
1.8% |
|
I&M Holdings |
9.7% |
9.5% |
0.2% |
71.9% |
71.4% |
0.5% |
|
Stanbic Bank |
10.0% |
9.3% |
0.7% |
63.1% |
58.1% |
5.0% |
|
Diamond Trust Bank |
12.0% |
12.9% |
(0.9%) |
46.3% |
41.8% |
4.5% |
|
NCBA Group |
13.0% |
16.0% |
(3.0%) |
58.5% |
73.6% |
(15.1%) |
|
Co-operative Bank of Kenya |
14.0% |
14.6% |
(0.6%) |
69.3% |
62.6% |
6.7% |
|
Standard Chartered Bank Kenya |
14.2% |
16.0% |
(1.8%) |
87.1% |
84.4% |
2.7% |
|
KCB |
17.0% |
16.6% |
0.4% |
52.4% |
52.9% |
(0.5%) |
|
HF Group |
19.7% |
21.1% |
(1.4%) |
78.8% |
73.6% |
5.2% |
|
Mkt Weighted Average |
11.8% |
12.3% |
(0.5%) |
67.8% |
65.5% |
2.3% |
|
*Market cap weighted as at 31/03/2023 |
||||||
|
**Market cap weighted as at 14/04/2022 |
||||||
Key take-outs from the table include;
- Asset quality for the listed banks improved during the year, with market weighted average NPL ratio declining by 0.5% points to 11.8%, from 12.3% in FY’2021. The improvement was largely driven by an improvement in NCBA Group’s, Standard Chartered Bank Kenya’s and HF Group’s asset quality with their NPL ratios declining by 3.0%, 1.8% and 1.4%% points to 13.0%, 14.2% and 19.7% respectively in FY’2022, from 16.0%, 16.0%, and 21.1% respectively in FY’2021, and,
- Market weighted average NPL Coverage for the listed banks increased by 2.3% points to 67.8% in FY’2022, from 65.5% recorded in FY’2021, majorly on the back of increased NPL coverage recorded b Co-operative Bank of Kenya, HF Group and Stanbic Holdings of 6.7%, 5.2% and 5.0% respectively. However, NCBA Group’s NPL coverage declined by 15.1% points to 58.5% in FY’2022 from 73.6% in FY’2021, owing to a decline of 36.1% in General Loan Loss Provisions to Kshs 15.6 bn, from Kshs 24.4 bn in FY’2021, an indication of reducing credit risk in the bank loan portfolio.
Summary performance
The table below highlights the performance listed banks, showing the performance using several metrics:
|
Cytonn Report: Q1’2023 Listed Banks metrics |
|||||||||||||
|
Bank |
Core EPS Growth |
Interest Income Growth |
Interest Expense Growth |
Net Interest Income Growth |
Net Interest Margin |
Non-Funded Income Growth |
NFI to Total Operating Income |
Growth in Total Fees & Commissions |
Deposit Growth |
Growth in Government Securities |
Loan to Deposit Ratio |
Loan Growth |
Return on Average Equity |
|
HF Group |
138.9% |
8.8% |
0.7% |
18.2% |
5.0% |
63.5% |
28.9% |
(1.9%) |
5.5% |
30.4% |
91.2% |
4.6% |
3.1% |
|
DTB-K |
53.9% |
18.2% |
23.5% |
14.5% |
5.3% |
43.5% |
28.3% |
19.9% |
16.9% |
5.8% |
66.5% |
15.1% |
10.0% |
|
NCBA |
34.8% |
12.7% |
11.5% |
13.5% |
5.9% |
36.8% |
49.7% |
5.0% |
7.0% |
4.8% |
55.5% |
14.3% |
17.2% |
|
I&M |
34.3% |
12.9% |
18.0% |
9.9% |
6.3% |
45.7% |
35.7% |
20.7% |
5.3% |
(9.9%) |
76.4% |
13.3% |
15.3% |
|
ABSA |
34.2% |
27.5% |
25.9% |
27.9% |
8.2% |
17.2% |
29.7% |
0.3% |
13.0% |
0.7% |
93.4% |
21.1% |
24.3% |
|
SCBK |
34.0% |
14.3% |
6.5% |
18.1% |
7.0% |
13.5% |
34.6% |
(17.7%) |
5.1% |
10.6% |
50.0% |
10.7% |
22.1% |
|
CO-OP |
33.2% |
11.0% |
11.0% |
10.9% |
8.9% |
32.7% |
36.1% |
32.7% |
3.9% |
(5.9%) |
80.1% |
9.4% |
21.2% |
|
Stanbic |
25.7% |
31.8% |
15.2% |
31.8% |
5.9% |
23.7% |
40.9% |
(0.5%) |
19.5% |
42.9% |
87.8% |
16.4% |
15.3% |
|
KCB |
19.5% |
15.3% |
27.1% |
11.5% |
7.5% |
11.5% |
33.3% |
18.6% |
35.6% |
2.7% |
81.3% |
27.8% |
22.0% |
|
Equity |
15.1% |
26.8% |
31.7% |
25.0% |
7.2% |
34.5% |
41.1% |
26.2% |
9.7% |
(4.1%) |
67.2% |
20.2% |
26.7% |
|
FY'22 Mkt Weighted Average* |
26.5% |
20.0% |
21.6% |
19.1% |
7.2% |
26.6% |
37.5% |
13.9% |
14.0% |
3.0% |
73.0% |
18.3% |
21.9% |
|
FY'21 Mkt Weighted Average** |
82.9% |
13.8% |
11.5% |
15.2% |
7.1% |
10.9% |
34.7% |
16.6% |
13.5% |
18.1% |
69.7% |
13.5% |
20.2% |
|
*Market cap weighted as at 31/03/2023 |
|||||||||||||
|
**Market cap weighted as at 14/04/2022 |
|||||||||||||
Key take-outs from the table include;
- The listed banks recorded a 26.5% growth in core Earnings per Share (EPS) in FY’2022, compared to the weighted average growth of 82.9% in FY’2021, an indication of sustained performance despite the tough operating environment experienced in FY’2022,
- The listed Banks’ Interest income grew by 20.0% compared to the market weighted average growth of 13.8% in FY’2021. The growth in interest income is attributable to the 18.3% weighted average growth in the loan book in FY’2022 which was higher than the 13.5% growth in FY’2021. The higher loan book growth took the loan to deposit ratio to 73.0% from the 69.7% market weighted average loan to deposit ratio in FY’2021,
- Non-Funded Income grew by 26.6% compared to market weighted average growth of 10.9% in FY’2021, pointing to increased revenue diversification efforts by the banking sector, and,
The Banks recorded a deposit growth of 14.0%, higher than the market weighted average deposit growth of 13.5% in FY’2021, highlighting increased investment risk in the business environment.
Q1’2023 Highlights:
- Centum Investment Plc announced that it had terminated the Share Purchase Agreement (SPA) to sell its 83.4% stake in Sidian Bank Limited to Access Bank Plc. The termination was due to the lapse of time arising from expiry of the Long Stop Date and the two parties could not agree to extend the duration, as well as the set conditions between the two parties having not been met. For more information, please see our Cytonn Weekly #02/2023,
- The Insurance Regulatory Authority of Kenya (IRA) released the Quarterly Insurance Industry Report for the period ending 30th September 2022 highlighting that the industry’s profits after tax declined by 3.3% to Kshs 6.2 bn in Q3’2022, from Kshs 6.4 bn recorded in Q3’2021. For more information, please see our Cytonn Weekly #03/2023,
- East African Breweries Plc (EABL) released their H1’2023 financial results for the period ending 31st December 2022, recording a stagnation in the Profits After Tax (PAT) at Kshs 8.7 bn as was recorded in a similar period last year. For more information, please see our Cytonn 2023 Markets Outlook,
- Equity Group Holdings Plc, through Equity Bank Kenya Limited (EBKL) announced that it had completed the acquisition of certain assets and liabilities of Spire Bank Limited after obtaining all the required regulatory approvals. For more information, please see our Cytonn Monthly January 2023,
- The Nairobi Stock Exchange (NSE) amended the trading rules for equity securities to allow for block trades, aimed at boosting liquidity in the bourse, after receiving approval from the Capital Markets Authority (CMA). For more information, please see our Cytonn Monthly January 2023,
- The Central Bank of Kenya (CBK) released the Commercial Banks’ Credit Survey Report for the quarter ended December 2022, highlighting that the banking sector’s loan book recorded a 15.6% y/y growth, with gross loans increasing to Kshs 3.7 tn in Q4’2022, from Kshs 3.2 tn in Q4’2021. For more information, please see our Cytonn Weekly #06/2023,
- British American Tobacco Kenya Plc released their FY’2022 financial results, recording a 6.3% growth in Profits after Tax (PAT) to Kshs 6.9 bn, from Kshs 6.5 bn recorded in FY’2021, majorly attributed to the 5.5% increase in Gross Sales to Kshs 42.2 bn in FY’2022 from Kshs 40.0 bn recorded in FY’2021. For more information, please see our Cytonn Weekly #07/2023,
- The Central Bank of Kenya (CBK) announced that Premier Bank Limited Somalia (PBLS) had completed acquisition of 62.5% shareholding of First Community Bank Limited (FCB) effective 27th March 2023; For more information, please see our Cytonn Weekly #11/2023, and,
Diageo UK, through its wholly-owned indirect subsidiary Diageo Kenya, announced that it had successfully completed the partial tender offer to acquire an additional 15.0% stake in East African Breweries Plc (EABL). For more information, please see our Cytonn Weekly #12/2023.
Universe of coverage:
|
Company |
Price as at 24/03/2023 |
Price as at 31/03/2023 |
w/w change |
q/q change |
YTD Change |
Year Open 2023 |
Target Price* |
Dividend Yield |
Upside/ Downside** |
P/TBv Multiple |
Recommendation |
|
Jubilee Holdings |
150.0 |
177.0 |
18.0% |
(10.9%) |
(10.9%) |
198.8 |
305.9 |
7.9% |
80.8% |
0.3x |
Buy |
|
KCB Group*** |
35.5 |
35.5 |
0.0% |
(6.8%) |
(7.4%) |
38.4 |
52.5 |
5.6% |
53.5% |
0.6x |
Buy |
|
Britam |
4.7 |
4.7 |
(0.4%) |
(10.6%) |
(10.6%) |
5.2 |
7.1 |
0.0% |
53.1% |
0.8x |
Buy |
|
Sanlam |
9.1 |
8.2 |
(9.9%) |
(14.2%) |
(14.2%) |
9.6 |
11.9 |
0.0% |
44.9% |
0.9x |
Buy |
|
Liberty Holdings |
4.8 |
4.8 |
1.1% |
(14.1%) |
(4.6%) |
5.0 |
6.8 |
0.0% |
40.3% |
0.4x |
Buy |
|
Kenya Reinsurance |
1.8 |
1.9 |
3.8% |
3.3% |
1.1% |
1.9 |
2.5 |
5.3% |
38.1% |
0.2x |
Buy |
|
Equity Group*** |
38.7 |
45.5 |
17.7% |
2.2% |
1.0% |
45.1 |
58.4 |
8.8% |
37.0% |
1.1x |
Buy |
|
ABSA Bank*** |
11.9 |
12.8 |
7.6% |
4.1% |
4.9% |
12.2 |
15.5 |
10.5% |
31.3% |
1.1x |
Buy |
|
NCBA*** |
32.8 |
36.7 |
12.1% |
(6.7%) |
(5.8%) |
39.0 |
43.4 |
11.6% |
29.8% |
0.8x |
Buy |
|
Co-op Bank*** |
12.6 |
13.2 |
4.4% |
6.9% |
8.7% |
12.1 |
15.5 |
11.4% |
29.0% |
0.6x |
Buy |
|
CIC Group |
2.0 |
2.0 |
(0.5%) |
0.5% |
2.6% |
1.9 |
2.3 |
6.6% |
25.0% |
0.7x |
Buy |
|
Diamond Trust Bank*** |
47.8 |
51.3 |
7.3% |
2.5% |
2.8% |
49.9 |
57.1 |
9.8% |
21.2% |
0.2x |
Buy |
|
Stanbic Holdings |
109.0 |
110.0 |
0.9% |
7.8% |
7.8% |
102.0 |
112.0 |
11.5% |
13.3% |
1.0x |
Accumulate |
|
Standard Chartered*** |
167.8 |
170.0 |
1.3% |
19.1% |
17.2% |
145.0 |
166.3 |
12.9% |
10.7% |
1.2x |
Accumulate |
|
I&M Group*** |
17.1 |
20.9 |
22.3% |
22.6% |
22.3% |
17.1 |
20.8 |
10.8% |
10.6% |
0.5x |
Accumulate |
|
HF Group |
3.4 |
3.8 |
11.4% |
19.4% |
21.0% |
3.2 |
3.4 |
0.0% |
(10.0%) |
0.2x |
Sell |
|
*Target Price as per Cytonn Analyst estimates **Upside/ (Downside) is adjusted for Dividend Yield ***For Disclosure, these are stocks in which Cytonn and/or its affiliates are invested in |
|||||||||||
We are “Neutral” on the Equities markets in the short term due to the current adverse operating environment and huge foreign investor outflows, and, “Bullish” in the long term due to current cheap valuations and expected global and local economic recovery.
With the market currently trading at a discount to its future growth (PEG Ratio at 0.7x), we believe that investors should reposition towards value stocks with strong earnings growth and that are trading at discounts to their intrinsic value. We expect the current high foreign investors sell-offs to continue weighing down the equities outlook in the short term.
In Q1’2023, Kenya’s Real Estate sector recorded notable growth in terms of activity compared to the similar period in 2022, attributable to continued growth of the Kenyan economy enabling increased Real Estate property transactions. Some of the key factors that have continued to shape the performance of the Real Estate sector include:
- Implementation of various infrastructural developments by the government such as the Nairobi Expressway, with the aim of improving the country’s economic status, thereby boosting the Real Estate sector’s performance by opening up areas for development,
- Continued focus on the Affordable Housing Program (AHP) by both the government and the private sector. Currently, the AHP pipeline boasts about 25 affordable housing projects, with an estimated 47,787 housing units by the government and 50,225 housing units by the private sector under construction. This is as 200,000 housing units are targeted to be delivered per year,
- Efforts by the government to provide affordable mortgages through the Kenya Mortgage Refinance Company (KMRC) to make home ownership more accessible to Kenyans by providing long-term, low-interest home loans to potential home buyers. In 2022, KMRC refinanced 1,948 mortgage loans valued at Kshs 6.8 bn, representing a 278.0% increase from 574 home loans valued at Kshs 1.3 bn disbursed in 2021,
- Aggressive expansion efforts by local and international retailers such as Naivas, QuickMart, and Carrefour, in a bid to increase their share of the market and ensure dominance, taking up spaces previously occupied by troubled retailers such as Tuskys, Uchumi and Nakumatt,
- Recovery of the hospitality sector away from the slowdown that was caused by pandemic lockdowns and travel restrictions. This is evidenced by the number of international arrivals registering a 70.5% increase to 1,483,752 persons in 2022 compared to 870,465 persons in 2021,
- Increased popularity in Mixed Use Developments (MUDs) due to their convenience, providing a comprehensive living experience for residents while also attracting more investors through combination of residential, commercial, and retail spaces, and,
- Positive demographics evidenced by Kenya’s relatively high urbanization and population growth rates of 3.7% p.a and 1.9% p.a, respectively, against the global average of 1.6% p.a and 0.9% p.a, respectively, as at 2021, driving demand for Real Estate developments.
However, some of challenges impeding performance of the sector include;
- Constrained financing to developers, with lenders tightening their lending requirements and demanding more collateral from developers as a result of the high credit risk in the Real Estate sector. Gross loans to the industry by the banking sector came in at Kshs 475.0 bn Q4'2022, a 4.2% increase from Kshs 456.0 bn recorded in Q4'2021. However, this represents 12.9% of total banking sector loans. Additionally, there is an overreliance on banks for funding by developers in Kenya, with banks providing 95.0% of funding for construction activities as opposed to 40.0% in developed countries, leading to an underutilization of capital markets, especially in the private markets, to supplement efforts in providing housing. Further credit risk remained elevated, evidenced by the 7.5% increase in gross Non-Performing Loans (NPLs) in the sector to Kshs 80.3 bn in Q4’2022 from Kshs 74.7 bn recorded during Q4’2021,
- Rising construction costs, averaging Kshs 5,210 per SQFT in 2022, a 5.0% increase from Kshs 4,960 per SQFT recorded in 2021, attributable to price increase of key construction materials such as cement, steel, paint, aluminium and PVC which is expected to impede development activities in the sector,
- Existing oversupply of physical space in select sectors, with approximately 5.8 mn SQFT in the NMA commercial office market, approximately 3.0 mn SQFT in the NMA retail market, with the rest of the Kenyan retail market having an oversupply of approximately 1.7 mn SQFT, leading to prolonged vacancy rates in the respective Real Estate sectoral themes, and,
- Continued poor performance of the REITs market in Kenya due to lack of knowledge of the financial asset class by investors, large capital requirements of Kshs 100.0 mn for trustees which limits the role to banks, prolonged approval process for REITs, only a few entities capable of incorporating REITs, and high minimum investment amounts set at 5.0 mn discouraging investments.
Despite these limitations, the Kenyan Real Estate sector has recorded increased activities over the years, with the sector’s contribution to the country’s GDP recording a 5-year CAGR of 5.8% to Kshs 999.6 mn in 2022 from Kshs 753.4 mn in 2017, as shown below;
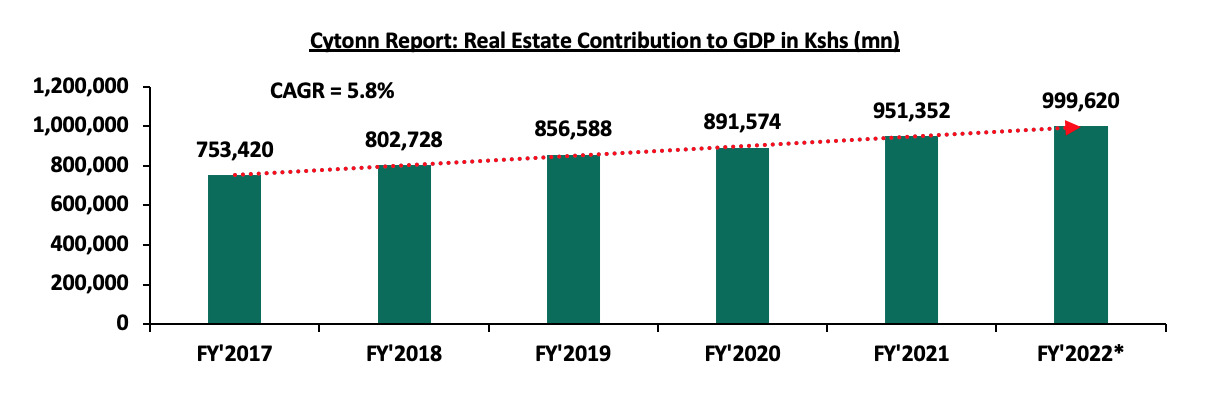
*Annualized figures
Source: Kenya National Bureau of Statistics (KNBS)
Sectoral Market Performance:
- Residential Sector
During Q1’2023, the NMA residential sector recorded an improvement in performance on a y/y basis with average y/y total returns to investors coming in at 6.1%, a 0.4% points increase from 5.7% recorded in Q1’2022. However, on a q/q basis this was a 0.1% points decline from the 6.2% average total return in FY’2022. Prices and rents in all segments of the residential market realized an increment with an overall average price appreciation of 1.1% and the average rental yield recording a 0.2% points y/y increase to 5.0% from 4.8% recorded in Q1’2022, as shown in the table below;
|
Cytonn Report: Nairobi Metropolitan Area (NMA) Residential Performance Q1’2023 |
|||||||||
|
Segment |
Average of Rental Yield Q1'2023 |
Average of Price Appreciation Q1'2023 |
Average of Total Returns Q1'2023 |
Average of Rental Yield Q1'2022 |
Average of Price Appreciation Q1'2022 |
Average of Total Returns Q1'2022 |
y/y ∆ in Rental Yield |
y/y ∆ in Price Appreciation |
y/y ∆ in Total Returns |
|
Detached Units |
|||||||||
|
High End |
4.4% |
1.4% |
5.8% |
3.9% |
1.3% |
5.2% |
0.5% |
0.1% |
0.6% |
|
Upper Middle |
4.5% |
1.1% |
5.6% |
4.2% |
1.1% |
5.3% |
0.3% |
0.0% |
0.3% |
|
Lower Middle |
5.0% |
0.9% |
5.9% |
4.5% |
1.3% |
5.8% |
0.5% |
(0.4%) |
0.1% |
|
Detached Units Average |
4.7% |
1.1% |
5.8% |
4.2% |
1.2% |
5.4% |
0.5% |
(0.1%) |
0.4% |
|
Apartments |
|||||||||
|
Upper Mid-End |
5.2% |
0.6% |
5.8% |
5.6% |
0.5% |
6.1% |
(0.4%) |
0.1% |
-0.3% |
|
Lower Mid-End Suburbs |
5.3% |
1.0% |
6.3% |
5.2% |
0.6% |
5.8% |
0.1% |
0.4% |
0.5% |
|
Lower Mid-End Satellite Towns |
5.5% |
1.5% |
7.0% |
5.4% |
0.9% |
6.3% |
0.1% |
0.6% |
0.7% |
|
Apartments Average |
5.3% |
1.1% |
6.4% |
5.4% |
0.6% |
6.0% |
(0.1%) |
0.5% |
0.4% |
|
Residential Market Average |
5.0% |
1.1% |
6.1% |
4.8% |
0.9% |
5.7% |
0.2% |
0.2% |
0.4% |
Source: Cytonn Research
- Detached Units Performance
The table below shows the NMA residential sector detached units’ performance during Q1’2023;
All values in Kshs unless stated otherwise
|
Cytonn Report: Residential Detached Units Summary Q1’2023 |
||||||||
|
Area |
Average of Price per SQM Q1'2023 |
Average of Rent per SQM Q1'2023 |
Average of Occupancy Q1'2023 |
Average of Uptake Q1'2023 |
Average of Annual Uptake Q1'2023 |
Average of Rental Yield Q1'2023 |
Average of Price Appreciation Q1'2023 |
Total Returns Q1’2023 |
|
High End |
||||||||
|
Runda |
212,650 |
828 |
95.3% |
97.0% |
10.1% |
4.6% |
1.9% |
6.5% |
|
Rosslyn |
185,171 |
850 |
90.1% |
98.2% |
15.0% |
5.0% |
1.3% |
6.3% |
|
Kitisuru |
227,130 |
810 |
94.6% |
94.9% |
11.6% |
4.7% |
1.5% |
6.2% |
|
Karen |
185,907 |
675 |
83.4% |
91.6% |
12.8% |
3.8% |
1.6% |
5.4% |
|
Lower Kabete |
152,996 |
474 |
95.6% |
89.9% |
13.0% |
3.9% |
1.2% |
5.1% |
|
Average |
192,771 |
727 |
91.8% |
94.3% |
12.5% |
4.4% |
1.4% |
5.8% |
|
Upper Middle |
||||||||
|
Ridgeways |
169,191 |
787 |
82.0% |
87.5% |
12.5% |
4.9% |
1.5% |
6.4% |
|
Redhill & Sigona |
99,463 |
448 |
84.7% |
96.4% |
14.3% |
4.8% |
1.4% |
6.2% |
|
Runda Mumwe |
152,496 |
730 |
91.2% |
92.5% |
13.6% |
5.1% |
0.9% |
6.0% |
|
Loresho |
167,449 |
708 |
80.5% |
82.5% |
13.4% |
4.7% |
1.2% |
5.9% |
|
South B/C |
112,832 |
440 |
88.1% |
86.4% |
12.7% |
4.4% |
1.2% |
5.6% |
|
Lavington |
189,218 |
622 |
87.2% |
91.6% |
12.4% |
4.0% |
0.5% |
4.5% |
|
Langata |
139,457 |
451 |
88.5% |
90.4% |
10.7% |
3.7% |
0.7% |
4.4% |
|
Average |
147,158 |
598 |
86.0% |
89.6% |
12.8% |
4.5% |
1.1% |
5.6% |
|
Lower Middle |
||||||||
|
Ruiru |
68,423 |
348 |
87.4% |
83.7% |
18.1% |
6.2% |
1.3% |
7.5% |
|
Juja |
67,415 |
295 |
86.6% |
83.6% |
16.5% |
5.8% |
0.8% |
6.6% |
|
Syokimau/Mlolongo |
75,735 |
320 |
88.8% |
90.8% |
18.5% |
4.5% |
2.0% |
6.5% |
|
Ngong |
60,676 |
305 |
90.0% |
96.3% |
12.4% |
6.3% |
0.1% |
6.4% |
|
Rongai |
81,419 |
277 |
95.6% |
96.3% |
16.4% |
4.2% |
1.5% |
5.7% |
|
Kitengela |
62,578 |
319 |
85.5% |
85.8% |
13.2% |
4.8% |
0.8% |
5.6% |
|
Athi River |
85,234 |
341 |
86.8% |
95.0% |
13.2% |
4.3% |
1.0% |
5.3% |
|
Thika |
63,642 |
304 |
83.3% |
86.9% |
13.4% |
5.0% |
0.1% |
5.1% |
|
Donholm/Komarock |
94,580 |
403 |
85.6% |
95.6% |
13.2% |
4.4% |
0.3% |
4.7% |
|
Average |
73,300 |
323 |
87.7% |
90.4% |
15.0% |
5.0% |
0.9% |
5.9% |
|
Detached Units Average |
137,743 |
550 |
88.5% |
91.5% |
13.4% |
4.7% |
1.1% |
5.8% |
Source: Cytonn Research
The key take-outs from the table include;
- Average Total Returns – The average total return came in at 5.8%, a 0.4% points increase from the 5.4% recorded in Q1’2022, with the rental yield increasing by 0.5% points to 4.7% in Q1’2023 from the 4.2% recorded in Q1’2022. The improved performance is attributable to increase in selling and rental prices per SQM to Kshs 137,743 and Kshs 550, respectively, from Kshs 136,275 and Kshs 509, respectively recorded in Q1’2022,
- Segment Performance – The best performing segment was the lower-middle segment offering an average total return of 5.9%, attributable to relatively high rental yields of 5.0%, which is driven by returns from well-performing nodes such as Ruiru, and Juja that have continued to offer relatively high returns, and,
- Nodal Performance – Overall, Ruiru was the best performing node, offering the highest returns at 7.5% attributable to relatively high rental yield of 6.2% and price y/y appreciation of 1.3%. This is driven by increased popularity by investors due to presence of key infrastructure developments, such as the Eastern Bypass and Thika Superhighway, granting easy access from Ruiru to the Nairobi CBD. Juja and Runda followed, offering investors average total returns of 6.6% and 6.5% respectively, compared to the detached units market average of 5.8%.
- Apartments Performance
The table below shows the NMA residential sector apartments’ performance during Q1’2023;
All values in Kshs unless stated otherwise
|
Cytonn Report: Residential Apartments Summary Q1’2023 |
||||||||
|
Area |
Average of Price per SQM Q1'2023 |
Average of Rent per SQM Q1'2023 |
Average of Occupancy Q1'2023 |
Average of Uptake Q1'2023 |
Average of Annual Uptake Q1'2023 |
Average of Rental Yield Q1'2023 |
Average of Price Appreciation Q1'2023 |
Total Returns Q1’2023 |
|
Upper Mid-End |
||||||||
|
Kilimani |
106,715 |
655 |
84.2% |
88.7% |
22.1% |
5.8% |
0.7% |
6.5% |
|
Westlands |
149,498 |
816 |
83.1% |
87.3% |
22.3% |
5.9% |
0.1% |
6.0% |
|
Loresho |
123,336 |
543 |
88.0% |
97.2% |
10.2% |
4.9% |
1.0% |
5.9% |
|
Upperhill |
134,566 |
744 |
81.3% |
87.9% |
11.5% |
5.0% |
0.8% |
5.8% |
|
Kileleshwa |
126,380 |
664 |
85.3% |
88.8% |
14.4% |
5.5% |
0.3% |
5.8% |
|
Parklands |
119,338 |
614 |
84.2% |
88.4% |
13.3% |
5.1% |
0.5% |
5.6% |
|
Average |
126,639 |
672 |
84.4% |
89.7% |
15.7% |
5.2% |
0.6% |
5.8% |
|
Lower Mid-End Suburbs |
||||||||
|
Imara Daima |
80,608 |
392 |
86.2% |
86.7% |
11.0% |
5.2% |
2.2% |
7.4% |
|
Kahawa West |
83,585 |
375 |
89.0% |
86.2% |
9.2% |
5.0% |
2.0% |
7.0% |
|
Langata |
102,782 |
490 |
82.8% |
88.7% |
11.5% |
4.6% |
2.3% |
6.9% |
|
RaceCourse/Lenana |
98,565 |
635 |
81.7% |
90.5% |
19.2% |
5.4% |
1.4% |
6.8% |
|
South C |
113,339 |
815 |
83.8% |
84.7% |
17.4% |
6.1% |
0.6% |
6.7% |
|
Waiyaki Way |
87,440 |
534 |
83.8% |
87.3% |
20.1% |
6.3% |
0.2% |
6.5% |
|
South B |
105,247 |
440 |
85.6% |
93.8% |
15.7% |
4.5% |
1.8% |
6.3% |
|
Donholm/Komarock |
75,827 |
389 |
92.6% |
91.4% |
12.1% |
5.6% |
0.5% |
6.1% |
|
Dagoretti |
84,514 |
535 |
88.3% |
81.2% |
14.4% |
5.9% |
(0.2%) |
5.7% |
|
Average |
92,434 |
512 |
86.0% |
87.8% |
14.5% |
5.3% |
1.0% |
6.3% |
|
Lower Mid-End Satellite Towns |
||||||||
|
Ngong |
66,960 |
367 |
84.6% |
84.8% |
12.4% |
5.3% |
2.3% |
7.6% |
|
Kitengela |
61,718 |
293 |
85.5% |
87.5% |
11.5% |
4.9% |
2.6% |
7.5% |
|
Ruaka |
108,765 |
570 |
77.1% |
83.8% |
22.1% |
5.1% |
2.1% |
7.2% |
|
Ruiru |
89,601 |
492 |
87.0% |
83.6% |
14.1% |
5.7% |
1.4% |
7.1% |
|
Thindigua |
102,208 |
501 |
84.2% |
80.2% |
15.0% |
5.1% |
1.9% |
7.0% |
|
Rongai |
93,916 |
311 |
87.5% |
76.9% |
16.4% |
5.8% |
0.7% |
6.5% |
|
Syokimau |
77,438 |
342 |
85.6% |
92.1% |
12.9% |
4.9% |
1.4% |
6.3% |
|
Athi River |
59,785 |
356 |
86.9% |
92.9% |
15.9% |
5.6% |
0.6% |
6.2% |
|
Kikuyu |
82,807 |
422 |
82.7% |
86.7% |
17.4% |
5.2% |
1.0% |
6.2% |
|
Average |
82,578 |
406 |
84.6% |
85.4% |
15.3% |
5.5% |
1.5% |
7.0% |
|
Apartments |
100,550 |
530 |
85.0% |
87.6% |
15.2% |
5.3% |
1.1% |
6.4% |
Source: Cytonn Research
The key take-outs from the table include;
- Average Total Returns – The average total return came in at 6.4%, a 0.4% points increase from the 6.0% recorded in Q1’2022. The improved performance is majorly attributable to an increase in price appreciation by 0.6% points to 1.1% in Q1’2023 from the 0.5% recorded in Q1’2022. The average rental yield reduced by 0.1% points to 5.3% from 5.4% recorded in Q1’2022, driven by a 0.8% points decline in average occupancy rates to 85.0%, from 85.8% in Q1’2022,
- Segment Performance – The best performing segment was the lower mid-end satellite towns with average total return of 7.0%, attributed to average rental yield of 5.5% and relatively high price appreciation of 1.5%. The performance of the segment is boosted by the presence of nodes such as Ngong and Kitengela which have become highly attractive for investment, and,
- Nodal Performance – Overall, the best performing node was Ngong with average rental yield of 7.6% attributable to a relatively high rental yield of 5.3% and y/y price appreciation of 2.3%. This is driven by increased popularity as a residence due to ease of access to the CBD majorly on the back of improved infrastructural development, owing to the completion of the Ngong-Lang’ata Link road. Kitengela and Imara Daima closely followed, offering investors average total returns of 7.5% and 7.4% respectively, compared to the apartments market average of 7.0%.
Weekly Highlights:
- Co-operative Bank of Kenya in partnership with KMRC introduces an affordable mortgage product
During the week, Co-operative Bank of Kenya (Co-op), in collaboration with the Kenya Mortgage Refinance Company (KMRC), introduced an affordable mortgage product with a repayment period of 15 years at an interest rate of 9.9%, 1.4% lower than the market average of 11.3% in 2021. Co-op bank has already secured Kshs 549.0 mn from KMRC which it will top up with counterpart funding to avail for onward lending to its customers. The financing plan is available to Co-op bank customers with a gross income of Kshs 150,000 either individually or combined per household, and will receive financing of up to 90.0% of property value. The loan limit for the mortgage product is capped at Kshs 6.0 mn in the Nairobi Metropolitan Area (NMA) and Kshs 5.0 mn for areas outside the NMA. Notably, the limits for the KMRC backed mortgages are still lower than the average home loan size of Kshs 9.2 mn in 2021.
We expect the partnership will be instrumental in availing affordable home loans to Kenyans which have remained out of the reach of many citizens as a result of; i) high property prices and land costs that translate to high purchasing costs which are higher than the affordable housing loan limits, ii) low income levels hampering the ability to service loans, and, iii) limited access to affordable long term funding. With increasing partnerships being witnessed between KMRC and commercial banks such as Co-op bank and NCBA, we expect that home ownership rates in the country will improve. Currently, the Kenyan housing market is characterized by low ownership rates, especially in urban areas coming in at 22.0%, as at 2021 as shown below;
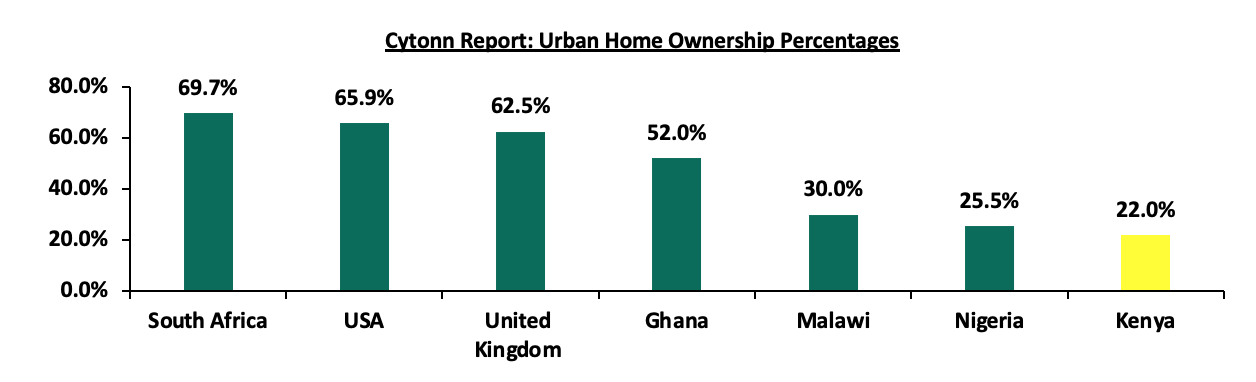
Source: Centre for Affordable Housing Africa, US Census Bureau, UK Office for National Statistics
KMRC’s primary objective to provide affordable home loans to Kenyans through the provision of long term funding to Primary Mortgage Lenders (PMLs) is aligned with the government’s affordable housing agenda and is key in pushing for increased home ownership in the country, as well as increasing mortgage uptake. KMRC has considerably grown its loan portfolio to Kshs 6.8 bn in 2022, from Kshs 1.3 bn disbursed in 2021 when it began its lending operations, refinancing approximately 1,948 loans in 2022 from 574 loans refinanced in 2021. However notwithstanding KMRC’s efforts, Kenya’s mortgage to GDP continues to underperform at 1.9% as shown below compared to countries such as South Africa and Rwanda approximately at 16.3% and 4.2% respectively;
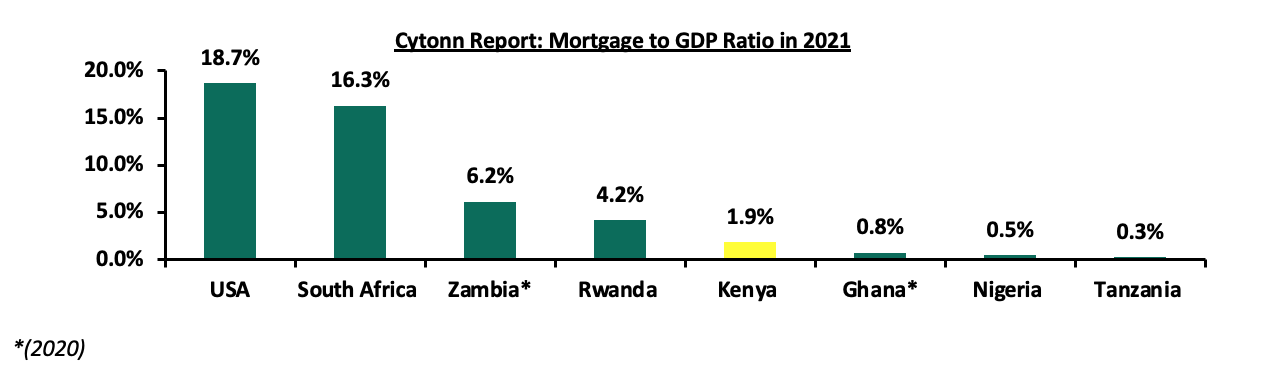
Source: Centre for Affordable Housing Africa
We expect to continue witnessing more partnerships between commercial banks and KMRC in efforts to; i) make mortgages more affordable to Kenyans, ii) improve home ownership rates in the country, and, ii) curb the existing housing deficit currently standing at 80.0%.
- Stima Investments Co-operative Society launched construction of Stima Heights in Ngara, Nairobi
During the week, Stima Investments Co-operative Society broke ground for the construction of Stima Heights, a Kshs 1.2 bn ultra-modern affordable housing project located in Ngara West, Nairobi County. The project is situated on a quarter acre piece of land along Kolobot road, and will comprise of; i) 216 studio units and 234 one bedroom units set within 20 storeys, ii) a mini commercial centre and parking spaces. The project is expected to be completed within 24 months from construction start date. Other notable projects currently being undertaken by Stima Sacco include; Stima Investments Plaza I and II, Stima Sacco Plaza, Stima Hotel in Ngara, Juja Ridges, Kathwana in Tharaka Nithi county, and Malindi Greens. The table below highlights important project particulars;
|
Cytonn Report: Stima Heights, Ngara, Nairobi County |
|||
|
Typology |
Plinth Area (SQM) |
Price |
Price per SQM |
|
Studio |
18 |
1,950,000 |
108,3331 |
|
One Bedroom |
33 |
3,950,000 |
121,5381 |
|
Average |
25 |
2,950,000 |
114,936 |
Source: Stima Sacco Investments Society
In addition to the above, there also exists several projects initiated by private developers to fast-track the delivery of housing projects through the program such as;
|
Cytonn Report: Notable Ongoing Affordable Housing Projects by the Private Sector |
||||
|
Name |
Developer |
Location |
Launch Date |
Number of Units |
|
Great Wall Gardens Phase 5 |
Erdemann Limited |
Mavoko, Machakos County |
December 2022 |
1,128 |
|
Samara Estate |
Skymore Pine Limited |
Ruiru |
July 2020 |
1,824 |
|
Moke Gardens |
Moke Gardens Real Estate |
Athi River |
October 2021 |
30,000 |
|
Habitat Heights |
Afra Holding Limited |
Mavoko |
December 2019 |
8,888 |
|
Tsavo Apartments Projects |
Tsavo Real Estate |
Embakasi, Riruta, Thindigua, Roysambu, and, Rongai |
October 2020 |
3,200 |
|
Unity West |
Unity Homes |
Tatu City |
November 2021 |
3,000 |
|
RiverView |
Karibu Homes |
Athi River |
October 2020 |
561 |
|
Kings Serenity |
Kings Developers Limited |
Ongata Rongai, Kajiado County |
October 2022 |
734 |
|
Joinven Estate |
Joinven Investments Limited |
Syokimau, Machakos County |
December 2022 |
440 |
|
Stima Heights |
Stima SACCO |
Ngara West, Nairobi County |
March 20223 |
450 |
|
Total |
|
|
50,225 |
|
Source: Boma Yangu
We expect; i) to see more affordable housing projects being launched by private sector players in line with the government’s affordable housing agenda, ii) the project will help bridge the existing housing deficit, iii) promote urban home ownership rates which have remained low at 22.0%.
For notable highlights during the quarter, please see our Cytonn Monthly - January 2023 and Cytonn Monthly - February 2023. For the month of March;
- NCBA Bank Kenya, a local commercial bank, announced a partnership with state-backed financier, Kenya Mortgage Refinancing Company (KMRC) for an initiative to provide low-cost mortgages starting from an interest rate of 9.5%, which is 1.8% points lower than the market average of 11.3% in 2021. For more information, see Cytonn Weekly #12/2023, and,
- President William Ruto presided over the ground breaking of 6,704 Affordable Housing units situated on 22.4 acre parcels of land in Ziwani, Starehe. For more information, see Cytonn Weekly #10/2023.
Our outlook on the Residential sector is NEUTRAL as we as we expect the demand for housing to grow boosted by infrastructural development and positive demographics as the government and private sector continue launching affordable housing projects and availing long-term sustainable loans through the KMRC. However, the sector’s performance continues to be weighed down by factors such as; i) low penetration of mortgages, ii) increase in costs of construction materials leading to slowdown of development activities, and, iv) reduced disposable income amongst Kenyans in the midst of tough economic times which may affect rental rates.
- Commercial Office Sector
The table below highlights the performance of the Nairobi Metropolitan Area (NMA) Commercial Office sector from Q1’2022 to Q1’2023;
|
Cytonn Report: Nairobi Metropolitan Area (NMA) Commercial Office Performance Q1’2022 – Q1’2023 |
||||||
|
Year |
Q1'2022 |
H1'2022 |
Q3'2022 |
FY'2022 |
Q1'2023 |
Y/Y 2023 ∆ |
|
Occupancy % |
77.9% |
77.9% |
78.2% |
79.4% |
79.8% |
1.9% |
|
Asking Rents (Kshs/SQFT) |
94 |
95 |
96 |
96 |
97 |
3.2% |
|
Average Prices (Kshs/SQFT) |
12,113 |
12,142 |
12,221 |
12,223 |
12,238 |
1.0% |
|
Average Rental Yields (%) |
7.3% |
7.4% |
7.4% |
7.6% |
7.6% |
0.3% |
Source: Cytonn Research
The key take-outs from the table include;
- Average Asking Rents – In Q1’2023, average asking rents per SQFT in the NMA increased by 3.2% to Kshs 97 from Kshs 94 per SQFT recorded in Q1’2022, owing to increased supply of Grade A offices fetching higher rents such as Karen Green, The Piano, The Cube, TDB Towers among others,
- Average Occupancy Rate – The overall occupancy rates in Q1’2023 increased by 1.9% points to 79.8% from 77.9% realized in Q1’2022 as a result of; i) gradual rise in demand for physical space following the resumption of working from office policies by most companies post COVID-19, ii) expansion strategy by various firms such as Call Centre International (CCI) Group and Nairobi Garage which boosted occupancies, and, iii) no major developments entered the market in Q1’2023 allowing for absorption rates to stabilize thereby boosting occupancy rates, and,
- Average Rental Yields – The average rental yields improved by a 0.3% points increase to 7.6% in Q1’2023 from 7.3% recorded in Q1’2022, due to improved asking rents and occupancy rates.
For the submarket performance, Gigiri, Westlands and Karen were the best performing nodes realizing average rental yields of 8.7%, 8.4% and 8.3% respectively in Q1’2023 compared to the market average of 7.6%. The remarkable performance realized by these locations is attributable to; i) the presence of well-developed infrastructure and amenities enhancing investments, ii) high concentration of top-quality office spaces commanding premium rental rates thus resulting in attractive yields for investors, iii) sustained demand for quality office spaces supported by the presence of international organizations, multinational companies and embassies in the areas, iv) serene environment providing excellent office locations away from the hustle and bustle of the city centre, and, v) ease of accessibility of these areas which has made them popular choices for businesses. Conversely, Mombasa Road was the least performing node with an average rental yield of 5.2%, 2.4% points lower than the market average of 7.6%. This was attributed to; i) low quality offices which attract low average rents at Kshs 73 per SQFT, ii) its recognition as an industrial area thus making it less attractive to office businesses and, iii) stiff competition from other sub-markets. The table below shows the Nairobi Metropolitan Area (NMA) sub-market performance;
All values in Kshs unless stated otherwise
|
Cytonn Report: Nairobi Metropolitan Area Commercial Office Market Performance Q1’2022/Q1’2023 |
|||||||||||
|
Area |
Price Kshs/ SQFT Q1’2023 |
Rent Kshs/ SQFT Q1’2023 |
Occupancy Q1’ 2023(%) |
Rental Yields Q1 2023(%) |
Price Kshs/ SQFT Q1’2022 |
Rent Kshs/ SQFT Q1’2022 |
Occupancy Q1’2022 (%) |
Rental Yields Q1 2022(%) |
∆ in Rent |
∆ in Occupancy (% points) |
∆ in Rental Yields (% points) |
|
Gigiri |
13,500 |
118 |
81.6% |
8.7% |
13,500 |
118 |
83.3% |
8.8% |
0.4% |
(1.7%) |
(0.1%) |
|
Westlands |
12,032 |
108 |
77.2% |
8.4% |
11,846 |
105 |
74.5% |
8.1% |
2.8% |
2.7% |
0.2% |
|
Karen |
13,431 |
111 |
82.9% |
8.3% |
13,325 |
107 |
82.8% |
7.8% |
3.8% |
0.1% |
0.5% |
|
Kilimani |
12,260 |
93 |
84.1% |
7.8% |
12,440 |
91 |
80.2% |
7.1% |
2.9% |
3.9% |
0.7% |
|
Parklands |
11,662 |
91 |
82.2% |
7.8% |
11,562 |
91 |
82.8% |
7.7% |
0.0% |
(0.6%) |
0.0% |
|
Nairobi CBD |
11,971 |
83 |
85.3% |
7.2% |
11,863 |
82 |
83.8% |
6.9% |
1.4% |
1.4% |
0.3% |
|
Upperhill |
12,605 |
97 |
76.6% |
7.0% |
12,409 |
94 |
76.1% |
6.9% |
2.7% |
0.4% |
0.1% |
|
Thika Road |
12,571 |
79 |
80.3% |
6.0% |
12,571 |
78 |
77.6% |
5.7% |
1.4% |
2.7% |
0.3% |
|
Mombasa Road |
11,325 |
71 |
67.0% |
5.2% |
11,250 |
73 |
64.6% |
5.1% |
(2.5%) |
2.4% |
0.1% |
|
Average |
12,238 |
97 |
79.8% |
7.6% |
12,113 |
94 |
77.9% |
7.3% |
2.2% |
1.9% |
0.4% |
Source: Cytonn Research
Notable highlights during Q1’2023 include;
- JP Morgan Chase & Co, an American-based international investment bank, through State House Nairobi, announced plans to open its regional office in Nairobi, Kenya, serving as a central hub for its operations in the East African region with existing footprints in Nigeria and South Africa. For more information, see our Cytonn Weekly #08/2023,
- Commonwealth Enterprise and Investment Council (CWEIC), Commonwealth’s official business networking organization, opened its regional office in Nairobi, Kenya. For more information, see our Cytonn Weekly #08/2023, and,
- Cytonn released its Nairobi Metropolitan Area (NMA) Commercial Office Report 2023 which highlighted that the office market realized a 0.3% points improvement in its overall performance in 2022, with the average rental yields for the un-serviced office spaces coming in at 7.6%, compared to the 7.3% recorded in 2021. For serviced offices, the average Y/Y rental growth came in at 2.0%, with Westlands being the best performing node. For more information, click here.
We have a NEUTRAL outlook for the NMA commercial office sector whose performance is supported by; i) the gaining traction in co-working spaces, ii) reduced developments in the pipeline which we expect will help curb the oversupply challenge by allowing room for the absorption of available and fewer incoming spaces, and, iii) gradual rise in demand for physical space following the resumption of work from office policies by most companies. However, the existing oversupply of office spaces at 5.8 mn SQFT in the NMA is expected to weigh down optimum performance of the sector by stifling the overall demand for physical space.
- Retail Sector
The table below shows the performance of the retail sector performance in Nairobi Metropolitan Area from Q1’2022 to Q1’2023;
|
Cytonn Report: Nairobi Metropolitan Area (NMA) Retail Performance Q1’2022 – Q1’2023 |
||||||
|
Year |
Q1'2022 |
H1'2022 |
Q3'2022 |
FY'2022 |
Q1'2023 |
Y/Y 2023 ∆ |
|
Average Asking Rents (Kshs/SQFT) |
170 |
173 |
171 |
174 |
176 |
3.0% |
|
Average Occupancy (%) |
77.2% |
75.9% |
76.1% |
77.6% |
78.0% |
0.8% |
|
Average Rental Yields |
7.9% |
7.8% |
7.6% |
7.9% |
8.0% |
0.1% |
|
Average Asking Rents (Kshs/SQFT) |
170 |
173 |
171 |
174 |
176 |
3.0% |
Source: Cytonn Research
The key take-outs from the table include;
- Average Occupancy Rate – The average occupancy rates came in at 78.0%, a 0.8% points increase from 77.2% recorded in Q1’2022. The positive growth is attributed to; i) continuous expansion by local and foreign retailers such as Naivas, Optica Limited, Kentucky Fried Chicken (KFC), Cleanshelf, Chicken and Pizza Inn, Chandarana Food plus, QuickMart, and Carrefour over the period, ii) an improved business environment following the peaceful election season and continuous gradual recovery of the economy in the post COVID-19 era, iii) positive demographics which continues to sustain demand for consumable goods and services hence triggering expansion by several retailers, and, iv), continuous improvement of infrastructure developments enhancing accessibility to retail centres and opening up other regions in NMA for newer opportunities,
- Asking Rents – The average asking rents per SQFT increased by 3.0% to Kshs 176 in Q1’2023 from Kshs 170 recorded in Q1’2022, driven by an increased presence of quality retail spaces which fetch higher rents in several nodes of NMA such as Karen, Kilimani, Westlands, and, along Kiambu and Limuru roads. Retail spaces in the aforementioned nodes of NMA have become a magnet for multinational businesses, owing to their close proximity to several embassies and multinational organizations whose clients prefer shopping in such malls. Consequently, the rents charged for these spaces are higher, being quoted in dollars. This, coupled with the ongoing depreciation of the Kenyan shilling against the US dollar, has led to a noticeable increase in rental prices over the period, and
- Average Rental Yield – The average rental yield for the NMA retail sector improved by 0.1% points to 8.0% in Q1’2023, from 7.9% in Q1’2022 attributed to improved rental yields and occupancy rates.
Regarding sub-market performance, Kilimani, Karen, and Westlands stood out as the best performing nodes with average rental yields of 9.8%, 9.5%, and 8.9% respectively, surpassing other nodes. This exceptional performance is attributed to the availability of high-quality retail spaces that command high rents, as well as the presence of quality infrastructure services in those areas. Conversely, Eastlands registered the least average rental yield of 5.9% due to; i) lower rents of Kshs 127 per SQFT, as compared to the market average of Kshs 176 per SQFT, ii) poor quality infrastructure which is unsustainable for the retail spaces and hindering sufficient accessibility, iii) heavy presence of informal retail spaces causing stiff competition due to their cheaper rates, and, iv) relatively low demand shown by a low occupancy rate of 75.1%, compared to the market average of 78.0%. The table below shows the submarket performance of nodes in the Nairobi Metropolitan Area (NMA) Q1’2023;
All values in Kshs unless stated otherwise
|
Cytonn Report: Nairobi Metropolitan Area Retail Market Performance Q1’2023 |
|||||||||
|
Area |
Rent Kshs /SQFT Q1’2023 |
Occupancy% Q1’2023 |
Rental Yield Q1’2023 |
Rent Kshs /SQFT Q1’2022 |
Occupancy% Q1’2022 |
Rental Yield Q1’2022 |
∆ in Rental Rates |
∆ in Occupancy (% points) |
∆ in Rental Yield (% points) |
|
Kilimani |
187 |
84.2% |
9.8% |
183 |
86.8% |
9.9% |
1.9% |
(2.6%) |
(0.1)% |
|
Karen |
216 |
80.6% |
9.5% |
200 |
85.0% |
10.0% |
7.7% |
(4.4)% |
(0.5)% |
|
Westlands |
215 |
76.6% |
8.9% |
214 |
72.9% |
9.5% |
0.2% |
3.8% |
(0.6)% |
|
Kiambu road & Limuru Road |
202 |
72.8% |
8.6% |
179 |
77.6% |
8.1% |
12.9% |
(4.8)% |
0.5% |
|
Ngong Road |
170 |
81.0% |
7.8% |
164 |
81.0% |
8.3% |
3.4% |
0.0% |
(0.5)% |
|
Mombasa road |
154 |
79.4% |
7.4% |
146 |
78.6% |
7.0% |
5.4% |
0.8% |
0.4% |
|
Thika Road |
165 |
78.7% |
7.3% |
156 |
74.2% |
6.6% |
5.9% |
4.5% |
0.7% |
|
Satellite towns |
134 |
74.6% |
6.2% |
145 |
70.8% |
6.2% |
(7.3)% |
3.8% |
0.0% |
|
Eastlands |
127 |
75.1% |
5.9% |
131 |
73.0% |
5.8% |
(3.1)% |
2.1% |
0.1% |
|
Average |
176 |
78.0% |
8.0% |
170 |
77.2% |
7.9% |
3.0% |
0.8% |
0.1% |
Source: Cytonn Research
Weekly Highlights:
- Grit acquired an additional 50.0% ownership stake in Buffalo mall located in Naivasha
During the week, Grit Real Estate Income Group, a Mauritius based Real Estate Investment company which holds income producing Real Estate assets across twelve territories in Africa, acquired an additional 50.0% ownership stake in Buffalo mall located in Naivasha. The deal which was valued at Kshs 262.8 mn gave Grit full ownership of the retail facility and brought the investment company’s ownership stake to 100.0%. The move follows Grit’s laid out capital commitment to acquire the remaining ownership stake of the mall which it disclosed in its H1’2022 financial report. As at close of 2022, Grit held a 50.0% percent stake, valued at Kshs 762.1 mn, which it had acquired in April 2016. This however, was a significant decline from the stake’s acquisition price of Kshs 827.8 mn in 2016. The decline was attributed to; i) tough operating conditions for retail space owners in the country, occasioned by increased competition from similar facilities, ii) curtailed demand for physical retail space on the back of the covid-19 pandemic which reduced consumer spending power, and, iii) fast paced growth of e-commerce instigated by social distancing measures in light of the onset of the pandemic. Other notable assets held by Grit in Kenya include; Imperial warehouse, Orbit Africa warehouse, Rosslyn Grove and Eneo at Tatu City. The acquisition coupled with Grit’s decision to establish a fully-fledged Kenyan office to serve its growing portfolio of assets is indicative of Kenya’s growing importance to Grit’s local market, accounting for 11.1% of its value of income producing assets in Africa valued at Kshs 12.1 bn (USD 92.5 mn).
We expect Kenya’s retail industry to continue realizing growth supported by increased foreign investments in the country, and continued recognition of Kenya as an economic hub in the region.
- Quickmart Supermarket opened a new outlet located at Basic Kileleshwa, along Mandera road
During the week, Quickmart Supermarket opened a new outlet located at Basic Kileleshwa, along Mandera road. The move by the retailer brings the number of Quickmart’s operating outlets countrywide to 57. The retailer’s decision to set up an outlet in Kileleshwa is part of its aggressive expansion strategy, aimed at stamping its market dominance, and increasing its competitive edge against other retailers such as Naivas, and Carrefour. Notably, Quickmart Supermarket is the first of the major retailers in the country to enter the retail market in Kileleshwa, with the area initially being serviced by convenience stores and mini-marts. Moreover, this development coincides with gaps left by retailers such as Nakumatt and Uchumi Supermarkets that exited the market, and especially comes at a time where the formal retail penetration in Kenya is low, standing at 30.0% as at 2018.
The table below shows the number of stores operated by key local and international retail supermarket chains in Kenya;
|
Cytonn Report: Main Local and International Retail Supermarket Chains |
|||||||||||
|
Name of retailer |
Category |
Branches as at FY’2018 |
Branches as at FY’2019 |
Branches as at FY’2020 |
Branches as at FY’2021 |
Branches as at FY’2022 |
Branches opened in 2023 |
Closed branches |
Current branches |
Branches expected to be opened |
Projected branches FY’2023 |
|
Naivas |
Local |
46 |
61 |
69 |
79 |
91 |
0 |
0 |
91 |
0 |
91 |
|
Quick Mart |
Local |
10 |
29 |
37 |
48 |
55 |
2 |
0 |
57 |
0 |
57 |
|
Chandarana |
Local |
14 |
19 |
20 |
23 |
26 |
0 |
0 |
26 |
0 |
26 |
|
Carrefour |
International |
6 |
7 |
9 |
16 |
19 |
0 |
0 |
19 |
0 |
19 |
|
Cleanshelf |
Local |
9 |
10 |
11 |
12 |
12 |
1 |
0 |
13 |
0 |
13 |
|
Tuskys |
Local |
53 |
64 |
64 |
6 |
6 |
0 |
59 |
5 |
0 |
5 |
|
Game Stores |
International |
2 |
2 |
3 |
3 |
0 |
0 |
3 |
0 |
0 |
0 |
|
Uchumi |
Local |
37 |
37 |
37 |
2 |
2 |
0 |
35 |
2 |
0 |
2 |
|
Choppies |
International |
13 |
15 |
15 |
0 |
0 |
0 |
15 |
0 |
0 |
0 |
|
Shoprite |
International |
2 |
4 |
4 |
0 |
0 |
0 |
4 |
0 |
0 |
0 |
|
Nakumatt |
Local |
65 |
65 |
65 |
0 |
0 |
0 |
65 |
0 |
0 |
0 |
|
Total |
|
257 |
313 |
334 |
189 |
211 |
3 |
183 |
213 |
0 |
213 |
Source: Cytonn Research
For notable highlights during the quarter please see our Cytonn Monthly - February 2023 report. For the month of March;
- Tuskys Supermarket announced the closure of Tuskys Karasha branch located along Kenyatta Avenue in the Central Business District (CBD), Nairobi. This has brought down the number of the retailers operating outlets countrywide to five; Tuskys Imara, Tuskys Athi River where its headquarters are located, Tuskys Buruburu, Tuskys Ongata Rongai, and Tuskys Oltalet Narok located in Oltalet Mall. Notably, Tuskys Imara branch along Tom Mboya is the last remaining of the retailer’s outlets in the CBD. For more information, see Cytonn Weekly #10/2023.
We have a NEUTRAL outlook on the performance of retail sector as we anticipate that the sector will be influenced by various factors. On the positive side, growth and expansion efforts by both local and international retailers, increased infrastructure development enhancing accessibility, and positive demographics supporting demand for space, goods, and services are expected to drive performance. On the negative side, the oversupply of retail space in the NMA and Kenyan retail sectors (excluding NMA) at approximately 3.0 mn and 1.7 mn SQFT respectively, the ongoing closure of retail spaces by exiting retailers, and the rapid growth of e-commerce, which could limit the optimal utilization of physical retail spaces, may hinder the optimum performance of the sector.
- Hospitality Sector
During Q1’2022, one Industry Report related to the Hospitality sector was released, namely;
|
Cytonn Report: Released Industry Report related to Hospitality Sector Q1’2023 |
||
|
# |
Report |
Key Take-outs |
|
1 |
Annual Tourism Sector Performance Report - 2022 by the Tourism Research Institute (TRI) |
|
Weekly Highlights:
During the week, Henley and Partners Real Estate, an international leading agency which offers premium properties in countries that host residence and citizenship by investment programs, published its Africa Wealth Report 2023 which gave key insights into the African luxury tourism market. Citizenship by investment programs are contemporary schemes that provide families and high-net-worth individuals, whose wealth is in excess of Kshs 132.3 mn (USD 1.0 mn), the privilege of acquiring an alternative citizenship, which in turn gives them the right to travel freely to various destinations and to settle in another country. Similarly, residence by investment programs, also referred to as golden visa programs, enable affluent individuals to choose to relocate and enjoy the privilege of residing, working, studying, and accessing healthcare in their new country of residence. The main key take-outs from the report include;
- Kenya ranks 9 on the list of Africa’s top 20 passports, with a visa free score of 72, allowing 32.2% visa free access to the world’s destinations, followed by Tanzania ranking 10th with a score of 71. Kenya and Tanzania were the only East African countries among the top ten countries,
- Kenya is among the top 5 wealthiest markets in Africa, in terms of resident high-net-worth individuals alongside South Africa, Egypt, Nigeria and Morocco. Together, they account for 56.0% of Africa’s high net individuals and over 90.0% of the continent’s billionaires, and,
- Two safari lodges in Kenya were among the ten most sought-out safari lodges by high net individuals in Africa namely; Cottars 1920 Camp located in Olderkesi conservancy, Maasai Mara and, Beyond Bateleur Camp situated in Kichwa Tembo private concession which neighbors the Maasai Mara.
The table below shows a list of the top ten most preferred lodges by high net individuals in Africa;
|
Cytonn Report: List of Top Ten Preferred Safari Lodges in Africa |
||
|
# |
Safari Lodge |
Country |
|
1 |
Singita Ebony Lodge |
South Africa |
|
2 |
Londolozi |
South Africa |
|
3 |
Sanctuary Chief’s Camp |
Bostwana |
|
4 |
Cottars 1920 Camp |
Kenya |
|
5 |
Wilderness Damaraland Camp |
Namibia |
|
6 |
Singita Sabora Tented Camp |
Tanzania |
|
7 |
One&Only Nyungwe House |
Rwanda |
|
8 |
Sanctuary Gorilla Forest Camp |
Uganda |
|
9 |
Xigera Safari Lodge |
Bostwana |
|
10 |
Beyond Bateleur Camp |
Kenya |
Source: Africa Wealth Report 2023
We expect Kenya’s tourism market to be supported by the continued recognition of Kenya’s tourism positioning the country as a vibrant tourism market, intensive and aggressive marketing by both the ministry of Tourism and Kenya Tourism Board through platforms such as Magical Kenya, and, anticipated increased international arrivals.
Notable highlights during Q1’2023 include;
- Dusit International, a Bangkok based Thai Hotel and property development company announced plans to open a hotel-serviced apartment in Westlands Nairobi in 2023 dubbed ‘Dusit Princes Hotel Residences’, along Mimosa Lane off Church Road. The upper-middle class property will consist of a hybrid of 56 one bedroom and 30 studio apartments and 14 deluxe hotel rooms. Other facilities at the property will include; an Italian inspire restaurant dubbed ‘The Olive Restaurant’, a rooftop bar dubbed ‘The Aviary Lounge’, heated swimming pool, rooftop gym, and a 150 guest capacity theatre-styled meeting room. For more information, see our Cytonn Weekly #08/2023.
We have a NEUTRAL outlook for the sector as we expect the hospitality sector’s performance to continue on an upward trajectory moving forward in terms of overall hotels in operations, hotel bookings, and hotel occupancies. We expect performance to be supported by factors such as: i) intensive and ambitious marketing of Kenya’s tourism market by the Ministry of Tourism in collaboration with the Kenya Tourism Board, through platforms such as Magical Kenya, ii) concerted efforts to promote local tourism highlighted under the Ministry of Tourism Strategy 2021-2025, and, iii) increased business events, conferences, and meetings from the public and private sectors owing to the revamp of the economy during the post-COVID-19 and electioneering periods. However, the recent issuance of travel advisories regarding insecurity in certain regions of the country by the United Kingdom (UK), United States of America (USA), Irish, and Canadian governments in February 2023 and the current government’s austerity measures to indefinitely suspend hotel meetings, conferences and trainings by Ministries, Departments and Agencies (MDAs) will curtail optimum performance of the sector.
- Land Sector
The Nairobi Metropolitan Area (NMA) land sector remained resilient in Q3’2022, recording a capital appreciation of 5.7% to Kshs 130.4 mn per acre, from Kshs 129.6 mn per acre realized in Q1’2022;
- Positive demographics driving demand for land facilitated by high population and urbanization growth rates of 1.9% and 3.7%, above the global averages of 0.9% and 1.6% respectively,
- Improved development of infrastructure such as roads, railways, water and sewer lines which has improved and opened up areas for investment, ultimately increasing property prices,
- Increased construction activities particularly in the residential sector driven by the government’s affordable housing agenda thus boosting demand for land, and,
- Limited supply of land especially in urban areas which has contributed to rising land prices,
- Rising middle income class population with more disposable income to invest, and,
- Land is the most preferred choice of investment among a majority of people which further drives up demand for land.
Overall Performance – Un-serviced land in the satellite towns of Nairobi recorded the highest y/y capital appreciation of 14.2% mainly due to; i) their affordability which entices both buyers and investors. Average asking land prices per acre for un-serviced land in satellite towns came in at Kshs 14.5 mn, compared to Kshs 403.4 mn per acre in Nairobi suburbs, ii) enhanced accessibility to the areas owing to infrastructure boost through projects such as the Nairobi Expressway and expanded Eastern Bypass, that equally unlocked value for investors in areas such as Syokimau and Utawala, and, iii) a high number of affordable housing development projects in the areas compared to other NMA regions, further increasing demand for land. The table below shows the overall performance of the sector across all land sub-sectors during Q1’2023;
All values in Kshs unless stated otherwise
|
Cytonn Report: Summary of the Performance Across All regions Q1’2022/Q1’2023 |
|||
|
Q1'2022 |
Q1'2023 |
Annualized Capital Appreciation |
|
|
Un-serviced land - Satellite Towns |
12.5 mn |
14.5 mn |
14.2% |
|
Serviced Land - Satelllite Towns |
16.5 mn |
18.1 mn |
9.3% |
|
Nairobi High End Suburbs (Low and High Rise Areas) |
127.2 mn |
136.4 mn |
8.0% |
|
Nairobi Middle End Suburbs- High Rise Residential Areas |
81.7 mn |
79.4 mn |
(1.5%) |
|
Nairobi Suburbs- Commercial Areas |
410.1 mn |
403.4 mn |
(1.7%) |
|
Average |
129.6 mn |
130.4 mn |
5.7% |
Source: Cytonn Research
Sub-markets Performance – For satellite towns, Syokimau, Juja and Utawala were the best performing nodes with y/y capital appreciations of 24.7%, 20.3% and 19.3% respectively, owing to: i) improved infrastructural developments such as the Nairobi Expressway, Juja Farm Road and Eastern Bypass which have opened up new areas for investment, subsequently driving up land prices, ii) reduced commute time owing to infrastructural boosts benefitting homebuyers seeking to settle away from the city, and, iii) a high presence of higher learning institutions within Juja Sub-County, such as Jomo Kenyatta and Zetech Universities, which have exacerbated the demand for land for development of student housing.
For Nairobi suburbs, Ridgeways recorded the highest y/y appreciation from Q1’2022 at 12.8% due to; i) its strategic central location as it is linked by Thika Superhighway, Kiambu and Limuru roads making it easily accessible and convenient, ii) a large population of affluent residents with higher purchasing power and disposable incomes, iii) ample security ensured by its proximity to Muthaiga Police station, iv) serene environment appealing to high end buyers, vi) proximity to social amenities such as Ridgeways mall, Two Rivers malls and international primary and higher learning institutions such as Braeburn which makes it ideal for family buyers, and v) relatively lower land costs at Kshs 83.7 mn per acre, providing buyers and residents similar quality of lifestyle as in neighbouring surburbs such as Kitisuru, that recorded higher average land asking prices per acre of Kshs 97.4 mn.
Land in Nairobi Surburbs Commercial Zones recorded a 1.7% price correction attributed to; i) declined demand owing to high land prices, with the average asking prices per acre coming in at Kshs 403.4 mn, which is 209.0% higher than the market average of Kshs 130.4 mn, and, ii) increasing congestion occasioning frequent traffic snarl-ups that make the areas often inconvenient and difficult to access. Additionally, land in Dagoretti recorded the highest decline in prices at 14.1%, attributed to declining demand due to high land costs, with prices per acre in Dagoretti coming it at Kshs 85.7 mn, 7.9% higher than the market average for middle end suburbs averaging at Kshs 79.4 mn per acre. This in turns has made alternative neighbourhoods such as Embakasi and Kasarani more attractive to buyers. The table below shows NMA’s land performance by submarkets in Q1’2023;
Price in Kshs per Acre
|
Cytonn Report: Nairobi Metropolitan Area Land Performance By Submarkets – Q1’2022/Q1’2023 |
|||
|
Location |
Price Q1'2022 |
Price Q1'2023 |
Capital Appreciation |
|
Satellite Towns - Unserviced Land |
|||
|
Juja |
12.0 mn |
14.5 mn |
20.3% |
|
Utawala |
14.0 mn |
16.7 mn |
19.3% |
|
Limuru |
19.1 mn |
22.3 mn |
16.4% |
|
Rongai |
13.0 mn |
14.6 mn |
12.1% |
|
Athi River |
4.3 mn |
4.4 mn |
2.8% |
|
Average |
12.5 mn |
14.5 mn |
14.2% |
|
Satellite Towns - Serviced Land |
|||
|
Syokimau |
14.5 mn |
18.1 mn |
24.7% |
|
Ruiru & Juja |
23.6 mn |
26.5 mn |
12.2% |
|
Rongai |
18.3 mn |
19.1 mn |
4.3% |
|
Athi River |
14.0 mn |
14.4 mn |
3.1% |
|
Ruai |
12.2 mn |
12.5 mn |
2.3% |
|
Average |
16.5 mn |
18.1 mn |
9.3% |
|
Nairobi High End Suburbs (Low and High Rise Areas) |
|||
|
Ridgeways |
74.1 mn |
83.7 mn |
12.8% |
|
Spring Valley |
164.8 mn |
179.7 mn |
9.0% |
|
Kitisuru |
90.3 mn |
97.4 mn |
7.9% |
|
Runda |
77.8 mn |
83.7 mn |
7.6% |
|
Karen |
60.8 mn |
64.5 mn |
6.1% |
|
Kileleshwa |
295.4 mn |
309.5 mn |
4.8% |
|
Average |
127.2 mn |
136.4 mn |
8.0% |
|
Nairobi Middle End Suburbs – High Rise Residential Areas |
|||
|
Embakasi |
74.9 mn |
78.8 mn |
5.2% |
|
Kasarani |
70.6 mn |
73.7 mn |
4.5% |
|
Dagoretti |
99.7 mn |
85.7 mn |
(14.1%) |
|
Average |
81.7 mn |
79.4 mn |
(1.5%) |
|
Nairobi Suburbs - Commercial Zones |
|||
|
Upperhill |
483.1 mn |
479.4 mn |
(0.8%) |
|
Westlands |
417.7 mn |
413.2 mn |
(1.1%) |
|
Riverside |
350.0 mn |
342.1 mn |
(2.2%) |
|
Kilimani |
389.7 mn |
378.7 mn |
(2.8%) |
|
Average |
410.1 mn |
403.4 mn |
(1.7%) |
Source: Cytonn Research
We retain a POSITIVE outlook for the land sector in the NMA which proves to be a reliable investment opportunity. We anticipate that the sector’s performance will continue to be driven by; i) positive population demographics facilitating increased demand for land, ii) the government's attempts to streamline land transactions, iii) increased launch and completion of affordable housing projects by both the government and private sector, and, iv) rapid growth of satellite towns amid increased delivery of infrastructural developments which are improving accessibility, property prices and demand for land in the regions.
- Infrastructure
During the week, Tatu City, a mixed use development located in Ruiru municipality and Kenya’s first operational special economic zone, completed the final phase of infrastructure for Kijani Ridge valued at Ksh 1.0 bn. The works mainly included horizontal infrastructural works including; i) 6 kilometres of tarmacked roads which forms part of a wider network of more than 50 kilometres of tarmacked roads within Tatu city, ii) 12 kilometres of footpath, iii) 5 kilometres of underground piped storm water network, iv) 5 kilometres of water supply, v) 2.7 kilometres of sewer line, vi) 12 kilometres of fiber-optic cabling, and, vii) 9.5 kilometres of 11Kv medium voltage underground power lines. Kijani Ridge is an exclusive urban living neighborhood situated in 350.0 acres of land within Tatu City overlooking a dam and a 79.0-acre central park and green space. Kijani Ridge offers fully serviced quarter acre plots at Kshs 26.3 mn and half acre plots starting from 44.0 mn, with a flexible payment plan and approved contemporary architectural designs integrated with amenities such as club house, jogging track, schools, shops, cafes and green spaces.
We expect the completion of the infrastructure at Kijani Ridge development, coupled with accelerated home constructions will enhance investments and, drive up value of properties within the development itself and surrounding areas.
Additionally, during the quarter;
- Northern Corridor Transit and Transport Coordination Authority (NCTTCA) announced a partnership with Superior Homes Kenya, a housing developer where Cytonn Investments is the second largest shareholder, to construct roadside stations along major highways. Superior Homes Kenya will develop the service and rest point areas along various transit routes within the country, which will feature self-contained facilities for long-distance truckers such as; i) safe parking spaces, ii) driver accommodation features, iii) convenience stores for food and beverage options, iv) health facilities, v) truck maintenance and refueling, and, vi) cargo handling. For more information, see our Cytonn Monthly – February 2023 report,
- Kenya Railways Corporation (KRC) commenced construction of the first phase of the Kshs 30.0 bn Railway City project which was launched in by President William Ruto in December 2022. For more information, see our Cytonn Weekly #07/2023, and,
- The Kenya National Highways Authority (KeNHA) announced plans to begin rehabilitation and improvement of sections of Mombasa road which were damaged during the construction of the Nairobi Expressway, within the next 2 months. Additionally, two major roads; Murang’a-Kangema and Murang’a-Kiriaini-Othaya located in Murang’a County were upgraded to national status for the purpose of rehabilitation and other maintenance works. For more information, see our Cytonn Weekly #06/2023.
We expect the infrastructure sector in Kenya will continue to play a crucial role in promoting economic activities, which in turn will drive the growth and performance of the Real Estate sector, with better and improved road networks, transportation systems, and other support facilities that make it easier for delivery of people, goods, and services efficiently, thereby increasing demand for Real Estate properties. However, due to the reduction in budgetary allocation to the State Department of Infrastructure by 21.4%, from Kshs 221.3 bn to Kshs 174.0 bn, infrastructural development activities are likely to experience setbacks. As a result, there may be a shift towards alternative financing strategies such as Public-Private Partnerships (PPPs) to source funds for more infrastructure projects in the country.
- Industrial Sector
During the quarter, logistics firm Mitchell Cotts Freights Kenya Limited, in partnership with two other logistics firms; Perishable Movements Kenya Limited and Fresh Handing Kenya Limited, unveiled a dry cargo and cold storage facilities worth Kshs 30.0 mn, within Jomo Kenyatta International Airport (JKIA). The cold storage occupies 1,943 SQM whereas the dry cargo storage will take up 4,174 SQM summing up to 7,609 SQM of total space occupied by the facilities in JKIA at the landslide of the air-cargo terminal. For more information, see Cytonn Weekly #02/2023 report.
We expect Kenya’s industrial sector to continue realizing growth and development activities supported by; i) the government's accelerated focus on exporting agricultural and horticultural products to the international market, with aim to improve the quantity, quality, efficiency, and reliability of Kenya-farmed produce thereby increasing the country’s competitiveness, ii) Kenya being recognized as a regional hub hence attracting investments, iii) Increased demand for data centres by both the government and private-sector firms driven by continued increase in demand for data protection services with the Data Protection Act 2019 requiring personal data to be stored in servers or data centres located within Kenya’s borders, iv) Increased demand for cold storage facilities for drugs and vaccines whose demand is driven by the Universal Health Coverage program by the government and accelerated campaign in provision of better and cheaper health services by private and Non-Governmental health organisations, v) improvement of infrastructure such as the Standard Gauge Railway (SGR) project, the Eastern and Northern Bypasses connecting Jomo Kenyatta International Airport (JKIA) and other regions in NMA which are expected to increase the output of Special Economic Zones and Inland Container Depots (ICDs), and, vi) Increased demand of e-commerce warehouses in the retail sector driven by the rising demand for space to store goods meant for delivery to clients across the country, as more people shift towards home delivery as a convenient and efficient way to purchase goods.
- Statutory Review
During the quarter;
- The Finance Act 2022, became effective as of 1st January 2023, with the Capital Gains Tax (CGT) chargeable on net gains upon transfer of property tripling to 15.0% from the 5.0% previously chargeable. For more information, see Cytonn Weekly #01/2023 report.
We expect both the national and county governments will continue to modify their legal policies and introduce new relevant regulations to promote transparency, efficiency, compliance, increased transactions and consequently build on the country’s competitive niche in the region for investments in Real Estate sector. However, some policies such as the new CGT rates may have negative effects on the attractiveness of Kenya's Real Estate sector, such as reduced property transaction volumes, limited investments due to increased merger and acquisition costs, and a slight decrease in foreign investments. With such, some investors may opt to shift their investments to other countries in the region with lower Capital Gains Tax (CGT) rates.
- Real Estate Investment Trusts (REITs)
During the week, ILAM Fahari and Acorn Holdings released their FY’2022 financial results highlighting that both Acorn D-REIT and I-REIT recorded profits of Kshs 384.2 mn and Kshs 504.9 mn, respectively. Additionally, ILAM Fahari I-REIT recorded a significant improvement in performance with its net earnings for the period FY’2022 improving by 77.1% to a Kshs 28.4 mn loss, from the Kshs 124.0 mn loss recorded in FY’2021.
The table below includes a summary of the three REIT’s performance in FY’2022;
(Values in Kshs bn unless stated otherwise)
|
Cytonn Report: ILAM Fahari and Acorn Holdings FY’2022 Financial Results Summary |
|||||||||
|
ILAM Fahari I-REIT |
Acorn I-REIT |
Acorn D-REIT |
|||||||
|
Balance Sheet |
FY'2021 |
FY'2022 |
y/y Change |
FY'2021 |
FY'2022 |
y/y Change |
FY'2021 |
FY'2022 |
y/y Change |
|
Total Assets |
3.7 |
3.6 |
(2.6%) |
3.8 |
6.8 |
81.0% |
8.4 |
10.4 |
23.3% |
|
Total Equity |
3.5 |
3.4 |
(3.4%) |
3.6 |
5.9 |
63.5% |
3.2 |
4.2 |
32.5% |
|
Total Liabilities |
0.2 |
0.2 |
12.9% |
0.2 |
0.9 |
435.4% |
5.2 |
6.2 |
17.6% |
|
Income Statement |
|||||||||
|
Rental Income |
0.3 |
0.4 |
19.1% |
334.0 |
442.0 |
32.3% |
59.0 |
311.0 |
427.0% |
|
Income from Other Sources |
0.0 |
0.0 |
(8.7%) |
0.0 |
4.8 |
0.0% |
18.7 |
34.9 |
87.1% |
|
Operating Expenses |
0.2 |
0.2 |
6.0% |
161.0 |
323.4 |
100.9% |
378.6 |
669.9 |
76.9% |
|
Profit/Loss |
(0.1) |
(0.0) |
(77.1%) |
387.5 |
504.9 |
30.3% |
775.9 |
384.2 |
(50.5%) |
|
Basic EPS |
(0.7) |
(0.2) |
(77.1%) |
1.1 |
1.9 |
74.3% |
3.5 |
1.8 |
(49.5%) |
|
Ratios Summary |
|||||||||
|
ROA |
(3.3%) |
(0.8%) |
(76.5%) |
10.3% |
7.4% |
(2.9%) |
0.0 |
0.0 |
2.2% |
|
ROE |
(3.5%) |
(0.8%) |
(76.3%) |
10.8% |
8.6% |
(2.2%) |
0.1 |
0.1 |
(8.6%) |
|
Debt Ratio |
4.6% |
5.3% |
16.0% |
4.7% |
13.9% |
9.2% |
0.4 |
0.4 |
2.8% |
|
PBT Margin |
(46.7%) |
(8.4%) |
(82.0%) |
87.6% |
109.1% |
21.4% |
9.0 |
1.1 |
(786.5%) |
|
Rental Yield |
9.1% |
12.1% |
32.9% |
9.8% |
6.8% |
(3.0%) |
0.8% |
3.4% |
2.6% |
The key take-outs include;
ILAM Fahari I-REIT
- The basic earnings per unit improved by 77.1% to a loss of Kshs 0.2 per unit in FY’2022, from a loss of Kshs 0.7 per unit in FY’2021. The performance was driven by a significant improvement in ILAM Fahari's net earnings which improved to a Kshs 28.4 mn loss in FY’2022, from Kshs 124.0 mn loss recorded in FY’2021. This was mainly driven by a 22.8% increase in the total operating income which came in at Kshs 367.8 mn in FY’2022, from Kshs 299.6 mn in FY’2021,
- Rental income increased by 19.1% to Kshs 354.3 mn in FY’2022, from Kshs 299.6 mn recorded in FY’2021, mainly attributable by increased rental contribution by Greenspan Mall’s anchor tenant, Naivas Supermarket, as well as other tenants, in line with rent escalations. The performance was also driven by improved occupancy rates in the mall following Naivas’ takeover of 37.0% of total mall space as the anchor tenant from troubled Tuskys supermarket, and recovery of the economy from the effects of the pandemic that led to normalcy returning in the property market, and,
- Total assets reduced by 2.6% to Kshs 3.6 bn in FY’2022 from Kshs 3.7 bn in FY’2021, driven by a 10.4% decline in investment property to Kshs 2.9 bn recorded in FY’2022 from Kshs 3.3 bn realized in FY’2021, coupled with a 25.3% decline in cash and cash equivalents to Kshs 89.9 mn in FY’2022, from Kshs 120.3 mn recorded in FY’2021. For more information, please see our ILAM Fahari FY’2022 Earnings Note.
Acorn D-REIT and I-REIT
- The basic earnings per unit for the Acorn D – REIT declined by 50.5% to Kshs 1.8 in FY’2022 from Kshs 3.6 in FY’2021. This was mainly driven by an 76.9% increase in the total expenses to Kshs 669.9 mn, from Kshs 378.6 mn in FY’2021, coupled with a 34.3% decline in fair value of investment properties to Kshs 701.6 mn, from Kshs 1,067.8 mn in FY’2021. For the I – REIT, the basic earnings per unit increased by 74.3% to Kshs 1.9, from Kshs 1.1 in FY’2021, driven by a 243.4% adjustment in Fair Value of Investment property to Kshs 365.3 mn from Kshs 161.0 mn, coupled with a 4.7% increase in total operating income to Kshs 463.0 mn from Kshs 442.1 mn in FY’2021. This resulted to a 30.3% increase in profits which came in at Kshs 504.9 mn, from Kshs 387.5 mn in FY’2021,
- The rental income for both the D-REIT and I-REIT increased by 427.0% and 32.3% to Kshs 311.0 mn and Kshs 442.0 mn in FY’2022, respectively, from Kshs 59.0 mn and Kshs 334.0 mn in FY’2021, respectively. The D-REIT rental income increase was mainly driven by the launch of the 832 – bed Qwetu Hurlingham project in January 2022, and reportedly has an occupancy rate of 90.0%, whereas the I – REIT rental growth was driven by the rental income from its current properties,
- Total assets for the D-REIT and I-REIT increased by 23.3% and 81.0% to Kshs 10.4 bn and Kshs 6.8 bn in FY’2022, respectively, from Kshs 8.4 bn and Kshs 3.8 bn, respectively, in FY’2021. The increase in assets was mainly on the back of increased investment property with the D-REIT’s coming in at Kshs 9.2 bn, an 18.2% increase from Kshs 7.8 bn in FY’2021, whereas the I-REIT’s investment property came in at Kshs 6.5 bn, a 92.1% increase from Kshs 3.4 bn in FY’2021,
For a more comprehensive analysis, please see our Acorn Holdings FY’2022 Earnings Note.
The chart below shows the comparison of ILAM Fahari’s I-REIT and Acorn REITs yield performance versus other yields in FY’2022;
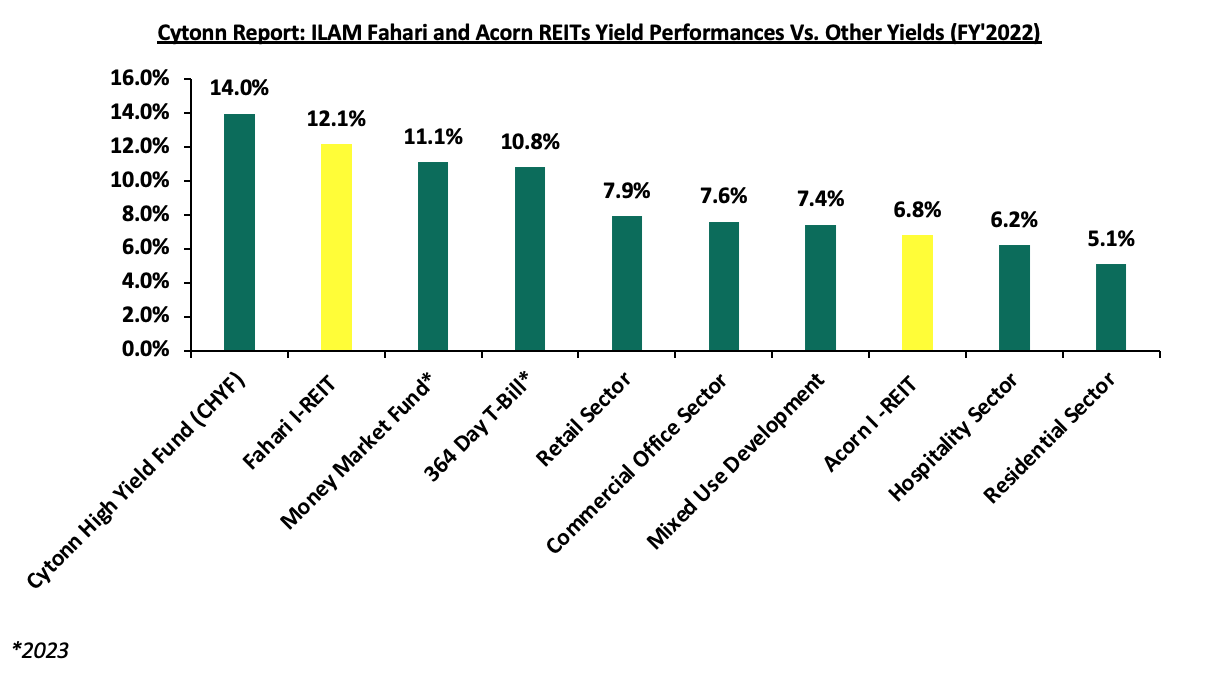
Source: Cytonn Research
In the Nairobi Securities Exchange, ILAM Fahari I-REIT closed the week trading at an average price of Kshs 6.5 per share. The performance represented a 3.2% gain from Kshs 6.3 per share recorded the previous week, taking it to a 3.8% Year-to-Date (YTD) decline from Kshs 6.8 per share recorded on 3rd January 2023. In addition, the performance represented a 67.4% Inception-to-Date (ITD) loss from the Kshs 20.0 price. The dividend yield currently stands at 7.7%. The graph below shows Fahari I-REIT’s performance from November 2015 to 31st March 2023;
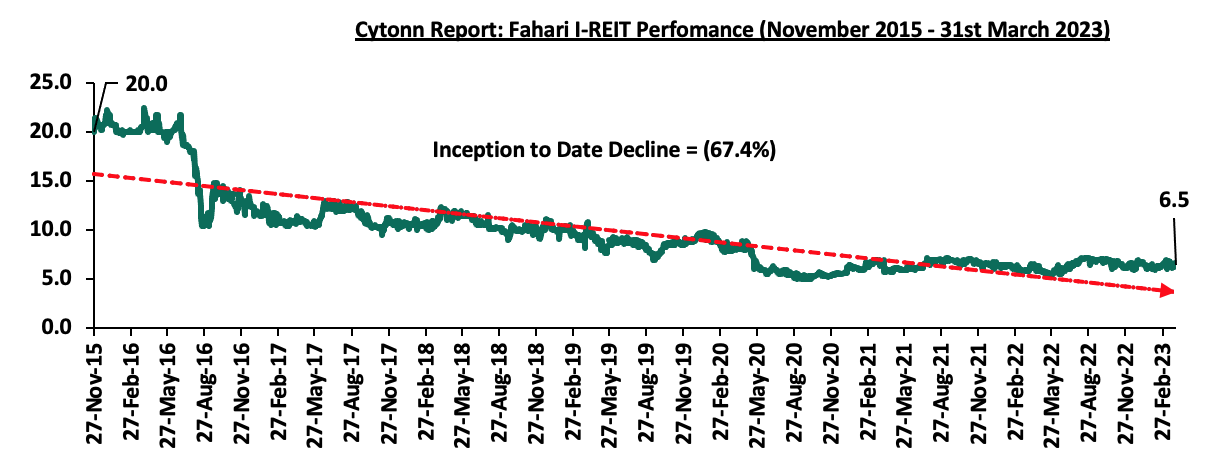
In the Unquoted Securities Platform, Acorn D-REIT and I-REIT traded at Kshs 23.9 and Kshs 20.9 per unit, respectively, as at 31st March 2023. The performance represented a 19.4% and 4.4% gain for the D-REIT and IREIT, respectively, from the Kshs 20.0 inception price. The volumes traded for the D-REIT and I-REIT came in at 12.3 mn and 29.6 mn shares, respectively, with a turnover of Kshs 257.5 mn and Kshs 603.2 mn, respectively, since inception in February 2021.
Notably, during the quarter,
- Local Authorities Pension Trust (LAPTRUST), the oldest pension scheme in Kenya, listed the LAPTRUST Imara I-REIT on the Nairobi Securities Exchange (NSE) at a bell-ringing ceremony officiated by President William Ruto. This comes four months after the Capital Markets Authority (CMA) announced the approval for the listing of the Imara I-REIT on the NSE's Main Investment Market, under the Restricted Sub-Segment. For more information see our Cytonn Weekly #12/2023 report, and,
- The Capital Markets Authority (CMA) in collaboration with the Sanduku Investment Initiative, the Association of Pension Trustees and Administrators of Kenya (APTAK) and the Nairobi Securities Exchange (NSE) announced ongoing plans to create a Kenya National REIT (KNR) as an accreditation body for REITs and their stakeholders within the Kenyan REITs market. For more information, see our Cytonn Weekly #06/2023 report.
The listing of LAPTRUST Imara I-REIT on the NSE, creation of Kenya National REIT (KNR), and deployment of the Vuka Investment Platform into the Kenyan REITs market at the end of 2022 are positive developments for the country's capital markets as they offer several advantages such as access to additional capital pools, diversified portfolios, consistent and long-term returns, tax exemptions, transparency, liquidity, and flexibility as an asset class. However, despite these benefits, REITs' performance has been lacklustre due to various impediments, including insufficient investor awareness of the investment tool, lengthy approval procedures for REIT formation, high minimum capital requirements of Kshs 100.0 mn for trustees which limits the role to banks, and steep minimum investment amounts of Kshs 5.0 mn which discourage investments.
Real Estate Performance Summary and Outlook
Below is a summary of the sectorial performance in Q1’2023 and investment opportunities:
|
Theme |
Cytonn Report: Thematic Performance and Outlook Q1’2023 |
Outlook |
|
Residential |
|
Neutral |
|
||
|
Commercial Office |
|
Neutral |
|
||
|
Retail |
|
Neutral |
|
||
|
Hospitality |
|
Neutral |
|
||
|
Land |
|
Positive |
|
||
|
Listed Real Estate |
|
Negative |
Disclaimer: The views expressed in this publication are those of the writers where particulars are not warranted. This publication, which is in compliance with Section 2 of the Capital Markets Authority Act Cap 485A, is meant for general information only and is not a warranty, representation, advice or solicitation of any nature. Readers are advised in all circumstances to seek the advice of a registered investment advisor.

- Talk to us
- Kenya
- P.O Box 20695 - 00200, Nairobi, Kenya
- Cell +254709101200
- Tel +254709101200
- WhatsApp +254741676635
- United States
- +254709101200
- DOWNLOAD OUR APP
-


- Kenya
- 8th Floor, Pinetree Plaza, Kaburu Drive, Ngong Road, Nairobi, Kenya
- USA
- Suite 1150, 1775 Eye Street NW, USA, Washington DC 20006, USA
- Investments
- High Yield
- Private Equity
- Real Estate
- Real Estate
- RiverRun Estates
- Cytonn Towers
- The Ridge
- Taraji Heights
- The Alma