Cytonn Q1'2020 Markets Review
By Research Team, Apr 5, 2020
Executive Summary
Global Markets Review
According to the United Nations Department of Economic and Social Affairs (UN-DESA), the global economy is expected to contract by 0.9% in 2020 as a result of the spread of the coronavirus, lower than the expectation of a 1.5% growth at the beginning of the year and the estimated 2.9% recorded in 2019. Further to this, the International Monetary Fund (IMF) Managing Director, Mrs. Kristalina Georgieva, highlighted in a press release that the ongoing COVID-19 pandemic has had an immeasurable human cost and emphasized that countries need to work together to protect people and limit the economic damage. Despite this, the IMF believes that recovery is expected in 2021 but this is dependent on how fast the virus is stopped. They advise that this can be done by (i) prioritizing containment, and (ii) strengthening health systems everywhere. Also, they are advocating for extraordinary fiscal actions by governments, such as easing monetary policy, in the best interests of the respective countries and the global economy. Several countries have undertaken the same to spur their economies with the hope of mitigating the economic effects. Headwinds to global growth include the drop in international trade owing to lockdowns in major economies such as China who are among the major players, which has resulted in global supply chain disruptions across the globe;
Sub-Saharan Africa Regional Review
During the quarter, the United Nations Economic Commission for Africa (UNECA) released the World Economic Situation and Prospects for 2020, revising the Sub-Saharan Africa (SSA) GDP growth downwards to 1.8%, from the earlier projected 3.2% in January 2020, as a result of the COVID-19 pandemic set to disrupt supply chains, plummeting commodity prices and key sectors such as tourism, agriculture, oil and mining set to be greatly affected. All select currencies depreciated against the US Dollar except for Ghanaian Cedi, which remains unchanged supported by market reforms, which included the rate at which the commercial banks were willing to commit to exchange the currency for the USD at a future rate. Yields on the various sovereign bonds in the region have been increasing, reflecting increased risk premiums due to the COVID-19 pandemic. The various regional stock markets showed bearish trends with the Rwanda and Tanzania stock exchanges being the only gainers, gaining 0.7% and 14.3%, respectively, on a YTD basis;
Kenya Macroeconomic Review
The macroeconomic environment in Kenya has come under pressure towards the end of Q1’2020, as a result of (i) expectations of lackluster economic growth, which is expected to decline from a baseline estimate of 6.4% to 3.4% as per the Central Bank of Kenya, (ii) volatility in the foreign exchange market driven by uncertainties concerning the impact of COVID-19 with the Kenya Shilling having depreciated by 3.3% against the US Dollar in Q1’2020, and (iii) declining business conditions as evidenced by the Stanbic Bank Monthly Purchasing Manager’s Index (PMI), which declined to 37.5 in March, from 49.0 the previous month. A reading of below 50 indicates a worsening outlook. The average inflation rate for Q1’2020 increased to 6.1%, compared to 4.4% in Q1’2019, with the inflation rates for January, February and March coming in at 5.8%, 6.4%, and 6.1%, respectively, compared to 4.7%, 4.1% and 4.4%, respectively, for a similar period of review in 2019;
Fixed Income
During the first quarter of 2020, T-bills were oversubscribed, with the overall subscription rate coming in at 175.6%, up from 77.0% in Q4’2019. The oversubscription was partly attributable to favorable liquidity in the market during the quarter, which saw the average interbank rate declining to 4.4%, from 5.7% in Q4’2019, supported by government payments and debt maturities. Overall subscriptions for the 91, 182, and 364-day papers came in at 79.4%, 67.8% and 295.6% in Q1’2020, from 74.4%, 24.4% and 121.5% in Q4’2019, respectively, with investors’ participation remaining skewed towards the longer 364-day paper. During the week, T-bills recorded an over-subscription, with the subscription rate coming in at 112.7%, an increase from 56.9% recorded the previous week. The oversubscription was partly attributed to favorable liquidity in the market due to ongoing government payments. The yields on the 91-day, 182-day papers, and 364-day paper remained unchanged from last week coming in at 7.2%, 8.1%, and 9.0%, respectively. The acceptance rate for the week increased to 100.0% from 85.3% recorded the previous week, with the government accepting all the 27.0 bn worth of bids received;
Equities
During the quarter, the equities market was on a downward trajectory, with NASI, NSE 25 and NSE 20 losing by 20.7%, 24.2% and 25.9%, respectively, taking their YTD performance as at the end of March to losses of 20.7%, 24.2% and 25.9% for NASI, NSE 25 and NSE 20, respectively. The losses recorded by all the three indices breach the threshold of a bear market, which is a condition in which securities prices fall by 20.0% or more. For the last twelve months (LTM), NASI, NSE 25 and NSE 20 have declined by 12.0%, 18.5% and 29.3%, respectively. Listed banks in Kenya released their FY’2019 results during the quarter, recording an average core earnings per share growth of 9.9%, compared to a growth of 13.8% the previous year. For a summary of the FY’2019 banking sector results and our key takeaways from the results, please see our Cytonn FY’2019 Banking Sector Performance Note. We shall be releasing our FY’2019 Banking Report on 3rd May 2020;
Real Estate
The real estate sector recorded moderate activity during Q1’2020, with a notable slowdown in the launch of new projects attributable to a challenging economic environment. The spread of the Coronavirus took its toll on key sectors including the tourism sector, which saw hotels suspending operations and this effect is expected to trickle down to the overall real estate sector, particularly commercial real estate amidst the current global economic crisis. In terms of performance, in Q1’2020, average rental yields improved marginally in the residential and commercial office sectors to 5.2% and 7.8%, respectively, from 5.0% and 7.5% in Q4’2019 as the retail sector registered 0.1% points drop in rental yields to 7.7% in Q1’2020, from 7.8% in Q4’2019.
- Weekly Rates:
- Cytonn Money Market Fund closed the week at a yield of 11.0% p.a. To subscribe, just dial *809#;
- Cytonn High Yield Fund closed the week at a yield of 14.1% p.a. To subscribe, email us at sales@cytonn.com;
- Following the Kenyan Government's directive in containing the spread of COVID-19, we have adjusted our working hours to 8 am - 4 pm on weekdays and 8 am- 12 pm on Saturdays. For convenience, you can reach us online on clients.cytonn.com, WhatsApp at 0748 070 000, or email at clientservices@cytonn.com
- In response to the recently announced measures to contain COVID-19 as announced by H.E. President Uhuru Kenyatta, Cytonn Investments has put in the following measures to ensure we continue serving our clients even as we comply with the safety measures. Please see our client communication here;
- Rodney Omukhulu, Assistant Investment Analyst at Cytonn Investments, was on CNBC to discuss the economic movements shaping the Kenyan market space amid COVID-19 crisis. Watch Rodney here
- Having completed and handed over Phase 1 of The Alma, and on track to hand over Phase 2, we have now turned our attention towards construction of The Ridge in Ridgeways. The Ridge is Cytonn’s 800-unit residential mixed-use development on the Northern Bypass. For more information, please email us at sales@cytonn.com;
- Phase 1 of The Alma is now 100% sold with early buyers having achieved up to 55% capital appreciation. We are now running a promotion in Phase 2: Buy a unit in Phase 2 with a 15-year payment plan and 0% deposit. For inquiries, please email us on clientservices@cytonn.com;
- For an exclusive tour of Cytonn’s real estate developments, visit: Sharp Investor's Tour and for more information, email us at sales@cytonn.com;
- We continue to hold weekly workshops and site visits on how to build wealth through real estate investments. The weekly workshops and site visits target both investors looking to invest in real estate directly and those interested in high yield investment products to familiarize themselves with how we support our high yields. Watch progress videos and pictures of The Alma, Amara Ridge, and The Ridge;
- We continue to see very strong interest in our weekly Private Wealth Management Training (largely covering financial planning and structured products). The training is at no cost and is open only to pre-screened participants. We also continue to see institutions and investment groups interested in the training for their teams. Cytonn Foundation, under its financial literacy pillar, runs the Wealth Management Training. If interested in our Private Wealth Management Training for your employees or investment group, please get in touch with us through wmt@cytonn.com. To view the Wealth Management Training topics, click here;
- For recent news about the company, see our news section here;
- We have 10 investment-ready projects, offering attractive development and buyer targeted returns. See further details here: Summary of Investment-ready Projects.
Introduction
According to the United Nations Department of Economic and Social Affairs (UN-DESA), the global economy is expected to contract by 0.9% in 2020 as a result of the spread of the coronavirus, lower than the expectation of a 1.5% growth at the beginning of the year and the estimated 2.9% recorded in 2019. Further to this, the International Monetary Fund (IMF) Managing Director, Mrs. Kristalina Georgieva, highlighted in a press release that the ongoing COVID-19 pandemic has had an immeasurable human cost and emphasized that countries need to work together to protect people and limit the economic damage. Despite this, the IMF believes that recovery is expected in 2021 but this is dependent on how fast the virus is stopped. They advise that this can be done by (i) prioritizing containment, and (ii) strengthening health systems everywhere. Also, they are advocating for extraordinary fiscal actions by governments, such as easing monetary policy, in the best interests of the respective countries and the global economy. Several countries have undertaken the same to spur their economies with the hope of mitigating the economic effects. Headwinds to global growth include the drop in international trade owing to lockdowns in major economies such as China who are among the major players, which has resulted in global supply chain disruptions across the globe. The demand for oil has also slowed down since the outbreak of the virus, mainly because of the shutdown or slowdown in major manufacturing hubs such as China and the US, causing the oil prices to plummet. Financial and commodity markets have similarly experienced adverse effects from the spread of the virus. Most investors in equities markets, for example, have become net sellers, wiping out any year to date gains that major indices had made, as investors move away from the equities market towards fixed income safe havens such as government treasuries and bonds. In addition, investors have moved capital to safe-haven assets such as gold, driving the price upwards, with the YTD performance of gold increasing by 4.2% as at 31st March 2020, trading at USD 1,587.7 from USD 1,523.0 at the start of the year.
United States:
The estimated 2019 GDP growth for the US according to the IMF came in at 1.3%, compared to the expected growth of 2.5%. In January, the IMF projected the GDP growth for the year to come in at 2.0%, down from 2.5% in 2019. The Congressional Budget Office (CBO) on April 2nd 2020 revised the country’s growth expectations for Q2’2020 to a 7% decline where they expect the unemployment to rise above 10%, and this is attributable to layoffs and closure of businesses related to the spread of the novel coronavirus. Similarly, Fitch Ratings expects the lockdowns to result in a recession with the GDP for the second quarter of 2020 expected to contract by 7.0% - 8.0%. This drastic change can be attributed to the rapid spread of the virus, as at 31st March 2020, the number of infections in the country stood at 140,640 with the death toll at 17,987 making it the country with the most infections globally.
Over the past two months, the Federal Open Monetary Committee (FOMC) has been pro-active with regards to policy actions targeted at mitigating the effects of the Coronavirus pandemic. On 15th March 2020, the FOMC lowered the federal funds rate target range to 0.0% to 0.25% to achieve maximum employment and price stability in the markets. Further to this, the committee will use its full range of tools to support the flow of credit to households and businesses by:
- Supporting the smooth functioning of markets for Treasury securities and agency mortgage-backed securities that are central to the flow of credit to households and businesses, by increasing its holdings of Treasury securities by at least USD 500.0 bn and its holdings of agency mortgage-backed securities by at least USD 200.0 bn,
- The Committee will also reinvest all principal payments from the Federal Reserve's holdings of agency debt and agency mortgage-backed securities in agency mortgage-backed securities,
- Supporting the flow of credit to employers, consumers and businesses by establishing new programs that will provide up to US Dollar 300.0 bn (Kshs 31.4 trillion) in new financing,
- Establishment of two facilities to support credit to large employers namely, the Primary Market Corporate Credit Facility (PMCCF) and Secondary Market Corporate Credit Facility (SMCCF), for the new bond and loan issuance and to provide liquidity for outstanding corporate bonds, respectively,
- The establishment of the Term Asset-Backed Securities Loan Facility (TALF), which is meant to support the flow of credit to consumers and businesses,
- Expanding the Money Market Mutual Fund Liquidity Facility (MMLF) to include a wide range of securities to facilitate the flow of credit to municipalities, and,
- Expanding the Commercial Paper Funding Facility (CPFF) to include high-quality, tax-exempt commercial paper as eligible securities to facilitate the flow of credit to municipalities.
The stock market has been on a downward trend, with the S&P 500 declining by 21.8% during the first quarter of 2020, compared to an 11.9% gain in the same period in 2019, making it the worst quarter since the last quarter of 2008. The decline was largely attributable to investors exiting the equities market because of Coronavirus. US valuations declined with the Shiller Cyclically Adjusted P/E (CAPE) multiple currently at 23.9x, which is 20.0% below the 29.9x recorded a similar period in 2019.
Eurozone:
According to the IMF in January 2020, the Eurozone was expected to grow at a rate of 1.3% and 1.4% in 2020 and 2021, respectively, lower than the 1.2% growth recorded in 2019. The latter projection was based on expectations of improved external demand. The growth for the region has since then been revised downwards by several agencies such as Fitch Ratings, who expect the Eurozone GDP for the year to contract by 4.2%, lower than the expected growth of 1.6%. This can be attributed to the spread of the novel coronavirus which has resulted to various factors such as; weaker export growth due to deteriorating activity in China and other affected counties and strict containment measures that have resulted to reduced business activity affecting certain sectors such as tourism and transport. In the near term, economic activity has deteriorated sharply as several counties such as Italy have gone into lockdown. As at 31st March, the number of infections in Europe stood at 423,946 with the death toll at 31,131.
The European Commercial Bank (ECB) maintained the base lending rate at (0.5%), a negative rate meant to incentivize banks borrow from the Central Bank to lend to businesses and people. This move is contrary to what other central banks have done such as the Bank of England, which cut its rate by 50 basis points to 0.25% in an attempt to limit the economic impact of the virus. The ECB, however, opted to support bank lending by expanding its asset purchase program by EUR 120.0 bn.
The Stoxx 600 index declined by 25.4% in Q1’2020, compared to a 12.0% gain in the same period in 2019, as declines in the equities markets were driven by the exit of investors in fear of the coming recession and uncertainty attributable to the spread of the novel coronavirus. Despite this, stocks in the health sector recorded gains of 0.7% during the first quarter of the year. The P/E ratio is currently at 13.8x, 21.1% below the 17.5x recorded in Q1’2019, indicating markets are currently trading at relatively cheaper valuations.
China:
The Chinese economy is estimated to have grown by 6.1% in FY’2019, the slowest growth rate since 1990, and was projected to grow by 6.0% in 2020, attributable to the then ongoing trade dispute between them and the US. In March, the IMF revised the country’s growth downwards to 5.6%, 0.4% points below their initial projection, based on the geographical spread of the novel coronavirus. They highlight that their previous assumptions were that the virus would stay limited to China and be contained which hasn’t materialized. As at 31st March 2020, the number of infections in the country stood at 82,545 with the death toll at 3,314, though broad market commentary suspects that these numbers are under-reported.
The Shanghai Composite has declined by 9.4% during the first quarter of the year as investors in most global markets dump equities fearing the coming recession. Despite the current state of affairs, stocks in the health sector and non-cyclical consumer products recorded gains of 1.1% and 0.5% in Q1’2020, respectively. All other sectors recorded declines with the largest decliners being the technology, energy, industrial and financial sectors which had declines of 1.6%, 1.3%, 0.8% and 0.7%, respectively.
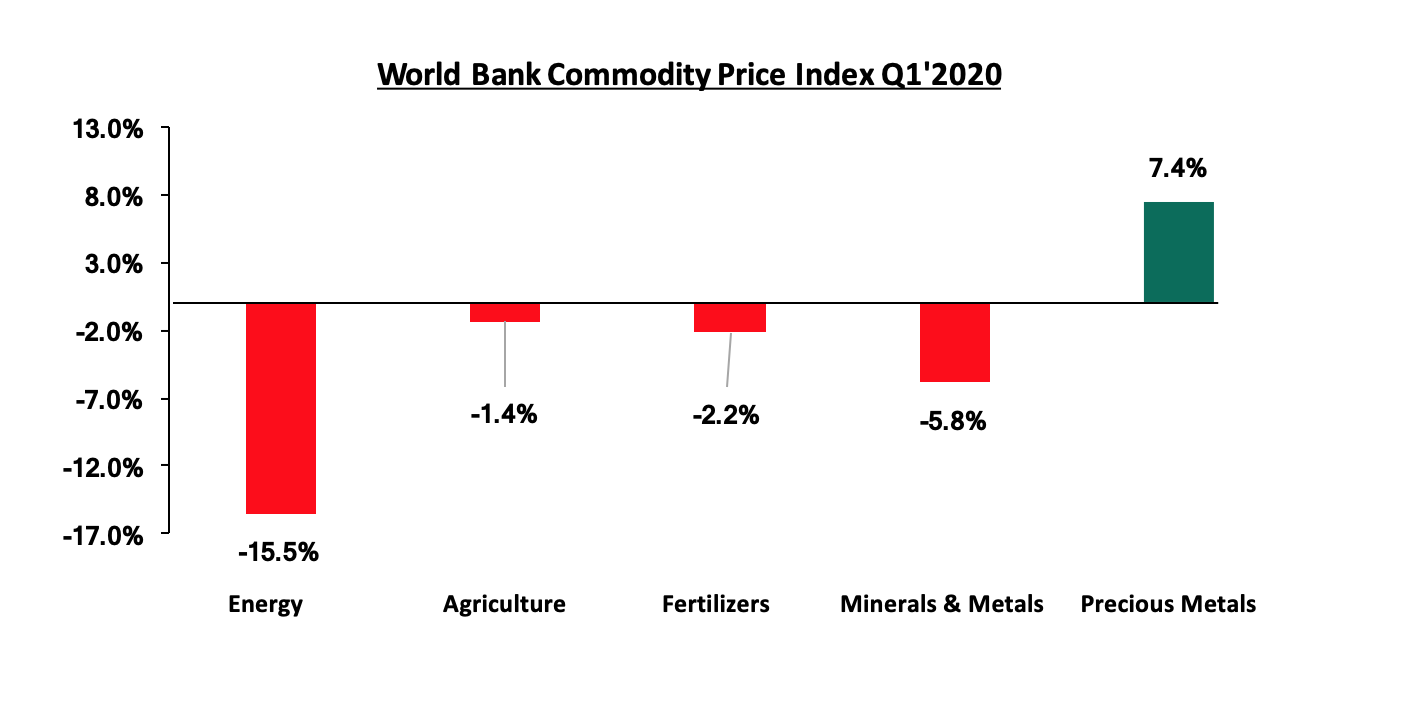
Commodity Prices:
Global commodity prices were on a downward trend in Q1’2020, with the exception of precious metals. This can be attributed to the adverse effects of the ongoing pandemic with the gain in precious metals being attributed to investors resorting to gold and other precious commodities, which are considered to be safe haven assets. According to the World Bank Commodity Prices Index, energy, metals and minerals, fertilizers and agriculture segments declined by 15.5%, 5.8%, 2.2% and 1.4%, respectively, during the quarter, while precious metals gained by 7.4%. Below is a chart showing the performance of select commodity groups for Q1’2019.
During Q1’2020, the United Nations Economic Commission for Africa (UNECA) released the World Economic Situation and Prospects for 2020, revising the Sub-Saharan Africa (SSA) GDP growth to 1.8% from the earlier projected 3.2% in January 2020. The lower growth rate was majorly attributed to the economic impact of the COVID-19 pandemic set to disrupt supply chains, plummeting commodity prices and key sectors such as tourism, agriculture, oil and mining set to be greatly affected. The projections for 2020 are lower by 140 bps compared to the previous projection of October 2019, which stood at 3.4%. The largest economy in SSA, Nigeria, is expected to experience a less robust GDP growth in 2020 with the International Monetary Fund (IMF) revising this downwards by 30 bps to 2.0%, from 2.3% previously, attributable to the decline in the oil price growth and disruption of global supply chains due to the COVID-19 pandemic.
Currency Performance
All select currencies depreciated against the US Dollar except for the Ghanaian Cedi, which remains unchanged supported by market reforms which included the rate at which the commercial banks were willing to commit to exchange the currency for the USD at a future rate. The depreciation recorded by the currencies is partly attributable to the ongoing COVID-19 pandemic, which has seen a fast-falling demand for export commodities particularly from China, the most vital trading partner and the epicenter of COVID-19 outbreak. The Zambian Kwacha was the worst performer, depreciating by 22.3% against the dollar YTD owing to the low economic productivity with the fall of copper prices and drought, compounded with heavy imports which continue to put pressure on the local currency. The Kenya Shilling depreciated by 3.6% to close the quarter at Kshs. 105.1 against the US Dollar attributable to demand from merchandise importers who had entered contracts before the coronavirus-related disruptions, buying hard currency to offset them in the current thin market with very little dollar inflows, prompting the Central Bank of Kenya (CBK) to sell dollars, despite their earlier plan to purchase dollars from the market to improve forex reserves. Below is a table showing the performance of select African currencies:
|
Select Sub Saharan Africa Currency Performance vs USD |
|||||
|
Currency |
Mar-19 |
Dec-19 |
Mar-20 |
Last 12 Months change (%) |
YTD change (%) |
|
Ghanaian Cedi |
5.4 |
5.7 |
5.7 |
(5.3%) |
0.0% |
|
Malawian Kwacha |
724.5 |
729.1 |
729.3 |
(0.66%) |
(0.03%) |
|
Tanzanian Shilling |
2315.5 |
2293.0 |
2308.0 |
0.3% |
(0.6%) |
|
Ugandan Shilling |
3714.9 |
3660.0 |
3785.0 |
(1.9%) |
(3.3%) |
|
Kenyan Shilling |
100.7 |
101.3 |
105.1 |
(4.2%) |
(3.6%) |
|
Mauritius Rupee |
34.9 |
36.2 |
39.1 |
(10.7%) |
(7.4%) |
|
Botswana Pula |
10.8 |
10.5 |
12.0 |
(9.7%) |
(12.2%) |
|
Nigerian Naira |
361.0 |
306.0 |
360.0 |
0.3% |
(15.0%) |
|
South African Rand |
14.5 |
14.0 |
17.8 |
(18.7%) |
(21.5%) |
|
Zambian Kwacha |
12.2 |
14.1 |
18.1 |
(32.8%) |
(22.3%) |
African Eurobonds:
Yields on African Eurobonds increased in Q1’2020 after a decline in 2019. This was partly attributed to the COVID-19 health crisis, with investors attaching a higher risk premium on the affected regions due to the anticipation of slower economic growth.
During the quarter, the Government of Ghana, on 4th February 2020 issued the longest dated Eurobond as part of debt issuance to raise USD.3.0 bn. The government launched the sale of a USD 750.0 mn tranche, which will amortize and have an average life of 40-years at a yield of 8.9%. The bond was oversubscribed 5x to USD 14.0 bn indicating a huge interest for Ghana's debt.
Below is a graph showing the Eurobond secondary market performance of select 10-year Eurobonds issued by the respective countries:
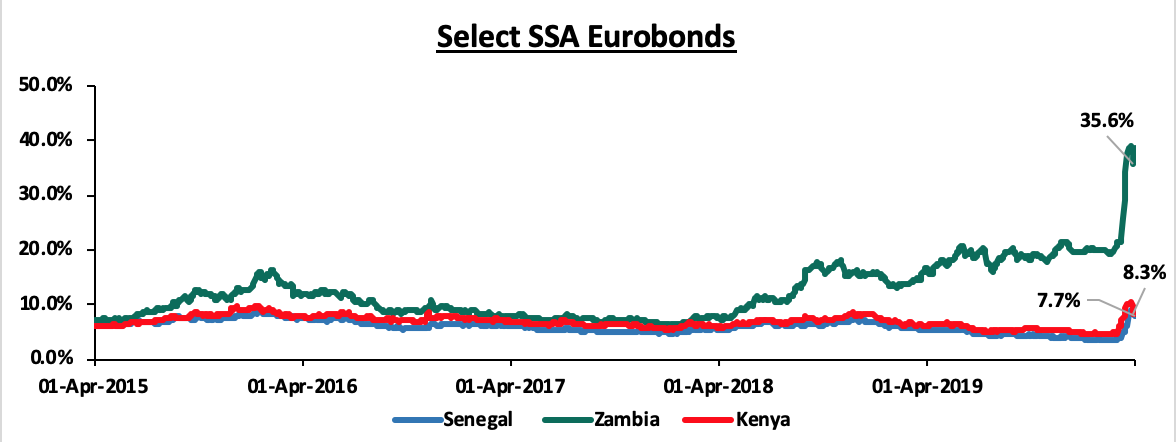
Analysis of trends observed in the chart above is as follows:
- Yields on the Zambia Eurobond increased in Q1’2020 by 19.1% points as a result of a mass exodus of foreign investors amid fears of the country’s debt sustainability and the ongoing COVID-19 pandemic, with most investors believing it to be close to default. Yields on its USD 750.0 mn of notes due in September 2022 soared 14.7% points to 66.3% attributable to the weakening copper prices and drought, which has led to power cuts caused by low water levels at its hydroelectric dams. Credit rating companies including Fitch Ratings had already warned of a high risk of default even before copper prices fell 20.0% this year as the coronavirus pandemic disrupts markets. Zambia’s currency is the world’s worst performer this year, and foreign-exchange reserves have fallen to a record low and cover less than two months of imports. The country intends to implement liability management of its external debt portfolio to lengthen maturity and enhance its capacity to meet debt-service obligations.
- Yields on Kenyan and Senegalese Eurobonds have been increasing since the beginning of the year, signaling that the demand for the instruments has declined during the period. The trend was replicated in all the Eurobonds attributable to the expected economic decline due to the COVID-19 pandemic. Emerging market bond funds have also endured heavy net outflows as investors have dumped risky assets amid the deepening coronavirus crisis. Outflows from Emerging Markets debt funds hit USD 17.0 bn in the seven days to March 25, 2020. The past four weeks have seen a total of USD 47.7bn withdrawn from the sector, equivalent to 10.2% of assets under management. The exodus has so far erased a third of the USD 140.0 bn of net inflows that Emerging Markets bonds have seen in the past four years, according to Bank of America.
Equities Market Performance
Most of the Sub-Saharan African (SSA) stock markets recorded negative returns in Q1’2020. The region experienced capital outflows, a downgrade from last year’s recorded inflows. This is attributable to the ongoing Coronavirus pandemic, with investors selling out of the equities market in favor of safe havens and the expected economic fallout. Below is a summary of the performance of key exchanges:
|
Equities Market Performance (Dollarized*) |
|||||
|
Country |
Mar-19 |
Dec-19 |
Mar-20 |
Last 12 Months change (%) |
YTD change (%) |
|
Rwanda |
0.1 |
0.1 |
0.2 |
60.0% |
14.3% |
|
Tanzania |
0.9 |
1.5 |
1.5 |
67.8% |
0.7% |
|
Ghana |
458.8 |
405.5 |
378.9 |
(17.4%) |
(6.6%) |
|
Kenya |
1.5 |
1.6 |
1.3 |
(16.0%) |
(21.3%) |
|
Zambia |
460.5 |
303.3 |
233.3 |
(49.3%) |
(23.1%) |
|
Uganda |
0.5 |
0.5 |
0.3 |
(32.0%) |
(32.0%) |
|
Nigeria |
85.4 |
87.7 |
59.2 |
(30.7%) |
(32.5%) |
|
South Africa |
3866.2 |
4079.3 |
2493.8 |
(35.5%) |
(38.9%) |
|
*The index values are dollarized for ease of comparison |
|||||
Analysis of trends observed in the chart above is as follows:
- Rwanda is the best performing index showing resilience amid the COVID-19 pandemic following gains made by cross-listed stocks such as Equity Bank, which has recorded YTD gains of 25.7%,
- South Africa recorded the worst performing index with losses of 38.9% attributable to the continued selloffs brought by concerns about the economic fallout caused by the Coronavirus, despite assurances that the cabinet is putting together an economic stimulus package to deal with the detrimental impact from the actions taken to combat the virus,
- The performance of the Nairobi All Share Index (NASI) was driven by losses of 21.3%, YTD attributable to the ongoing Coronavirus pandemic, with investors selling out of the equities market.
GDP growth in Sub-Saharan Africa region is expected to decline owing to the ongoing COVID-19 pandemic that is expected to disrupt global supply chains and as the currencies lose value against the dollar in an uncertain global economy. Key risks remain difficult business conditions and poor infrastructure, reliance on commodity exports, political tension in some countries and debt sustainability due to high levels of public debt in most economies in the region. Stock market valuations remain unattractive for long-term investors.
During Q1’2020, we tracked Kenya 2020 GDP growth projections released by 11 organizations, that comprised of research houses, global agencies, and government organizations. At the beginning of the quarter the average growth rate was projected to be 6.0% but due to the novel Coronavirus pandemic, economic growth is expected to decline due to reduced demand by Kenya’s main trading partners and disruptions of supply chains and domestic production. Based on the impact on other economies, Cytonn Investments, have also reduced Kenya’s forecasted GDP growth. Based on the impact on other economies, we believe that Coronavirus may have a 10.0% to 25.0% impact on GDP growth for the year 2020. The 10.0% impact is an optimistic case in the event the outbreak is contained, and a 25.0% impact in the event it is not contained. As such, the Coronavirus could reduce Kenya’s GDP growth to 4.3% for the year 2020 depending on the severity of the outbreak and economic implications for Kenya. The Central Bank of Kenya also reduced the 2020 forecasted economic growth rate from a baseline estimate of 6.4% to 3.4%. The table below shows GDP projections from 11 firms with the consensus GDP growth as per the 11 firms below expected to come in at 5.2%.
However, we expect this growth rate to be revised downwards as global research houses downgrade their GDP growth estimates for 2020 once they factor in the economic impact of Coronavirus.
|
Kenya 2020 Annual GDP Growth Outlook |
|||
|
No. |
Organization |
Q1’2020* |
Q1’2020** |
|
1. |
Citigroup Global Markets |
6.2% |
6.2% |
|
2. |
International Monetary Fund |
6.0% |
6.0% |
|
3. |
African Development Bank |
6.0% |
6.0% |
|
4. |
World Bank |
6.0% |
6.0% |
|
5. |
National Treasury |
6.0% |
6.0% |
|
6. |
African Development Bank (AfDB) |
6.0% |
6.0% |
|
7. |
Capital Economics |
5.9% |
5.9% |
|
8. |
United Nations Conference on Trade and Development (UNCTAD) |
5.5% |
5.5% |
|
9. |
Cytonn Investments Management PLC** |
5.7% |
4.3% |
|
10. |
Central Bank of Kenya** |
6.2% |
3.4% |
|
11. |
McKinsey & Company *** |
5.2% |
1.9% |
|
|
Average |
5.9% |
5.2% |
|
*As at the beginning of the year **Revised GDP Growth **Revised GDP Growth |
|||
Inflation:
The average inflation rate rose to 6.1% in Q1’2020 as compared to 4.4% in a similar period in 2019. During the month of March, the Kenya National Bureau of Statistics (KNBS), revised the commodity basket and included several items such as mobile phone airtime, pay-tv, and garbage collection while dropping several archaic items such as radio and video cassettes. The revision was in a bid to reflect the true cost of living due to increased urbanization and the expanding middle-class population. The revision brings the number of items included in the commodity basket to 330, from 234 items previously, while data collection zones have increased from the previous 25 to 50. The KNBS also adjusted the weighting assigned to items in the commodity basket such as the Food and Non-Alcoholic Beverages, Alcoholic Beverages, Tobacco and Narcotics, and Transport Indices, which previously had a weighting of 36.0%, 2.1%, and 8.7%, respectively, to 32.9%, 3.3%, and 9.7%, respectively.
Inflation for the month of March came in at 6.1% with the m/m inflation increased marginally by 0.2%. The increase in the month-on-month inflation in March was mainly due to:
- A 0.6% increase in the food and non-alcoholic beverage index, driven by increases in prices of some food items such as Mangoes, Irish Potatoes, onions and cooking oils which increased by 5.4%, 2.3%, 2.1%, and 0.8%, respectively.
- A 0.1% decrease in transport cost driven by a 1.3% decline in pump prices for petrol, and
- A marginal decline (0.02%) in Housing, Water, Electricity, Gas and Other Fuels Index stimulated by a 2.2% decrease in prices of cooking fuels which offset the 0.9% increase in house rent.
|
Major Inflation Changes – March 2020 |
|||
|
Broad Commodity Group |
Price change m/m (March-20/Feb-20) |
Price change y/y (March-20/March-19) |
Reason |
|
Food & Non-Alcoholic Beverages |
0.6% |
11.9% |
The m/m decline was due to an increase in prices of some foodstuffs for instance Mangoes, Irish Potatoes, onions and cooking oils |
|
Transport Cost |
(0.1%) |
5.5% |
The m/m decline was mainly on account of a decrease in pump prices of petrol |
|
Housing, Water, Electricity, Gas and other Fuels |
(0.02%) |
4.5% |
The m/m marginal decline was as a result of a decrease in prices of cooking fuels which offset the increase in house rent |
|
Overall Inflation |
0.2% |
6.1% |
The m/m increase was due to a 0.6% increase in the food index which has a revised CPI weight of 32.9% |
The Kenya Shilling:
The Kenya Shilling depreciated against the US Dollar by 3.3% in Q1’2020, to close at Kshs 104.7, from Kshs 101.3 at the end of Q4’2019 attributable to the persistent worries about the impact of the Coronavirus outbreak on export earnings, prompting CBK to sell dollars to limit the losses. During the week, the Kenya Shilling depreciated against the US Dollar by 0.5% to close at 105.7 from 105.1, the previous week. We expect depreciation of the shilling in 2020 as a result of:
- Rising uncertainties in the global market due to the Coronavirus outbreak, which has seen the disruption of global supply chains. The shortage of imports from China for instance, which accounts for an estimated 21.0% of the country’s imports, is likely to cause local importers to look for alternative import markets, which may be more expensive and as such higher demand for the dollar from merchandise importers, and,
- Subdued diaspora remittances growth following the close of the 10.0% tax amnesty window in July 2019. We also foresee reduced diaspora remittances, owing to the decline in economic activities globally hence a reduction in disposable incomes. This coupled with increased prices of household items abroad might see a reduction in money expatriated into the country.
The shilling is however expected to be supported by:
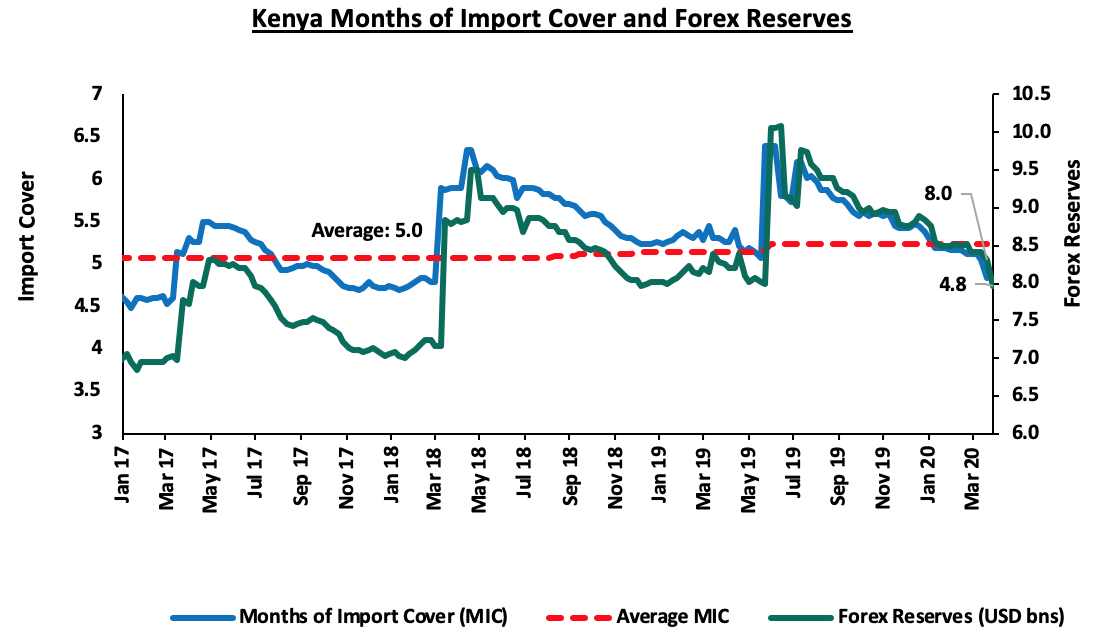
- High levels of forex reserves, currently at USD 7.9 bn (equivalent to 4.8-months of import cover), above the statutory requirement of maintaining at least 4.0-months of import cover, and the EAC region’s convergence criteria of 4.5-months of import cover, and,
- CBK’s supportive activities in the money markets, with the Central Bank of Kenya (CBK) having already indicated that it’s looking to purchase USD 400.0 mn from banks for four months beginning from March to bolster the forex reserves.
Monetary Policy:
The Monetary Policy Committee (MPC) met twice in Q1’2020, cutting the Central Bank Rate (CBR) by 125 bps cumulatively to 7.25%. In the January 27th meeting, the committee cut the CBR by 25 bps noting that inflation expectations were well anchored within the target range of 2.5% - 7.5% and that the economy was operating below its potential level, not in line with our expectations where we had expected the MPC to maintain the CBR at 8.5%. This was evidenced by;
- Improving private sector credit growth, despite being below historical averages, coming in at 7.1% in the 12-months to December. Strong growth in credit to the private sector was being observed in the consumer durables (26.0%), manufacturing (9.2%) and trade (8.9%), and,
- Stability in the foreign exchange market supported by the narrowing of the current account deficit to 4.6% of GDP in 2019, from 5.0% in 2018, driven by strong receipts from transport and tourism services, resilient diaspora remittances and lower imports of food and SGR related equipment. The foreign exchange market has also been supported by adequate forex reserves currently at USD 8.5 bn (equivalent to 5.2-months of import cover), that continue to provide adequate cover and a buffer against short-term shocks in the foreign exchange market.
For more information, see our note on Monetary Policy Committee Meeting for January 2020.
In the March 23rd meeting, the committee cut the CBR by 100 bps, a move to help mitigate the economic and financial impact of the COVID-19 health crisis, in line with our expectations. The MPC noted that the effects of the virus are already being felt in the economy as evidenced by:
- Volatility in the foreign exchange market driven by uncertainties concerning the impact of COVID-19 as evidenced by the recent downward trend of the shilling,
- Economic growth, which is expected to decline from a baseline estimate of 6.4% to 3.4% as per the Central Bank of Kenya, attributable to reduced demand by Kenya’s main trading partners, disruptions of supply chains and domestic production caused by COVID-19 pandemic.
For more information see our note on Monetary Policy Committee Meeting for March 2020. As such, the MPC concluded that due to the adverse economic outlook attributable to the COVID-19 health crisis, it will ensure that the interbank market and liquidity management across the sector continue to function smoothly. The committee also pointed out that it will closely monitor the impact of this change and therefore, reconvene after a month for an early assessment of the COVID-19 pandemic.
Q1’2020 Highlights:
- The Treasury released the Draft 2020 Budget Policy Statement, which highlights the current performance of the country’s economy and gives a medium-term outlook, in preparation for the FY2020/21 Budget for comments from the general public. The Budget Policy Statement (BPS) is a government policy document that sets out the strategic priorities, policy targets as well as a summary of the government’s spending plans in preparation for the FY 2020/21 Budget. For more information, see our Cytonn Weekly #04/2020,
- Moody’s Credit Agency released an update highlighting Kenya’s international creditworthiness. Kenya’s rating by the agency was maintained at B2 with a stable outlook, on the back of relative diversification of the economy and moderate economic strength. The agency, however, warned that Kenya’s debt burden coupled with poor revenue collection may negatively affect the country’s credit rating. For more information, see our Cytonn Weekly #08/2020,
- The Central Bank of Kenya (CBK), under Sections 9 and 51 of the CBK Act and following approval by the CBK Board, announced that it has transferred Kshs 7.4 bn from its General Reserve Fund to the Government Consolidated Fund in support of the fight against Coronavirus. For more information, see our Cytonn Weekly #12/2020,
- According to Stanbic Bank’s Monthly Purchasing Manager’s Index (PMI), released earlier during the week, the economy suffered another difficult month with a sharp decline in business activities leading to a steep fall in total sales. The seasonally adjusted PMI came in at 37.5 in March, a 29- month low and a sharp decline from 49.0 in February 2020. A PMI reading of above 50 indicates improvements in the business environment, while a reading below 50 indicates a worsening outlook. The downturn in business was widely due to the outbreak of coronavirus in the country. The sharper decline in new business saw export demand drop due to low demand by foreign clients with many customers cancelling their orders due to the uncertainty surrounding the coronavirus. The decline in business caused a decline in employment with demand for inputs falling rapidly as well. Most businesses also highlighted that raw materials were in short supply during the month mainly attributable to the lockdown in China where most businesses source their inputs from. The report, however, noted that the overall level of sentiment in the Kenyan private sector remained strong, despite the impact of the pandemic.
Macroeconomic Indicators Table:
|
Macro-Economic & Business Environment Outlook |
|||
|
Macro-Economic Indicators |
YTD 2020 Experience and Outlook Going Forward |
Outlook at the Beginning of the Year |
Current outlook |
|
Government Borrowing |
|
Negative |
Negative |
|
Exchange Rate |
|
Neutral |
Negative |
|
Interest Rates |
|
Neutral |
Negative |
|
Inflation |
|
Positive |
Neutral |
|
GDP |
|
Neutral |
Negative |
|
|||
|
Investor Sentiment |
|
Positive |
Neutral |
|
Security |
|
Positive |
Positive |
Of the 7 indicators we track, 1 is positive, 2 are neutral and 4 are negative with changes in GDP, interest rates, and currency which were neutral at the beginning of the year and now negative and inflation and investor sentiment which were positive and now neutral. We have switched our outlook on 2020 macroeconomic environment from positive to negative depending on how fast the Coronavirus is contained. Based on the impact on other economies, we believe that Coronavirus may have a 10.0% to 25.0% impact on GDP growth for the year.
Money Markets, T-Bills & T-Bonds Primary Auction:
During the first quarter of 2020, T-bills were oversubscribed, with the overall subscription rate coming in at 175.6%, up from 77.0% in Q4’2019. The oversubscription was partly attributable to favorable liquidity in the market during the quarter, which saw the average interbank rate declining to 4.4%, from 5.7% in Q4’2019, supported by government payments and debt maturities. Overall subscriptions for the 91, 182, and 364-day papers came in at 79.4%, 67.8% and 295.6% in Q1’2020, from 74.4%, 24.4% and 121.5% in Q4’2019, respectively, with investors’ participation remaining skewed towards the longer 364-day paper. The demand for the longer-dated paper is attributable to a scarcity of shorter-dated bonds due to the government issuing medium-term and longer-dated papers in a bid to increase the debt maturity profile, which saw most investors still keen to participate in the primary fixed income market finding the 364-day T-bill more attractive on a risk-adjusted return basis. The yields on the 91-day T-bill and 182-day T-bill remained unchanged to close at 7.2% and 8.1%, respectively. The yield on the 364-day T-bills declined by 80 bps to close at 9.0%, from 9.8% in Q4’2019. The acceptance rate for the quarter came in at 62.7%, down from 79.9% recorded in Q4’2019, with the government accepting a total of Kshs 317.3 bn of the total Kshs 505.8 bn worth of bids received during the quarter.
During the week, T-bills recorded an over-subscription, with the subscription rate coming in at 112.7%, an increase from 56.9% recorded the previous week. The oversubscription was partly attributed to favorable liquidity in the market due to ongoing government payments. The yields on the 91-day, 182-day papers, and 364-day paper remained unchanged at 7.2%, 8.1%, and 9.0% respectively. The acceptance rate increased to 100.0% from 85.3% recorded the previous week, with the government accepting all the 27.0 bn worth of bids received.
During Q1’2020, the Kenyan Government had one Treasury bond primary issue and five bonds were re-opened, with FXD1/2018/25 being re-opened twice, in February and March, with the details in the table below:
|
No. |
Date |
Bond Auctioned |
Effective Tenor to Maturity (Years) |
Coupon |
Amount to be Raised (Kshs bn) |
Bids Received |
Actual Amount Raised (Kshs bn) |
Average Accepted Yield |
Subscription Rate |
Acceptance Rate |
|
1 |
27/01/2020 |
FXD1/2019/5 |
4.1 |
11.3% |
50.0 |
44.5 |
44.5 |
11.5% |
139.9% |
99.9% |
|
|
|
FXD1/2019/10 |
9.1 |
12.4% |
25.4 |
19.3 |
12.4% |
75.7% |
||
|
2 |
24/02/2020 |
FXD1/2020/15 |
15.0 |
12.8% |
50.0 |
18.4 |
5.2 |
12.8% |
85.0% |
28.2% |
|
|
|
FXD1/2018/25 |
23.3 |
13.4% |
24.1 |
22.7 |
13.6% |
94.3% |
||
|
3 |
23/03/2020 |
FXD1/2018/20 |
18.1 |
13.2% |
50.0 |
19.8 |
8.3 |
13.3% |
70.3% |
41.8% |
|
|
|
FXD1/2018/25 |
23.3 |
13.4% |
15.3 |
14.6 |
13.8% |
95.4% |
||
|
|
Total |
|
|
|
|
147.6 |
114.5 |
76.4% |
77.6% |
Primary T-bond auctions in Q1’2020 were undersubscribed, with the subscription rate averaging 76.4% for the quarter, lower than the average subscription rate for Q4’2019, which was 100.7%. The average acceptance rate for the quarter came in at 77.6%, as the CBK continued to reject bids deemed expensive in order to maintain the rates at low levels, with government reopening four bonds, namely the FXD1/2019/5, FXD1/2019/10, FXD1/2018/20, and the FXDI/2018/25 that was reopened twice, on 24th February and 23rd March 2020, to plug in any deficits from the initial issuances. The re-opened bonds were better received by the market, recording a subscription rate averaging 51.7%, higher compared to 36.9 % for the first issuance. The government accepted Kshs 114.5 bn against a target of Kshs 150.0 bn during the quarter.
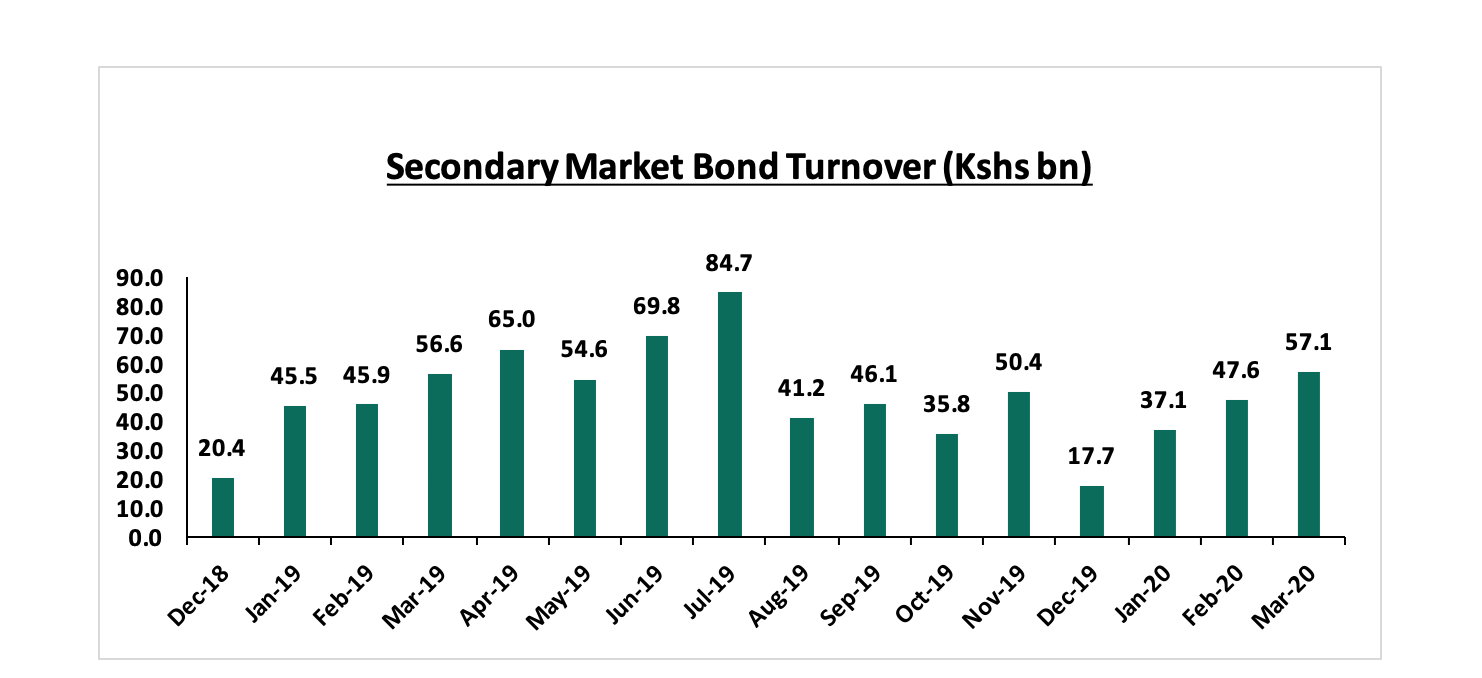
Secondary Bond Market Activity:
The secondary bond market recorded increased activity, with the turnover increasing by 36.6% to Kshs 141.8 bn from Kshs 103.8 bn in Q4’2019, as the local institutional investors increased their allocation to treasury bonds considered a safe haven in this period of market uncertainties.
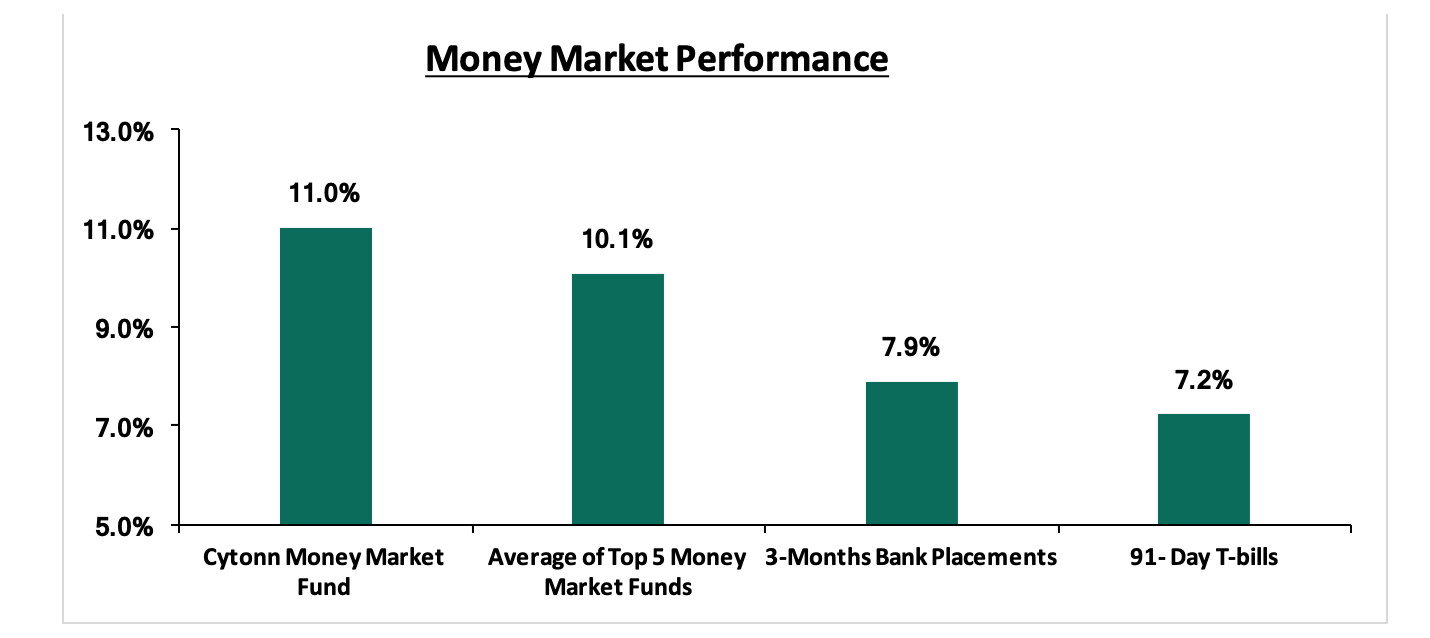
In the money markets, 3-month bank placements ended the week at 7.9% (based on what we have been offered by various banks), the 91-day T-bill remained unchanged at 7.2%, while the average of Top 5 Money Market Funds remained unchanged at 10.1%. The yield on the Cytonn Money Market came in at 11.0%, unchanged from the previous week.
Liquidity:
In this quarter, liquidity levels remained stable and well distributed in the market as indicated by the 23.9% decline in the average volumes traded in the interbank market to Kshs 11.9 bn, from Kshs 15.6 bn recorded in Q4’2019, and the subsequent decline in the interbank rate to 4.4%, from 5.7% the previous quarter indicating increased liquidity in the market attributable to support by government payments and debt maturities. During the week, liquidity tightened with the average interbank rate rising to 5.2%, from 4.7% recorded the previous week attributable to tax payments which offset government payments. There was a decrease in the average volumes traded in the interbank market by 55.9% to Kshs 7.6 bn, from Kshs 17.3 bn the previous week.
Kenya Eurobonds:
During Q1’2020, the yields on all the Eurobonds increased significantly, an indication that investors are now attaching a higher risk premium on the country due to the anticipation of slower economic growth attributable to the locust invasion, coupled with the entry of the novel COVID-19 in Kenya’s borders, further dampening the country’s economic growth prospects. In the third week of March, there was a sharp increase in the yields of all the issued Eurobonds due to Kenya announcing its first Coronavirus case. The 10-year Eurobond issued in 2014, the 10-year and 30-year Eurobonds, issued in 2018 and the 7-year and 12-year Eurobonds issued in 2019 increased by 3.0% points, 1.9% points, 2.0% points, 4.4% points, and 1.4% points respectively to close at a yield of 10.2%, 10.1%, 10.4%, 11.0% and 10.8% from 7.2%, 8.3%, 8.4%, 6.6%, and 9.3%, respectively in the second week of March. The 7-year Eurobond issued in 2019 recorded the highest spike, increasing by 4.4% points.
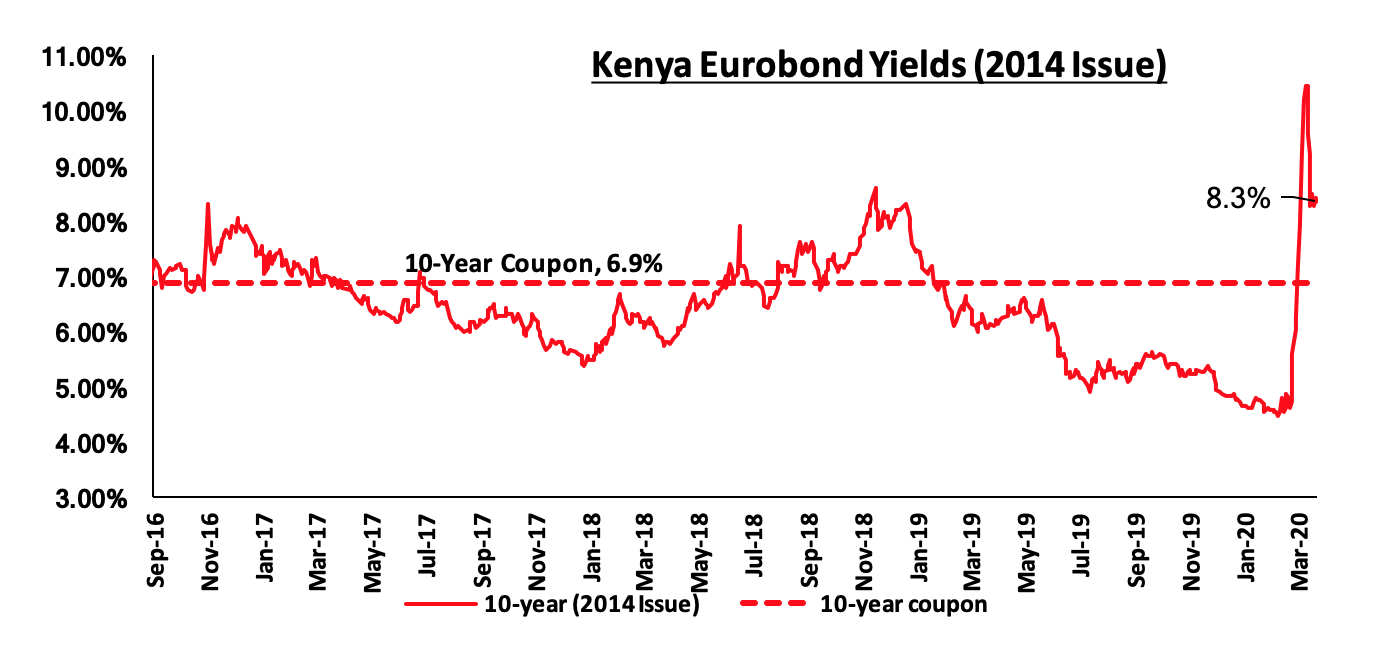
According to Reuters, the yield on the 10-year Eurobond issued in 2014, increased by 3.5% points to close at 8.3%, in Q1’2020, from 4.8% in Q4’2019. Key to note is that this bond has 4.3-years to maturity. During the week, the yield on the 10-year Eurobond issued in June 2014 remained unchanged at 8.3%, recorded the previous week.
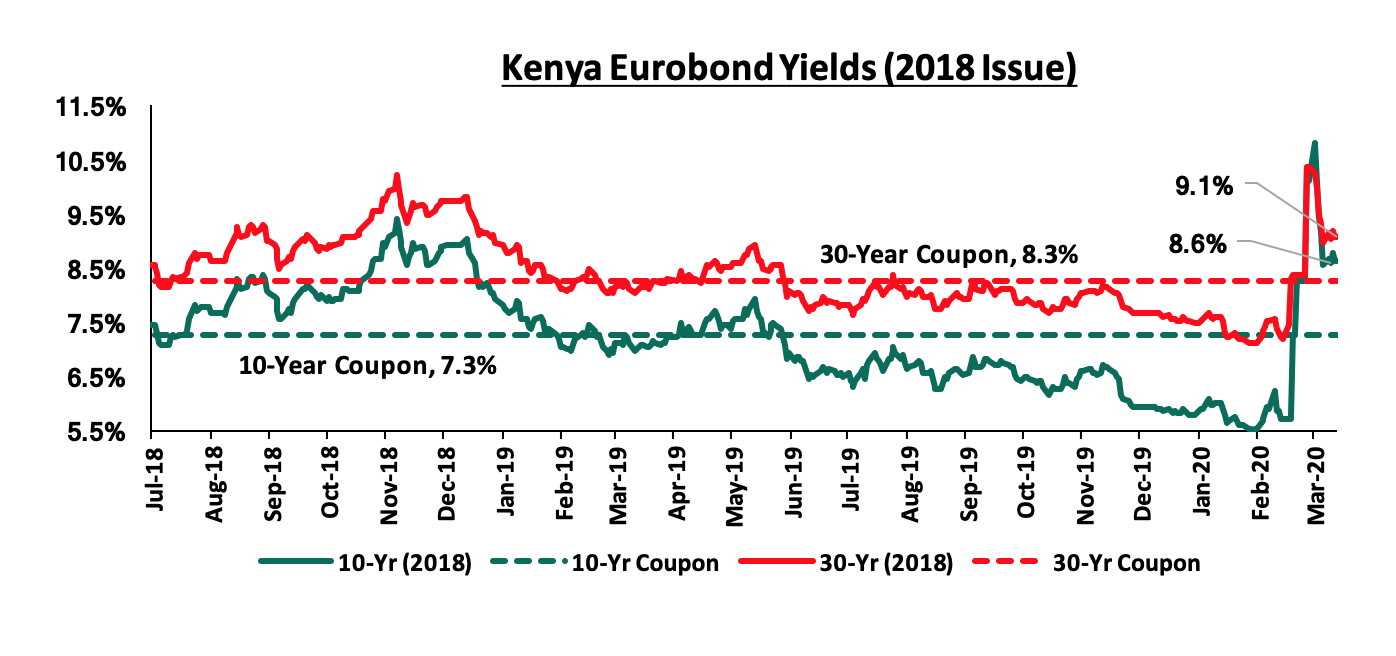
During the quarter, the yields on the 10-year and 30-year Eurobonds, issued in 2018, increased by 2.7% points and 1.3% points to close at 8.6% and 9.0% from 5.9% and 7.7% respectively in Q4’2019, these bonds have a 7.9-years and 27.9-years to maturity for the 10-year and 30-year, respectively. During the week, the yield on the 10-year Eurobond issued in 2018 remained unchanged at 8.6% while, the yield on the 30-year Eurobonds increased by 0.1% points to 9.1%, from 9.0% recorded previous week.
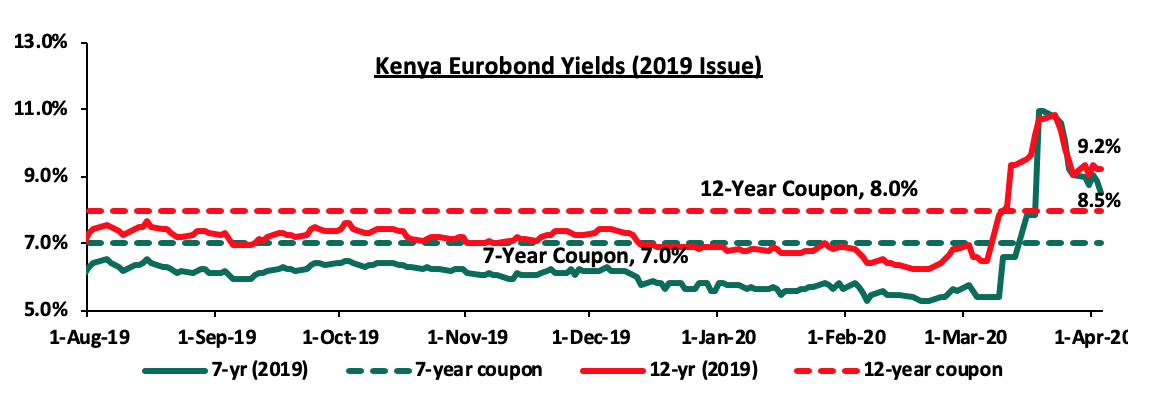
During Q1’2020, the yields on the 7-year and 12-year Eurobonds issued in 2019 increased by 3.2% points and 2.2% points, to close at 8.8% and 9.1% from 5.6% and 6.9% recorded at the close of Q4’2019, respectively. Key to note is that these bonds have 6.2-years and 11.2-years to maturity respectively. During the week, the yields on the 7-year Eurobond issued in 2019 declined by 0.6% points, to 8.5%, from 9.1% recorded the previous week while, the yields on the 12-year Eurobond issued in 2019 increased by 0.1% points, to 9.2%, from 9.1% recorded the previous week
Rates in the fixed income market have remained relatively stable as the government rejects expensive bids. The government is 11.2% behind of its domestic borrowing target, having borrowed Kshs 210.2 bn against a pro-rated target of Kshs 236.8 bn. The uncertainty brought about by the novel Coronavirus will make it harder for the government to access foreign debt due to uncertainty affecting the global markets which might see investors attaching a high-risk premium on the country. A budget deficit is likely to result from the depressed revenue collection with the revenue target for FY’2019/2020 at Kshs 2.1 tn, creating uncertainty in the interest rate environment as additional borrowing from the domestic market goes to plug the deficit. Owing to this uncertain environment, our view is that investors should be biased towards short-term fixed income securities to reduce duration risk.
Market Performance:
During Q1’2020, the equities market was on a downward trajectory, with NASI, NSE 25 and NSE 20 losing by 20.7%, 24.2% and 25.9%, respectively, taking their YTD performance as at the end of March to losses of 20.7%, 24.2% and 25.9% for NASI, NSE 25 and NSE 20, respectively. The losses recorded by all the three indices breach the threshold of a bear market, which is a condition in which securities prices fall by 20.0% or more. The equities market performance during the quarter was driven by losses recorded by large caps such as Bamburi, Equity, KCB, BAT Kenya, EABL and ABSA of 40.0%, 36.5%, 35.2%, 28.0%, 24.7% and 24.3%, respectively.
During the week, the equities market was on an upward trajectory with NASI, NSE 25 and NSE 20 gaining by 8.9%, 7.1% and 5.0%, respectively, due to gains recorded by large-cap stocks such as EABL, Safaricom, Diamond Trust Bank (DTBK) and NCBA of 14.8%, 13.4%, 7.3% and 7.2% respectively. For the last twelve months (LTM), NASI, NSE 25 and NSE 20 have declined by 12.0%, 18.5% and 29.3%, respectively.
Equities turnover declined by 49.4% during the quarter to USD 438.6 mn in Q1’2020 from USD 866.6 mn in Q4’2019. During the week, equities turnover declined by 31.8% to USD 25.5 mn from USD 37.3 mn in the previous week, taking the YTD turnover to USD 453.7 mn. Foreign investors remained net sellers for the week, with a net selling position of USD 3.9 mn, from a net selling position of USD 17.6 mn recorded the previous week. The trend reflects the global equity markets with foreign investors disposing of riskier assets in favor of safe havens.
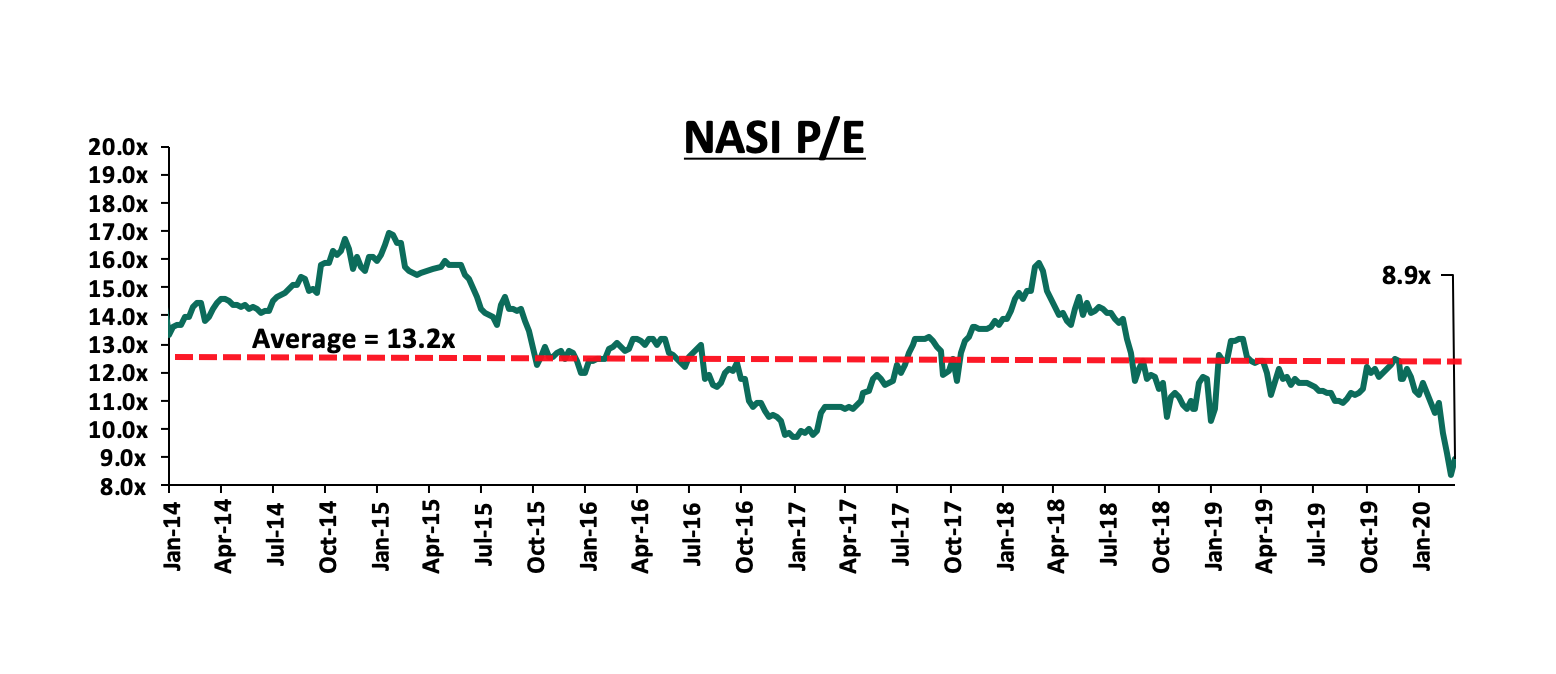
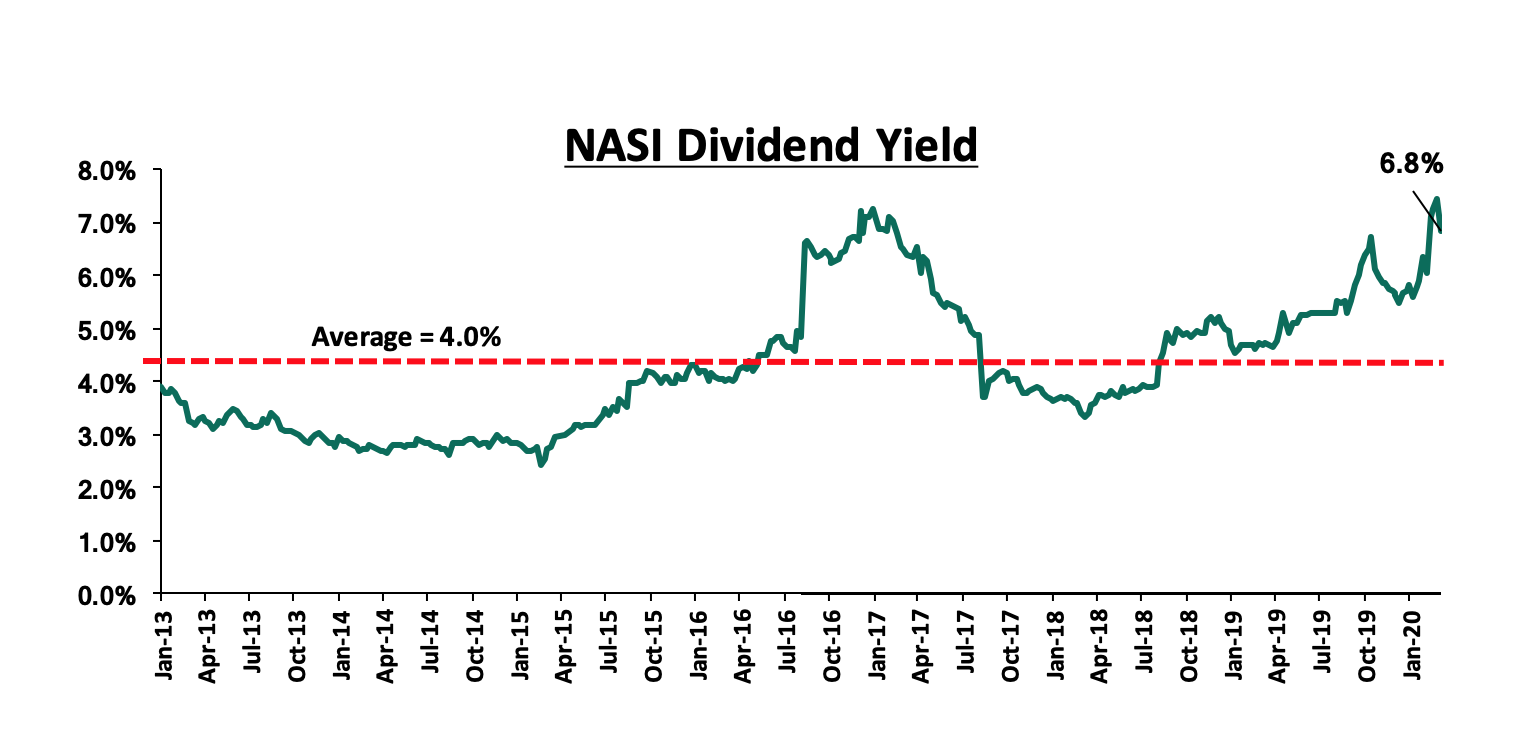
The market is currently trading at a price to earnings ratio (P/E) of 8.9x, 32.3% below the historical average of 13.2x, and a dividend yield of 6.8%, 2.8% points above the historical average of 4.0%. With the market trading at valuations below the historical average, we believe there is value in the market. The current P/E valuation of 8.9x is 7.8% below the most recent trough valuation of 9.7x experienced in the first week of February 2017, and 7.7% above the previous trough valuation of 8.3x experienced in December 2011. The charts below indicate the historical P/E and dividend yields of the market.
Kenyan Listed Banks Results
HF Group released their FY’2019 results during the week:
- HF Group released their FY’2019 financial results, recording a loss per share of Kshs 0.3 in FY’2019, an improvement from a loss per share of Kshs 1.6 recorded in FY’2018, not in-line with our expectations of Kshs 0.3 earnings per share. The performance of the group can be attributed to a faster 17.1% decline in total operating expenses, which out-paced the 6.0% decline in total operating income. For more information, see our HF Group FY’2019 Earnings Note.
During the quarter, listed banks in Kenya released their FY’2019 results, recording average core earnings per share growth of 9.9%, against a 13.8% growth in FY’2018. The table below highlights the performance of the banking sector, showing the performance using several metrics, and the key takeaways of the performance:
Key to note: Results released by NCBA were on a prospective basis (a continuation of CBA) representing the 9 months performance of CBA Bank and 3 months performance of NCBA Bank (Merged bank); prior year comparatives are of those of CBA Bank. In our analysis, we have used the pro forma combined statements of the two Banks as a 2018 comparative:
|
Bank |
Core EPS Growth |
Interest Income Growth |
Interest Expense Growth |
Net Interest Income Growth |
Net Interest Margin |
Non-Funded Income Growth |
NFI to Total Operating Income |
Growth in Total Fees & Commissions |
Deposit Growth |
Growth in Government Securities |
Loan to Deposit Ratio |
Loan Growth |
Return on Average Equity |
|||
|
I&M |
26.6% |
4.5% |
12.0% |
(0.5%) |
6.3% |
9.1% |
34.8% |
5.0% |
7.6% |
3.4% |
76.3% |
5.2% |
19.5% |
|||
|
ABSA |
21.2% |
6.8% |
11.0% |
5.4% |
7.7% |
9.1% |
31.4% |
8.8% |
14.6% |
32.3% |
82.0% |
9.9% |
16.7% |
|||
|
Equity |
13.8% |
12.2% |
24.8% |
8.6% |
8.5% |
19.0% |
40.6% |
16.1% |
14.2% |
6.2% |
75.9% |
23.3% |
22.8% |
|||
|
COOP |
12.4% |
1.4% |
0.8% |
1.7% |
8.5% |
33.1% |
5.9% |
34.7% |
8.7% |
46.8% |
80.1% |
8.7% |
19.2% |
|||
|
KCB |
4.9% |
12.2% |
4.4% |
15.0% |
8.2% |
22.6% |
33.4% |
39.0% |
27.7% |
41.0% |
78.0% |
17.4% |
20.4% |
|||
|
SCBK |
1.7% |
(5.9%) |
(22.4%) |
0.4% |
7.4% |
0.3% |
32.2% |
(4.7%) |
1.8% |
0.9% |
56.3% |
8.5% |
17.5% |
|||
|
Stanbic |
1.6% |
8.1% |
7.1% |
10.7% |
5.2% |
14.0% |
46.1% |
11.7% |
2.4% |
(12.7%) |
85.1% |
9.3% |
13.6% |
|||
|
DTBK |
1.6% |
(6.9%) |
(7.3%) |
(6.5%) |
5.6% |
6.2% |
23.6% |
3.1% |
(0.9%) |
12.9% |
71.1% |
3.1% |
12.9% |
|||
|
NCBA |
(12.4%) |
(34.1%) |
(34.0%) |
(34.2%) |
3.3% |
25.9% |
60.0% |
14.4% |
10.9% |
11.8% |
65.9% |
4.1% |
11.8% |
|||
|
HF |
N/A |
(15.4%) |
(16.7%) |
(13.2%) |
(0.2%) |
6.4% |
4.8% |
91.2% |
7.7% |
43.3% |
103.1% |
(11.3%) |
(1.1%) |
|||
|
FY'19 Mkt Weighted Average* |
9.9% |
4.8% |
5.1% |
4.9% |
7.5% |
17.2% |
32.4% |
18.7% |
12.8% |
19.9% |
75.5% |
13.2% |
18.9% |
|||
|
FY'18 Mkt Weighted Average** |
13.8% |
6.5% |
10.6% |
2.6% |
7.9% |
3.8% |
33.2% |
(1.0%) |
10.3% |
9.1% |
75.5% |
4.3% |
19.0% |
|||
|
|
*Market cap weighted as at 31/03/2020 |
|||||||||||||||
|
|
**Market cap weighted as at 31/12/2018 |
|||||||||||||||
Key takeaways from the table above include:
- All listed Kenyan banks have released results for FY’2018, and have recorded a 9.9% average increase in core Earnings Per Share (EPS), compared to a growth of 13.8% in FY’2018, and consequently, the Return on Average Equity (RoAE) declined marginally to 18.9%, from 19.0% in FY’2018. All listed banks apart from HF Group and NCBA have recorded growths in their core EPS, with I&M Holdings recording the highest growth of 26.6%, and the lowest being HF Group, which recorded a loss per share of Kshs 0.3,
- The sector recorded strong deposit growth, which came in at 12.8%, faster than the 10.3% growth recorded in FY’2018. Despite the relatively fast deposit growth, interest expenses growth of 5.1% was slower than the 10.6% growth recorded in FY’2018, indicating that banks have been able to mobilize relatively cheaper deposits after the September 2018 implementation of the Finance Act 2018, which saw the removal of the minimum interest rate payable on deposits, which stood at 70.0% of the Central Bank Rate (CBR). This helped mitigate high increments in interest expense, despite the relatively fast deposit growth,
- Average loan growth came in at 13.2%, which was faster than the 4.3% recorded in FY’2018, indicating that there was an improvement in credit extension, with banks targeting select segments such as corporate entities and Small and Medium Enterprises (SMEs), the growth in loans was accelerated towards the tail end of FY’2019 following the repeal of interest rate cap in November 2019. Government securities, on the other hand, recorded a growth of 19.9% y/y, which was faster compared to the loans and the 9.1% growth recorded in FY’2018. This highlights banks’ continued preference for investing in government securities, which offer better risk-adjusted returns. Interest income increased by 4.8%, compared to a growth of 6.5% recorded in FY’2018. The slower 4.8% growth in interest income compared to the 6.5% recorded in FY’2018, may be attributable to the lower yields on interest-earning assets compared to FY’2018. Consequently, the Net Interest Margin (NIM) in the banking sector currently stands at 7.5%, a decrease from the 7.9% recorded in FY’2018, despite the Net Interest Income increasing by 4.9% y/y, and,
- Non-funded income grew by 17.2% y/y, faster than 3.8% recorded in FY’2018. The growth in NFI was supported by the 18.7% average increase in total fee and commission income, which was faster than the (1.0%) growth recorded in FY’2018.
For a summary of the FY’2019 banking sector results and our key takeaways from the results, please see our Cytonn FY’2019 Banking Sector Performance Note. We shall be releasing our FY’2019 Banking Report on 3rd May 2020.
Quarterly Highlights:
During the quarter;
- The Central Bank of Kenya gave a go-ahead to Nigerian lender, Access Bank PLC to acquire a 100% stake in Transnational Bank PLC for an undisclosed amount, with Access Bank PLC targeting to enhance its corporate and retail banking business in Kenya through the acquisition. Access Bank is Nigeria’s largest lender by assets with an asset base of USD 16.1 bn (equivalent to Kshs 1.6 tn). The acquisition was in line with our expectation of consolidation in the Kenyan banking sector. For more information see our Cytonn Weekly #03/2020,
- SBM Bank (Kenya) Limited filed a petition under the Insolvency Act 2015 to liquidate East African Cables (EAC), which is unable to pay its obligations owed to the lender amounting to Kshs 285.0 mn. The listed firm has had banking facilities with other lenders such as Standard Bank Plc (Kenya & Tanzania), Stanchart, Ecobank Kenya and Equity Bank, and in a statement to stakeholders, EAC revealed that it has successfully completed the restructuring of 82.0% of its total debt obligations and has made significant progress to complete the remaining phase, including debt owed to SBM Bank. For more information see our Cytonn Monthly January 2020,
- Barclays Bank of Kenya officially commenced trading on the Nairobi Securities Exchange (NSE) as ABSA Bank Kenya Plc, after the bourse temporarily suspended the trading of the lender’s shares to allow the settlement of outstanding obligations as well as change of its trading ticker code, as the lender finalized its brand transition. The rebranding ended a process that began in 2018, following Barclays Plc’s reduction of its stake in Barclays Africa Group from 62.0% to 15.0%. For more information see our Cytonn Weekly #07/2020,
- Safaricom opened talks with a consortium of undisclosed investors who would be involved in the bid for one of the two Ethiopian telecom licenses due to the high entry costs expected to scale above Kshs 100.0 bn. In November 2019, the company entered into a joint bid with Vodacom (which owns a 35.0% stake in Safaricom); however, more telecommunication firms such as Vodafone (which also owns a 5.0% stake) are expected to join the partnership. For more information see our Cytonn Weekly #08/2020,
- Co-operative Bank of Kenya announced it has opened talks to acquire 100.0% stake in Jamii Bora Bank Limited. The announcement came months after Commercial Bank of Africa (CBA), dropped its cash buy-out offer and instead, merged with NIC Bank to form NCBA Group. The Central Bank of Kenya (CBK) welcomed the transaction, citing it will enhance the stability of the Kenyan Banking Sector and diversify the business models of the two institutions. For more information see our Cytonn Weekly #11/2020,
- KCB group announced that it has set aside a Kshs 30.0 bn credit facility, in an effort to cushion individuals and businesses grappling with the effects of the Coronavirus pandemic. The credit facility will be accessed through the lender's mobile lending platform, KCB M-Pesa, and will issue loans from Kshs 50.0 to Kshs 1.0 mn, depending on the customer’s credit rating. The loan facility offers repayment periods of 30-days, 60-days, and 90-days with interest rates of between 2.0% and 6.0%, per month. For more information see our Cytonn Weekly #13/2020,
- Equity group was given the green light by the Committee Responsible for Initial Determination (CID), a Commission mandated to monitor and investigate possible breaches of the COMESA Competition Regulations, to acquire a 66.5% controlling stake worth Kshs 10.9 bn in Banque Commerciale du Congo (BCDC), effectively valuing BCDC at Kshs 16.4 bn. For more information see our Cytonn Weekly #13/2020.
Equities Universe of Coverage:
Below is our Equities Universe of Coverage:
|
Banks |
Price at 27/03/2020 |
Price at 03/04/2020 |
w/w change |
q/q change |
YTD Change |
Year Open |
Target Price* |
Dividend Yield |
Upside/ Downside** |
P/TBv Multiple |
Recommendation |
|
Diamond Trust Bank |
81.8 |
87.8 |
7.3% |
(19.3%) |
(19.5%) |
109.0 |
189.0 |
3.1% |
118.5% |
0.4x |
Buy |
|
KCB Group*** |
35.0 |
34.6 |
(1.1%) |
(35.2%) |
(35.9%) |
54.0 |
64.2 |
10.1% |
95.7% |
0.9x |
Buy |
|
Kenya Reinsurance |
2.2 |
2.8 |
24.7% |
(22.1%) |
(8.3%) |
3.0 |
4.8 |
4.0% |
76.6% |
0.2x |
Buy |
|
Equity Group*** |
33.2 |
34.0 |
2.4% |
(36.5%) |
(36.4%) |
53.5 |
56.7 |
7.4% |
74.1% |
1.2x |
Buy |
|
Jubilee Holdings |
250.0 |
275.0 |
10.0% |
(24.0%) |
(21.7%) |
351.0 |
453.4 |
3.3% |
68.1% |
0.9x |
Buy |
|
I&M Holdings*** |
49.8 |
50.0 |
0.4% |
(6.0%) |
(7.4%) |
54.0 |
75.2 |
5.1% |
55.5% |
0.7x |
Buy |
|
Co-op Bank*** |
12.1 |
12.9 |
6.6% |
(21.4%) |
(21.1%) |
16.4 |
18.1 |
7.8% |
48.1% |
1.0x |
Buy |
|
Sanlam |
13.9 |
15.0 |
8.3% |
(12.8%) |
(12.8%) |
17.2 |
21.7 |
0.0% |
44.7% |
1.3x |
Buy |
|
ABSA Bank*** |
9.8 |
9.9 |
0.8% |
(24.3%) |
(25.8%) |
13.4 |
13.0 |
11.1% |
42.4% |
1.2x |
Buy |
|
NCBA |
26.4 |
28.3 |
7.2% |
(22.9%) |
(23.2%) |
36.9 |
37.0 |
6.2% |
36.9% |
0.7x |
Buy |
|
Standard Chartered |
178.3 |
185.0 |
3.8% |
(12.1%) |
(8.6%) |
202.5 |
211.6 |
10.8% |
25.2% |
1.4x |
Buy |
|
Liberty Holdings |
8.4 |
8.5 |
0.5% |
(18.5%) |
(18.1%) |
10.4 |
10.1 |
0.0% |
18.7% |
0.7x |
Buy |
|
CIC Group |
2.3 |
2.3 |
0.0% |
(17.9%) |
(14.6%) |
2.7 |
2.6 |
0.0% |
15.2% |
0.8x |
Accumulate |
|
Stanbic Holdings |
92.0 |
96.0 |
4.3% |
(15.8%) |
(12.1%) |
109.3 |
103.1 |
7.3% |
14.7% |
1.0x |
Accumulate |
|
Britam |
6.5 |
7.0 |
7.4% |
(27.8%) |
(22.7%) |
9.0 |
6.8 |
3.6% |
0.6% |
0.7x |
Lighten |
|
HF Group |
4.2 |
4.2 |
1.0% |
(35.3%) |
(35.0%) |
6.5 |
4.2 |
0.0% |
0.0% |
0.2x |
Lighten |
|
*Target Price as per Cytonn Analyst estimates **Upside/ (Downside) is adjusted for Dividend Yield ***Banks in which Cytonn and/or its affiliates are invested in |
|||||||||||
We are “Positive” on equities for investors as the sustained price declines have seen the market P/E decline to below its historical average. We expect increased market activity, and possibly increased inflows from foreign investors, as they take advantage of the attractive valuations, to support the positive performance.
During Q1’2020, the real estate sector recorded moderate activity with a notable decline in the launch of new projects into the market, attributable to a challenging financial environment. According to Kenya National Bureau of Statistics’ January 2020 issue of the Leading Economic Indicators, the value of building approvals in 2019 totalled Kshs 207.6 bn, 1.3% drop from Kshs 210.3 bn in 2018, a trend we expect will continue in 2020 with the rising uncertainty over credit availability in light of the ongoing economic crisis as well as constrained supply chains.
However, we expect the sector’s performance to be cushioned in the long-term by (i) the persistent high housing deficit standing at 2.0 mn units, (ii) continued infrastructural upgrades, and (iii) government economic stimulus packages and efforts aimed at enhancing the ease of doing business, such as:
- Introduction of the Land Information Management System (LIMS) in April 2020 to eliminate fraud and enable digitization of processes at the lands ministry,
- The recently assented 2020 Business Laws Bill, which is set to facilitate the transition process of the lands registries from manual to digital, generally enhancing the real estate sector’s processes, which has been a key challenge, and
- Stabilization of the interest rate environment with the Central Bank Rate having been reduced by 1.0% points to 7.25% from 8.25% to counter excess liquidity challenges stemming from the Coronavirus pandemic.
Market Performance:
I. Residential Sector
During the quarter, annual returns to investors averaged at 5.1%, 1.0% points lower than 6.1% recorded in Q4’2019. The decline is attributable to sluggish growth in prices which averaged at (0.1%), 1.2% points lower than 1.1% in Q4’2019 owing to a decline in demand in the face of a challenging economic environment. Rental yields, however, remained largely flat coming in at 5.2% compared to 5.0% in Q4’2019.
A: Detached Units Performance
Detached units registered average annual returns of 4.6%, 0.7% points lower than 5.3% in Q4’2019 owing to slow price appreciation, which dropped to 0.2% in Q1’2020 from 1.0% in Q4’2019. The average price per SQM came in at Kshs 136,599 from Kshs 141,968 amid a decline for detached houses prompting developers to offer price discounts to attract homebuyers.
The best-performing markets during the quarter were South C, Ruiru, and Ridgeways owing to relatively high returns at 6.2%, 5.6%, and 5.5%, respectively, in comparison to detached market’s average of 4.6%, as well as high market uptake averaging 21.1%, 20.6% and 22.5%, respectively, in comparison to the detached market’s average of 18.7%, evidence of the areas’ appeal to homebuyers attributable to the presence of good infrastructure and proximity to key commercial nodes. Overall, the upper mid-end sector registered the highest annual returns with 5.1% in comparison to 4.7% and 4.2% for lower-middle and high-end segments, respectively, evidence of demand from the growing middle class.
(All Values I Kshs Unless Stated Otherwise)
|
Detached Units Performance Q1'2020 |
|||||||
|
Area |
Average Price per SQM Q1'2020 |
Average Rent Per SQM Q1'2020 |
Average Occupancy Q1'2020 |
Average Annual Uptake Q1'2020 |
Average Rental Yield Q1'2020 |
Average Annual Price Appreciation Q1'2020 |
Total Returns Q1'2020 |
|
High-End |
|||||||
|
Runda |
213,685 |
876 |
91.1% |
18.3% |
4.6% |
0.5% |
5.1% |
|
Rosslyn |
172,556 |
830 |
86.2% |
18.3% |
4.9% |
(0.1%) |
4.8% |
|
Kitisuru |
204,845 |
771 |
90.0% |
17.2% |
4.3% |
0.0% |
4.3% |
|
Karen |
198,414 |
765 |
82.9% |
21.4% |
4.0% |
0.3% |
4.3% |
|
Lower Kabete |
146,007 |
435 |
69.0% |
16.6% |
2.5% |
0.0% |
2.5% |
|
Average |
187,101 |
736 |
83.8% |
18.3% |
4.1% |
0.1% |
4.2% |
|
Upper Mid-End |
|||||||
|
South C |
120,566 |
551 |
94.9% |
21.1% |
5.1% |
1.1% |
6.2% |
|
Ridgeways |
139,586 |
682 |
88.5% |
22.5% |
5.5% |
0.0% |
5.5% |
|
Runda Mumwe |
152,063 |
716 |
73.2% |
19.4% |
4.2% |
0.9% |
5.1% |
|
Langata |
143,376 |
599 |
87.4% |
18.7% |
4.8% |
(0.1%) |
4.7% |
|
Lavington |
178,169 |
720 |
80.2% |
18.8% |
3.9% |
0.0% |
3.9% |
|
Average |
146,752 |
654 |
84.8% |
20.1% |
4.7% |
0.4% |
5.1% |
|
Lower Mid-End |
|||||||
|
Ruiru |
85,686 |
392 |
67.3% |
20.6% |
5.6% |
0.1% |
5.6% |
|
Kitengela |
68,875 |
318 |
96.0% |
17.7% |
5.2% |
0.0% |
5.2% |
|
Athi River |
81,525 |
334 |
90.3% |
18.1% |
4.5% |
0.1% |
4.7% |
|
Ngong |
75,980 |
317 |
88.3% |
15.0% |
4.2% |
(0.3%) |
3.9% |
|
Juja |
67,651 |
238 |
90.1% |
17.0% |
3.8% |
0.0% |
3.8% |
|
Average |
75,944 |
320 |
86.4% |
17.7% |
4.7% |
0.0% |
4.7% |
Source: Cytonn Research 2020
Markets such as Lower Kabete, Juja, and Ngong registered flat price movement and thus, also registered the lowest returns at 2.5%, 3.8%, and 3.9%, respectively. This is also due to low rental yields as the areas attract low rental rates.
B: Apartments Performance
Returns to investors averaged 5.5% for apartments boosted by attractive rental yields witnessed in high-rise developments, owing to relatively high occupancy rates and thus, rental rates stability. However, price appreciation came in at (0.3%) attributable to a drop in demand from homebuyers as more people opted to rent rather than purchase in the face of a tough financial environment.
The lower mid-end Satellite Towns registered the highest returns averaging 5.9% compared to lower mid-end suburbs and upper mid-end segments with 5.5% and 5.3%, respectively, as more people opted to rent in areas such as Ruaka and Athi River where housing is affordable yet offering relative proximity to key commercial nodes, at a time when disposable incomes have continued to be affected by the rising cost of living amidst a slow economic growth, coupled by good infrastructure.
Langata, Athi River, Kilimani and Ruaka registered the highest returns to investors with 6.8%, 6.7% and 6.3%, respectively, boosted by constant demand from Nairobi’s young and working population as these areas continue to offer good infrastructure, security, presence of amenities while areas such as Athi River offer affordability.
(All Values in Kshs Unless Stated Otherwise)
|
Apartments Performance Q1'2020 |
|||||||
|
Area |
Average Price per SQM Q1'2020 |
Average Rent Per SQM Q1'2020 |
Average Occupancy Q1'2020 |
Average Annual Uptake 2020 |
Average Rental Yield Q1'2020 |
Average Annual Price Appreciation Q1'2020 |
Total Returns Q1’2020 |
|
Upper Mid-End |
|||||||
|
Kilimani |
115,985 |
650 |
94.5% |
25.7% |
6.6% |
0.1% |
6.7% |
|
Parklands |
113,703 |
637 |
94.1% |
16.7% |
6.2% |
(0.8%) |
5.4% |
|
Loresho |
111,277 |
563 |
90.8% |
17.9% |
5.5% |
(0.6%) |
4.9% |
|
Westlands |
129,199 |
687 |
77.6% |
21.5% |
5.2% |
(0.4%) |
4.8% |
|
Kileleshwa |
113,736 |
442 |
71.4% |
18.3% |
5.9% |
(1.6%) |
4.3% |
|
Average |
116,780 |
596 |
85.7% |
20.0% |
5.9% |
(0.6%) |
5.3% |
|
Lower Mid-End (Suburbs) |
|||||||
|
Langata |
105,466 |
515 |
94.5% |
21.3% |
5.6% |
1.2% |
6.8% |
|
South C |
108,306 |
589 |
97.7% |
20.3% |
6.0% |
0.1% |
6.1% |
|
Upper Kabete |
87,668 |
530 |
72.6% |
24.8% |
5.5% |
0.5% |
6.0% |
|
Donholm/Komarock |
77,085 |
430 |
86.1% |
16.6% |
6.7% |
(1.4%) |
5.4% |
|
Ngong Road |
96,104 |
546 |
72.0% |
20.0% |
5.0% |
(2.0%) |
3.0% |
|
Average |
94,926 |
522 |
84.6% |
20.6% |
5.8% |
(0.3%) |
5.5% |
|
Lower Mid-End (Satellite Towns) |
|||||||
|
Athi River |
63,485 |
361 |
88.0% |
18.2% |
6.3% |
0.5% |
6.8% |
|
Ruaka |
102,715 |
524 |
91.2% |
20.6% |
5.6% |
0.6% |
6.3% |
|
Kitengela |
61,789 |
325 |
82.7% |
12.5% |
5.7% |
0.0% |
5.7% |
|
Thindigua |
113,853 |
546 |
92.2% |
21.9% |
5.6% |
0.0% |
5.6% |
|
Syokimau |
68,072 |
373 |
84.6% |
15.1% |
5.8% |
(0.8%) |
5.0% |
|
Average |
81,983 |
426 |
87.7% |
17.7% |
5.8% |
0.1% |
5.9% |
Source: Cytonn Research 2020
Ngong Road, Syokimau and Kileleshwa recorded the lowest returns in the apartments market with 3.0%, 4.3% and 5.0%, respectively attributable to increased supply, thus, prompting developers to reduce prices due to growing competition.
Quarterly Highlights
During the quarter, the sector saw a decline in construction activity and the overall momentum in the government’s affordable housing initiative owing to insufficient funding. However:
- To boost mortgage uptake, The National Treasury Cabinet Secretary, Mr Ukur Yattani, announced that the Kenya Mortgage Refinance Company (KMRC) will from April 2020, begin lending money to local financial institutions at an annual interest rate of 5.0%, enabling them to write home loans at 7.0%, 6.0% points lower than the market rate of approximately 13.0%, according to the Central Bank of Kenya. For more information see Cytonn Monthly - February 2020
- United Kingdom Climate Investment (UKCI), a joint venture between the Green Investment Group, a UK-based specialist developer and investor of green infrastructure, and the United Kingdom Government’s Department for Business, pledged to invest GBP 30.0 mn (Kshs 3.9 bn) towards affordable green housing in Kenya, a major boost for the Kenyan Government’s affordable housing agenda. For more information, see Cytonn Weekly #04/2020
- Phase I of the Park Road Affordable Housing Project was completed and handed over to the government for public allocation, paving way for phase II which was set to for completion in June 2020. For more information, see Cytonn Weekly #03/2020
Various local developers also launched projects mainly in the lower mid-end segment:
- Liason Homes announced that they are set to begin construction of 32 bungalows in a gated community on Kenyatta Road in Nyeri Town, consisting of 3-bedroom units of 135 SQM priced at Kshs 4.9 mn and projected rent of Kshs 45,000. For more information see Cytonn Weekly #08/2020,
- Eboss Investment Company announced plans to develop 120 villas within a 20-acre gated community in Ruiru’s Membley area comprising of 3, 4 and 5-bedroom units selling at Kshs 18.5 mn, Kshs 21.0 mn and Kshs 24.0 mn, respectively. For more information see Cytonn Monthly - February 2020,
- Mizizi Africa Homes launched its 18-unit off-plan development located along Kenyatta Road in Juja. The development dubbed ‘Heritage Estate’ will comprise of 118 SQM 3-bedroom bungalow units selling at Kshs 3.8 mn. For more information, see Cytonn Weekly #10/2020, and
- Rama Homes announced its intentions to break ground on its 50-unit residential in South C that will consist of 130 SQM 3-bedroom and 150 SQM 4-bedroom apartments selling at Kshs 13.5 mn and Kshs 15.5 mn. For more information, see Cytonn Weekly #11/2020
Finally,
- In student housing, Helios Investments Partners, a private equity firm announced that it will be making a new equity investment of up to Kshs 10.0 bn in Acorn Holdings, the local property developer. Approximately Kshs 2.6 bn of the investment will be used to fund the development of student hostels, a sector the developer has been focusing on with Qwetu hostels. For more information on the student housing market in Kenya, see Cytonn Weekly #10/2020
Our outlook for the residential sector remains neutral. We expect a decline in transaction volumes and an overall dampening of the sector’s performance going forward owing to the COVID-19 global pandemic. The high demand for affordable housing and rapid population growth is, however, going to sustain the sector.
II. Commercial Office Sector
The commercial office sector recorded a marginal improvement in performance with rental yields recording a 0.3% points increase to 7.8% in Q1’2020, from 7.5% in FY’2019. This rise in rental yields was driven by a 1.5% points increase in occupancy rates to 81.7% in Q1’2020, from 80.2% recorded in FY’2019, an indication the sector’s recovery amidst a slowdown in construction activities allowing the existing demand to absorb the current supply.
Rental rates and asking prices remained fairly stagnated during the period at Kshs 96 per SQFT and Kshs 12,535 per SQFT, respectively, attributed to an oversupply of 5.6 mn SQFT office space as at 2019, which has created a bargaining chip for potential tenants, forcing developers and landlords to reduce or maintain prices and rents to remain competitive.
The table below highlights the performance of the Nairobi Metropolitan Area (NMA) Commercial Office sector over time:
(All values in Kshs unless stated otherwise)
|
Nairobi Metropolitan Area (NMA) Commercial Office Returns 2019-2020 |
||||||
|
Year |
Q1' 2019 |
H1' 2019 |
Q3' 2019 |
FY' 2019 |
Q1' 2020 |
∆ |
|
Occupancy % |
82.4% |
81.0% |
80.5% |
80.2% |
81.7% |
1.5% points |
|
Asking Rents |
100.3 |
96.6 |
96.0 |
96.2 |
96.7 |
0.5% |
|
Average Prices |
12,574 |
12,637 |
12,638 |
12,638 |
12,535 |
(0.8%) |
|
Average |
8.0% |
7.8% |
7.7% |
7.5% |
7.8% |
0.3% points |
|
||||||
Source: Cytonn Research 2020
In the Nairobi Metropolitan Area (NMA) submarket analysis, Gigiri, Karen and Westlands were the best performers in Q1’2020 recording rental yields of 9.8%, 8.4%, and 8.3%, respectively, due to their prime locations and availability of quality Grade A offices, enabling them to charge a premium on rentals.
Thika Road and Mombasa Road were the worst performers recording rental yields of 6.2% and 5.6%, respectively, attributed to; (i) poor location as a result of traffic congestions, (ii) the Mombasa Road’s zoning for industrial use, and (iii) lower quality office space.
The table below shows the Nairobi Metropolitan Area (NMA) sub-market performance:
(All values in Kshs unless stated otherwise)
|
Nairobi Metropolitan Area (NMA) Commercial Office Sub-market Performance Q1'2020 |
|||||||||||
|
Location |
Price Q1' |
Rent Q1' |
Occupancy |
Rental |
Price FY' |
Rent FY' 2019 |
Occupancy |
Rental |
Y/Y |
Y/Y Occupancy |
Y/Y Rental Yield |
|
Gigiri |
13,833 |
117.0 |
85.4% |
9.8% |
13,833 |
116.6 |
80.4% |
9.2% |
0.3% |
5.0% |
0.6% |
|
Karen |
13,665 |
110.6 |
86.8% |
8.4% |
13,665 |
111.1 |
85.3% |
8.3% |
(0.5%) |
1.5% |
0.1% |
|
Westlands |
12,370 |
102.7 |
81.3% |
8.3% |
12,370 |
104.3 |
80.3% |
8.3% |
(1.5%) |
1.0% |
0.0% |
|
Parklands |
12,369 |
97.1 |
83.3% |
8.2% |
12,369 |
97.4 |
82.4% |
8.1% |
(0.4%) |
0.9% |
0.1% |
|
Upper Hill |
12,397 |
98.3 |
81.9% |
7.7% |
12,397 |
98.5 |
80.0% |
7.5% |
(0.2%) |
1.9% |
0.2% |
|
Kilimani |
12,680 |
92.0 |
80.7% |
7.2% |
12,680 |
91.1 |
80.9% |
7.1% |
1.0% |
(0.2%) |
0.1% |
|
Nairobi CBD |
12,247 |
87.5 |
88.7% |
7.6% |
12,425 |
88.6 |
85.6% |
7.1% |
(1.3%) |
3.1% |
0.5% |
|
Thika Road |
12,600 |
84.3 |
79.7% |
6.2% |
12,600 |
84.3 |
80.4% |
6.3% |
0.0% |
(0.7%) |
(0.1%) |
|
Msa Road |
11,400 |
73.3 |
67.3% |
5.6% |
11,400 |
72.8 |
66.5% |
5.5% |
0.7% |
0.8% |
0.1% |
|
Average |
12,618 |
95.9 |
81.7% |
7.8% |
12,638 |
96.1 |
80.2% |
7.5% |
(0.2%) |
1.5% |
0.2% |
|
|||||||||||
Source: Cytonn Research 2020
We retain a neutral outlook for the commercial office sector with rental prices expected to remain fairly unchanged over the short term due to downward pressure arising from the existing oversupply in the market.
III. Retail Sector
The retail sector performance softened in Q1’2020, recording a 0.1% points decline in rental yield to 7.7% in Q1’ 2020 from 7.8% in FY’ 2019. This was driven by a decline in average rents by 1.6% to Kshs 172.7 per SQFT in Q1’ 2020 from Kshs 175.5 per SQFT in FY’2019 attributed to; (i) constrained spending power among consumers resulting from a tough financial environment, and (ii) an oversupply of retail space in certain locations which has resulted in pressure on landlords to provide concessions and other incentives to attract new or retain existing tenants.
Average occupancy rates, however, increased marginally by 0.4% points to 76.3% from 75.9% recorded in FY’2019. This can be attributed to the continued entry of international retailers and the expansion of local retailers such as Naivas and Quickmart.
The performance of the retail sector in Nairobi over time is as shown below:
(All values in Kshs unless stated otherwise)
|
Summary of Retail Sector Performance 2019-2020 |
|||||||
|
Item |
Q1' 2019 |
H1' 2019 |
Q3' 2019 |
FY' 2019 |
Q1' 2020 |
∆ Y/Y |
∆ Q1’2020 |
|
Average Asking Rents (Kshs/SQFT) |
174.3 |
170.0 |
167.0 |
175.5 |
172.7 |
(0.9%) |
(1.6%) |
|
Average Occupancy (%) |
76.8% |
75.6% |
74.5% |
75.9% |
76.3% |
(0.5%) points |
0.4% points |
|
Average Rental Yields |
8.5% |
8.2% |
8.0% |
7.8% |
7.7% |
(0.7%) points |
(0.1%) points |
|
|||||||
Source: Cytonn Research 2020
In terms of submarket analysis, Westlands and Karen were the best performing retail nodes with average rental yields of 10.0% and 9.6%. This is attributed to the premiums charged on rents in these nodes, as the areas are affluent neighbourhoods hosting middle to high-end income earners with high consumer purchasing power.
Mombasa Road and Satellite towns recorded the lowest rental yields at 6.4% and 6.0% respectively. The poor performance is attributable to low rental charges of Kshs 152.5 per SQFT and Kshs 135.0 per SQFT as a result of continued traffic congestion along Mombasa road and competition from informal retail space in Satellite towns.
The table below shows the submarket performance in the Nairobi Metropolitan Area (NMA):
(All values in Kshs unless stated otherwise)
|
Nairobi Metropolitan Area (NMA) Retail Submarket Performance FY'2019-Q1'2020 |
||||||||
|
Row Labels |
Rent Kshs/SQFT Q1’ 2020 |
Occupancy Q1’ 2020 |
Rental Yield Q1’ 2020 |
Rent Kshs/SQFT FY’ 2019 |
Occupancy FY’ 2019 |
Rental Yield FY’ 2019 |
y/y ∆ in Occupancy |
y/y ∆ in |
|
Westlands |
210.3 |
82.2% |
10.0% |
215.0 |
82.8% |
10.30% |
(0.6%) |
(0.3%) |
|
Karen |
220.0 |
81.9% |
9.6% |
222.0 |
80.0% |
9.5% |
1.9% |
0.1% |
|
Ngong Rd |
186.3 |
80.5% |
8.5% |
181.0 |
80.5% |
8.3% |
0.0% |
0.2% |
|
Kilimani |
164.2 |
85.5% |
8.5% |
167.0 |
87.4% |
8.8% |
(1.9%) |
(0.3%) |
|
Kiambu Rd |
175.4 |
70.3% |
7.3% |
180.0 |
67.6% |
7.2% |
2.7% |
0.1% |
|
Thika Rd |
170.4 |
73.0% |
7.0% |
173.0 |
72.8% |
7.1% |
0.2% |
(0.1%) |
|
Eastlands |
148.2 |
71.8% |
6.8% |
150.0 |
71.7% |
6.8% |
0.1% |
0.0% |
|
Mombasa Rd |
152.5 |
69.3% |
6.4% |
156.0 |
66.8% |
6.3% |
2.5% |
0.1% |
|
Satellite town |
135.0 |
74.5% |
6.0% |
136.0 |
73.3% |
5.9% |
1.2% |
0.1% |
|
Average |
172.7 |
76.3% |
7.7% |
175.6 |
75.9% |
7.8% |
0.7% |
0.0% |
|
||||||||
Source: Cytonn Research 2020
Notable highlights during the quarter included:
- Naivas Supermarket, a local retailer, opened its 63rd store in Mountain View Mall, along Waiyaki Way. For more, see Cytonn Weekly #12/2020,
- Optica, a local eye-wear retailer, opened its 40th Kenyan outlet at Two Rivers Mall along Limuru Road. For more, see Cytonn Weekly #12/2020,
- Istikbal, a Turkish home furnish retailer, opened its first Kenyan outlet at Panesar Center along Mombasa Road. For more, see Cytonn Weekly #11/2020,
- Chandarana Food Plus, a local supermarket chain, opened its latest outlet in Signature Mall in Kitengela town. For more, see Cytonn Monthly February 2020,
- Tendam Group, a Spanish fashion retailer, opened its first Kenyan outlet at the Westgate shopping mall in Westlands. For more, see Cytonn Weekly #06/2020,
- Giordano, a Hong Kong fashion chain, opened its first Kenyan outlet at Garden City Mall. For more, see Cytonn Weekly #08/2020.
Despite the existing oversupply of retail office space by approximately 2.8 mn SQFT as at 2019, we expect continued activities in the sector, supported by the continued entry of international retailers and expansion of local retailers which will cushion the performance of the sector in 2020.
IV. Hospitality Sector
During Q1’2020, the Kenya National Bureau of Statistics (KNBS) released their December 2019 issue of Leading Economic Indicators December 2019, highlighting a 6.2% growth in the number of tourist arrivals to 1.6 mn in FY’2019 from 1. 5 mn during FY’2018, evidence of international confidence in Kenya as a preferred travel destination for both business and leisure. This is supported by; (i) the continued marketing of Kenya as an experience destination, (ii) political stability, (iii) improving air transport operations, and (iv) improved security in the country. According to Cytonn Real Estate Market Outlook 2020, the number of arrivals was projected to come in at 2.3 mn for FY’2020, supported by the factors mentioned above. We, however, note that the number of tourist arrivals during the first quarter of the year has been significantly affected by the current COVID- 19 pandemic which has led to the cancelling of meetings, conferences and events, the banning of all international flights and reduced local direct flights. Nevertheless, in our view, the tourist arrivals will bounce back once the pandemic is contained, coupled by government compensating factors such as the Tourism Ministry’s post- corona recovery kitty of Kshs 500.0 mn, which will be used to restore confidence in Kenya as a preferred travel destination globally.
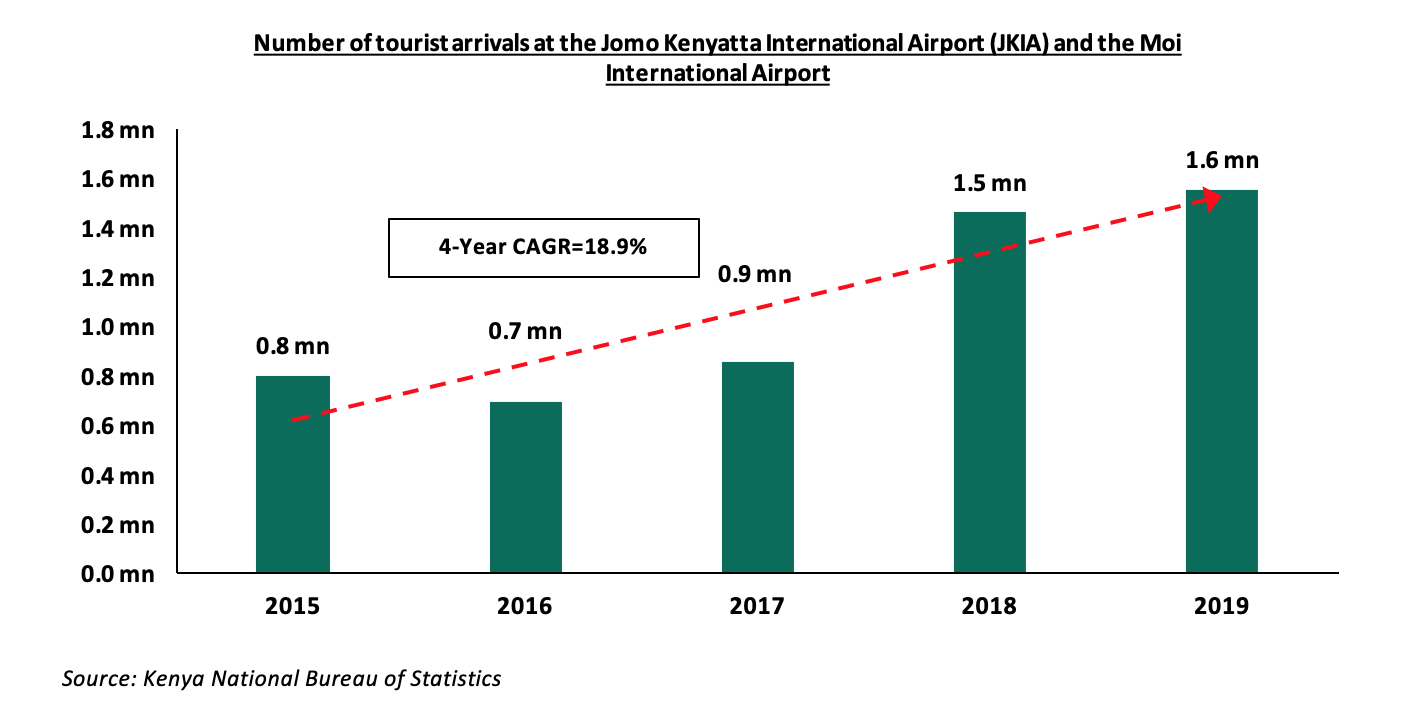
Other highlights during the quarter;
- In January, PrideInn, a local hospitality group, revealed plans of undertaking its first management facility, Azure Hotel, a Kshs 1.2 bn five-star hotel with 164-rooms located in Westlands. For more information, please see our Cytonn Weekly #04/2020,
- Kenya was ranked among the top five African destinations for tourism by Safari Bookings, an online site that compares Africa’s Safaris, coming in after Botswana, Tanzania, Zambia, and Zimbabwe For more information, please see our Cytonn Weekly #08/2020,
- Omotic General Trading, an Ethiopian hospitality chain, announced plans to open its first Kenyan 60-room lodge at the Masai Mara Game Reserve in Narok County. For more analysis, please see our Cytonn Weekly #11/2020,
- In March, the President of Kenya, H.E Hon. Uhuru Kenyatta temporarily revoked the ban restricting government corporations from holding conferences in privately-owned hotels in a bid to cushion the hospitality sector’s earnings following the outbreak of the Corona Virus. For more information, please see our Cytonn Weekly #12/2020, and
- The sector continued to be negatively affected by several adjustments in the country aimed at containing the spread of the Coronavirus. These include; (i) the government implemented a ban on all international flights effective Wednesday 25th March 2020, except for cargo flights, (ii) temporary closure of some major hotels in Kenya, such as Tribe Hotel and Ole Sereni in Nairobi County; Grand Royal Swiss and Sovereign Hotel, in Kisumu County, (iii) suspension of operations at the Masai Mara Game Reserve in Narok County, (iv) Villa Rosa Kempinski Hotel limited its business to room service only, and (v) Jambo jet, a local airline carrier, combined some of its flights to Western Kenya, mainly trips to Eldoret and Kisumu, to boost the number of passengers per flight, and reduce air travel fares in response to the low number of passengers. For more analysis please see our Cytonn Weekly #13/2020.
We expect that the hospitality sector will be hit significantly by the Corona Virus Pandemic owing to its heavy reliance upon tourism and the MICE (Meetings, Incentives, Exhibitions and Conferencing) sectors. However, we expect the performance to be cushioned by domestic tourism as airlines such as the Kenya Airways are still operating domestic flights, in addition to government compensating factors aimed at aiding the sector’s post- corona recovery strategy.
V. Land
During Q1’2020, the land sector recorded an overall annualized capital appreciation of 0.2%, with unserviced land in satellite towns such as Ongata Rongai and Ngong recording the highest annualized capital appreciation at 0.7%, attributable to the growing demand for land in these areas fueled by the affordability with an asking price of approximately Kshs 23.0 mn per acre compared to suburbs with relatively high asking prices of up to Kshs 441.6 mn per acre.
The table below shows the performance of the sector during the quarter:
(All values in Kshs unless stated otherwise)
|
Summary of Nairobi Metropolitan Area Land Sector Performance Across the Nodes |
|||
|
Nodes |
*Price in Q1'2019 |
*Price in Q1'2020 |
Capital Appreciation |
|
Satellite Towns- Unserviced Land |
22.9 mn |
23.0 mn |
0.7% |
|
Nairobi Suburbs- High Rise Residential Areas |
135.4 mn |
136.3 mn |
0.3% |
|
Satellite Towns- Site and Service Schemes |
14.4 mn |
14.5 mn |
0.3% |
|
Nairobi Suburbs- Low Rise Residential Areas |
86.7 mn |
86.8 mn |
0.3% |
|
Nairobi Suburbs- Commercial Zones |
443.3 mn |
441.6 mn |
(0.4%) |
|
Average |
0.2% |
||
|
*Asking land price per acre
|
|||
Source: Cytonn Research 2020
The performance per node was as follows:
I. Satellite Towns- Unserviced Land
(All values in Kshs unless stated otherwise)
|
Satellite Towns |
|||
|
Location |
Q1'2019 |
Q1'2020 |
Annualized Capital Appreciation |
|
Ngong |
13.6 mn |
13.9 mn |
2.0% |
|
Ongata Rongai |
11.3 mn |
11.4 mn |
1.3% |
|
Limuru |
17.4 mn |
17.5 mn |
0.6% |
|
Athi River |
3.8 mn |
3.8 mn |
0.5% |
|
Ruaka |
90.9 mn |
91.0 mn |
0.2% |
|
Juja |
10.2 mn |
10.2 mn |
0.1% |
|
Utawala |
12.9 mn |
12.9 mn |
0.0% |
|
Average |
22.9 mn |
23.0 mn |
0.7% |
|
|||
II. Nairobi Suburbs- High Rise Residential Areas
(All values in Kshs unless stated otherwise)
|
High Rise Residential Areas |
|||
|
Location |
*Price in Q1'2019 |
*Price in Q1'2020 |
Capital Appreciation |
|
Kileleshwa |
308.8 mn |
312.4 mn |
1.2% |
|
Embakasi |
68.1 mn |
68.7 mn |
0.9% |
|
Kasarani |
64.7 mn |
64.7 mn |
0.1% |
|
Dagoretti |
100.0 mn |
99.2 mn |
(0.8%) |
|
Average |
135.4 mn |
136.3 mn |
0.3% |
|
|||
III. Serviced Land in Satellite Towns
(All values in Kshs unless stated otherwise)
|
Site and Service Schemes |
|||
|
Location |
Q1'2019 |
Q1'2020 |
Annualized Capital Appreciation |
|
Ruiru |
20.7 mn |
21.1 mn |
2.2% |
|
Ruai |
13.8 mn |
14.0 mn |
1.0% |
|
Syokimau-Mlolongo |
11.9 mn |
12.0 mn |
1.0% |
|
Thika |
10.1 mn |
10.1 mn |
(0.3%) |
|
Ongata Rongai |
16.9 mn |
16.7 mn |
(0.8%) |
|
Athi River |
13.0 mn |
12.8 mn |
(1.2%) |
|
Average |
14.4 mn |
14.5 mn |
0.3% |
|
|||
IV. Nairobi Suburbs- Low- Rise Residential Areas
(All values in Kshs unless stated otherwise)
|
Low Rise Residential Areas |
|||
|
Location |
*Price in Q1'2019 |
*Price in Q1'2020 |
Capital Appreciation |
|
Runda |
69.3 mn |
70.3 mn |
1.5% |
|
Karen |
56.5 mn |
57.0 mn |
0.9% |
|
Kitisuru |
77.4 mn |
77.4 mn |
0.0% |
|
Spring Valley |
164.9 mn |
164.3 mn |
(0.4%) |
|
Ridgeways |
65.5 mn |
65.2 mn |
(0.4%) |
|
Average |
86.7 mn |
86.8 mn |
0.3% |
|
|||
V. Nairobi Suburbs- Commercial Zones
(All values in Kshs unless stated otherwise)
|
Commercial Zones |
|||
|
Location |
*Price in Q1'2019 |
*Price in Q1'2020 |
Capital Appreciation |
|
Kilimani |
386.6 mn |
387.1 mn |
0.2% |
|
Westlands |
494.6 mn |
494.1 mn |
(0.1%) |
|
Riverside |
389.2 mn |
386.4 mn |
(0.7%) |
|
Upper Hill |
502.7 mn |
498.8 mn |
(0.8%) |
|
Average |
445.9 mn |
441.6 mn |
(0.4%) |
|
|||
The investment opportunity in the land sector lies in sub-markets such as Runda and Kileleshwa which recorded relatively high annualized capital appreciation of 1.5% and 1.2%, respectively, and satellite towns such as Ngong for unserviced land, and Ruiru for site and service schemes which were the best performing sub-markets with average annualized capital appreciation of 2.0%, and 2.2%, respectively.
We expect the land sector to record improved performance going forward, driven mainly by; (i) the growing demand for development land especially in the satellite towns as developers strive to drive the government’s Big Four government agenda on the provision of affordable housing, (ii) improving infrastructure, and (iii) increased demand for development land by the growing middle income population.
VI. Listed Real Estate
During the first quarter of 2020, the I-REIT continued to perform poorly trading at Kshs 8.8 on average, a 57.5% drop from its initial price of Kshs 20.75 as at November 2015. The instrument’s price per share reduced by 8.3% YTD closing at Kshs 8.0 per share from Kshs 9.6 at the beginning of the year, as shown below:
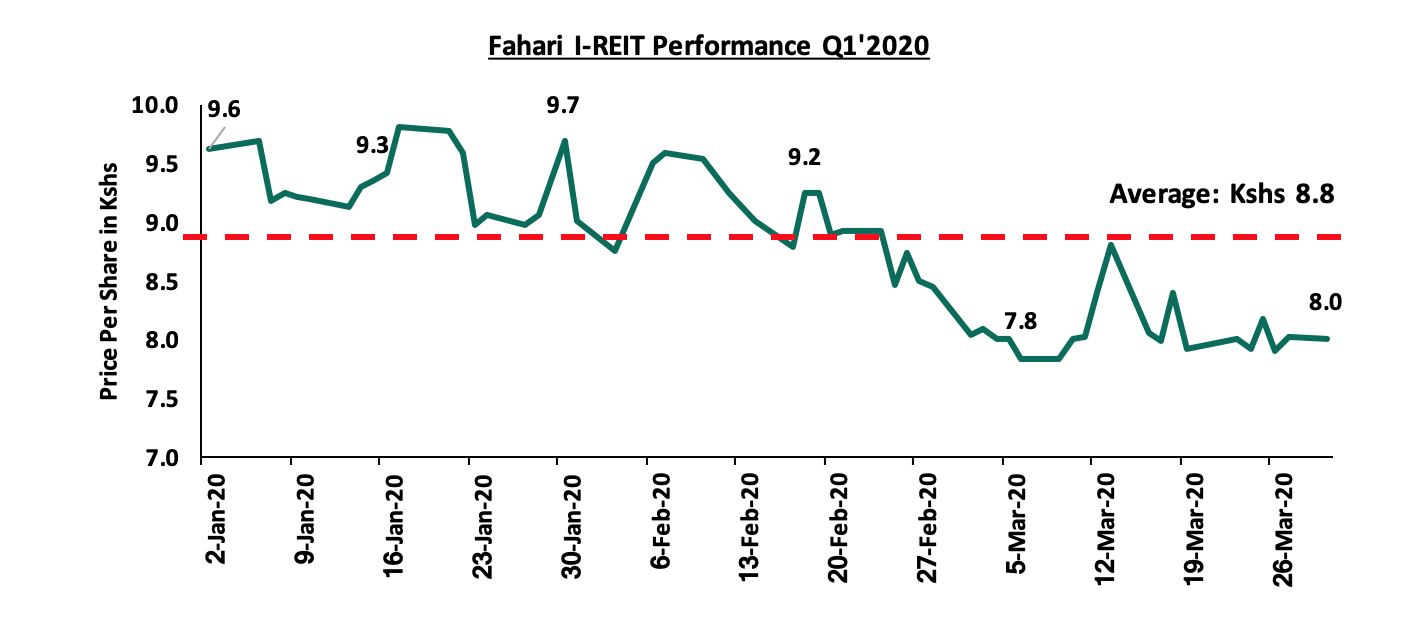
Other notable activities on the listed real estate in Q1’2020 include:
- The Capital Markets Authority (CMA) and the Competition Authority of Kenya (CAK) made approval for the transfer of the Fahari I- REIT by Stanlib Kenya to ICEA Lion Asset Management, a local Kenyan fund manager. For more information see Cytonn weekly #10/2020
- Acorn Holdings Limited, a local property developer, announced that it was structuring a Development Real Estate Investment Trust (D-REIT), to facilitate the sale of its stake in branded hostels Qwetu and Qejani’s development pipeline to institutional investors and high net-worth individuals. For more information see Cytonn weekly #10/2020
Our outlook for listed real estate is negative constrained by the declining performance of the Stanlib Fahari I-REIT as a result of continued lack of investor interest for the instrument.
Real Estate Performance Summary and Outlook:
Below is a summary of the sectorial performance in Q1’2020 and investment opportunities:
|
Theme |
Thematic Performance and Outlook Q1’2020 |
Outlook |
|
Residential |
Annual returns to investors averaged at 5.1%, 1.0% points lower than 6.1% recorded in Q4’2019. The decline is attributable to sluggish growth in prices which averaged at (0.1%), 1.2% points lower than 1.1% in Q4’2019 owing to a decline in demand on the back of a challenging economic environment. Rental yields, however, remained largely flat coming in at 5.2% compared to 5.0% in Q4’2019. Returns to investors averaged 5.5% for apartments compared to detached units with 4.6% with Langata, Athi River, Kilimani and Ruaka having the highest returns to investors at 6.8%, 6.7% and 6.3%, respectively, boosted by constant demand from Nairobi’s young and working population. |
Neutral |
|
We expect uptake to remain suppressed in 2020 as cash flows for investors and homebuyers come under pressure in light of the ongoing pandemic. With supply slowing down, the constant high demand for affordable housing coupled by rapid population growth is, however, set to sustain the sector throughout the year. As such, the opportunity for the lower mid-end market is in Satellite Towns such as Athi River and Ruaka, and suburbs such as Langata, which continued to post above-market returns and uptake while areas such as Kilimani had the best performing in the upper middle market due to attractive rental yields. |
||
|
Office |
The commercial office sector performance improved marginally in Q1’2020 recording a 0.3% points and 1.5% point’s increase in average rental yields and occupancy rates, to 7.8% and 81.7% in Q1’2020, from 7.5% and 80.2%, respectively, in FY’2019. Rental rates and asking prices remained fairly stagnated during the period at Kshs 96 per SQFT and Kshs 12,535 per SQFT, respectively, attributed to an oversupply of 5.6 mn SQFT office space as at 2019. |
Neutral |
|
Our outlook for the commercial office sector is neutral with rental prices expected to remain fairly unchanged over the short term due to downward pressure arising from the existing oversupply in the market. The investment opportunity is in mixed-use developments (MUDs) and serviced offices that attract yields of 9.2% and 13.4%, respectively. |
||
|
Retail |
The retail sector performance softened slightly during the quarter with yields declining by 0.1% points to 7.7% in Q1’2020 from 7.8% in FY’2019 attributed to a tough economic environment that continued to affect consumer’s spending power as well as the existing oversupply of retail space estimated at 2.8 mn SQFT as at 2019. The continued entry of international retailers drove up average occupancy rates by 0.4% points to 76.3% in Q1’2020 from 75.9% recorded in FY’2019. |
Neutral |
|
Despite the existing oversupply of retail office space by approximately 2.8 mn SQFT as at 2019, we expect continued activities in the sector, supported by the continued entry of international retailers and expansion of local retailers, which will cushion the performance of the sector in 2020. The investment opportunity is in mixed-use concepts in areas such as Karen and Kilimani, with attractive yields of 10.6% and 8.4%, respectively. |
||
|
Hospitality |
The sector recorded reduced activities as the number of tourist arrivals during Q1’2020, has been significantly affected by the current COVID- 19 pandemic which has led to the cancelling of meetings, conferences and events, the banning of all international flights and reduced local direct flights. |
Neutral |
|
We expect that the sector will be hit significantly by the Corona Virus Pandemic owing to its heavy reliance upon tourism and the MICE. However, we expect the performance to be cushioned by domestic tourism, in addition to government compensating factors aimed at aiding the sector’s post- corona recovery strategy. The investment opportunity lies in; (i) serviced apartments in Westlands and Parklands with a rental yield of above 10.0% |
||
|
Land |
The sector recorded an overall annualized capital appreciation of 0.2% in Q1’2020, attributable to the growing demand for land especially in satellite towns fueled by affordability and improving infrastructure |
Positive |
|
The investment opportunity lies mainly in satellite towns such as Ngong for un-serviced land, and Ruiru for site and service schemes with an average annualized capital appreciation of 8.4%, and 9.0%, respectively, attributed to the relatively high demand for land in these areas, fueled by the affordable housing initiative, improving infrastructure in addition to satellite towns acting as Nairobi’s dormitory with the majority of the population moving away from the Central Business District. |
||
|
Listed Real Estate |
The Stanlib Fahari I-REIT continued to perform poorly trading at Kshs 8.8 on average, a 57.5% drop from its initial price of Kshs 20.75 as at November 2015. The instrument’s price per share reduced by 8.3% YTD closing at Kshs 8.0 per share from Kshs 9.6 at the beginning of the year. |
Neutral |
|
Our outlook for listed real estate is neutral in line with the performance of the office and retail sectors with the continued poor investor perception being the key hindrance to the I-REIT’s performance. |
The real estate outlook is neutral for five sectors, that is, residential, office, retail, hospitality and listed real estate, while land remains positive. Thus, our overall outlook for the real estate sector is neutral with key drivers being the constant housing deficit, infrastructural development, foreign investment mainly directed towards the retail sector, and government efforts to improve processes in the built environment in a bid to improve Kenya’s ease of doing business. However, we expect the sector’s performance to be dampened by the current COVID-19 pandemic, which is set to see Kenya’s 2020 GDP growth reduce by 10% to 25%, as well as surplus supply in various sectors such as office and retail.
Disclaimer: The views expressed in this publication are those of the writers where particulars are not warranted. This publication is meant for general information only and is not a warranty, representation, advice or solicitation of any nature. Readers are advised in all circumstances to seek the advice of a registered investment advisor.

- Talk to us
- Kenya
- P.O Box 20695 - 00200, Nairobi, Kenya
- Cell +254709101200
- Tel +254709101200
- WhatsApp +254741676635
- United States
- +254709101200
- DOWNLOAD OUR APP
-


- Kenya
- 8th Floor, Pinetree Plaza, Kaburu Drive, Ngong Road, Nairobi, Kenya
- USA
- Suite 1150, 1775 Eye Street NW, USA, Washington DC 20006, USA
- Investments
- High Yield
- Private Equity
- Real Estate
- Real Estate
- RiverRun Estates
- Cytonn Towers
- The Ridge
- Taraji Heights
- The Alma