Cytonn Weekly #12/2026
By Research Team, Mar 29, 2026
Executive Summary
Fixed Income
This week, T-bills were undersubscribed for the first time in eight weeks, with the overall subscription rate coming in at 45.5%, lower than the subscription rate of 146.9% recorded the previous week. Investors’ preference for the shorter 91-day paper waned, with the paper receiving bids worth Kshs 2.6 bn against the offered Kshs 4.0 bn, translating to a subscription rate of 64.9%, lower than the subscription rate of 361.3%, recorded the previous week. The subscription rate for the 182-day paper decreased significantly to 28.3% from 103.0% recorded the previous week, while that of the 364-day paper decreased significantly to 54.9% from 105.1% recorded the previous week. The government accepted a total of Kshs 10.86 bn worth of bids out of Kshs 10.92 bn bids received, translating to an acceptance rate of 99.4%. The yields on the government papers were on a downward trajectory with the yields on the 91-day papers decreasing the most by 14.2 bps to 7.4% from the 7.6% recorded the previous week. The yields on the 364-day paper decreased by 6.3 bps to 8.3% from 8.4% recorded the previous week, while the yields on the 182-day paper decreased by 1.1 bps to remain relatively unchanged from the 7.8% recorded the previous week;
In the primary bond market, the government is looking to raise Kshs 20.0 bn through the switch auction from FXD1/2016/010 to FXD1/2018/015 with fixed coupon rates of 15.0% and 12.7% respectively and tenors to maturity of 0.3 years and 7.1 years respectively. The period of sale for the two bonds opened on Monday 23rd March 2026 and will close on Monday 13th April 2026. Our bidding ranges for the switch to FXD1/2016/010 from FXD1/2018/015 is 12.25%-12.55% respectively;
We are projecting the y/y inflation rate for March 2026 will increase to within the range of 4.4%- 4.6%;
Equities
During the week, the equities market was on a downward trajectory, with NSE 10, NSE 25, NASI, and NSE 20 declining by 9.0%, 7.5%, 6.7% and 6.6% respectively, taking the YTD performance to gains of 8.8%, 5.6%, 4.3% and 2.6% for NSE 20, NSE 25, NASI and NSE 10 respectively. The equities market performance was mainly driven by losses recorded by large cap stocks such as ABSA, KCB and COOP of 14.5%, 10.5% and 9.8% respectively;
Also, during the week, the banking sector index declined by 8.0% to 221.9 from 241.3 recorded the previous week. This is attributable to losses recorded by stocks such as ABSA, KCB and COOP of 14.5%, 10.5% and 9.8% respectively;
During the week, Kenya Re corporation released their FY’2025 results, recording a 12.9% decrease in Profit After Tax to Kshs 3.9 bn, from the Kshs 4.4 bn recorded in FY’2024. The performance was mainly driven by a 11.1% decrease in Insurance Revenue to Kshs 12.6 bn from Kshs 14.2 bn, coupled with a 6.0% increase in Insurance Service Expense to Kshs 11.1 bn from Kshs 10.5 bn, and a 91.0% increase in Net Expense from reinsurance contracts held to Kshs 1.4 bn from Kshs 0.7 bn;
Real Estate
During the week, state-backed mortgage lender, Kenya Mortgage Refinance Company (KMRC) released its FY’2025 financial results, which reported a 24.2% decrease in Profit After Tax (PAT) to Kshs 1.0 bn from Kshs 1.3 mn recorded in FY’2024 majorly attributable to 19.6% decrease in net interest income to Kshs 1.7 bn in FY’2025 from 2.2 bn in FY’2024;
During the week, the government initiated a road infrastructure project in Kenya following the award of a Kshs 2.5 bn contract by the Kenya National Highways Authority (KENHA) for the tarmacking of the Rumuruti-Nanyuki road. The project forms part of ongoing efforts to improve road connectivity across secondary urban corridors, focusing on enhancing accessibility within Laikipia County and strengthening linkages between towns such as Rumuruti and Nanyuki;
On the Unquoted Securities Platform, Acorn D-REIT and I-REIT traded at Kshs 27.4 and Kshs 23.2 per unit, respectively, as per the last updated data on 13th March 2026. Additionally, ILAM Fahari I-REIT traded at Kshs 11.0 per share as of 13th March 2026 representing a 45.0% loss from the Kshs 20.0 inception price;
Focus of the Week
Over the years, Kenya has grappled with rapid population growth and high urbanization rates, exacerbating the country's housing shortage. In response to this challenge, the government has implemented different measures including the Affordable Housing Program (AHP) under the Bottom-Up Economic Transformation Agenda (BETA) and the establishment of the Kenya Mortgage Refinance Company (KMRC). KMRC's mandate is to provide long-term funds to primary mortgage lenders (PMLs) for onward lending to increase the availability of affordable home loans to Kenyans. Since its inception, KMRC has made notable progress, having disbursed 4,600 loans as of 2025, contributing to increased homeownership in the country. While KMRC has achieved significant milestones, there remains a substantial gap in the annual housing deficit and the mortgage market remains underdeveloped.
Investment Updates:
- Weekly Rates: Cytonn Money Market Fund closed the week at a yield of 11.5% p.a. To invest, dial *809# or download the Cytonn App from Google Play store here or from the Appstore here;
- We continue to offer Wealth Management Training every Tuesday, from 7:00 pm to 8:00 pm. The training aims to grow financial literacy among the general public. To register for any of our Wealth Management Trainings, click here;
- If interested in our Private Wealth Management Training for your employees or investment group, please get in touch with us through wmt@cytonn.com;
- Cytonn Insurance Agency acts as an intermediary for those looking to secure their assets and loved ones’ future through insurance namely; Motor, Medical, Life, Property, WIBA, Credit and Fire and Burglary insurance covers. For assistance, get in touch with us through insuranceagency@cytonn.com;
- Cytonn Asset Managers Limited (CAML) continues to offer pension products to meet the needs of both individual clients who want to save for their retirement during their working years and Institutional clients that want to contribute on behalf of their employees to help them build their retirement pot. To more about our pension schemes, kindly get in touch with us through pensions@cytonn.com;
Hospitality Updates:
- We currently have promotions for Staycations. Visit cysuites.com/offers for details or email us at sales@cysuites.com;
Money Markets, T-Bills Primary Auction:
This week, T-bills were undersubscribed for the first time in eight weeks, with the overall subscription rate coming in at 45.5%, lower than the subscription rate of 146.9% recorded the previous week. Investors’ preference for the shorter 91-day paper waned, with the paper receiving bids worth Kshs 2.6 bn against the offered Kshs 4.0 bn, translating to a subscription rate of 64.9%, lower than the subscription rate of 361.3%, recorded the previous week. The subscription rate for the 182-day paper decreased significantly to 28.3% from 103.0% recorded the previous week, while that of the 364-day paper decreased significantly to 54.9% from 105.1% recorded the previous week. The government accepted a total of Kshs 10.86 bn worth of bids out of Kshs 10.92 bn bids received, translating to an acceptance rate of 99.4%. The yields on the government papers were on a downward trajectory with the yields on the 91-day papers decreasing the most by 14.2 bps to 7.4% from the 7.6% recorded the previous week. The yields on the 364-day paper decreased by 6.3 bps to 8.3% from 8.4% recorded the previous week, while the yields on the 182-day paper decreased by 1.1 bps to remain relatively unchanged from the 7.8% recorded the previous week.
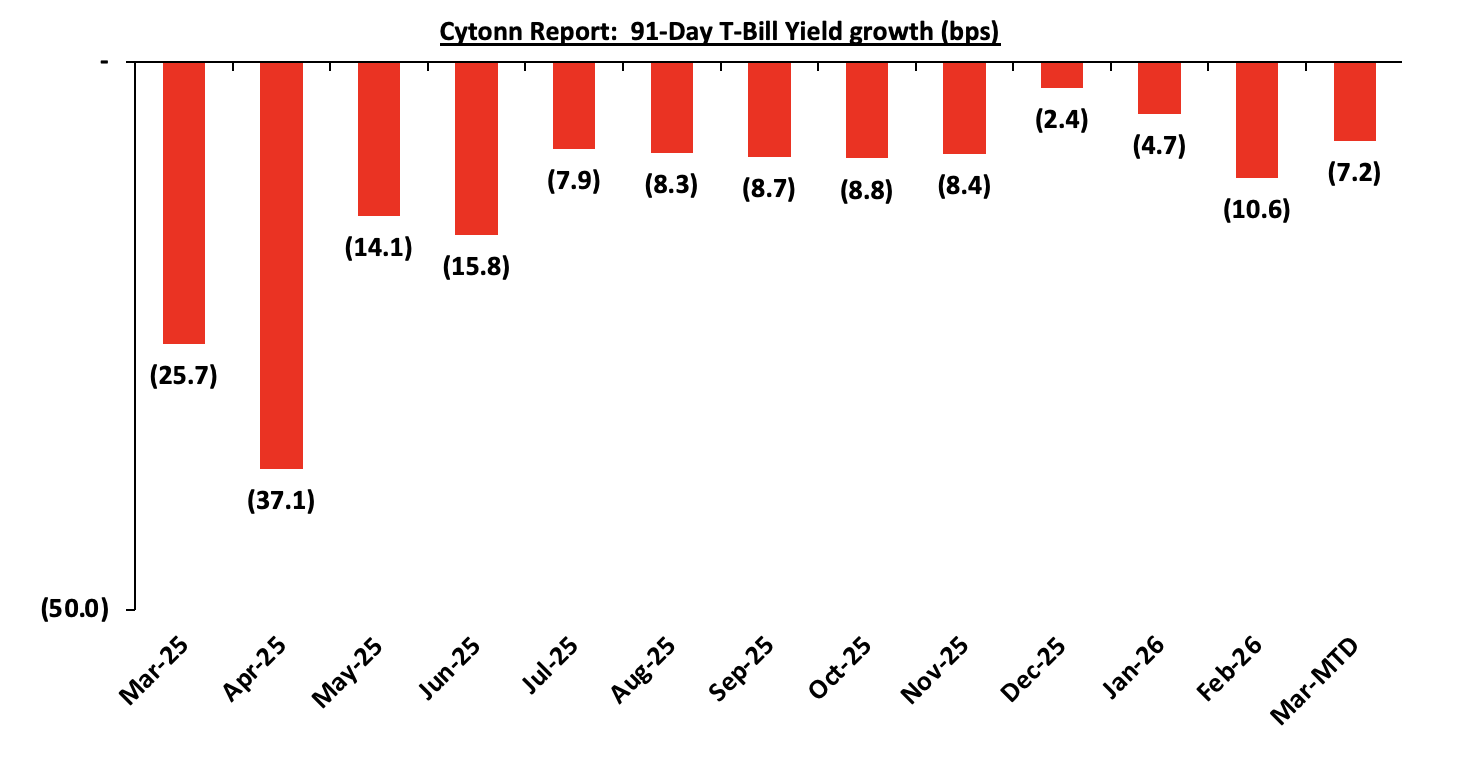
The chart below shows the yield growth rate for the 91-day paper from January 2024 to date:
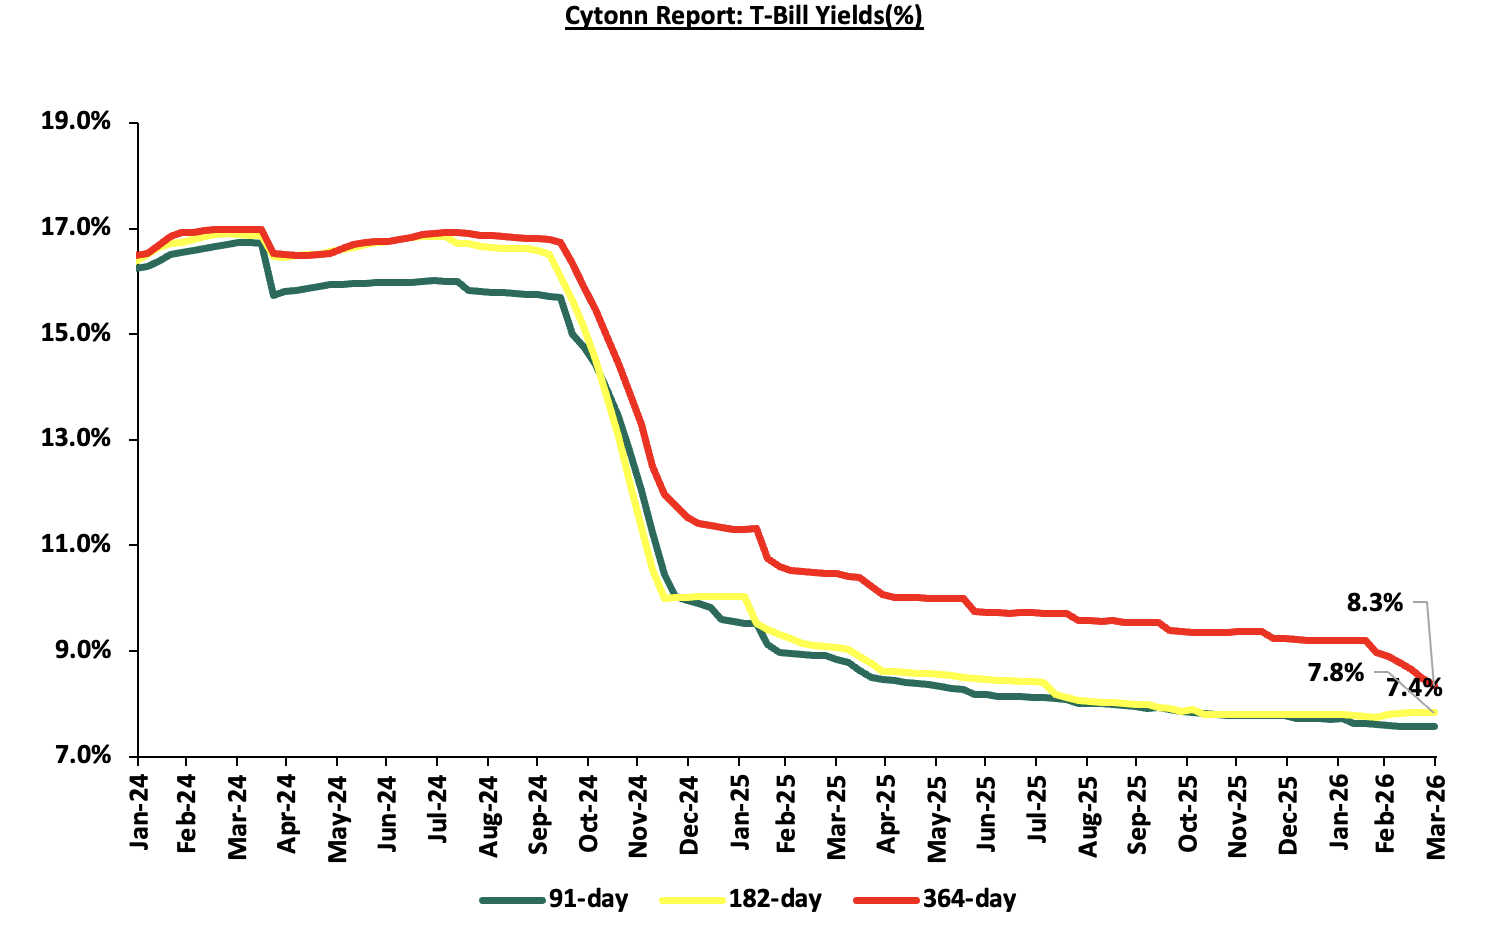
The charts below show the performance of the 91-day, 182-day and 364-day papers from March 2025 to March 2026
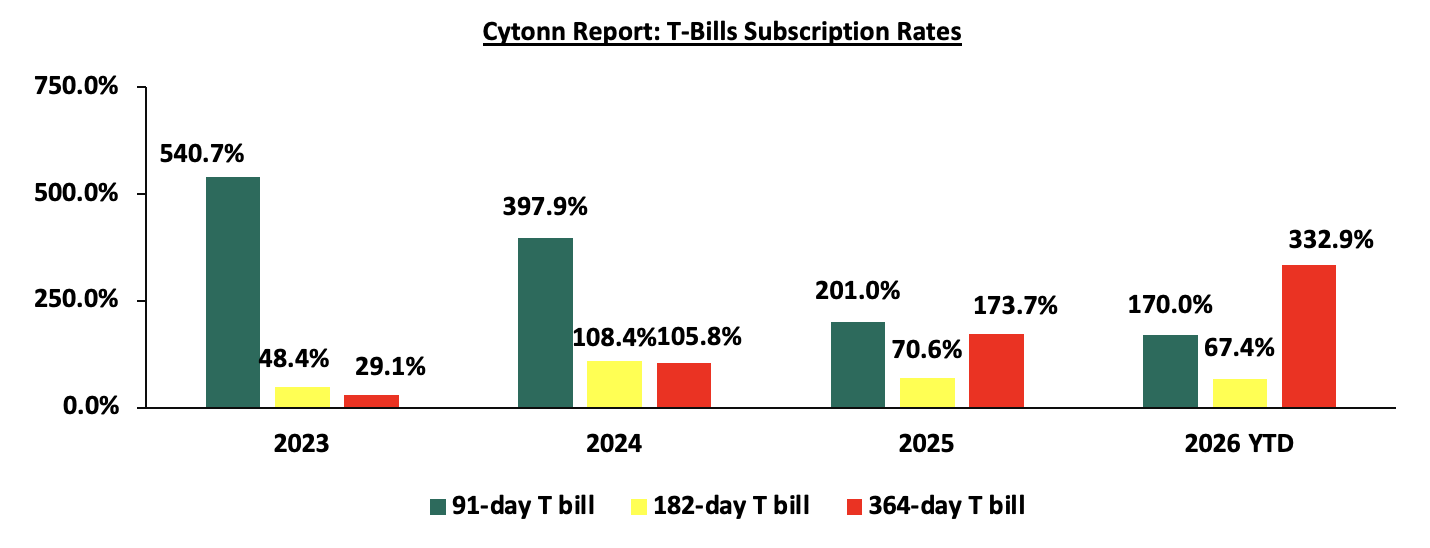
The chart below compares the overall average T-bill subscription rates obtained in 2023, 2024, 2025 and 2026 Year-to-date (YTD):
In the primary bond market, the government is looking to raise Kshs 20.0 bn through the switch auction from FXD1/2016/010 to FXD1/2018/015 with fixed coupon rates of 15.0% and 12.7% respectively and tenors to maturity of 0.3 years and 7.1 years respectively. The period of sale for the two bonds opened on Monday 23rd March 2026 and will close on Monday 13th April 2026. Our bidding ranges for the switch to FXD1/2016/010 from FXD1/2018/015 is 12.25%-12.55% respectively;
Money Market Performance:
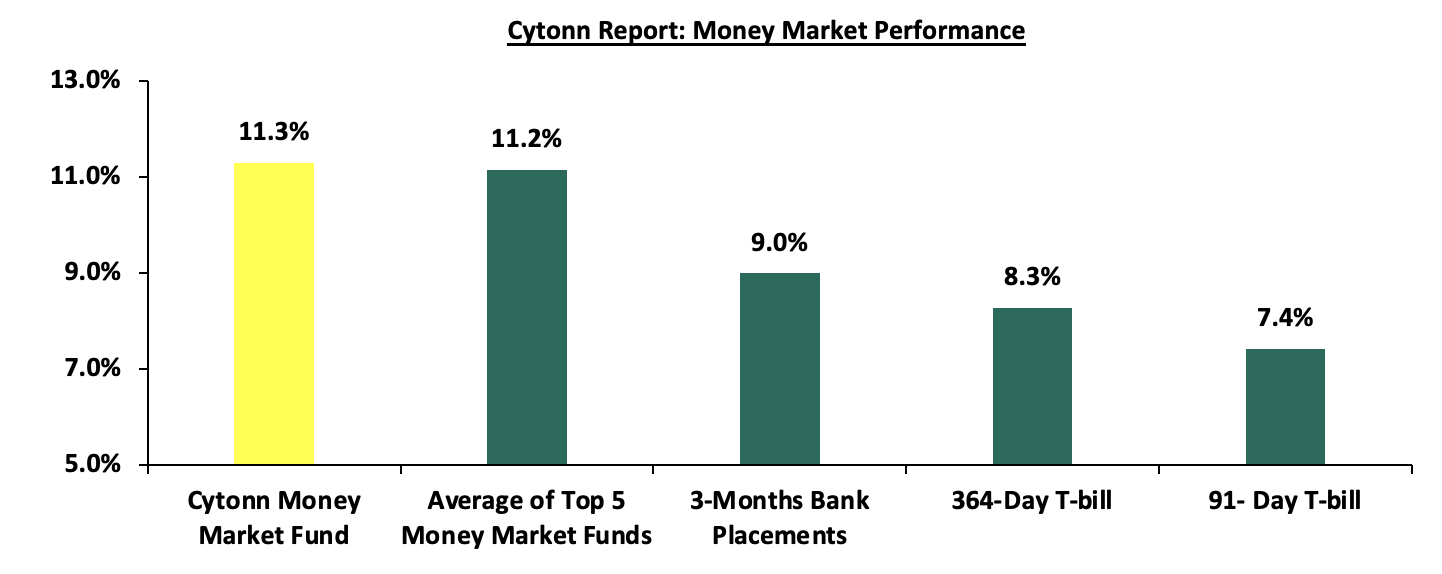
In the money markets, 3-month bank placements ended the week at 9.0% (based on rates offered by various banks). The yields on the 364-day paper decreased by 6.3 bps to 8.3% from 8.4% recorded the previous week, while the yields on the 91-day paper also decreased by 14.2 bps to 7.4% from 7.6% recorded last week. The yield on the Cytonn Money Market Fund decreased by 22.0 bps to 11.3% from 11.5% recorded the previous week, while the average yields on the Top 5 Money Market Funds decreased by 4.0 bps to remain relatively unchanged at 11.2% recorded the previous week.
The table below shows the Money Market Fund Yields for Kenyan Fund Managers as published on 27th March 2026:
|
Money Market Fund Yield for Fund Managers as published on 27th March 2026 |
||
|
Rank |
Fund Manager |
Effective Annual Rate |
|
1 |
Nabo Africa Money Market Fund |
12.2% |
|
2 |
Cytonn Money Market Fund (Dial *809# or download Cytonn App) |
11.3% |
|
3 |
Gulfcap Money Market Fund |
10.8% |
|
4 |
Enwealth Money Market Fund |
10.8% |
|
5 |
Arvocap Money Market Fund |
10.7% |
|
6 |
Lofty-Corban Money Market Fund |
10.6% |
|
7 |
Ndovu Money Market Fund |
10.5% |
|
8 |
Jubilee Money Market Fund |
10.5% |
|
9 |
Orient Kasha Money Market Fund |
10.5% |
|
10 |
Faulu Money Market Fund |
10.3% |
|
11 |
Madison Money Market Fund |
10.2% |
|
12 |
Old Mutual Money Market Fund |
10.2% |
|
13 |
Kuza Money Market fund |
10.2% |
|
14 |
Etica Money Market Fund |
10.1% |
|
15 |
British-American Money Market Fund |
9.6% |
|
16 |
Dry Associates Money Market Fund |
9.5% |
|
17 |
GenAfrica Money Market Fund |
9.3% |
|
18 |
SanlamAllianz Money Market Fund |
9.3% |
|
19 |
KCB Money Market Fund |
9.0% |
|
20 |
Genghis Money Market Fund |
8.8% |
|
21 |
Apollo Money Market Fund |
8.5% |
|
22 |
CIC Money Market Fund |
8.5% |
|
23 |
CPF Money Market Fund |
8.4% |
|
24 |
Co-op Money Market Fund |
8.3% |
|
25 |
ICEA Lion Money Market Fund |
8.3% |
|
26 |
Mali Money Market Fund |
8.1% |
|
27 |
Absa Shilling Money Market Fund |
7.3% |
|
28 |
Mayfair Money Market Fund |
6.7% |
|
29 |
Ziidi Money Market Fund |
6.1% |
|
30 |
AA Kenya Shillings Fund |
5.9% |
|
31 |
Stanbic Money Market Fund |
5.5% |
|
32 |
Equity Money Market Fund |
4.6% |
Source: Business Daily
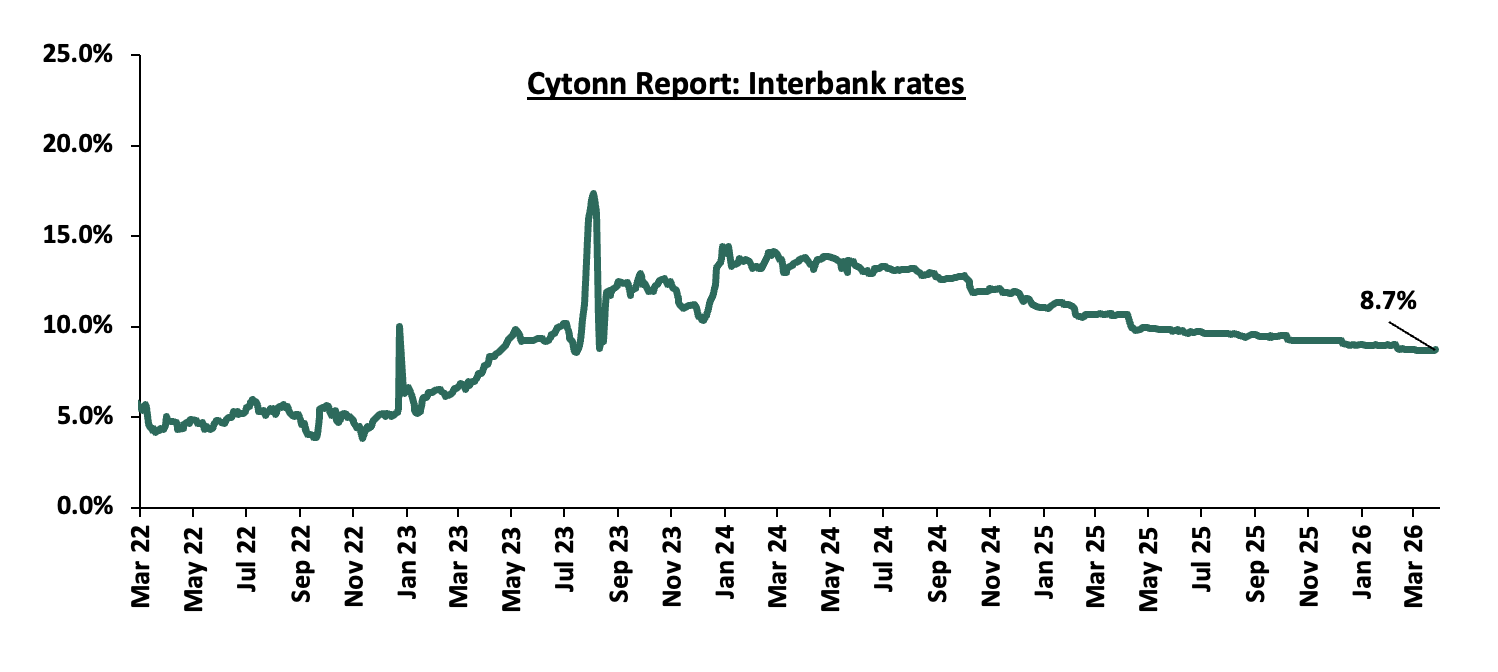
Liquidity:
During the week, liquidity in the money markets tightened with the average interbank rate increasing by 3.1 bps to remain relatively unchanged at 8.7% in comparison to last week, partly attributable to tax remittances that offset government payments. The average interbank volumes traded increased by 20.0% to Kshs 14.3 bn from Kshs 12.0 bn recorded the previous week. The chart below shows the interbank rates in the market over the years:
Kenya Eurobonds:
During the week, the yields on the Eurobonds showed a mixed performance with the yield on the 10-year Eurobond issued in 2018, increasing the most by 63.0 bps to 7.3% from 6.7% recorded the previous week, while the yield on the 30-year Eurobond issued in 2021, decreased the most by 17.0 bps to 9.4% from 9.5% recorded the previous week. The table below shows the summary performance of the Kenyan Eurobonds as of 26th March 2026;
|
Cytonn Report: Kenya Eurobonds Performance |
||||||
|
|
2018 |
2019 |
2021 |
2024 |
||
|
Tenor |
10-year issue |
30-year issue |
12-year issue |
13-year issue |
7-year issue |
|
|
Amount Issued (USD) |
1.0 bn |
1.0 bn |
1.0 bn |
1.5 bn |
1.5 bn |
|
|
Years to Maturity |
2.5 |
22.5 |
8.8 |
5.5 |
10.5 |
|
|
Yields at Issue |
7.3% |
8.3% |
6.2% |
10.4% |
9.9% |
|
|
2-Jan-26 |
6.1% |
8.8% |
7.2% |
7.8% |
7.1% |
|
|
2-Mar-26 |
6.1% |
9.1% |
7.2% |
8.3% |
7.1% |
|
|
19-Mar-26 |
6.7% |
9.5% |
8.2% |
9.0% |
8.2% |
|
|
20-Mar-26 |
7.1% |
9.7% |
8.5% |
9.4% |
8.6% |
|
|
23-Mar-26 |
7.0% |
9.6% |
8.4% |
9.2% |
8.4% |
|
|
24-Mar-26 |
7.0% |
9.6% |
8.4% |
9.2% |
8.4% |
|
|
25-Mar-26 |
7.0% |
9.4% |
8.2% |
9.0% |
8.2% |
|
|
26-Mar-26 |
7.3% |
9.4% |
8.5% |
9.0% |
8.2% |
|
|
Weekly Change |
0.6% |
(0.2%) |
0.3% |
(0.0%) |
0.0% |
|
|
MTD Change |
1.2% |
0.3% |
1.2% |
0.7% |
1.1% |
|
|
YTD Change |
1.3% |
0.5% |
1.3% |
1.1% |
1.1% |
|
Source: Central Bank of Kenya (CBK) and National Treasury
Kenya Shilling:
During the week, the Kenya Shilling depreciated by 17.8 bps against the US Dollar, to Kshs 129.8 from the Kshs 129.5 recorded the previous week. On a year-to-date basis, the shilling has depreciated by 54.2 bps against the dollar, as compared to the 22.9 bps appreciation recorded in 2025.
We expect the shilling to be supported by:
- Diaspora remittances standing at a cumulative USD 5,051.2 mn in the twelve months to February 2026, 1.9% higher than the USD 4,956.5 mn recorded over the same period in 2025. These have continued to cushion the shilling against further depreciation. In the February 2026 diaspora remittances figures, North America remained the largest source of remittances to Kenya accounting for 54.2% in the period, and,
- Tourism inflows, which strengthened significantly. Tourism receipts reached Kshs 560.0 bn in 2025, up from Kshs 452.2 bn in 2024, representing a 23.9% increase, supported by improved international arrivals through the country’s major airports, and,
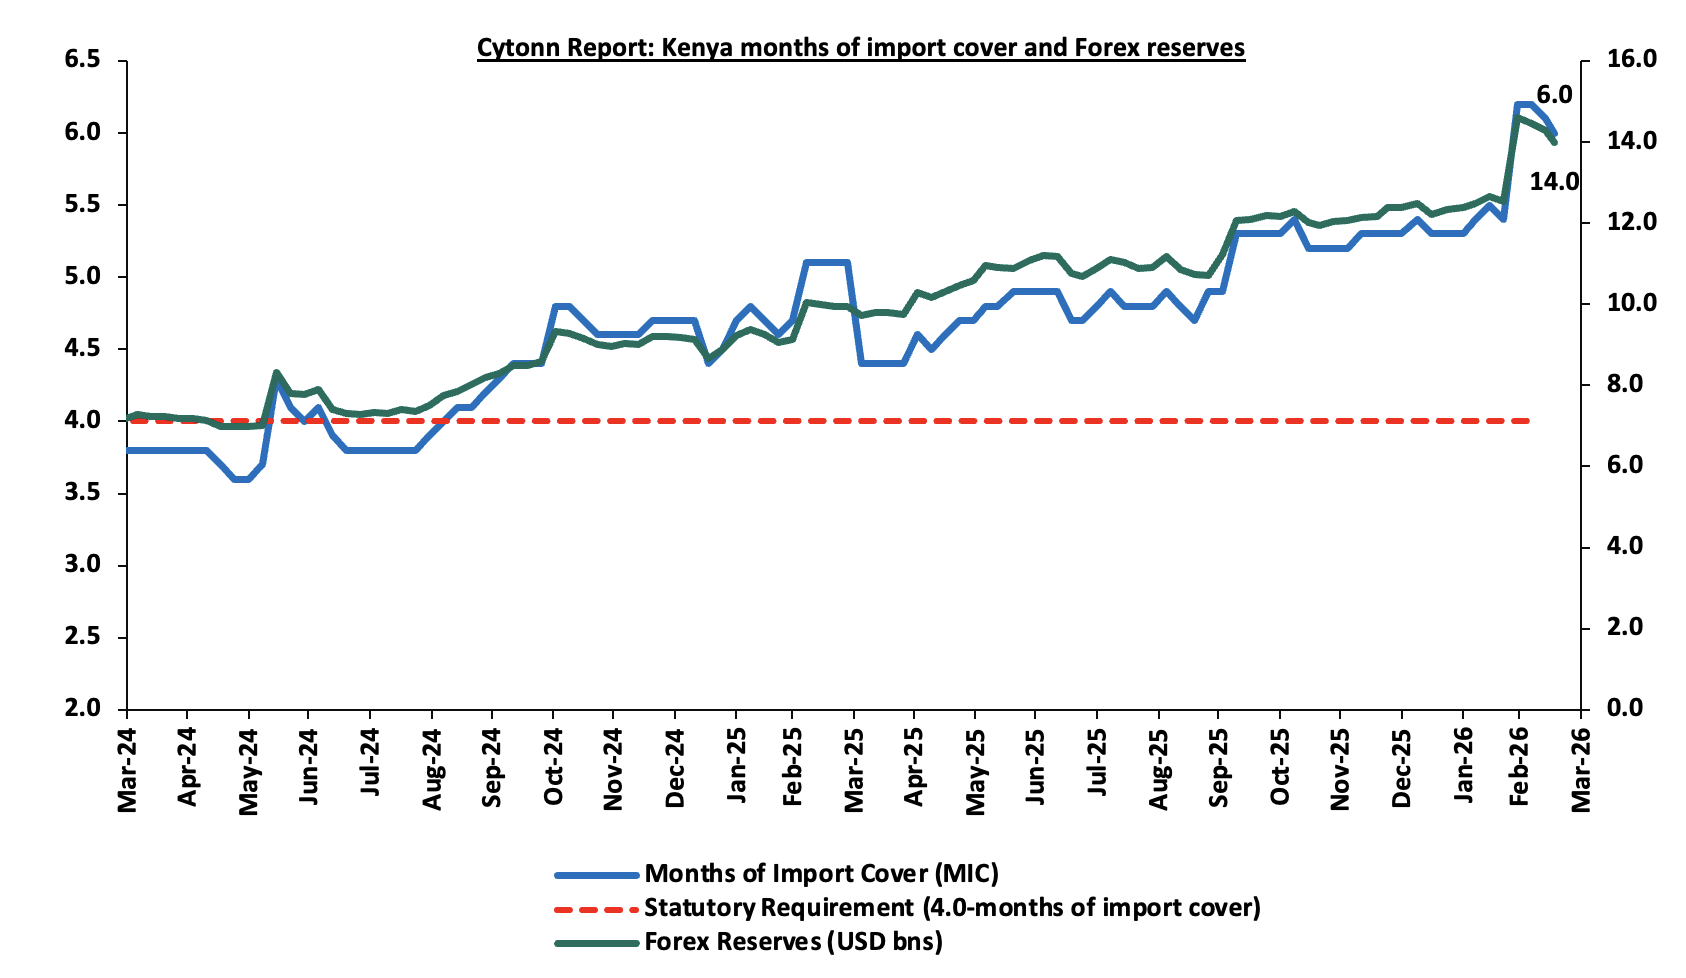
- Improved forex reserves currently at USD 14.0 bn (equivalent to 6.0-months of import cover), which is above the statutory requirement of maintaining at least 4.0-months of import cover and above the EAC region’s convergence criteria of 4.5-months of import cover.
The shilling is however expected to remain under pressure in 2026 as a result of:
- An ever-present current account deficit which came at 2.2% of GDP in the twelve months to October 2025, and,
- The need for government debt servicing, continues to put pressure on forex reserves given that 52.0% of Kenya’s external debt is US Dollar-denominated as of September 2025.
Kenya’s forex reserves decreased by 1.9% during the week to USD 14.0 bn from the USD 14.3 bn recorded the previous week, equivalent to 6.0 months of import cover, and above the statutory requirement of maintaining at least 4.0-months of import cover.
The chart below summarizes the evolution of Kenya's months of import cover over the years:
Weekly Highlights
- March 2026 Inflation Projection
We are projecting the y/y inflation rate for March 2026 will increase to within the range of 4.4%- 4.6%, mainly on the back of:
- Increased electricity forex adjustment charges – In March 2026, electricity prices increased marginally on the back of a rise in fuel cost charges and forex adjustment charges. EPRA set the fuel cost charge at Kshs 0.4 up from Kshs 0.3 in February 2026, while the forex adjustment was raised to Kshs 1.3 from Kshs 1.2 in February 2026. With electricity being one the major inputs of inflation, this increase is expected to increase production costs for businesses as well as increase electricity costs for households and thus tightening inflation.
- The decrease in the Central Bank Rate (CBR) by 0 bps to 8.75% from 9.00% - In 2026, the CBK Monetary Policy Committee has continued adopting an accommodative monetary policy stance, reducing the Central Bank Rate (CBR) by a cumulative 25.0 bps from 9.0% at the beginning of 2026. This reduction in the CBR is likely to increase the money supply through lower borrowing costs, which may cause a slight rise in inflation rates as the effects of the CBR continue to gradually take hold in the broader economy.
- Depreciation of the Kenya Shilling against the US Dollar- The Kenya Shilling recorded a 6 bps month-to-date depreciation as of 27th March to Kshs 129.8 from Kshs 129.2 recorded at the beginning of the month. This depreciation in the exchange rate could tighten inflationary pressures, making imported goods more expensive.
- Fuel Prices – The Energy and Petroleum Regulatory Authority (EPRA) has issued its monthly update on maximum retail fuel prices in Kenya, covering the period from 15th March to 14th April 2026. The capped prices remain unchanged at Kshs 178.3 for Super Petrol, Kshs 166.5 for Diesel, and Kshs 152.8 for Kerosene per litre. However, this stability is unlikely to last. The ongoing USA–Iran conflict has disrupted global oil supply routes and driven up the cost of Murban crude, the grade Kenya imports, placing upward pressure on future pump prices. Although March prices were held steady, rising import costs and currency depreciation point to inevitable adjustments in the months ahead. Any increase in fuel prices will have significant implications for inflation, given fuel’s central role in transportation and production costs across the economy.
The ongoing Iran–US conflict is reverberating through the global economy via energy markets, exchange rates, and policy channels. While domestic fuel prices have remained stable in Kenya during the current review cycle, the war has already introduced a global oil risk premium and disrupted supply routes, most notably around the Strait of Hormuz, a critical hub for international oil flows. These developments have indirectly raised electricity costs in Kenya, driven by higher fuel charges and foreign exchange adjustments that reflect elevated generation and import expenses. At the same time, heightened global demand for the US dollar as a safe-haven asset has accelerated the depreciation of the Kenya Shilling, increasing the cost of imports and amplifying inflationary pressures.
Going forward, we still expect inflationary pressures to remain anchored in the short term, remaining within the CBK’s target range of 2.5%-7.5%. However, risks remain, particularly from the potential for increased demand-driven inflation due to accommodative monetary policy. The decision to lower the CBR to 8.75% during the latest MPC meeting will likely increase money supply, in turn increasing inflation, especially with further cuts expected in the coming meetings. The CBK’s ability to balance growth and inflation through close monitoring of both inflation and exchange rate stability will be key to maintaining inflation within the target range.
Rates in the Fixed Income market have been on a downward trend due to high liquidity in the money market which allowed the government to front load most of its borrowing. The government is 116.4% ahead of its prorated net domestic borrowing target of Kshs 634.8 bn, having a net borrowing position of Kshs 1,026.4 bn (inclusive of T-bills). However, we expect a stabilization of the yield curve in the short and medium term, with the government looking to increase its external borrowing to maintain the fiscal surplus, hence alleviating pressure in the domestic market. As such, we expect the yield curve to stabilize in the short to medium-term and hence investors are expected to shift towards the long-term papers to lock in the high returns
Market Performance:
During the week, the equities market was on a downward trajectory, with NSE 10, NSE 25, NASI, and NSE 20 declining by 9.0%, 7.5%, 6.7% and 6.6% respectively, taking the YTD performance to gains of 8.8%, 5.6%, 4.3% and 2.6% for NSE 20, NSE 25, NASI and NSE 10 respectively. The equities market performance was mainly driven by losses recorded by large cap stocks such as ABSA, KCB and COOP of 14.5%, 10.5% and 9.8% respectively, mostly due heightened global risk aversion amid escalating tensions between Iran and the USA, which have raised concerns over potential oil supply disruptions, fueling volatility in global oil prices, inflationary pressures, and currency risks in oil-importing economies like Kenya, thereby prompting foreign investors to adopt a risk-off stance and reduce exposure to frontier markets such as the NSE, amplifying the overall sell-off in equities.
Also, during the week, the banking sector index declined by 8.0% to 221.9 from 241.3 recorded the previous week. This is attributable to losses recorded by stocks such as ABSA, KCB and COOP of 14.5%, 10.5% and 9.8% respectively.
During the week, equities turnover increased by 132.3% to USD 36.8 mn from USD 15.9 mn recorded the previous week, taking the YTD total turnover to USD 433.1 mn. Foreign investors remained net sellers for the eighth consecutive week with a net selling position of USD 3.9 mn, from a net selling position of USD 2.7 mn recorded the previous week, taking the YTD foreign net selling position to USD 66.0 mn, compared to a net selling position of USD 92.9 mn recorded in 2025.
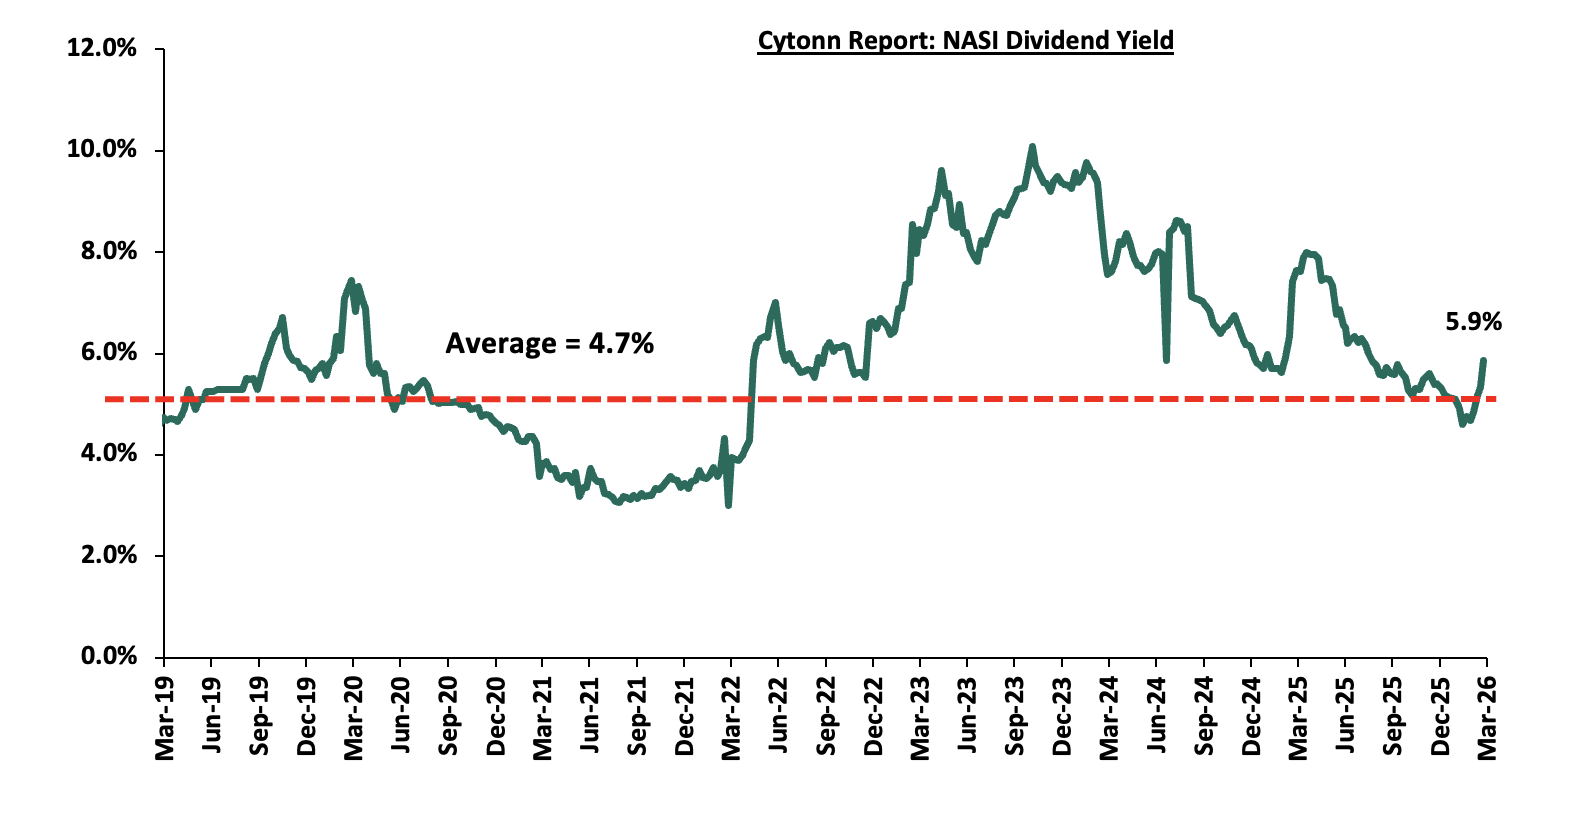
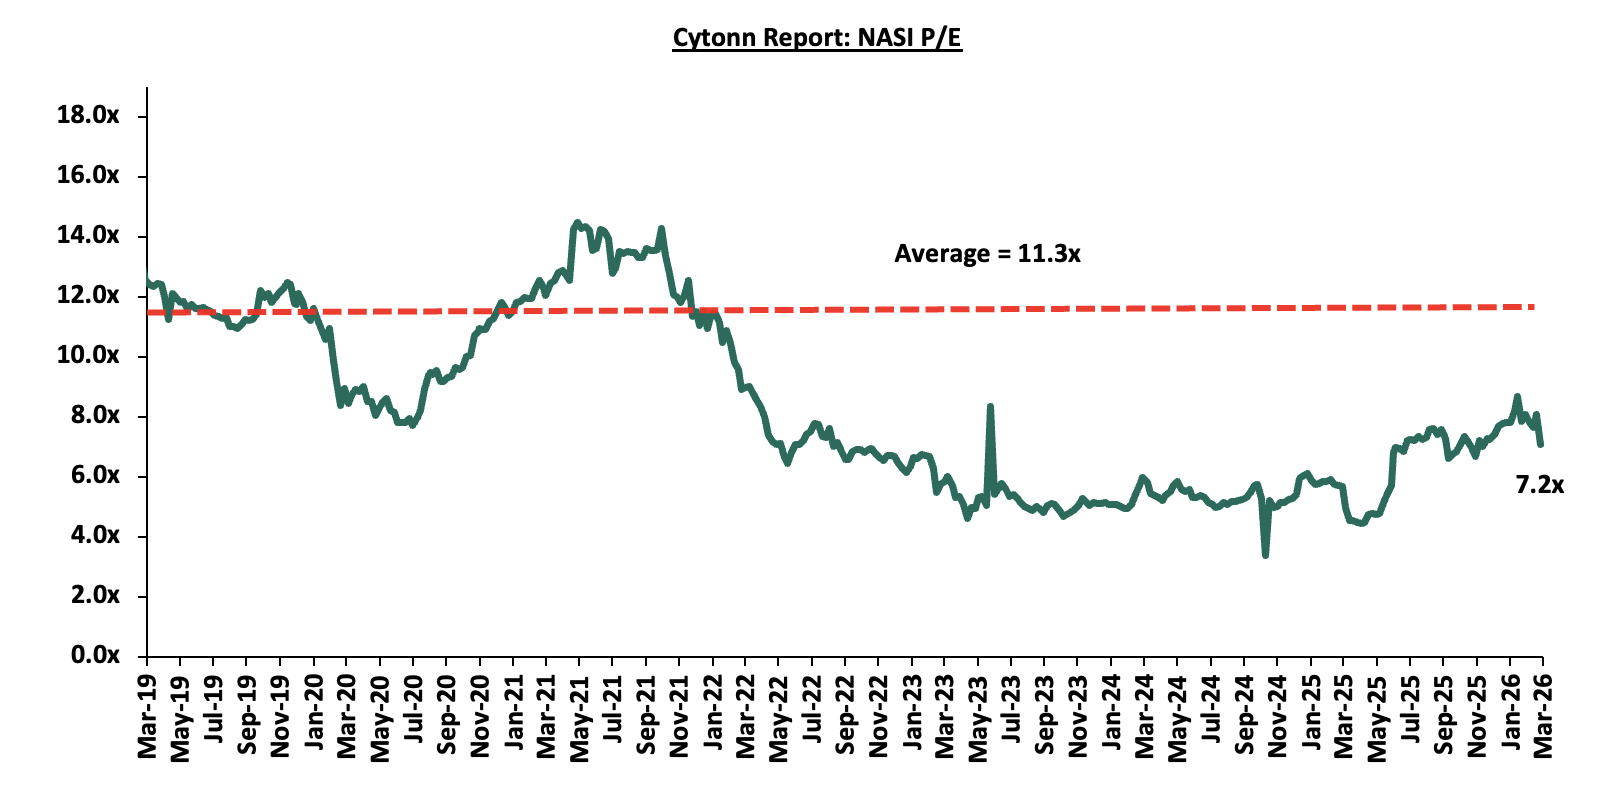
The market is currently trading at a price to earnings ratio (P/E) of 7.2x, 36.5% below the historical average of 11.3x. The dividend yield stands at 5.9%, 1.2% points above the historical average of 4.7%. Key to note, NASI’s PEG ratio currently stands at 0.9x, an indication that the market is slightly undervalued relative to its future growth. A PEG ratio greater than 1.0x indicates the market may be overvalued while a PEG ratio less than 1.0x indicates that the market is undervalued.
The charts below indicate the historical P/E and dividend yields of the market.
Universe of Coverage:
|
Cytonn Report: Equities Universe of Coverage |
||||||||||
|
|
|
|
|
|
|
|
|
|
|
|
|
Company |
Price as at 19/03/2026 |
Price as at 27/03/2026 |
w/w change |
YTD Change |
Year Open 2026 |
Target Price* |
Dividend Yield |
Upside/ Downside** |
P/TBv Multiple |
Recommendation |
|
Co-op Bank |
30.0 |
27.0 |
(9.8%) |
13.0% |
23.9 |
33.4 |
9.3% |
33.0% |
1.0x |
Buy |
|
I&M Group |
51.3 |
47.2 |
(7.9%) |
10.3% |
42.8 |
57.4 |
7.9% |
29.5% |
0.7x |
Buy |
|
ABSA Bank |
31.8 |
27.2 |
(14.5%) |
9.5% |
24.9 |
33.0 |
7.5% |
28.9% |
1.5x |
Buy |
|
CIC Group* |
5.0 |
4.46 |
(10.3%) |
(1.8%) |
4.5 |
5.5 |
2.9% |
26.2% |
1.2x |
Buy |
|
Diamond Trust Bank |
155.5 |
146.3 |
(5.9%) |
27.5% |
114.8 |
173.4 |
6.2% |
24.7% |
0.4x |
Buy |
|
KCB Group |
76.0 |
68.0 |
(10.5%) |
3.4% |
65.8 |
77.5 |
10.3% |
24.2% |
0.7x |
Buy |
|
Equity Group |
76.5 |
69.0 |
(9.8%) |
3.0% |
67.0 |
79.2 |
8.3% |
23.1% |
0.9x |
Buy |
|
NCBA |
91.3 |
88.3 |
(3.3%) |
3.8% |
85.0 |
101.3 |
8.0% |
22.8% |
1.2x |
Buy |
|
Stanbic Holdings |
260.0 |
258.8 |
(0.5%) |
30.8% |
197.8 |
272.1 |
8.6% |
13.8% |
1.5x |
Accumulate |
|
Standard Chartered Bank |
330.0 |
328.5 |
(0.5%) |
9.6% |
299.8 |
335.0 |
9.4% |
11.4% |
2.0x |
Accumulate |
|
Britam* |
12.5 |
12.5 |
0.0% |
38.0% |
9.1 |
13.5 |
0.0% |
8.0% |
1.2x |
Hold |
|
Jubilee Holdings* |
398.0 |
393.8 |
(1.1%) |
22.1% |
322.5 |
407.5 |
3.4% |
6.9% |
0.6x |
Hold |
|
*Target Price as per Cytonn Analyst estimates **Upside/ (Downside) is adjusted for Dividend Yield Dividend Yield is calculated using FY’2025 Dividends *Dividend Yield is calculated using FY’2024 Dividends |
||||||||||
Weekly Highlights
- Earnings Releases
- DTB-K FY’2025 Performance
During the week, DTB-K released their FY’2025 financial results. Below is a summary of the performance:
|
Balance Sheet Items |
FY'2024 |
FY'2025 |
y/y change |
|
Government Securities |
126.8 |
149.3 |
17.7% |
|
Net Loans and Advances |
285.3 |
324.2 |
13.6% |
|
Total Assets |
573.9 |
659.1 |
14.9% |
|
Customer Deposits |
447.2 |
509.1 |
13.8% |
|
Deposits/ Branch |
2.8 |
3.2 |
11.7% |
|
Total Liabilities |
481.5 |
546.1 |
13.4% |
|
Shareholders’ Funds |
81.8 |
101.1 |
23.6% |
|
Balance Sheet Ratios |
FY'2024 |
FY'2025 |
% Points change |
|
Loan to Deposit Ratio |
63.8% |
63.7% |
(0.1%) |
|
Government Securities to Deposit ratio |
28.3% |
29.3% |
1.0% |
|
Return on average equity |
11.3% |
11.7% |
0.5% |
|
Return on average assets |
1.5% |
1.7% |
0.3% |
|
Income Statement |
FY'2024 |
FY'2025 |
y/y change |
|
Net Interest Income |
28.1 |
34.9 |
24.1% |
|
Net non-Interest Income |
13.0 |
11.8 |
(9.1%) |
|
Total Operating income |
41.1 |
46.7 |
13.6% |
|
Loan Loss provision |
8.7 |
10.0 |
14.6% |
|
Other Operating expenses |
11.5 |
11.8 |
3.0% |
|
Total Operating expenses |
29.9 |
32.7 |
9.4% |
|
Profit before tax |
11.1 |
13.4 |
20.5% |
|
Profit after tax |
8.8 |
10.7 |
21.4% |
|
Core EPS |
27.3 |
33.7 |
23.1% |
|
Dividend Per Share (Kshs) |
7.0 |
9.0 |
28.6% |
|
Dividend Payout |
25.6% |
26.7% |
1.1% |
|
Dividend Yield |
10.1% |
5.8% |
(4.3%) |
|
Capital Adequacy Ratios |
FY'2024 |
FY'2025 |
% Points Change |
|
Core Capital/Total Liabilities |
16.7% |
16.4% |
(0.3%) |
|
Minimum Statutory ratio |
8.0% |
8.0% |
|
|
Excess |
8.7% |
8.4% |
(0.3%) |
|
Core Capital/Total Risk Weighted Assets |
15.7% |
15.5% |
(0.2%) |
|
Minimum Statutory ratio |
10.5% |
10.5% |
|
|
Excess |
5.2% |
5.0% |
(0.2%) |
|
Total Capital/Total Risk Weighted Assets |
17.3% |
16.9% |
(0.4%) |
|
Minimum Statutory ratio |
14.5% |
14.5% |
|
|
Excess |
2.8% |
2.4% |
(0.4%) |
|
Liquidity Ratio |
49.9% |
54.6% |
4.7% |
|
Minimum Statutory ratio |
20.0% |
20.0% |
|
|
Excess |
29.9% |
34.6% |
4.7% |
Key Take-Outs:
- Increased earnings - Core earnings per share (EPS) grew by 23.1% to Kshs 33.7 in FY’2025 from Kshs 27.3 in FY’2024, driven by the 13.6% growth in total operating income to Kshs 46.7 bn in FY’2025 from Kshs 41.1 bn in FY’2024, which outpaced the 9.4% increase in total operating expenses to Kshs 32.7 bn in FY’2025 from Kshs 29.9 bn in FY’2024.
- Improved asset quality – The bank’s asset quality improved, with the Gross NPL ratio declining to 11.3% in FY’2025 from 12.6% in FY’2024, as the 14.8% growth in gross loans to Kshs 344.8 bn in FY’2025 from Kshs 300.4 bn in FY’2024, which outpaced the 3.2% increase in gross non-performing loans to Kshs 39.1 bn in FY’2025 from Kshs 37.9 bn in FY’2024,
- Expanded Balanced sheet - The balance sheet expanded, with total assets increasing by 14.9% to Kshs 659.1 bn in FY’2025 from Kshs 573.9 bn in FY’2024, driven by a 13.6% increase in net loans and advances to Kshs 324.2 bn in FY’2025 from Kshs 285.3 bn in FY’2024, coupled with a strong 17.7% increase in government securities to Kshs 149.3 bn in FY’2025 from Kshs 126.8 bn in FY’2024,
- Increased lending- Customer net loans and advances increased by 13.6% to Kshs 324.2 bn in FY’2025 from Kshs 285.3 bn in FY’2024, reflecting the bank’s continued appetite to expand customer lending.
- Declaration of dividends - The Board of Directors recommended a first and final dividend of Kshs 9.0 per share in FY’2025, from a final and total dividend of Kshs 7.0 in FY’2024. The payout ratio and dividend yield came in at 26.7% and 5.8% respectively in FY’2025.
For a more detailed analysis, please see the DTB-K FY’2025 Earnings Note
- I&M Group Performance
During the week, I&M Group released their FY’2025 financial results Below is a summary of I&M Group’s FY’2025 performance:
|
Balance Sheet Items (Kshs bn) |
FY'2024 |
FY'2025 |
y/y change |
|
Government Securities |
102.5 |
159.4 |
55.5% |
|
Net Loans and Advances |
287.5 |
306.3 |
6.5% |
|
Total Assets |
580.9 |
668.9 |
15.1% |
|
Customer Deposits |
412.2 |
483.9 |
17.4% |
|
Deposits/branch |
3.9 |
4.4 |
14.2% |
|
Total Liabilities |
480.0 |
546.9 |
13.9% |
|
Shareholders’ Funds |
93.8 |
115.2 |
22.8% |
|
Balance Sheet Ratios |
FY'2024 |
FY'2025 |
% points change |
|
Loan to Deposit Ratio |
69.7% |
63.3% |
(6.5%) |
|
Government Securities to Deposit Ratio |
24.9% |
32.9% |
8.1% |
|
Return on average equity |
16.2% |
17.8% |
1.6% |
|
Return on average assets |
2.7% |
3.2% |
0.4% |
|
Income Statement (Kshs bn) |
FY'2024 |
FY'2025 |
y/y change |
|
Net Interest Income |
39.6 |
46.0 |
16.0% |
|
Net non-Interest Income |
11.0 |
14.4 |
30.8% |
|
Total Operating income |
50.6 |
60.3 |
19.2% |
|
Loan Loss provision |
(7.8) |
(8.7) |
11.1% |
|
Total Operating expenses |
(31.7) |
(36.9) |
16.3% |
|
Profit before tax |
19.8 |
24.2 |
22.4% |
|
Profit after tax |
15.9 |
19.8 |
24.5% |
|
Core EPS |
8.9 |
10.8 |
21.2% |
|
Dividend per Share |
3.00 |
3.75 |
25.0% |
|
Dividend Yield |
8.3% |
7.5% |
(0.8%) |
|
Dividend Payout Ratio |
31.1% |
32.9% |
1.8% |
|
Income Statement Ratios |
FY'2024 |
FY'2025 |
% points change |
|
Yield from interest-earning assets |
14.3% |
12.8% |
(1.5%) |
|
Cost of funding |
6.7% |
4.7% |
(2.0%) |
|
Net Interest Margin |
8.1% |
8.5% |
0.5% |
|
Net Interest Income as % of operating income |
78.3% |
76.2% |
(2.1%) |
|
Non-Funded Income as a % of operating income |
21.7% |
23.8% |
2.1% |
|
Cost to Income Ratio |
62.7% |
61.2% |
(1.5%) |
|
CIR without LLP |
47.3% |
46.8% |
(0.5%) |
|
Cost to Assets |
4.1% |
4.2% |
0.1% |
|
Capital Adequacy Ratios |
FY'2024 |
FY'2025 |
% points change |
|
Core Capital/Total Liabilities |
20.7% |
20.6% |
(0.1%) |
|
Minimum Statutory ratio |
8.0% |
8.0% |
0.0% |
|
Excess |
12.7% |
12.6% |
(0.1%) |
|
Core Capital/Total Risk Weighted Assets |
16.8% |
16.9% |
0.1% |
|
Minimum Statutory ratio |
10.5% |
10.5% |
0.0% |
|
Excess |
6.3% |
6.4% |
0.1% |
|
Total Capital/Total Risk Weighted Assets |
20.2% |
20.1% |
(0.1%) |
|
Minimum Statutory ratio |
14.5% |
14.5% |
0.0% |
|
Excess |
5.7% |
5.6% |
(0.1%) |
|
Liquidity Ratio |
51.6% |
51.6% |
0.0% |
|
Minimum Statutory ratio |
20.0% |
20.0% |
0.0% |
|
Excess |
31.6% |
31.6% |
0.0% |
Key Take-Outs:
- Increased earnings - Core earnings per share grew by 21.2% to Kshs 10.8, from Kshs 8.9 in FY’2024, driven by the 19.2% increase in total operating income to Kshs 60.3 bn, from Kshs 50.6 bn in FY’2024, which outpaced the 16.3% increase in total operating expenses to Kshs 36.9 bn, from Kshs 31.7 bn in FY’2024,
- Improved asset quality –The bank’s Asset Quality improved, with Gross NPL decreasing to 9.6% in FY’2025, from 11.5% in FY’2024, attributable to a 11.5% decrease in Gross non-performing loans to Kshs 31.4 bn, from Kshs 35.5 bn in FY’2024, compared to the 6.2% increase in gross loans to Kshs 328.8 bn, from Kshs 309.6 bn recorded in FY’2024,
- Expanded Balanced sheet - The balance sheet recorded an expansion as total assets increased by 15.1% to Kshs 668.9 bn, from Kshs 580.9 bn in FY’2024, mainly driven by a 55.5% increase in governments securities holdings to Kshs 159.4 bn, from 102.5 bn in FY’2024, coupled with a 6.5% increase in net loans and advances to Kshs 306.3 bn, from Kshs 287.5 bn in FY’2024,
- Increased lending- Customer net loans and advances increased 6.5% Kshs 306.3 bn, from Kshs 287.5 bn in FY’2024, and,
- Declaration of Dividends - The Board of Directors recommended a final dividend of Kshs 2.25 per share in addition to an interim dividend of Kshs 1.5 per share for FY’2025, bringing the total dividend to Kshs 3.75 per share compared to Kshs 3.0 per share in FY’2024, translating to a dividend yield and dividend payout ratio of 7.5% and 32.9% respectively
For a more detailed analysis, please see the I&M Group FY’2025 Earnings Note
- NCBA Group FY’2025 Performance
During the week, NCBA Group released their FY’2025 financial results Below is a summary of NCBA Group’s FY’2025 performance:
|
Balance Sheet Items |
FY'2024 |
FY'2025 |
y/y change |
|
Net Loans and Advances |
302.1 |
317.2 |
5.0% |
|
Government Securities |
180.8 |
189.1 |
4.6% |
|
Total Assets |
665.9 |
716.0 |
7.52% |
|
Customer Deposits |
502.0 |
531.9 |
5.9% |
|
Deposits per Branch |
4.3 |
4.4 |
1.6% |
|
Total Liabilities |
556.2 |
588.6 |
5.8% |
|
Shareholders’ Funds |
109.7 |
127.5 |
16.2% |
|
Key Ratios |
FY'2024 |
FY'2025 |
% points change |
|
Loan to Deposit Ratio |
60.2% |
59.6% |
(0.5%) |
|
Government Securities to Deposit ratio |
36.0% |
35.6% |
(0.5%) |
|
Return on average equity |
21.2% |
19.7% |
(1.5%) |
|
Return on average assets |
3.1% |
3.4% |
0.3% |
|
Dividend Payout Ratio |
41.4% |
50.0% |
8.6% |
|
Dividend Yield |
10.4% |
8.0% |
(2.5%) |
|
Income Statement |
FY'2024 |
FY'2025 |
y/y change |
|
Net Interest Income |
34.5 |
44.1 |
27.7% |
|
Net non-Interest Income |
28.2 |
29.3 |
3.8% |
|
Total Operating income |
62.7 |
73.3 |
17.0% |
|
Loan Loss provision |
5.5 |
8.0 |
46.3% |
|
Total Operating expenses |
37.6 |
45.5 |
21.0% |
|
Profit before tax |
25.1 |
27.9 |
10.9% |
|
Profit after tax |
21.9 |
23.4 |
7.0% |
|
Core EPS (Kshs) |
13.3 |
14.2 |
7.0% |
|
Dividend Per Share (Kshs) |
5.50 |
7.10 |
29.1% |
|
Dividend payout ratio |
41.4% |
50.0% |
8.6% |
|
Dividend yield |
10.4% |
8.0% |
(2.5%) |
|
Income Statement Ratios |
FY'2024 |
FY'2025 |
% points change |
|
Yield from interest-earning assets |
12.5% |
11.7% |
(0.8%) |
|
Cost of funding |
7.4% |
4.5% |
(2.9%) |
|
Net Interest Spread |
5.1% |
7.2% |
2.1% |
|
Net Interest Margin |
5.7% |
7.5% |
1.9% |
|
Cost of Risk |
8.7% |
10.9% |
2.2% |
|
Net Interest Income as % of operating income |
55.0% |
60.1% |
5.1% |
|
Non-Funded Income as a % of operating income |
45.0% |
39.9% |
(5.1%) |
|
Cost to Income Ratio |
60.0% |
62.1% |
2.1% |
|
Cost to Income Ratio without LLP |
51.3% |
51.2% |
(0.1%) |
|
Capital Adequacy Ratios |
FY'2024 |
FY'2025 |
% points change |
|
Core Capital/Total Liabilities |
20.3% |
20.4% |
0.1% |
|
Minimum Statutory ratio |
8.0% |
8.0% |
|
|
Excess |
12.3% |
12.4% |
0.1% |
|
Core Capital/Total Risk Weighted Assets |
21.2% |
21.9% |
0.7% |
|
Minimum Statutory ratio |
10.5% |
10.5% |
|
|
Excess |
10.7% |
11.4% |
0.7% |
|
Total Capital/Total Risk Weighted Assets |
21.2% |
21.9% |
0.7% |
|
Minimum Statutory ratio |
14.5% |
14.5% |
|
|
Excess |
6.7% |
7.4% |
0.7% |
|
Liquidity Ratio |
54.1% |
60.7% |
6.6% |
|
Minimum Statutory ratio |
20.0% |
20.0% |
|
|
Excess |
34.1% |
40.7% |
6.6% |
Key Take-Outs:
- Increased earnings – Core earnings per share increased by 7.0% to Kshs 14.2, from Kshs 13.3 in FY’2024, mainly driven by the 17.0% increase in total operating income to Kshs 73.3 bn, from Kshs 62.7 bn in FY’2024, however, this was weighed down by the 21.0% increase in total operating expenses to Kshs 45.5 bn, from Kshs 37.6 bn in FY’2024
- Improved asset quality – The bank’s Asset Quality improved, with Gross NPL ratio reduced by 1.0% points to 10.4% in FY’ 2025 from 11.5% in FY’2024, attributable to the the 3.6% decrease in gross non-performing loans to Kshs 35.8 bn, from Kshs 37.2 bn in FY’2024, which was outpaced by the 5.8% increase in gross loans to Kshs 342.8 bn, from Kshs 324.1 bn recorded in FY’2024,
- Increased Lending – The bank’s loan book recorded an expansion of 5.0% to Kshs 317.2 bn from Kshs 302.1 bn in FY’2024 attributed to increased credit risk aversion with NPLs decreasing to 10.4% in December 2025, from 11.5% in December 2024.
- Expanded Balance sheet- The balance sheet recorded an expansion as total assets increased by 7.5% to Kshs 716.0 bn, from Kshs 665.9 bn in FY’2024, mainly driven by a 5.0% loan book expansion to Kshs 317.2 bn from Kshs 302.1 bn in FY’2024.
- Declaration of dividends - The Board of Directors recommended a final dividend of Kshs 4.60, which was a 41.5% increase from Kshs 3.25 recommended in FY’ 2024. With the interim dividend of Kshs 2.50 per share, this brings the total dividend for the year to Kshs 7.10 per share which was a 29.1% increase from Kshs 5.50 paid in 2024. This translates to a dividend yield of 8.0% and a payout ratio of 50.0%.
For a more detailed analysis, please see the NCBA Group FY’2025 Earnings Note
Asset Quality:
The table below shows the asset quality of listed banks that have released their FY’2025 results using several metrics:
|
Cytonn Report: Listed Banks Asset Quality in FY’2025 |
||||||
|
Bank |
FY'2025 NPL Ratio* |
FY'2024 NPL Ratio** |
% point change in NPL Ratio |
FY'2025 NPL Coverage* |
FY'2024 NPL Coverage** |
% point change in NPL Coverage |
|
KCB Group |
16.2% |
19.8% |
(3.7%) |
74.0% |
65.1% |
9.0% |
|
Equity Group |
11.5% |
13.6% |
(2.1%) |
66.8% |
63.7% |
3.1% |
|
Standard Chartered Bank |
5.5% |
7.4% |
(2.0%) |
87.0% |
81.8% |
5.2% |
|
Co-operative Bank |
15.7% |
17.0% |
(1.3%) |
66.0% |
63.9% |
2.1% |
|
Stanbic Holdings |
8.0% |
9.1% |
(1.1%) |
84.3% |
78.4% |
5.9% |
|
Absa Bank Kenya |
11.5% |
12.6% |
(1.1%) |
64.6% |
66.0% |
(1.4%) |
|
I&M Group |
9.6% |
11.5% |
(1.9%) |
71.6% |
62.3% |
9.3% |
|
NCBA Group |
10.4% |
11.5% |
(1.0%) |
71.6% |
59.2% |
12.4% |
|
Diamond Trust Bank |
11.3% |
12.6% |
(1.3%) |
52.8% |
39.9% |
13.0% |
|
FY’2025 Mkt Weighted Average* |
11.7% |
13.4% |
(1.6%) |
71.5% |
66.7% |
4.8% |
|
FY’2025 Mkt Weighted Average** |
13.2% |
12.6% |
0.7% |
66.8% |
60.7% |
6.1% |
|
*Market cap weighted as at 27/03/2026 |
||||||
|
**Market cap weighted as at 13/03/2025 |
||||||
Key take-outs from the table include;
- Asset quality for the listed banks that have released results improved during FY’2025, with market-weighted average NPL ratio decreasing by 1.6% points to 11.7% from 13.4% in FY’2024 largely due to KCB Group numbers, and,
- Market-weighted average NPL Coverage for the nine listed banks increased by 4.8% points to 71.5% in FY’2025 from 66.7% recorded in FY’2024. The increase was attributable to DTB-K’s NPL coverage ratio increasing by 13.0% points to 52.8% from 39.9% in FY’2024. However, the performance was weighed down by Absa Bank Kenya NPL coverage ratio decreasing by 1.4% points to 64.6% from 66.0% in FY’2024.
Summary Performance
The table below shows the performance of listed banks that have released their FY’2025 results using several metrics:
|
Cytonn Report: Listed Banks Performance in FY’2025 |
|||||||||||||
|
Bank |
Core EPS Growth |
Interest Income Growth |
Interest Expense Growth |
Net Interest Income Growth |
Net Interest Margin |
Non-Funded Income Growth |
NFI to Total Operating Income |
Growth in Total Fees & Commissions |
Deposit Growth |
Growth in Government Securities |
Loan to Deposit Ratio |
Loan Growth |
Return on Average Equity |
|
Equity Group |
54.7% |
2.0% |
(24.2%) |
16.8% |
7.8% |
6.7% |
41.7% |
7.9% |
4.0% |
11.4% |
60.6% |
7.7% |
27.8% |
|
Diamond Trust Bank |
23.1% |
2.8% |
(16.3%) |
24.1% |
6.7% |
(9.1%) |
25.3% |
10.4% |
13.8% |
17.7% |
63.7% |
13.6% |
11.7% |
|
I&M Group |
21.2% |
(1.4%) |
(23.9%) |
16.0% |
8.5% |
30.8% |
23.8% |
20.9% |
17.4% |
55.5% |
63.3% |
6.5% |
17.8% |
|
Co-operative Bank |
16.9% |
8.0% |
(12.8%) |
22.0% |
9.2% |
(0.3%) |
31.6% |
1.2% |
13.4% |
12.6% |
73.3% |
12.6% |
19.1% |
|
KCB Group |
11.2% |
(1.7%) |
(18.9%) |
7.8% |
8.6% |
(2.6%) |
30.8% |
0.7% |
15.2% |
10.2% |
72.3% |
16.3% |
22.5% |
|
Absa Bank Kenya |
9.7% |
(10.9%) |
(22.2%) |
(6.4%) |
9.1% |
12.2% |
29.4% |
18.8% |
1.4% |
20.7% |
83.8% |
1.0% |
24.7% |
|
NCBA Group |
7.0% |
(10.0%) |
(41.6%) |
27.7% |
7.5% |
3.8% |
39.9% |
4.0% |
5.9% |
4.6% |
59.6% |
5.0% |
19.7% |
|
Stanbic Group |
0.0% |
(17.2%) |
(41.4%) |
(1.0%) |
5.7% |
(6.4%) |
37.5% |
(10.0%) |
19.5% |
36.4% |
70.3% |
17.2% |
18.8% |
|
Standard Chartered Bank |
(38.0%) |
(15.4%) |
(29.1%) |
(13.1%) |
8.7% |
(23.0%) |
31.7% |
1.0% |
(4.1%) |
11.8% |
54.4% |
1.8% |
18.0% |
|
FY'2025 Mkt Weighted Average* |
15.5% |
(4.2%) |
(25.2%) |
10.3% |
8.1% |
1.6% |
34.0% |
5.4% |
8.6% |
16.6% |
67.2% |
9.0% |
21.7% |
|
FY'24 Mkt Weighted Average* |
26.2% |
20.5% |
42.6% |
12.0% |
7.6% |
13.9% |
36.1% |
9.2% |
(4.4%) |
18.9% |
66.5% |
(7.6%) |
22.8% |
|
*Market cap weighted as at 27/03/2026 |
|||||||||||||
|
**Market cap weighted as at 13/03/2025 |
|||||||||||||
Key take-outs from the table include:
- The listed banks that have released their FY’2025 results recorded a 15.5% growth in core Earnings per Share (EPS) in FY’2025, compared to the weighted average growth of 26.2% in FY’2024, an indication of deteriorated performance attributable to the Standard Chartered numbers.
- Interest income recorded a weighted average decrease of 4.2% in FY’2025, compared to 20.5% in FY’2024. Similarly, interest expenses recorded a market-weighted average decline of 25.2% in FY’2025 compared to the weighted average growth of 42.6% in FY’2024.
- The Banks’ net interest income recorded a weighted average growth of 10.3% in FY’2025, a decrease from the 12.0% recorded over a similar period in 2024, while the non-funded income increased by 1.6% in FY’2025 compared to the 13.9% growth recorded in FY’ 2024, and,
- The Banks recorded a weighted average deposit growth of 8.6%, compared to the decrease in market-weighted average deposit of 4.4% in FY’2024.
- Kenya Re Corporation Limited FY’2025 Financial Results.
Kenya Re corporation released their FY’2025 results, recording an 12.9% decrease in Profit After Tax to Kshs 3.9 bn, from the Kshs 4.4 bn recorded in FY’2024. The performance was mainly driven by a 11.1% decrease in Insurance Revenue to Kshs 12.6 bn from Kshs 14.2 bn, coupled with a 6.0% increase in Insurance Service Expense to Kshs 11.1 bn from Kshs 10.5 bn, and a 91.0% increase in Net Expense from reinsurance contracts held to Kshs 1.4 bn from Kshs 0.7 bn.
|
Cytonn Report: Kenya Re's Income Statement |
|||
|
Income Statement (Kshs bn) |
FY'2024 |
FY'2025 |
y/y change |
|
Insurance Revenue |
14.2 |
12.6 |
(11.1%) |
|
Insurance Service Expense |
(10.5) |
(11.1) |
6.0% |
|
Net Expense from reinsurance contracts held |
(0.7) |
(1.4) |
91.0% |
|
Insurance Service Result |
2.9 |
0.1 |
(96.3%) |
|
Investment Income |
4.7 |
6.6 |
41.3% |
|
Net Insurance and Investment Revenue |
6.9 |
6.4 |
(6.9%) |
|
Operating and other expenses |
(1.4) |
(1.8) |
31.4% |
|
Profit before tax |
5.6 |
4.77 |
(15.6%) |
|
Income tax expense |
(1.2) |
(0.90) |
(25.6%) |
|
Profit after tax |
4.4 |
3.86 |
(12.9%) |
|
Core EPS (Kshs) |
0.8 |
0.6 |
(27.2%) |
|
Dividend Per Share (Kshs) |
0.15 |
0.15 |
0.0% |
|
Dividend Yield |
7.2% |
4.6% |
(2.7%) |
|
Dividend Payout Ratio |
18.5% |
25.4% |
6.9% |
|
Cytonn Report: Kenya Re's Balance Sheet |
|||
|
Balance Sheet items |
FY'2024 |
FY'2025 |
y/y change |
|
Government Securities |
24.4 |
25.0 |
2.6% |
|
Reinsurance contract assets |
0.6 |
0.2 |
(69.8%) |
|
Other assets |
39.1 |
43.3 |
10.8% |
|
Total assets |
64.1 |
68.5 |
6.9% |
|
Insurance and Reinsurance contract liabilities |
12.8 |
13.1 |
1.9% |
|
Payables and Other liabilities |
2.5 |
2.9 |
15.8% |
|
Total liabilities |
15.3 |
16.0 |
4.2% |
|
Shareholder funds |
48.8 |
52.6 |
7.8% |
Key take outs from the results:
- Core EPS decreased by 27.2% to Kshs 0.6 in FY’2025 from Kshs 0.8 in FY’2024. Dividend per share remained unchanged at Kshs 0.15 for both years, resulting in a stable payout ratio of 18.5% in FY’2024 and 25.4% in FY’2025, while dividend yield fell from 7.2% in FY’2024 to 4.6% in FY’2025.
- Insurance revenue fell by 11.1% to Kshs 12.6 bn in FY’2025 from Kshs 14.2 bn in FY’2024, while insurance service expenses increased by 6.0% to Kshs 11.1 bn. Additionally, net expenses from reinsurance contracts held rose sharply by 91.0% to Kshs 1.4 bn from Kshs 0.7 bn. This combination led to a steep 96.3% decline in insurance service result to Kshs 0.1 bn from Kshs 2.9 bn,
- Profit before tax decreased by 15.6% to Kshs 4.8 bn, while profit after tax declined by 12.9% to Kshs 3.9 bn.
- The balance sheet recorded an expansion as total assets increased by 6.9% to Kshs 68.5 bn in FY’2025 from Kshs 64.1 bn in FY’2024, driven primarily by a 10.8% rise in other assets to Kshs 43.3 bn and a 2.6% increase in government securities to Kshs 25.0 bn.
- Total liabilities grew by 4.2% to Kshs 16.0 bn from Kshs 15.3 bn, primarily due to a 1.9% increase in insurance and reinsurance contract liabilities to Kshs 13.1 bn. Shareholder funds expanded by 7.8% to Kshs 52.6 bn, reflecting the company’s retained earnings and strong capital base.
Other highlights from the release include:
- Declaration of dividends – The directors of Kenya Re corporation recommend a payment of Kshs 0.15 dividend per share for FY’2025.
Going forward, the factors that would drive Kenya Re’s growth would be:
- Regional and international expansion – Kenya Re continues to pursue a deliberate growth strategy through geographic diversification. The company is setting up a subsidiary in Tanzania and a branch in India. The Tanzanian subsidiary, requiring an initial capital injection of USD 6.0 mn, will enable Kenya Re to comply with local regulations that bar foreign reinsurers without a local presence from underwriting, thereby regaining previously lost business. The India branch, located in a Special Economic Zone (SEZ), will benefit from a 10–15-year tax holiday and foreign currency operations, giving Kenya Re a competitive advantage and the opportunity to build dollar reserves. The expansion will initially focus on fire, engineering, and marine lines, with expected revenues of Kshs 1.5 bn in the first year and a projected break-even within three years.
- Future growth pipeline – Beyond Tanzania and India, Kenya Re is exploring new markets across Africa and the Middle East, including South Africa, Egypt, Ethiopia, the Democratic Republic of Congo, and Nigeria. This pipeline of expansion opportunities will diversify revenue streams and strengthen Kenya Re’s ambition to become a leading Pan-African and international reinsurer. With an existing presence in over 80 markets and subsidiaries in Côte d’Ivoire, Zambia, and Uganda, Kenya Re is well-positioned to leverage its scale, reputation, and government backing to deepen market penetration and enhance its competitive positioning across emerging economies.
We maintain a “cautiously optimistic” short-term outlook supported primarily earnings-led attractive valuations, lower yields on short-term government papers and expected global and local economic recovery, and, “neutral” in the long term as persistent foreign investor outflows continue to constrain market liquidity and limit broad-based market re-rating. With the market currently trading at a discount to its future growth (PEG Ratio at 0.9x), where performance will be driven by company-specific fundamentals rather than general market direction, we believe that investors should reposition towards value stocks exhibiting strong earnings growth, attractive dividend yields, solid balance sheets, sustainable competitive advantages and trading at compelling discounts to their intrinsic value. While foreign investor sell-offs are expected to continue exerting pressure in the near term, we believe this will create selective entry opportunities for long-term investors.
- Industry Report
During the week, state-backed mortgage lender, Kenya Mortgage Refinance Company (KMRC) released its FY’2025 financial results, which reported a 24.2% decrease in Profit After Tax (PAT) to Kshs 1.0 bn from Kshs 1.3 mn recorded in FY’2024 majorly attributable to 19.6% decrease in net interest income to Kshs 1.7 bn in FY’2025 from 2.2 bn in FY’2024. Additionally, total assets increased by 33.6% to Kshs 43.2 bn from 32.3 bn posted in FY’2024, owing to the 64.7% and 18.9% increase in Loan and advances and Cash and Cash equivalents respectively. The table below shows a summary of KMRC’s income statement for FY’2024 and FY’2025. The table below shows a summary of KMRC’s income statement for FY’2024 and FY’2025;
|
Cytonn Report: Summary of KMRC Statement of Comprehensive Income |
|||
|
|
FY'2024 (Kshs mn) |
FY'2025 (Kshs mn) |
y/y Change |
|
REVENUE |
|
|
|
|
Interest Income |
3,214.9 |
3191.2 |
(0.7%) |
|
Interest expense |
(1,055.7) |
(1455.4) |
37.9% |
|
Net interest income |
2,159.2 |
1735.8 |
(19.6%) |
|
EXPENSES |
|||
|
Net movement in expected credit losses |
1.1 |
(0.8) |
(179.9%) |
|
Operating and adminstration expenses |
(317.5) |
(348.1) |
9.6% |
|
Depreciation and amortisation expenses |
(24.8) |
(22.0) |
(11.2%) |
|
Total Expenses |
(341.2) |
(370.9) |
8.7% |
|
Net profit before income tax |
1,818.0 |
1,364.9 |
(24.9%) |
|
Income tax expense |
(495.9) |
(362.4) |
(26.9%) |
|
PROFIT AFTER TAX |
1,322.1 |
1,002.4 |
(24.2%) |
Source: KMRC
The table below shows a summary of KMRC’s balance sheet for FY’2024 and FY’2025;
|
Cytonn Report: Summary of KMRC Statement of Financial Position |
|||
|
|
FY'2024 (Kshs mn) |
FY'2025 (Kshs mn) |
y/y Change |
|
Assets |
|
|
|
|
Loan and Advances |
11,888.6 |
19,579.2 |
64.7% |
|
Cash and Cash equivalents |
14,860.5 |
17,674.8 |
18.9% |
|
Other Assets |
5,572.6 |
5,932.2 |
6.5% |
|
Total Assets |
32,321.6 |
43,186.3 |
33.6% |
|
Liabilities |
|||
|
Borrowings |
25,731.2 |
35,865.4 |
39.4% |
|
Debt securities in issue |
1,144.2 |
975.5 |
(14.7%) |
|
Lease Liabilities |
14.7 |
59.6 |
306.5% |
|
Other Liabilities |
593.4 |
445.4 |
(24.9%) |
|
Total Liabilities |
27,483.5 |
37,345.9 |
35.9% |
|
Capital Resources |
|||
|
Share Capital |
1,808.4 |
1,808.4 |
0.0% |
|
Revenue reserves |
2,911.8 |
3,836.9 |
31.8% |
|
Other Revenues |
0.3 |
0.0 |
(89.1%) |
|
Statutory Reserve |
117.7 |
195.0 |
65.7% |
|
Total Capital |
4,838.2 |
5,840.4 |
20.7% |
|
Total Liabilities and Equity |
32,321.6 |
43,186.3 |
33.6% |
Source: KMRC
Income Statement:
- The profit after tax decreased by 24.2% to Kshs 1.0 bn in FY’2025, from Kshs 1.3 bn in FY’2024 majorly attributable to a 19.6% decrease in net interest income to Kshs 1.7 bn in FY’2025 from Kshs 2.2 bn recorded in FY’2024, contrary to the 64.7% increase in loans and advances to Kshs 19.6 bn from Kshs 11.9 bn in FY’2024.
- The total expenses increased by 8.7% to Kshs 370.9 mn in FY’2025 from Kshs 341.2 mn recorded in FY’2024 mainly attributable to a 9.6% increase in operating and administration expense to Kshs 348.1 in FY’2025 from Kshs 317.5 mn in FY’2024. The increase in total expenses was, however weighed down by a 179.9% and an 11.2% decline in net movement in expected credit losses and depreciation and amortization expense respectively, and,
Balance Sheet:
- Total assets increased by 33.6% to Kshs 43.2 bn in FY’2025 from Kshs 32.3 bn in FY’2024 mainly attributable to 64.7% increase in loans and advances to Kshs 19.6 bn in FY’2025 from Kshs 11.9 bn in FY’2024. Additionally, Cash and Cash equivalents increased by 18.9% to Kshs 17.7 bn in FY’2025 from Kshs 14.9 bn in FY’2024,
- Total liabilities posted a 35.9% increase to Kshs 37.3 bn in FY’2025 from Kshs 27.5 bn in FY’2024 majorly on the back of an increase in borrowings by 39.4% to Kshs 35.9 bn in FY2025 from Kshs 25.7 bn in FY’2024. Additionally, lease liabilities recorded a 306.5% surge to Kshs 59.6 mn in FY’2025 from Kshs 14.7 mn in FY’2024, and,
- The company’s borrowings increased by 39.4% to Kshs 35.9 bn in FY’2025 from Kshs 25.7 bn, reflecting a notable expansion in liabilities driven by additional funding commitments and new financing structures such as the Risk Sharing Facility (RSF), blended finance arrangements, and planned bond issuances.
We anticipate KMRC will continue disbursing more mortgages in line with the government’s ongoing goal of expanding homeownership across the country. The company has consistently demonstrated its ability to manage resources efficiently, as reflected in its financial statements, which builds confidence in its capacity to handle increased funding for stakeholders. Support for KMRC is expected to grow as the company strengthens partnerships with new primary mortgage lenders (PMLs) and continues to introduce innovative financial products and sustainable financing solutions such as the green linked bond to further develop Kenya’s mortgage market.
- Infrastructure Sector
Rumuruti-Nanyuki Road Upgrade Project
During the week, the government initiated a road infrastructure project following the award of a Kshs 2.5 bn contract by the Kenya National Highways Authority (KENHA) for the tarmacking of the Rumuruti-Nanyuki road. The project forms part of ongoing efforts to improve road connectivity across secondary urban corridors, focusing on enhancing accessibility within Laikipia County and strengthening linkages between towns such as Rumuruti and Nanyuki.
The project has received initial funding support, with the National Treasury allocating Kshs 206.9 mn in the current financial year toward implementation. The upgrade of the Rumuruti-Mutara stretch is expected to address existing infrastructure constraints, particularly poor road conditions that have limited mobility and increased transport costs across the corridor. The works will include earthworks, drainage systems, and road surfacing, transforming the currently unpaved stretch into a reliable, all-weather route.
We expect improved road quality to enhance the movement of agricultural produce, reduce travel times, and support trade efficiency, reinforcing the region’s role within the broader Mt Kenya economic and tourism circuit. Continued investment in road infrastructure across secondary towns is likely to support regional integration and economic expansion. Improved accessibility may drive gradual land value appreciation along the corridor, particularly around growth nodes such as Nanyuki, while rising investor interest in residential and mixed-use developments is anticipated as infrastructure upgrades reduce development barriers and increase the attractiveness of previously underdeveloped areas, positioning the corridor as an emerging frontier for real estate activity.
- Real Estate Investments Trusts
- REITs Weekly Performance
On the Unquoted Securities Platform Acorn D-REIT and I-REIT traded at Kshs 27.4 and Kshs 23.2per unit, respectively, as per the last updated data on 13th March 2025. The performance represented a 33.4% and 14.5% gain for the D-REIT and I-REIT, respectively, from the Kshs 20.0 inception price. The volumes traded for the D-REIT and I-REIT came in at 13.4 mn and 42.2 mn shares, respectively. Additionally, ILAM Fahari I-REIT traded at Kshs 11.0 per share as of 13th March, representing a 45.0% loss from the Kshs 20.0 inception price. The volume traded to date came in at 1.2 mn shares for the I-REIT, REITs offer various benefits, such as tax exemptions, diversified portfolios, and stable long-term profits. However, the ongoing decline in the performance of Kenyan REITs and the restructuring of their business portfolios are hindering significant previous investments. Additional general challenges include:
- Insufficient understanding of the investment instrument among investors leading to a slower uptake of REIT products,
- Lengthy approval processes for REIT creation,
- High minimum capital requirements of Kshs 100.0 mn for REIT trustees compared to Kshs 10.0 mn for pension funds Trustees, essentially limiting the licensed REIT Trustee to banks only
- The rigidity of choice between either a D-REIT or and I-REIT forces managers to form two REITs, rather than having one Hybrid REIT that can allocate between development and income earning properties
- Limiting the type of legal entity that can form a REIT to only a trust company, as opposed to allowing other entities such as partnerships, and companies,
- We need to give time before REITS are required to list – they would be allowed to stay private for a few years before the requirement to list given that not all companies maybe comfortable with listing on day one, and,
- Minimum subscription amounts or offer parcels set at Kshs 0.1 mn for D-REITs and Kshs 5.0 mn for restricted I-REITs. The significant capital requirements still make REITs relatively inaccessible to smaller retail investors compared to other investment vehicles like unit trusts or government bonds, all of which continue to limit the performance of Kenyan REITs.
We expect the performance of Kenya’s Real Estate sector to remain resilient, supported by several factors: i) Rumuruti-Nanyuki Road Improvement Project signaling enhanced infrastructure and connectivity along the Laikipia corridor, ii) Continued market support from the Kenya Mortgage Refinance Company (KMRC), which is improving mortgage access and driving uptake of home ownership. However, challenges such as the weak investor appetite in listed REITs like ILAM Fahari I-REIT and high capital requirements will continue to constrain the sector’s optimal performance.
The Kenya Mortgage Refinance Company (KMRC) is a non-deposit taking, public-private partnership (PPP) firm formed by the Government of Kenya and regulated by the Central Bank of Kenya (CBK). The primary mandate of KMRC is to ensure sustainable home financing in the country, by providing long-term funds to primary mortgage lenders (PMLs) such as; banks, microfinance institutions and SACCOs at low and fixed interest rates. KMRC was incorporated in April 2018 under the Companies Act 2015, and authorized by the CBK to begin lending operations in September 2020. In 2024, KMRC had managed to disburse Kshs 14.0 bn in mortgages.
As a wholesale financial institution, KMRC does not take deposits nor lend directly to individuals. This strategic approach allows KMRC to concentrate on enhancing liquidity for primary mortgage lenders (PMLs) and fostering standardized lending practices in collaboration with governmental bodies and other stakeholders. The primary aim is to empower mortgage lending institutions to sustain their lending activities to homebuyers without concern over potential shortages in long-term funding. This is achieved by ensuring they have the capacity to manage any unforeseen short-term deposit fluctuations. Beyond providing extended funding, KMRC also plays a pivotal role in advancing Kenya's economic growth by expanding the capital markets through the issuance of corporate bonds tailored for long-term financing purposes. We have been tracking the KMRC over the years with the most recent topical done in April 2024:
- Update on Kenya Mortgage Refinance Company (KMRC). KMRC continued to make strides towards enhancing sustainable home financing in Kenya. The update highlighted key developments, including increased refinancing of mortgage loans to banks and Saccos, expansion of long-term funding through bond issuances, and initiatives to reduce mortgage interest rates for end borrowers. The report also noted ongoing challenges in the mortgage market, such as affordability constraints, limited access to long-term finance, and structural market inefficiencies, while emphasizing the milestones achieved in supporting the growth and stability of Kenya’s mortgage sector.
This week, we shall discuss the progress made by KMRC in the housing sector by noting the key developments, and the challenges faced. We shall offer suggestions to enhance mortgage funding by drawing insights from similar entities in different countries. In this article we shall write on:
- Overview of the Housing Sector in Kenya,
- Home Financing in Kenya,
- Kenya Mortgage Refinance Company (KMRC) Review,
- Case Studies and Lessons Learnt, and,
- Conclusion.
Section I: Overview of the Housing Sector in Kenya
In recent years, there has been a notable rise in the demand for housing in Kenya. This surge is attributed to factors such as a growing population and an elevated rate of urbanization, with more individuals relocating from rural regions in pursuit of employment opportunities, especially the young population. As of 2024, urbanization and population growth rates were at 2.8% and 2.0% respectively, both higher than global averages of 1.4% and 1.0% respectively. Kenya faces a significant annual deficit of 200,000 housing units. Developers are only able to deliver 50,000 units annually against the annual demand of 250,000 units. Additionally, the housing segment faces many challenges on both supply and demand sides. On the supply side, the high cost of construction and lack of sufficient capital for developers have been major challenges. On the demand side, diminishing purchasing power has affected potential homeowners, exacerbated by elevated macroeconomic factors such as increased taxes and inflation. According to the Centre for Affordable Housing Africa (CAHF), home ownership rates in Kenyan urban areas stands at 21.3%, relatively below the national average of 61.3% where 78.7% of urban dwellers are renters.
In a bid to counter the housing deficit in the country, the Kenyan government has made efforts to boost both the demand and the supply side. On the supply side, the government has set an ambitious target of delivering 250,000 affordable housing units on an annual basis. Currently, the government is actively rolling out affordable housing projects across the country through partnerships with both public and private sector developers. The Affordable Housing Programme (AHP), now anchored under the Affordable Housing Act, 2024, continues to benefit from a range of fiscal and policy incentives aimed at stimulating supply and uptake. These include the provision of public land for development, a reduced corporate tax rate of 15.0% for developers delivering at least 100 residential units annually, and tax relief on contributions to the Affordable Housing Fund to encourage home ownership. Additionally, first-time homebuyers under the programme benefit from stamp duty exemptions, while developers enjoy VAT exemptions on selected construction materials and inputs used in affordable housing projects. Since its enactment, the Affordable Housing Act, 2024 has established a legal and institutional framework for the Affordable Housing Program, enabling sustainable funding through the Affordable Housing Fund and levy mechanisms. The Act has improved investor confidence, strengthened public–private partnerships and supported expanded mortgage financing via KMRC, laying the foundation for increased delivery of affordable homes across the country. Early indications show improved coordination among stakeholders, although full impact will depend on wider adoption of the funding mechanisms and continued efforts to make housing more affordable.
On the demand side, the government aims to significantly deepen Kenya’s mortgage market by increasing the number of mortgage accounts from fewer than 30,000 to over 1,000,000 in the long term. This is being pursued through the provision of affordable mortgages with monthly repayments targeted below Kshs 10,000, particularly for low- and middle-income households. Additionally, the government has restructured the housing finance framework through the Affordable Housing Act, 2024, which establishes the Affordable Housing Fund to mobilize long-term savings and support home ownership. The framework also incorporates alternative housing delivery models, including social and cooperative housing schemes, aimed at enhancing uptake of units developed under the Affordable Housing Programme (AHP). Furthermore, the government continues to support the operationalization of KMRC with a target of attaining 200,000 mortgages on average every financial year through KMRC, according to the Bottom-Up Economic Transformation Agenda. Therefore, KMRC is key in the implementation of AHP and some of its key objectives include;
- Providing sustainable, long-term funding at attractive rates to participating financing institutions which will enable them to scale up their mortgage lending operations,
- Facilitating participating institutions to extend the mortgage maturity durations in line with the goal of achieving long-term housing finance,
- Standardization of mortgage practices in Kenya which is geared towards enabling efficiency of lending processes by working together with the government and stakeholders,
- Boosting the growth of the capital markets in the country through the issuance of corporate bonds as a source of sustainable long-term funding,
- Ensuring lower overall transaction costs to PMLs through pooling issuance, as compared to accessing the markets individually, that will, in turn, enable them to offer lower rates to homebuyers, and,
- Facilitating the entry of new mortgage lenders in the market in a bid to increase competition among PMLs in order to lead to a wider range of high-quality mortgage products.
Section II: Home Financing in Kenya
The mortgage market is pivotal in the housing segment in Kenya with many Kenyans opting for mortgages to finance their housing development projects or when purchasing homes. Therefore, KMRC plays a crucial role in the housing segment by its role in providing loans to PMLs. For example, according to CBK, in 2024 there was a total of 30,016 mortgages in the market, meanwhile the total number of mortgages refinanced by KMRC stood at 3,855 representing 12.8% of the total mortgages accounts.
In 2024, the total number of mortgage accounts in Kenya stood at 30,016, reflecting marginal growth from 29,260 in 2023, according to the Central Bank of Kenya. This near-stagnation follows a period of faster growth in 2023, when mortgage accounts increased by 2,229 (8.0%) from 27,786 in 2022. Over the past decade, the mortgage market has recorded a Compound Annual Growth Rate (CAGR) of approximately 3.1%, indicating steady but moderate expansion driven by urbanization, population growth, and a rising middle-income segment. Despite this, Kenya’s mortgage-to-GDP ratio remains low at around 1.8%, underscoring the significant untapped potential in the housing finance sector. The graph below shows the average mortgage loan accounts from 2014 to 2024;
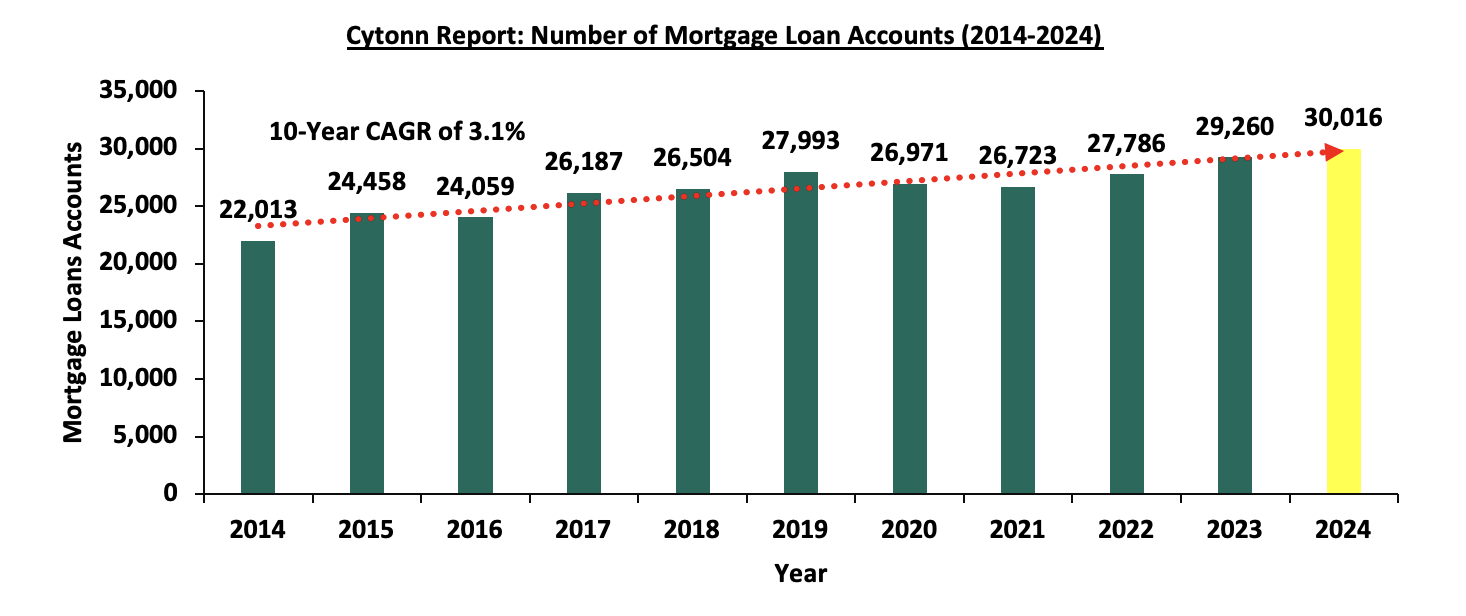
Source: Central Bank of Kenya
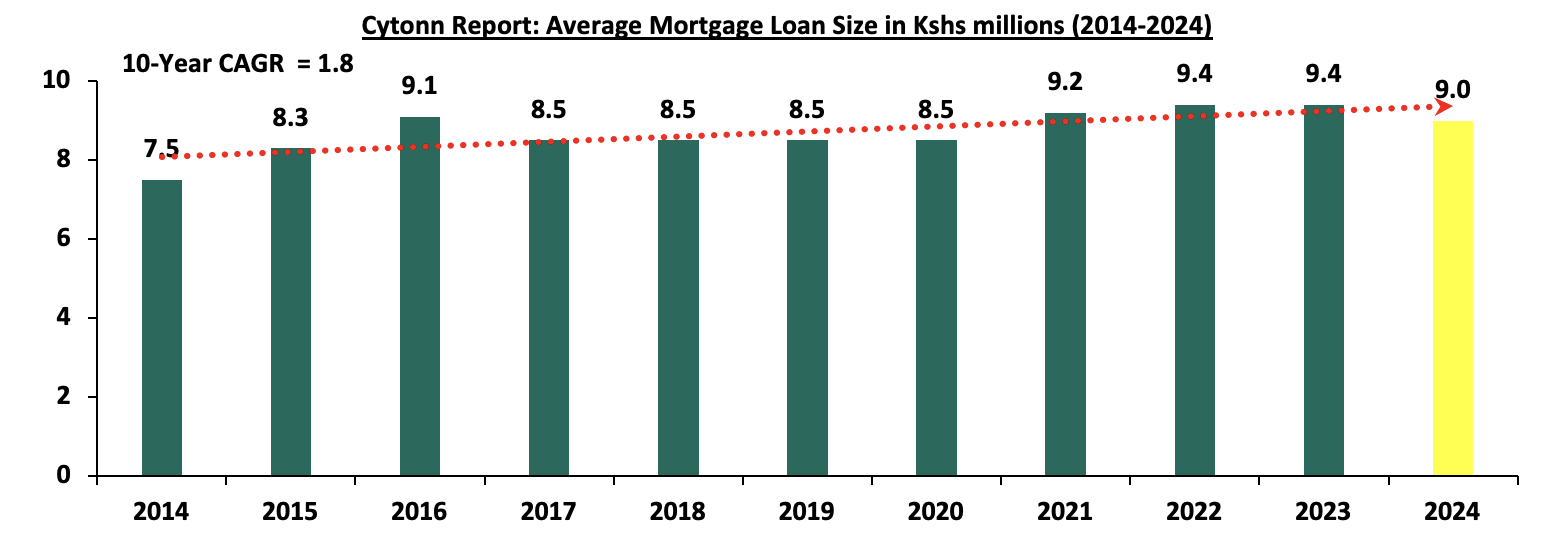
Similar to the mortgage loan accounts, the trend of average mortgage loan size has also been on an upward trajectory in the recent past, registering a 10-year CAGR of 1.8% to Kshs 9.0 mn in 2024 from Kshs 7.5 mn in 2014 as shown in the graph below;
Source: Central Bank of Kenya
This can be attributed to collaborative efforts by the government through entities such as the Kenya Mortgage Refinance Company (KMRC) and private players in making housing financing available to Kenyans. Additionally, the growth can also be attributed to the increase in property prices, consequently driving the demand for larger mortgages.
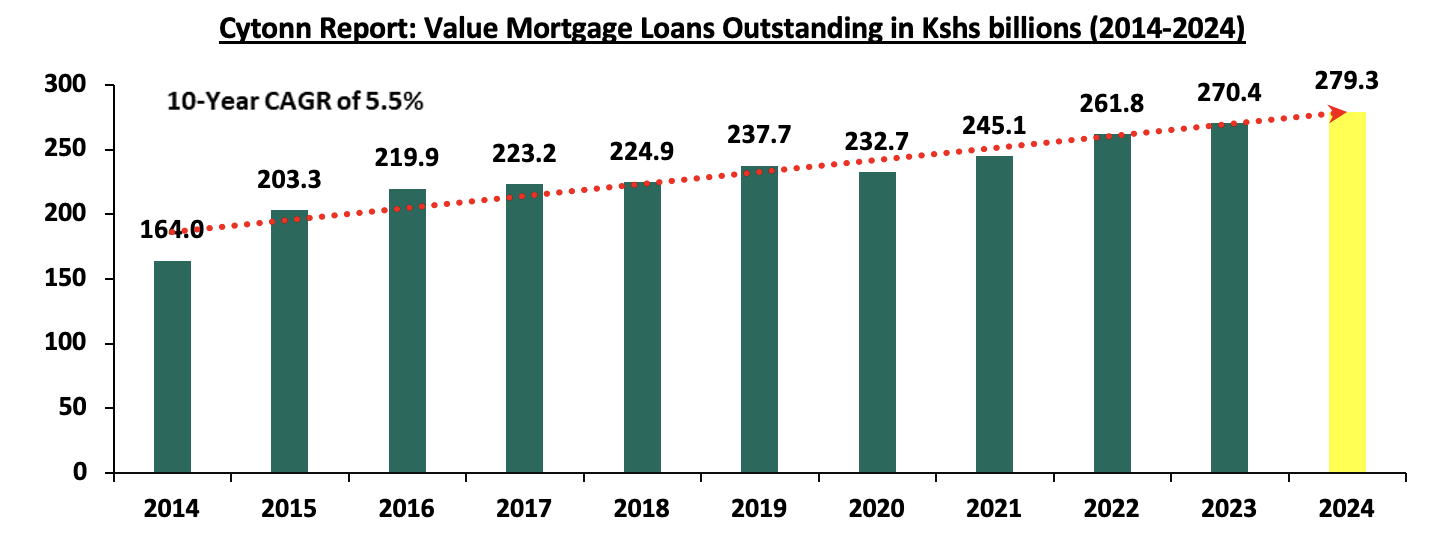
Going by the Bank Supervision Annual Report 2024, the value of mortgage loans outstanding increased by Kshs 8.9 bn, representing a 3.3% increase to Kshs 279.3 bn in 2024 from Kshs 270.4 bn in 2023. The upward trajectory of the loans, which also represented a positive 10-year CAGR of 5.5%, was attributed to the growing number of mortgage accounts as more people try to access mortgages to finance their housing needs. This follows the economic recovery from a downturn in 2020, during which the mortgage sector was adversely impacted by the COVID-19 pandemic. The graph below illustrates the trend of the value of mortgage loans outstanding from 2014 to 2024;
Source: Central Bank of Kenya
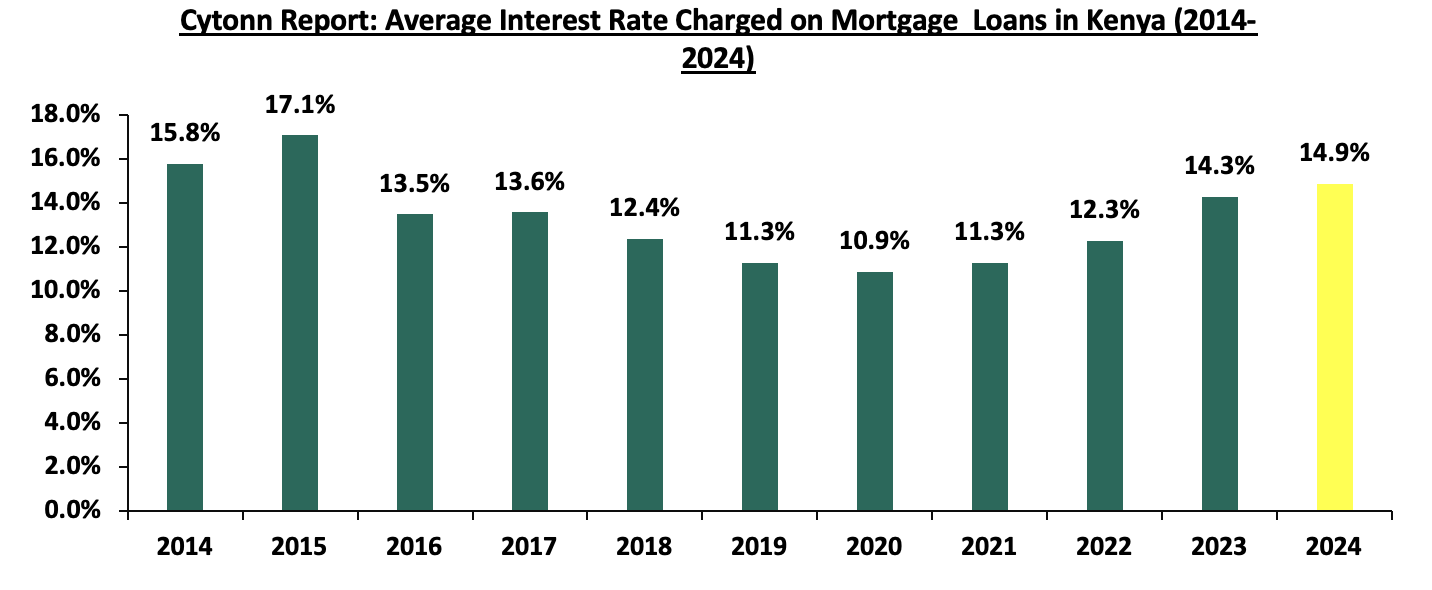
In 2024, the mortgage market recorded an average interest rate charged on mortgages of 14.9%, representing 0.6% points increase from 14.3% in 2023 and 12.3% in 2022. CBK noted that rates in 2024 ranged between 8.2% and 20.4%, compared to ranges of 8.7%–18.6% in 2023 and 8.2%–17.0% in 2022. The increase in mortgage interest rates in recent years was driven by a general rise in interest rates in the economy. Over the past decade, mortgage rates have exhibited a mixed trend, they initially declined following the introduction of the Central Bank of Kenya (CBK) lending rate cap in September 2016, before rising again after the cap’s repeal in November 2019. The post-repeal increase was largely due to loan repricing by banks, tighter monetary policy, and higher overall funding costs in the economy, as illustrated in the graph below
Source: Central Bank of Kenya
Despite periods of declining interest rates over the past decade, Kenya’s mortgage market remains underdeveloped, primarily due to low household incomes. For instance, a household earning the median monthly income of KShs 50,000 seeking a KShs 9.0 mn mortgage at 14.9% interest over 20 years would face monthly repayments of roughly KShs 123,000–125,000, more than double their income and thus largely unaffordable. Other factors constraining the market include high property prices, limited access to affordable long-term financing, cumbersome property registration processes and high land costs. Furthermore, most banks set Loan-to-Value (LTV) ratios below 90.0% in 2022–2023, requiring substantial down payments and further limiting access to mortgage finance
On the other hand, in 2024, the value of outstanding non‑performing mortgage loans increased to Kshs 46.0 bn, up from Kshs 39.9 bn in 2023 and Kshs 37.8 bn in 2022. The increase in non‑performing mortgage loans was linked to continued economic challenges, including the lingering effects of the COVID‑19 pandemic and rising interest rates, which strained borrowers’ ability to service their loans. This resulted in higher non‑performing mortgage loans to gross mortgage loans ratio of 16.5% in 2024, compared to 14.4% in 2023 and 11.4% in 2022, indicating increasing stress within the mortgage loan book over the period. The graph below shows the trend in the non-performing mortgage loans from 2014 to 2024;
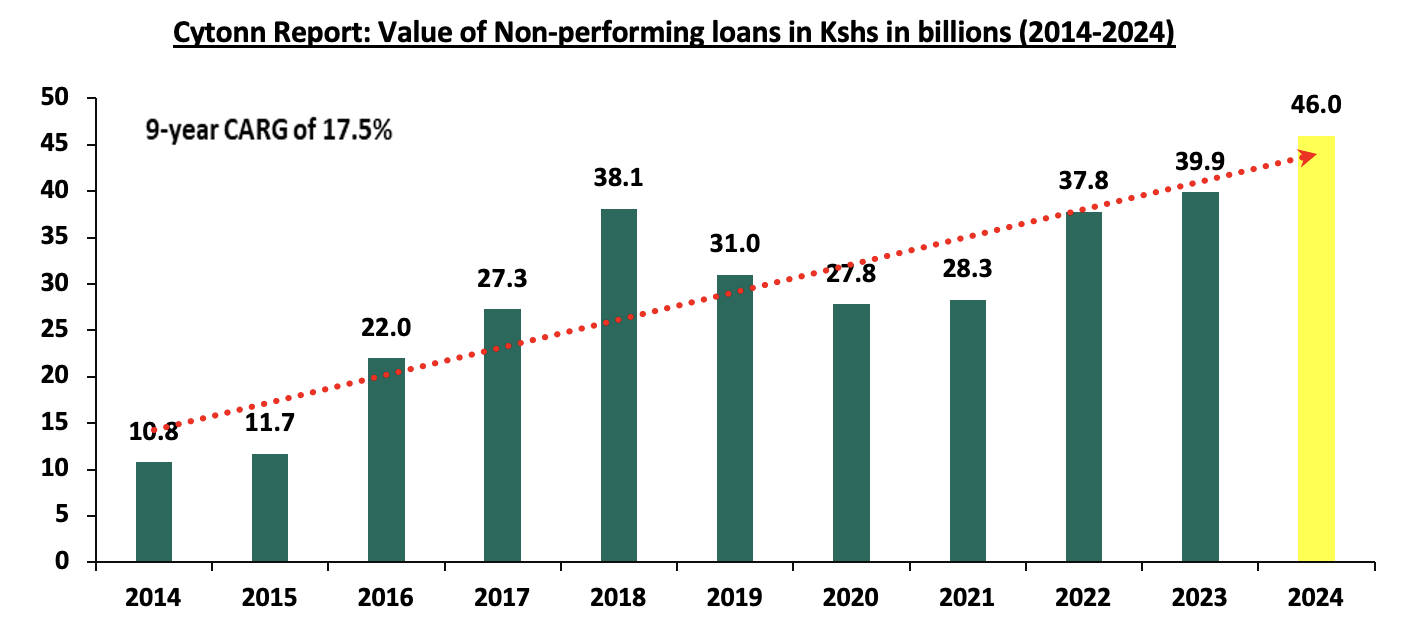
Source: Central Bank of Kenya
Non‑performing loans in Kenya recorded a 9‑year CAGR of 17.5% between 2015 and 2024, reflecting a consistent increase in mortgage loan defaults over the period. The growth in non-performing mortgage loans has been influenced by a combination of economic, political, and structural factors. Economic disruptions such as the COVID‑19 pandemic, coupled with rising interest rates and high borrowing costs, constrained borrowers’ repayment capacity, contributing to elevated non-performing mortgage loan balances. By 2024, the value of outstanding non-performing mortgage loans reached Kshs 46.0 bn, up from Kshs 39.9 bn in 2023 and Kshs 37.8 bn in 2022, highlighting ongoing stress in the mortgage portfolio despite gradual improvements in the housing finance market.
On the other hand, Kenya’s mortgage to GDP remains low at approximately 1.6%, as of the latest date by Centre for Affordable Housing Africa, compared to countries such as South Africa, Zambia and Rwanda which are at approximately 17.6%, 7.8%, and 3.3% respectively as at 2024, respectively, as shown below;
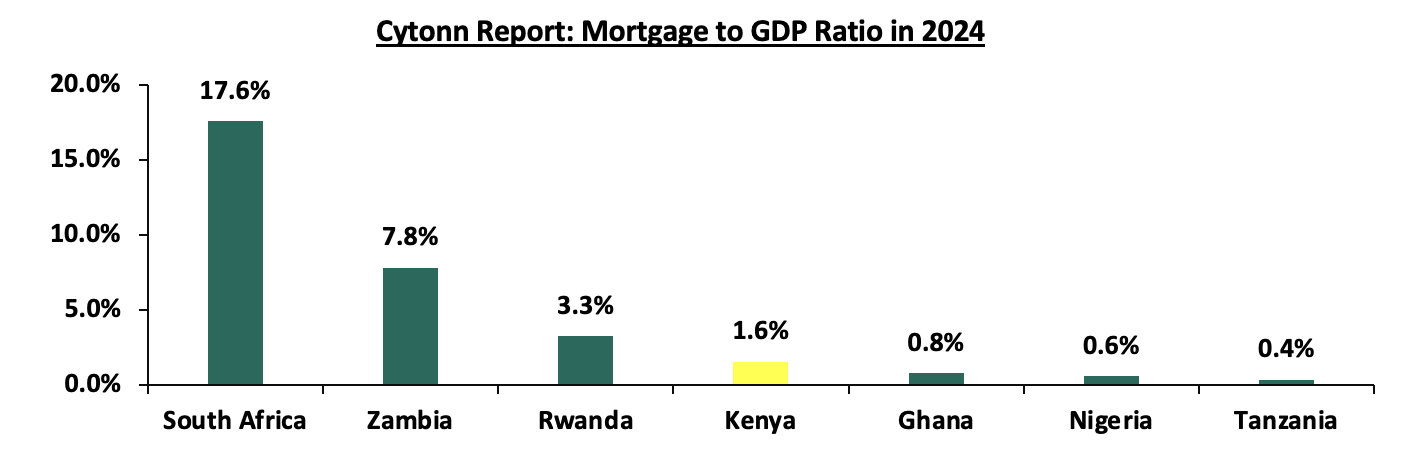
Source: Centre for Affordable Housing Africa
Currently, Kenya has 30,016 mortgage loan accounts with an average size of Kshs 9.0 mn, bringing the total value of outstanding mortgages to Kshs 279.3 bn as of December 2024 which translates to a mortgage‑to‑GDP ratio of 1.6% in 2024 reflecting a relatively small mortgage market relative to the size of the economy. To match South Africa’s 17.6% mortgage‑to‑GDP ratio, Kenya’s mortgage market would need an expansion of approximately Kshs 2,576.4 bn, assuming the average mortgage size remained at Kshs 9.0 mn. This means an additional 286,268 mortgages would be required to achieve that target level.
Section III: Kenya Mortgage Refinance Company (KMRC) Review
- Overview of the Kenya Mortgage Refinance Company
The Kenya Mortgage Refinance Company (KMRC) is a treasury backed non-deposit taking financial institution established in 2018 under the Companies Act 2015 and was licensed by the Central Bank of Kenya (CBK) to commence core business operations in September 2020. KMRC is the sole institution licensed to carry out Mortgage Liquidity Facility (MLF) activities in Kenya, which include the provision of long-term funds to Primary Mortgage Lenders (PMLs) such as banks, microfinance institutions, and SACCOS for purposes of increasing availability of affordable home loans to Kenyans. KMRC acts as an intermediary between PMLs and the capital markets through the issuance of bonds subject to regulation and supervision of the CBK and Capital Markets Authority (CMA), with the objective of providing long term funds at better rates. As such, KMRC does not lend directly to individual borrowers. The issuer was established as a crucial component in the implementation of the Affordable Housing Plan aimed at increasing the low rates of home ownership, particularly in urban areas, resulting from limited and inaccessible housing financing as well as high housing costs. In support of this, KMRC was purposely established through a public-private partnership (PPP) arrangement between the Government of Kenya and World Bank with majority ownership being by the private sector at 75.0%. Currently, the Kenya Mortgage Refinance Company (KMRC) has 23 institutional shareholders, comprising the Government of Kenya, development finance institutions such as IFC and Shelter Afrique, commercial banks, a microfinance bank, and numerous SACCOs, reflecting its broad-based public-private ownership structure;
|
Cytonn Report: KMRC Shareholders |
|||
|
# |
Umbrella Body |
Individual Shareholders |
Estimated Stake (%) |
|
1 |
Government of Kenya |
The National Treasury and Economic |
25.3% |
|
2 |
Development Finance Institutions |
International Finance Corporation (IFC), |
22.9% |
|
3 |
Commercial Banks |
KCB Bank, Co-operative Bank, Stanbic |
44.3% |
|
4 |
Microfinance Bank |
Kenya Women Microfinance Bank (KWFT) |
|
|
5 |
Savings and Credit Cooperatives |
Stima, Qona, Apstar, Imarisha, Tower, Mwalimu, Unaitas, Harambee, Bingwa, Kenya Police & Imarika SACCOs |
7.5% |
Source: Kenya Mortgage Refinance Company (KMRC)
By providing long-term funding to participating Primary Mortgage Lenders (PMLs) at concessional rates of approximately 5.0%, with repayment periods of up to 25 years, the Kenya Mortgage Refinance Company has enhanced liquidity within Kenya’s mortgage market. This has enabled lenders to offer longer-tenor and more affordable mortgage products, including single-digit interest rate loans to eligible borrowers. Consequently, KMRC has increased the availability of housing finance through the refinancing of mortgage portfolios held by its member PMLs. Overall, KMRC continues to play a critical role in deepening the mortgage market and supporting homeownership, in line with Kenya’s affordable housing objectives.
- KMRC Progress and Key Milestones Achieved
The Kenya Mortgage Refinance Company was incorporated in April 2018 in accordance with the requirements of the Companies Act 2015. In 2019, KMRC completed a successful capital mobilization drive, resulting in the Government of Kenya, commercial banks, a microfinance bank, and SACCOs becoming shareholders of the Company. In June 2020, KMRC held its first Annual General Meeting and was subsequently issued with its operating license in September 2020. Since its operationalization, KMRC has made notable progress in refinancing mortgages for its participating Primary Mortgage Lenders (PMLs). In 2025, KMRC refinanced 5,148 mortgages, supporting increased access to long-term housing finance in Kenya.
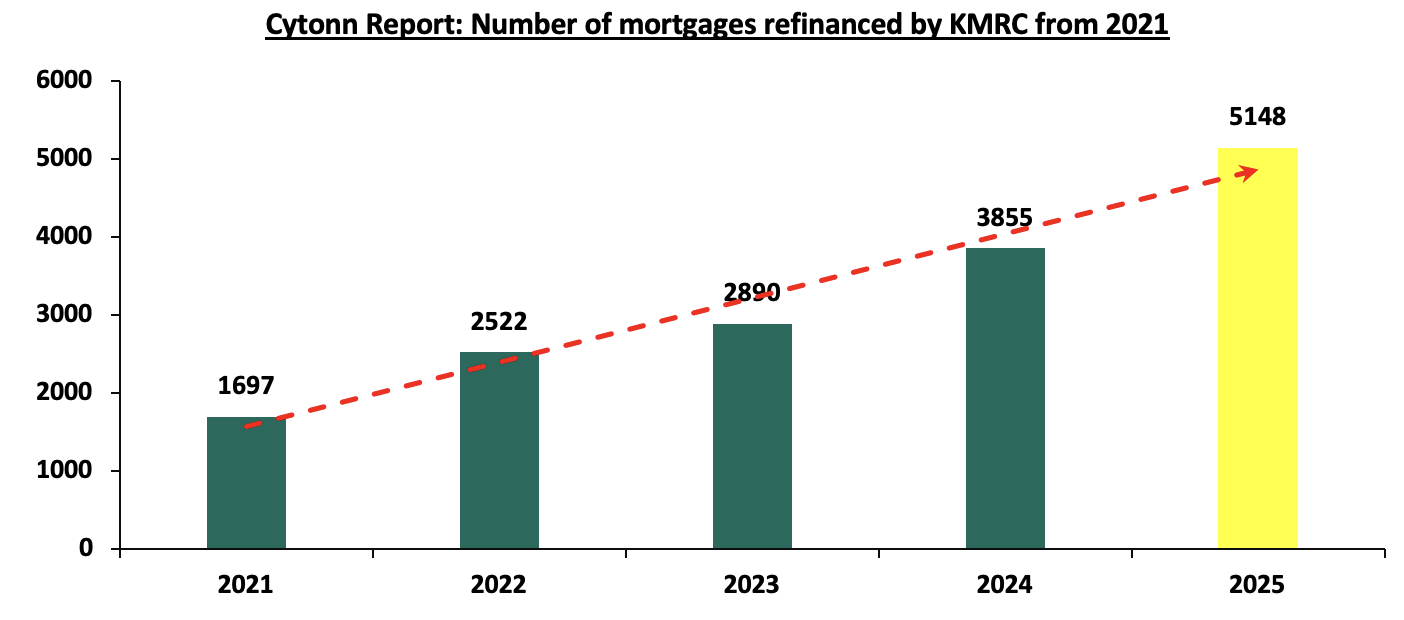
Source: Kenya Mortgage Refinance Company (KMRC)
In Financial Year 2025, KMRC reported a 24.2% decrease in Profit After Tax (PAT) to Kshs 1.0 bn from Kshs 1.3 mn recorded in FY’2024 majorly attributable to 19.6% decrease in interest income to Kshs 1.7 bn in FY’2025 from 2.2 bn in FY’2024. Additionally, total assets increased by 33.6% to Kshs 43.2 bn from 32.3 bn posted in FY’2024, owing to the 64.7% and 18.9% increase in Loan and advances and Cash and Cash equivalents respectively. The table below shows a summary of KMRC’s income statement for FY’2024 and FY’2025;
|
Cytonn Report: Summary of KMRC Statement of Comprehensive Income |
|||
|
|
FY'2024 (Kshs) |
FY'2025 (Kshs) |
y/y Change |
|
REVENUE |
|
|
|
|
Interest Income |
3,214,901,565 |
3,191,173,592.00 |
(0.7%) |
|
Interest expense |
(1,055,683,491) |
(1,455,384,888.0) |
37.9% |
|
Net interest income |
2,159,218,074 |
1,735,788,704.00 |
(19.6%) |
|
EXPENSES |
|||
|
Net movement in expected credit losses |
1,052,749 |
(841,296.0) |
(179.9%) |
|
Operating and administration expenses |
(317,531,217) |
(348,101,463.0) |
9.6% |
|
Depreciation and amortization expenses |
(24,761,884) |
(21,994,260.0) |
(11.2%) |
|
Total Expenses |
(341,240,352) |
(370,937,019.0) |
8.7% |
|
Net profit before income tax |
1,817,977,722 |
1,364,851,685.00 |
(24.9%) |
|
Income tax expense |
(495,915,723) |
(362,409,323.0) |
(26.9%) |
|
PROFIT AFTER TAX |
1,322,061,999 |
1,002,442,362 |
(24.2%) |
Source: KMRC
The table below shows a summary of KMRC’s balance sheet for FY’2024 and FY’2025;
|
Cytonn Report: Summary of KMRC Statement of Financial Position |
|||
|
|
FY'2024 (Kshs) |
FY'2025 (Kshs) |
y/y Change |
|
Assets |
|
|
|
|
Loan and Advances |
11,888,572,822 |
19,579,239,923 |
64.7% |
|
Cash and Cash equivalents |
14,860,464,671 |
17,674,798,450 |
18.9% |
|
Other Assets |
5,572,595,256 |
5,932,224,221 |
6.5% |
|
Total Assets |
32,321,632,749 |
43,186,262,594 |
33.6% |
|
Liabilities |
|||
|
Borrowings |
25,731,201,060 |
35,865,403,521 |
39.4% |
|
Debt securities in issue |
1,144,171,817 |
975,494,167 |
(14.7%) |
|
Lease Liabilities |
14,662,432 |
59,604,903 |
306.5% |
|
Other Liabilities |
593,423,325 |
445,401,871 |
(24.9%) |
|
Total Liabilities |
27,483,458,634 |
37,345,904,462 |
35.9% |
|
Capital Resources |
|||
|
Share Capital |
1,808,375,125 |
1,808,375,125 |
0.0% |
|
Revenue reserves |
2,911,800,468 |
3,836,944,905 |
31.8% |
|
Other Revenues |
289,880 |
31,535 |
(89.1%) |
|
Statutory Reserve |
117,708,642 |
195,006,567 |
65.7% |
|
Total Capital |
4,838,174,115 |
5,840,358,132 |
20.7% |
|
Total Liabilities and Equity |
32,321,632,749 |
43,186,262,594 |
33.6% |
Source: KMRC
Other notable key Milestones by KMRC include;
- Expansion in mortgage refinancing activity; By 2025, KMRC had cumulatively refinanced 5,148 mortgages, reflecting continued growth in its core mandate of providing long-term liquidity to primary mortgage lenders and improving access to affordable housing finance.
- Growth in cumulative disbursements; KMRC’s total disbursements to participating financial institutions increased significantly, reaching Kshs 25.4 bn by the end of 2025, supporting the expansion of long-term, fixed-rate mortgage products in the market.
- Increased reach and impact in affordable housing; By 2025, KMRC’s interventions supported over 4,600 affordable home loans valued at approximately Kshs 21.7 bn across 39 counties, demonstrating substantial growth in uptake of its refinancing facilities and deeper penetration of affordable housing finance.
- Standardization of loan limits to enhance accessibility; KMRC revised and standardized its maximum loan size to Kshs 10.5 mn nationwide, up from the previous differentiated limits in different regions. This adjustment expanded eligibility for refinancing and better aligned KMRC‑backed mortgage ceilings with prevailing market mortgage sizes, helping bridge gaps created by inflationary pressures and rising construction costs.
- Recent developments
- Kenya Mortgage Guarantee Trust (KMGT) – The Kenya Mortgage Refinance Company operationalized the Kenya Mortgage Guarantee Trust (KMGT) to de-risk lending to underserved segments, particularly informal and low- to middle-income earners. The facility provides partial guarantees of up to 40.0% of the loan value, significantly higher than comparable markets, to encourage lenders to extend mortgages to higher-risk borrowers. Additionally, the Government of Kenya committed approximately Kshs 603.0 mn in 2025 to capitalize the facility, reinforcing its role in unlocking housing finance. The KMGT targets borrowers earning below Kshs 200,000 per month, with loan caps around Kshs 6.0 mn, and incorporates risk-sharing mechanisms and data-driven credit assessment tools to enhance underwriting.
- Increase in Maximum Loan Size – KMRC revised the maximum loan size to Kshs 10.5 mn from Kshs 8.0 mn (Nairobi Metropolitan Area) and Kshs 6.0 mn (rest of the country), in response to rising construction costs, inflationary pressures and declining purchasing power. This adjustment aims to align KMRC-backed mortgages with prevailing property prices and maintain affordability for borrowers despite macroeconomic pressures.
- Significant Growth in Refinancing Activity – As of 2025, KMRC had refinanced over 4,600 mortgages valued at approximately Kshs 21.7 bn across 39 counties, reflecting substantial growth from earlier years and demonstrating increased uptake of its refinancing facilities by Primary Mortgage Lenders.
- Blended Financing and Capital Markets Expansion – KMRC has continued to deepen its funding base through blended finance, combining concessional funding with domestic bond market issuances, including its Medium-Term Note program. This approach has enabled the institution to sustain single-digit, fixed-rate funding to lenders, improving affordability and supporting long-term mortgage financing.
- Policy Alignment with Affordable Housing Agenda – KMRC has been positioned as a key pillar in the government’s Bottom-Up Economic Transformation Agenda (BETA), with increased collaboration between national and county governments, developers, and financiers to scale affordable housing delivery. The institution has also attracted global investor and stakeholder interest, reflecting its growing role in Kenya’s housing finance ecosystem.
- Kenya Mortgage Refinance Company (KMRC) Achievements
The following are key achievements by KMRC
- Increased liquidity to primary mortgage lenders (PMLs): The Kenya Mortgage Refinance Company has continued to scale up its disbursements to PMLs, with cumulative loans disbursed rising to approximately Kshs 21.7 bn by 2025, up from Kshs 8.4 bn in 2023 and Kshs 6.7 bn in 2022, reflecting sustained growth since operationalization. This has significantly enhanced liquidity to PMLs, enabling them to meet increasing mortgage demand and extend long-term financing to borrowers.
- Increased mortgage uptake in the country: Through its refinancing model, KMRC has supported the growth of mortgage uptake, with cumulative mortgages refinanced increasing from 2,522 in 2022 to 2,890 in 2023 and further to 3,855 in 2024 and surpassing 4,600 mortgages by 2025. Additionally, KMRC’s provision of single-digit funding rates to lenders significantly lower than prevailing market rates has improved affordability and accessibility of mortgage loans.
- Improved standards of living: KMRC’s activities have contributed to job creation and improved living standards through increased homeownership and housing development. As of 2025, the institution has supported the creation of over 8,000 direct and indirect jobs, driven by growth in housing construction and related value chains.
- Successful issuance of bonds and capital markets development: KMRC successfully implemented its Kshs 10.5 billion Medium-Term Note (MTN) program, with its inaugural bond issuance significantly oversubscribed, reflecting strong investor confidence. Subsequent issuances and active participation in the domestic capital markets have enhanced long-term funding availability and contributed to the deepening of Kenya’s capital markets. Looking ahead, KMRC is also planning to issue a green bond, which will support sustainable financing initiatives and attract environmentally focused investors.
- Strengthened mortgage market infrastructure: KMRC has played a key role in strengthening Kenya’s mortgage ecosystem by promoting standardized underwriting practices, improved risk management frameworks and capacity building among lenders. These initiatives have enhanced efficiency, transparency and stability within the mortgage market, making housing finance more accessible.
- Promoted financial sector inclusion: KMRC has expanded access to housing finance by integrating SACCOs and microfinance institutions into the mortgage ecosystem. More recently, through initiatives such as the Kenya Mortgage Guarantee Trust (KMGT), KMRC has enhanced lending to informal and low-income earners by providing credit guarantees, thereby addressing affordability constraints and promoting inclusive homeownership.
- KMRC Challenges
Despite the accomplishments mentioned earlier, KMRC has encountered various challenges, including:
- Low qualifying mortgage amounts limiting market reach: KMRC historically maintained relatively low maximum loan sizes compared with the average mortgage size in the market, which constrained the number of loans eligible for refinancing. In February 2024, KMRC increased its maximum mortgage refinance threshold nationwide to Kshs 10.5 mn, up from prior limits of Kshs 8.0 mn in the Nairobi Metropolitan Area and Kshs 6.0 mn elsewhere. Although this adjustment expanded eligibility, the qualifying limits still lag behind typical market mortgage sizes, meaning many potential borrowers remain excluded from KMRC refinancing, resulting in lower absorption of its product across segments.
- Cost of capital and funding sustainability concerns: KMRC’s funding model remains a structural challenge. The institution relies heavily on capital market funding, primarily through bond issuance, to generate long‑term liquidity for on‑lending. However, elevated interest rates and heightened government borrowing have pushed up benchmark yields, making it difficult for KMRC to issue new bonds at low cost. In its latest annual disclosures, management noted that rising funding costs and reluctance in the capital markets are constraining its ability to raise additional long‑term funds, which undermines the sustainability of offering mortgages at the targeted concessional rates.
- Credit risk and non‑performing loans in the broader real estate sector: Rising non‑performing loans (NPLs) in the real estate sector present an indirect risk to KMRC’s refinancing operations. According to industry data, NPLs in the real estate segment increased within the broader banking sector in recent years, signaling heightened credit risk for lenders active in housing finance. Although KMRC does not directly hold mortgage loans on its books, its refinancing programs are secured by mortgage portfolios pledged by primary mortgage lenders, meaning elevated default rates can reduce the attractiveness of these portfolios and make investors more cautious about financing KMRC’s operations.
- High property prices limiting affordability and mortgage uptake: Escalating residential property prices in urban and peri‑urban areas remain a major barrier to expanding homeownership. Rising costs of construction inputs, expensive land acquisition and registration processes have pushed average property prices above typical affordability thresholds for many low‑ and middle‑income households. This trend reduces the pool of borrowers who can qualify for mortgage financing and increases risk aversion among lenders, thereby limiting the overall uptake of KMRC‑supported mortgages.
Section IV: Case Studies and Lessons Learnt
In our previous topicals, Update on Kenya Mortgage Refinance Company (KMRC) 2024, Update on Kenya Mortgage Refinance Company (KMRC) 2023, Kenya Mortgage Refinance Company Progress 2022, Kenya Mortgage Refinance Company Update 2021, Kenya Mortgage Refinance Company Recap 2020, we provided case studies of France’s Caisse de Refinancement de I’Habitat (CRH), Nigeria Mortgage Refinance Company, Tanzania Mortgage Refinance Company, Jordan Mortgage Refinance Company, the Saudi Real Estate Refinancing company, respectively. In this topical, we now look at the lessons and key take-outs that we can derive from the aforementioned mortgage refinancing companies alongside Egyptian Mortgage Refinance Company.
|
Cytonn Report: Summary of Mortgage Refinance Companies in Various Countries |
|
|
Institution |
Key Takeouts/Achievements |
|
Jordan Mortgage Refinancing Company |
· Jordan Mortgage Refinance Company (JMRC) is a public shareholding company established in 1996 and headquartered in Amman, Jordan, whose main purpose is to provide medium‑ and long‑term financing for the Jordanian housing and real estate sector by extending refinance loans to banks, financial institutions, and leasing companies in the country. JMRC funds its activities through the issuing of corporate bonds in the local capital market, contributing both to housing liquidity and the availability of long‑term instruments in the Jordanian financial market. · In 2025, JMRC continued to expand its refinance lending operations, signing 13 refinance loan agreements with six financial institutions amounting to approximately JOD 75.5 mn, bringing the total number of refinance agreements since inception to 394 agreements and total refinance loans granted to JOD 2.591 bn. As of 31 December 2025, the outstanding refinance loan balance stood at JOD 329.5 mn, with tenors ranging from 1 to 7 years, thereby increasing access to medium‑ and long‑term finance for participating lenders. · JMRC also continued to issue corporate bonds throughout 2025, with at least five bond issues totaling approx. JOD 48 mn issued between January and September 2025 (Issues Nos. 344–348), increasing JMRC’s total bonds outstanding to approximately JOD 2.637 bn. These bonds are typically collateralized by JMRC’s mortgage finance portfolio and support ongoing refinancing operations. · The company has further strengthened its capital base, completing a share capital increase in mid‑2025, raising its registered capital from 12.5 mn shares to 22.5 mn shares, reflecting shareholder confidence and enhancing its capacity to support expanding refinance demand in Jordan’s housing finance market. · Through these refinancing activities, JMRC has continued to improve access to capital for primary mortgage lenders, enabling banks and leasing companies to offer housing and real estate loans at competitive rates, helping support lending to low‑ and middle‑income borrowers and deepen the mortgage market in Jordan. |
|
Saudi Real Estate Refinance Company |
· Saudi Real Estate Refinance Company (SRC) was formed in 2017 with the primary goal of developing the housing finance market in Saudi Arabia. The institution was established to enable originators mainly financial institutions to offer long‑term and short‑term financing solutions to home buyers through intermediaries by providing refinance liquidity and facilitating portfolio purchases, thereby supporting expanded access to home finance. SRC is fully licensed by the Saudi Central Bank (SAMA) and operates as a key pillar of Saudi Vision 2030’s housing and financial sector development strategy. · The company has significantly progressed its capital market activities. In February 2025, SRC completed pricing its first USD2 bn international Sukuk offering, which was oversubscribed six times and listed on the London Stock Exchange’s International Securities Market, strengthening liquidity for mortgage refinancing and reinforcing its role in the global housing finance market. · In October 2025, SRC priced its second international Sukuk issuance totaling approximately USD2.5 bn, further broadening its investor base and increasing global capital inflows into Saudi Arabia’s mortgage refinance sector, reflecting robust demand for its debt instruments and sustained confidence from institutional investors. · Domestically, the Saudi Central Bank granted SRC a no‑objection clearance to launch Residential Mortgage‑Backed Securities (RMBS) in Saudi Arabia in 2025, positioning SRC to mobilize real estate finance portfolios into tradable securities that deepen the local debt market and diversify funding sources for lenders through securitization. · In 2025, SRC launched the Kingdom’s first RMBS transaction under its local securitization program, marking an important innovation in Saudi Arabia’s secondary real‑estate finance market. This initiative supports enhanced liquidity and capital market infrastructure for home finance, opening new investment opportunities and aiding long‑term financial sector stability. · SRC also expanded partnership activities with banks and financial institutions throughout 2025, including SAR 10.0 bn real estate refinance portfolio agreements with Alrajhi Bank, enabling continued mortgage originations and capital recycling under an “Originate to Distribute” model that strengthens ongoing lending capacity. · SRC’s credit quality and market credibility have been demonstrated by international affirmations such as Fitch Ratings’ affirmation of its “A+” issuer rating with a stable outlook in late 2025, supported by strong government guarantees and alignment with national housing objectives. · Through these developments, SRC continues to support increased access to financing and homeownership in Saudi Arabia, contributing to financial market depth, broader investor participation, and the continued expansion of housing finance options for individuals and developers. |
|
Tanzania Mortgage Refinance Company |
· Tanzania Mortgage Refinance Company (TMRC) is a non‑deposit taking financial institution licensed by the Bank of Tanzania (BoT) whose core activity is to refinance mortgage portfolios of primary mortgage lenders (PMLs) by providing long‑term liquidity and helping deepen Tanzania’s mortgage market. Since inception, TMRC has played a key role in extending mortgage tenors available in the country, which today can reach up to 25 years, thereby enabling banks and financial institutions to offer longer‑term housing finance. · As of 30 June 2025, the Tanzanian residential mortgage market registered growth in mortgage debt outstanding, with the total value of residential mortgages rising to approximately TZS 694.35 bn (USD 264.0 mn) up from previous years while the number of institutions offering residential mortgages increased to 29 lenders by mid‑2025, reflecting gradual expansion in mortgage supply. · TMRC has continued to attract institutional support and expand its footprint. In February 2025, KCB Bank (Tanzania) invested TZS 500.0 mn to become a shareholder of TMRC, deepening both capital base and market participation. · A major strategic development has been TMRC’s partnership with Habitat for Humanity International, which has enabled TMRC to develop and launch housing microfinance refinancing products targeted at low‑income households and informal sector workers. In late 2025 the Bank of Tanzania approved TMRC’s refinancing product for housing microfinance portfolios, which is now being rolled out, and in March 2026 TMRC officially launched Retail and Wholesale Housing Microfinance products that allow financial institutions to offer incremental housing finance to underserved segments of the population. · TMRC’s role continues to be focused on providing long‑term wholesale refinancing, catalyzing the growth of housing finance in Tanzania, and innovating new financing solutions in partnership with development partners, with the broader objective of increasing home ownership and addressing housing access barriers across income segments. |
|
France's Caisse de Refinancement de l’Habitat (CRH) |
· France’s Housing Refinance Fund (Caisse de Refinancement de l’Habitat, CRH) is a specialised French credit institution founded in 1985 with the sole purpose of refinancing housing loans granted by its shareholder credit institutions through the issuance of covered bonds under French law and acquiring promissory notes issued by these institutions under the same conditions of rate and maturity as the bonds issued. CRH operates as a non‑profit, pass‑through entity, meaning it charges the same interest rates to primary mortgage lenders as it pays on its own borrowings, ensuring no extra refinancing margin is added to its shareholders. · The institution continues to play a central role in France’s mortgage finance market, issuing high‑quality covered bonds that are typically rated Aaa/AAA by major credit rating agencies and are eligible for European Central Bank operations, underscoring strong investor confidence and robust market standing. As of end‑2024, CRH had outstanding bonds of over EUR 18.4 billion backed by a cover pool exceeding EUR 25.7 bn composed entirely of high‑quality French residential mortgage assets, with over‑collateralisation materially above regulatory requirements. · Since inception, CRH has refinanced a substantial portion of the French housing loan market, with total refinanced volumes exceeding EUR 109.0 bn by the end of 2024. This long‑term refinancing support has helped banks maintain relatively low mortgage interest rates in France, keeping funding costs aligned with broader European covered bond benchmarks. · CRH’s operational model emphasises risk minimisation, primarily by tightly matching the interest rate, currency, and maturity of its bond issuances with the refinancing loans granted to its shareholder banks, thereby aligning assets and liabilities and reducing interest rate risk without extensive use of derivatives. Its framework also includes strong legal and regulatory protections: refinanced loans remain on the banks’ balance sheets but are pledged as collateral with statutory privileges that permit CRH to automatically take ownership in the event of a counterparty default, and minimum over‑collateralisation levels provide additional investor security. · The company’s unique structure and special legal framework have ensured superb credit quality for its covered bond issuances reflected in ratings and market demand and a smooth operational trajectory with no losses or write‑downs since inception, helping sustain long‑term confidence in France’s covered bond and mortgage finance markets. |
|
Nigeria Mortgage Refinance Company |
· Nigeria Mortgage Refinance Company (NMRC) was incorporated in June 2013 as a public limited liability company registered with the Securities & Exchange Commission (SEC). It is regulated by the Central Bank of Nigeria (CBN) as a non‑deposit taking financial institution with the core activity of refinancing mortgage loans by raising funds from capital markets and providing long‑term finance to eligible mortgage lenders. NMRC’s mandate is to deepen the primary and secondary mortgage markets in Nigeria and improve access to affordable homeownership. · NMRC specialises in the aggregation and issuance of mortgage‑linked bonds under its secured debt programme, enabling it to channel long‑term capital into Nigeria’s housing finance sector. Since inception, NMRC has accessed the Nigerian capital market on multiple occasions, including issuing bonds such as its N8.0 bn Series I, N11.0 bn Series II, and N10 bn Series III bonds, which have been deployed to refinance conforming mortgage portfolios of member banks and financial institutions. · In September 2024, NMRC secured a USD 228.0 mn blended financing arrangement, anchored by a USD 200.0 mn loan from the U.S. International Development Finance Corporation (DFC) and local currency financing, through a partnership with Standard Bank Group and MiDA Advisors. The arrangement is intended to support affordable mortgage financing by refinancing and pre‑financing eligible mortgage loans originated by primary mortgage lenders across Nigeria. · The company has continued to maintain strong financial positioning, with ratings affirmations reflecting creditworthiness: in 2025, Agusto & Co. affirmed NMRC’s long‑term rating at “Aa” with a stable outlook, supported by government guarantees, good capitalisation and liquidity, while GCR Ratings affirmed national scale ratings of AA+(NG)/A1+(NG) on its local currency instruments, reinforcing investor confidence. · NMRC plays a critical role in promoting standardisation of mortgage origination and underwriting practices in Nigeria, helping improve asset quality and investor confidence, and enabling participating lenders to offer longer‑term mortgage loans at more competitive rates and extended tenors. · Although the Nigeria mortgage market still faces challenges including a significant housing deficit and concentrated loan book NMRC’s interventions, partnerships and capital market engagement continue to strengthen liquidity, support extended mortgage tenors and contribute to broader market development. |
|
Egyptian Mortgage Refinance Company |
· The Egyptian Mortgage Refinance Company (EMRC) was incorporated under Law 148 of 2001 and established in June 2006 to act as a market maker and lay the foundation for an active secondary mortgage market in Egypt. Its primary mandate is to operate as a second‑tier, wholesale, market‑based liquidity facility focused on refinancing mortgage loans originated by Primary Mortgage Lenders (PMLs). The Company began actual operations in August 2008 and is structured as a wholesale institution that cannot take deposits or lend directly to households, instead providing refinance loans to PMLs collateralized by mortgage portfolios. · EMRC continues to secure funds through long‑term loans from institutional investors and equity contributions from its founding shareholders, with a shareholder base that includes multiple banks, mortgage finance companies, the Central Bank of Egypt, and the Social Housing Fund & Mortgage Finance Subsidy. It also maintains plans to access the bond and securitization markets by establishing itself as a consistent and highly rated issuer. · In August 2023, EMRC achieved a major milestone by issuing its first securitized bond under an approved EGP 3.0 bn securitization programme a EGP 472.0 mn issuance structured in three tranches with ratings from AA+ to A, marking its first securitization of mortgage portfolios in the Egyptian market and reinforcing its role in enhancing market liquidity and supporting PMLs’ balance sheets. · In July 2025, EMRC launched a new portfolio purchase product designed to broaden refinancing options by allowing retail and institutional investors to participate in mortgage portfolio acquisitions, thereby diversifying funding sources and deepening secondary market activity. · EMRC is legally empowered to refinance credit institutions with priority access to their mortgage portfolios, issue tax‑exempt bonds enjoying full creditor rights (including foreclosure), and operates under effective financial oversight by the Financial Regulatory Authority (FRA). Its legal authority and open club structure whereby only shareholder PMLs can access refinancing at preferential rates — support its mission to strengthen Egypt’s mortgage finance ecosystem. |
Based on the aforementioned case studies, the following measures can be considered in order to improve the Real Estate sector through KMRC;
- Offer innovative products targeting residential developers – To accelerate funding and strengthen its market impact, KMRC can explore offering innovative products tailored specifically for residential developers. Such products could include flexible financing options, incentives for green and sustainable building practices, or customized loan structures to accommodate varying project needs. This approach would not only enhance KMRC's financial sustainability but also foster growth in the residential sector, ultimately supporting the goal of affordable housing provision in Kenya, similar to how Saudi Real Estate Refinance Company (SRC) facilitated financing to boost the number of housing units and expand market participation.
- Develop mortgage products targeting low and middle-income groups – KMRC can design long-term mortgage products of up to 30 years for low and middle-income earners, following EMRC’s example, which offers mortgages with tenors of up to 30 years and collateral coverage of 100% of the refinance value. Implementing this strategy can drive higher homeownership rates among these income groups, contributing to socio-economic development and inclusive growth, much like EMRC’s focus on affordability and long-tenor loans for underserved segments.
- Introduce specialized mortgages for PMLs under the Affordable Housing Program (AHP) – KMRC can create mortgage products targeted at Primary Mortgage Lenders (PMLs) for housing units under the AHP. This mirrors EMRC’s 2014 "NUCA" initiative, which advanced mortgages for units under the Egyptian Ministry of Housing, Utilities, and Urban Communities. By disbursing loans specifically for social and affordable housing schemes, KMRC can support structured growth in the AHP and enhance participation of PMLs in the affordable housing sector.
- Diversify into non-residential mortgages – To enhance sustainability and broaden its market impact, KMRC can introduce mortgages tailored for non-residential developments, including commercial and industrial projects. These mortgages could offer flexibility and incorporate provisions for sustainability, such as efficient water and heat management, natural lighting, and environmentally friendly designs. This approach draws inspiration from international examples where refinancing institutions have diversified beyond purely residential portfolios to reduce risk and increase capital deployment efficiency.
- Introduce "Elite" mortgages to address high-end segments – To respond to rising property prices, particularly in the Nairobi Metropolitan Area (NMA), KMRC can introduce "Elite" mortgage products aimed at refinancing high-end mortgage portfolios, similar to EMRC’s Elite mortgages launched in 2013. This product would enhance KMRC’s inclusivity by accommodating a diverse range of mortgage portfolios and enable participation across different income brackets, ensuring that the company supports both affordable and premium housing markets.
Section V: Conclusion
The Kenya Mortgage Refinance Company (KMRC) has made measurable progress in advancing homeownership in Kenya. As of December 2024, KMRC’s refinancing efforts have directly benefited 3,855 borrowers with home loans across 36 counties by disbursing a total of KES 13.9 bn through Primary Mortgage Lenders (PMLs). This reflects a 23.0% growth in refinanced mortgages compared to the previous year, demonstrating KMRC’s expanding footprint in the mortgage market. Despite this growth, the number of mortgages refinanced through KMRC remains modest relative to the broader mortgage market. According to the Central Bank of Kenya’s 2024 Residential Mortgage Market Survey, there were 30,016 active mortgage accounts in Kenya at the end of 2024. This means that KMRC‑refinanced mortgages accounted for around 12.8 % of total mortgage accounts as of December 2024 highlighting that a significant portion of the mortgage market remains untapped by KMRC’s interventions. There is therefore substantial opportunity for KMRC to deepen its reach and scale within the broader housing finance ecosystem. Moreover, KMRC has demonstrated its capacity to manage resources effectively, supported by strong financial performance including a 25.0% growth in total assets to KES 32.3 bn and a 69.0% increase in profit before tax to KES 1.82 bn in 2024 instilling confidence in its ability to handle larger funding from both domestic and international stakeholders.
Looking forward, KMRC is well positioned to continue increasing mortgage refinancing volumes by partnering with new PMLs, introducing innovative products tailored to diverse market segments and operationalizing initiatives such as the Risk Sharing Facility (RSF) to address credit risk and stimulate greater lender participation. These initiatives are expected to significantly contribute to expanding mortgage access, supporting affordable homeownership, and further developing Kenya’s mortgage finance sector
Disclaimer: The views expressed in this publication are those of the writers where particulars are not warranted. This publication, which is in compliance with Section 2 of the Capital Markets Authority Act Cap 485A, is meant for general information only and is not a warranty, representation, advice or solicitation of any nature. Readers are advised in all circumstances to seek the advice of a registered investment advisor

- Talk to us
- Kenya
- P.O Box 20695 - 00200, Nairobi, Kenya
- Cell +254709101200
- Tel +254709101200
- WhatsApp +254741676635
- United States
- +254709101200
- DOWNLOAD OUR APP
-


- Kenya
- 8th Floor, Pinetree Plaza, Kaburu Drive, Ngong Road, Nairobi, Kenya
- USA
- Suite 1150, 1775 Eye Street NW, USA, Washington DC 20006, USA
- Investments
- High Yield
- Private Equity
- Real Estate
- Real Estate
- RiverRun Estates
- Cytonn Towers
- The Ridge
- Taraji Heights
- The Alma