Cytonn Weekly #38/2018
By Cytonn Research Team, Oct 7, 2018
Executive Summary
Fixed Income
T-bills were over-subscribed during the week, with the overall subscription rate coming in at 120.9%, a rise from 85.9% recorded the previous week. The yields on the 91-day and 182-day papers remained unchanged at 7.6% and 8.6%, respectively, while the yield on the 364-day paper declined by 10 bps to 9.6%, from 9.7% the previous week. According to the Stanbic Bank’s Monthly Purchasing Manager’s Index (PMI), the business environment in the country continued to improve in September 2018 for the 10th month in a row since December 2018, however the rate of growth was the slowest in the aforementioned period. The seasonally adjusted PMI came in at 52.7 in September, a decline from 54.6 recorded in August;
Equities
During the week, the equities market recorded mixed performance with NSE 25 and NSE 20 declining by 0.2% and 0.4%, respectively, while NASI gained by 0.8%, taking their YTD performance to (13.8%), (22.8%) and (11.9%), for NASI, NSE 20 and NSE 25, respectively. For the last twelve months (LTM), NASI, NSE 20 and NSE 25 have declined by 6.3%, 22.6% and 9.8%, respectively. I&M Bank secured a USD 40.0 mn (Kshs 4.0 bn) loan from FMO, a Dutch Development Bank, for onward lending to Small and Medium Enterprises (SMEs);
Private Equity
The African Private Equity and Venture Capital Association (AVCA) and PwC released a report on private equity-backed IPOs in the African Region, analyzing the growing trend by private equity firms to exit by means of an IPO;
Real Estate
During the week, retailers continued with their expansion activities in Kenya with; i) Botswana based Choppies announcing that it will be taking up space previously occupied by Uchumi Supermarket in Ongata Rongai Town, and ii) Naivas Supermarket opened a new outlet in Freedom Height Mall, Lang’ata, occupying 18,000 SQFT. In the hospitality sector, global hotel chain, Marriott International announced plans to increase its footprint in Africa hotels to over 200 hotels and 38,000 rooms by 2023, with a focus on Kenya, Ghana, Morocco, South Africa and Mozambique. In the infrastructure sector, Safaricom Pension Scheme received approval from Kenya Urban Roads Authority (KURA) to construct a road that will link its Athi River development, Crystal Rivers, to the Nairobi-Mombasa Highway, with the aim of enhancing access to the gated community.
- On 5th October 2018, Mr. Juhani Elomaa, CEO of Taaleri Group, and the Taaleri Africa Team, visited us at our Nairobi offices and reviewed the progress of our real estate developments, namely The Alma and The Ridge. During the visit of Mr. Elomaa, we reviewed the partnership so far, in developments such as The Alma, The Ridge, Situ Village, and Amara Ridge, which has already been delivered to homeowners, while also exploring further areas of collaboration. As we enter our fifth year of partnership with Taaleri, we remain focused on delivering aspirational real estate, creating jobs, growing the economy, and uplifting the standards of living, even as we pursue above-average returns for our clients.
- On 3rd October 2018, Cytonn CEO Edwin H. Dande was a keynote speaker at The Kenya Alternative Investment Intensive (KeAll) forum themed “Catalysts for Impact and Financial Returns” which was organized by African Intensive, a multi-media platform that provides insights into investment themes in Africa, and held at the Villa Rosa Kempinski. See Event Note
- We continue to hold weekly workshops and site visits on how to build wealth through real estate investments. The weekly workshops and site visits target both investors looking to invest in real estate directly and those interested in high yield investment products to familiarize themselves with how we support our high yields. Watch progress videos and pictures of The Alma, Amara Ridge, The Ridge, and Taraji Heights. Key to note is that our cost of capital is priced off the loan markets, where all-in pricing ranges from 16.0% to 20.0%, and our yield on real estate developments ranges from 23.0% to 25.0%, hence our top-line gross spread is about 6.0%. If interested in attending the site visits, kindly register here
- We continue to see very strong interest in our weekly Private Wealth Management Training (largely covering financial planning and structured products). The training is at no cost and is open only to pre-screened participants. We also continue to see institutions and investment groups interested in the training for their teams. The Wealth Management Training is run by the Cytonn Foundation under its financial literacy pillar. If interested in our Private Wealth Management Training for your employees or investment group, please get in touch with us through wmt@cytonn.com. To view the Wealth Management Training topics, click here
- For recent news about the company, see our news section here
- We have 10 investment-ready projects, offering attractive development and buyer targeted returns of around 23.0% to 25.0% p.a. See further details here: Summary of Investment-Ready Projects
- We continue to beef up the team with ongoing hires for Independent Financial Advisors (IFA) Manager. Visit the Careers section on our website to apply
T-Bills & T-Bonds Primary Auction:
T-bills were over-subscribed during the week, with the overall subscription rate coming in at 120.9%, a rise from 85.9% recorded the previous week. The yields on the 91-day and 182-day papers remained unchanged at 7.6% and 8.6%, respectively, while the yield on the 364-day paper declined by 10 bps to 9.6%, from 9.7% the previous week. The acceptance rate for T-bills dropped to 80.8%, from 94.8% the previous week, with the government accepting Kshs 23.4 bn of the Kshs 29.0 bn worth of bids received. The subscription rate for the 91-day paper declined to 98.5%, from 127.4% the previous week, while the subscription rate for the 182-day and 364-day papers gained to 65.4% and 185.3%, from 50.9% and 104.3% recorded the previous week, respectively, with investors’ participation being skewed towards the longer dated paper.
Liquidity:
The average interbank rate increased to 5.2%, from 4.4% the previous week, pointing to reduced liquidity in the market, while the average volumes traded in the interbank market increased by 26.1% to Kshs 14.3 bn, from Kshs 11.3 bn the previous week. The increased activity was attributed to increased demand of funds in the interbank markets at the beginning of the week amidst tight liquidity, due to tax remittances. Liquidity however improved towards the end of the week, with the interbank rate declining to 4.2% from 5.7% as at the beginning of the week, which the CBK attributed to increased government payments.
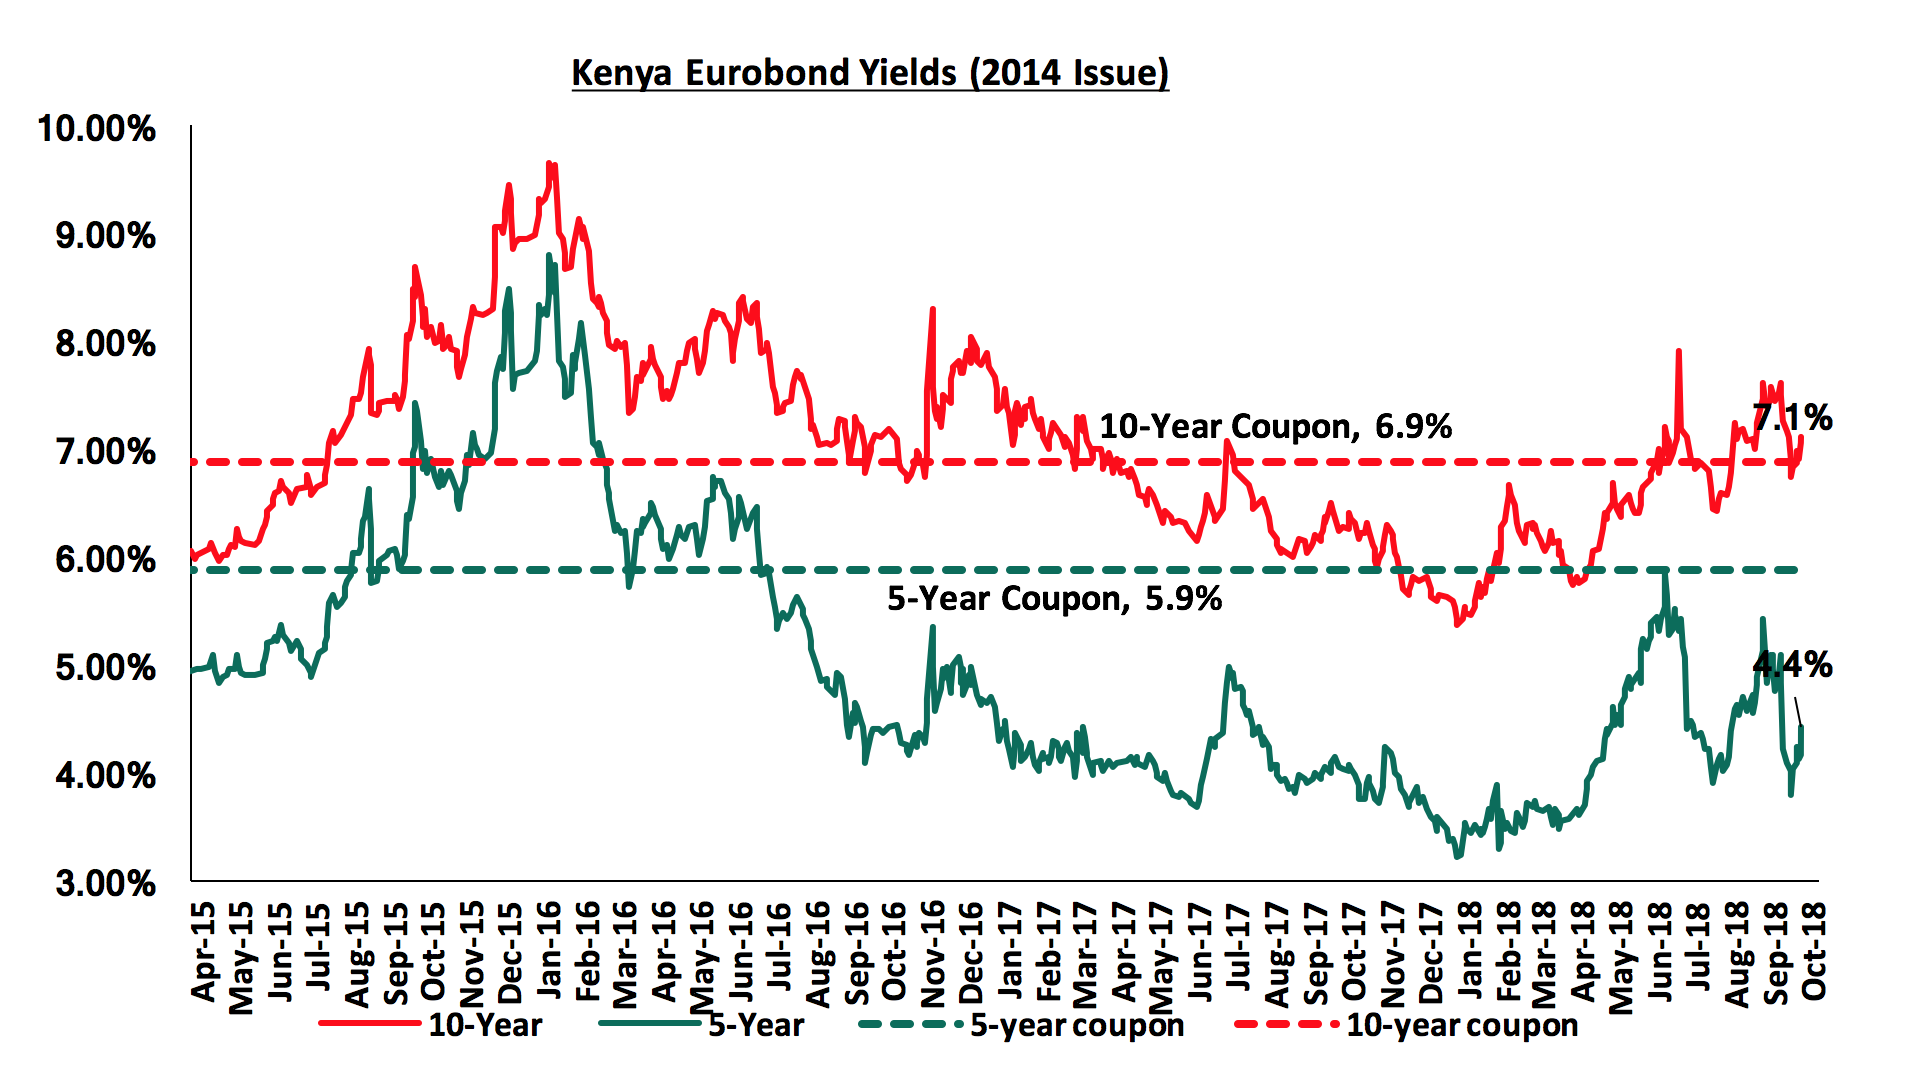
Kenya Eurobonds:
According to Bloomberg, the yield on the 10-year and 5-year Eurobonds issued in 2014 gained by 0.3% points and 0.4% points to 7.1% and 4.4% from 6.8% and 4.0%, the previous week, respectively. Since the mid-January 2016 peak, yields on the Kenyan Eurobonds have declined by 4.4% points and 2.5% points for the 5-year and 10-year Eurobonds, respectively, an indication of the relatively stable macroeconomic conditions in the country. Key to note is that these bonds have 0.7-years and 5.7-years to maturity for the 5-year and 10-year, respectively.
For the February 2018 Eurobond issue, during the week, the yields on both the 10-year and 30-year Eurobonds gained by 0.4% and 0.3% points to 7.9% and 8.9% from 7.6% and 8.6%, the previous week, respectively. Since the issue date, the yields on the 10-year and 30-year Eurobonds have both increased by 0.7% and 0.6% points, respectively.
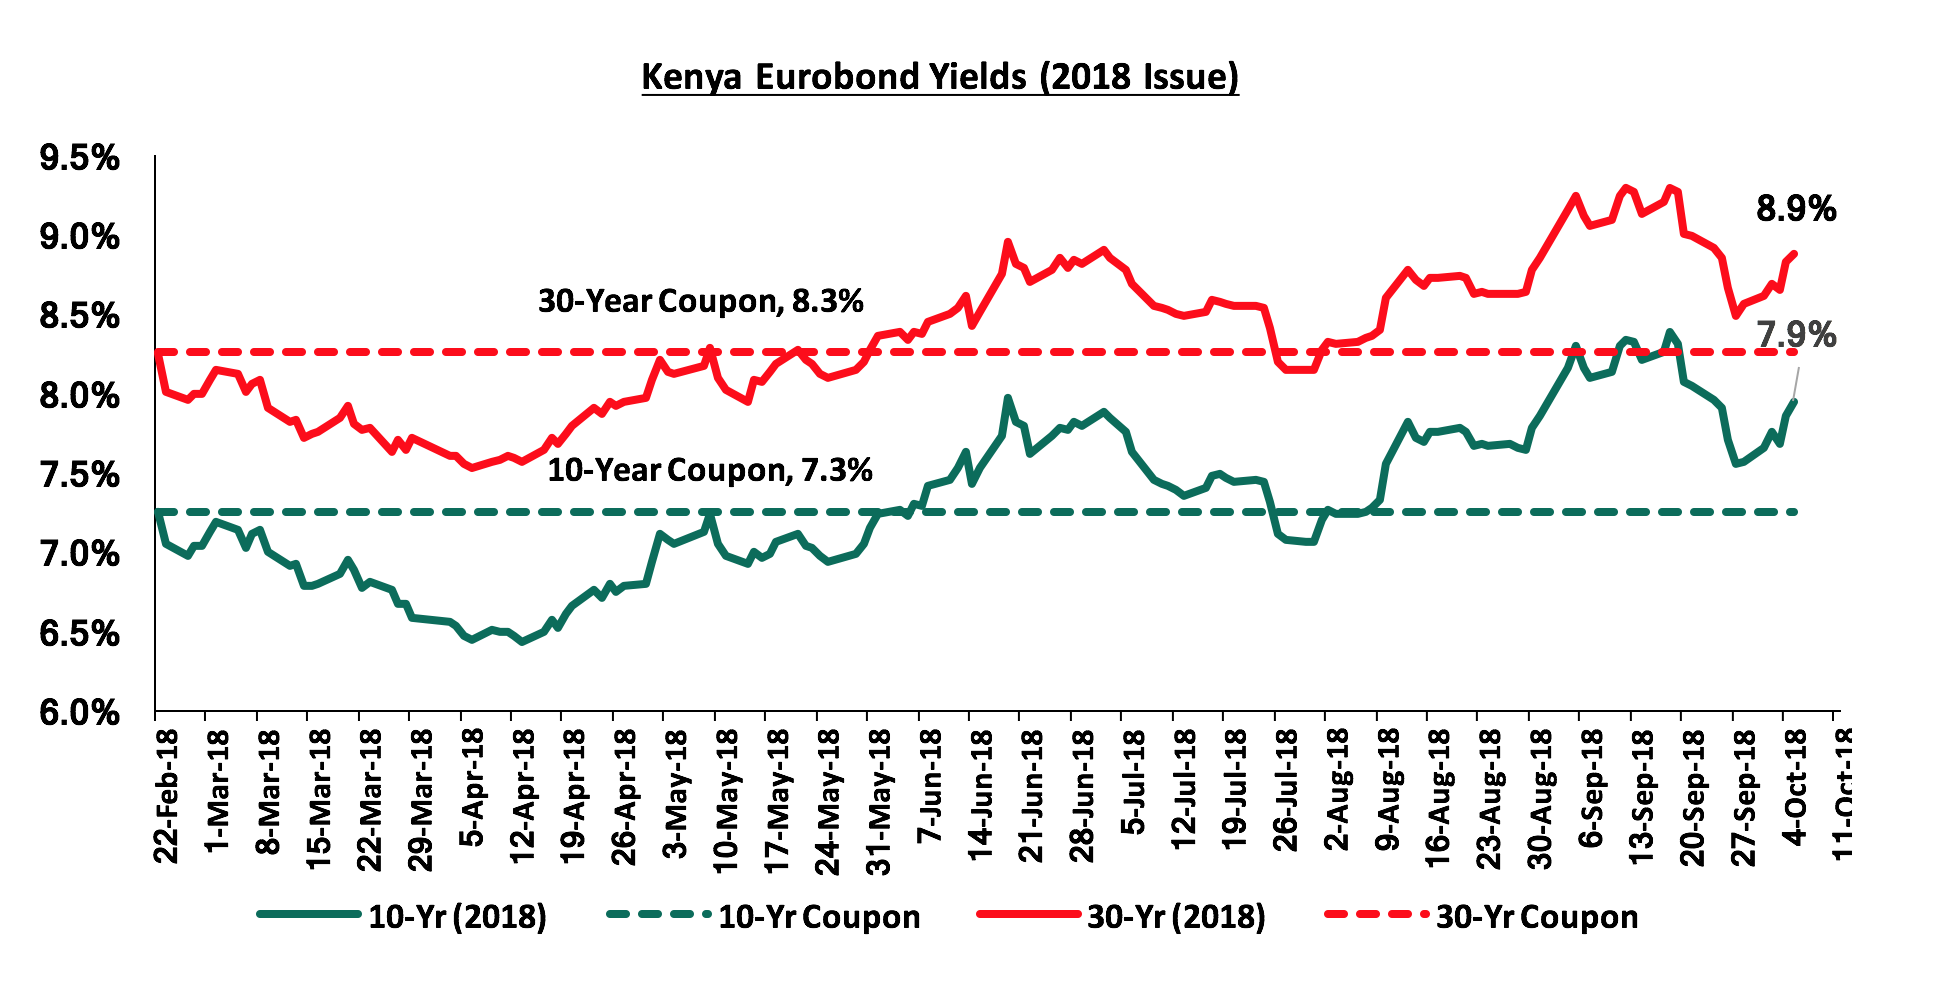
Key to note, the yields on all the Eurobonds was on the rise this week consistent with global trends in the bond markets due to the effects of the 0.25% hike in the Fed Rate by the Federal Open Market Committee (FOMC) the previous week.
The Kenya Shilling:
During the week, the Kenya Shilling remained stable against the US Dollar at Kshs 101.0, supported by inflows from diaspora remittances and reduced dollar demand from importers. The Kenya Shilling has appreciated by 2.2% year to date, and in our view the shilling should remain relatively stable to the dollar in the short term, supported by:
- The narrowing of the current account deficit to 5.8% in the 12-months to June 2018, from 6.3% in March 2018, attributed to improved agriculture exports, and lower capital goods imports following the completion of Phase I of the Standard Gauge Railway (SGR) project,
- Stronger inflows from principal exports, which include coffee, tea, and horticulture, which increased by 1.7% during the month of July to Kshs 24.7 bn, from Kshs 24.3 bn in June, with the exports from horticulture improving by 9.1%,
- Improving diaspora remittances, which increased by 71.9% y/y to USD 266.2 mn in June 2018 from USD 154.9 mn in June 2017 and by 4.9% m/m, from USD 253.7 mn in May 2018, with the largest contributor being North America at USD 130.1 mn, attributed to; (a) recovery of the global economy, (b) increased uptake of financial products by the diaspora due to financial services firms, particularly banks, targeting the diaspora, and (c) new partnerships between international money remittance providers and local commercial banks making the process more convenient, and,
- High levels of forex reserves, currently at USD 8.5 bn, equivalent to 5.6-months of import cover, compared to the one-year average of 5.4-months.
Highlights of the Week:
According to the Stanbic Bank’s Monthly Purchasing Manager’s Index (PMI), the business environment in the country continued to improve in September 2018 for the 10th month in a row since December 2017, but the rate of growth was the slowest in the aforementioned period. The seasonally adjusted PMI came in at 52.7 in September, a decline from 54.6 recorded in August. A PMI reading of above 50 indicates improvements in the business environment, while a reading below 50 indicates a worsening outlook. Firms reported growth in value of outputs though at the slowest rate since December 2017, driven by the continued rise in total new orders albeit at a slower rate as compared to August, and at the slowest rate since January 2018.
Private sector credit growth however remains the main concern, despite improving to 4.3% in August, from 3.9% in May, but still remains below the 5-year historical average of 13.0%. We expect private sector credit growth to remain low due to the assent of the Finance Bill 2018, which retained the ceiling rate on loans at 4.0% above the Central Bank Rate (CBR) only removing the floor rates on deposits.
Due to the introduction of the various tax measures in the Finance Bill 2018, and the increased fuel prices as a result of implementation of the 8.0% VAT, we also expect a continued slowdown in new orders and effectively reduced output due to a rise in costs of production, which will be passed down to consumers. The increased prices will put a strain on overall consumption as consumers will have to rationalize their consumption on goods and services due to the dilution of their purchasing power, which effectively means a reduction in the quantity of goods and services a single unit of currency can buy.
Rates in the fixed income market have been on a declining trend, as the government continues to reject expensive bids as it is currently 82.1% ahead of its pro-rated borrowing target for the current financial year, having borrowed Kshs 142.8 bn against a pro-rated target of Kshs 78.4 bn. The 2018/19 budget had given a domestic borrowing target of Kshs 271.9 bn, 8.6% lower than the 2017/2018 fiscal year’s target of Kshs 297.6 bn, which may result in reduced pressure on domestic borrowing. With the rate cap still in place, with the president having ascented to the Finance Bill 2018, we maintain our expectation of stability in the interest rate environment. With the expectation of a relatively stable interest rate environment, our view is that investors should be biased towards medium-term fixed-income instruments.
Market Performance:
During the week, the equities market recorded mixed performances with NSE 25 and NSE 20 declining by 0.2% and 0.4%, respectively, while NASI gained by 0.8%, taking their YTD performance to (13.8%), (22.8%) and (11.9%), for NASI, NSE 20 and NSE 25, respectively. This week’s performance was driven by gains in large cap stocks such as EABL, Co-operative Bank, KCB Group and Barclays Bank of Kenya that gained by 5.6%, 5.3%, 9.4% and 4.4%, respectively. For the last twelve months (LTM), NASI, NSE 20 and NSE 25 have declined 6.3%, 22.6% and 9.8%, respectively.
Equities turnover decreased by 16.9% to USD 34.0 mn from USD 41.0 mn the previous week, bringing the YTD turnover to USD 1.5 bn. During the week, foreign investors remained net sellers with the net outflow decreasing by 33.2% to USD 8.0 mn, from USD 12.1 mn the previous week. We expect the market to remain subdued in the near term as foreign investors exit the broader emerging markets due to the rising interest rates in the US coupled with the strengthening of the US Dollar.
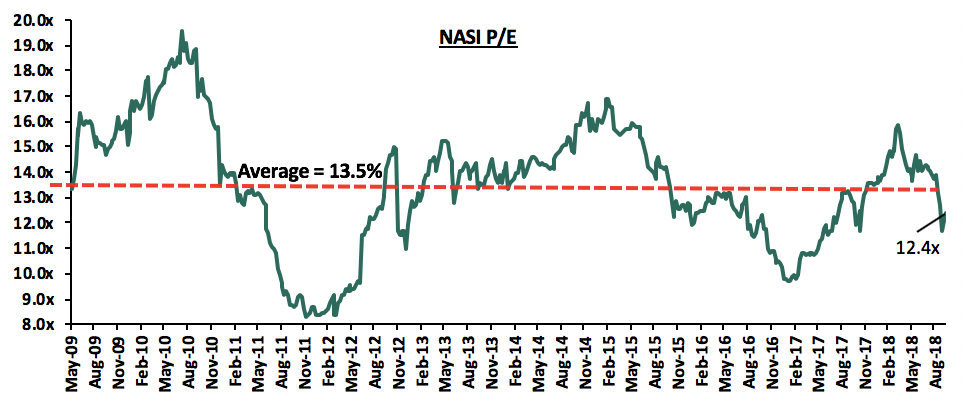
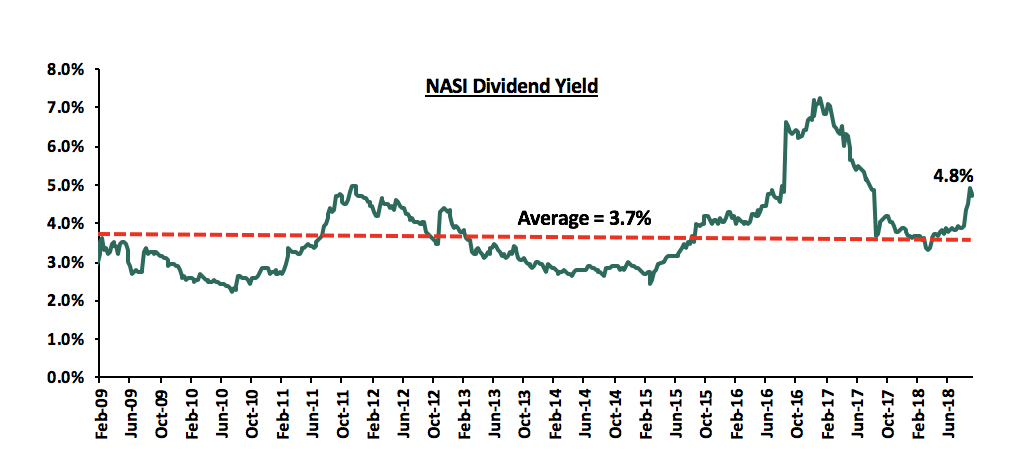
The market is currently trading at a price to earnings ratio (P/E) of 12.4x, which is 8.1% below the historical average of 13.5x, and a dividend yield of 4.8%, higher than the historical average of 3.7%. The current P/E valuation of 12.4x is 26.5% above the most recent trough valuation of 9.8x experienced in the first week of February 2017, and 49.4% above the previous trough valuation of 8.3x experienced in December 2011. The charts below indicate the historical P/E and dividend yields of the market.
Weekly Highlights:
I&M Bank has secured a USD 40.0 mn (Kshs 4.0 bn) loan from the FMO, a Dutch Development Bank, for onward lending to small business enterprises (SMEs) in what is expected to boost their operations, currently hampered by cautious lending towards the segment. FMO’s Chief Investment Officer, Linda Broekhuizen, highlighted that the facility would be used primarily for onward lending to SMEs, thus supporting the expansion of I&M Bank’s strategy to increase its SME loan book, and in the process aid in boosting the local economy. In recent years, Kenyan banks have taken on substantial loans from international financiers, including International Finance Corporation (IFC), European Investment Bank and the African Development Bank (AfDB). Development banks such as FMO offer attractive terms on their lending to commercial banks, including lower interest rates and longer maturity periods. Previous issues such as that of the International Finance Corporation (IFC) to Co-operative Bank were priced at the London Interbank Offered Rate (LIBOR), plus a premium, which is unspecified, and for a period of 7-years. The current LIBOR rate is at 2.8%. Previously, Equity Group, Co-operative Bank, Diamond Trust Bank, Stanbic Holdings and KCB Group have borrowed from international financiers to mainly fund their onward lending business. The asset-liability mismatch by tenor due to the relatively long-term nature of loans and short-term nature of deposits exposes a gap that banks have chosen to fill will with credit from the international financiers. The SMEs businesses have been hit hard following the enactment of the Banking (Amendment) Act 2015 that capped the interest chargeable on loans at 4.0% above the Central Bank Rate (CBR). Inability to price SMEs within these margins, coupled with the continually deteriorating asset quality evidenced by a rise in gross non-performing loans ratio to a weighted average of 10.0% in H1’2018 from 7.7% in H1’2017, led to a constriction in lending to these businesses. The move by lenders has had negative effect on SMEs resulting to a slow growth in the credit extended to the private sector, of 4.3% in the last 12-months to August 2018, which remains below the Central Bank of Kenya target rate of 12.0-15.0%, and below the 5-year average of 13.0%.
The table below highlights several debt issues by international institutions to local banks:
|
Issuer |
Bank |
Issue Date |
Amount of Loan (Kshs bn) |
Term of Credit |
|
|
1. |
Africa Development Bank |
Kenya Commercial Bank |
Oct-17 |
10.4 |
Not specified |
|
2. |
IFC |
I&M Holdings |
Jan-18 |
1.0 |
Not specified |
|
3. |
IFC |
Cooperative Bank |
Feb-18 |
15.2 |
7-years |
|
4. |
Africa Development Bank |
Diamond Trust bank |
Mar-18 |
7.5 |
7-years |
|
5. |
SwedFund |
Victoria Commercial Bank |
Apr-18 |
0.5 |
Not specified |
|
6. |
14 financial Institutions (syndicated) |
Stanbic Bank |
May-18 |
10.0 |
2,3 years |
|
7. |
FMO |
I&M Holdings |
Oct-18 |
4.0 |
Not Specified |
|
Total |
48.6 |
ARM’s creditors, including banks like Stanbic Holdings and Africa Finance Corporation, that placed it under administration, will meet to vote on how to settle the company’s debt. United Bank for Africa (UBA) had provided the company with a short-term loan of Kshs 500 mn and appointed Price Waterhouse Coopers (PwC) as administrators in an effort to recover the debt. The administrators asked the company bankers and suppliers to file their claims ahead of the meeting, where creditors owed an aggregate of 75.0% of the liabilities can decide on a solution that is binding to all. Africa Finance Corporation (AFC) provided ARM with a loan of Kshs 4.6 bn, while Stanbic Bank had provided the company with Kshs 3.2 bn, thereby holding nearly 36.0% of the total outstanding liability of Kshs 21.7 bn, and will have a major influence in the meeting. According to Pradeep Paunrana, the founding shareholder, the company is considering liquidation, raising Kshs 5.0 bn through a rights issue or selling more assets, including the Tanzania operations among other solutions to get the company back on its feet. It is highly likely that ARM’s declining share price, from August 2015 at Kshs 58.0 per share to Kshs 5.5 per share in October 2018, a decline of 91.0%, could complicate the company’s plan to raise Kshs 5.0 bn through a rights issue because offering a discount on that share price will affect the long-term shareholders who have already lost 90.0% of their paper value. We further expect that the suspension from the NSE bourse will continue beyond October 26th as PwC and creditors work to decide on the best solution. In our view, ARM should sell off the operations in Tanzania, a move that will see it reduce the debt but leave it with a smaller and potentially profitable business.
Central Bank of Kenya (CBK) and the Kenya Deposit Insurance Corporation (KDIC) announced they had received an improved binding offer from KCB Group, inching closer to closing a deal that will see the bank carve out certain assets and liabilities from Imperial Bank. CBK and KDIC will hold a meeting with depositors of Imperial Bank, which is under receivership as they finalize assessment of the revised offer from KCB. At the end of June 2015, Imperial Bank held Kshs 58.0 bn in customer deposits and was classified a mid-tier lender with operations in Kenya and Tanzania. The actions by CBK and KDIC are a step in the right direction, and if successful, will see the second instance a bank is successfully brought out of receivership after Chase Bank was bought by SBM Kenya Limited. We note that the process needs to be expedited, given that the CBK is behind from its earlier schedule of having a successful bidder by February 2018. If successful, depositors will be able to access deposits locked in the lender since 2015.
Equities Universe of Coverage:
Below is our Equities Universe of Coverage:
|
Banks |
Price as at 28/09/2018 |
Price as at 5/10/2018 |
w/w change |
YTD Change |
LTM Change |
Target Price* |
Dividend Yield |
Upside/Downside** |
P/TBv Multiple |
|
NIC Bank*** |
25.3 |
24.5 |
(3.0%) |
(27.4%) |
(29.1%) |
48.8 |
4.1% |
103.3% |
0.7x |
|
Diamond Trust Bank*** |
174.0 |
165.0 |
(5.2%) |
(14.1%) |
(11.3%) |
283.7 |
1.6% |
73.5% |
1.0x |
|
Zenith Bank*** |
21.5 |
21.6 |
0.2% |
(16.0%) |
(12.7%) |
33.3 |
12.5% |
67.1% |
1.0x |
|
KCB Group*** |
40.5 |
38.8 |
(4.3%) |
(9.4%) |
(3.7%) |
61.3 |
7.7% |
65.9% |
1.3x |
|
Union Bank Plc |
5.1 |
5.0 |
(2.0%) |
(35.9%) |
(16.5%) |
8.2 |
0.0% |
63.0% |
0.5x |
|
I&M Holdings*** |
99.0 |
91.0 |
(8.1%) |
(9.0%) |
(27.8%) |
138.6 |
3.8% |
56.2% |
1.0x |
|
Ghana Commercial Bank*** |
5.4 |
5.3 |
(0.2%) |
5.7% |
33.5% |
7.7 |
7.1% |
51.7% |
1.3x |
|
Equity Group |
40.0 |
40.5 |
1.3% |
1.9% |
9.5% |
56.2 |
4.9% |
43.7% |
1.9x |
|
UBA Bank |
8.4 |
8.2 |
(2.4%) |
(20.4%) |
(10.9%) |
10.7 |
10.4% |
40.9% |
0.6x |
|
Co-operative Bank |
15.2 |
15.4 |
1.0% |
(4.1%) |
(7.8%) |
19.9 |
5.2% |
34.9% |
1.3x |
|
CRDB |
160.0 |
160.0 |
0.0% |
0.0% |
(8.6%) |
207.7 |
0.0% |
29.8% |
0.5x |
|
Ecobank |
8.0 |
8.5 |
5.6% |
11.2% |
31.1% |
10.7 |
0.0% |
27.0% |
1.8x |
|
Barclays |
10.6 |
10.7 |
0.5% |
10.9% |
4.4% |
12.5 |
9.4% |
26.8% |
1.4x |
|
Access Bank |
8.2 |
8.1 |
(1.2%) |
(23.0%) |
(17.9%) |
9.5 |
5.0% |
23.0% |
0.5x |
|
CAL Bank |
1.2 |
1.2 |
0.0% |
8.3% |
32.4% |
1.4 |
0.0% |
19.7% |
1.0x |
|
HF Group*** |
5.8 |
5.9 |
1.7% |
(43.3%) |
(38.8%) |
6.6 |
5.9% |
17.8% |
0.2x |
|
Stanbic Bank Uganda |
33.0 |
33.0 |
0.0% |
21.1% |
21.1% |
36.3 |
3.5% |
13.5% |
2.3x |
|
Standard Chartered |
192.0 |
190.0 |
(1.0%) |
(8.7%) |
(15.9%) |
196.3 |
6.6% |
9.9% |
1.5x |
|
Guaranty Trust Bank |
36.4 |
36.4 |
0.0% |
(10.8%) |
(9.7%) |
37.1 |
6.6% |
8.7% |
2.3x |
|
Bank of Kigali |
289.0 |
289.0 |
0.0% |
(3.7%) |
3.6% |
299.9 |
4.8% |
8.6% |
1.6x |
|
SBM Holdings |
6.5 |
6.3 |
(2.8%) |
(15.7%) |
(18.6%) |
6.6 |
4.7% |
8.5% |
0.9x |
|
Stanbic Holdings |
90.0 |
90.0 |
0.0% |
11.1% |
14.6% |
92.6 |
2.5% |
5.4% |
0.9x |
|
Bank of Baroda |
126.0 |
140.0 |
11.1% |
23.9% |
27.3% |
130.6 |
1.8% |
(4.9%) |
1.1x |
|
National Bank |
5.8 |
5.2 |
(10.3%) |
(44.4%) |
(45.3%) |
4.9 |
0.0% |
(5.8%) |
0.4x |
|
Stanbic IBTC Holdings |
46.0 |
42.5 |
(7.6%) |
2.4% |
3.7% |
37.0 |
1.4% |
(11.5%) |
2.4x |
|
FBN Holdings |
8.9 |
8.9 |
0.0% |
1.1% |
56.1% |
6.6 |
2.8% |
(22.7%) |
0.5x |
|
Standard Chartered |
26.1 |
26.1 |
0.0% |
3.4% |
52.3% |
19.5 |
0.0% |
(25.4%) |
3.3x |
|
Ecobank Transnational |
17.9 |
17.5 |
(2.2%) |
2.9% |
4.5% |
9.3 |
0.0% |
(47.0%) |
0.6x |
|
*Target Price as per Cytonn Analyst estimates **Upside / (Downside) is adjusted for Dividend Yield ***Banks in which Cytonn and/or its affiliates holds a stake. For full disclosure, Cytonn and/or its affiliates holds a significant stake in NIC Bank, ranking as the 5th largest shareholder **** Stock prices are in respective country currency |
|||||||||
We are “NEUTRAL” on equities since the markets are currently trading below their historical averages. Pockets of value continue to exist, with a number of undervalued sectors like Financial Services, which provide an attractive entry point for medium and long-term investors, and with expectations of higher corporate earnings this year, we are “POSITIVE” for investors with a long-term investment horizon.
The African Private Equity and Venture Capital Association (AVCA) and PwC released a report on private equity-backed IPOs (exit of private equity firms from companies through means of an Initial Public Offer) in the African region. This study spanned a period of 8-years from 2010 to 2017, and sought to analyse the growing trend of companies that have had PE backed IPOs.
In the period from 2010 to 2017, there was a total of 187 IPOs, with 28 in 2017, a 17.0% increase from the 24 IPOs in 2016. However, most IPOs in the region have been non-private equity backed, with private equity backed IPOs over the period constituting 14.3% of total IPOs, compared to an average of 39.0% and 36.0% for the United States and the United Kingdom, respectively. The Johannesburg Stock Exchange tied with the Bourse de Tunis in Tunisia in terms of number of IPO exits for PE firms, each having 9 PE backed IPOs over the period, followed by the Bourse de Casablanca in Morocco, which had 4 PE-backed IPOs over the period.
Below is the summary of the top 5 bourses that had PE backed IPOs over the course of the study. The Nairobi Securities Exchange did not have any PE backed IPO over this period:
|
Top 5 Exchanges for PE-Backed IPOs (2010 to 2017) |
|||
|
Exchange |
Country |
Number of PE-backed IPOs |
Percentage of Total Proceeds |
|
Johannesburg Stock Exchange (JSE) |
South Africa |
9 |
58.8% |
|
London Stock Exchange (LSE) |
United Kingdom |
2 |
18.9% |
|
The Egyptian Exchange(EGX) |
Egypt |
2 |
9.7% |
|
Bourse de Casablanca |
Morocco |
4 |
6.4% |
|
Bourse de Tunis |
Tunisia |
9 |
6.2% |
Source: AVCA
In terms of total proceeds raised from these IPOs, the Johannesburg Stock Exchange (JSE) led with 58.8% of the total proceeds raised, followed by the London Stock Exchange (LSE), with 18.9% of the total proceeds. This affinity towards the JSE for PE backed exits can be attributed to the investor confidence in the market given the reputation of South Africa as an investment hub for the region. The LSE has been actively working to ensure that more African companies list on the LSE, with efforts to ease the process, as well as partnering with African bourses to have companies achieve parallel listings locally and on the LSE.
JSE still led the pack, with three out of the top five IPO backed companies in terms of capital raised having listed on the JSE, with 58.8% of the total proceeds being raised between the 9 companies that were listed, as summarised below:
|
Top 5 PE Backed IPOs by Value (2010 to 2017) |
|||||||
|
Company |
Exchange |
IPO Date |
Proceeds Raised (USD mn) |
Financial Sponsor(s) |
Stake Owned |
Date of PE Investment |
Initial Amount Invested by PE Firm (USD mn) |
|
Life Healthcare |
JSE |
Jun-10 |
681.0 |
Mvelaphanda Group, Brimstone |
26.7% |
2005 |
Undisclosed |
|
Alexander Forbes |
JSE |
Jul-14 |
348.0 |
Actis, Ethos Private Equity, Harbourvest Partners |
70.0% |
2007 |
Undisclosed |
|
Integrated Diagnostics Holdings |
LSE |
May-15 |
334.0 |
Abraaj |
Undisclosed |
2008 |
Undisclosed |
|
AYO Technology Solutions |
JSE |
Dec-17 |
328.0 |
AEEI |
80.0% |
2009 |
Undisclosed |
|
EditaFood Industries |
EGX & LSE |
Apr-15 |
267.0 |
Actis |
30.0% |
2013 |
102.0 |
Source: AVCA
The consumer goods and the financial services industries boasted the greatest number of PE- backed IPOs, with each having 7 out of 32 PE-backed IPOs. These sectors raised a total of USD 544.0 mn and USD 468.0 mn, respectively. In terms of the proceeds raised, healthcare led with USD 1.1 bn of proceeds raised, followed by consumer goods, which had USD 521.1 mn of proceeds raised. Financial services came in third, accounting for 16.0% of the proceeds raised. This is largely due to the huge growth in the financial services industry in Africa, and the high opportunities for growth in this sector driven by (i) inherent increase in consumption expenditure and a rise in the percentage of the population requiring financial services, (ii) low financial inclusion which presents ample runway for growth, and (iii) incorporation of technology to improve efficiency in operations and increase coverage.
|
PE-backed IPOs by Sector (2010 - 2017) |
||||
|
Industry |
Total Number of PE-Backed IPOs |
Percentage of IPOs |
Value of Proceeds Raised (USD mn) |
Percentage of Proceeds Raised |
|
Healthcare |
7 |
23.0% |
1,100.0 |
38.0% |
|
Consumer goods |
7 |
23.0% |
521.1 |
18.0% |
|
Financials |
6 |
17.0% |
463.2 |
16.0% |
|
Technology |
5 |
14.0% |
318.4 |
11.0% |
|
Basic Materials |
3 |
10.0% |
260.5 |
9.0% |
|
Industrials |
2 |
7.0% |
115.8 |
4.0% |
|
Consumer Services |
1 |
3.0% |
60.8 |
2.1% |
|
Utilities |
1 |
3.0% |
55.0 |
1.9% |
|
Total |
32 |
2,894.7 |
||
Source: AVCA
One of the most notable IPOs was in 2014, by Alexander Forbes, with the exit of PE Firms Actis, Harbourvest Partners and Ethos Private Equity from the fund manager, who collectively owned 70.0% of Alexander Forbes. Alexander Forbes had initially gone private after it was bought by Actis in 2007. Another notable PE backed IPO was the exit of Helios from Vivo through a dual-listing on the LSE and the JSE, being the first PE exit via an IPO on both the LSE and the JSE.
In our view, the performance of the private equity sector in terms of exits points to growing volumes in the proceeds gained by exit through IPOs, with USD 370.0 mn being raised in 2017 compared to USD 125.0 mn in 2016. However, the number of IPO exits still remain low, at 4 in 2017, compared to 24 non-PE backed IPOs in 2017. We expect this trend of PE firms exiting by way of IPOs to remain considerably low given the tedious procedures involved in a company going the IPO way. A shift in this trend is only achievable if there is an improvement in the local capital markets by putting in place measures that will (i) encourage firms to list, and (ii) improve investors’ participation in IPOs. This can be done by: (i) making the process of companies going public by means of an IPO easier, (ii) encouraging disclosures for non-listed companies in order to improve transparency and accessibility of information, which boosts investor confidence, making it easier for firms to raise capital during IPOs, and (iii) encouraging foreign participation through improved regulation, good economic fundamentals and empowering private initiatives.
Private equity investments in Africa remains robust as evidenced by the increasing investor interest, which is attributed to; (i) rapid urbanization of 4.1% p.a compared to 2.0% p.a globally, (ii) a resilient and adapting middle class and increased consumerism, (ii) the attractive valuations in Sub Saharan Africa’s private markets compared to its public markets, (iii) the attractive valuations in Sub Saharan Africa’s markets compared to global markets, and (iv) better economic projections in Sub Sahara Africa compared to global markets. We remain bullish on PE as an asset class in Sub-Sahara Africa. Going forward, the increasing investor interest and stable macro-economic environment will continue to boost deal flow into African markets.
Retail Sector
During the week, retailers continued with their expansion activities with:
- Botswana-based Choppies announcing that it will take up space previously occupied by Uchumi Supermarket in Ongata Rongai Town, in line with its expansion plan, which has seen the retailer increase its foothold in Kenya where it currently has 12 stores, with the most recent outlet openings being SouthField Mall in Embakasi and Kiambu Mall in Kiambu Town, and,
- Local retailer, Naivas Supermarket, opened a new outlet in Freedom Height Mall, Lang’ata, occupying 18,000 SQFT. The outlet brings the retailer’s total number of branches in Nairobi to 24, and 46 countrywide.
The above indicates the expansion of local and international retailers that have aggressively penetrated and increased their foothold in the Kenyan market within the last 2-years, among them, French Retailer Carrefour and Game of South Africa, which have opened 6 and 2 stores, respectively, in the last 2-years. The continued expansion is supported by: i) increased purchasing power, with GDP per capita growing at a rate of 7.9% p.a over the last 5-years, from Kshs 113,539 in 2013 to Kshs 166,314 in 2017, as well as varying tastes and preferences for different goods and services thus creating demand for diverse brands, ii) provision of high-quality spaces in line with international standards with destination malls such as Two Rivers Mall along Kiambu Road and Garden City Mall along Thika Road coming to the market, iii) infrastructure improvement, such as the construction of the Northern By-Pass which has opened up areas such as Ruaka and Ruiru for development, iv) the closure of branches of struggling local brands, namely Nakumatt and Uchumi, leading to availability of prime retail spaces, and v) the relatively stable growth of the Kenyan Economy, recording an average GDP growth rate of over 5.0% p.a for the past 5-years.
The table below shows a summary of operational branches of key supermarkets in Kenya:
|
Summary of Key Supermarkets in Kenya |
||
|
Outlet |
Origin Country |
No. of Operational Local Outlets |
|
Choppies |
Botswana |
12 |
|
Carrefour |
France |
6 |
|
The Game |
South Africa |
2 |
|
Naivas Supermarkets |
Kenya |
46 |
|
Nakumatt Holdings |
Kenya |
6 |
|
Tuskys Supermarkets |
Kenya |
63 |
|
Uchumi Supermarkets |
Kenya |
11 |
Source: Cytonn Research
We expect continued increase in activities in the retail sector, as both international and some local retailers continue to embark on expansion, and taking up space previously occupied by struggling local brands such as Nakumatt Holdings and Uchumi Supermarkets.
Hospitality Sector
Global hotel chain, Marriott International announced plans to increase its footprint in Africa to over 200 hotels and 38,000 rooms by 2023, with a focus on Kenya, Ghana, Morocco, South Africa and Mozambique. In Kenya, the company aims to increase its presence from 2 hotels to 5, and has laid out several strategies, including: i) a 365-room, 5-star JW Marriott in Westlands, Nairobi, slated to open in 2020, ii) a facility under the Protea Hotel Brand in Nairobi, which will be located approximately 5 KM from the Jomo Kenyatta International Airport (JKIA) on Mombasa Road and is expected to open doors in 2021. The Protea Hotel will consist of 250 rooms, a restaurant, bar, a fitness centre, a swimming pool and 600 SQFT of meeting space, and iii) a franchise agreement with Nairobi’s 5-star hotel, Sankara, which will see the Westlands-based hotel trade as a Marriott brand from early 2019. Currently, the hotel chain operates two 4-star hotels in Kenya, which are the 96-key Four Points by Sheraton located in Hurligham, and the 172-key Four Points by Sheraton Nairobi Airport along Mombasa Road. The Kenyan hospitality market continues to attract investments from global players evidenced by the increased entry of international brands such as Marriott, Accor Hotels and Carlson Rezidor (Radisson Blu), drawn by the improved performance, driven by:
- Increased demand for accommodation and other hospitality services by both local and international guests, with the number of international arrivals increasing by 0.9% to 443,950 by June 2018 compared to 439,807 during the same period in 2017,
- Positive reviews from travel advisors such as Trip Advisor, who ranked Nairobi as the 3rd best travel destination in the world after Ishigaki in Japan and Kapaa in Hawaii in 2018,
- Continued marketing efforts by the Kenya Tourism Board,
- Jomo Kenyatta International Airport (JKIA) ranking as the best airport in Africa and 38th globally according to worldwide rankings by Airhelp, a Danish firm that fights for airline passengers across Europe for compensation over flight delays, cancellations and overbookings, and
- Increased ease of access with direct flights to the US set to commence at the end of this month.
|
Summary of International Hotel Brands in Kenya |
||||
|
International Brands |
Operating Hotels |
Hotels in the Deal Pipeline |
No. of Rooms |
Year to be Opened |
|
Carlson Rezidor |
Radisson Blu, Upperhill |
Radisson Residence, Kilimani |
123 |
2018 |
|
Park Inn, Westlands |
|
|
||
|
Best Western |
Best Western Plus Meridian, CBD |
Best Western, The Alba |
83 |
2019 |
|
Hilton |
Hilton Hotel, CBD |
Hilton Pinnacle Towers, Upperhill |
255 |
2020 |
|
Hilton Double Tree, Hurlingham |
|
|
||
|
Hilton Garden Inn, Mombasa Rd |
|
|
||
|
Mariott International |
Four Points by Sheraton, Kilimani |
JW Mariott at Avic Towers, Westlands |
365 |
2020 |
|
Four Points by Sheraton, JKIA |
Protea Hotel by Mariott, Mombasa Road |
250 |
2021 |
|
|
Sankara, Westlands |
|
|
||
|
Accor Hotels |
Ibis Styles, Westlands |
Pullman, Westlands |
340 |
2018 |
|
Movenpick Nairobi |
|
|
||
|
Fairmont the Norfolk |
|
|
||
|
Fairmount Mount Kenya Safari Club |
|
|
||
|
Fairmont Mara Safari Club |
|
|
||
|
Sarovar |
Lazizi Premier, Mombasa Road |
|
|
|
|
Zehneria Portico |
|
|
||
|
Heron Portico, Mombasa Road |
|
|
||
|
Kempinski |
Villa Rosa Kempinski |
|
|
|
|
Hyatt Hotels |
Hyatt Place, Westlands |
173 |
2020 |
|
Source: Cytonn Research
Infrastructure Sector
During the week, Safaricom Pension Scheme received approval from Kenya Urban Roads Authority (KURA) to construct a 500-meter tarmac road that will link its Athi River development, named, Crystal Rivers, to the Nairobi-Mombasa Highway. The road is aimed at enhancing access to the gated community development, which sits on 25-acres of land and consists of 200,000 SQFT of lettable retail area, and a residential area consisting of 138 3-and 4-bedroom townhouses, and 260 units of 3-bedroom apartments. In the past years, the Kenyan Government has been taking up majority of the infrastructural projects, however, in recent years, we have witnessed the private sector taking up projects in the infrastructure sector aimed at enhancing economic growth and shared prosperity through access to facilities such as sewer, electricity and opening areas for development. The main factors driving investment in infrastructure in Kenya include (i) government incentives, where investors in commercial property who spend on social infrastructure such as power, water, sewer lines and roads are allowed to recover their expenses from tax deductions within four-years, through a 25.0% deduction in computing the taxable profits of the developer for any year of income, according to the Finance Bill 2012, (ii) the increased focus on the Kenyan Government’s Big Four Agenda, and (iii) the government’s focus on total integration and interconnection of areas which has resulted in the establishment of projects such as the Lamu Port-South Sudan-Ethiopia-Transport Corridor (LAPSSET) and the Standard Gauge Railway (SGR). We expect continued investment in infrastructure by both the private and public sector, aimed at opening up of areas for development, and enhancing the achievement of the expected average Gross Domestic Product (GDP) rates of between 5.3% - 5.5% for 2018, as the economy recovers from the effect of the prolonged electioneering period.
Jones Lang LaSalle (JLL), an American real estate company, released a Global Real Estate Transparency Index 2018, which ranked Kenya 53rd globally and 3rd in Sub Saharan Africa in transparency of the real estate market after South Africa and Botswana, which were ranked 21st and 46th globally, respectively. This is an improvement for Kenya, which was previously ranked 61st globally, and 4th in Sub-Saharan Africa, in the Global Real Estate Transparency Index 2016. According to the 2018 report, the proposed adoption of block chain technology for recording land ownership and listing websites such as Jumia and Property24, where property owners and potential buyers are able to get information on property, are key factors that have put Kenya in the map in enhancing transparency in its real estate industry. We expect continued transparency in Kenya’s real estate market, supported by the digitalization of the lands ministry, mounting intolerance of corruption by the government and increase in the number of property listing platforms facilitated by the rapid adoption of technology.
Other highlights during the week:
- Airlines operating in Kenya continue to increase their flights frequency driven by increased tourist arrivals into the country, with (i) Qatar Airways announcing plans to launch direct flights between Italy and Malindi, in a bid to increase the airlines foothold in Kenya and this follows the announcement that the airline will be introducing direct flights to Mombasa from Doha, Qatar, starting December 9th this year, and (ii) a partnership between Kenya Association of Travel Agents (KATA) and South Africa Tourism (SAT), which will see the Kenya Airways flight frequencies to Cape Town increase from 3 to 5-weekly, a move that is expected to further promote intra-Africa travel for leisure, trade and business.
Listed Real Estate
- Fahari I-REIT
The Fahari I-REIT closed the week at Kshs 10.0 per share, 2.0% lower than last week’s closing price of Kshs 10.2 per share. Additionally, during the week, it recorded an average price of Kshs 10.2 per share, which is an improvement of 1.0% from the previous week’s average of Kshs 10.1 per share. Despite the increase, the instrument continues to trade at low prices and in low volumes largely due to: (i) the negative sentiments currently engulfing the sector given the poor performance of the Fusion D-REIT (FRED), which failed to raise the minimum capital required to list on the NSE, (ii) inadequate investor knowledge, and (iii) the poor performance of Fahari I-REIT recording a dividend yield of 5.7% compared to brick and mortar office and retail at 9.3% and 9.7%, respectively.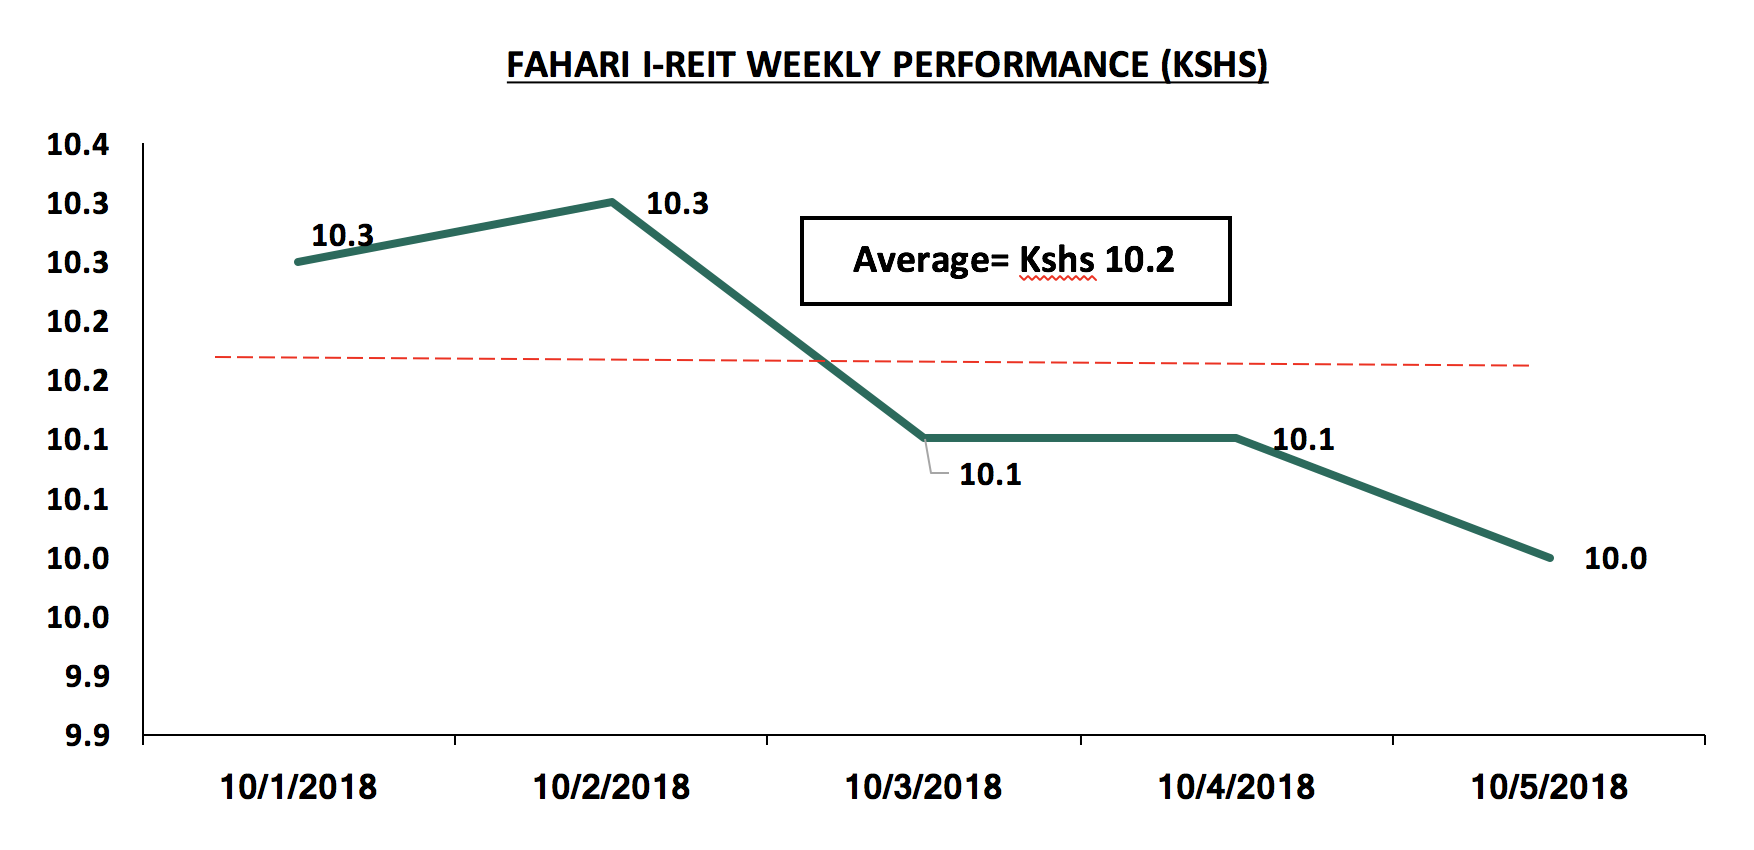
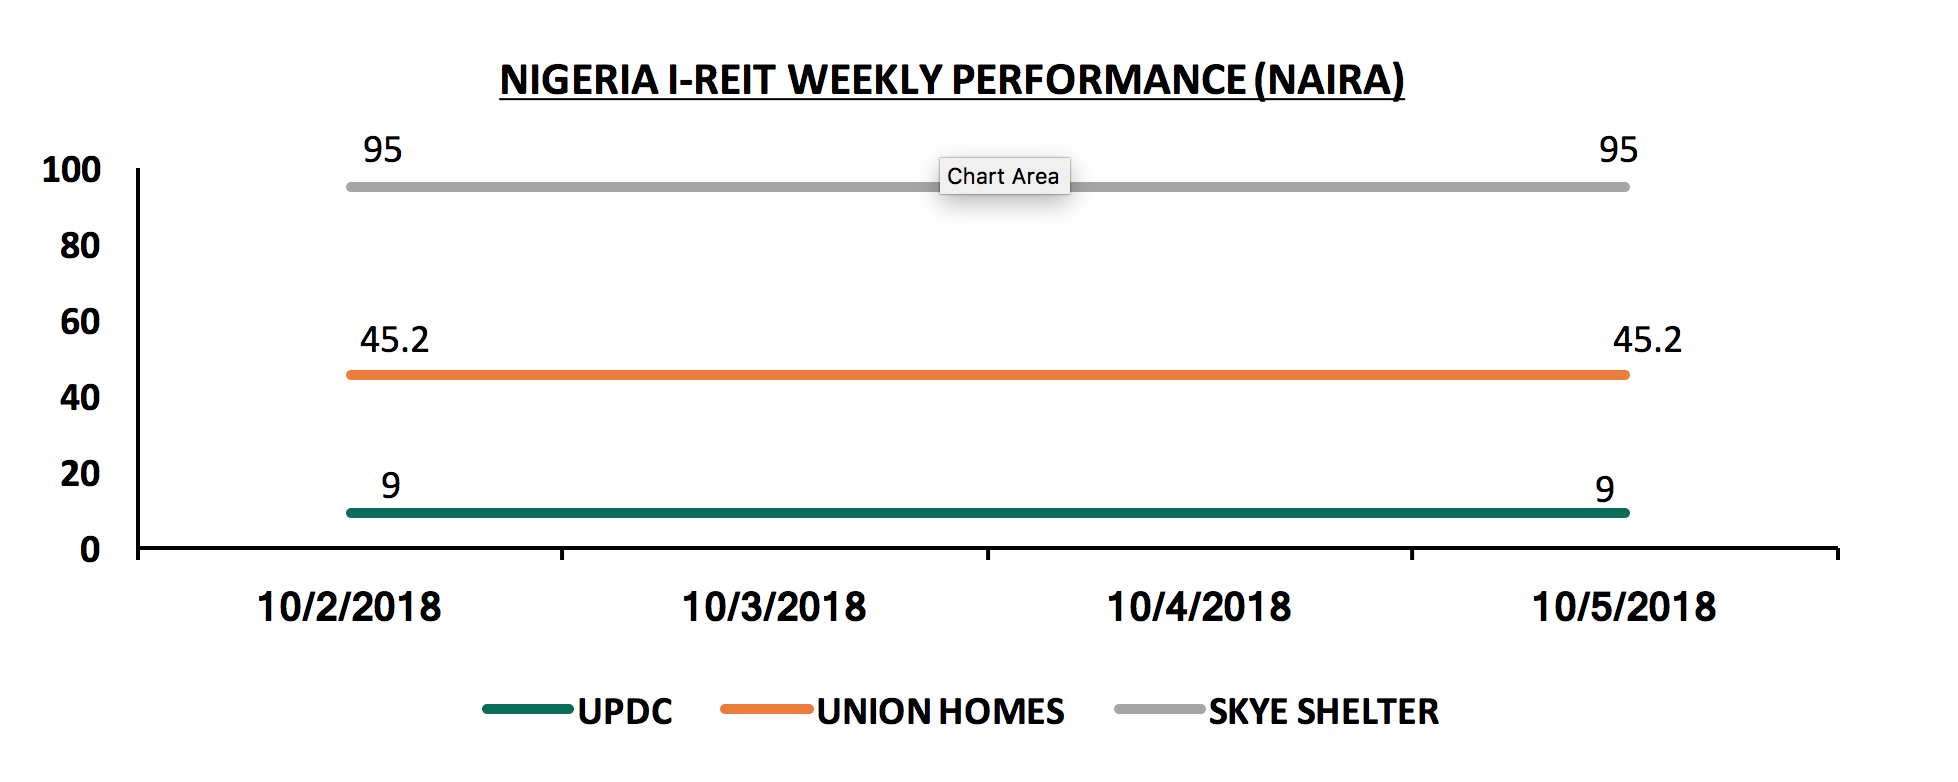
- Nigerian I-REIT
The Nigerian I-REIT market remained unchanged during the week, with, Skye Shelter, Union Homes and UPDC, retaining a price per share of N95, N45.2, and N9, respectively. We attribute the plateaued performance to inadequate investor knowledge about the market hence low investor interest in the instrument.
We expect continued increase in activities in the real estate sector, backed by; i) entry of international brands into the Kenyan hospitality and retail markets, ii) improved infrastructural developments, and iii) increased flights frequency which is expected to result in increased demand for accommodation and other hospitality services, and thus improved performance of the hospitality sector.

- Talk to us
- Kenya
- P.O Box 20695 - 00200, Nairobi, Kenya
- Cell +254709101200
- Tel +254709101200
- WhatsApp +254741676635
- United States
- +254709101200
- DOWNLOAD OUR APP
-


- Kenya
- 8th Floor, Pinetree Plaza, Kaburu Drive, Ngong Road, Nairobi, Kenya
- USA
- Suite 1150, 1775 Eye Street NW, USA, Washington DC 20006, USA
- Investments
- High Yield
- Private Equity
- Real Estate
- Real Estate
- RiverRun Estates
- Cytonn Towers
- The Ridge
- Taraji Heights
- The Alma