
Election Cycles & Impact on Capital Markets Ahead of the 2027 General Election, & Cytonn Weekly #32.2026
By Research Team, Aug 16, 2026
Executive Summary
Fixed Income
During the week, T-bills were oversubscribed for the second consecutive week, with the overall subscription rate coming in at 145.7% higher than the subscription rate of 107.0%, recorded the previous week. Investors’ preference for the shorter 91-day paper persisted, with the paper receiving bids worth Kshs 18.2 bn against the offered Kshs 8.0 bn, translating to a subscription rate of 228.0%, higher than the subscription rate of 169.9%, recorded the previous week. The subscription rate for the 182-day paper decreased marginally to 89.9% from 101.7% recorded the previous week, while that of the 364-day paper increased to 135.6% from 62.1% recorded the previous week. The government accepted a total of Kshs 37.0 bn worth of bids out of Kshs 40.8 bn bids received, translating to an acceptance rate of 90.8%. The yields on the government papers showed a mixed performance with the yields on the 364-day paper increasing the most by 3.2 bps to 9.04% from 9.00% recorded the previous week. The yields on the 182-day paper remained relatively unchanged at 9.0% while that of the 91-day paper decreased by 0.9 bps to 8.77% from 8.78% recorded the previous week;
Also, the Central Bank of Kenya released the auction results for the re-opened infrastructure bonds IFB1/2019/016, IFB1/2021/018 and IFB1/2021/021 with tenors to maturities of 9.3 years, 12.7 years and 16.2 years respectively and fixed coupon rates of 11.8%, 12.7% and 12.7% respectively. The bonds were oversubscribed, with the overall subscription rate coming in at 306.9%, receiving bids worth Kshs 460.4 bn against the offered Kshs 150.0 bn. The government accepted bids worth Kshs 3120 bn, translating to an acceptance rate of 67.8%. The weighted average yield for the accepted bids for IFB1/2019/016, IFB1/2021/018 and IFB1/2021/021 came in at 12.2%, 12.7% and 13.1% respectively. Notably the 12.2% on IFB1/2019/016 was lower than the 12.4% recorded in October 2019 when it was issued. However, the 13.1% for IFB1/2021/018 was higher than the 12.7% recorded in September 2021 when it was issued and the 12.7% for IFB1/2021/018 remain unchanged from April 2021 when it was issued. With the Inflation rate at 6.5% as of July 2026, the real returns of the IFB1/2021/021, IFB1/2021/018 and IFB1/2019/016 are 6.6%, 6.2% and 5.7%. Given that these infrastructure bonds are completely tax-exempt, the tax equivalent yields for long term government bonds with a 10.0% withholding tax are 14.6% for IFB1/2021/021, 14.1% for IFB1/2021/018, and 13.6% for IFB1/2019/016;
During the week, the Energy and Petroleum Regulatory Authority (EPRA) released its monthly statement on the maximum retail fuel prices in Kenya, effective from 15th August 2026 to 14th September 2026. Notably, the maximum allowed price for Diesel decreased by Kshs 5.0 per litre to Kshs 217.9 from Kshs 222.9, while the prices of Super Petrol and Kerosene remained unchanged at Kshs 214.0 and Kshs 191.4 per litre, respectively;
The Monetary Policy Committee (MPC) met on 11th August, 2026, to review the outcome of its previous policy decisions and decided to maintain the Central Bank Rate (CBR) at 8.75%, unchanged from the June 2026 meeting;
The National Treasury published the 2026 Budget Review and Outlook Paper (BROP), providing a review of the FY’2025/26 budget implementation and updated macroeconomic and fiscal projections for FY’2026/27 and the medium term;
Equities
During the week, the equities market was on an upward trajectory, with NSE 10, NSE 25, NASI and NSE 20 gaining by 2.3%, 1.5%, 1.3% and 0.6% respectively taking the YTD performance to gains of 31.7%, 31.0%, 29.7% and 27.1% respectively for NSE 20, NSE 10, NSE 25 and NASI respectively. The week-on-week equities market performance was mainly driven by gains recorded by large cap stocks such as Co-op Bank, Equity, and KCB of 7.0%, 5.0% and 2.9% respectively. However, the performance was weighed down by losses recorded by large cap stocks such as BAT, EABL and Stanbic Bank of 4.9%, 4.1% and 1.9% respectively;
During the week, the banking sector index increased by 2.8% to 276.6 from the 269.0 recorded the previous week. This is attributable to gains recorded by large cap stocks such as Co-op Bank, Equity, and KCB of 7.0%, 5.0% and 2.9% respectively. However, the performance was weighed down by losses recorded by large cap stocks such as Stanbic, NCBA and DTB of 1.9%, 0.5% and 0.2% respectively;
During the week, KCB Bank released their H1’2026 financial results, recording a 14.5% increase in profit after tax to Kshs 36.1 bn in H1’2026, from Kshs 31.5 bn in H1’2025;
During the week, Co-op Bank released their H1’2026 financial results, recording a 28.0% increase in profit after tax to Kshs 18.0 bn in H1’2026, from Kshs 14.1 bn in H1’2025;
During the week, Sanlam released their HY’2026 financial results for HY’2026 recording a 7.4% decrease in Profit After Tax to Kshs 0.13 bn from Kshs 0.12 bn recorded in HY’2025;
During the week, the Capital Markets Authority (CMA) approved the listing of the WSA Banking Index ETF on the Nairobi Securities Exchange (NSE), introducing Kenya’s first locally domiciled Exchange Traded Fund. The ETF will provide investors with diversified exposure to the domestic banking sector through a single investment instrument, tracking the NSE Banking Sector Index;
Real Estate
During the week, the treasury reported that Kenya's Affordable Housing Programme has received cumulative contributions of Kshs 206.5 bn over three years, with more than 205,000 housing units currently under development at a cost of nearly Kshs 500.0 bn, a development expected to significantly expand residential Real Estate supply and sustain demand for construction and property management services across the country's major urban centers;
During the week, Kenya and Tanzania renewed efforts to connect their SGR networks to landlocked neighbors Uganda, Rwanda, and Burundi, with Kenya targeting the mobilization of up to Kshs 390.0 bn through Railway Development Levy-backed securitized bonds to finance the stalled Naivasha–Kisumu–Malaba extension;
During the week, the government announced that Nairobi's Kshs 1.0 tn metro rail project is set to begin construction in 2028 with a 10-kilometre first phase connecting the CBD to Eastlands, financed through a blended model combining PPPs, the National Infrastructure Fund, and climate finance;
During the week, Africa Logistics Properties (ALP) received a Kshs 228.0 mn stamp duty relief on property transfers into its dollar-denominated I-REIT, following the Finance Act 2026's reinstatement of a stamp duty exemption on such transactions;
During the week, Laptrust released the H1’2026 financial results for the Imara I-REIT for the period ended 30th June 2026;
On the Unquoted Securities Platform Acorn D-REIT and I-REIT traded at Kshs 29.7 and Kshs 24.4 per unit, respectively, as per the last updated data on 14th August 2026. The performance represented a 48.5% and 22.0% gain for the D-REIT and I-REIT, respectively, from the Kshs 20.0 inception price. Additionally, ILAM Fahari I-REIT traded at Kshs 13.8 per share as of 14th August 2026, representing a 31.0% loss from the Kshs 20.0 inception price;
Digital Payments Weekly Highlights
During the week, American Express announced the launch of expanded virtual card capabilities across its U.S. commercial solutions, enabling corporate customers to create, manage, and deploy virtual cards directly within its Work platform and via an expanded integration with Conferma. The initiative enhances security, spending controls, and operational efficiency for commercial clients, reinforcing Amex's strategy of expanding digital payment tools across enterprise expense management;
During the week, Mastercard Incorporated announced the appointment of Yasemin Bedir as President for its Eastern Europe, Middle East, and Africa (EEMEA) region, effective 1ST September 2026. The leadership appointment supports Mastercard's strategic expansion in high-growth emerging markets and strengthens its regional digital payments footprint;
During the week, PayPal Holdings, Inc. highlighted its AI strategy at the Ai4 2026 conference in Las Vegas, showcasing how its trusted transaction history and scale are being leveraged to build foundational infrastructure for agentic commerce and AI-driven financial services;
The digital payment companies we track (AXP, Visa, Mastercard, Circle, Block, PayPal, Coinbase, Global Payments, and Wise) are currently trading at an average P/E of 21.9x, implying that investors are pricing in strong future earnings growth expectations and are willing to pay a significant premium for current earnings, which may also suggest that valuations may be stretched relative to near-term fundamentals;Bottom of Form
Focus of the Week
Approximately one year to Kenya's August 2027 General Election, the potential impact of the election cycle on economic activity and capital markets is increasingly relevant to investors. Historical evidence shows that elections can affect economic and investment conditions through political uncertainty, changes in investor sentiment, government borrowing and spending, but the magnitude of the impact has varied across election cycles. The 2007/08 cycle represents the most severe episode, with real GDP growth falling to 0.2% in 2008 from 6.9% in 2007 amid post-election violence and other domestic and global shocks. The 2013, 2017 and 2022 cycles demonstrate that election-related uncertainty can have a more pronounced effect when it coincides with broader economic and financial pressures.
Kenya enters the 2027 election cycle from a mixed but relatively resilient position. Real GDP growth accelerated to 5.3% in Q1'2026 from 4.9% in Q1'2025, although the World Bank projects growth to moderate to 4.3% in 2026, reflecting escalating geopolitical tensions, higher energy prices, elevated debt levels and uncertainty surrounding the upcoming elections. Inflation remains within the CBK's 2.5%-7.5% target range but increased to 6.5% in July 2026, above the 5.0% midpoint, while the CBR remains at 8.75%. Fiscal pressures remain a key concern, with the FY’2026/27 Budget providing for expenditure of Kshs 4.8 tn and a fiscal deficit of Kshs 1.1 tn, increasing the government's reliance on domestic borrowing. At the same time, foreign direct investments provide a more supportive backdrop, with inflows rising by 37.7% to a record USD 3.2 bn in 2025 from USD 2.3 bn in 2024. Continued public investment also provides support to real estate, with development expenditure of Kshs 809.0 bn, including Kshs 531.3 bn allocated to infrastructure.
For capital markets, we expect the 2027 election to increase uncertainty and influence investor positioning, but not necessarily result in a broad-based deterioration in asset performance. The 2017 and 2022 experiences show that the interaction between election risk, corporate earnings, valuations, foreign investor flows, interest rates and global conditions is more important than the election itself. We therefore expect government borrowing to remain a key downside risk, while GDP, FDI, corporate earnings and real estate provide some support to the investment environment. Overall, we expect the 2027 election cycle to have a meaningful impact on Kenya's macroeconomic and market environment, particularly through its effects on investor sentiment, capital flows, spending decisions and policy uncertainty. The magnitude of this impact will depend on the evolution of fiscal conditions, inflation, economic growth, investor sentiment and global financial conditions as the country moves closer to the polls.
Investment Updates:
-
Weekly Rates: Cytonn Money Market Fund closed the week at a yield of 11.08% p.a. To invest, dial *809# or download the Cytonn App from Google Play store here or from the Appstore here;
-
We continue to offer Wealth Management Training every Tuesday, from 7:00 pm to 8:00 pm. The training aims to grow financial literacy among the general public. To register for any of our Wealth Management Trainings, click here. If interested in our Private Wealth Management Training for your employees or investment group, please get in touch with us through wmt@cytonn.com;
-
Cytonn Asset Managers Limited (CAML) continues to offer pension products to meet the needs of both individual clients who want to save for their retirement during their working years and Institutional clients that want to contribute on behalf of their employees to help them build their retirement pot. To more about our pension schemes, kindly get in touch with us through pensions@cytonn.com;
Hospitality Updates:
-
We currently have promotions for Staycations. Visit cysuites.com/offers for details or email us at sales@cysuites.com;
Money Markets, T-Bills Primary Auction:
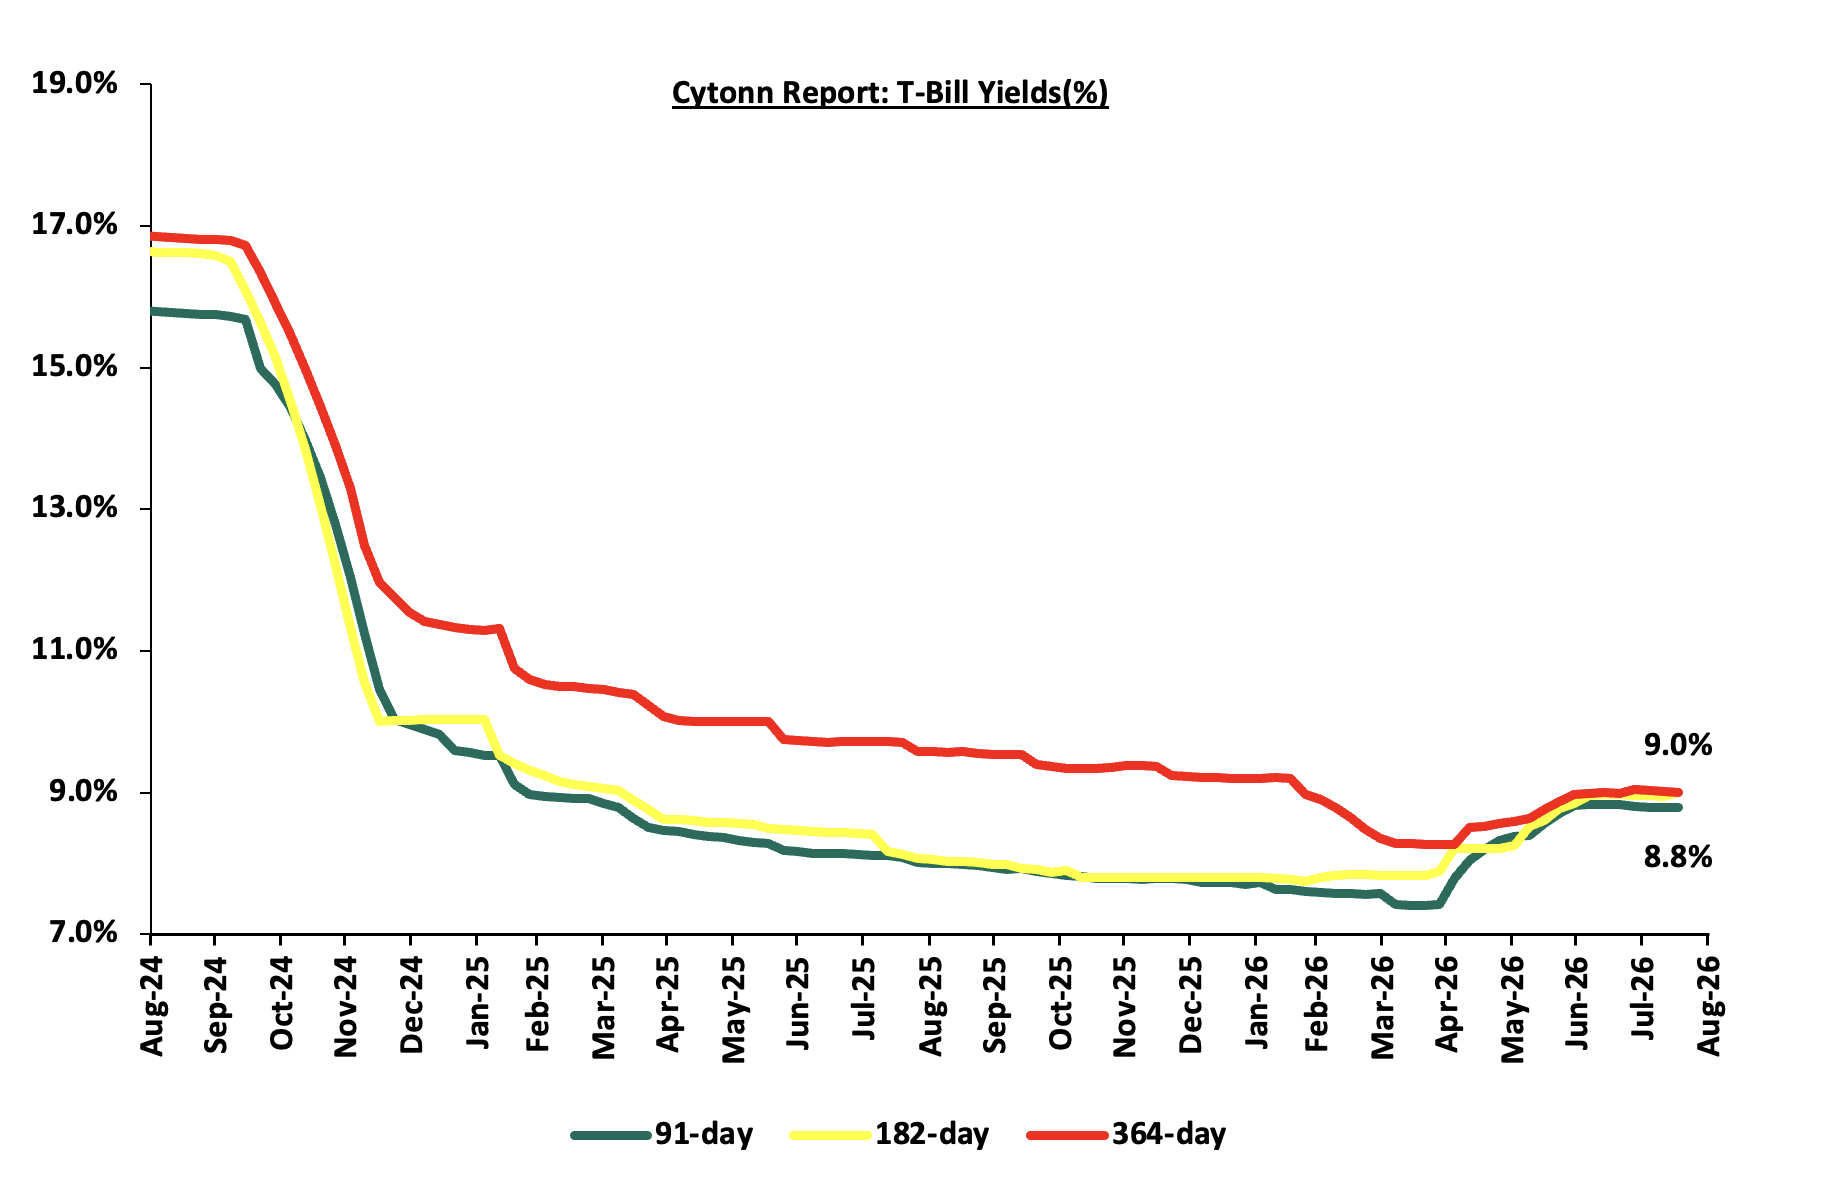
This week, T-bills were oversubscribed for the second consecutive week, with the overall subscription rate coming in at 145.7% higher than the subscription rate of 107.0%, recorded the previous week. Investors’ preference for the shorter 91-day paper persisted, with the paper receiving bids worth Kshs 18.2 bn against the offered Kshs 8.0 bn, translating to a subscription rate of 228.0%, higher than the subscription rate of 169.9%, recorded the previous week. The subscription rate for the 182-day paper decreased marginally to 89.9% from 101.7% recorded the previous week, while that of the 364-day paper increased to 135.6% from 62.1% recorded the previous week. The government accepted a total of Kshs 37.0 bn worth of bids out of Kshs 40.8 bn bids received, translating to an acceptance rate of 90.8%. The yields on the government papers showed a mixed performance with the yields on the 364-day paper increasing the most by 3.2 bps to 9.04% from 9.00% recorded the previous week. The yields on the 182-day paper remained relatively unchanged at 9.0% while that of the 91-day paper decreased by 0.9 bps to 8.77% from 8.78% recorded the previous week.
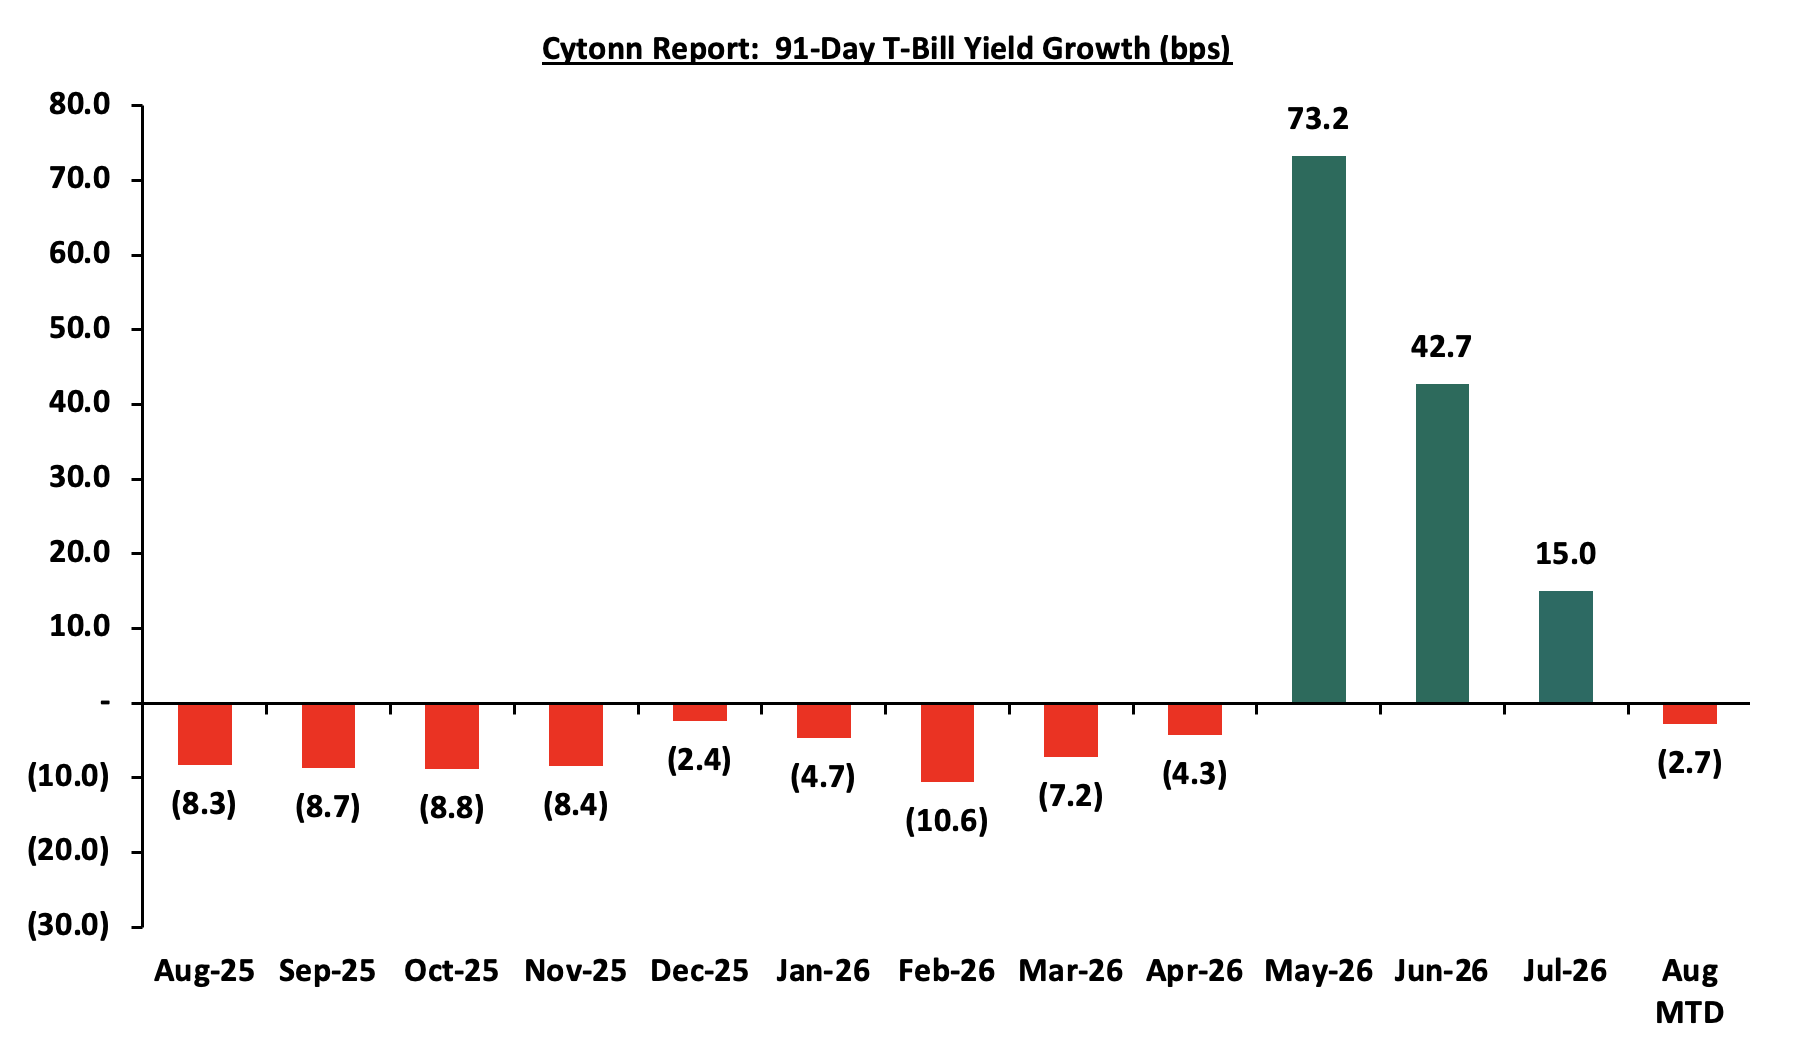
The chart below shows the yield growth rate for the 91-day paper from August 2025 to date:
The chart below shows the performance of the 91-day, 182-day and 364-day papers from August 2024 to August 2026:
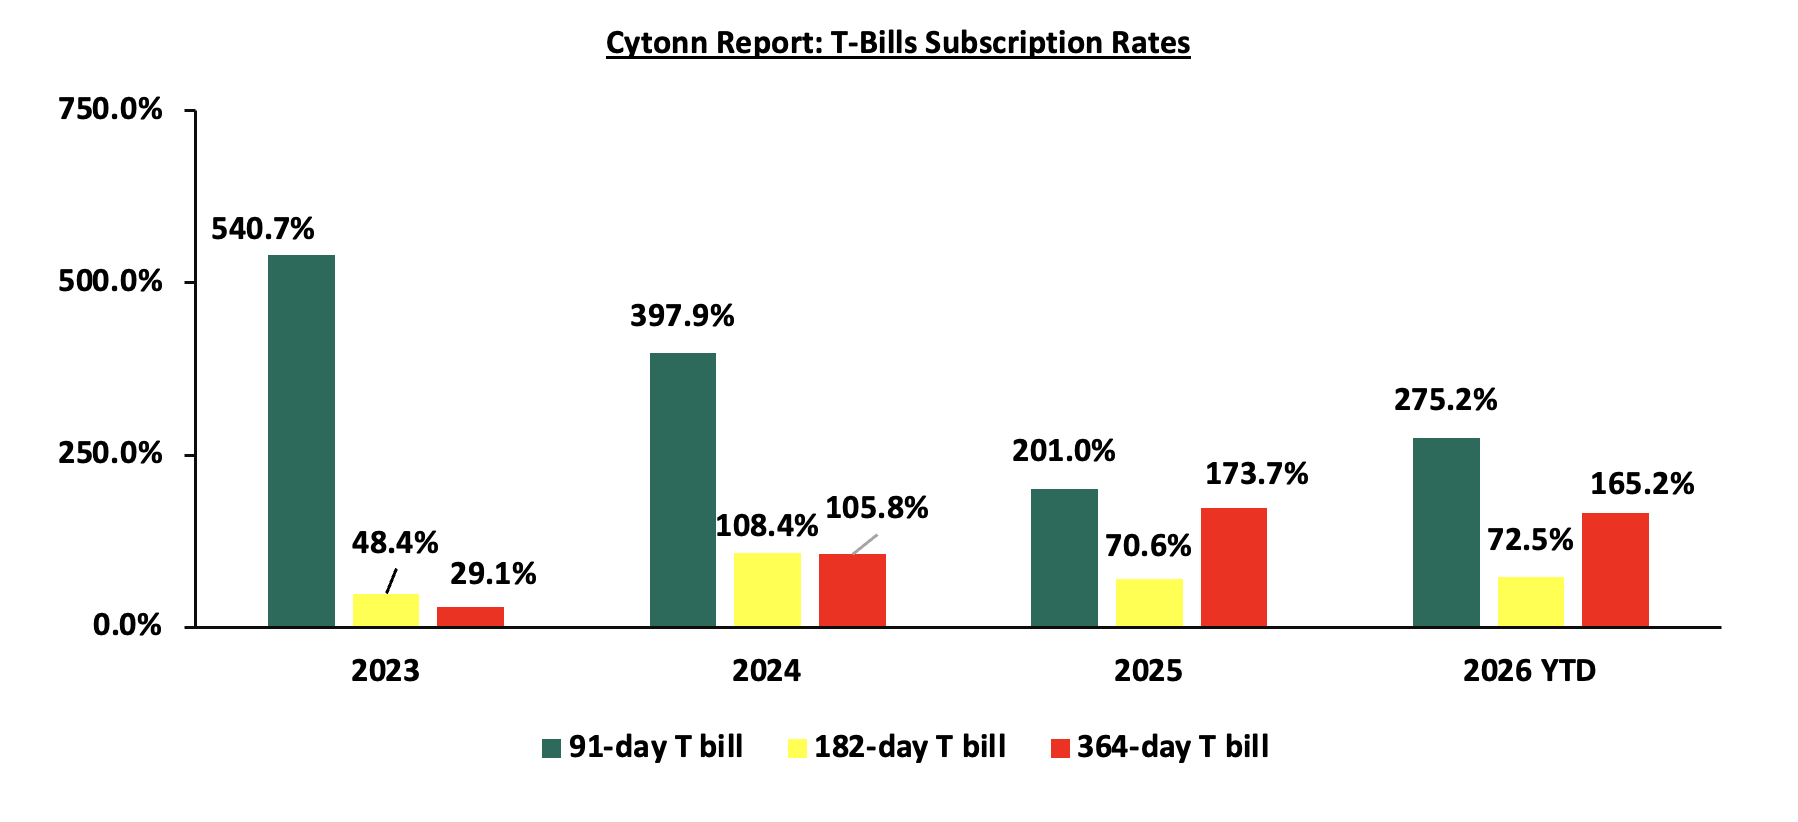
The chart below compares the overall average T-bill subscription rates obtained in 2023, 2024, 2025 and 2026 Year-to-date (YTD):
T-Bonds Primary Auction:
During the week, the Central Bank of Kenya released the auction results for the re-opened treasury bonds IFB1/2019/016, IFB1/2021/018 and IFB1/2021/021 with tenors to maturities of 9.3 years, 12.7 years and 16.2 years respectively and fixed coupon rates of 11.8%, 12.7% and 12.7% respectively. The bonds were oversubscribed, with the overall subscription rate coming in at 306.9%, receiving bids worth Kshs 460.4 bn against the offered Kshs 150.0 bn. The government accepted bids worth Kshs 3120 bn, translating to an acceptance rate of 67.8%. The weighted average yield for the accepted bids for IFB1/2019/016, IFB1/2021/018 and IFB1/2021/021 came in at 12.2%, 12.7% and 13.1% respectively. Notably the 12.2% on IFB1/2019/016 was lower than the 12.4% recorded in October 2019 when it was issued. However, the 13.1% for IFB1/2021/018 was higher than the 12.7% recorded in September 2021 when it was issued and the 12.7% for IFB1/2021/018 remain unchanged from April 2021 when it was issued. With the Inflation rate at 6.5% as of July 2026, the real returns of the IFB1/2021/021, IFB1/2021/018 and IFB1/2019/016 are 6.6%, 6.2% and 5.7%. Given that these infrastructure bonds are completely tax-exempt, the tax equivalent yields for ordinary government bonds with a 10.0% withholding tax are 14.6% for IFB1/2021/021, 14.1% for IFB1/2021/018, and 13.6% for IFB1/2019/016.
Money Market Performance:
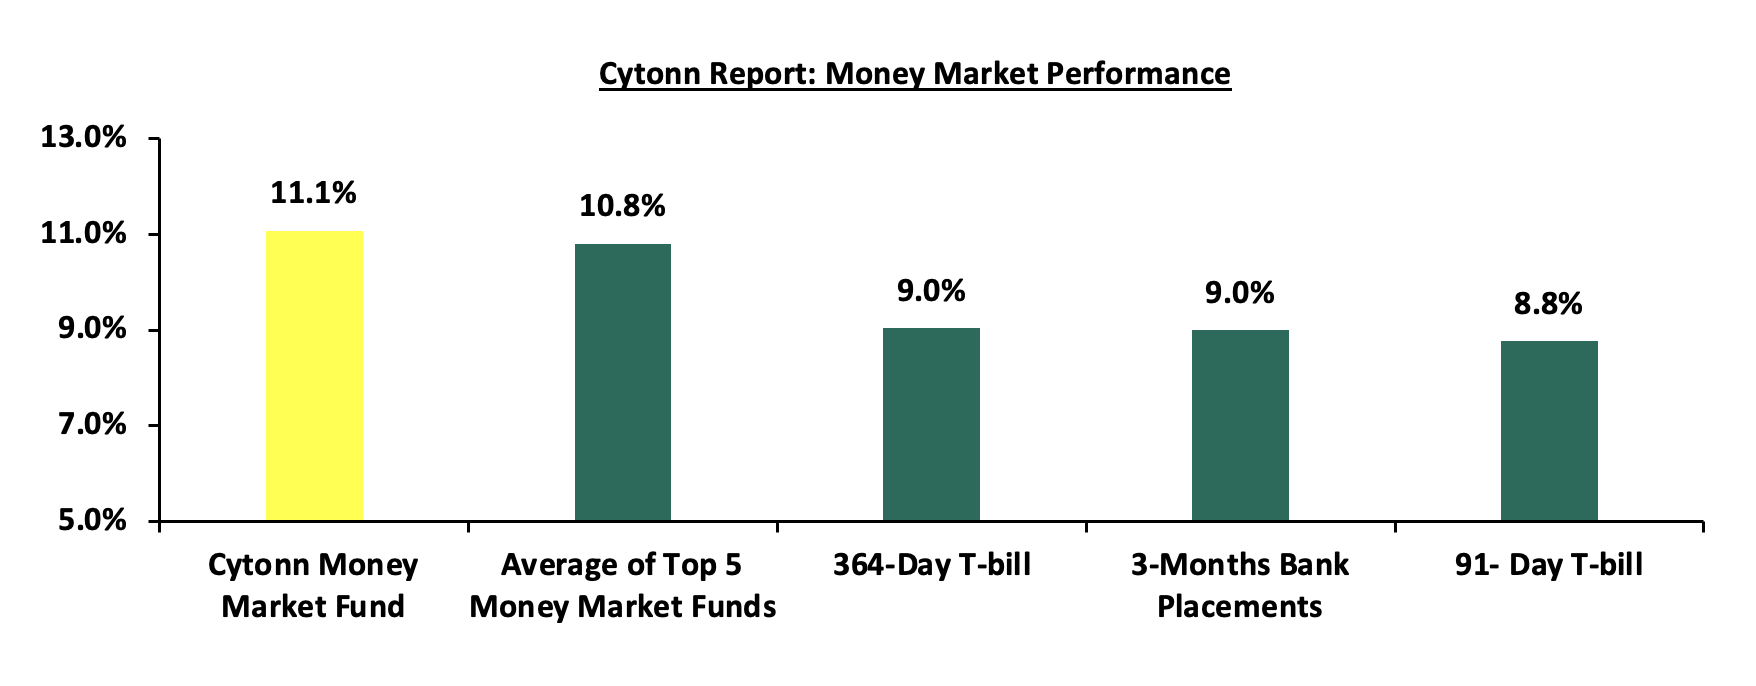
In the money markets, 3-month bank placements ended the week at 9.0% (based on rates offered by various banks). The yields on the government papers showed a mixed performance with the yields on the 364-day paper increasing by 3.2 bps to 9.04% from 9.00% recorded the previous week, while that of the 91-day paper decreased by 0.9 bps to 8.77% from 8.78% recorded the previous week. The yield on the Cytonn Money Market Fund decreased by 3.0 bps to 11.08% from 11.11% recorded the previous week, while the average yields on the Top 5 Money Market Funds decreased by 15.6 bps to 10.8% from 11.0% recorded the previous week.
The table below shows the Money Market Fund Yields for Kenyan Fund Managers as published on 14th August 2026:
|
Money Market Fund Yield for Fund Managers as published on 14th August 2026 |
||
|
Rank |
Fund Manager |
Effective Annual Rate |
|
1 |
Cytonn Money Market Fund (Dial *809# or download Cytonn App) |
11.08% |
|
2 |
Nabo Africa Money Market Fund |
10.89% |
|
3 |
Faulu Money Market Fund |
10.84% |
|
4 |
Arvocap Money Market Fund |
10.62% |
|
5 |
Madison Money Market Fund |
10.61% |
|
6 |
Enwealth Money Market Fund |
10.61% |
|
7 |
Lofty-Corban Money Market Fund |
10.58% |
|
8 |
Etica Money Market Fund |
10.55% |
|
9 |
Kuza Money Market fund |
10.51% |
|
10 |
Ndovu Money Market Fund |
10.48% |
|
11 |
Globetec Money Market Fund |
10.41% |
|
12 |
British-American Money Market Fund |
10.31% |
|
13 |
Old Mutual Money Market Fund |
10.30% |
|
14 |
Jubilee Money Market Fund |
10.15% |
|
15 |
Orient Kasha Money Market Fund |
10.13% |
|
16 |
Gulfcap Money Market Fund |
10.11% |
|
17 |
GenAfrica Money Market Fund |
9.93% |
|
18 |
SanlamAllianz Money Market Fund |
9.64% |
|
19 |
Apollo Money Market Fund |
9.37% |
|
20 |
KCB Money Market Fund |
9.15% |
|
21 |
Dry Associates Money Market Fund |
9.05% |
|
22 |
CPF Money Market Fund |
8.83% |
|
23 |
Genghis Money Market Fund |
8.47% |
|
24 |
CIC Money Market Fund |
8.32% |
|
25 |
Co-op Money Market Fund |
7.99% |
|
26 |
ICEA Lion Money Market Fund |
7.98% |
|
27 |
Mali Money Market Fund |
7.98% |
|
28 |
Mayfair Money Market Fund |
7.96% |
|
29 |
AA Kenya Shillings Fund |
7.90% |
|
30 |
Absa Shilling Money Market Fund |
7.40% |
|
31 |
Ziidi Money Market Fund |
5.98% |
|
32 |
Equity Money Market Fund |
|
Source: Business Daily
Liquidity:
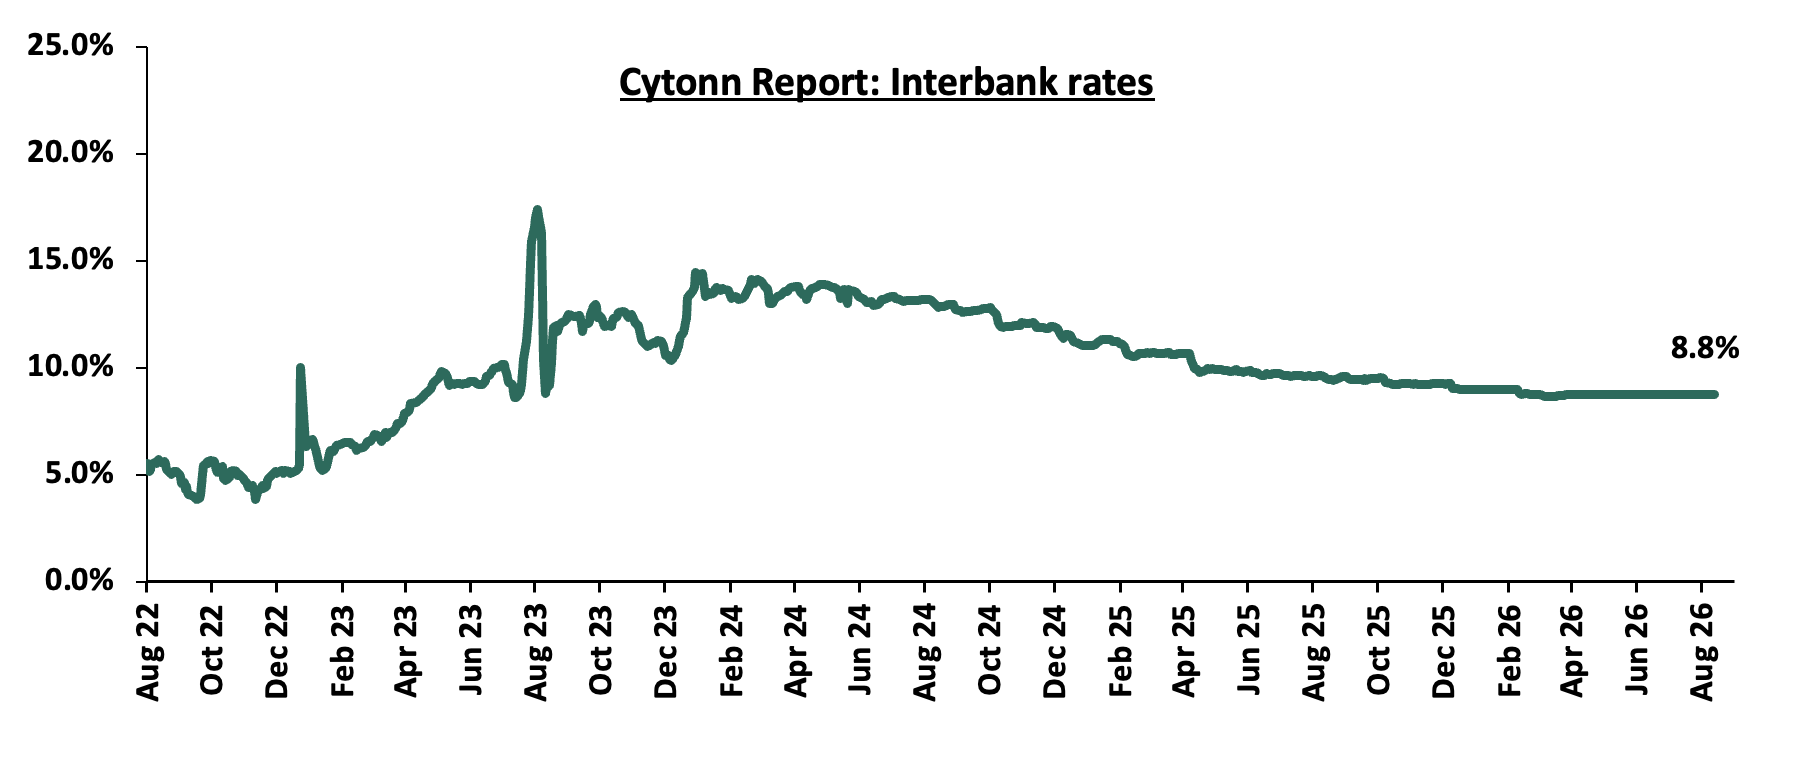
During the week, liquidity in the money markets remained stable with the average interbank rate remaining relatively unchanged at 8.8% recorded last week. The average interbank volumes traded increased by 40.3% to Kshs 18.8 bn from Kshs 13.4 bn recorded the previous week. The chart below shows the interbank rates in the market over the years:
Kenya Eurobonds:
During the week, the yields on the Eurobonds recorded a mixed performance with the yield on the 30-year Eurobond issued in 2018, increasing the most by 10.8 bps to 8.9% from 8.8% recorded the previous week, while the 10-year Eurobond issued in 2018 decreased the most by 19.5 bps to 6.6% from 6.7% recorded the previous week. The table below shows the summary performance of the Kenyan Eurobonds as of 13th August 2026:
|
Cytonn Report: Kenya Eurobonds Performance |
||||||
|
2018 |
2019 |
2021 |
2024 |
|||
|
Date |
10-year issue |
30-year issue |
12-year issue |
13-year issue |
7-year issue |
|
|
02-Jan-26 |
6.1% |
8.8% |
7.2% |
7.8% |
7.1% |
|
|
03-Aug-26 |
7.0% |
9.0% |
8.0% |
8.5% |
7.7% |
|
|
06-Aug-26 |
6.7% |
8.8% |
7.5% |
7.9% |
7.3% |
|
|
07-Aug-26 |
6.7% |
8.8% |
7.5% |
7.9% |
7.3% |
|
|
10-Aug-26 |
6.8% |
8.8% |
7.6% |
8.0% |
7.4% |
|
|
11-Aug-26 |
6.7% |
8.9% |
7.6% |
8.0% |
7.4% |
|
|
12-Aug-26 |
6.7% |
8.9% |
7.6% |
8.0% |
7.4% |
|
|
13-Aug-26 |
6.6% |
8.9% |
7.5% |
7.9% |
7.3% |
|
|
Weekly Change |
(0.2%) |
0.1% |
(0.0%) |
(0.0%) |
(0.1%) |
|
|
MTD Change |
(0.4%) |
(0.2%) |
(0.5%) |
(0.6%) |
(0.5%) |
|
|
YTD Change |
0.5% |
0.0% |
0.3% |
0.1% |
0.2% |
|
Source: Central Bank of Kenya (CBK) and National Treasury
Kenya Shilling:
During the week, the Kenya Shilling appreciated marginally against the US Dollar by 12.4 bps to Kshs 129.2 from Kshs 129.4 recorded the previous week. On a year-to-date basis, the shilling has depreciated by 13.9 bps against the dollar, as compared to the 22.9 bps appreciation recorded in 2025.
We expect the shilling to be supported by:
-
Diaspora remittances standing at a cumulative USD 4,986.9 mn in the twelve months to July 2026, slightly lower than the USD 5,079.9 mn recorded over the same period in 2025. These have continued to cushion the shilling against further depreciation. In the July 2026 diaspora remittances figures, North America remained the largest source of remittances to Kenya accounting for 51.6% in the period,
-
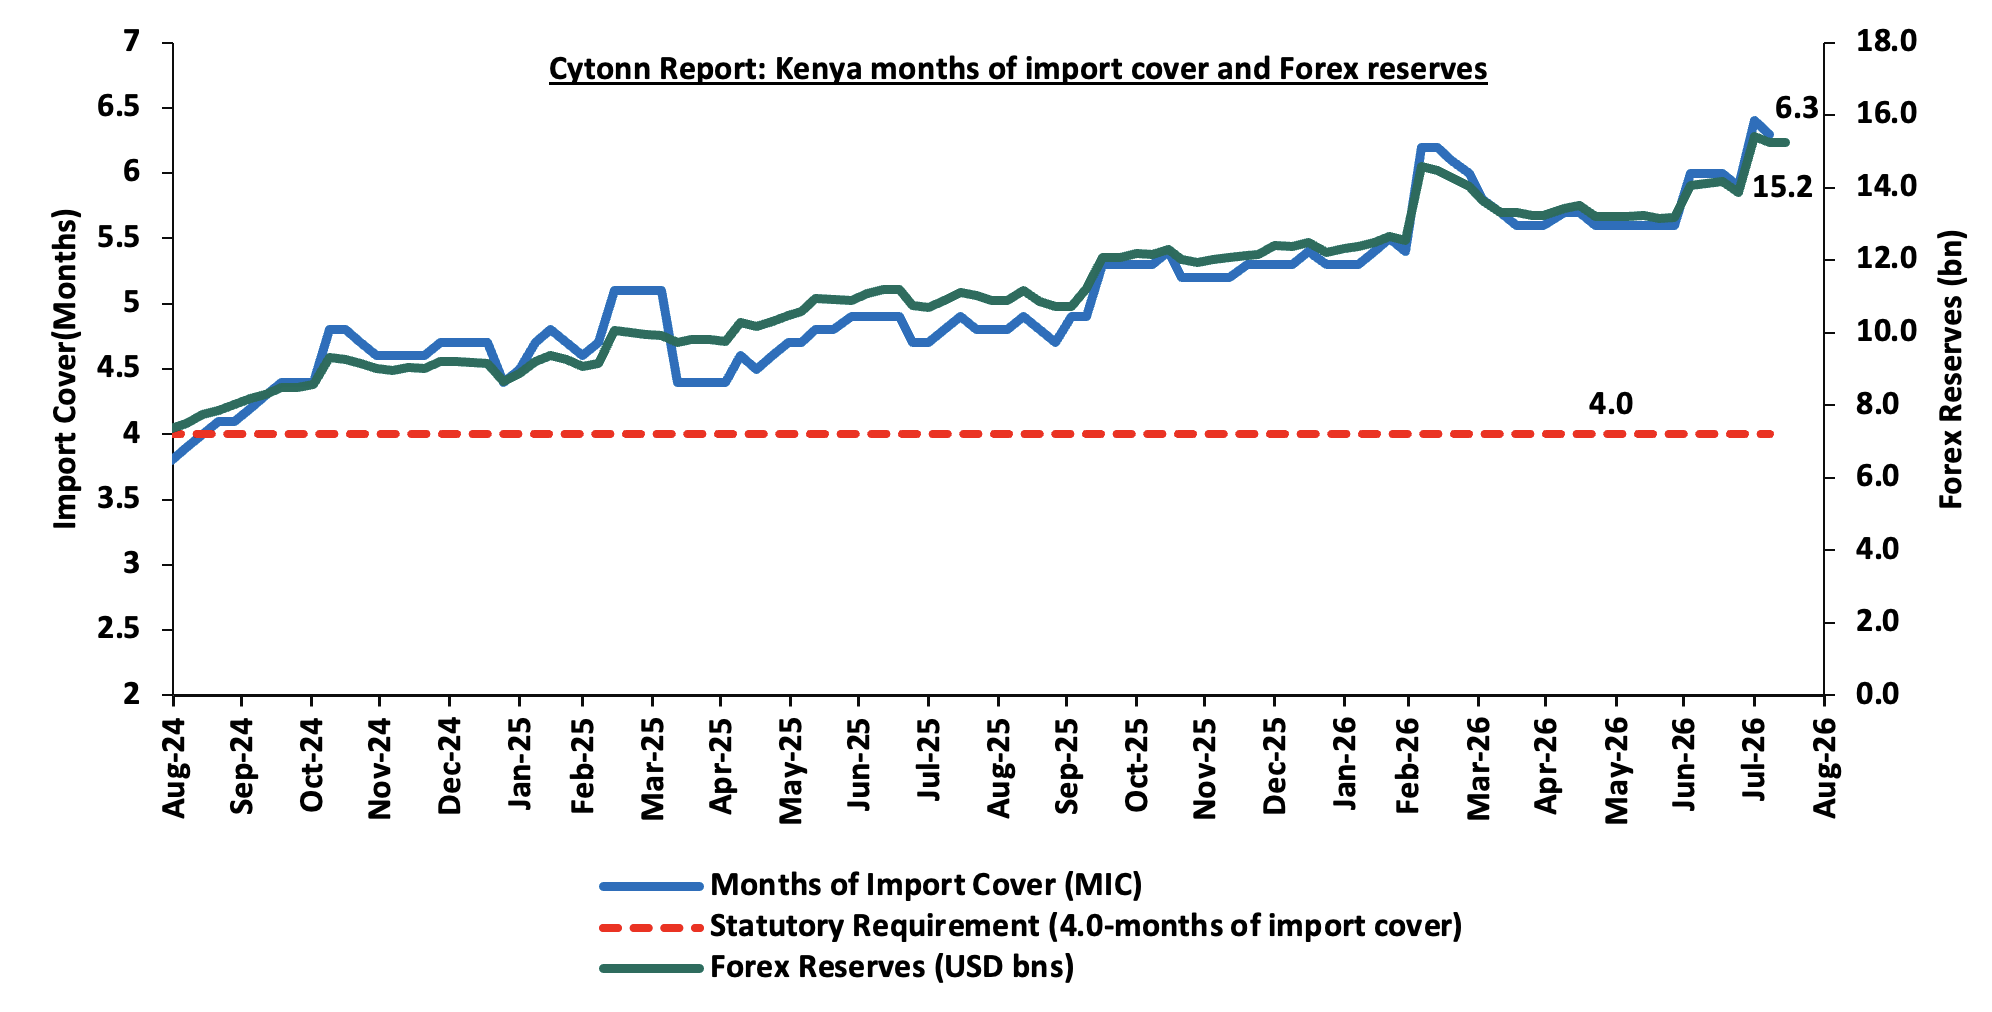
Improved forex reserves currently at USD 15.2 bn (equivalent to 6.3-months of import cover), which is above the statutory requirement of maintaining at least 4.0-months of import cover and above the EAC region’s convergence criteria of 4.5-months of import cover.
The shilling is however expected to remain under pressure in 2026 as a result of:
-
An ever-present current account deficit which widened to 3.0% of GDP in the 12 months to June 2026 compared to 1.9% of GDP in a similar period in 2025 and,
-
The need for government debt servicing, continues to put pressure on forex reserves given that 54.8% of Kenya’s external debt is US Dollar-denominated as of June 2026.
-
Rising geopolitical tensions in the Middle East, which could exert pressure on the shilling through higher global oil prices and increased uncertainty in international markets. Given that Kenya is a net importer of petroleum products, any sustained increase in oil prices would widen the import bill, increase demand for US Dollars, and consequently put depreciation pressure on the shilling
Kenya’s forex reserves decreased by 0.02% during the week to remain relatively unchanged from USD 15.2 bn recorded the previous week, equivalent to 6.3 months of import cover, and above the statutory requirement of maintaining at least 4.0-months of import cover.
The chart below summarizes the evolution of Kenya's months of import cover over from August 2024 to August 2026:
Weekly Highlights
-
Fuel Prices effective 15th August – 14th September 2026
During the week, the Energy and Petroleum Regulatory Authority (EPRA) released its monthly statement on the maximum retail fuel prices in Kenya, effective from 15th August 2026 to 14th September 2026. Notably, the maximum allowed price for Diesel decreased by Kshs 5.0 per litre to Kshs 217.9 from Kshs 222.9, while the prices of Super Petrol and Kerosene remained unchanged at Kshs 214.0 and Kshs 191.4 per litre, respectively, due to additional Government Stabilization Support Measures of Kshs 938.0.
Other key take-outs from the performance include,
-
The average landed cost per cubic metre of Super Petrol increased by 7.0% to USD 948.9 in July 2026 from USD 886.9 in June 2026, while the landed costs of Diesel and Kerosene decreased by 13.1% and 11.0% to USD 855.6 and USD 915.0, respectively, from USD 984.4 and USD 1,028.2 in June 2026.
-
The Kenyan Shilling depreciated marginally by 2.0 bps against the US Dollar to Kshs 129.74 in July 2026 from Kshs 129.72 in June 2026.
-
The Authority's calculations incorporated Value Added Tax and other applicable taxes and levies, while the Government utilized an additional Kshs 938.0 mn in stabilization measures to cushion consumers from higher petroleum costs and support the reduction in Diesel prices.
-
International petroleum prices increased across all three products in July 2026. The prices of Super Petrol, Diesel and Kerosene increased by 8.9%, 13.2% and 11.8% to USD 1,032.8, USD 1,006.6 and USD 1,063.7 per cubic metre, respectively, from USD 948.7, USD 889.6 and USD 951.5 in June 2026.
Going forward, the outlook for fuel prices remains cautious. While the reduction in Diesel prices is expected to provide some relief to businesses and consumers, particularly given Diesel's importance as an input in transportation, manufacturing, agriculture and logistics, the increase in international petroleum prices presents an upside risk to future pump prices. The relatively stable exchange rate provides some cushion against imported inflation, although sustained increases in global oil prices could increase the import bill and exert pressure on the exchange rate. Consequently, continued Government intervention through the fuel price stabilization mechanism will remain important in cushioning consumers from global oil price volatility, while developments in international petroleum prices and the exchange rate will remain key determinants of the domestic fuel price and inflation outlook.
-
August 2026 Monetary Policy Committee (MPC) Meeting Highlight
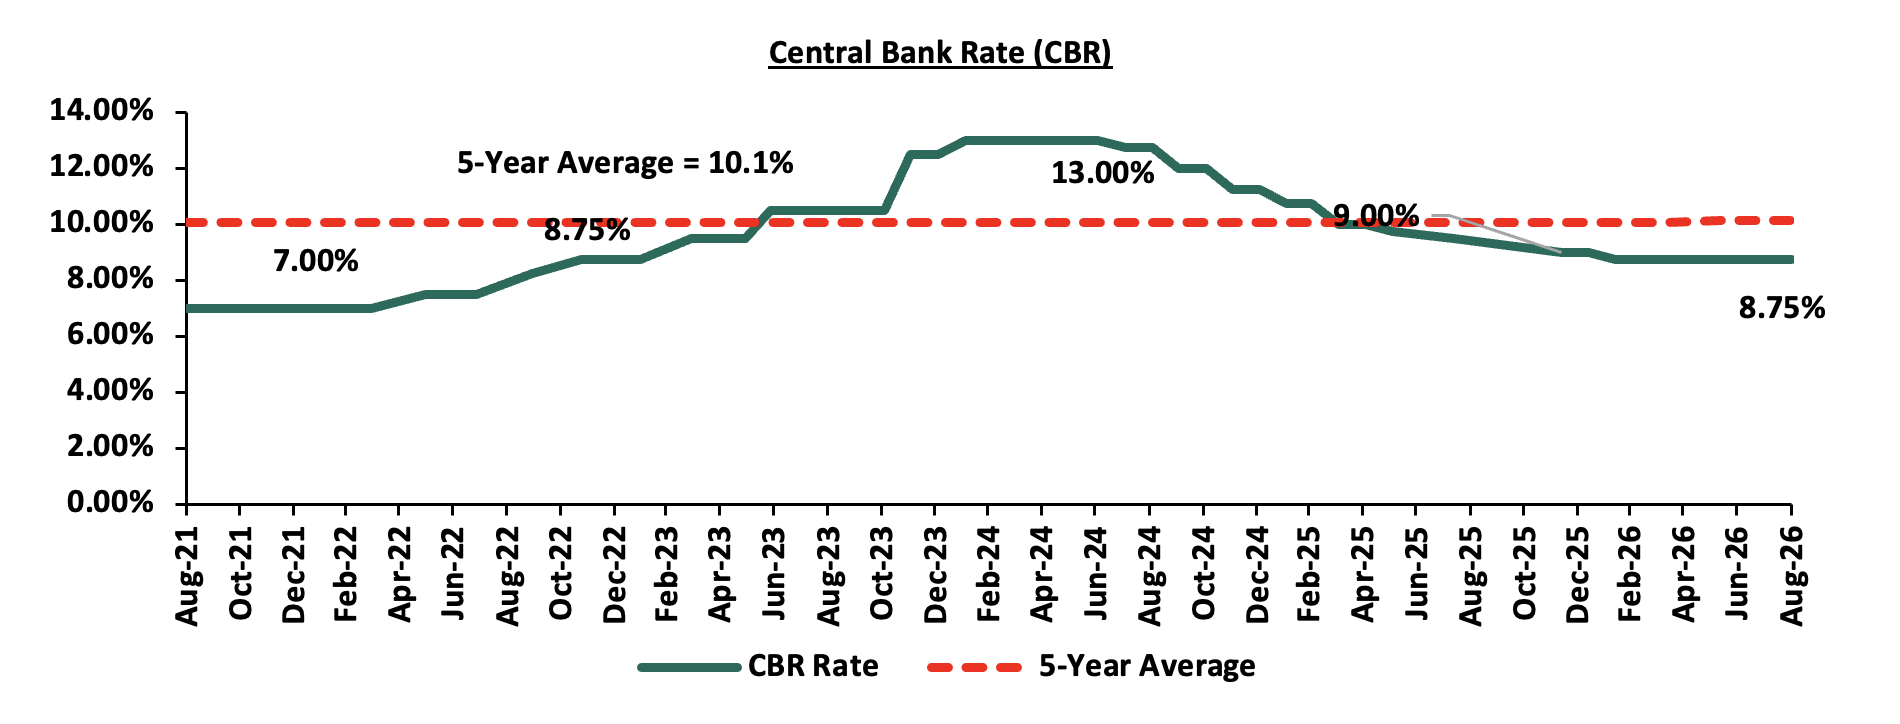
The Monetary Policy Committee (MPC) met on 11th August, 2026, to review the outcome of its previous policy decisions and decided to maintain the Central Bank Rate (CBR) at 8.75%, unchanged from the June 2026 meeting. The decision was in line with our expectation of the MPC maintaining the CBR at 8.75%. Notably, inflation remained within the CBK preferred range of 2.5%-7.5% for the thirty-seventh consecutive month, increasing marginally by 0.1% points to 6.5% in July 2026, from 6.4% in June 2026. Below are some of the key highlights from the August 2026 meeting:
-
Overall inflation remained within the CBK preferred range of 2.5%-7.5% in July 2026, increasing marginally to 6.5% from 6.4% in June 2026. Core inflation remained relatively stable at 3.2% in July, compared to 3.1% in June, while non-core inflation declined to 15.0% from 15.1%, mainly supported by lower energy prices, government interventions including subsidies and the temporary reduction of VAT on fuel. However, food inflation remained elevated due to higher prices of vegetables, particularly Irish potatoes, tomatoes, kales, cabbages and onions. Overall inflation is expected to remain within the target range in the near term, assuming a de-escalation of the conflict in the Middle East, supported by appropriate monetary policy actions, government interventions, expected stability in food prices and a stable exchange rate.
-
The growth of the Kenyan economy accelerated to 5.3% in the first quarter of 2026, compared to 4.9% in the first quarter of 2025, reflecting broad-based growth across all sectors of the economy, with stronger growth in the industry and services sectors. The economy is projected to grow by 4.9% in 2026 and 5.3% in 2027, compared to 4.6% in 2025. The outlook is supported by a robust industrial sector, resilient services and stable agricultural growth. However, the growth outlook remains subject to risks arising from a prolonged conflict in the Middle East, elevated trade policy uncertainties and the potential adverse effects of the El Niño weather phenomenon.
-
The current account deficit is estimated at 3.0% of GDP in the 12 months to June 2026, compared to 1.9% of GDP in a similar period in 2025, mainly due to a higher trade deficit and lower secondary income transfers. Goods exports increased by 8.9%, driven mainly by horticulture, tea, and machinery and transport equipment, while goods imports increased by 13.1%, reflecting higher imports of food, mineral fuels, and intermediate and capital goods. Services receipts increased by 8.3%, mainly supported by travel services receipts, while diaspora remittances declined by 2.4%. The current account deficit is projected at 3.0% of GDP in 2026, compared to 2.1% in 2025, mainly reflecting increased imports of mineral fuels due to higher international oil prices, lower remittances and export receipts. The deficit is expected to be more than fully financed by financial and capital account inflows, resulting in an overall balance of payments surplus of USD 2.485 billion in 2026. CBK foreign exchange reserves stood at USD 15.249 billion, equivalent to 6.3 months of import cover, providing an adequate buffer against short-term domestic and external shocks.
-
The banking sector remains stable and resilient, with strong liquidity and capital adequacy ratios. The ratio of gross non-performing loans (NPLs) to gross loans stood at 14.6% in July 2026, down from 15.4% in April 2026 and 17.6% in August 2025. Decreases in NPLs were noted in the manufacturing, building and construction, trade, agriculture and real estate sectors. Banks have continued to make adequate provisions for NPLs.
-
Growth in commercial banks’ lending to the private sector remained strong at 10.2% in July 2026, despite the decline from 10.6% in June 2026 and -2.9% in January 2025. Credit growth to key sectors of the economy, particularly trade, building and construction, agriculture and consumer durables, remained strong, reflecting improved demand for credit in line with declining lending interest rates. Average commercial banks’ lending rates declined to 14.3% in July 2026 from 14.4% in June 2026 and 17.2% in November 2024.
-
The CEOs Survey and Market Perceptions Survey conducted in July 2026 revealed sustained optimism regarding business activity and economic growth prospects over the next 12 months. The optimism was attributed to continued macroeconomic stability, Government support for the agriculture sector, prospects for favourable weather conditions, increased infrastructure spending, increased digital innovations, a stable exchange rate and improved private sector credit growth. Nevertheless, respondents remained concerned about elevated global uncertainties arising from the conflict in the Middle East and high energy costs.
-
A majority of respondents to the July 2026 Agriculture Sector Survey expect inflation to remain within the target range in the near term, supported by stable food and fuel prices and exchange rate stability. However, some respondents expect moderate upward pressure on inflation due to concerns over higher energy prices arising from elevated international oil prices following the conflict in the Middle East.
-
Global growth is projected to moderate to 3.0% in 2026 from 3.5% in 2025, mainly due to higher energy prices arising from the conflict in the Middle East. Other key risks to global growth include elevated trade policy uncertainty and the Russia-Ukraine conflict. Global inflation is expected to increase to 4.7% in 2026 from 4.1% in 2025 on account of higher energy prices and transport costs. Inflation rates in most major economies have increased in recent months and remained above their respective targets due to higher energy prices and persistent core inflation. Central banks in most major economies have maintained their policy rates as they continue to assess the impact of the Middle East conflict on their inflation and growth outlooks.
-
The Committee noted the outcome of the implementation of the FY2025/26 Supplementary Budget II, the Budget for FY2026/27, and the planned fiscal consolidation strategy aimed at reducing debt vulnerabilities over the medium term.
The MPC noted that maintaining the Central Bank Rate (CBR) at 8.75% remains appropriate to ensure that inflation expectations remain anchored within the target range and the exchange rate remains stable. The Committee emphasized the need to continue monitoring the evolution of global oil prices and any second-round effects on inflation, as well as other developments in the global and domestic economies, and remains ready to take further action as necessary in line with its mandate. Going forward, we expect the MPC to maintain a cautious approach to monetary policy adjustments, balancing the need to anchor inflation expectations and support exchange rate stability and private sector credit growth, while monitoring the effects of the Middle East conflict and global energy prices. The next MPC meeting is scheduled for October 2026.
-
2026 Budget Review and Outlook Paper (BROP) Highlight
The National Treasury published the 2026 Budget Review and Outlook Paper (BROP), providing a review of the FY’2025/26 budget implementation and updated macroeconomic and fiscal projections for FY’2026/27 and the medium term. The BROP was prepared against a backdrop of heightened global uncertainty, particularly the ongoing conflict in the Middle East, which has disrupted energy markets and international shipping routes and increased volatility in energy and commodity prices. The Government revised its 2026 economic growth projection downwards to 5.0%, from 5.3% previously, while growth is projected at 5.1% in 2027. The lower growth outlook has also resulted in downward revisions to revenue projections, highlighting continued pressure on the Government's fiscal position. Below are some of the key highlights from the 2026 BROP:
-
The Treasury revised its FY2026/27 tax revenue target downwards by 2.8% to Kshs 2,777.3 bn, from the Kshs 2,858.7 bn projected in the 2026 Budget Policy Statement (BPS). The downward revision reflects the weaker economic growth outlook, with real GDP growth for 2026 revised to 5.0% from the previous projection of 5.3%, mainly due to the impact of the Middle East conflict on domestic economic activity. The revision highlights the continued challenge of achieving ambitious revenue targets amid a constrained economic environment.
-
Income tax recorded the largest downward revision, with the FY2026/27 target reduced by 5.7% to Kshs 1,305.0 bn from Kshs 1,383.6 bn previously. The reduction is mainly attributable to lower expected collections from corporate income tax and Pay-As-You-Earn (PAYE), reflecting the anticipated moderation in economic activity. VAT projections were also revised downwards by 2.3% bn to Kshs 810.3 bn from Kshs 829.2 bn, while excise duty collections were reduced by 4.6% to Kshs 364.8 bn from Kshs 382.2 bn. Other tax revenue was revised downwards to Kshs 76.4 bn from Kshs 77.4 bn.
-
Import duty was the only major tax category to record an upward revision, increasing by 18.6% to Kshs 220.8 bn from Kshs 186.2 bn. The upward revision comes against expectations of higher import values, particularly amid elevated global commodity and energy prices. However, higher import-related revenues could be accompanied by an increase in the import bill, particularly if international oil prices remain elevated, potentially exerting pressure on the current account and exchange rate.
-
The FY2026/27 expenditure framework is expected to remain constrained by the Government's fiscal consolidation agenda, with the Zero-Based Budgeting approach being entrenched to improve expenditure efficiency. Ministries, Departments and Agencies will be required to justify their expenditure proposals and align them with national development priorities, while Sector Working Groups will scrutinize programmes and projects to ensure that available resources are directed towards high-impact interventions. This approach is expected to contain non-priority spending, improve allocation of resources and support the Government's efforts to reduce fiscal pressures while maintaining funding for key development programmes.
-
For FY2027/28, total expenditure and net lending is projected at Kshs 5,322.9 bn, equivalent to 23.1% of GDP, comprising recurrent expenditure of Kshs 3,887.2 bn, equivalent to 16.8% of GDP, development expenditure of Kshs 958.0 bn, equivalent to 4.2% of GDP, transfers to Counties of Kshs 472.8 billion and Kshs 5.0 bn for the Contingency Fund. The resulting fiscal deficit, including grants, is projected at Kshs 1,321.0 bn, equivalent to 5.7% of GDP.
-
The FY2027/28 expenditure framework reflects the Government's continued focus on expenditure prioritization amid a constrained resource envelope. The Government will entrench the Zero-Based Budgeting approach, requiring Ministries, Departments and Agencies to justify their expenditure proposals, while Sector Working Groups will scrutinize programmes and projects to ensure that available resources are directed towards high-impact interventions that support the Bottom-Up Economic Transformation Agenda, create jobs and improve outcomes for citizen.
-
The Government intends to strengthen revenue mobilization through continued reforms in tax policy and revenue administration, while adopting a more stringent approach to expenditure management. In particular, the Government will entrench a Zero-Based Budgeting approach, requiring Ministries, Departments and Agencies to justify their expenditure proposals and align them with national development priorities. This is expected to improve expenditure efficiency and ensure that limited resources are directed towards high-impact programmes under the Bottom-Up Economic Transformation Agenda (BETA).
-
The BROP also highlights the important contribution of key sectors to tax collections. Manufacturing and energy remained the largest tax-contributing sectors in the year to June 2026, with collections of Kshs 462.0 bn and Kshs 445.0 bn, respectively, representing growth of 9.2% and 9.1%. Combined, the two sectors contributed nearly one-third of KRA collections despite accounting for approximately 27.4% of nominal GDP, underscoring their importance to domestic revenue mobilization and the broader tax base.
The 2026 BROP highlights a challenging fiscal environment, characterized by downward revisions to revenue projections, a sizeable fiscal deficit and continued reliance on domestic borrowing. Going forward, the Government's ability to achieve fiscal consolidation will depend on improving revenue collection, particularly through tax administration reforms and broadening the tax base, while containing recurrent expenditure. The downward revision of the FY2026/27 tax target reflects the risks posed by weaker economic activity, while elevated domestic financing requirements remain a key consideration for the fixed-income market and private-sector credit. Additionally, adverse weather conditions and elevated global oil prices remain key risks to economic growth, inflation, the import bill and the exchange rate.
Rates in the fixed income market have declined MTD, reversing the recent upward trend. The decline comes despite the CBK's decision to pause its rate-cutting cycle at 8.75%, with inflation remaining elevated at 6.5% but within the CBK's target range. The government is 277.1% ahead of its prorated net domestic borrowing target of Kshs 133.0 bn, having a net borrowing position of Kshs 368.6 bn (inclusive of T-bills). We expect investors to maintain a preference for short to medium-term papers as they monitor the pace of government issuance and the path of inflation before committing further out on the curve, with the yield curve likely to remain under upward pressure rather than stabilize, at least until the inflation trajectory becomes clearer.
Market Performance:
During the week, the equities market was on an upward trajectory, with NSE 10, NSE 25, NASI and NSE 20 gaining by 2.3%, 1.5%, 1.3% and 0.6% respectively taking the YTD performance to gains of 31.7%, 31.0%, 29.7% and 27.1% respectively for NSE 20, NSE 10, NSE 25 and NASI respectively. The week-on-week equities market performance was mainly driven by gains recorded by large cap stocks such as Co-op Bank, Equity, and KCB of 7.0%, 5.0% and 2.9% respectively. However, the performance was weighed down by losses recorded by large cap stocks such as BAT, EABL and Stanbic Bank of 4.9%, 4.1% and 1.9% respectively.
During the week, the banking sector index increased by 2.8% to 276.6 from the 269.0 recorded the previous week. This is attributable to gains recorded by large cap stocks such as Co-op Bank, Equity, and KCB of 7.0%, 5.0% and 2.9% respectively. However, the performance was weighed down by losses recorded by large cap stocks such as Stanbic, NCBA and DTB-K of 1.9%, 0.5% and 0.2% respectively.
During the week, equities turnover decreased by 5.9% to USD 30.1 mn from USD 32.0 mn recorded the previous week, taking the YTD total turnover to USD 2,670.9 mn. Foreign investors remained net sellers for the fifth consecutive week with a net selling position of USD 9.1 mn, from a net selling position of USD 3.5 mn recorded the previous week, taking the YTD foreign net selling position to USD 116.8 mn, compared to a net selling position of USD 92.9 mn recorded in 2025.
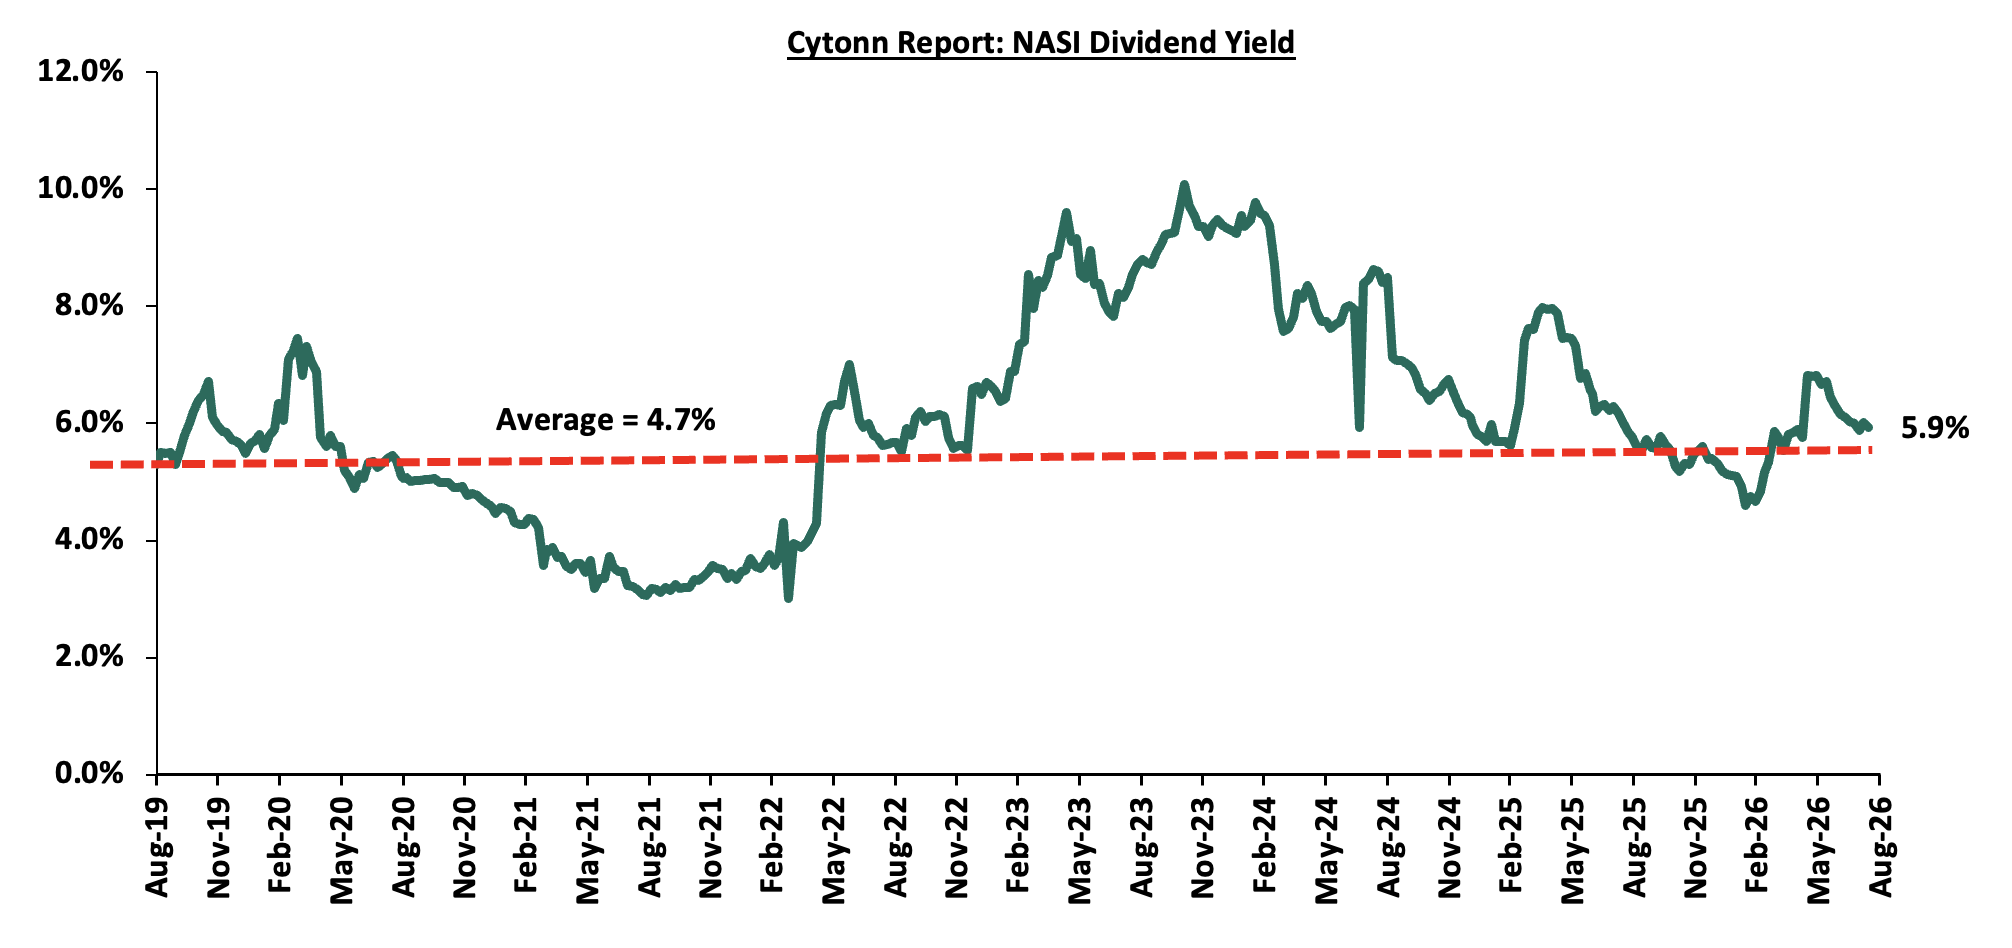
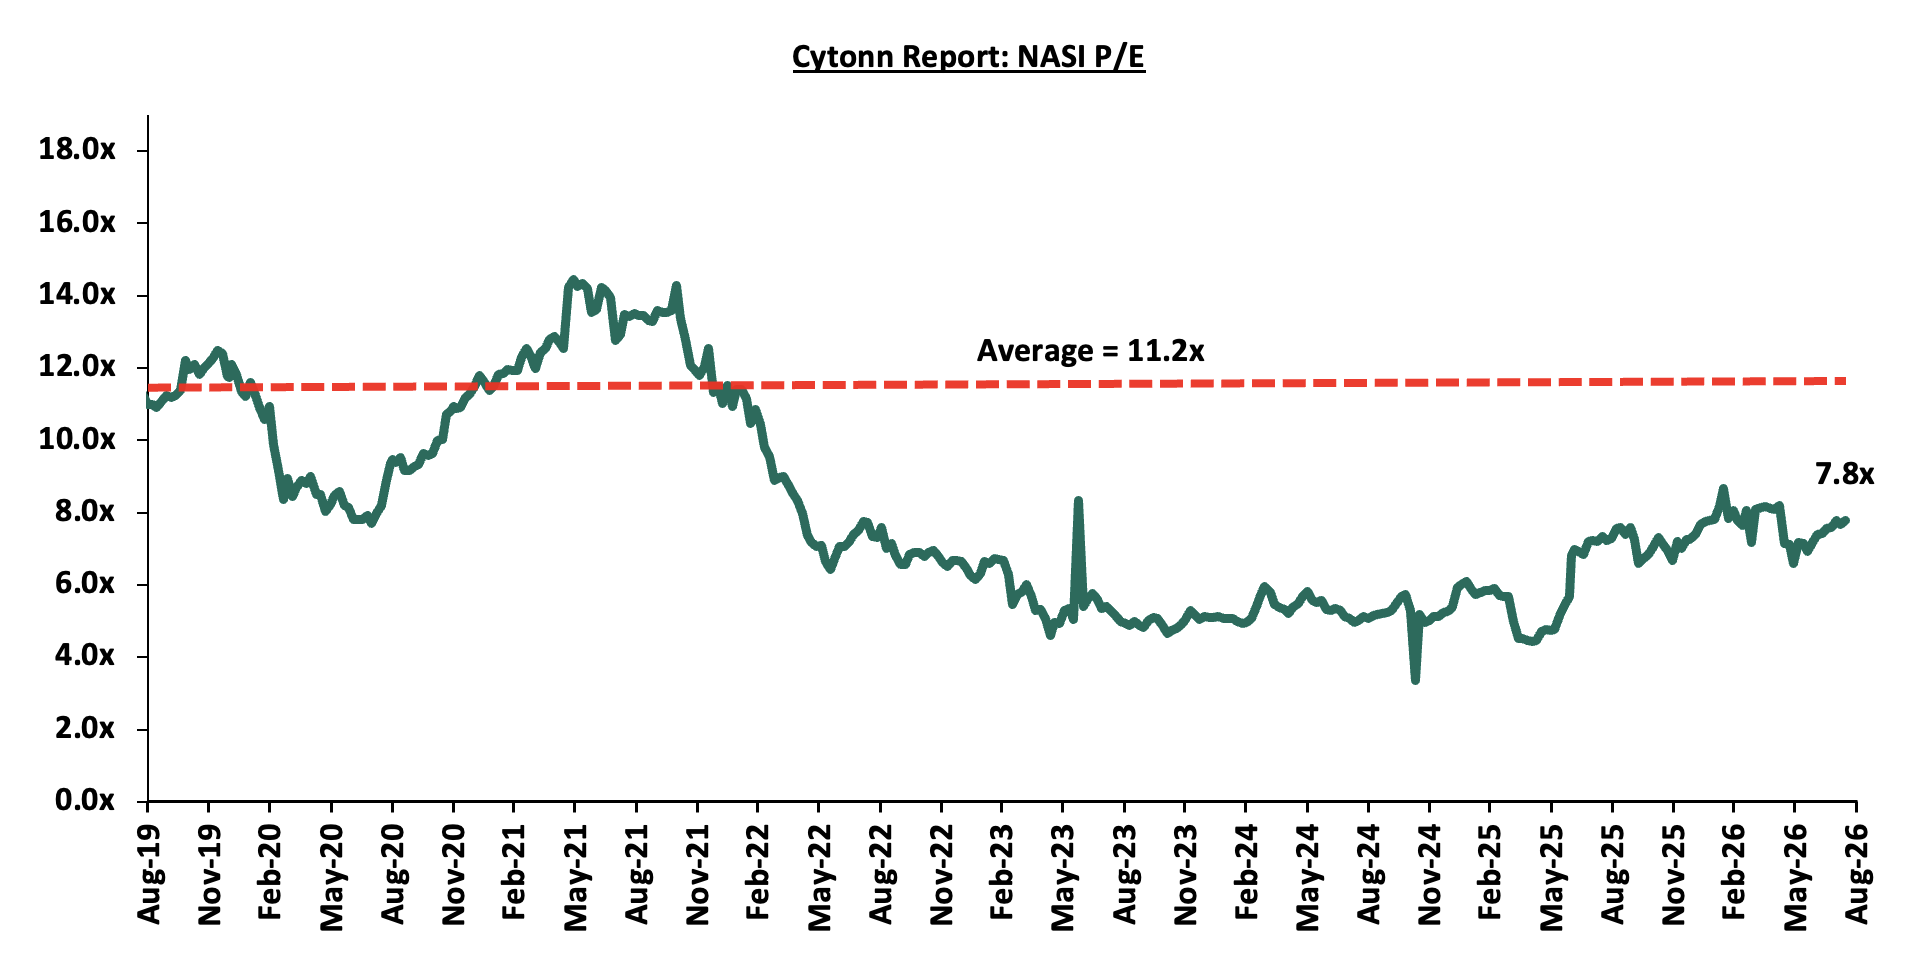
The market is currently trading at a price to earnings ratio (P/E) of 7.8x, 30.6% below the historical average of 11.2x, and a dividend yield of 5.9%, 1.2% points above the historical average of 4.7%. Key to note, NASI’s PEG ratio currently stands at 1.0x, an indication that the market is fairly valued relative to its future growth. A PEG ratio greater than 1.0x indicates the market may be overvalued while a PEG ratio less than 1.0x indicates that the market is undervalued.
The charts below indicate the historical P/E and dividend yields of the market:
Universe of Coverage:
|
Cytonn Report: Equities Universe of Coverage |
|||||||||||
|
Company |
Price as at 7/08/2026 |
Price as at 14/08/2026 |
w/w change |
m/m change |
YTD Change |
Year Open 2026 |
Target Price* |
Dividend Yield |
Upside/ Downside** |
P/TBv Multiple |
Recommendation |
|
KCB Group |
84.8 |
87.3 |
2.9% |
1.5% |
32.7% |
65.8 |
104.4 |
8.0% |
27.7% |
0.9x |
Buy |
|
Co-op Bank |
35.8 |
38.3 |
7.0% |
9.9% |
60.3% |
23.9 |
46.1 |
6.5% |
26.9% |
1.4x |
Buy |
|
NCBA |
92.0 |
91.5 |
(0.5%) |
1.7% |
7.6% |
85.0 |
108.9 |
7.8% |
26.8% |
1.3x |
Buy |
|
Stanbic Holdings |
284.0 |
278.5 |
(1.9%) |
(4.5%) |
40.8% |
197.8 |
300.3 |
8.0% |
15.9% |
1.6x |
Accumulate |
|
ABSA Bank |
33.4 |
34.0 |
1.8% |
2.1% |
36.8% |
24.9 |
36.8 |
6.0% |
14.4% |
1.9x |
Accumulate |
|
Diamond Trust Bank |
154.25 |
154.0 |
(0.2%) |
1.0% |
34.2% |
114.8 |
161.4 |
5.8% |
10.7% |
0.4x |
Accumulate |
|
Standard Chartered Bank |
339.0 |
343.8 |
1.4% |
1.8% |
14.7% |
299.8 |
345.8 |
9.0% |
9.6% |
2.1x |
Hold |
|
CIC Group |
4.7 |
4.7 |
(1.1%) |
(1.1%) |
3.3% |
4.5 |
5.0 |
2.8% |
8.5% |
1.2x |
Hold |
|
Jubilee Holdings |
405.5 |
399.8 |
(1.4%) |
6.1% |
24.0% |
322.5 |
407.5 |
3.8% |
5.7% |
0.6x |
Hold |
|
Britam |
18.5 |
17.7 |
(4.1%) |
1.7% |
95.4% |
9.1 |
18.5 |
0.0% |
4.2% |
1.3x |
Lighten |
|
Equity Group |
85.3 |
89.5 |
5.0% |
3.2% |
33.6% |
67.0 |
87.5 |
6.4% |
4.2% |
1.2x |
Lighten |
|
I&M Group |
68.3 |
69.8 |
2.2% |
3.0% |
63.0% |
42.8 |
67.9 |
5.4% |
2.7% |
1.1x |
Lighten |
|
Family Bank |
31.3 |
31.9 |
2.1% |
1.4% |
77.2% |
18.0 |
31.3 |
3.8% |
1.7% |
1.7x |
Lighten |
|
*Target Price as per Cytonn Analyst estimates **Upside/ (Downside) is adjusted for Dividend Yield ***Dividend Yield is calculated using FY’2025 Dividends |
|||||||||||
Weekly Highlights
-
KCB Bank H1’2026 Financial Performance
During the week, KCB Bank released their H1’2026 financial results, recording a 14.5% increase in profit after tax to Kshs 36.1 bn in H1’2026, from Kshs 31.5 bn in H1’2025;
|
Balance Sheet Items |
H1'2025 |
H1'2026 |
y/y change |
|
Government Securities |
305.1 |
401.3 |
31.5% |
|
Net Loans and Advances |
1,095.4 |
1,240.7 |
13.3% |
|
Total Assets |
1,969.0 |
2,299.4 |
16.8% |
|
Customer Deposits |
1,486.1 |
1,710.8 |
15.1% |
|
Total Liabilities |
1,653.5 |
1,932.4 |
16.9% |
|
Shareholders’ Funds |
306.8 |
357.0 |
16.3% |
|
Deposits per branch |
3.3 |
3.7 |
13.9% |
|
Balance Sheet Ratios |
H1'2025 |
H1'2026 |
% point change |
|
Loan to Deposit Ratio |
73.7% |
72.5% |
(1.2%) |
|
Government Securities to Deposit Ratio |
20.5% |
23.5% |
2.9% |
|
Return on average equity |
23.4% |
22.0% |
(1.5%) |
|
Return on average assets |
3.3% |
3.4% |
0.2% |
|
Income Statement (Kshs Bn) |
H1'2025 |
H1'2026 |
y/y change |
|
Net Interest Income |
69.1 |
74.0 |
7.0% |
|
Net non-Interest Income |
29.5 |
34.1 |
15.4% |
|
Total Operating income |
98.7 |
108.1 |
9.5% |
|
Loan Loss provision |
(12.5) |
(10.8) |
(13.6%) |
|
Total Operating expenses |
(57.8) |
(58.8) |
1.6% |
|
Profit before tax |
40.8 |
49.3 |
20.8% |
|
Profit after tax |
31.5 |
36.1 |
14.5% |
|
Core EPS |
19.6 |
22.5 |
14.5% |
|
Dividend Per Share |
4.0 |
3.0 |
(25.0%) |
|
Dividend Yield (Annualized) |
15.2% |
6.9% |
(8.3%) |
|
Payout Ratio |
39.8% |
26.1% |
(13.6%) |
|
Income Statement Ratios |
H1'2025 |
H1'2026 |
% points change |
|
Yield from interest-earning assets |
12.5% |
11.5% |
(1.0%) |
|
Cost of funding |
4.5% |
3.5% |
(1.0%) |
|
Net Interest Spread |
8.0% |
8.0% |
0.0% |
|
Net Interest Margin |
8.4% |
8.2% |
(0.1%) |
|
Cost of Risk |
12.6% |
10.0% |
(2.7%) |
|
Net Interest Income as % of operating income |
70.1% |
68.5% |
(1.6%) |
|
Non-Funded Income as a % of operating income |
29.9% |
31.5% |
1.6% |
|
Cost to Income Ratio |
58.6% |
54.4% |
(4.2%) |
|
Cost to Income Ratio (without LLP) |
46.0% |
44.4% |
(1.6%) |
|
Capital Adequacy Ratios |
H1'2025 |
H1'2026 |
% points change |
|
Core Capital/Total Liabilities |
18.7% |
19.4% |
0.7% |
|
Minimum Statutory ratio |
8.0% |
8.0% |
0.0% |
|
Excess |
10.7% |
11.4% |
0.7% |
|
Core Capital/Total Risk Weighted Assets |
17.0% |
18.0% |
1.0% |
|
Minimum Statutory ratio |
10.5% |
10.5% |
0.0% |
|
Excess |
6.5% |
7.5% |
1.0% |
|
Total Capital/Total Risk Weighted Assets |
19.7% |
21.0% |
1.3% |
|
Minimum Statutory ratio |
14.5% |
14.5% |
0.0% |
|
Excess |
5.2% |
6.5% |
1.3% |
|
Liquidity Ratio |
47.2% |
49.9% |
2.7% |
|
Minimum Statutory ratio |
20.0% |
20.0% |
0.0% |
|
Excess |
27.2% |
29.9% |
2.7% |
Key Take-Outs:
-
Increased earnings - Core earnings per share grew by 14.5% to Kshs 22.5, from Kshs 19.6 in H1’2025, driven by the 9.5% increase in total operating income to Kshs 108.1 bn, from Kshs 98.7 bn in H1’2025, it was however weighed down by the 1.6% increase in total operating expenses to Kshs 58.8 bn, from Kshs 57.5 bn in H1’2025,
-
Improved asset quality – The bank’s Asset Quality improved, with Gross NPL ratio decreasing to 14.5% in H1’2026, from 17.9% in H1’2025, attributable to a 13.2% increase in gross loans to Kshs 1,401.3 bn, from Kshs 1,237.6 bn recorded in H1’2025 and the 7.8% decrease in Gross non-performing loans to Kshs 203.8 bn, from Kshs 221.1 bn in H1’2025,
-
Expanded balanced sheet - The balance sheet recorded an expansion as total assets increased by 16.8% to Kshs 2,299.4 bn, from Kshs 1,969.2 bn in H1’2025, mainly driven by a 31.5% increase in government securities to Kshs 401.3 bn, from 305.1 bn in H1’2025
For a more detailed analysis, please see our KCB Bank H1’2026 Earnings Note.
-
Co-op Bank H1’2026 Financial Performance
During the week, Co-op Bank released their H1’2026 financial results, recording a 28.0% increase in profit after tax to Kshs 18.0 bn in H1’2026, from Kshs 14.1 bn in H1’2025;
|
Balance Sheet Items |
H1'2025 |
H1'2026 |
y/y change |
|
Government Securities |
253.7 |
271.6 |
7.0% |
|
Net Loans and Advances |
391.3 |
462.2 |
18.1% |
|
Total Assets |
811.9 |
869.5 |
7.1% |
|
Customer Deposits |
547.7 |
621.3 |
13.4% |
|
Deposits per branch |
2.6 |
2.8 |
8.3% |
|
Total Liabilities |
655.6 |
698.2 |
6.5% |
|
Shareholders’ Funds |
156.3 |
171.0 |
9.4% |
|
Balance Sheet Ratios |
H1'2025 |
H1'2026 |
% points change |
|
Loan to Deposit Ratio |
71.4% |
74.4% |
3.0% |
|
Government Securities to Deposits Ratio |
46.3% |
43.7% |
(2.6%) |
|
Return on average equity |
18.8% |
20.6% |
1.8% |
|
Return on average assets |
3.5% |
4.0% |
0.5% |
|
Income Statement |
H1'2025 |
H1'2026 |
y/y change |
|
Net Interest Income |
29.4 |
33.2 |
13.0% |
|
Non-Interest Income |
14.1 |
15.8 |
11.6% |
|
Total Operating income |
43.5 |
48.9 |
12.5% |
|
Loan Loss provision |
(4.5) |
(3.7) |
(17.5%) |
|
Total Operating expenses |
(24.0) |
(26.3) |
9.2% |
|
Profit before tax |
19.7 |
23.1 |
17.3% |
|
Profit after tax |
14.1 |
18.0 |
28.0% |
|
Core EPS |
2.4 |
3.1 |
28.0% |
|
Income Statement Ratios |
H1'2025 |
H1'2026 |
% points change |
|
Yield from interest-earning assets |
13.7% |
12.9% |
(0.8%) |
|
Cost of funding |
5.7% |
4.5% |
(1.3%) |
|
Net Interest Spread |
8.0% |
8.4% |
0.4% |
|
Net Interest Income as % of operating income |
67.5% |
67.8% |
0.3% |
|
Non-Funded Income as a % of operating income |
32.5% |
32.2% |
(0.3%) |
|
Cost to Income |
55.3% |
53.7% |
(1.6%) |
|
CIR without provisions |
44.9% |
46.0% |
1.2% |
|
Cost to Assets |
2.4% |
2.6% |
0.2% |
|
Net Interest Margin |
8.6% |
9.0% |
0.4% |
|
Capital Adequacy Ratios |
H1'2025 |
H1'2026 |
% points change |
|
Core Capital/Total deposit Liabilities |
23.1% |
23.5% |
0.4% |
|
Minimum Statutory ratio |
8.0% |
8.0% |
|
|
Excess |
15.1% |
15.5% |
0.4% |
|
Core Capital/Total Risk Weighted Assets |
18.8% |
21.0% |
2.2% |
|
Minimum Statutory ratio |
10.5% |
10.5% |
|
|
Excess |
8.3% |
10.5% |
2.2% |
|
Total Capital/Total Risk Weighted Assets |
21.3% |
22.9% |
1.6% |
|
Minimum Statutory ratio |
14.5% |
14.5% |
|
|
Excess |
6.8% |
8.4% |
1.6% |
|
Liquidity Ratio |
66.7% |
57.3% |
(9.4%) |
|
Minimum Statutory ratio |
20.0% |
20.0% |
|
|
Excess |
46.7% |
37.3% |
(9.4%) |
Key Take-Outs:
-
Increased earnings - Core earnings per share grew by 28.0% to Kshs 3.1, from Kshs 2.4 in H1’2025, driven by the 12.5% increase in total operating income to Kshs 48.9 bn, from Kshs 43.5 bn in H1’2025. However, the performance was weighed down by an 9.2% increase in total operating expenses to Kshs 26.3 bn from Kshs 24.0 bn in H1’2025,
-
Improved asset quality – The bank’s Asset Quality improved slightly, with Gross NPL ratio decreasing by 3.1% points to 14.2% in H1’2026, from 17.3% in H1’2025, attributable to a 4.9% decrease in Gross non-performing loans to Kshs 72.6 bn, from Kshs 76.3 bn in H1’2025, and a 16.0% increase in gross loans to Kshs 512.2 bn, from Kshs 441.5 bn recorded in H1’2025,
-
Expanded balanced sheet - The balance sheet recorded an expansion as total assets increased by 7.1% to Kshs 869.5 bn, from Kshs 811.9 bn in H1’2025, mainly driven by a 18.1% increase in net loans and advances to Kshs 462.2 bn from Kshs 391.3 bn and 7.0% increase in governments securities to Kshs 271.6 bn from Kshs 253.7 bn in H1’2025.
For a more detailed analysis, please see our Co-op Bank H1’2026 Earnings Note.
Summary Performance
The table below shows the performance of listed banks that have released their H1’2026 results using several metrics;
|
Cytonn Report: Listed Banks Performance in H1’2026 |
||||||||||||||
|
Bank |
Core EPS Growth |
Interest Income Growth |
Interest Expense Growth |
Net Interest Income Growth |
Net Interest Margin |
Non-Funded Income Growth |
NFI to Total Operating Income |
Growth in Total Fees & Commissions |
Deposit Growth |
Growth in Government Securities |
Loan to Deposit Ratio |
Loan Growth |
Return on Average Equity |
|
|
Co-operative Bank |
28.0% |
6.3% |
(6.5) % |
13.0% |
9.0% |
11.6% |
32.2% |
10.9% |
13.4% |
7.0% |
74.4% |
18.1% |
20.6% |
|
|
KCB Group |
14.5% |
4.0% |
(2.9%) |
7.0% |
8.2% |
15.4% |
31.5% |
17.7% |
15.1% |
31.5% |
72.5% |
13.27% |
22.0% |
|
|
NCBA Group |
12.2% |
7.6% |
(12.8%) |
20.4% |
7.9% |
7.6% |
38.3% |
9.1% |
(11.3%) |
12.3% |
62.7% |
2.0% |
19.8% |
|
|
Stanbic Group |
1.3% |
5.9% |
6.6% |
5.5% |
6.2% |
(9.0%) |
23.8% |
1.9% |
9.4% |
14.5% |
68.1% |
24.7% |
20.7% |
|
|
H1'2026 Mkt Weighted Average* |
16.1% |
5.6% |
(4.5%) |
11.2% |
8.1% |
9.2% |
31.9% |
11.7% |
8.6% |
18.1% |
70.5% |
14.1% |
21.0% |
|
|
H1'2025 Mkt Weighted Average* |
8.4% |
(2.0%) |
(20.7%) |
10.4% |
8.0% |
(5.8%) |
33.9% |
4.2% |
1.7% |
28.3% |
67.2% |
1.5% |
22.3% |
|
|
*Market cap weighted as at 14/08/2026 |
||||||||||||||
|
**Market cap weighted as at 16/09/2025 |
||||||||||||||
Key take-outs from the table include:
-
The listed banks that have released results recorded a 16.1% weighted average growth in core Earnings per Share (EPS) in H1’2026, compared to the weighted average growth of 8.4% in H1’2025.
-
Interest income recorded a weighted average increase of 5.6% in H1’2026, compared to the 2.0% decline recorded in H1’2025. Interest expenses recorded a market-weighted average decline of 4.5% in H1’2026, compared to the 20.7% decline in H1’2025.
-
The Banks’ net interest income recorded a weighted average growth of 11.2% in H1’2026, from the 10.4% growth recorded over a similar period in 2025, while non-funded income increased by 9.2% in H1’2026 compared to the 5.8% decline recorded in H1’2025, and,
-
The Banks recorded a weighted average deposit growth of 8.6% in H1’2026, compared to the market-weighted average deposit growth of 1.7% in H1’2025.
Asset Quality
The table below shows the asset quality of listed banks that have released their Q1’2026 results using NPL ratio and NPL coverage:
|
Bank |
H1'2026 NPL Ratio* |
H1'2025 NPL Ratio** |
% point change in NPL Ratio |
H1'2026 NPL Coverage* |
H1'2025 NPL Coverage** |
% point change in NPL Coverage |
|
KCB Group |
14.5% |
17.9% |
(3.3%) |
78.8% |
64.3% |
14.4% |
|
Co-operative Bank |
14.2% |
17.3% |
(3.1%) |
68.9% |
65.8% |
3.1% |
|
NCBA Group |
10.8% |
12.2% |
(1.4%) |
67.4% |
65.5% |
1.8% |
|
Stanbic Holdings |
7.3% |
9.5% |
(2.1%) |
86.6% |
82.7% |
3.9% |
|
Mkt Weighted Average* |
12.7% |
13.8% |
(1.1%) |
74.8% |
67.8% |
7.0% |
|
*Market Cap weighted as at 14/08/2026 |
||||||
Key take-outs from the table include;
-
Asset quality for the listed banks that have released results improved during H1’2026, with the market-weighted average NPL ratio decreasing by 1.1% points to 12.7%, from 13.8% in H1’2025. The improvement was supported by reduced NPL ratios from NCBA and Stanbic Bank.
-
Market-weighted average NPL coverage increased by 7.0% points to 74.8% in H1’2026 from 67.8% recorded in H1’2025. The performance was supported by increases in coverage by individual banks such as KCB Group by 14.4%, Stanbic Bank by 3.9% points, Co-op Bank by 3.1% and NCBA by 1.8% points.
-
Sanlam Kenya Holdings Plc H1’2026 Financial Performance
During the week, Sanlam Kenya Holdings released their HY’2026 results, recording a 7.4% decrease in Profit After Tax to Kshs 0.13 from Kshs 0.12 bn recorded in HY’2025. The performance was mainly driven by a 34.5% decrease in insurance service result to Kshs 0.2 bn in HY’2026, from Kshs 0.4 bn in HY’2025, but supported by the 59.3% decrease in net insurance finance expenses to Kshs 0.1 bn from Kshs 0.2 bn in HY’2025. The tables below show a summary of the performance:
|
Cytonn Report: Sanlam Allianz Kenya Plc's Income Statement |
|||
|
Income Statement (Kshs bn) |
HY'2025 |
HY'2026 |
y/y change |
|
Insurance Revenue |
2.17 |
2.20 |
1.1% |
|
Insurance Service Expense |
(1.7) |
(1.9) |
9.2% |
|
Net Expense from reinsurance contracts held |
(0.09) |
(0.09) |
(7.2%) |
|
Insurance Service Result |
0.4 |
0.2 |
(34.5%) |
|
Interest revenue calculated using the effective interest method |
0.1 |
0.04 |
(30.2%) |
|
Other Interest Revenue |
1.3 |
1.3 |
1.5% |
|
Other Investment Revenue |
1.5 |
(0.9) |
(156.6%) |
|
Insurance Investment Revenue |
2.9 |
0.5 |
(83.3%) |
|
Net Insurance Finance expenses |
(0.2) |
(0.1) |
(59.3%) |
|
Profit before tax |
0.3 |
0.20 |
(28.1%) |
|
Income tax expense |
(0.1) |
(0.08) |
(47.3%) |
|
Profit after tax |
0.13 |
0.12 |
(7.4%) |
|
Core EPS |
0.93 |
0.87 |
(7.4%) |
|
Cytonn Report: Sanlam Allianz Kenya Plc's Balance Sheet |
|||
|
Balance Sheet items |
HY’2025 |
HY’2026 |
y/y change |
|
Financial Investments |
32.9 |
34.9 |
6.2% |
|
Insurance and Reinsurance contract assets |
0.4 |
0.6 |
51.1% |
|
Other assets |
8.1 |
4.8 |
(40.6%) |
|
Total assets |
41.3 |
40.3 |
(2.5%) |
|
Insurance contract liabilities |
30.2 |
31.7 |
4.9% |
|
Payables and Other liabilities |
7.2 |
3.7 |
(48.1%) |
|
Total liabilities |
37.4 |
35.4 |
(5.2%) |
|
Shareholder funds |
3.9 |
4.8 |
23.3% |
Key take outs from the results:
-
Core Earnings Per share decreased by 7.4% to Kshs 0.87 from Kshs 0.93 per share in HY’2025, mainly attributable to the 34.5% decrease in insurance service result to Kshs 0.2 bn in HY’2026, from Kshs 0.4 bn in HY’2025, coupled with a significant 83.3% decrease in insurance investment revenue to Kshs 0.5 bn in HY’2026, from Kshs 2.9 bn in HY’2025;
-
Net Investment revenue decreased by 83.3% to Kshs 0.5 bn in HY’2026, from Kshs 2.9 bn in HY’2025. This was majorly attributable to a 156.6% decrease in other investment revenue to a loss Kshs 0.9 bn from Kshs 1.5 bn coupled with the 30.2% decrease in interest revenue calculated using the effective interest method to Kshs. 0.04 bn from the Kshs 0.1 bn recorded in HY’2025. However, this was supported by a marginal 1.5% increase in other interest revenue to Kshs 1.31 bn from Kshs 1.29 bn in HY’2025. Insurance service expenses increased by 9.2% to Kshs 1.9 bn from Kshs 1.7 bn in HY’2025. In addition, there was a 1.1% increase in insurance revenue to Kshs 2.2 bn from Kshs 2.17 bn registered in HY’2025, while net expense from reinsurance contracts held decreased marginally by 7.2% to remain unchanged at Kshs 0.09 bn recorded in HY’2025. This translated to a net insurance service result decrease of 34.5% to Kshs 0.2 bn from Kshs 0.4 bn in HY’2025 while,
-
The company's balance sheet recorded a decline as total assets decreased by 2.5% to Kshs 40.3 bn in HY'2026 from Kshs 41.3 bn in HY'2025, mainly driven by a 40.6% decrease in Other assets to Kshs 4.8 bn in HY'2026 from Kshs 8.1 bn in HY'2025. However, this was supported by a 51.1% increase in insurance and reinsurance contract assets to Kshs 0.6 bn in HY'2026, from Kshs 0.4 bn in HY'2025 and a 6.2% increase in Financial Investments to Kshs 34.9 bn in HY'2026 from Kshs 32.9 bn in HY'2025.
-
Total liabilities also declined by 5.2% to Kshs 35.4 bn in HY’2026 from Kshs 37.4 bn in HY’2025 mainly driven by a 48.1% decrease in payables and other liabilities to Kshs 3.7 bn from Kshs 7.2 bn in HY’2025. However, this was supported by a 4.9% increase in insurance contract liabilities to Kshs 31.7 bn from Kshs 30.2 bn in H1’2025.
Going forward, the factors that would drive the company’s growth would be:
-
Holistic Business Resilience (SME 360) - The SME 360 initiative is expected to accelerate growth by offering highly customizable, all-inclusive risk management solutions designed to safeguard small and medium enterprises. By pairing adaptable coverage options and bundled commercial protections with built-in emergency response frameworks, the platform addresses business hesitation around unpredictable operational liabilities, enhancing customer acquisition and building a resilient, long-term commercial premium pipeline.
Milestone-Driven Wealth Creation (Flexi Future Plus) - The Flexi Future Plus initiative is expected to accelerate growth by offering highly customizable, goal-based endowment solutions designed to capture mid-to-long-term savings. By pairing flexible policy durations and adaptable premium structures with built-in financial protection, the platform addresses consumer hesitation around rigid financial commitments, enhancing customer acquisition and building a resilient, long-term premium pipeline.
-
CMA Approves Listing of WSA Banking Index ETF
The Capital Markets Authority (CMA) has approved the listing of the WSA Banking Index ETF on the Nairobi Securities Exchange (NSE), introducing Kenya’s first locally domiciled Exchange Traded Fund. The ETF will provide investors with diversified exposure to the domestic banking sector through a single investment instrument, tracking the NSE Banking Sector Index. The approval comes at a time when banking stocks have continued to support the performance of the local equity market, with the Banking Sector Index standing at 276.6 as at 14th August 2026, a 35.4% increase from 204.4 recorded at the beginning of the year. The key take-outs include;
-
The WSA Banking Index ETF will be the first locally domiciled ETF in Kenya, bringing the total number of ETFs approved for listing on the NSE to three, alongside the Absa NewGold ETF and the Satrix MSCI World Feeder ETF. Unlike the existing products, which provide exposure to gold and developed global equities, the new ETF will provide investors with exposure to Kenya’s domestic banking sector.
-
The ETF will track the NSE Banking Sector Index, namely Equity Group, KCB Group, Co-operative Bank, Absa Bank Kenya, NCBA Group, Standard Chartered Bank Kenya, Stanbic Holdings, I&M Group, Diamond Trust Bank, HF Group and BK Group. This provides investors with a diversified basket of banking stocks through a single tradable instrument, reducing the need to construct and manage exposure to individual banking counters
-
The introduction of the ETF comes against a backdrop of strong performance by the banking sector. The NSE Banking Sector Index stood at 276.6 as at 14th August 2026, , a 35.4% increase from 204.4 recorded at the beginning of the year, highlighting the strong performance of listed banking counters and providing a notable backdrop for the launch of a product focused on the sector.
-
The product broadens investment options on the NSE by giving investors a simple way to gain diversified exposure to Kenya’s banking sector through a single investment, rather than investing in individual bank stocks. This allows investors to participate in the performance of multiple listed banks while reducing the company specific risk associated with holding a single banking counter.
-
The ETF will be denominated in Kenya Shillings, with its underlying investments also traded in Kenya Shillings, meaning investors will not take on foreign exchange risk from the fund’s underlying holdings. However, returns will remain exposed to movements in the domestic equity market and the performance of the constituent banks.
-
The approval is also significant from a market development perspective, as the introduction of a locally domiciled ETF provides an additional avenue through which capital can be channelled into listed securities. Its eventual impact on market depth, however, will depend on investor uptake and the level of liquidity generated once trading commences.
The introduction of the WSA Banking Index ETF is particularly timely given the strong performance of the banking sector and its significance within the NSE. By packaging exposure to the 11 listed banks into a single instrument, the ETF could encourage greater participation in the domestic equity market while giving investors an alternative to selecting individual banking counters. It also marks a gradual shift towards more diversified and index-based investment products within Kenya’s capital markets.
Going forward, we expect the ETF’s performance to largely reflect movements in the underlying banking sector, with investor uptake and secondary market liquidity being key determinants of its success. While the strong performance of the Banking Sector Index provides a favorable backdrop, sustained demand will be necessary for the ETF to develop into a meaningful investment vehicle. Successful adoption could also encourage the development of additional locally domiciled ETFs tracking other sectors or asset classes, further diversifying Kenya’s capital markets and investment opportunities.
We maintain a “cautiously optimistic” short-term outlook supported primarily earnings-led attractive valuations, despite rising yields on short-term government papers, which increase competition for capital by drawing investors towards risk-free government securities, as well as heightened geopolitical risks such as Iran war that may weigh on investor sentiment, and, “neutral” in the long term as persistent foreign investor outflows continue to constrain market liquidity and limit broad-based market re-rating. With the market currently trading at a discount to its future growth (PEG Ratio at 1.0x), where performance will be driven by company-specific fundamentals rather than general market direction, we believe that investors should reposition towards value stocks exhibiting strong earnings growth, attractive dividend yields, solid balance sheets, sustainable competitive advantages and trading at compelling discounts to their intrinsic value. While foreign investor sell-offs are expected to continue exerting pressure in the near term, we believe this will create selective entry opportunities for long-term investors
-
Residential Sector
-
Kshs 206.5 bn Pumped into Kenya's Affordable Housing Programme Over Three Years
During the week, the Treasury reported that taxpayers have collectively contributed Kshs 206.5 bn into President Ruto's Affordable Housing Programme over three years, making it one of the largest payroll-funded public construction initiatives in Kenya's history. Treasury records show that the Housing Development Levy generated Kshs 54.2 bn in 2023/24, Kshs 73.2 bn in 2024/25, and Kshs 79.1 bn in 2025/26, lifting cumulative collections beyond Kshs 200.0 bn despite court battles and political resistance. Collections have, however, fallen short of the Treasury's cumulative target of Kshs 212.8 bn by Kshs 6.3 bn, or 3.0%, with the government having raised its annual target aggressively to Kshs 95.0 bn in the last fiscal year against actual collections of Kshs 79.1 bn, leaving a gap of Kshs 15.9bn or 16.7% below target.
As of December 2025, more than 205,000 housing units were under development nationwide at an estimated cost of nearly Kshs 500.0 bn, according to the 2026 Economic Survey. The affordable housing component accounted for 138,474 units valued at Kshs 385.8 bn, while social housing projects targeting lower-income households comprised 53,350 units worth Kshs 81.8 bn. Institutional housing included 12,709 units costing Kshs 28.6 bn for public servants, police officers, and members of the Kenya Defense Forces. Affordable housing units are currently priced at between Kshs 1.5 mn and Kshs 2.1 mn for one-bedroom houses, Kshs 2.0 mn to Kshs 2.5 mn for two-bedroom units, and Kshs 3.0 mn to Kshs 3.3 mn for three-bedroom apartments, with buyers required to pay a 10.0% deposit, though the President announced plans to reduce this to 5.0% to accelerate sales.
Going forward, the Affordable Housing Programme is expected to remain a significant driver of residential Real Estate supply in Kenya, with expenditure on affordable housing projected to spike in FY2027/28 as the Kshs 360.0 bn projection incorporates funds expected to be realized from housing sales and increased levy collections. The programme's tenant-purchase model, under which occupants make monthly payments before eventually owning the homes, is expected to generate substantial cash flows that will finance subsequent phases of construction and reduce the programme's dependence on payroll deductions. For the broader Residential Real Estate sector, the scale of the programme is likely to exert downward pressure on entry-level pricing in the affordable segment, while also creating positive spillover effects for construction, building materials, and property management services across Nairobi and other major urban centers.
-
Infrastructure Sector
-
Kenya and Tanzania have renewed efforts to connect their Standard Gauge Railway (SGR) networks to landlocked neighbors Uganda, Rwanda and Burundi
During the week, Kenya and Tanzania have renewed efforts to connect their Standard Gauge Railway (SGR) networks to landlocked neighbors Uganda, Rwanda, and Burundi, amid growing pressure to diversify funding sources for the undertakings. Kenya recently broke ground on the extension of its railway line from Naivasha to Kisumu and the border town of Malaba, six years after the project stalled, while Tanzania has initiated the extension of its SGR westward from Dodoma to Kigoma on the shores of Lake Tanganyika, with plans to add two new lines linking its port city of Tanga to Musoma on the shores of Lake Victoria and connecting to Rwanda, Burundi, and Uganda. Kenya plans to use up to 90.0% of Railway Development Levy (RDL) collections to issue securitized bonds, targeting the mobilization of up to Kshs 390.0 bn to finance the stalled SGR extension to Kisumu and Malaba.
Both Kenya and Tanzania are under pressure to innovate their financing models, with Kenya exploring securitization, public-private partnerships (PPPs), and Railway Development Levy-backed bond issuances to fund the extensions. Tanzania has signed three agreements with Africa50, a pan-African infrastructure investor co-owned by the African Development Bank, to deliver infrastructure projects under the PPP model. Uganda, seen as the immediate off-taker of Kenya's extended SGR project, has sought Kshs 62.0 bn through a Shariah-compliant Sukuk bond to finance its 272-kilometre stretch of standard gauge railway connecting Malaba to Kampala, though lenders have requested payment and price guarantees before committing.
Going forward, the full-circle completion of the Kenya and Tanzania SGR projects and the subsequent connection to neighboring landlocked countries is expected to significantly enhance regional trade connectivity and logistics efficiency. For Kenya's Real Estate sector, improved rail infrastructure linking Nairobi to the port of Mombasa and extending westward to Uganda and Rwanda is likely to drive demand for logistics, warehousing, and industrial facilities along key rail corridors, particularly in Naivasha, Kisumu, and the wider Rift Valley region. The shift toward alternative financing mechanisms, including PPPs, securitization, and development finance institution partnerships, also reinforces the Government's broader strategy of mobilizing private and institutional capital to fund large-scale infrastructure while maintaining fiscal discipline.
-
Phase One of Nairobi's Kshs 1.0 tn Metro Rail Project Set for 2028 Construction Launch
During the week, the government announced that Nairobi's long-delayed metro rail project, estimated to cost approximately Kshs 1.0 tn, is expected to begin construction with a 10-kilometre first phase linking the Central Business District (CBD) to Eastlands in 2028. The proposed underground and overground Mass Rapid Transit System (MRTS), whose full network is planned to cover 30 kilometers, is being pursued as part of the current regime’s Vision 2060 agenda, with the Government arguing that more efficient public transport is necessary to support Nairobi's economic growth and development. The project will be financed through a mix of sources including PPPs, the National Infrastructure Fund (NIF), climate finance, and carbon funding, reflecting the Government's multi-source financing approach intended to spread investment costs while leveraging private capital and climate-related funding.
The first phase will prioritize the CBD-to-Eastlands corridor, given that Eastlands is among the most populous parts of the city. The system is expected to reduce time lost in traffic, currently estimated at between 2.5 and 3 hours per person per day, with projections suggesting this could rise to 4 hours by 2040 and 6 hours by 2060 without intervention. The investment is also expected to create more than 115,000 jobs, reduce fuel consumption by approximately 70.0 mn liters annually, and cut carbon dioxide emissions by an estimated 1.6 mn tonnes per year. The system will connect to other public transport services including Bus Rapid Transit (BRT), allowing passengers to transfer between stations and reach destinations beyond the rail network.
Going forward, the development of Nairobi's metro rail system is expected to have transformative implications for the city's Real Estate market by reshaping accessibility, land use patterns, and development density along the rail corridors. For the Residential sector, improved mass transit connectivity is likely to support demand for housing in previously underserved nodes such as Eastlands, as reduced commute times make these areas more attractive to middle-income households. For the Commercial Real Estate segment, transit-oriented development around proposed metro stations could drive demand for mixed-use developments, retail space, and commercial office nodes at key interchange points. The adoption of a blended financing model incorporating PPPs, the NIF and climate finance also signals the Government's growing commitment to leveraging alternative capital structures to deliver large-scale urban infrastructure projects.
-
Real Estate Investments Trusts
During the week, Laptrust released the H1’2026 financial results for the Imara I-REIT for the period ended 30th June 2026. The I-REIT was authorized by the Capital Markets Authority (CMA) on 1st November 2022. Laptrust Imara I-REIT holds several properties across the country including; Pension towers, CPF House, Metro Park, Freedom Heights mall, Freedom Heights serviced plot, Man apartments, and Nova Pioneer in Eldoret.
Below is a summary of the Laptrust Imara I-REIT’s H1’2026 Performance.
|
Figures in Kshs mn unless stated otherwise |
|||
|
Balance Sheet |
H1'2025 |
H1'2026 |
y/y Change |
|
Total Assets |
6,918.9 |
6,354.6 |
(8.2%) |
|
Total Equity |
6,379.7 |
5,868.5 |
(8.0%) |
|
Total Liabilities |
539.2 |
486.1 |
(9.8%) |
|
Figures in Kshs mn unless stated otherwise |
|||
|
Income Statement |
H1'2025 |
H1'2026 |
y/y Change |
|
Rental Income |
247.2 |
124.6 |
(49.6%) |
|
Income from Other Sources |
57.9 |
51.7 |
(10.7%) |
|
Operating Expenses |
224.2 |
118.5 |
(47.1%) |
|
Profit/Loss |
80.9 |
57.8 |
(28.5%) |
|
Basic EPS (Kshs) |
0.23 |
0.17 |
(28.5%) |
|
Figures in Kshs mn unless stated otherwise |
|||
|
Ratios Summary |
H1'2025 |
H1'2026 |
y/y Change |
|
ROA |
1.2% |
0.9% |
(0.3%) |
|
ROE |
1.3% |
1.0% |
(0.3%) |
|
Debt Ratio |
7.8% |
7.6% |
(0.1%) |
|
PBT Margin |
32.7% |
46.4% |
13.7% |
|
Annualized Rental Yield |
8.1% |
4.4% |
(3.7%) |
Income Statement:
-
Rental and related income for the REIT stood at Kshs 124.6 mn in H1’2026, a 49.6% decrease from Kshs 247.2 mn in H1’2025, implying a gross annual rental yield of 8.1% in H1‘2026 on interest-earning assets, 3.7% points lower than the 4.4% rental yield recorded during H1’2025. This decrease is attributable to 49.6% decrease in rental and related income which outpaced the 8.6% decrease in investment property to Kshs 5.7 bn from Kshs 6.2 bn in H1’2025,
-
The basic earnings per unit came in at Kshs 0.17 in H1’2026, a 37.2% decline from Kshs 0.23 recorded in H1’2025. The performance was driven by a 28.5% decrease in net profits to Kshs 57.8 mn in H1’2026 from Kshs 80.9 mn recorded in H1’2025, which was attributable to the 49.6% decrease in revenues.
-
Total operating expenses in H1'2026 for the REIT came in at Kshs 118.5mn, 47.1% lower than the Kshs 224.2mn recorded in H1'2025, attributed to a 56.8% decrease in utility expenses to Kshs 64.7mn from Kshs 148.5mn in H1’2025, a 38.6% decrease in property expenses to Kshs 24.4mn from Kshs 39.7mn , and a 15.3% decrease in fund operating expenses to Kshs 29.4mn from Kshs 34.7mn in H1’2024. The decline in property expenses was largely driven by a 53.7% decrease in landlord service charge expenses to Kshs 14.3mn from Kshs 30.9mn in H1'2025, which outpaced a 6.4% increase in landlord property operating expenses to Kshs 10.0mn from Kshs 9.4mn. Similarly, the decrease in fund operating expenses was mainly attributable to a 90.0% decrease in provisions for bad debts, which fell to Kshs 0.5mn from Kshs 5.0mn in H1'2025, coupled with a 21.1% decrease in REITs manager fees to Kshs 1.5mn from Kshs 1.9mn, while other components such as trustee fees, audit fees, and marketing and PR expenses remained largely flat
Balance Sheet:
-
Total assets for the REIT stood at Kshs 6.4 bn in H1’2026, an 8.2% decrease from Kshs 6.9 bn recorded in H1’2025. Total non-current assets decreased by 7.9% to Kshs 5.8 bn from Kshs 6.3 bn in H1’2025 , attributable to 8.6% decrease in investment property to Kshs 5.7 bn from Kshs 6.2 bn in H1’2025, while total current assets decreased by 10.9% to Kshs 0.5 bn from Kshs 0.6 bn in H1’2025 attributable to a 28.7% decrease cash and cash equivalents to Kshs 0.2 bn from Kshs 0.3 bn coupled with a 9.6% increase in trade and other receivables to Kshs 0.31 bn from Kshs 0.3 bn in H1’2025.
-
Total liabilities in H1’2026 came in at Kshs 0.48 bn, recording a 9.8% decrease from Kshs 0.5 bn in H1’2025 wholly attributable to a decrease in trade and other payables,
-
The shareholder’s funds decreased by 8.0% to Kshs 5.9 bn from Kshs 6.4 bn in H1’2025, mainly attributable to 72.4% increase in revaluation reserve to Kshs 1.3 bn from Kshs 0.7 bn in H1’2025, which outpaced the 14.4% increase in retained earnings to Kshs 229.5 mn from Kshs 200.6 mn in H1’2025.
-
The REIT currently has a Return on Asset and a Return on Equity of 0.9% and 1.0% respectively.
Going forward,
-
We expect the expiry of the three-year trading restriction period in 2026 to mark a key inflection point for the I-REIT, as pricing transitions from a net asset value (NAV)-based model to a market-driven mechanism. However, the REIT’s weak operational performance, characterized by declining rental income, compressed yields, and negative returns, may weigh on investor sentiment and result in units trading at a discount to NAV once price discovery sets in.
For more comprehensive analysis, please see our Laptrust Imara I-REIT Earnings Note
-
Africa Logistics Properties received a Kshs 228.0 mn stamp duty relief
During the week, warehousing developer Africa Logistics Properties (ALP) received a Kshs 228.0 mn stamp duty relief after transferring its properties into its recently listed Income Real Estate Investment Trust (I-REIT), following provisions under the Finance Act 2026 which exempted such transfers from the levy. ALP listed Kenya's first dollar-denominated I-REIT in March 2026 after raising USD 34.0 mn through a restricted offer, and subsequently initiated the transfer of three properties in Tatu City and Tilisi, valued at a combined Kshs 3.4 bn, into the REIT. The company is in the process of transferring an additional Kshs 2.4 bn warehouse unit at Tatu City into the REIT, for which it will be allocated an additional 5.0 mn units, bringing its total holding to 15.2 mn units and the total issued units to 45.0 mn.
Prior to the Finance Act 2026, property transfers into REITs attracted a stamp duty of 4.0 %, a cost that had previously acted as a friction point for REIT formation and property injection in Kenya. The reinstatement of the stamp duty exemption, which had originally existed until 2022, is expected to lower the cost of seeding REITs and encourage greater participation by property developers in the REIT market. ALP and InfraCo Africa Investment Limited each hold 10.2 mn units or 25.5 % of issued units, while the UK government entity MOBILIST Programme and Jubilee Life Insurance Limited hold nine and five million units respectively, with the remaining units distributed among 17 shareholders.
Going forward, the stamp duty exemption under the Finance Act 2026 is expected to serve as a meaningful catalyst for the growth of Kenya's REIT market by reducing the transactional costs associated with property injection into REITs. For the Industrial and Logistics Real Estate segment, the development signals growing institutional appetite for warehousing assets as an investable class, with ALP's Tatu City and Tilisi properties reflecting sustained demand for modern, large-format logistics facilities along Nairobi's key growth corridors. More broadly, the expansion of Kenya's REIT market is likely to deepen capital market participation in Real Estate, improving liquidity, price discovery, and access to institutional-grade property investments.
-
REITs Weekly Performance
On the Unquoted Securities Platform Acorn D-REIT and I-REIT traded at Kshs 29.7 and Kshs 24.4 per unit, respectively, as per the last updated data on 14th August 2026. The performance represented a 48.5% and 22.0% gain for the D-REIT and I-REIT, respectively, from the Kshs 20.0 inception price. The volumes traded for the D-REIT and I-REIT came in at 13.6 mn and 44.9 mn shares, respectively. Additionally, ILAM Fahari I-REIT traded at Kshs 13.8 per share as of 14th August 2026, representing a 31.0% loss from the Kshs 20.0 inception price. The volume traded to date came in at 1.2 mn shares for the I-REIT, REITs offer various benefits, such as tax exemptions, diversified portfolios, and stable long-term profits. However, the ongoing decline in the performance of Kenyan REITs and the restructuring of their business portfolios are hindering significant previous investments. Additional general challenges include:
-
Insufficient understanding of the investment instrument among investors leading to a slower uptake of REIT products,
-
Lengthy approval processes for REIT creation,
-
High minimum capital requirements of Kshs 100.0 mn for REIT trustees compared to Kshs 10.0 mn for pension funds Trustees, essentially limiting the licensed REIT Trustee to banks only
-
The rigidity of choice between either a D-REIT or and I-REIT forces managers to form two REITs, rather than having one Hybrid REIT that can allocate between development and income earning properties
-
Limiting the type of legal entity that can form a REIT to only a trust company, as opposed to allowing other entities such as partnerships, and companies,
-
We need to give time before REITS are required to list – they would be allowed to stay private for a few years before the requirement to list given that not all companies maybe comfortable with listing on day one, and,
-
Minimum subscription amounts or offer parcels set at Kshs 0.1 mn for D-REITs and Kshs 5.0 mn for restricted I-REITs. The significant capital requirements still make REITs relatively inaccessible to smaller retail investors compared to other investment vehicles like unit trusts or government bonds, all of which continue to limit the performance of Kenyan REITs
We expect the performance of Kenya's Real Estate sector to remain resilient, supported by several factors, including: i) renewed efforts between Kenya and Tanzania to connect their SGR networks to landlocked neighbors Uganda, Rwanda, and Burundi, ii) Nairobi's Kshs 1.0 tn metro rail project that is set to begin construction in 2028, and iii) and the cumulative contributions of Kshs 206.5 bn over three years to Kenya’s Affordable Housing Program. However, challenges such as weak investor appetite in listed REITs like ILAM Fahari I-REIT and high capital requirements will continue to constrain the sector's optimal performance.
-
American Express Expands Virtual Card Capabilities for U.S. Commercial Customers
During the week, American Express announced new capabilities designed to simplify business payments and improve spend management by expanding access to Amex Virtual Cards for U.S. commercial clients. Corporate customers can now generate, track, and manage virtual cards directly within Amex's proprietary Work software platform, integrating spending limits, timeframes, and merchant controls directly into existing ERP and expense management systems. Additionally, through an expanded relationship with Conferma, clients using Amex's Business Travel Account (BTA) can issue virtual cards via the Conferma mobile app for point-of-purchase travel and business expenses. The expansion underscores American Express's strategic focus on capturing higher-margin commercial payment flows and deepening client retention within B2B ecosystems. By integrating flexible virtual payment controls into native platforms and third-party travel systems, Amex lowers administrative friction, reduces fraud risks, and improves visibility into employee and supplier spending, driving continued adoption of digital B2B solutions among corporate clients.
-
Mastercard Appoints New Regional President for EEMEA Region
During the week, Mastercard Incorporated announced the appointment of Yasemin Bedir as the new President of its Eastern Europe, Middle East, and Africa (EEMEA) region, effective 1 September 2026. Bedir will oversee Mastercard’s operations across the region, focusing on expanding market penetration, driving digital payments adoption, and fostering strategic public-private partnerships across diverse financial ecosystems. The leadership transition aligns with Mastercard’s ongoing strategic push to capture growth across rapidly digitizing emerging markets. By placing experienced leadership over the EEMEA region, Mastercard is well-positioned to accelerate the deployment of its digital infrastructure, enhance regional merchant acquiring capabilities, and strengthen financial inclusion initiatives in high-potential markets.
-
PayPal Outlines Agentic Commerce and AI Strategy at Ai4 2026 Conference
During the week, PayPal Holdings, Inc. presented its technology vision at the Ai4 2026 conference in Las Vegas, detailing how the firm is utilizing its extensive transaction dataset and trust infrastructure to develop agentic commerce tools. PayPal's technology leadership highlighted how AI algorithms and automated agent models are being integrated into the platform to streamline payment flows, optimize fraud detection, and support autonomous consumer purchasing workflows. The strategy highlights PayPal's positioning at the intersection of artificial intelligence and digital commerce. By embedding AI-driven capabilities directly into its payments layer, PayPal aims to secure a foundational role in next-generation automated commerce, driving user engagement, optimizing merchant conversion rates, and defending its competitive moat against emerging fintech disruptors.
-
Digital Payments Stock Performance
The table below presents a snapshot of NYSE-listed digital payments stocks, covering Visa, Mastercard, American Express (AXP), Circle, Block and PayPal:
|
Cytonn Report: Digital Payments NYSE Stock Performance |
||||||
|
Company |
Year Open 2026 |
Price 8/07/2026 |
Price 8/14/2026 |
w/w change |
YTD change |
P/E |
|
American Express |
372.7 |
336.3 |
342.5 |
1.9% |
(8.1%) |
26.6x |
|
Visa |
346.5 |
366.1 |
364.2 |
(0.5%) |
5.1% |
17.3 x |
|
Mastercard |
563.1 |
573.1 |
569.3 |
(0.7%) |
1.1% |
33.0x |
|
Block |
65.2 |
81.2 |
82.9 |
2.0% |
27.2% |
35.1 x |
|
Paypal Holdings |
58.1 |
57.2 |
61.7 |
7.8% |
6.1% |
12.3x |
|
JPMorgan Chase & Co. |
322.2 |
351.8 |
362.8 |
3.1% |
12.6% |
7.0 x |
|
Average |
|
|
|
|
|
21.9x |
Source: (AXP, Visa, Mastercard, Circle, Block, PayPal, Coinbase, Global Payments, Wise and JPMorgan Chase. NYSE
The stocks are currently trading at an average P/E multiple of 21.9x, indicating that investors are pricing in strong future earnings growth and are prepared to pay a substantial premium for current earnings. This also suggests that valuations may be stretched relative to near-term fundamentals.
We expect the global digital payments sector to continue evolving toward greater payment sovereignty, digital infrastructure modernization, and reduced reliance on traditional card-based payment networks as governments and financial institutions increasingly prioritize control over domestic payment ecosystems. Recent developments, particularly the European Central Bank’s progress toward launching the Digital Euro, signal a growing global shift toward central bank-backed digital payment infrastructure aimed at enhancing financial resilience, improving transaction efficiency, and strengthening monetary independence in an increasingly digital economy. This trend is likely to accelerate competition between public-sector digital currencies and established private payment networks such as Visa Inc. and Mastercard Incorporated, while driving broader innovation across digital finance infrastructure. However, despite these favorable long-term structural tailwinds, valuations within the sector remain relatively elevated, with the companies under coverage currently trading at an average P/E of 21.9x, suggesting that a significant portion of future growth expectations may already be priced in. As such, we expect near-term performance to remain sensitive to regulatory developments, execution risk, and the pace at which both incumbents and emerging digital payment infrastructure providers adapt to the rapidly changing payments landscape.
With approximately one year to Kenya's August 2027 General Election, attention is increasingly turning to the potential impact of the election cycle on the country's economic and investment environment. Elections generally introduce a period of heightened political and policy uncertainty, which can affect economic activity, investor confidence and capital flows. Where uncertainty becomes elevated, businesses and investors may adopt a cautious approach, delaying investment and spending decisions until there is greater clarity on the political and economic environment. The experience across Kenya's previous election cycles shows that elections have a meaningful impact on economic activity and financial markets, primarily through changes in political and policy uncertainty, investor sentiment, spending decisions and capital flows. However, the magnitude of these effects has varied depending on prevailing domestic conditions and broader global developments.
We have previously covered “Effects of the Election on the Investment Environment in Kenya” and “Effect of the Election on the Real Estate Environment in Kenya” in 2017, as well as “Effects of Elections on the Investments Environment in Kenya” in 2022, examining the implications of election cycles for Kenya's investment environment. This week, we revisit the historical experience across previous election cycles and assess Kenya's current position ahead of the August 2027 General Election. We shall do this by looking into the following:
-
GDP Growth and Economic Activity
-
Government Borrowing
-
Interest Rates and Inflation
-
Private-Sector Credit and Business Activity
-
Foreign Direct Investments (FDI)
-
Corporate Earnings and Market Valuations
-
Real Estate Market
-
Outlook
-
Conclusion
-
GDP Growth and Economic Activity
Kenya's economic performance around election cycles has been mixed, with the impact of elections largely dependent on the extent of political disruption and the prevailing macroeconomic environment. The 2007/08 cycle represents the most severe episode, with real GDP growth falling to 0.2% in 2008 from 6.9% in 2007 following post-election violence that disrupted economic activity across key sectors. In 2017, growth moderated to 3.8% from 4.2% in 2016, mainly due to prolonged electioneering uncertainty alongside adverse weather conditions as contributing factors. While during the 2013 election growth, decreased to 3.8% from 4.6% in 2012. The 2022 slowdown, from 7.6% to 4.9%, is less conclusive as an election effect given the unusually strong post-COVID rebound in 2021 and the severe drought in 2022.
Kenya enters the 2027 election cycle from a relatively stronger growth position, with real GDP expanding by 5.3% in Q1’2026 from 4.9% in Q1’2025, supported by broad-based growth, including construction, financial services, manufacturing and agriculture. This provides a more favourable starting point ahead of the 2017 election, although the sustainability of growth will be more important than the headline rate for capital markets. Continued economic expansion would support corporate earnings, government revenues and investor sentiment, while a broad-based slowdown during the electioneering period could weaken earnings expectations and increase risk aversion. The key risk ahead of 2027 is therefore not the election itself, but whether election-related uncertainty amplifies existing economic weaknesses, making the underlying growth environment an important determinant of the eventual impact on capital markets. The graph below shows Kenya’s GDP growth over the years:
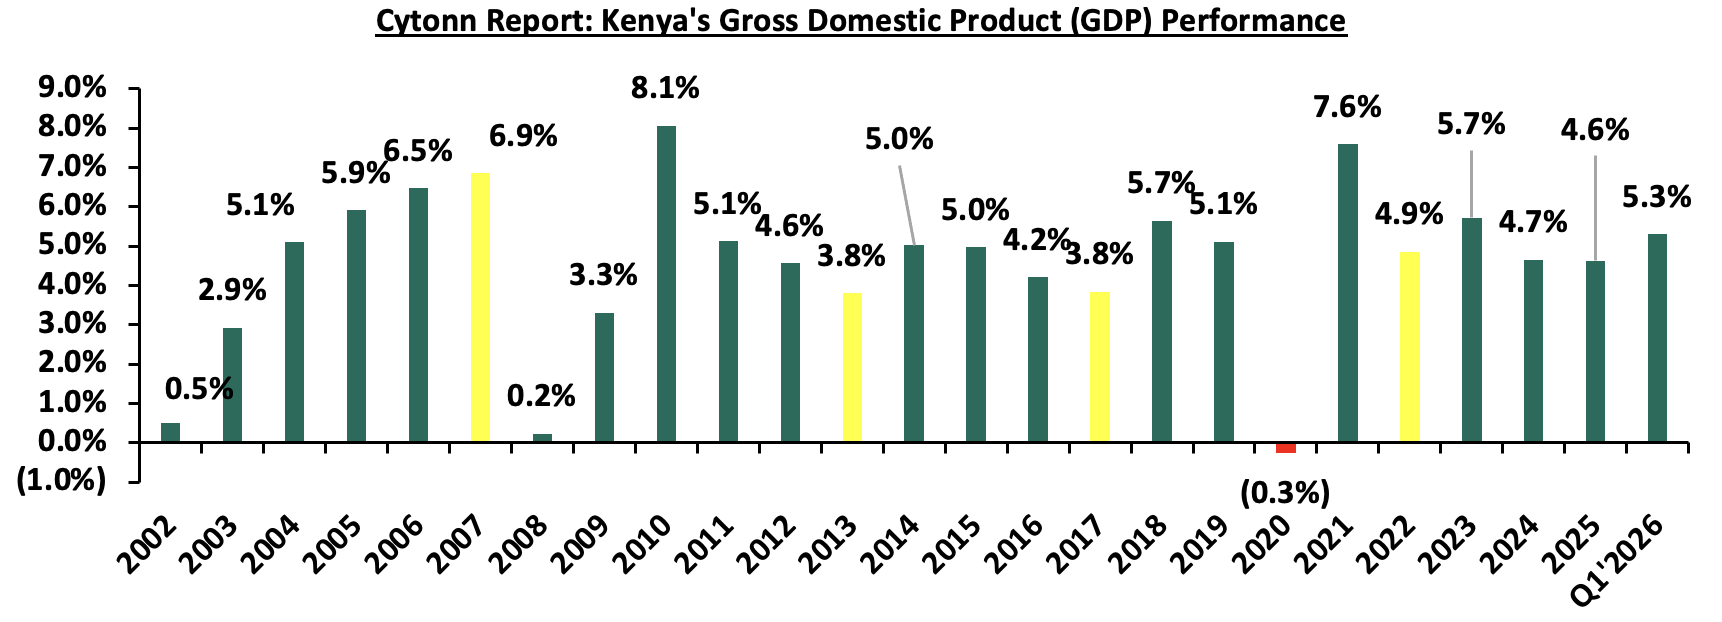
Source: World Bank
-
Government Borrowing
Government borrowing has generally increased across the pre-election, election and post-election periods, although the pace of accumulation has varied across election cycles. During the 2013 election cycle, total public debt increased to Kshs 2.1 tn in 2013 from Kshs 1.8 tn in 2012, before rising further to Kshs 2.5 tn in 2014. Similarly, debt increased to Kshs 4.6 tn in 2017 from Kshs 3.8 tn in 2016, before rising to Kshs 5.3 tn in 2018. During the 2022 election cycle, total public debt increased to Kshs 9.1 tn from Kshs 8.2 tn in 2021, representing an 11.0% increase, and rose further to Kshs 11.1 tn in 2023. Based on exchequer releases ggovernment spending around these periods followed a similar upward pattern. In FY2012/13, total expenditure stood at Kshs 1.1 tn, comprising Kshs 808.3 bn in recurrent expenditure and Kshs 298.9 bn in development expenditure. By FY2016/17, total expenditure had nearly doubled to Kshs 2.1 tn, with recurrent expenditure at Kshs 1.1 tn and development expenditure at Kshs 645.7 bn. In FY2021/22, total expenditure reached Kshs 3.1 tn, comprising Kshs 1.2 tn in recurrent expenditure, Kshs 1.2 tn in CFS exchequer issues and Kshs 341.0 bn in development expenditure. The continued increase in debt following the elections indicates that borrowing pressures can extend beyond the election year, as governments continue to finance expenditure commitments and fiscal deficits. The graph below shows Kenya’s debt before, during and after election years:
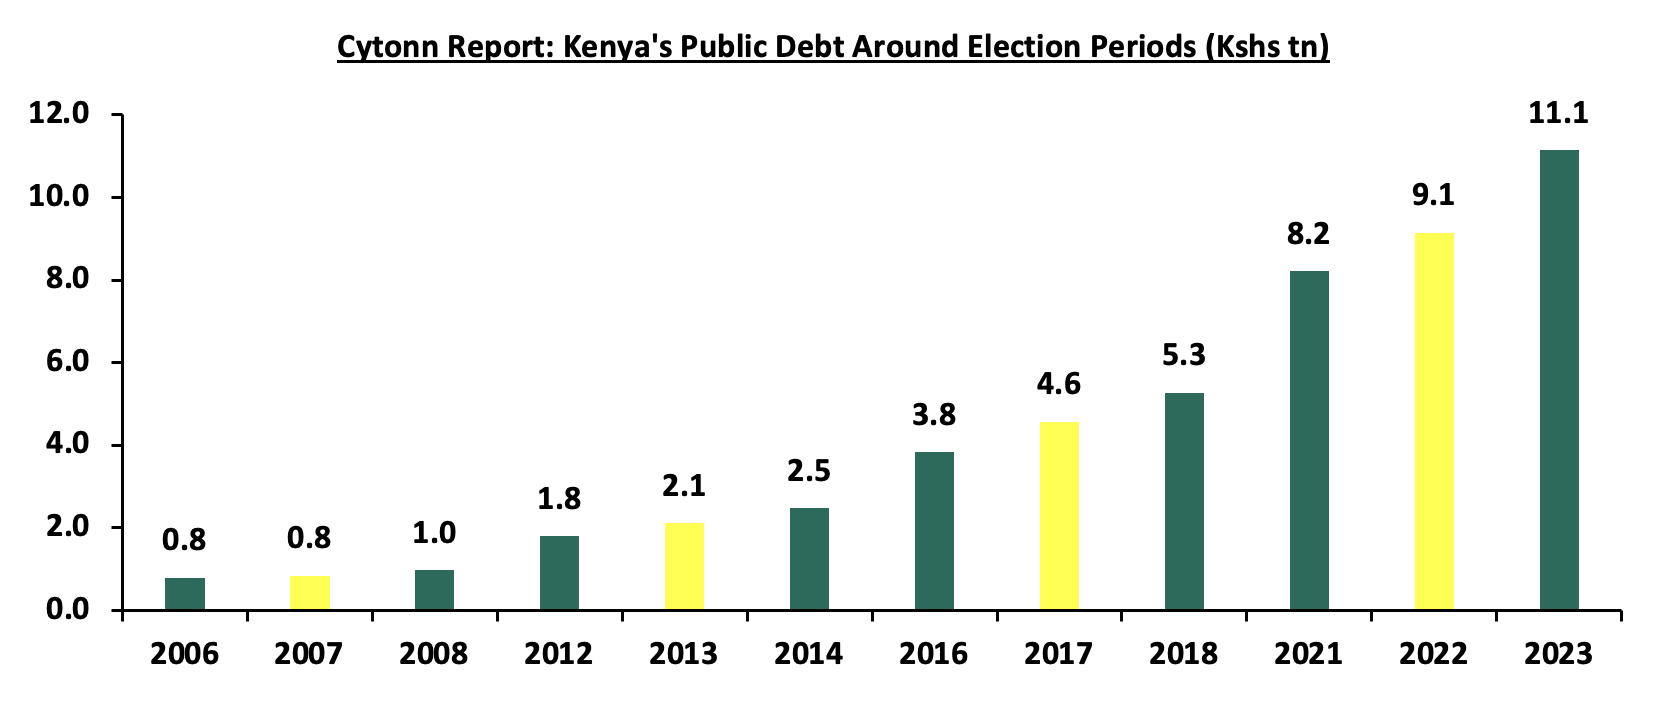
Source: Central Bank of Kenya
Kenya enters the 2027 election cycle with a sizeable fiscal financing requirement. As of June 2026, Kenya’s public debt stood at Kshs 13.0 tn. In the FY2026/27 Budget, total expenditure is projected at Kshs 4.8 tn, while the fiscal deficit is projected at Kshs 1.1 tn. However, since FY2026/27 will end in June 2027, the bulk of the approved budget will be executed before the August 2027 General Election. This makes the period leading up to the election particularly important for government borrowing, as any additional expenditure pressures, revenue shortfalls or supplementary budgets could increase financing requirements ahead of the polls. For the capital markets, higher domestic borrowing would increase the supply of government securities and could place pressure on liquidity and interest rates, particularly if borrowing exceeds the amounts initially provided for in the budget. Going into the election, the extent and duration of additional borrowing pressures will therefore depend on expenditure execution, revenue performance and whether supplementary financing requirements emerge during the electioneering period. The graph below shows composition of Kenya’s debt over the years:
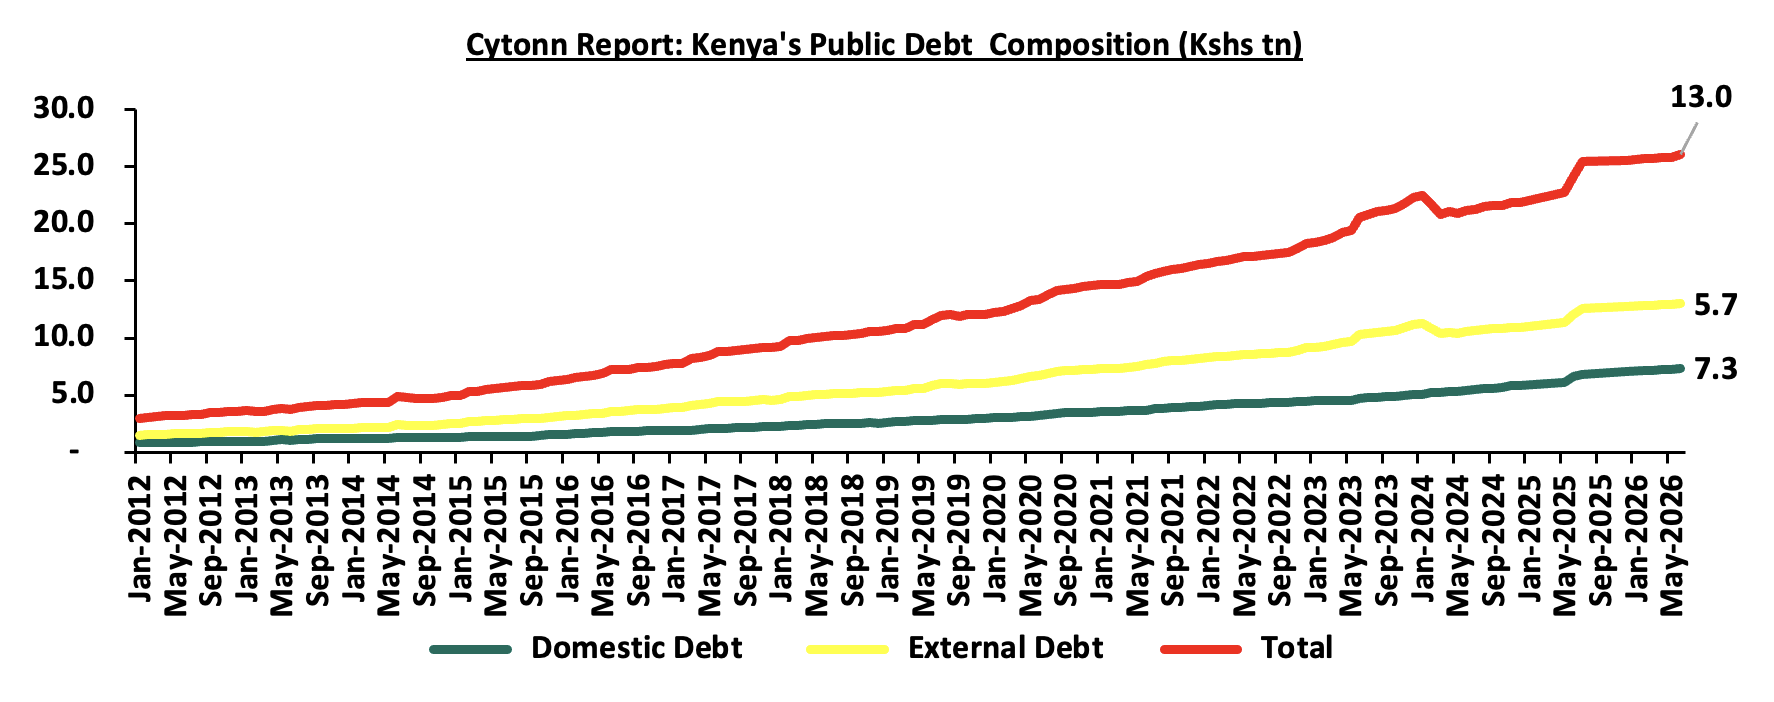
Source: Central Bank of Kenya
-
Interest Rates
Inflation has tended to come under pressure around Kenya's election cycles, although the magnitude has varied considerably depending on the broader economic environment. The 2007/08 election cycle provides the clearest example, with the disruption caused by post-election violence affecting the movement and supply of goods and contributing to a sharp acceleration in inflation. Inflation reached 31.5% in May 2008, before easing slightly to 29.3% in June and 26.5% in July, highlighting the extent to which severe political disruption can generate substantial supply-side price pressures. The 2013 election was associated with more moderate inflation, with inflation rising to 6.0% in July from 3.7% in January, while in 2017, inflation averaged 8.0%, up from 6.3% in 2016, and reached 8.0% in August around the election period. However, the 2017 increase was also driven by higher food and oil prices. The 2022 election similarly coincided with elevated inflation, which rose to 8.5% in August and peaked at 9.5% in November. This period, however, was heavily influenced by the Russia-Ukraine war, which drove global food, energy and fertiliser prices higher, alongside domestic supply pressures. The period highlights how election-related spending and uncertainty can add to inflationary pressures, particularly when they coincide with existing supply-side and external price shocks. As such, the impact of elections on inflation is likely to be more pronounced when election-related demand pressures occur alongside elevated input costs and supply constraints.
Kenya enters the 2027 election cycle with inflation contained but relatively close to the upper end of the CBK's target range. Inflation increased to 6.5% in July 2026, from 6.4% in June, remaining within the CBK's 2.5%–7.5% target range but above the 5.0% midpoint. The CBR has been maintained at 8.75% since February 2026, following a reduction from 9.00% in December 2025, with the MPC subsequently retaining the rate in April , June and August meetings. This leaves monetary policy in a relatively accommodative position, but with less room for aggressive easing if inflationary pressures intensify. For 2027, therefore, the key concern is whether election-related pressures add to existing inflationary drivers. A contained inflation environment would allow the CBK greater flexibility to maintain or ease monetary conditions, supporting borrowing conditions and asset valuations, conversely, renewed food, fuel or demand pressures, potentially amplified by election-related activity, could constrain monetary easing and keep interest rates elevated. The graph below shows comparison between CBR and inflation rates over the years:
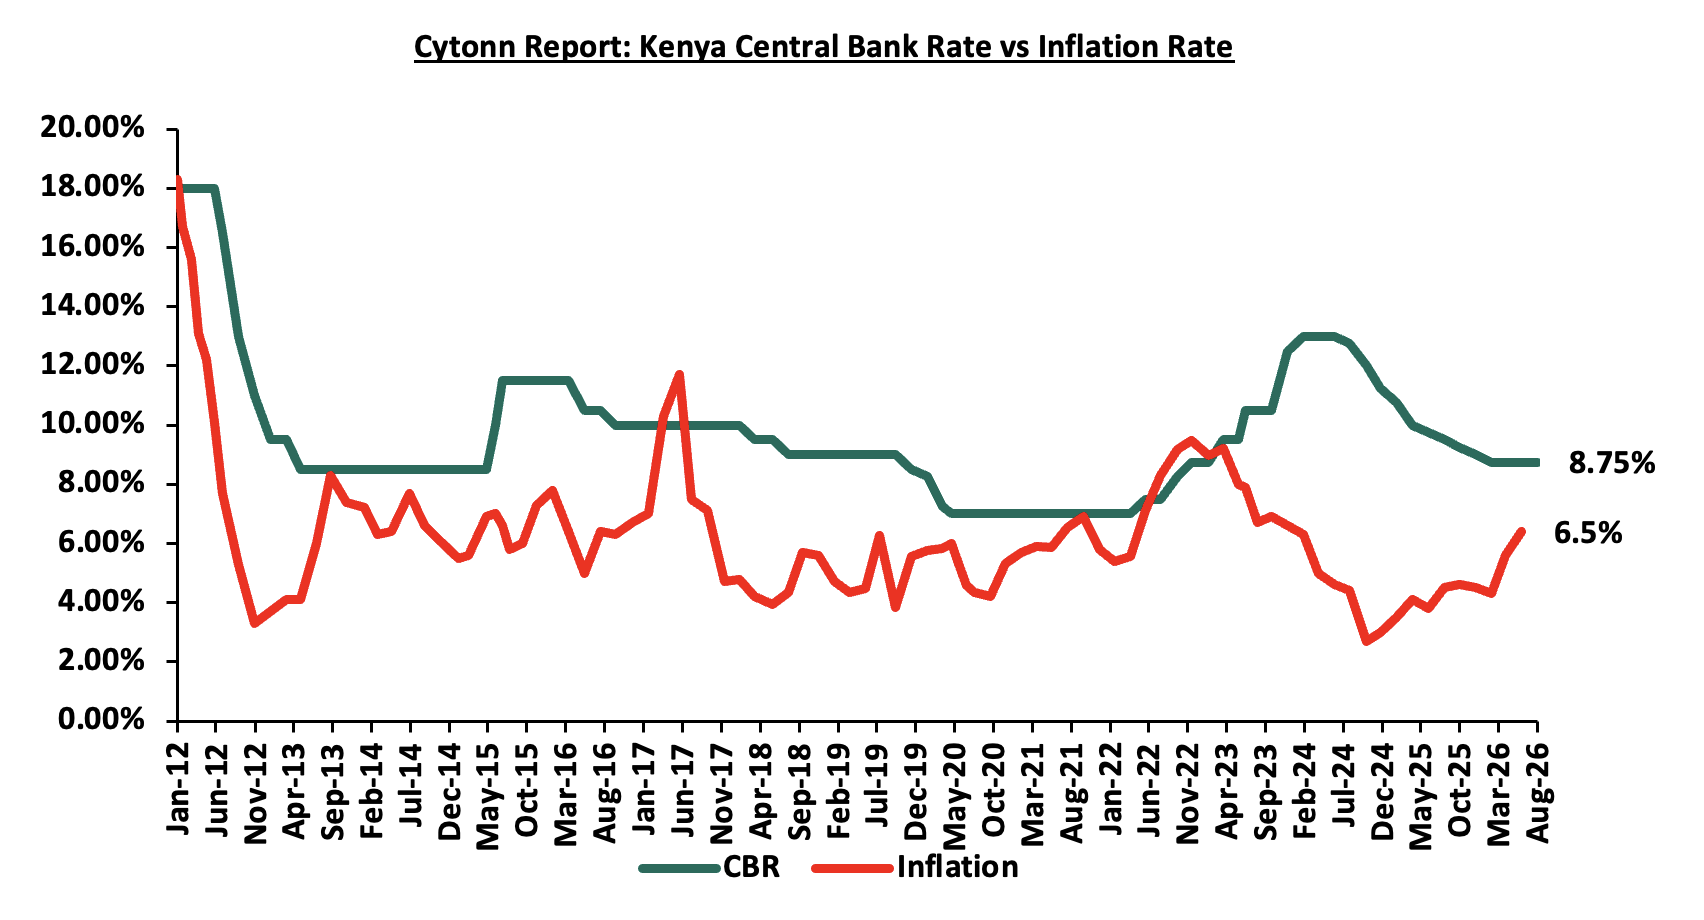
Source: CBK and KNBS
-
Private-Sector Credit and Business Activity
Private-sector credit growth also varied across the election cycles. In 2013, credit growth increased to 20.1% in December from 12.0% in January. In contrast, credit growth stood at 3.9% in December 2017 and declined further to 2.4% in December 2018, as prolonged political uncertainty following the 2017 election continued to weigh on credit demand and private-sector activity. During the 2022 election cycle, credit growth strengthened to 12.7% in December 2022 from 8.6% in December 2021. As Kenya approaches the 2027 election, private-sector credit growth stood at 10.2% in July 2026, indicating a relatively supportive credit environment ahead of the polls. However, the 2017-2018 experience highlights the potential for prolonged election-related uncertainty to weaken credit demand and private-sector activity beyond the election period if uncertainty persists. The graph below shows Kenya’s Private Sector growth over the years:
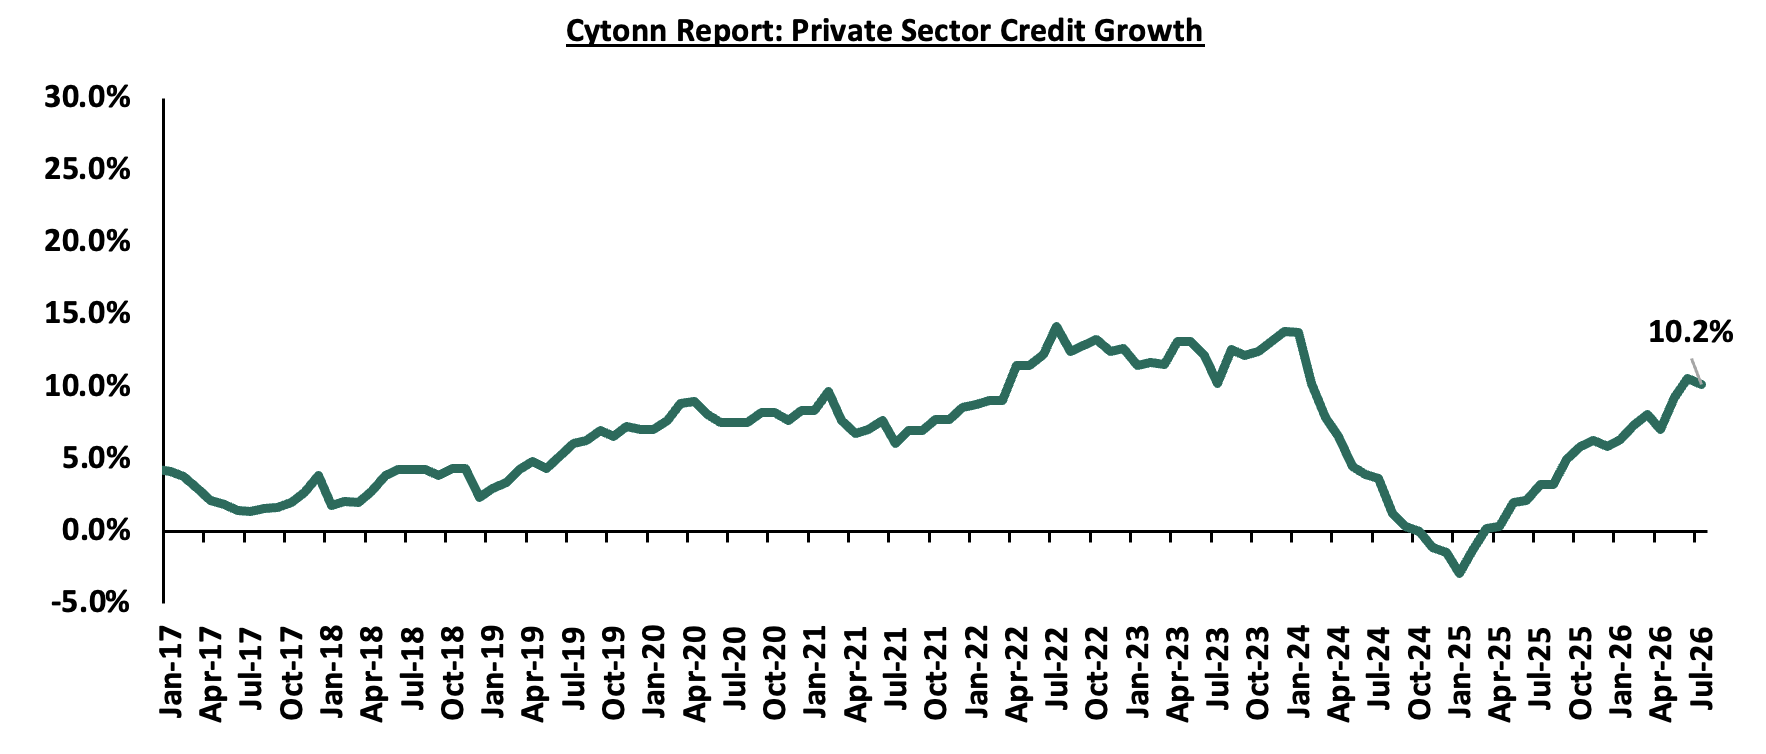
Source: CBK
Business activity, as measured by the Stanbic’s Purchasing Managers’ Index (PMI), also weakened as the country approached the elections. In the 2017 election cycle, PMI declined to 42.0 in August 2017 from 52.0 in December 2016, moving from above the 50.0 threshold that indicates a shift from expansion to contractionary territory. A similar pattern was observed in 2022, with PMI declining to 44.2 in August 2022 from 53.1 in December 2021, again moving from expansionary to contractionary territory. The decline in PMI during both election periods suggests that prolonged election-related uncertainty can weigh on business activity as firms delay investment and spending decisions. As Kenya approaches the 2027 election, PMI stood at 51.3 in July 2026, remaining above the 50.0 threshold and indicating continued expansion in private-sector activity. However, the experience of the previous two election cycles highlights the potential for prolonged election-related uncertainty to weaken private-sector activity if businesses adopt a wait-and-see approach ahead of the polls. The graph below shows Kenya’s Purchasing Manager’s Index over the years;
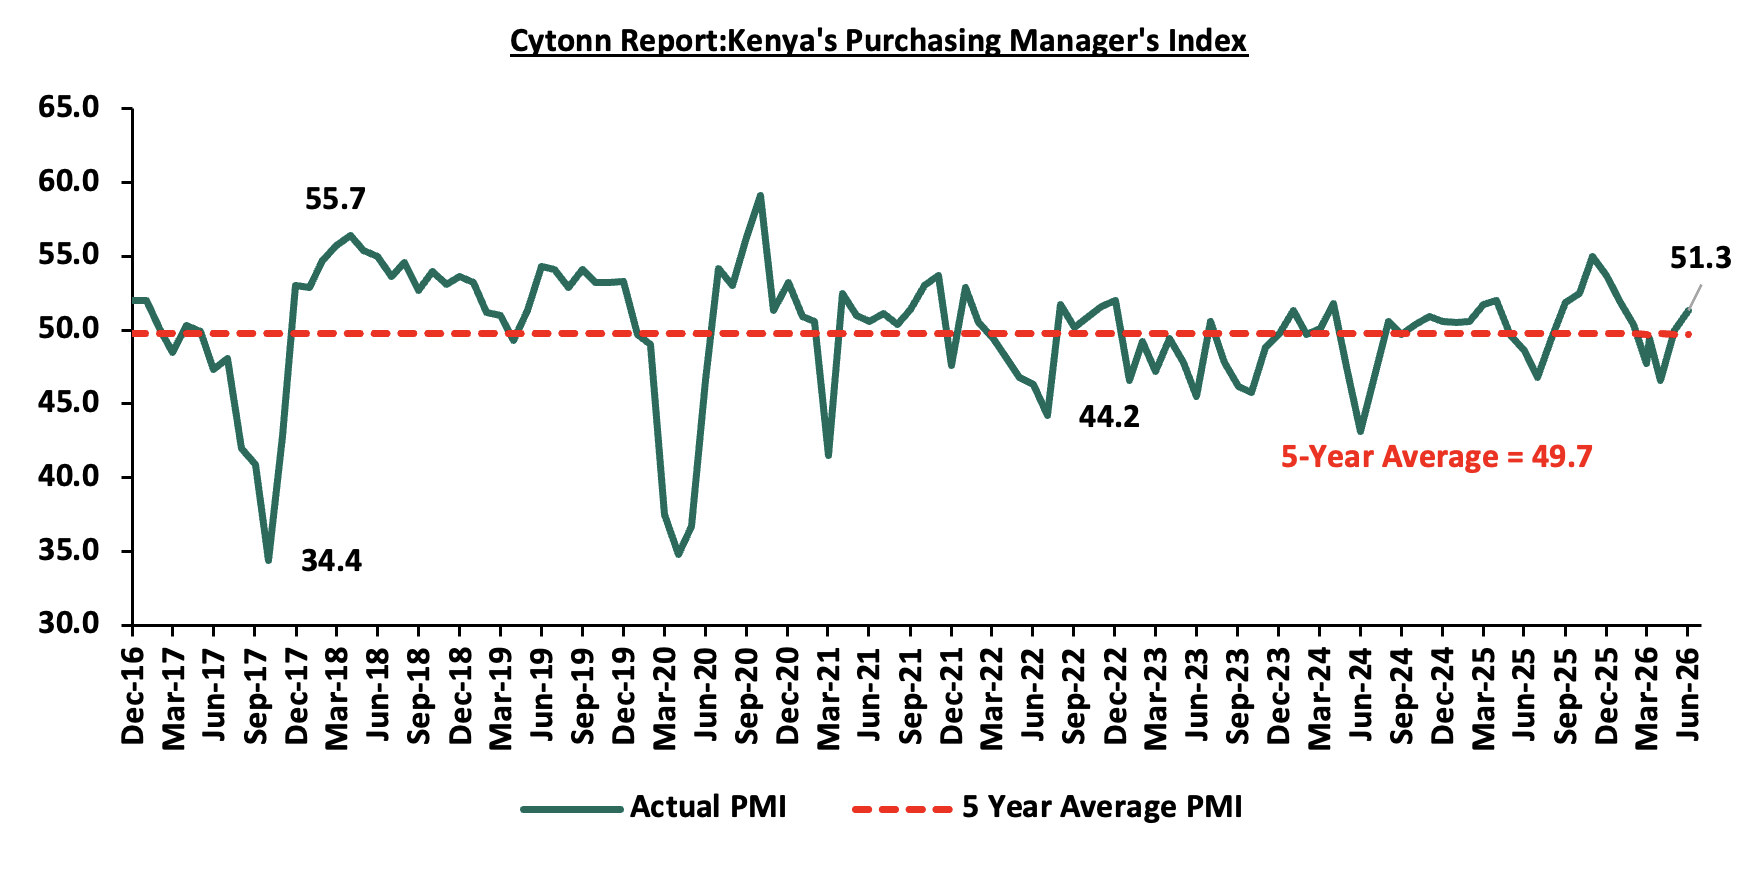
Source: Stanbic PMI
-
Foreign Direct Investment
Foreign direct investment provides an important gauge of international investors' longer-term confidence in Kenya. Election periods can create a wait-and-see approach, as investors may defer new commitments until there is greater clarity on the political and policy environment. FDI inflows increased to USD 1.4 bn in 2017 from USD 1.1 bn in 2016, while inflows increased to USD 1.5 bn in 2022 from USD 1.4 bn in 2021. The Kenya Shilling depreciated by 0.7% to Kshs 103.2 per US Dollar in 2017 from Kshs 102.5 in 2016, and by 9.0% to Kshs 123.4 per US Dollar in 2022 from Kshs 113.1 in 2021. The weaker Shilling may have improved the relative cost of investing in Kenya, as local assets and production costs became cheaper in US Dollar terms, potentially supporting FDI inflows during the election cycles. The graph below shows Kenya’s Foreign Direct Investments over the years;
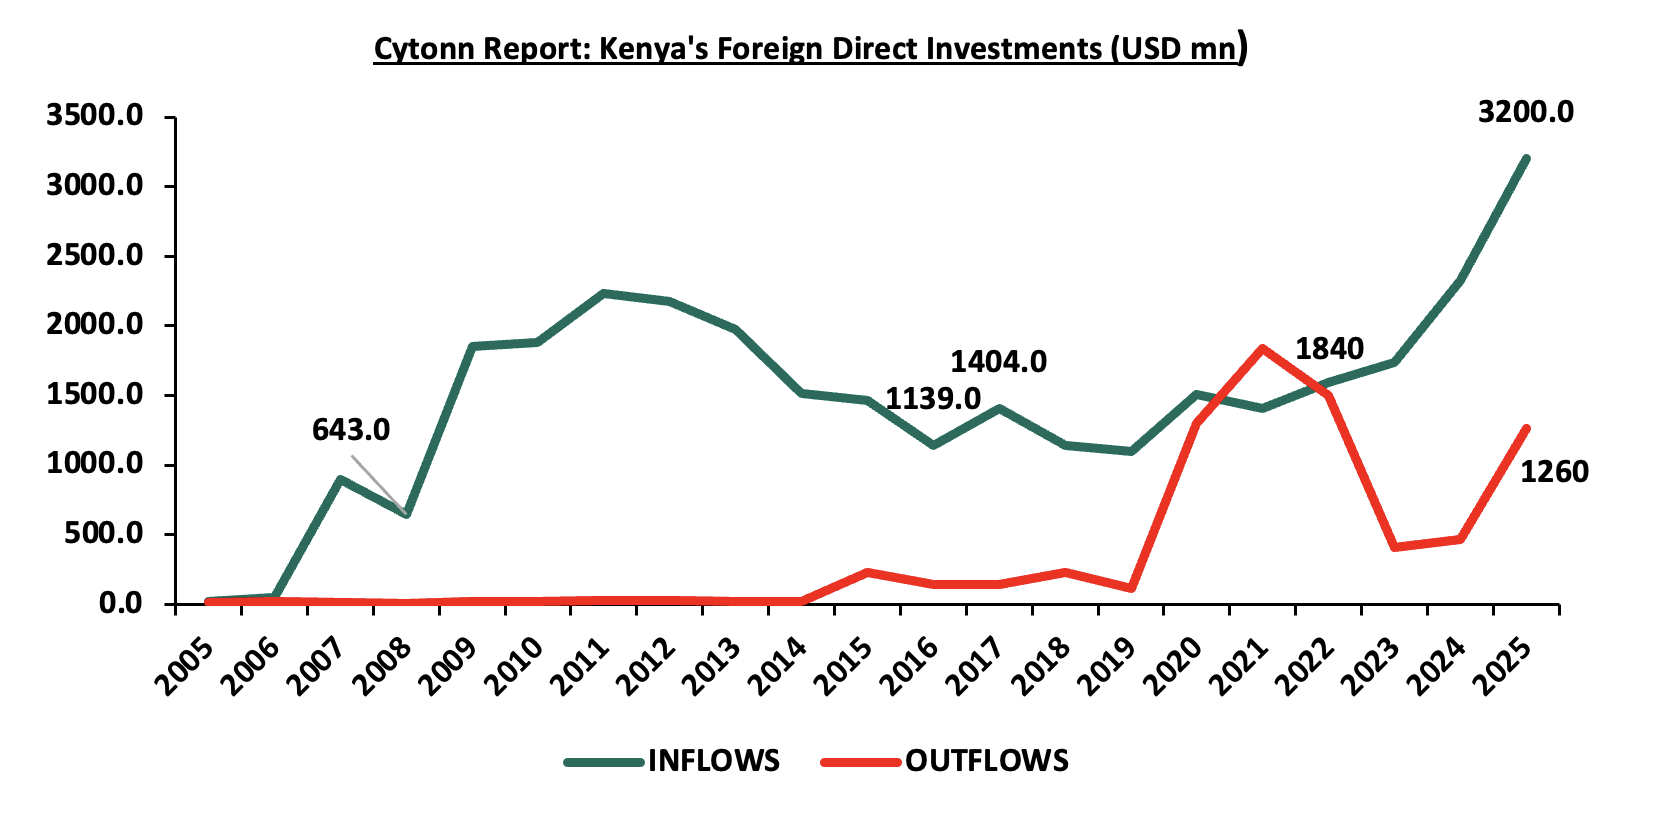
Source: UNCTAD
The latest data provide a stronger starting point ahead of 2027, with FDI inflows rising to USD 3.2 bn in 2025 from USD 2.3 bn in 2024, supported by increased investment in digital infrastructure and renewable energy. Going into the 2027 General Election, maintaining investor confidence will be important in sustaining this momentum, as election-related uncertainty could influence the timing of new investment commitments. While a weaker Shilling could continue to improve the relative cost of Kenyan assets for foreign investors, significant exchange-rate volatility could increase currency risk and offset this advantage.
-
Corporate Earnings and Market Valuations
The 2017 election cycle illustrates that strong equity-market performance can coexist with election-related uncertainty. In our Cytonn Annual Markets Review 2017, the NASI gained 28.4%, compared with a 3.8% decline in 2016, supported by gains in large-cap counters including DTB-K, KCB Group, Safaricom, Equity Group and Co-operative Bank. This performance occurred despite foreign investors shifting to net outflows of USD 117.1 mn in 2017 from net inflows of USD 88.8 mn in 2016, which was attributable partly to negative sentiment arising from the election period and profit-taking following the market rally. At the same time, the market's P/E ratio rose to 13.5x from a historical average of 13.4x, indicating a valuation re-rating even as corporate earnings, particularly in the banking sector, remained under pressure from the interest-rate cap and subdued private-sector credit growth. The 2017 experience therefore points to valuation expansion and investor sentiment playing a greater role in market performance than earnings growth alone, while election uncertainty was reflected more strongly in foreign investor positioning than in the headline market return. The graph below shows NASI performance over the years:
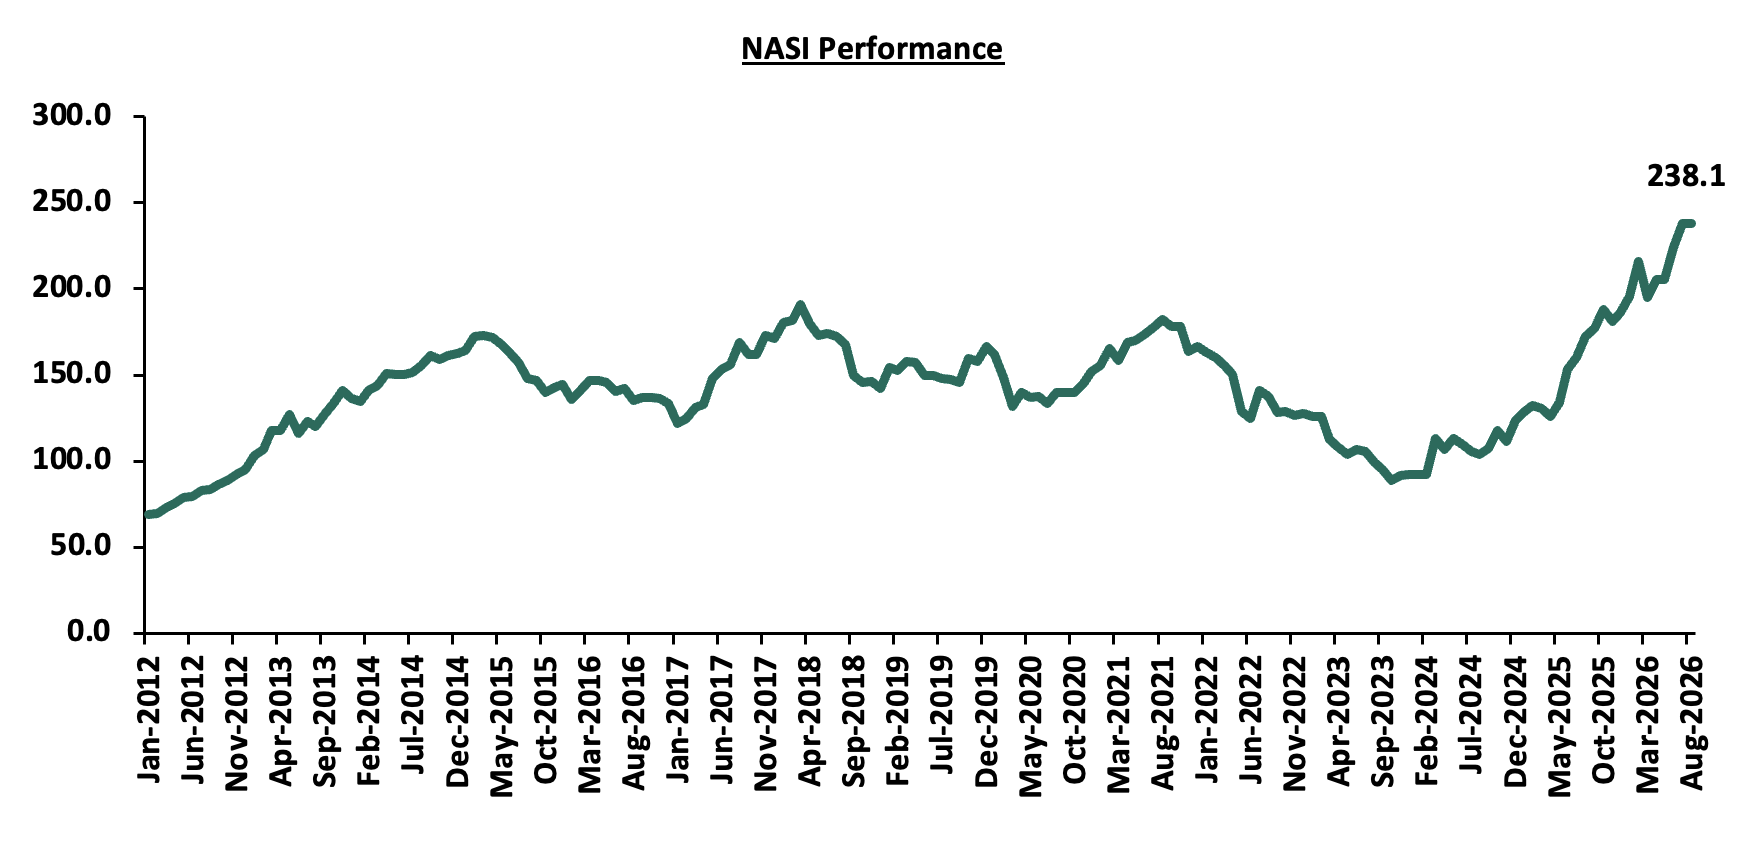
Source: Nairobi Securities Exchange (NSE)
The 2022 election cycle produced a markedly different outcome, with the NASI declining 23.7%, following a 1.2% decline in 2021, while foreign investor net outflows increased to USD 204.3 mn from USD 91.9 mn. In our Cytonn Annual Markets Review 2022, the heightened foreign selling largely attributable to monetary tightening in advanced economies, which increased the attractiveness of dollar-denominated assets, while elevated inflation, currency pressures and the Russia-Ukraine conflict further weakened investor sentiment. Corporate performance also came under pressure, with companies issuing profit warnings increasing to ten from four in 2021, although listed banks recorded 26.6% growth in weighted core EPS in FY2022, according to our Cytonn Listed Banks FY'2022 Report. Meanwhile, the market's P/E ratio fell to 6.7x from 11.5x in 2021, while the dividend yield rose to 6.6% from 4.1%, pointing to significant valuation compression. The 2022 experience highlights the heightened sensitivity of the equity market to election-related uncertainty, with increased foreign selling and significant valuation compression during the election cycle. These pressures were reinforced by elevated global interest rates, inflationary pressures and currency weakness, which increased the attractiveness of dollar-denominated assets and weakened investor sentiment toward emerging markets. The graph below shows NASI performance over the years:
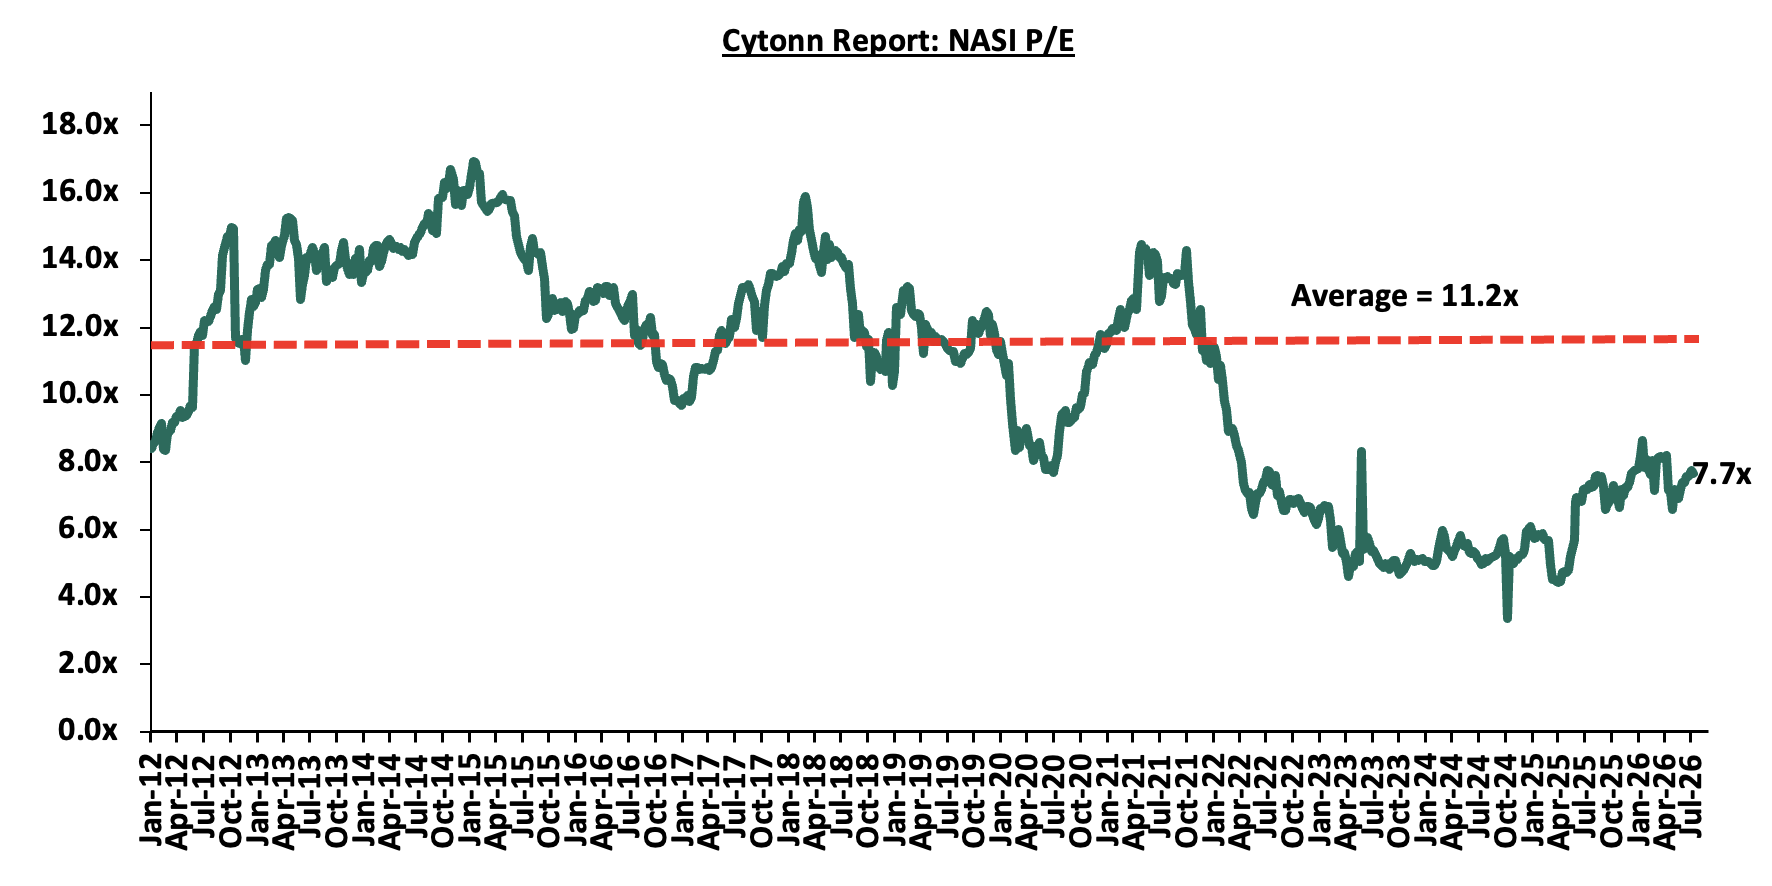
Source: Nairobi Securities Exchange (NSE)
The contrasting 2017 and 2022 experiences demonstrate that election cycles affect equities primarily through investor sentiment, foreign positioning and the risk premium attached to Kenyan assets, while the ultimate market outcome depends on the interaction with corporate earnings and valuations. In 2017, valuations expanded despite foreign selling and earnings pressure, supporting strong market returns; in 2022, stronger earnings in some sectors were insufficient to prevent a sharp decline as foreign outflows and broader risk aversion drove a significant valuation compression. This suggests that the impact of election uncertainty is likely to be greater where it coincides with weak earnings, elevated valuations or sustained foreign selling, while stronger fundamentals can provide a greater buffer against election-related volatility. Going into the 2027 General Election, the performance of the equities market will therefore depend on how election-related uncertainty interacts with prevailing global financial conditions, particularly foreign investor positioning, interest rates and market valuations.
-
Real Estate
Real estate provides an important component of Kenya's alternative investment landscape, with investors often viewing property as a relatively stable, long-term store of value, particularly during periods of heightened uncertainty. This perception can support investment activity even when economic and political conditions become less certain, although the sector remains sensitive to broader economic conditions and financing costs. Real estate sector growth increased marginally to 4.1% in 2013 from 4.0% in 2012. In 2017, growth slowed to 6.7% from 9.8% in 2016, while in 2022 it moderated further to 4.5% from 6.7% in 2021. The slower growth recorded during the 2017 and 2022 election years points to the potential impact of election-related uncertainty on real estate activity, as investors and developers may delay investment and development decisions while awaiting greater clarity on the political and economic environment. The graph below shows real estate sector growth over the years;
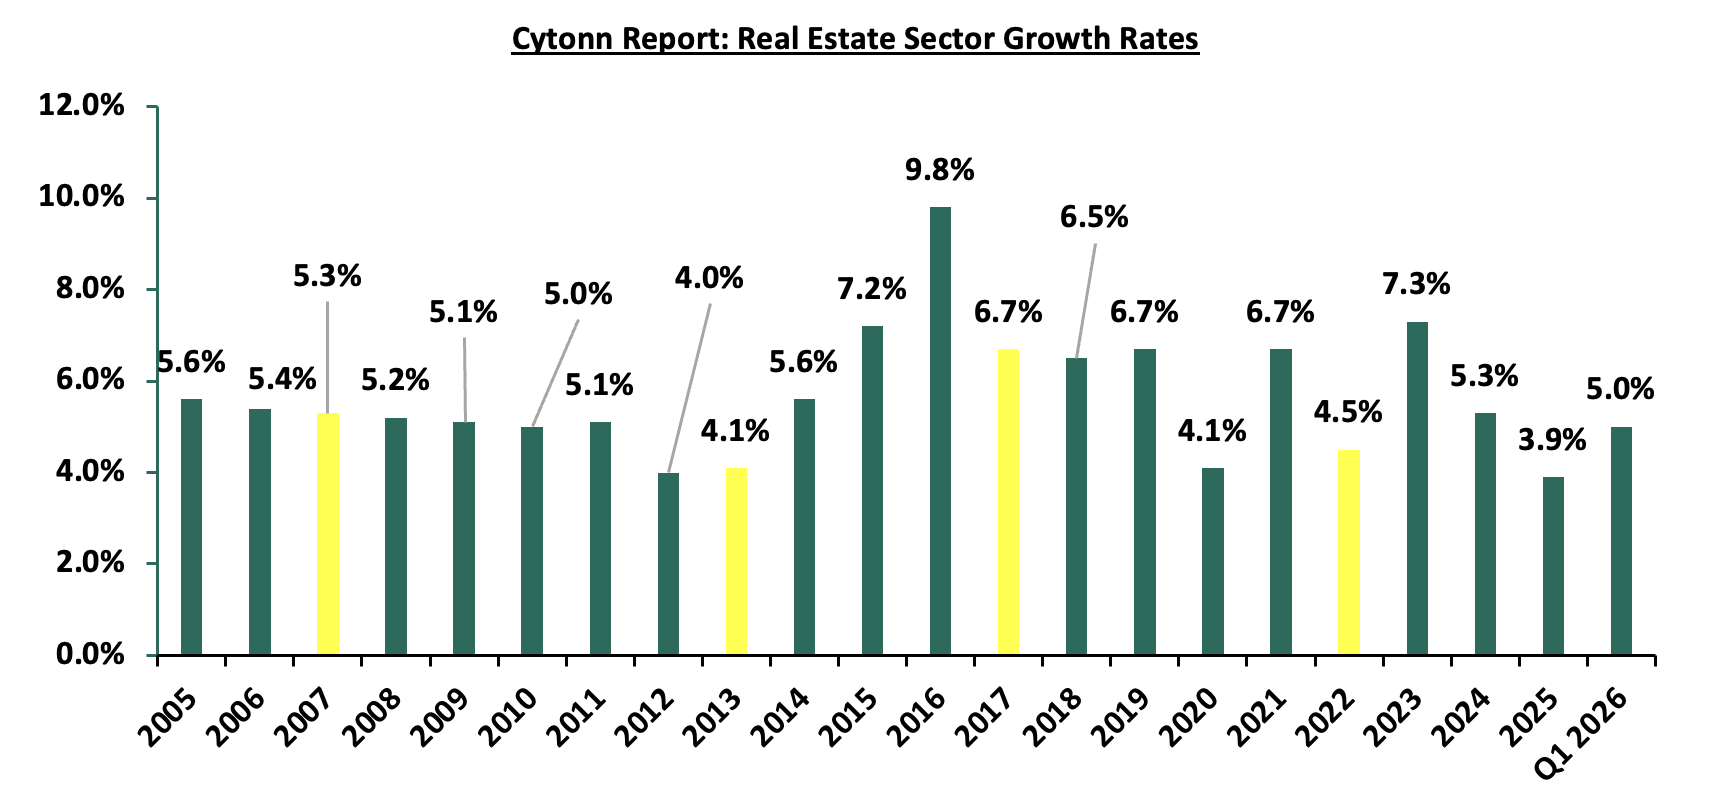
Source: Kenya National Bureau of Statistics (KNBS)
The moderation in 2017 and 2022 highlights the influence of election-related uncertainty on real estate activity, although the extent of the impact varied across the two election cycles. In 2017, the sector continued to expand at 6.7%, while the sharper slowdown in 2022 occurred alongside elevated inflation, tighter financial conditions and weaker economic activity. Real estate investment decisions also tend to have a longer horizon, meaning that investors may be less responsive to short-term political uncertainty where they retain confidence in the underlying value of the asset. Nevertheless, election-related uncertainty can influence the timing of investment decisions, particularly where investors and developers adopt a wait-and-see approach ahead of the polls. The sector's performance around previous election cycles therefore suggest that political uncertainty can weigh on real estate activity, with its impact shaped by broader economic growth, financing conditions and investor confidence. REITs provide the more direct capital-markets channel for property investment, although their relatively limited market depth in Kenya constrains the extent to which they can be used to assess election-related effects.
-
Outlook
In this section, we give our expectations on the effects of the 2027 General Election on Kenya's investment environment, considering the historical experience of previous election cycles and the prevailing macroeconomic, fiscal and market conditions. Our outlook is summarized below:
|
Measure |
Sentiment |
Outlook |
|
GDP |
We expect economic activity to remain resilient as Kenya approaches the 2027 General Election, supported by the 5.3% real GDP growth recorded in Q1'2026, up from 4.9% in Q1'2025. However, the World Bank projects growth to moderate to 4.3% in 2026 before strengthening to 4.4% over the medium term. Election-related uncertainty could weigh on private investment and business activity if prolonged, with the magnitude of the impact depending on the duration of political uncertainty and its effect on investor confidence, domestic demand and financing conditions. |
Neutral |
|
Government Borrowing |
We expect government borrowing requirements to remain elevated as the country approaches the election. The FY2026/27 Budget provides for total expenditure of Kshs 4.8 tn and a fiscal deficit of about Kshs 1.1 tn, to be financed through a combination of domestic and external borrowing. Continued reliance on domestic financing could increase competition for liquidity and exert pressure on government securities yields, particularly if election-related expenditure increases beyond budgeted levels. |
Negative |
|
Interest Rates and Inflation |
We expect the interest-rate environment to remain relatively stable, although elevated inflation could constrain the scope for further monetary easing. The CBR currently stands at 8.75%, while inflation increased to 6.5% in July 2026, remaining within the CBK's 2.5%–7.5% target range but above the 5.0% midpoint. As the election approaches, fiscal and demand pressures could add to inflationary risks, while ongoing geopolitical tensions and the Iran war could exert further pressure through higher and more volatile global oil prices. This could limit the scope for further rate cuts and keep interest rates elevated if imported inflation persists. |
Neutral |
|
Private-Sector Credit and Business Activity |
Private-sector credit growth and business activity remain relatively supportive ahead of the 2027 election, with credit growth at 10.2% and PMI at 51.3 in July 2026. However, prolonged election-related uncertainty could weaken credit demand and private-sector activity, particularly if businesses delay investment and spending decisions, as observed during the 2017-2018 period. |
Neutral |
|
Foreign Direct Investments |
We expect FDI to remain relatively resilient ahead of the 2027 General Election, supported by Kenya's longer-term investment fundamentals and the recent improvement in foreign investment inflows. FDI inflows increased by 37.7% to a record USD 3.2 bn in 2025 from USD 2.3 bn in 2024, providing a stronger starting position ahead of the election. Proposed large-scale investments, including the Dangote refinery in Lamu, further highlight continued investor interest in Kenya's energy and infrastructure potential. However, election-related uncertainty could result in delays to some investment decisions as investors adopt a more cautious approach ahead of the polls. |
Neutral |
|
Corporate Earnings and Market Valuations |
We expect corporate earnings to remain an important support for the equity market, particularly if economic activity remains resilient. However, the strong appreciation in the NASI means that investor sentiment and valuation levels will remain important as election uncertainty increases. Foreign investor positioning could also become more sensitive to political risk, as demonstrated in previous election cycles. |
Neutral |
|
Real Estate |
We expect the real estate sector to remain relatively resilient as Kenya approaches the 2027 General Election, supported by an expected increase in the rollout of Affordable Housing Programme projects and associated infrastructure development. The FY'2026/27 Budget allocates Kshs 809.0 bn to development expenditure, of which Kshs 531.3 bn is allocated to infrastructure, accounting for 75.7% of total development expenditure. Continued investment in affordable and social housing, alongside infrastructure development, should support construction activity and demand for related real estate services. However, the sector remains exposed to election-related uncertainty, financing conditions and household purchasing power, which could moderate private-sector activity. Real estate may also continue to attract investors seeking relatively stable, long-term assets during periods of uncertainty. |
Neutral |
Overall, we expect the 2027 General Election to have a NEUTRAL effect on Kenya's investment environment. Of the seven measures assessed, six carry a Neutral outlook, reflecting a relatively resilient economic and market backdrop heading into the election. However, election-related uncertainty could affect investment decisions, investor positioning, financing conditions and market sentiment as the country approaches the polls.
-
Conclusion and Our View
The historical evidence shows that election cycles have actual impact on Kenya's economic and investment environment, although the magnitude and direction of the impact have varied considerably across election periods. The 2007/08 cycle demonstrates the potential for political instability to cause a severe disruption to economic activity, while the 2013 and 2017 elections show that the economy and capital markets can remain resilient even amid election-related uncertainty where underlying macroeconomic conditions are supportive. The 2022 experience further reinforces this distinction, as the weaker economic and market performance occurred alongside elevated inflation, global monetary tightening, currency pressures and the Russia-Ukraine conflict. Overall, the historical experience suggests that election-related uncertainty can influence economic activity, investor sentiment, capital flows and market valuations, with prevailing domestic and global conditions shaping the extent of the impact.
Going into the 2027 General Election, Kenya enters the electioneering period with a relatively resilient but increasingly constrained investment environment. Real GDP growth remains positive, FDI has strengthened significantly, and continued investment in infrastructure and affordable housing should provide support to economic activity and alternative investments. However, elevated government borrowing requirements, inflation remaining above the CBK's midpoint, and the potential for increased political uncertainty present downside risks. In the capital markets, the sustainability of equity performance will depend increasingly on corporate earnings, valuations and foreign investor positioning, while the real estate sector should benefit from public investment but remain sensitive to financing conditions and purchasing power. We therefore expect the 2027 election cycle to increase uncertainty across the investment environment and influence investor sentiment, capital flows and investment decisions. The extent to which this translates into broader economic and capital-market effects will depend on fiscal policy, inflation, economic growth and global financial conditions, as well as the duration and intensity of political uncertainty as the country moves through the election period
Disclaimer: The views expressed in this publication are those of the writers where particulars are not warranted. This publication, which is in compliance with Section 2 of the Capital Markets Authority Act Cap 485A, is meant for general information only and is not a warranty, representation, advice or solicitation of any nature. Readers are advised in all circumstances to seek the advice of a registered investment advisor.

- Talk to us
- Kenya
- P.O Box 20695 - 00200, Nairobi, Kenya
- Cell +254709101200
- Tel +254709101200
- WhatsApp +254741676635
- United States
- +254709101200
- DOWNLOAD OUR APP
-


- Kenya
- 8th Floor, Pinetree Plaza, Kaburu Drive, Ngong Road, Nairobi, Kenya
- USA
- Suite 1150, 1775 Eye Street NW, USA, Washington DC 20006, USA
- Investments
- High Yield
- Private Equity
- Real Estate
- Real Estate
- RiverRun Estates
- Cytonn Towers
- The Ridge
- Taraji Heights
- The Alma