Financial Planning Amidst Challenging Economic Environment, & Cytonn Weekly #20/2023
By Research Team, May 21, 2023
Executive Summary
Fixed Income
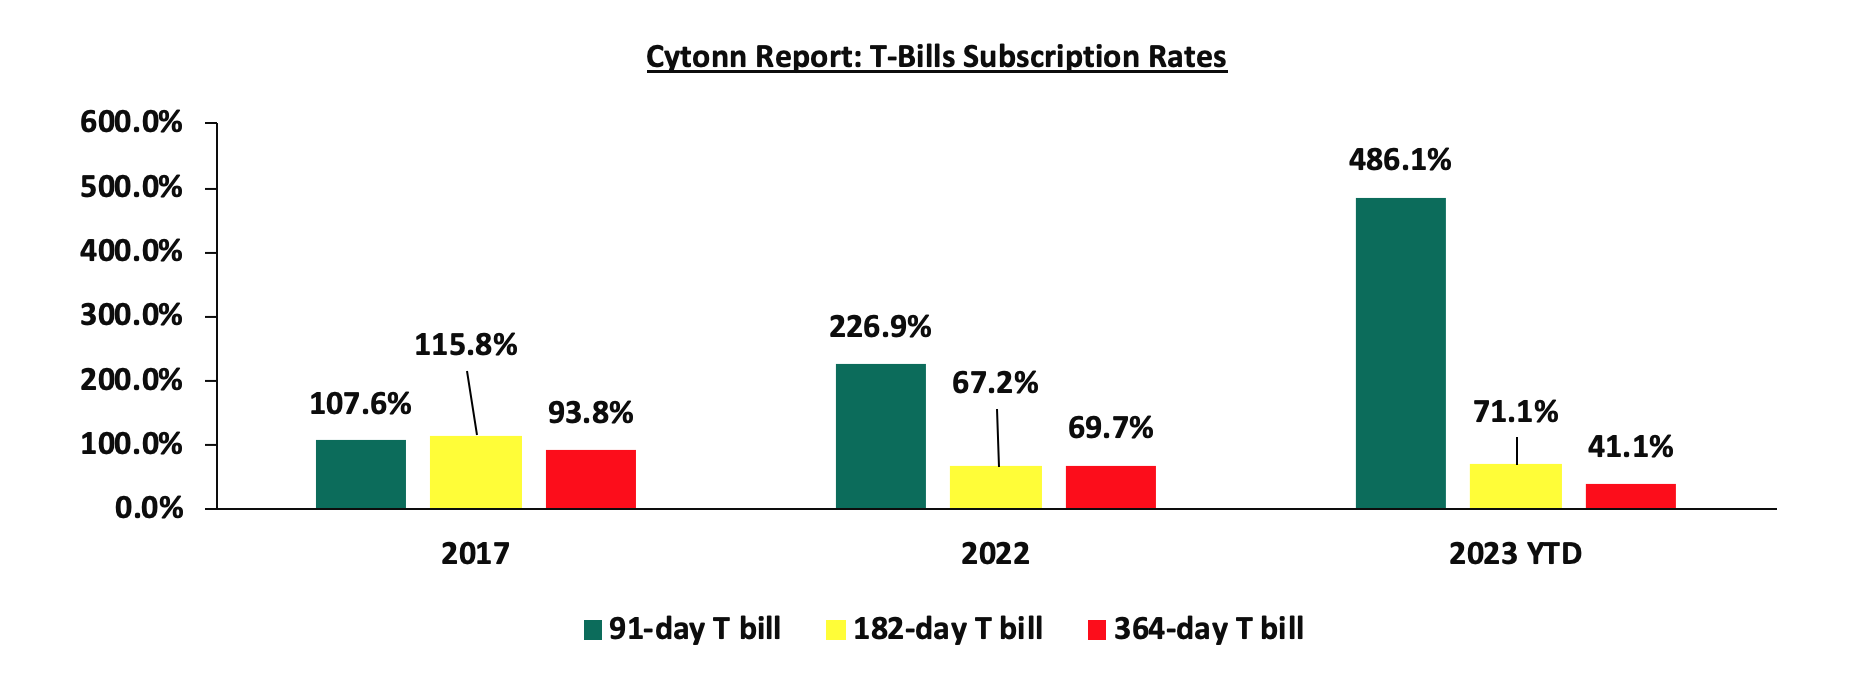
During the week, T-bills were oversubscribed, with the overall subscription rate coming in at 150.1%, down from the 188.9%, recorded the previous week. Investor’s preference for the shorter 91-day paper persisted as they sought to avoid duration risk, with the paper receiving bids worth Kshs 24.0 bn against the offered Kshs 4.0 bn, translating to an oversubscription rate of 602.3%, lower than the 865.8% recorded the previous week. The subscription rate for the 182-day paper declined to 42.2%, down from the 88.4% recorded the previous week, while the subscription rate for the 364-day paper increased to 77.1%, up from 18.6%, recorded the previous week. The government accepted bids worth Kshs 36.0 bn of the total bids received, translating to an acceptance rate of 99.9%. The yields on the government papers were on an upward trajectory, with the yields on the 364-day paper, 182-day and 91-day papers increasing by 12.0 bps, 12.5 bps and 10.8 bps to 11.4%, 11.0% and 10.5%, respectively;
In the primary bond market, the Central Bank of Kenya released the tap sale results for the Treasury bond FXD1/2023/003 with tenor to maturity of 3 years. In line with our expectations, the bond was oversubscribed, receiving bids worth Kshs 10.6 bn, against the offered Kshs 10.0 bn, translating to an oversubscription rate of 106.0%, partly attributable to investors’ preference for shorter dated bonds as they seek to avoid duration risk;
Also, during the week, the Energy and Petroleum Regulatory Authority (EPRA) released their monthly statement on the maximum retail fuel prices in Kenya effective 15 May 2023 to 14 June 2023;
Equities
During the week, the equities market recorded mixed performance with NASI and NSE 25 gaining by 5.3% and 2.7% respectively, while NSE 20 declined by 0.3%, taking the YTD performance to losses of 22.6%, 12.4% and 18.1% for NASI, NSE 20 and NSE 25, respectively. The equities market performance was mainly driven by gains recorded by large cap stocks such as Safaricom, KCB Group, EABL and Standard Chartered Bank-Kenya of 13.2%, 8.2%, 4.8% and 3.5% respectively. The gains were however weighed down by losses recorded by banking stock such as Diamond Trust Bank (DTB-K), Equity Group and BAT of 9.4%, 5.9% and 2.0% respectively;
During the week, three listed banks released their Q1’2023 financial results all recording an increase in their Core Earnings Per Share. Standard Chartered Bank Kenya, Equity Group Holdings and Co-operative Bank recorded an increase in their Core earnings per share of 45.7%, 7.9% and 4.7%, respectively;
Real Estate
During the week, the Central Bank of Kenya (CBK) released the Bank Supervision Annual Report 2022, highlighting that the number of mortgage accounts increased by 4.0% to 27,786 in 2022, from 26,723 in 2021, which also represented a 10-year Compounded Annual Growth Rate (CARG) of 4.1%, from 18,587 recorded in 2012. In the Regulated Real Estate Funds, under the Real Estate Investment Trusts (REITs) segment, Fahari I-REIT closed the week trading at an average price of Kshs 6.0 per share in the Nairobi Securities Exchange, representing an 8.3% increase from Kshs 5.5 per share recorded the previous week. On the Unquoted Securities Platform as at 19 May 2023, Acorn D-REIT and I-REIT closed the week trading at Kshs 23.9 and Kshs 20.9 per unit, respectively, a 19.4% and 4.4% gain for the D-REIT and I-REIT, respectively, from the Kshs 20.0 inception price. In addition, Cytonn High Yield Fund (CHYF) closed the week with an annualized yield of 13.7%, remaining relatively unchanged from what was recorded the previous week;
Focus of the Week
People face various financial obligations in different stages of their lives that range from medical expenses, education expenses and other miscellaneous expenses. Currently, the expenses have been worsened by the high cost of living in Kenya that has adversely impacting the financial stability and overall well-being of the people. Despite the high cost of living, it is key to note that a lot of financial challenges are often caused by poor financial planning. Financial Planning refers to a process that helps an individual to make sound decision about money that can help one to achieve financial goals. Having a sound personal financial plan is important because it helps reduce and possibly eliminate financial distress arising from various responsibilities and unexpected situations. The purpose of this week’s focus note is thus to highlight the importance of financial planning, the various considerations to make based on one’s own characteristics, needs and preferences, and some of the investment avenues available in Kenya;
Investment Updates:
- Weekly Rates:
- Cytonn Money Market Fund closed the week at a yield of 11.14%. To invest, dial *809# or download the Cytonn App from Google Playstore here or from the Appstore here;
- Cytonn High Yield Fund closed the week at a yield of 13.70% p.a. To invest, email us at sales@cytonn.com and to withdraw the interest, dial *809# or download the Cytonn App from Google Playstore here or from the Appstore here;
- We continue to offer Wealth Management Training every Wednesday, from 9:00 am to 11:00 am, through our Cytonn Foundation. The training aims to grow financial literacy among the general public. To register for any of our Wealth Management Trainings, click here;
- If interested in our Private Wealth Management Training for your employees or investment group, please get in touch with us through wmt@cytonn.com;
- Cytonn Insurance Agency acts as an intermediary for those looking to secure their assets and loved ones’ future through insurance namely; Motor, Medical, Life, Property, WIBA, Credit and Fire and Burglary insurance covers. For assistance, get in touch with us through insuranceagency@cytonn.com;
- Cytonnaire Savings and Credit Co-operative Society Limited (SACCO) provides a savings and investments avenue to help you in your financial planning journey. To enjoy competitive investment returns, kindly get in touch with us through clientservices@cytonn.com;
Real Estate Updates:
- For an exclusive tour of Cytonn’s real estate developments, visit: Sharp Investor's Tour, and for more information, email us at sales@cytonn.com;
- Phase 3 of The Alma is now ready for occupation and the show house is open daily. To rent please email properties@cytonn.com;
- We have 8 investment-ready projects, offering attractive development and buyer targeted returns; See further details here: Summary of Investment-ready Projects;
- For Third Party Real Estate Consultancy Services, email us at rdo@cytonn.com;
- For recent news about the group, see our news section here;
Hospitality Updates:
- We currently have promotions for Staycations. Visit cysuites.com/offers for details or email us at sales@cysuites.com;
Money Markets, T-Bills Primary Auction:
During the week, T-bills were oversubscribed, with the overall subscription rate coming in at 150.1%, down from the 188.9%, recorded the previous week. Investor’s preference for the shorter 91-day paper persisted as they sought to avoid duration risk, with the paper receiving bids worth Kshs 24.0 bn against the offered Kshs 4.0 bn, translating to an oversubscription rate of 602.3%, lower than the 865.8% recorded the previous week. The subscription rate for the 182-day paper declined to 42.2%, down from the 88.4% recorded the previous week, while the subscription rate for the 364-day paper increased to 77.1%, up from 18.6%, recorded the previous week. The government accepted bids worth Kshs 36.0 bn of the total bids received, translating to an acceptance rate of 99.9%. The yields on the government papers were on an upward trajectory, with the yields on the 364-day paper, 182-day and 91-day papers increasing by 12.0 bps, 12.5 bps and 10.8 bps to 11.4%, 11.0% and 10.5%, respectively. The chart below compares the overall average T- bills subscription rates obtained in 2017, 2022 and 2023 Year to Date (YTD):
In the primary bond market, the Central Bank of Kenya released the tap sale results for the Treasury bond FXD1/2023/003 with tenor to maturity of 3 years. In line with our expectations, the bond recorded an oversubscription rate of 106.0%, partly attributable to investors’ preference for shorter dated bonds as they seek to avoid duration risk. The government issued the bond seeking to raise Kshs 10.0 bn for budgetary support. The tap sale of the bond received bids worth Kshs 10.6 bn, with government accepting bids worth Kshs 10.6 bn, translating to an acceptance rate of 100.0%. Key to note, both the weighted average yield of accepted bids and the coupon rate came at 14.2%.
Money Market Performance:
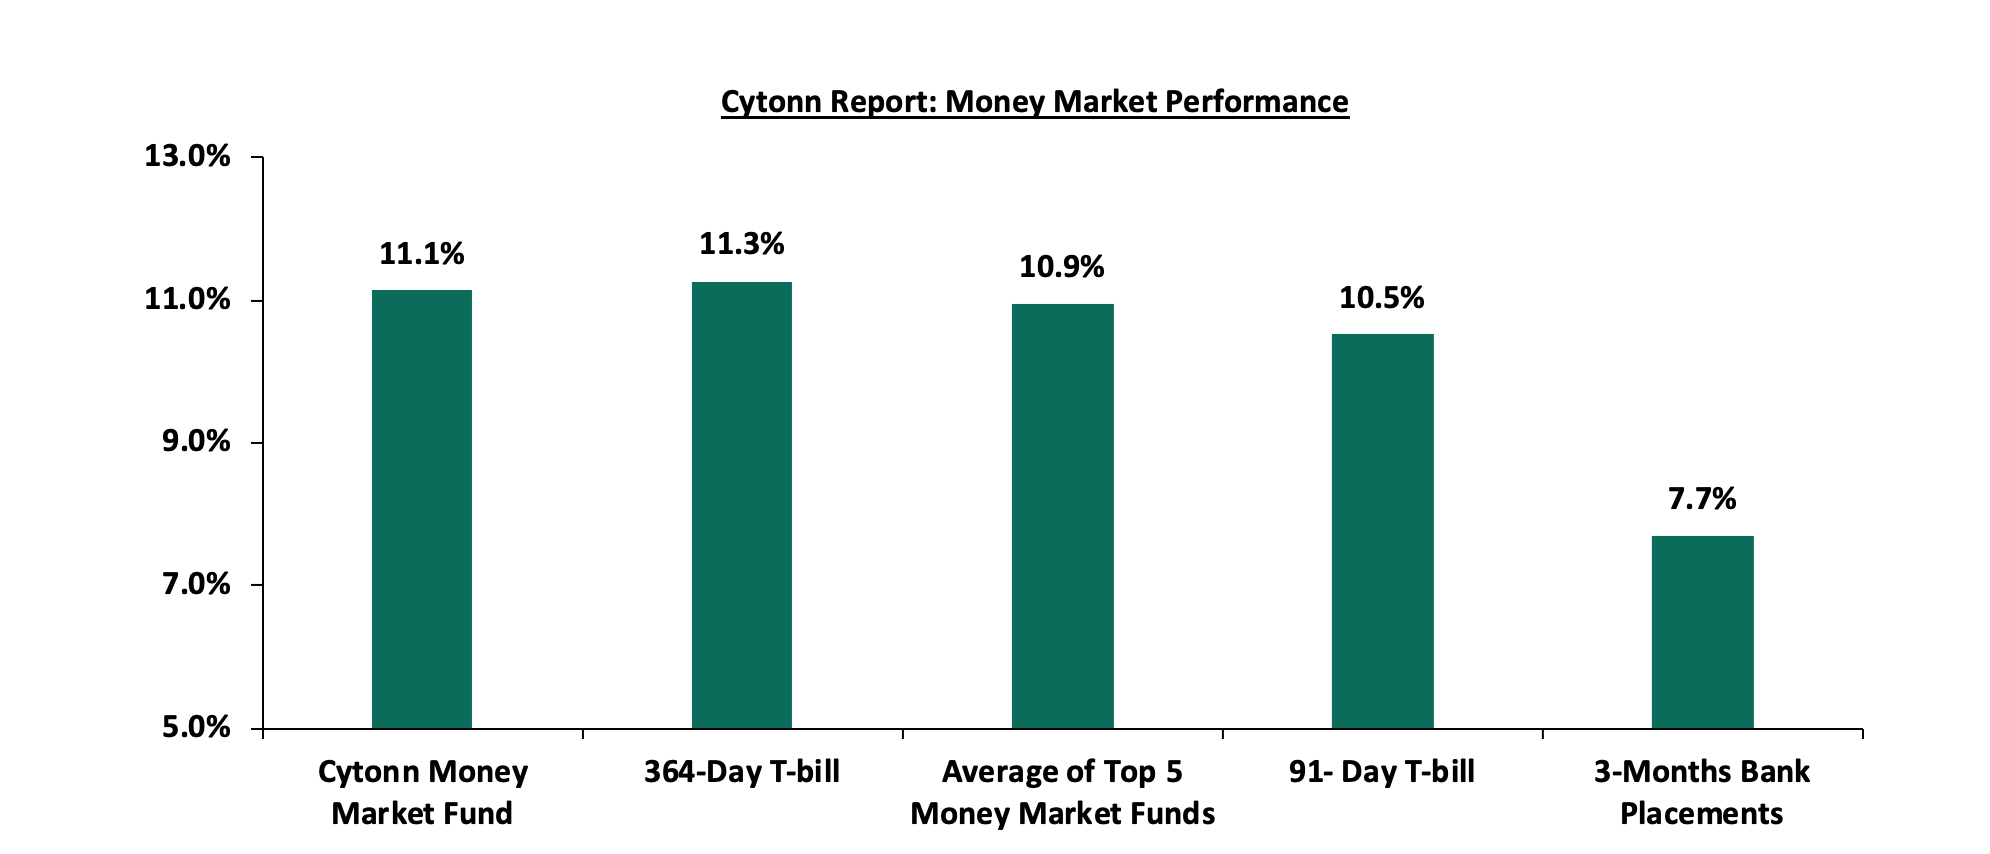
In the money markets, 3-month bank placements ended the week at 7.7% (based on what we have been offered by various banks), while the yields on the 364-day and 91-day paper increased by 12.0 bps and 10.8 bps to 11.4% and 10.5% respectively. The yield of Cytonn Money Market Fund remained relatively unchanged at 11.1%, similar to what was recorded in the previous week, while the average yields of Top 5 Money Market Funds increased by 18.2 bps to 11.0%, up from 10.8%, recorded the previous week.
The table below shows the Money Market Fund Yields for Kenyan Fund Managers as published on 19 May 2023:
|
Cytonn Report: Money Market Fund Yield for Fund Managers as published on 19 May 2023 |
||
|
Rank |
Fund Manager |
Effective Annual Rate |
|
1 |
Etica Money Market Fund |
11.2% |
|
2 |
Cytonn Money Market Fund (dial *809# or download the Cytonn app) |
11.1% |
|
3 |
Madison Money Market Fund |
10.9% |
|
4 |
Apollo Money Market Fund |
10.9% |
|
5 |
Dry Associates Money Market Fund |
10.6% |
|
6 |
AA Kenya Shillings Fund |
10.3% |
|
7 |
Enwealth Money Market Fund |
10.3% |
|
8 |
GenAfrica Money Market Fund |
10.2% |
|
9 |
Co-op Money Market Fund |
10.1% |
|
10 |
Sanlam Money Market Fund |
10.1% |
|
11 |
Old Mutual Money Market Fund |
10.1% |
|
12 |
NCBA Money Market Fund |
10.1% |
|
13 |
Kuza Money Market fund |
10.0% |
|
14 |
Jubilee Money Market Fund |
10.0% |
|
15 |
Zimele Money Market Fund |
9.9% |
|
16 |
Nabo Africa Money Market Fund |
9.8% |
|
17 |
KCB Money Market Fund |
9.8% |
|
18 |
GenCap Hela Imara Money Market Fund |
9.7% |
|
19 |
British-American Money Market Fund |
9.6% |
|
20 |
CIC Money Market Fund |
9.5% |
|
21 |
ICEA Lion Money Market Fund |
9.5% |
|
22 |
Orient Kasha Money Market Fund |
9.4% |
|
23 |
Absa Shilling Money Market Fund |
9.0% |
|
24 |
Mali Money Market Fund |
8.3% |
|
25 |
Equity Money Market Fund |
7.5% |
Source: Business Daily
Liquidity:
During the week, liquidity in the money markets eased, with the average interbank rate decreasing to 9.2%, from 9.5% recorded the previous week, partly attributable to government payments that offset tax remittances. The average interbank volumes traded increased by 16.4% to Kshs 22.6 bn, from Kshs 19.4 bn recorded the previous week. The chart below shows the interbank rates in the market over the years:
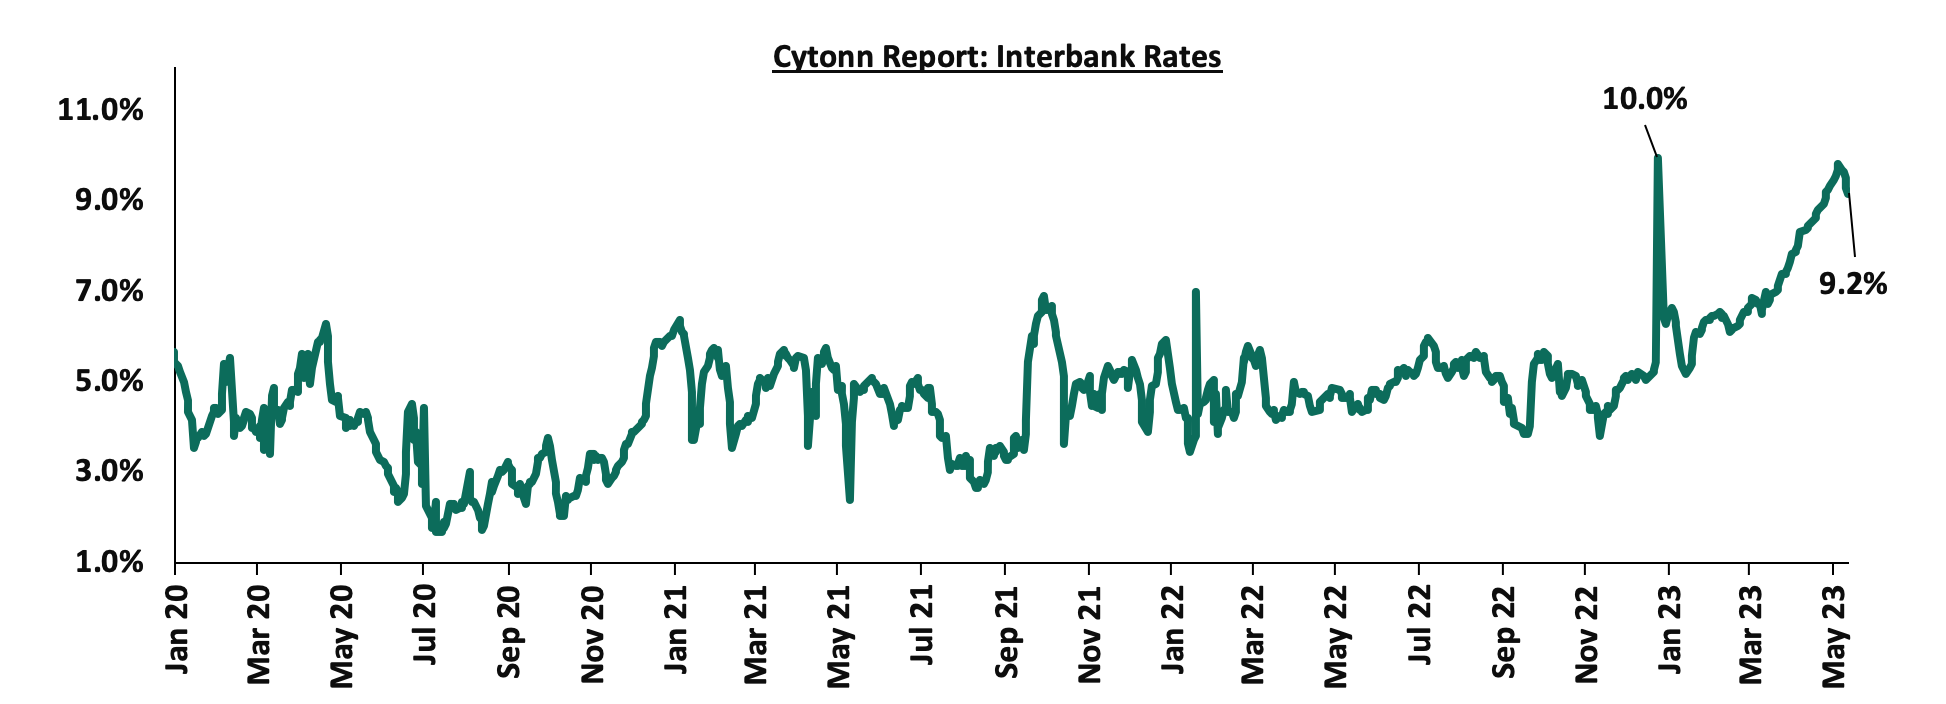
Source: CBK
Kenya Eurobonds:
During the week, the yields on Eurobonds were on a downward trajectory with the yield on the 10-year Eurobond issued in 2014 recording the largest decline having declined by 2.2% points to 15.4%, from 17.6%, recorded the previous week. The downward trajectory of the Eurobond yields is partly attributable to the recent announcement by the International Monetary Fund (IMF) Managing Director Kristalina Georgieva dubbing Kenya as debt sustainable. The IMF Chief also reassured investors that the government is moving swiftly to improve its fiscal position. The table below shows the summary of the performance of the Kenyan Eurobonds as of 18 May 2023;
|
Cytonn Report: Kenya Eurobonds Performance |
||||||
|
|
2014 |
2018 |
2019 |
2021 |
||
|
Date |
10-year issue |
10-year issue |
30-year issue |
7-year issue |
12-year issue |
12-year issue |
|
Amount Issued (USD) |
2.0 bn |
1.0 bn |
1.0 bn |
0.9 bn |
1.2 bn |
1.0 bn |
|
Years to Maturity |
1.2 |
4.8 |
24.9 |
4.1 |
9.1 |
11.2 |
|
Yields at Issue |
6.6% |
7.3% |
8.3% |
7.0% |
7.9% |
6.2% |
|
02-Jan-23 |
12.9% |
10.5% |
10.9% |
10.9% |
10.8% |
9.9% |
|
1-May-23 |
20.6% |
14.1% |
12.7% |
15.5% |
13.2% |
12.4% |
|
11-May-23 |
17.6% |
13.3% |
12.3% |
15.1% |
12.8% |
12.1% |
|
12-May-23 |
16.9% |
13.2% |
12.2% |
14.8% |
12.8% |
12.0% |
|
15-May-23 |
17.2% |
13.2% |
12.3% |
15.0% |
12.8% |
12.1% |
|
16-May-23 |
16.9% |
13.0% |
12.1% |
14.8% |
12.7% |
11.9% |
|
17-May-23 |
15.6% |
12.7% |
12.0% |
14.4% |
12.5% |
11.8% |
|
18-May-23 |
15.4% |
12.6% |
12.0% |
14.3% |
12.4% |
11.7% |
|
Weekly Change |
(2.2%) |
(0.7%) |
(0.4%) |
(0.8%) |
(0.4%) |
(0.5%) |
|
MTD change |
(5.2%) |
(1.5%) |
(0.7%) |
(1.2%) |
(0.8%) |
(0.7%) |
|
YTD Change |
2.5% |
2.1% |
1.1% |
3.3% |
1.6% |
1.8% |
Source: Central Bank of Kenya (CBK) and National Treasury
Kenya Shilling:
During the week, the Kenya Shilling depreciated by 0.4% against the US dollar to close the week at Kshs 137.5, from Kshs 136.9 recorded the previous week, partly attributable to the persistent dollar demand from importers, especially oil and energy sectors against a slower supply of hard currency. On a year to date basis, the shilling has depreciated by 11.4% against the dollar, adding to the 9.0% depreciation recorded in 2022. We expect the shilling to remain under pressure in 2023 as a result of:
- High global crude oil prices on the back of persistent supply chain bottlenecks coupled with high demand,
- An ever-present current account deficit estimated at 4.9% of GDP in twelve months to January 2023, from 5.6% recorded in a similar period last year,
- The need for Government debt servicing which continues to put pressure on forex reserves given that 63.0% of Kenya’s External debt was US Dollar denominated as of December 2022, and,
The shilling is however expected to be supported by:
- Diaspora remittances standing at a cumulative USD 1,335.9 mn in 2023 as of April 2023, albeit 3.1% lower than the USD 1,378.9 mn recorded over the same period in 2022, and,
- The tourism inflow receipts that came in at USD 268.1 bn in 2022, a significant 82.9% increase from USD 146.5 bn inflow receipts recorded in 2021.
Key to note, Kenya’s forex reserves declined by 0.4% during the week to remain relatively unchanged at USD 6.3 bn as at 18 May 2023, equivalent to 3.5 months of import cover, but a notable 2.6% decline from the 3.6 months of import cover recorded the previous week, and remained below the statutory requirement of maintaining at least 4.0-months of import cover. The chart below summarizes the evolution of Kenya months of import cover over the last 10 years:
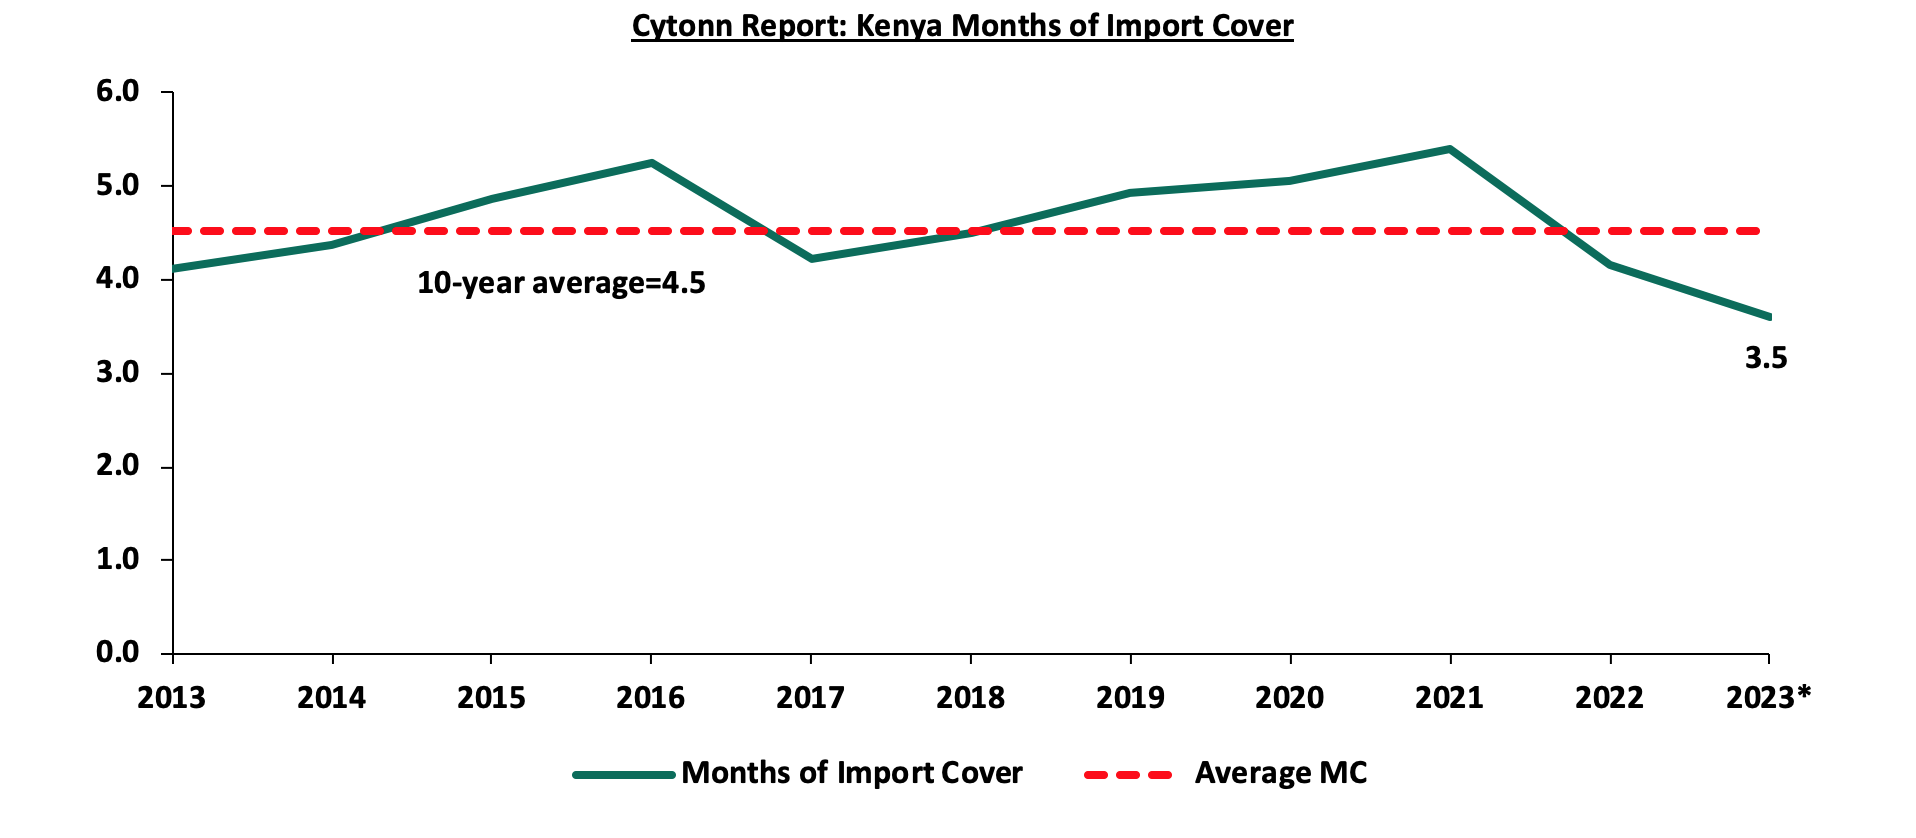
*Figure as at 18 May 2023
Weekly Highlights:
- Fuel Prices
During the week, the Energy and Petroleum Regulatory Authority (EPRA) released their monthly statement on the maximum retail fuel prices in Kenya effective 15 May 2023 to 14 June 2023. Notably, fuel prices increased by 1.9%, 4.0% and 10.4% to Kshs 182.7, Kshs 168.4 and Kshs 161.1, up from Kshs 179.3, Kshs 162.0 and Kshs 145.9 per litre of Super Petrol, Diesel and Kerosene, respectively. This comes after the government completely removed the fuel subsidy which was aimed at cushioning the citizens from high fuel prices.
Other key take-outs from the performance include;
- The average landed costs for diesel and kerosene decreased by 2.5% and 1.1% to USD 688.1 per cubic metre and USD 699.5 per cubic metre in April 2023, from USD 705.8 per cubic metre and USD 707.5 per cubic metre in March 2023, respectively. However, the landed cost for Super Petrol increased by 8.3% to USD 724.0 per cubic metre in April 2023 from USD 666.1 per cubic metre in February,
- The Free On Board (FOB) price of Murban crude oil increased by 0.9% to USD 83.4 per barrel in April 2023 from USD 82.6 per barrel recorded in March 2023,
- The subsidies on Diesel and Kerosene have been removed, a commendable move since the fuel subsidy weighed heavily on government expenditure, necessitating the need for excessive borrowing.
The performance was despite;
- The Kenya shilling performing better at the crude oil pump, with the mean monthly exchange rate trading at Kshs 139.0 in April 2023, compared to the mean monthly exchange rate of Kshs 139.6 recorded in March 2023, representing a 0.4% appreciation against the US dollar. The ease in fuel prices can be attributed to the ongoing government to government deal easing dollar demand by importers in the oil and energy sector.
Key to note, EPRA increased the price of Super Petrol, Diesel and Kerosene by Kshs 3.4, Kshs 6.4, and Kshs 15.2 per litre on the back of the government’s decision to completely remove fuel subsidy program. While the increase in Kerosene will weigh down on the low income households in Kenya, who form the majority of the Kenyan population, the move will help suppliers with financing as the fuel subsidy reduced most suppliers financing margins. Additionally, the removal of fuel subsidy is informed by the current government-government dealing involving firms such as the Saudi Aramco (ARAMCO), Abu Dhabi National Oil Company (ADNOC) and Emirates National Oil Company (ENOC) to supply Kenya with diesel and super petrol for the next six months on credit. The first batch of fuel importation was received in April 2023 and the latest batch will be received in May 2023.
We commend the government’s move to eliminate the fuel subsidies to ease the expenditure and ensure fiscal consolidation. However, we maintain the view that the government needs to implement long term strategies to buffer foreign reserves and resuscitate the currently weakened interbank forex market, with the Kenyan shilling having recorded an 11.4% depreciation on year to data basis.
Rates in the Fixed Income market have been on upward trend given the continued government’s demand for cash as well as tight liquidity in the money market. The government is 3.7% behind its prorated borrowing target of Kshs 379.6 bn having borrowed Kshs 365.3 bn of the revised domestic borrowing target of Kshs 425.1 bn for the FY’2022/2023. We believe that the projected budget deficit of 5.7% is relatively ambitious given the downside risks and deteriorating business environment occasioned by high inflationary pressures. Further, revenue collections are lagging behind, with total revenue as at April 2023 coming in at Kshs 1.6 tn in the FY’2022/2023, equivalent to 74.8% of its revised target of Kshs 2.2 tn and 89.8% of the prorated target of Kshs 1.8 tn. Therefore, we expect a continued upward readjustment of the yield curve in the short and medium term, with the government looking to bridge the fiscal deficit through the domestic market. Owing to this, our view is that investors should be biased towards short-term fixed-income securities to reduce duration risk.
Market Performance:
During the week, the equities market recorded mixed performance with NASI and NSE 25 gaining by 5.3% and 2.7% respectively, while NSE 20 declined by 0.3%, taking the YTD performance to losses of 22.6%, 12.4% and 18.1% for NASI, NSE 20 and NSE 25, respectively. The equities market performance was mainly driven by gains recorded by large cap stocks such as Safaricom, KCB Group, EABL and Standard Chartered Bank-Kenya of 13.2%, 8.2%, 4.8% and 3.5% respectively. The gains were however weighed down by losses recorded by banking stock such as Diamond Trust Bank (DTB-K), Equity Group and BAT of 9.4%, 5.9% and 2.0% respectively.
During the week, equities turnover increased by 15.9% to USD 12.0 mn, from USD 10.3 mn, recorded the previous week, taking the YTD turnover to USD 408.6 mn. Foreign investors remained net sellers for a fifth consecutive week, with a net selling position of USD 1.4 mn, from a net selling position of USD 3.5 mn recorded the previous week, taking the YTD net selling position to USD 50.7 mn.
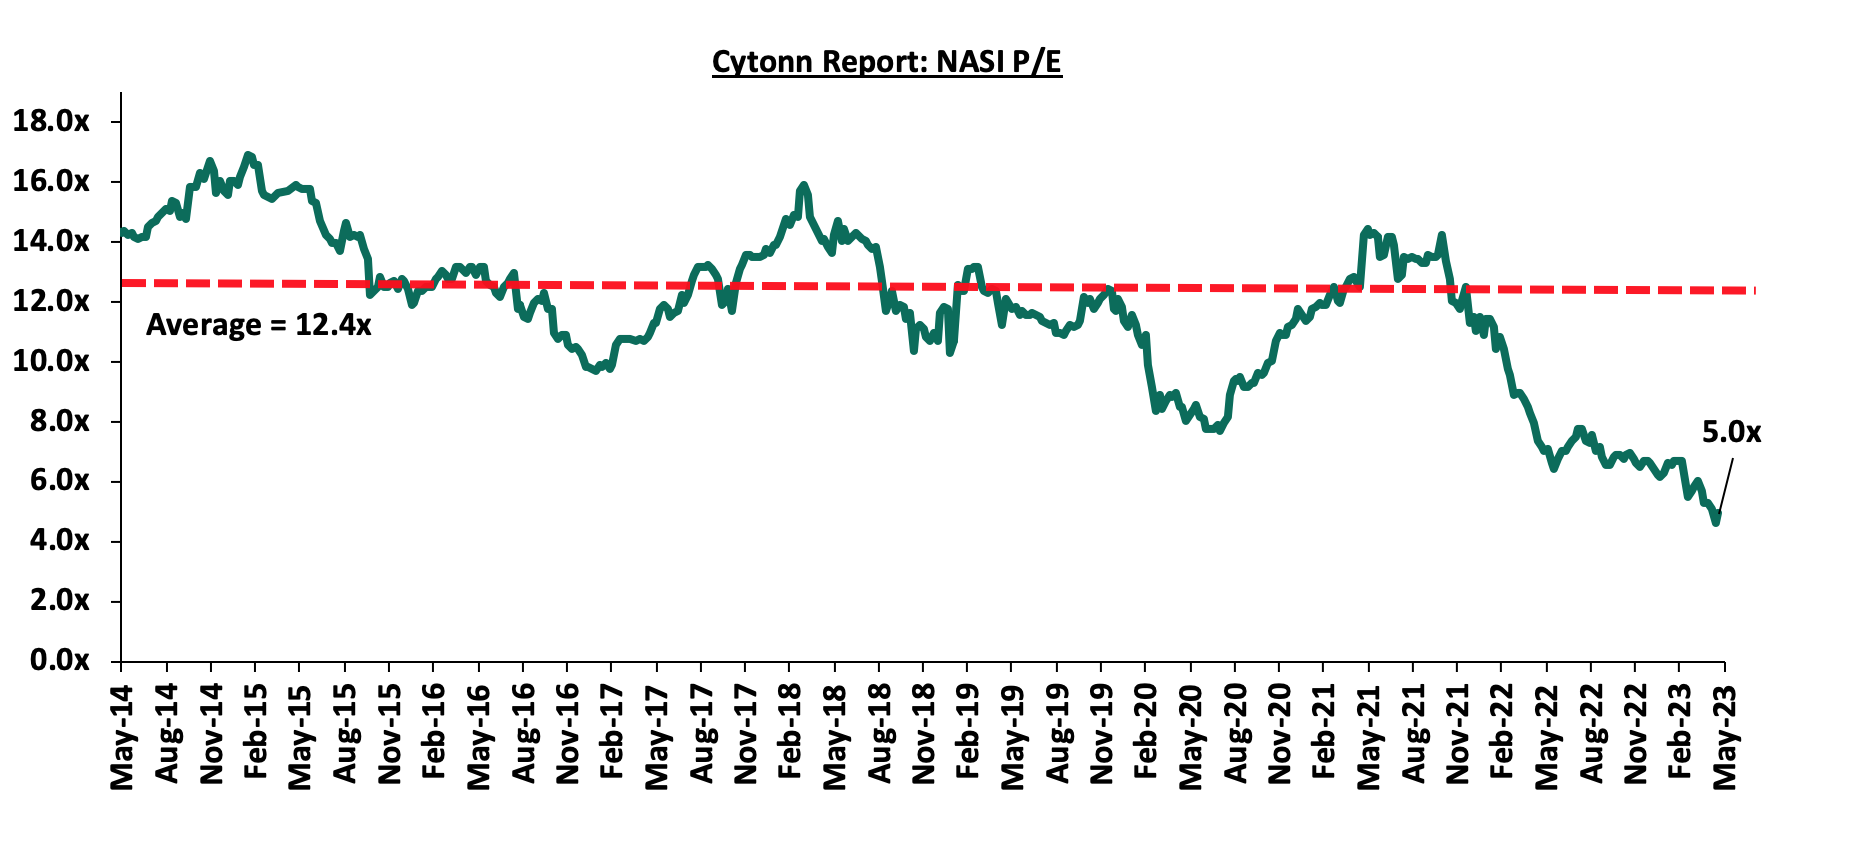
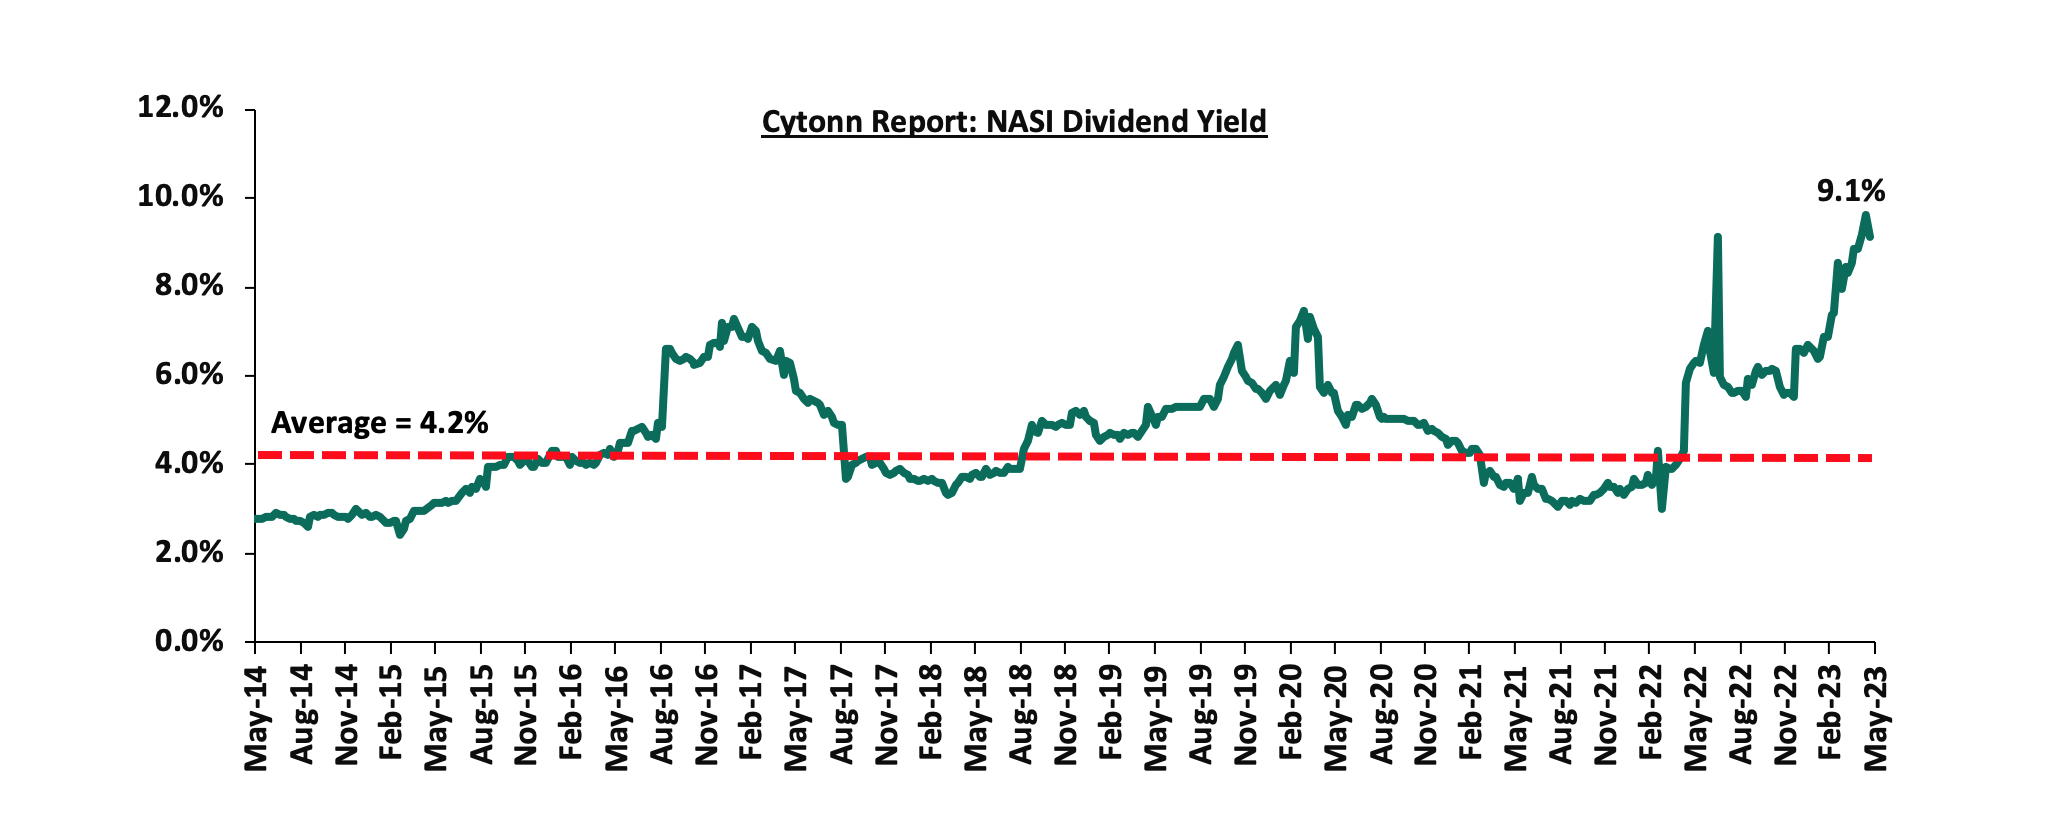
The market is currently trading at a price to earnings ratio (P/E) of 5.0x, 60.0% below the historical average of 12.4x. The dividend yield stands at 9.1%, 4.9% points above the historical average of 4.2%. Key to note, NASI’s PEG ratio currently stands at 0.6x, an indication that the market is undervalued relative to its future growth. A PEG ratio greater than 1.0x indicates the market is overvalued while a PEG ratio less than 1.0x indicates that the market is undervalued. The charts below indicate the historical P/E and dividend yields of the market;
Earnings Releases
- Equity Group Holdings Plc
During the week, Equity Group Holdings Plc released their Q1’2023 financial results. Below is a summary of the performance:
|
Balance Sheet |
Q1’2022 |
Q1’2023 |
y/y change |
|
Government Securities |
233.9 |
216.0 |
(7.7%) |
|
Net Loans and Advances |
623.6 |
756.3 |
21.3% |
|
Total Assets |
1,269.5 |
1,537.7 |
21.1% |
|
Customer Deposits |
900.9 |
1111.2 |
23.3% |
|
Deposits per branch |
2.7 |
3.1 |
17.4% |
|
Total Liabilities |
1,095.3 |
1,347.0 |
23.0% |
|
Shareholders’ Funds |
167.2 |
183.8 |
9.9% |
|
Key Ratios |
Q1’2022 |
Q1’2023 |
% point change |
|
Loan to Deposit Ratio |
69.2% |
68.1% |
(1.1%) |
|
Return on average equity |
28.7% |
26.8% |
(1.9%) |
|
Return on average assets |
3.7% |
3.4% |
(0.3%) |
|
Income Statement |
Q1’2022 |
Q1’2023 |
y/y change |
|
Net Interest Income |
19.4 |
21.7 |
12.1% |
|
Net non-Interest Income |
11.9 |
18.4 |
54.3% |
|
Total Operating income |
31.3 |
40.1 |
28.2% |
|
Loan Loss provision |
(1.8) |
(3.5) |
92.5% |
|
Total Operating expenses |
(16.0) |
(23.2) |
45.1% |
|
Profit before tax |
15.3 |
16.9 |
10.5% |
|
Profit after tax |
11.9 |
12.8 |
7.9% |
|
Core EPS |
3.1 |
3.4 |
7.9% |
|
Income Statement Ratios |
Q1'2022 |
Q1'2023 |
y/y change |
|
Yield from interest-earning assets |
9.9% |
10.5% |
0.6% |
|
Cost of funding |
2.8% |
3.2% |
0.4% |
|
Cost of risk |
5.8% |
8.7% |
2.9% |
|
Net Interest Margin |
7.2% |
7.4% |
0.2% |
|
Net Interest Income as % of operating income |
61.9% |
54.1% |
(7.8%) |
|
Non-Funded Income as a % of operating income |
38.1% |
45.9% |
7.8% |
|
Cost to Income Ratio |
51.1% |
57.9% |
6.8% |
|
CIR without LLP |
45.3% |
49.2% |
3.9% |
|
Cost to Assets |
1.2% |
1.4% |
0.2% |
|
Capital Adequacy Ratios |
Q1’2022 |
Q1’2023 |
% points change |
|
Core Capital/Total Liabilities |
16.3% |
17.7% |
1.4% |
|
Minimum Statutory ratio |
8.0% |
8.0% |
|
|
Excess |
8.3% |
9.7% |
1.4% |
|
Core Capital/Total Risk Weighted Assets |
13.9% |
15.5% |
1.6% |
|
Minimum Statutory ratio |
10.5% |
10.5% |
|
|
Excess |
3.4% |
5.0% |
1.6% |
|
Total Capital/Total Risk Weighted Assets |
18.7% |
19.8% |
1.1% |
|
Minimum Statutory ratio |
14.5% |
14.5% |
|
|
Excess |
4.2% |
5.3% |
1.1% |
|
Liquidity Ratio |
56.9% |
51.5% |
(5.4%) |
|
Minimum Statutory ratio |
20.0% |
20.0% |
|
|
Excess |
36.9% |
31.5% |
(5.4%) |
|
Adjusted core capital/ total deposit liabilities |
16.3% |
17.7% |
1.4% |
|
Adjusted core capital/ total risk weighted assets |
13.9% |
15.5% |
1.6% |
|
Adjusted total capital/ total risk weighted assets |
18.7% |
19.8% |
1.1% |
Key Take-Outs:
Earnings growth - Core earnings per share (EPS) grew by 7.9% to Kshs 3.4, from Kshs 3.1 in Q1’2022. The strong growth was mainly driven by the 28.2% growth in total operating income to Kshs 40.1 bn from Kshs 31.3 bn in Q1’2022. However, the performance was weighed down by a 45.1% growth in total operating expenses to Kshs 23.2 bn, from Kshs 16.0 bn in Q1’2022,
Increased Provisioning - On the back of high credit risk occasioned by the deteriorated business environment, the bank increased its provisions holdings to cover for the anticipated losses in the future, with its provisions increasing by 92.5% to Kshs 3.5 bn from Kshs 1.8 bn recorded in Q1’2022. The high credit risk is further evidenced by the 35.2% increase in bank’s gross non-performing loans to Kshs 80.3 bn in Q1’2023, from Kshs 59.4 bn recorded in Q1’2022, and,
Revenue Diversification – Non-Funded Income (NFI) increased by 54.3% to Kshs 18.4 bn, from Kshs 11.9 bn in Q1’2022, mainly driven by a 152.3% increase in the foreign exchange trading income to Kshs 5.2 bn, from Kshs 2.0 bn in Q1’2022, highlighting the group’s increased foreign exchange margins as well as increased revenue diversification.
For a comprehensive analysis, please see our Equity Group Holding Plc’s Q1’2023 Earnings Note
- Co-operative Bank of Kenya
During the week, Co-operative Bank of Kenya released their Q1’2023 financial results. Below is a summary of the performance:
|
Balance Sheet Items (Kshs bn) |
Q1'2022 |
Q1'2023 |
y/y change |
|
Government Securities |
183.4 |
179.2 |
(2.3%) |
|
Net Loans and Advances |
324.5 |
360.1 |
11.0% |
|
Total Assets |
597.0 |
631.1 |
5.7% |
|
Customer Deposits |
410.8 |
419.8 |
2.2% |
|
Deposits per Branch |
2.28 |
2.32 |
1.6% |
|
Total Liabilities |
493.9 |
518.2 |
4.9% |
|
Shareholders’ Funds |
102.7 |
112.6 |
9.7% |
|
Balance Sheet Ratios |
Q1'2022 |
Q1'2023 |
y/y change |
|
Loan to Deposit Ratio |
79.0% |
85.8% |
6.8% |
|
Return on average equity |
19.3% |
20.7% |
1.5% |
|
Return on average assets |
3.3% |
3.6% |
0.3% |
|
Income Statement (Kshs bn) |
Q1'2022 |
Q1'2023 |
y/y change |
|
Net Interest Income |
10.4 |
10.8 |
3.9% |
|
Non-Interest Income |
6.4 |
7.1 |
10.8% |
|
Total Operating income |
16.8 |
17.9 |
6.5% |
|
Loan Loss provision |
(1.5) |
(1.5) |
(0.7%) |
|
Total Operating expenses |
(9.0) |
(9.8) |
8.8% |
|
Profit before tax |
7.8 |
8.1 |
4.6% |
|
Profit after tax |
5.8 |
6.1 |
4.7% |
|
Earnings per share (Kshs) |
0.8 |
0.9 |
4.7% |
|
Income Statement Ratios |
Q1'2022 |
Q1'2023 |
Y/Y Change |
|
Yield from interest-earning assets |
11.2% |
11.7% |
0.5% |
|
Cost of funding |
3.2% |
3.7% |
0.4% |
|
Net Interest Spread |
7.9% |
8.1% |
0.1% |
|
Net Interest Income as % of Total Income |
61.8% |
60.3% |
(1.5%) |
|
Non-Funded Income as a % of Total Income |
38.2% |
39.7% |
1.5% |
|
Cost to Income |
53.8% |
54.9% |
1.1% |
|
Cost to Income Ratio without provisions |
44.6% |
46.3% |
1.7% |
|
Cost to Assets |
1.25% |
1.31% |
0.06% |
|
Net Interest Margin |
8.3% |
8.5% |
0.2% |
|
Capital Adequacy Ratios |
Q1'2022 |
Q1'2023 |
% points change |
|
Core Capital/Total deposit Liabilities |
19.8% |
22.7% |
2.9% |
|
Minimum Statutory ratio |
8.0% |
8.0% |
|
|
Excess |
11.8% |
14.7% |
2.9% |
|
Core Capital/Total Risk Weighted Assets |
15.3% |
16.3% |
1.0% |
|
Minimum Statutory ratio |
10.5% |
10.5% |
|
|
Excess |
4.8% |
5.8% |
1.0% |
|
Total Capital/Total Risk Weighted Assets |
16.6% |
17.2% |
0.6% |
|
Minimum Statutory ratio |
14.5% |
14.5% |
|
|
Excess |
2.1% |
2.7% |
0.6% |
|
Liquidity Ratio |
54.1% |
50.6% |
(3.5%) |
|
Minimum Statutory ratio |
20.0% |
20.0% |
|
|
Excess |
34.1% |
30.6% |
(3.5%) |
|
Adjusted Core Capital/Total Deposit Liabilities |
16.0% |
22.7% |
6.7% |
|
Adjusted Core Capital/Total Risk Weighted Assets |
12.3% |
16.3% |
4.0% |
|
Adjusted Total Capital/Total Risk Weighted Assets |
13.6% |
17.2% |
3.6% |
Key Take-Out
Earnings Growth- Core earnings per share rose by 4.7% to Kshs 0.9 from Kshs 0.8 in Q1’2022. The performance was driven by a 6.5% increase in total operating income to Kshs 17.9 bn in Q1’2023, from Kshs 16.8 bn in Q1’2022. The performance was however weighed down by the 8.8% increase in the total operating expenses to Kshs 9.8 bn in Q1’2022, from Kshs 9.0 bn in Q1’2022,
Increased Lending– The Group’s net loans and advances increased by 11.0% to Kshs 360.1 bn in Q1’2023, from Kshs 324.5 bn in Q1’2022, highlighting the Bank’s aggressive lending despite the tough operating business environment. On the other hand, government securities declined by 2.3% to Kshs 179.2 bn, from Kshs 183.4 bn recorded in Q1’2022, indicating a continued diversification of their exposure aimed at cushioning the bank against any potential risk,
Decline in Efficiency Levels - The Bank’s efficiency levels have declined evidenced by a deterioration in Cost to Income Ratio (CIR) to 54.9% in Q1’2023, from 53.8% in Q1’2022 owing to the 8.8% increase in the total operating expenses which outpaced the 6.5% increase in the total operating income. Similarly, Without LLP, the Cost to Income ratio increased to 46.3%, from 44.6% in Q1’2022, and,
Deterioration in Asset Quality – The group’s asset quality deteriorated, with the NPL ratio increasing to 14.1% in Q1’2023, from 13.9% in Q1’2022, owing to the 12.6% growth in gross non-performing loans to Kshs 394.7 bn, from Kshs 356.8 bn in Q1’2022, which outpaced the 10.6% increase in Gross loans.
For a comprehensive analysis, please see our Co-operative Bank of Kenya Q1’2023 Earnings Note
- Standard Chartered Bank - Kenya
During the week, Standard Chartered Bank – Kenya released their Q1’2023 financial results. Below is a summary of the performance
|
Balance Sheet Items |
Q1'2022 |
Q1'2023 |
y/y change |
||
|
Net loans |
128.1 |
137.1 |
7.0% |
||
|
Government Securities |
101.4 |
95.1 |
(6.2%) |
||
|
Total Assets |
340.9 |
388.6 |
14.0% |
||
|
Customer Deposits |
265.4 |
302.9 |
14.2% |
||
|
Deposits per Branch |
7.4 |
9.5 |
28.4% |
||
|
Total Liabilities |
285.3 |
328.3 |
15.1% |
||
|
Shareholder's Funds |
55.6 |
60.4 |
8.6% |
||
|
Balance Sheet Ratios |
Q1'2022 |
Q1'2023 |
y/y change |
|
Loan to deposit ratio |
48.3% |
45.3% |
(3.0%) |
|
Return on Average Equity |
17.4% |
23.0% |
5.6% |
|
Return on Average Assets |
2.8% |
3.7% |
0.9% |
|
Income Statement |
Q1'2022 |
Q1'2023 |
y/y change |
|
Net Interest Income |
4.9 |
6.9 |
40.1% |
|
Net non-Interest Income |
2.5 |
3.9 |
55.5% |
|
Total Operating income |
7.4 |
10.8 |
45.2% |
|
Loan Loss provision |
0.1 |
0.8 |
819.6% |
|
Total Operating expenses |
3.5 |
5.1 |
47.2% |
|
Profit before tax |
3.9 |
5.6 |
43.6% |
|
Profit after tax |
2.8 |
4.0 |
45.7% |
|
Core EPS |
7.3 |
10.7 |
45.7% |
|
Income Statement Ratios |
Q1'2022 |
Q1'2023 |
y/y change |
|
Yield from interest-earning assets |
7.4% |
8.3% |
0.9% |
|
Cost of funding |
1.2% |
1.1% |
(0.1%) |
|
Net Interest Spread |
6.2% |
7.1% |
0.9% |
|
Net Interest Margin |
6.3% |
7.3% |
1.0% |
|
Cost of Risk |
1.2% |
7.3% |
6.1% |
|
Net Interest Income as % of operating income |
66.4% |
64.1% |
(2.3%) |
|
Non-Funded Income as a % of operating income |
33.6% |
35.9% |
2.3% |
|
Cost to Income Ratio |
47.0% |
47.6% |
0.6% |
|
Cost to Income Ratio without LLP |
45.8% |
40.3% |
(5.5%) |
|
Cost to Assets |
1.0% |
1.2% |
0.2% |
|
Capital Adequacy Ratios |
Q1'2022 |
Q1'2023 |
% Change |
|
Core Capital/Total Liabilities |
15.6% |
15.1% |
(0.5%) |
|
Minimum Statutory ratio |
8.0% |
8.0% |
|
|
Excess |
7.6% |
7.1% |
(0.5%) |
|
Core Capital/Total Risk Weighted Assets |
15.4% |
16.0% |
0.6% |
|
Minimum Statutory ratio |
10.5% |
10.5% |
|
|
Excess |
4.9% |
5.5% |
0.6% |
|
Total Capital/Total Risk Weighted Assets |
17.6% |
17.5% |
(0.1%) |
|
Minimum Statutory ratio |
14.5% |
14.5% |
|
|
Excess |
3.1% |
3.0% |
(0.1%) |
|
Liquidity Ratio |
71.6% |
73.8% |
2.2% |
|
Minimum Statutory ratio |
20.0% |
20.0% |
|
|
Excess |
51.6% |
53.8% |
2.2% |
|
Adjusted core capital/ total deposit liabilities |
15.6% |
15.1% |
(0.5%) |
|
Adjusted core capital/ total risk weighted assets |
15.4% |
16.0% |
0.6% |
|
Adjusted total capital/ total risk weighted assets |
17.7% |
17.6% |
(0.1%) |
Key Take-Outs:
Earnings Growth- Core earnings per share rose by 45.7% to Kshs 10.7, from Kshs 7.3 registered in Q1’2022. The performance was manly driven by the 45.2% growth in total operating income to Kshs 10.8 bn, from Kshs 7.4 bn in Q1’2022. However, the performance was weighed down by a 47.2% increase in the total operating expenses to Kshs 5.1 bn in Q1’2022, from Kshs 3.5 bn in Q1’2022,
Improvement in Asset Quality - The group’s asset quality improved significantly, with the NPL ratio improving to 14.4% in Q1’2023, from 15.4% recorded in Q1’2022. The improvement in asset quality was attributable to the 6.9% growth in gross loans, coupled with the relatively unchanged Non-Performing loans,
Sustained operating efficiency levels – The bank’s operating efficiency has recorded sustained improvement with cost to income ratio without LLP improving by 5.5% points to 40.3% in Q1’2023, from 45.8% recorded in Q1’2022, similar to the trend witnessed in FY’2022 financial performance where cost to income LLP improved by 3.9% points to 45.8% in FY’2022 from 49.7% in FY’2021, and,
Increased Provisioning – Q1’2023 was characterized by increased provisioning, attributable to the high credit risks brought about by the deteriorated business environment mainly as a result of the elevated inflationary pressures. As such, Standard Chartered Bank Kenya increased its loan loss provision to kshs 0.8 bn in Q1’2023, up from Kshs 0.1 bn recorded in Q1’2022. Additionally, General Provisions (LLP) increased by 7.6% to Kshs 10.3 bn, from Kshs 9.6 bn recorded in Q1’2022.
For a comprehensive analysis, please see our Standard Chartered Bank - Kenya Q1’2023 Earnings Note
Summary performance:
Asset Quality:
The table below highlights the Asset Quality of the listed banks:
|
Cyonn Report: Listed Banks Asset Quality |
||||||
|
Bank |
Q1'2023 NPL Ratio* |
Q1'2022 NPL Ratio** |
% point change in NPL Ratio |
Q1'2023 NPL Coverage* |
Q1'2022 NPL Coverage** |
% point change in NPL Coverage |
|
Equity Group |
10.0% |
9.0% |
1.0% |
62.0% |
66.0% |
(4.0%) |
|
Stanbic Bank |
11.7% |
11.1% |
0.6% |
66.7% |
59.1% |
7.6% |
|
Co-operative Bank of Kenya |
14.1% |
13.9% |
0.2% |
62.2% |
65.3% |
(3.1%) |
|
Standard Chartered Bank Kenya |
14.4% |
15.4% |
(1.0%) |
86.8% |
81.8% |
5.0% |
| Mkt Weighted Average |
11.9% |
12.5% |
(0.6%) |
66.9% |
65.1% |
1.8% |
|
*Market cap weighted as at 19/05/2023 |
||||||
|
**Market cap weighted as at 17/06/2022 |
||||||
Key take-outs from the table include;
- Asset quality for the listed banks that have released improved during the Q1’2023, with market weighted average NPL ratio declining by 0.6% points to 11.9%, from a 12.5% in Q1’2022. The improvement was largely driven by an improvement in Standard Chartered Bank Kenya’s Asset quality with the NPL ratio declining by 1.0% to 14.4%, from 15.4% recorded in Q1’2022. However, the improvement was weighed down by deterioration in Equity Group’s, Stanbic Holding’s and Co-operative Bank Kenya’s asset quality with their NPL ratio increasing by 1.0%, 0.6% points and 0.2% points to 10.0%, 11.7% and 14.1% in Q1’2023, from 9.0%, 11.1% and 13.9%, respectively in recorded in Q1’2022,
- Market weighted average NPL Coverage for the listed banks increased by 1.8% points to 66.9% in Q1’2023, from 65.1% recorded in Q1’2022, mainly attributable to 7.6% points increase in Stanbic Holding’s NPL coverage to 66.7%, from 59.1% in Q1’2022, and 5.0% points increase in Standard Chartered Bank – Kenya NPL coverage to 86.8%, from 81.8% in Q1’2022.
The table below highlights the performance listed banks, showing the performance using several metrics:
|
Cytonn Report: Listed Banks Performance in Q1’2023 |
|||||||||||||
|
Bank |
Core EPS Growth |
Interest Income Growth |
Interest Expense Growth |
Net Interest Income Growth |
Net Interest Margin |
Non-Funded Income Growth |
NFI to Total Operating Income |
Growth in Total Fees & Commissions |
Deposit Growth |
Growth in Government Securities |
Loan to Deposit Ratio |
Loan Growth |
Return on Average Equity |
|
Stanbic |
84.3% |
49.1% |
59.7% |
44.7% |
7.2% |
89.3% |
51.4% |
17.7% |
23.8% |
9.7% |
79.1% |
11.5% |
20.7% |
|
SCB-K |
47.2% |
34.1% |
(5.4%) |
40.1% |
7.3% |
55.5% |
35.9% |
13.3% |
14.2% |
(6.2%) |
45.3% |
7.0% |
23.0% |
|
Equity |
7.9% |
21.6% |
46.9% |
12.1% |
7.4% |
54.3% |
45.9% |
39.2% |
23.3% |
(7.7%) |
68.1% |
23.1% |
26.8% |
|
CO-OP |
4.7% |
11.2% |
32.2% |
3.9% |
8.5% |
10.8% |
39.7% |
9.7% |
2.2% |
(2.3%) |
85.8% |
11.0% |
20.7% |
|
Q1'23 Mkt Weighted Average* |
25.1% |
25.7% |
36.6% |
20.1% |
7.6% |
50.8% |
43.7% |
25.6% |
17.5% |
(3.8%) |
69.2% |
16.2% |
24.0% |
|
Q1'22 Mkt Weighted Average** |
37.9% |
17.8% |
17.1% |
17.7% |
7.3% |
21.4% |
35.9% |
21.7% |
9.5% |
17.6% |
73.9% |
17.2% |
21.9% |
|
*Market cap weighted as at 19/05/2023 |
|||||||||||||
|
**Market cap weighted as at 17/06/2022 |
|||||||||||||
Key take-outs from the table include:
- The listed banks recorded an 25.1% growth in core Earnings per Share (EPS) in Q1’2023, compared to the weighted average growth of 37.9% in Q1’2022, an indication of sustained performance despite the tough operating environment experienced in Q1’2023,
- Non-Funded Income grew by 50.8% compared to market weighted average growth of 21.4% in Q1’2022, mainly due to growth in forex related fees which is likely due to the wide spreads in the dollar exchange rate during the quarter, and,
- The Banks recorded a deposit growth of 17.5%, higher than the market weighted average deposit growth of 9.5% in Q1’2022, highlighting increased investment risk in the country’s business environment.
Universe of coverage:
|
Company |
Price as at 12/05/2025 |
Price as at 19/05/2026 |
w/w change |
YTD Change |
Year Open 2023 |
Target Price* |
Dividend Yield |
Upside/ Downside** |
P/TBv Multiple |
Recommendation |
|
Jubilee Holdings |
180.0 |
179.8 |
(0.1%) |
(9.6%) |
316.8 |
305.9 |
6.7% |
76.9% |
0.3x |
Buy |
|
Britam |
4.1 |
4.2 |
1.2% |
(19.8%) |
7.6 |
7.1 |
0.0% |
70.7% |
0.7x |
Buy |
|
Liberty Holdings |
3.7 |
4.0 |
7.3% |
(21.4%) |
7.1 |
6.8 |
0.0% |
70.5% |
0.3x |
Buy |
|
NCBA*** |
32.1 |
32.6 |
1.7% |
(16.3%) |
25.5 |
48.7 |
13.0% |
62.5% |
0.6x |
Buy |
|
ABSA Bank*** |
10.2 |
10.4 |
2.0% |
(14.8%) |
11.8 |
15.1 |
13.0% |
58.6% |
0.8x |
Buy |
|
I&M Group*** |
17.0 |
17.0 |
0.3% |
(0.3%) |
21.4 |
24.5 |
13.2% |
57.3% |
0.4x |
Buy |
|
Equity Group*** |
40.8 |
38.4 |
(5.9%) |
(14.8%) |
52.8 |
56.3 |
10.4% |
57.1% |
0.7x |
Buy |
|
Standard Chartered*** |
135.3 |
140.0 |
3.5% |
(3.4%) |
130.0 |
195.4 |
15.7% |
55.3% |
0.9x |
Buy |
|
KCB Group*** |
28.5 |
30.9 |
8.2% |
(19.6%) |
45.6 |
45.5 |
6.5% |
54.0% |
0.5x |
Buy |
|
Diamond Trust Bank*** |
50.8 |
46.0 |
(9.4%) |
(7.7%) |
59.5 |
64.6 |
10.9% |
51.3% |
0.2x |
Buy |
|
Kenya Reinsurance |
1.8 |
1.8 |
(1.1%) |
(3.7%) |
2.3 |
2.5 |
11.1% |
50.6% |
0.1x |
Buy |
|
Sanlam |
8.6 |
8.0 |
(7.0%) |
(16.5%) |
11.6 |
11.9 |
0.0% |
48.9% |
0.8x |
Buy |
|
CIC Group |
1.7 |
1.7 |
(2.3%) |
(11.5%) |
2.2 |
2.3 |
7.7% |
45.0% |
0.6x |
Buy |
|
Co-op Bank*** |
12.0 |
12.3 |
2.1% |
1.2% |
13.0 |
15.9 |
12.2% |
42.0% |
0.5x |
Buy |
|
Stanbic Holdings |
112.0 |
110.0 |
(1.8%) |
7.8% |
87.0 |
131.8 |
11.5% |
31.2% |
0.7x |
Buy |
|
HF Group |
3.8 |
4.2 |
11.4% |
33.0% |
3.8 |
4.5 |
0.0% |
6.2% |
0.2x |
Hold |
|
*Target Price as per Cytonn Analyst estimates **Upside/ (Downside) is adjusted for Dividend Yield ***For Disclosure, these are stocks in which Cytonn and/or its affiliates are invested in |
||||||||||
We are “Neutral” on the Equities markets in the short term due to the current adverse operating environment and huge foreign investor outflows, and, “Bullish” in the long term due to current cheap valuations and expected global and local economic recovery.
With the market currently trading at a discount to its future growth (PEG Ratio at 0.6x), we believe that investors should reposition towards value stocks with strong earnings growth and that are trading at discounts to their intrinsic value. We expect the current high foreign investors sell-offs to continue weighing down the equities outlook in the short term.
- Industry Reports
During the week, the Central Bank of Kenya (CBK) released the Bank Supervision Annual Report 2022, which highlighted the performance of the mortgage industry in Kenya’s Real Estate sector. The key highlights include;
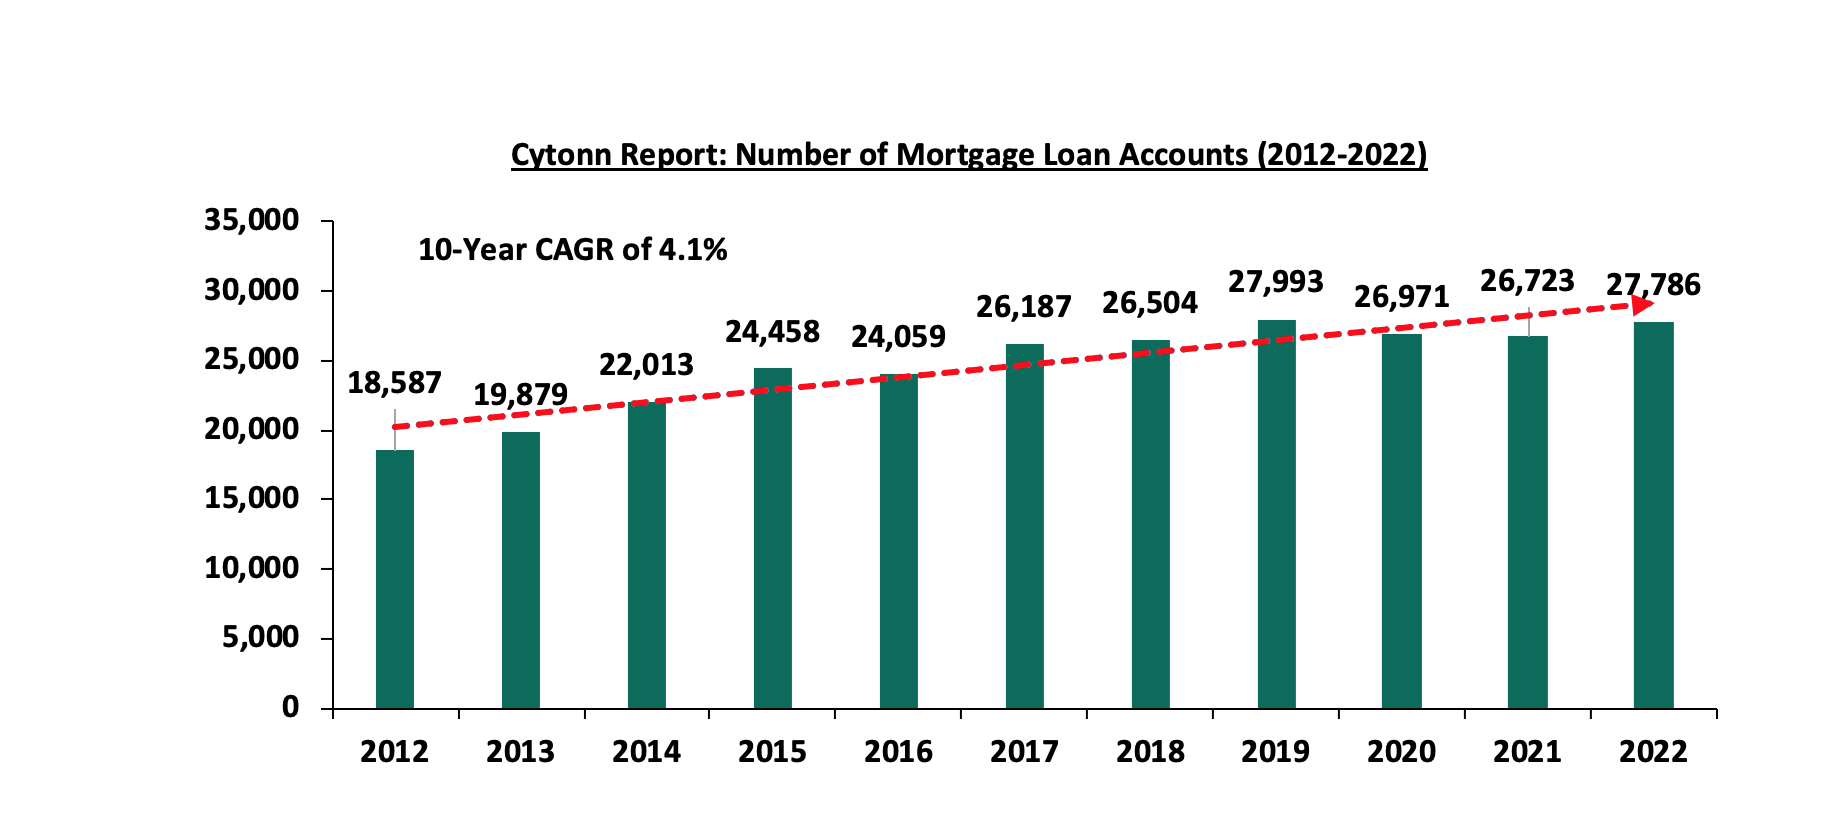
- The number of mortgage accounts increased by 4.0% to 27,786 in 2022, from 26,723 in 2021, which also represented a 10-year Compounded Annual Growth Rate (CAGR) of 4.1%, from 18,587 recorded in 2012. This was attributed to growing demand for homeownership among Kenyans as evidenced by a 5.7% average growth of the Real Estate sector in the last five years. This has been driven by steady economic growth at an average of 4.6% in last 5 years, subsequently increasing the disposable income for investment in property. The graph below shows the average mortgage loan accounts from 2012 to 2022:
Source: Central Bank of Kenya
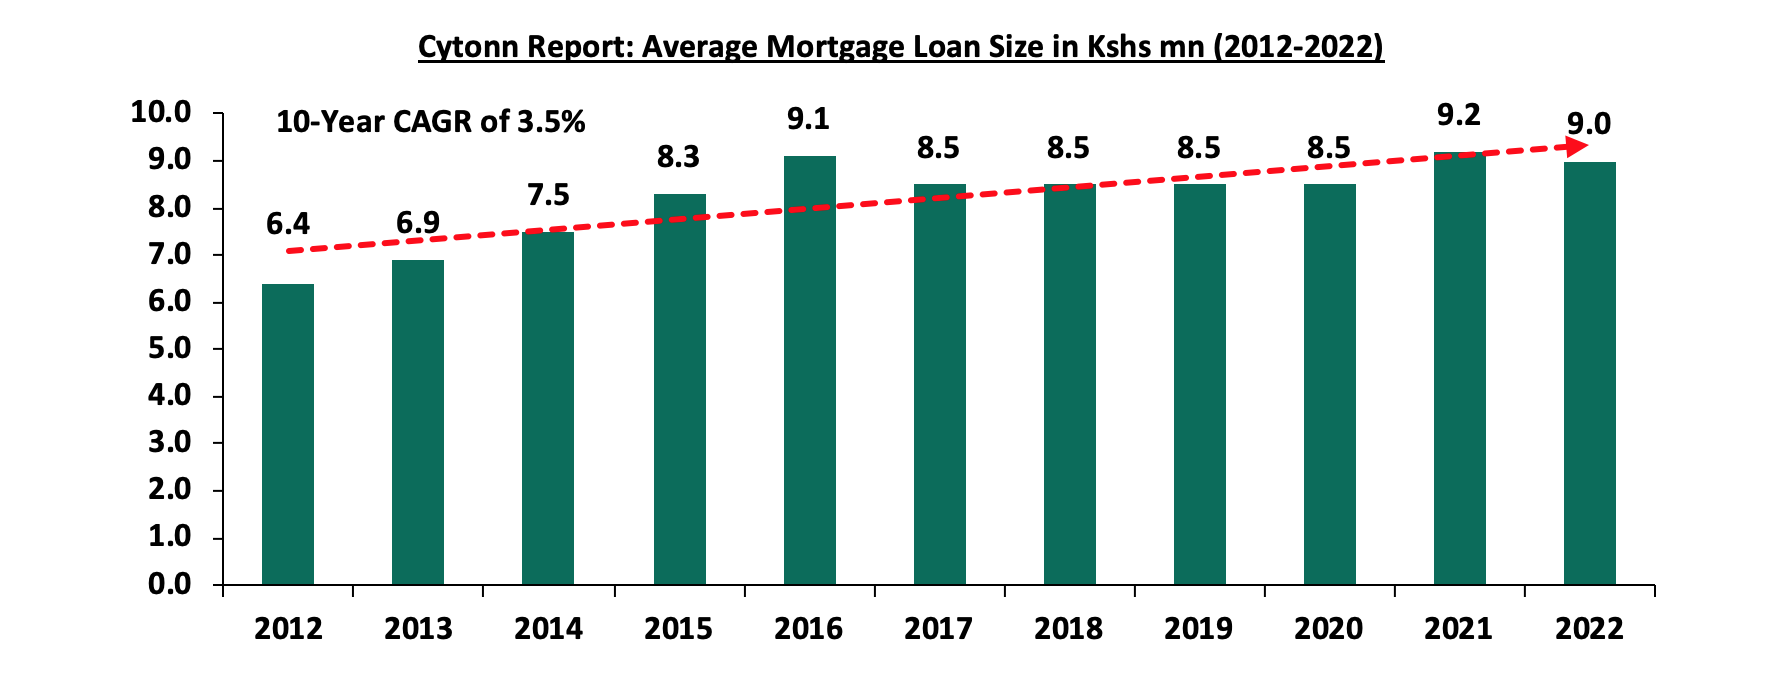
- The average mortgage loan size decreased by 2.2% to Kshs 9.0 mn in 2022, from 9.2 mn in 2021, attributable to lower values of mortgage loans advanced in 2022 by financial institutions. However, the steady increase in average mortgage loan sizes at a 10-year CAGR of 3.5% to Kshs 9.0 mn in 2022, from 6.4 mn in 2012, illustrates continuous demand for higher value mortgage loans, in line with rising costs of construction of buildings and purchases of homes in the market over the decade. The graph below shows the average mortgage loan size from 2012 to 2022:
Source: Central Bank of Kenya
- The value of mortgage loans outstanding increased by Kshs 16.7 bn, representing a 6.8% increase to Kshs 261.8 bn in 2022, from Kshs 245.1 bn in 2021. The upward trajectory of the value of loans as evidenced by 10-year CAGR of 8.1% to Kshs 261.8 bn, from Kshs 119.6 bn in 2012, was attributed to increase in the number of mortgage loans granted by financial institutions as illustrated above. This was on the back of continuous recovery of the economy from the adverse effects of the COVID-19 pandemic in 2022 and 2021, hence creating more opportunities in the residential sector. The graph below illustrates the trend of value of mortgage loans outstanding from 2011 to 2022:
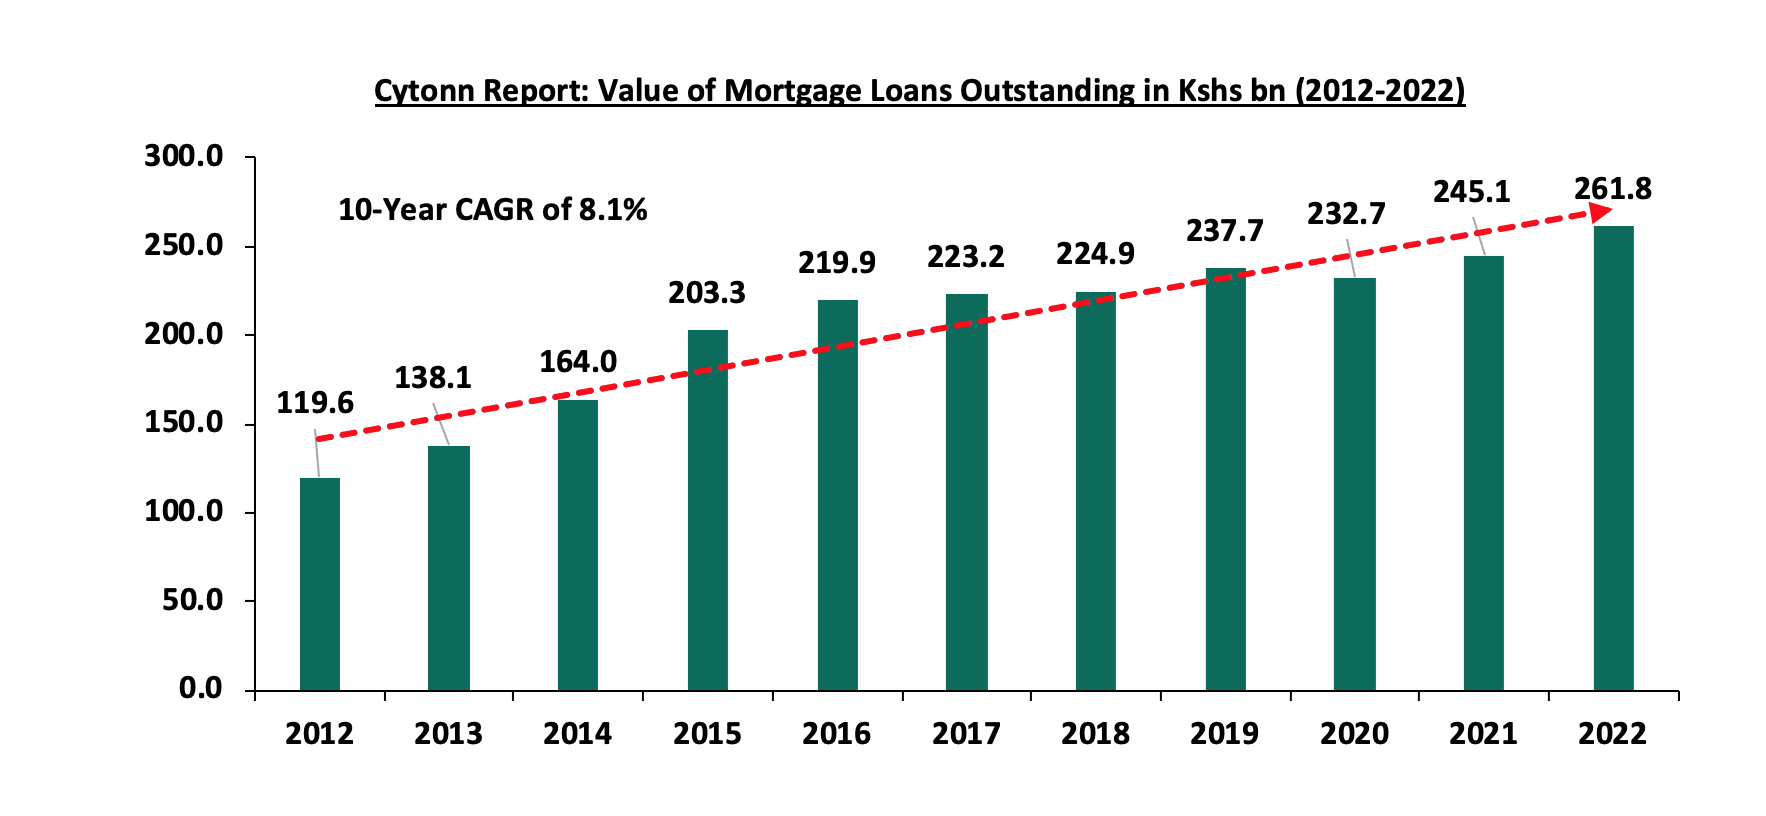
Source: Central Bank of Kenya (CBK)
- The average interest rate charged on mortgages increased by 1.0% points to 12.3% in 2022, from 11.3% in 2021. The interest rates majorly ranged from 8.2% to 17.0% in 2022 compared to a range of from 7.1% to 15.0% recorded in 2021. The increase in the interest rates was attributed to the consistency of increasing interest rates charged by financial institutions in the economy, in line with gradual increases in the average MPC rate by CBK to 8.8% at the end of 2022, from 7.0% in 2021 aimed at curbing the elevated inflation rate. The graph below shows the average interest rate charged on mortgage loans in Kenya from 2012 to 2022:
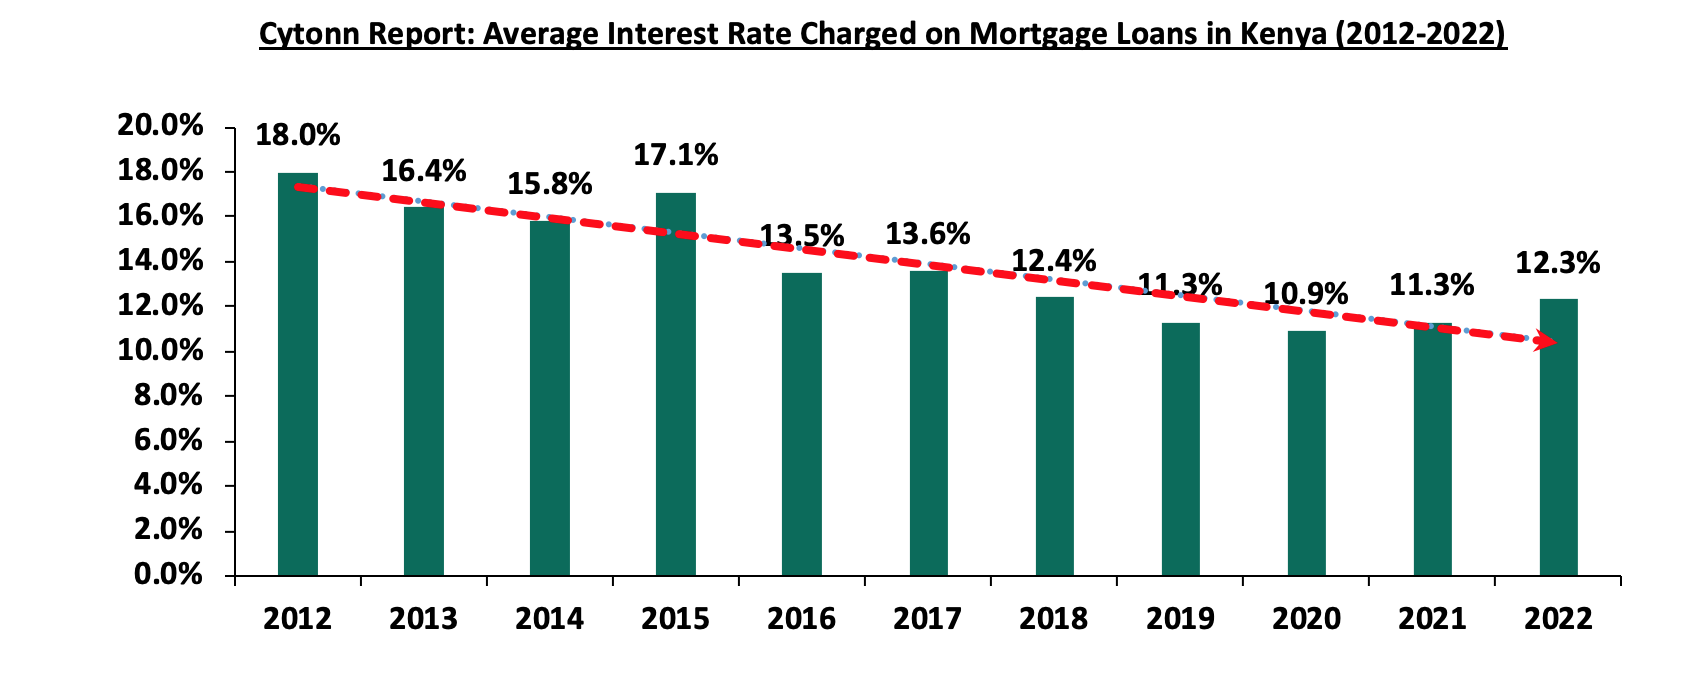
Source: Central Bank of Kenya (CBK)
- The outstanding value of Non-Performing Mortgage Loans (NPMLs) increased by 33.6% to Kshs 37.8 bn in 2022, from Kshs 28.3 bn in 2021. Additionally, the NPMLs have increased at a 10-year CAGR of 18.7% to Kshs 37.8 bn in 2022, from Kshs 6.8 bn in 2012. This was attributed to rising costs of construction over the years. As a result, a significant number of housing investors found it difficult to service their mortgage loans. The disruptions in the housing market activities coupled with rising prices of the existing housing units led to a slowdown in Real Estate sales, making it more difficult for investors to sell their homes and refinance their mortgages during the period. However, the Non-Performing Mortgage Loans to Gross Mortgage Loans ratio was at 11.4% in 2022, 2.4% points lower than the industry Gross Mortgage Loans to Gross Loans ratio of 13.8% in 2021. The graph below shows the performance of non-performing mortgage loans from 2013 to 2021:
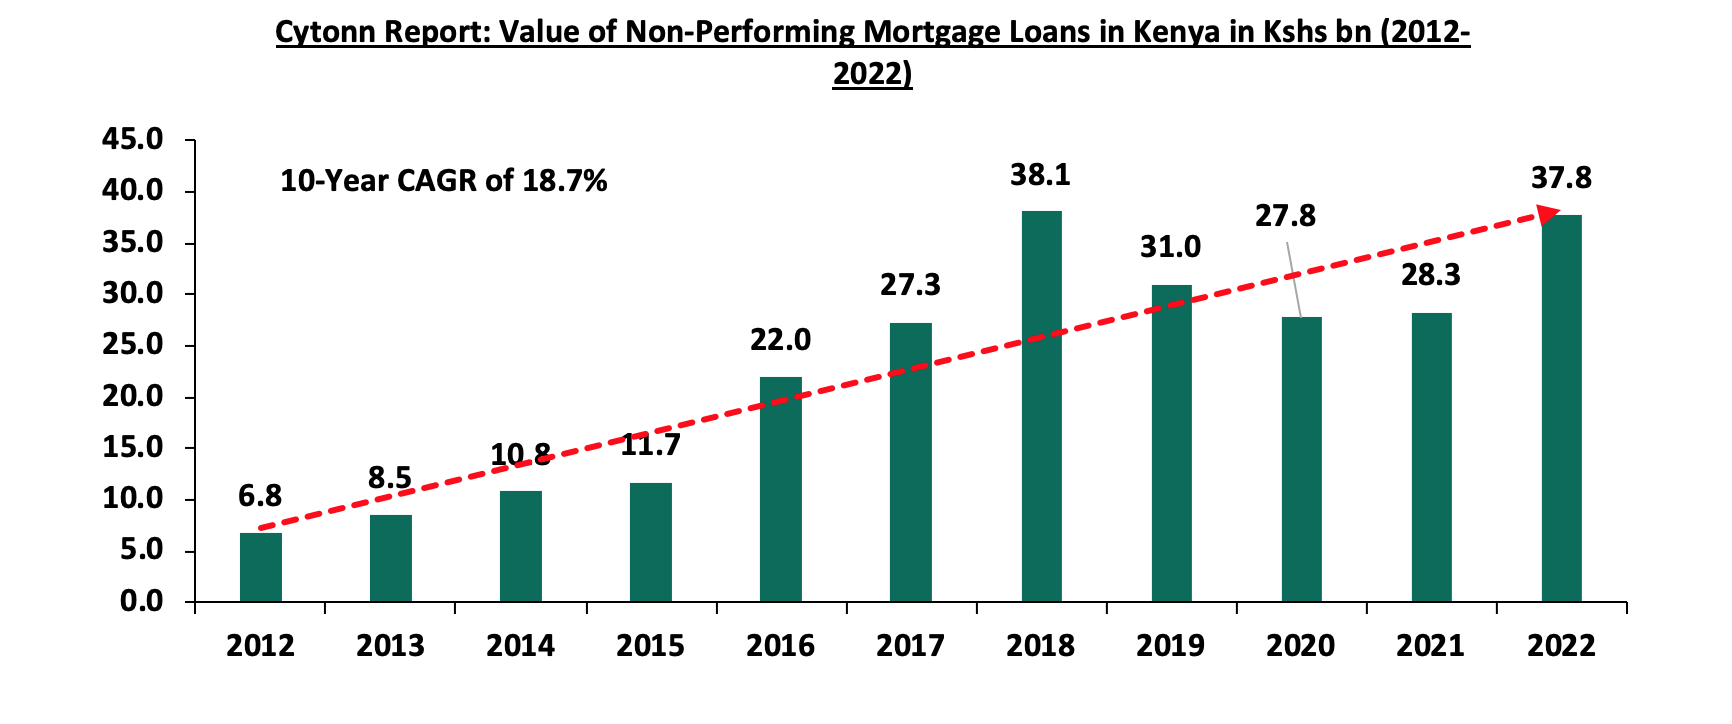
Source: Central Bank of Kenya (CBK)
The graph below shows Non-Performing Mortgage Loans to Gross Mortgage Loans and Non-Performing Mortgage Loans to Gross Loans from 2015 to 2022;
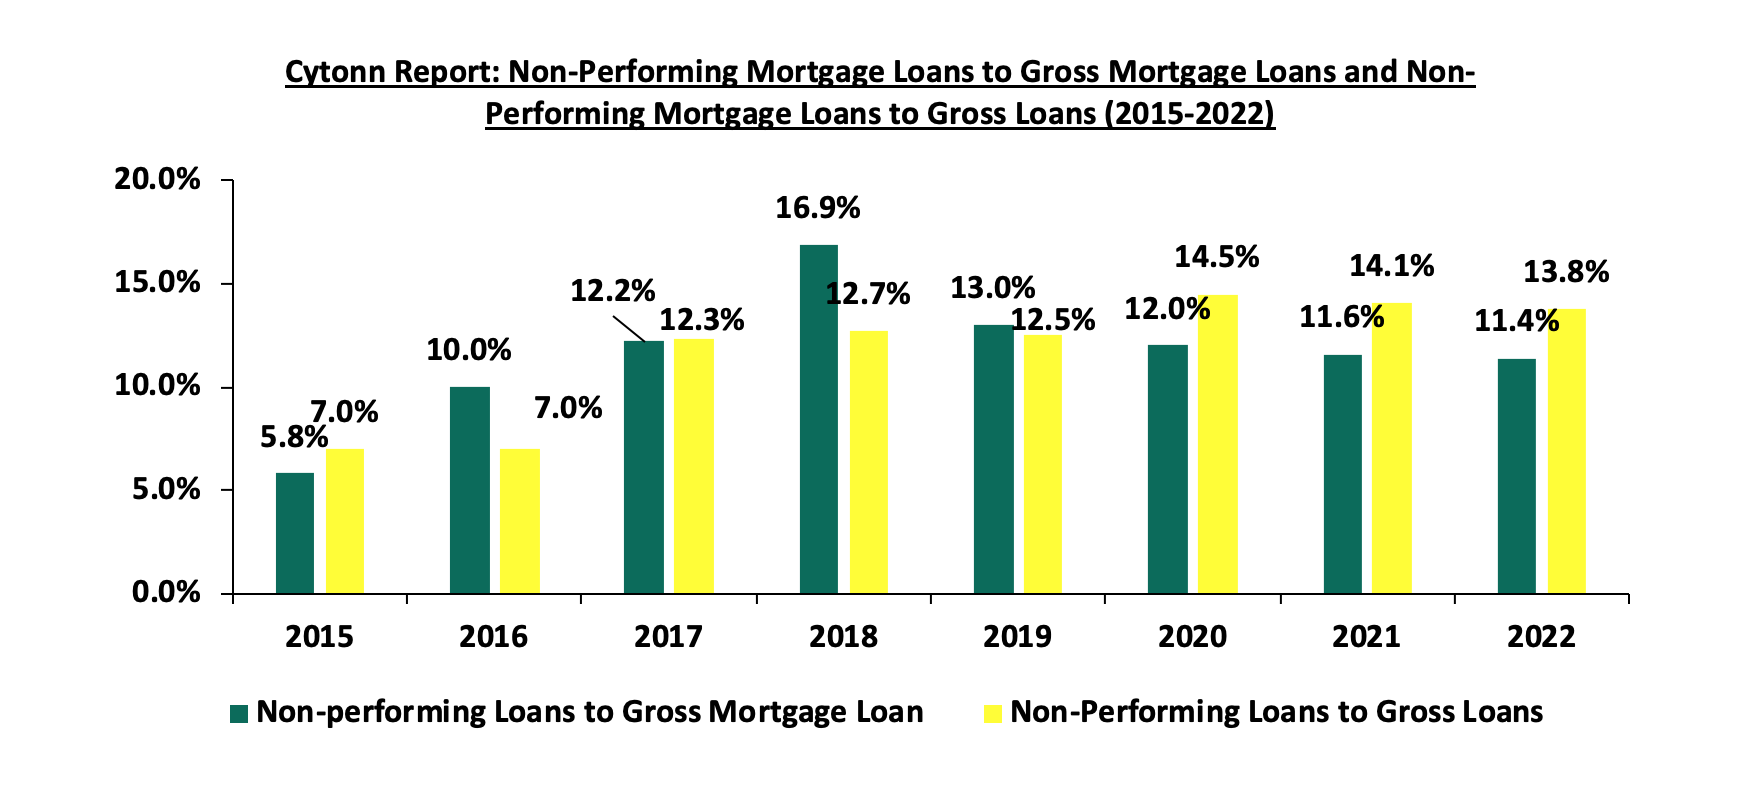
Source: Central Bank of Kenya (CBK)
- The Loan to Value Ratio, which is the maximum loan as a percentage of the property value, stabilized at 90.0% in 2022 since 2014, leaving mortgage customers to cover for their own incidental costs such as legal and registration costs. On the other hand, the average maturity of the loans was 10.9 years. This is as the loan maturity ranged from a minimum of 5 years to a maximum of 18 years as compared to loan maturity of 12 years recorded in 2021, ranging from a minimum of 5 years to a maximum of 20 years. This indicated that majority of the financial institutions tightened their loan restrictions by decreasing the period of their mortgage facilities to clients, owing to heightened risks of default to the lenders.
We expect that the mortgage industry will record increased activities going forward, supported by; i) the government's aggressive efforts on providing affordable housing, ii) renewed investor confidence in select sectors such as the hospitality industry with increase in tourist arrivals, iii) increased participation of private sector developers through Public Private Partnerships (PPPs) in bringing affordable housing projects to fruition, and, iv) joint efforts of the government through the Kenya Mortgage Refinancing Company (KMRC) and private financial institutions in enhancing financial accessibility by providing affordable and flexible mortgage options which accommodate the general public. Nevertheless, there are several challenges that continue to hinder the industry’s optimal performance. Some of the challenges include; high development costs of housing units caused by rising costs of land and construction materials, and rising prices of the existing properties on sale at the back of elevated inflation rates and transactional charges for services such as legal and registrations. Subsequently, Kenya’s mortgage to GDP continues to underperform at approximately 2.2% as of 2022, compared to countries such as South Africa and Rwanda which stand at approximately 16.3% and 4.2% as at 2021, respectively. The graph below shows a comparison of the mortgage to GDP ratio in Kenya against other countries;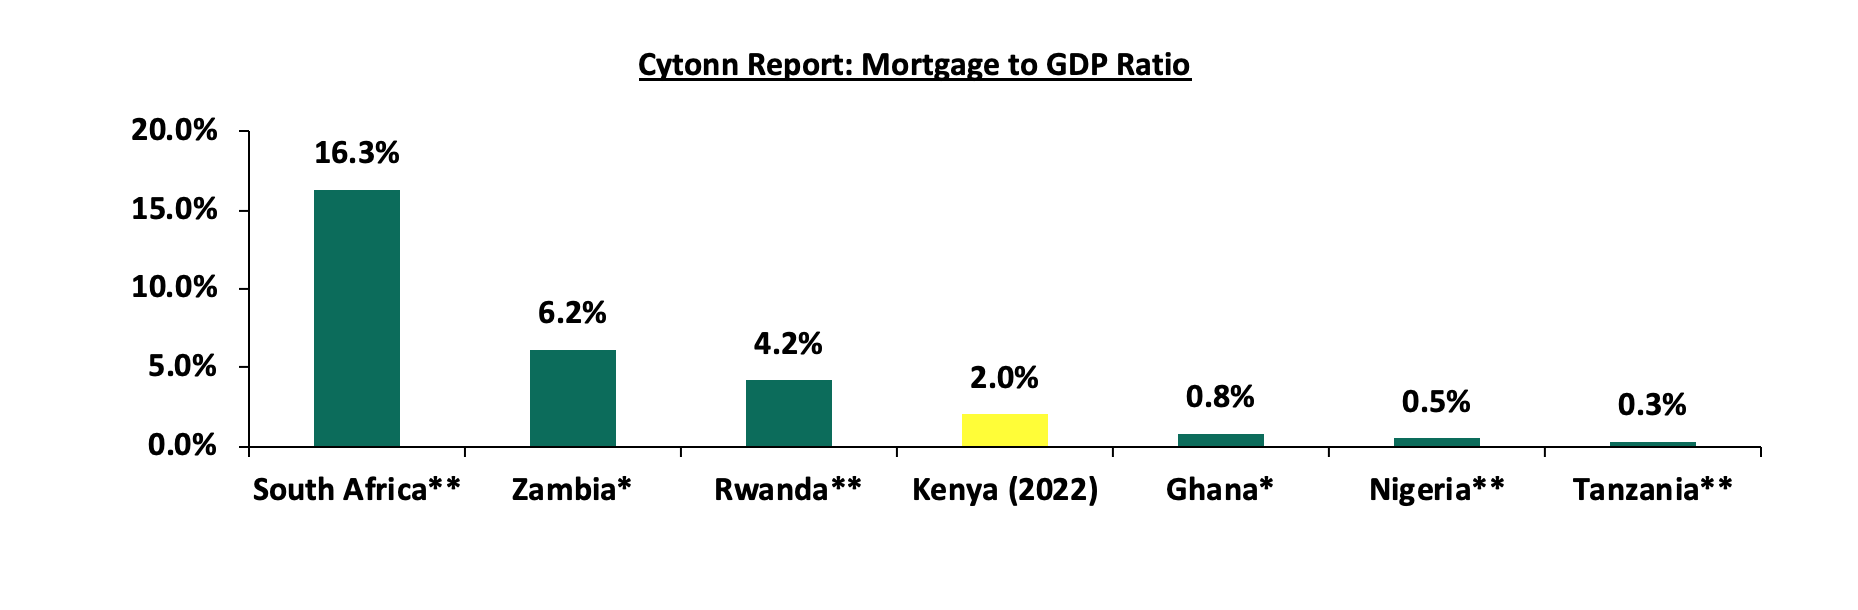
- Regulated Real Estate Funds
- Real Estate Investment Trusts (REITs)
In the Nairobi Securities Exchange, ILAM Fahari I-REIT closed the week trading at an average price of Kshs 6.0 per share. The performance represented an 8.3% increase from Kshs 5.5 per share recorded the previous week, taking it to an 11.5% Year-to-Date (YTD) decline from Kshs 6.8 per share recorded on 3 January 2023. In addition, the performance represented a 70.0% Inception-to-Date (ITD) loss from the Kshs 20.0 price. The dividend yield currently stands at 10.8%. The graph below shows Fahari I-REIT’s performance from November 2015 to 19 May 2023: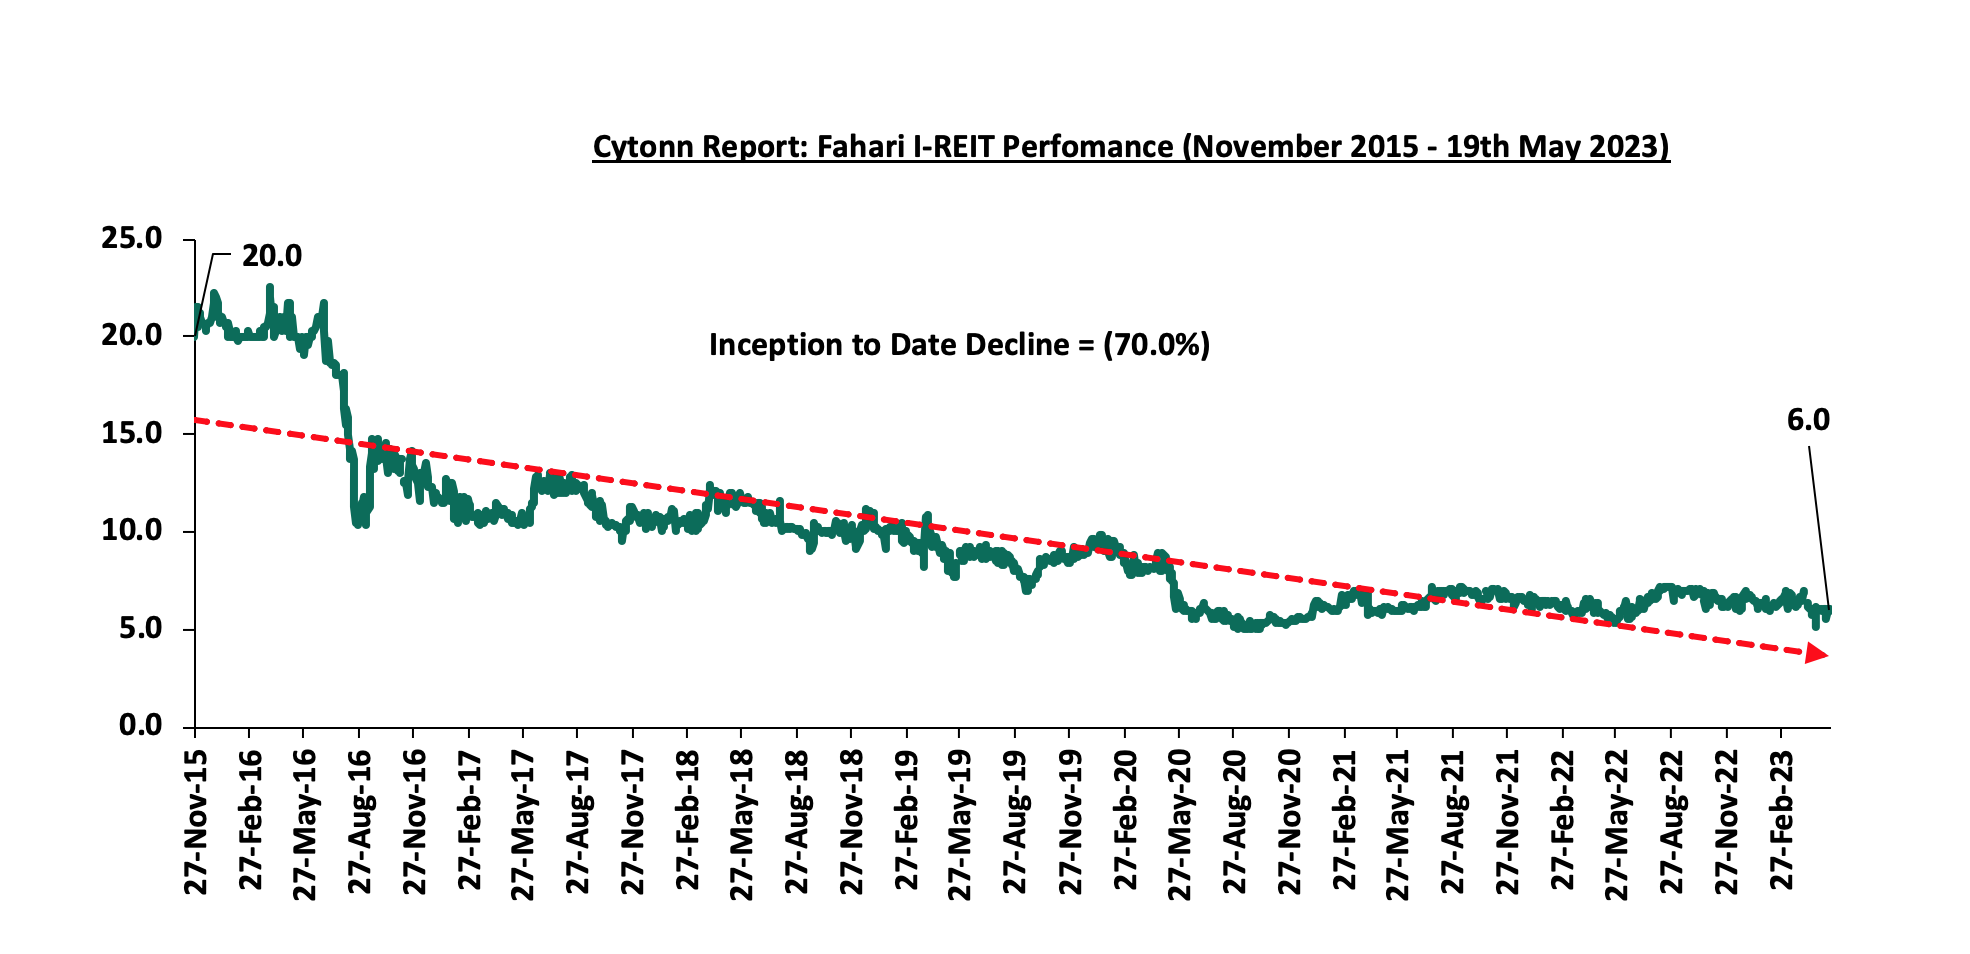
In the Unquoted Securities Platform, Acorn D-REIT and I-REIT traded at Kshs 23.9 and Kshs 20.9 per unit, respectively, as at 19 May 2023. The performance represented a 19.4% and 4.4% gain for the D-REIT and IREIT, respectively, from the Kshs 20.0 inception price. The volumes traded for the D-REIT and I-REIT came in at 12.3 mn and 29.6 mn shares, respectively, with a turnover of Kshs 257.5 mn and Kshs 616.4 mn, respectively, since inception in February 2021.
REITs provide numerous advantages, including; access to more capital pools, consistent and prolonged profits, tax exemptions, diversified portfolios, transparency, liquidity and flexibility as an asset class. Despite these benefits, the performance of the Kenyan REITs market remains limited by several factors such as; i) insufficient investor understanding of the investment instrument, ii) time-consuming approval procedures for REIT creation, iii) high minimum capital requirements of Kshs 100.0 mn for trustees, and, iv) high minimum investment amounts set at Kshs 5.0 mn discouraging investments.
- Cytonn High Yield Fund (CHYF)
Cytonn High Yield Fund (CHYF) closed the week with an annualized yield of 13.7% remaining relatively unchanged from what was recorded the previous week. The performance also represented a 0.2% points Year-to-Date (YTD) decline from 13.9% yield recorded on 1 January 2023, and 2.0% points Inception-to-Date (ITD) loss from the 15.7% yield. The graph below shows Cytonn High Yield Fund’s performance from November 2019 to 19 May 2023: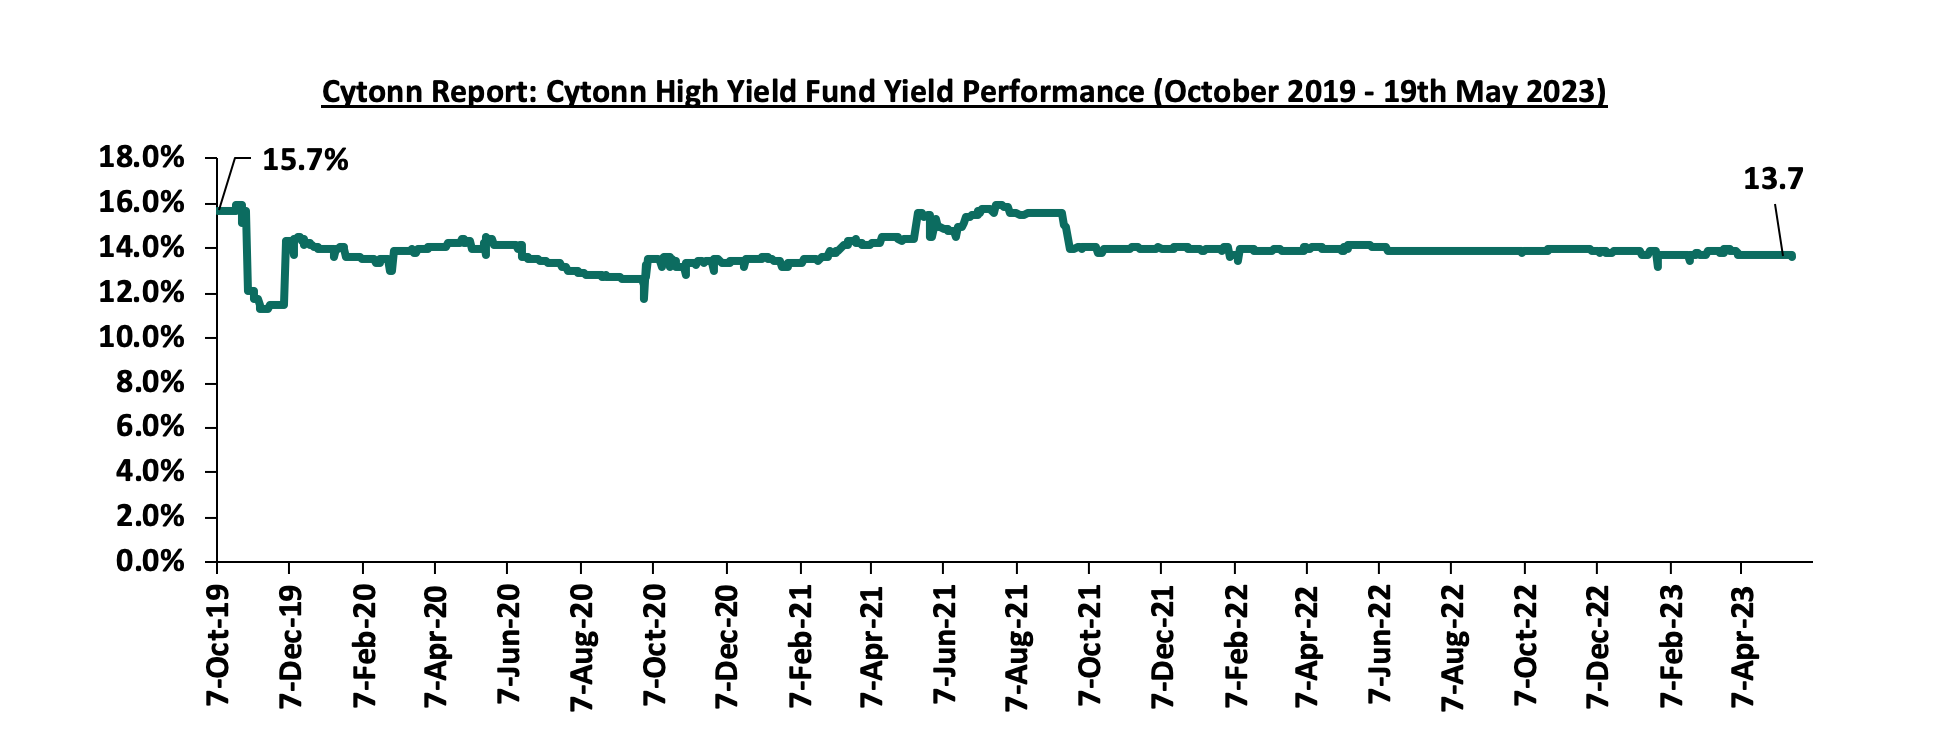
Notably, the CHYF has outperformed other regulated Real Estate funds with an annualized yield of 13.7%, as compared to Fahari I-REIT and Acorn I-REIT with yields of 11.7%, and 6.8% respectively. As such, the higher yields offered by CHYF makes the fund one of the best alternative investment resource in the Real Estate sector. The graph below shows the yield performance of the Regulated Real Estate Funds:
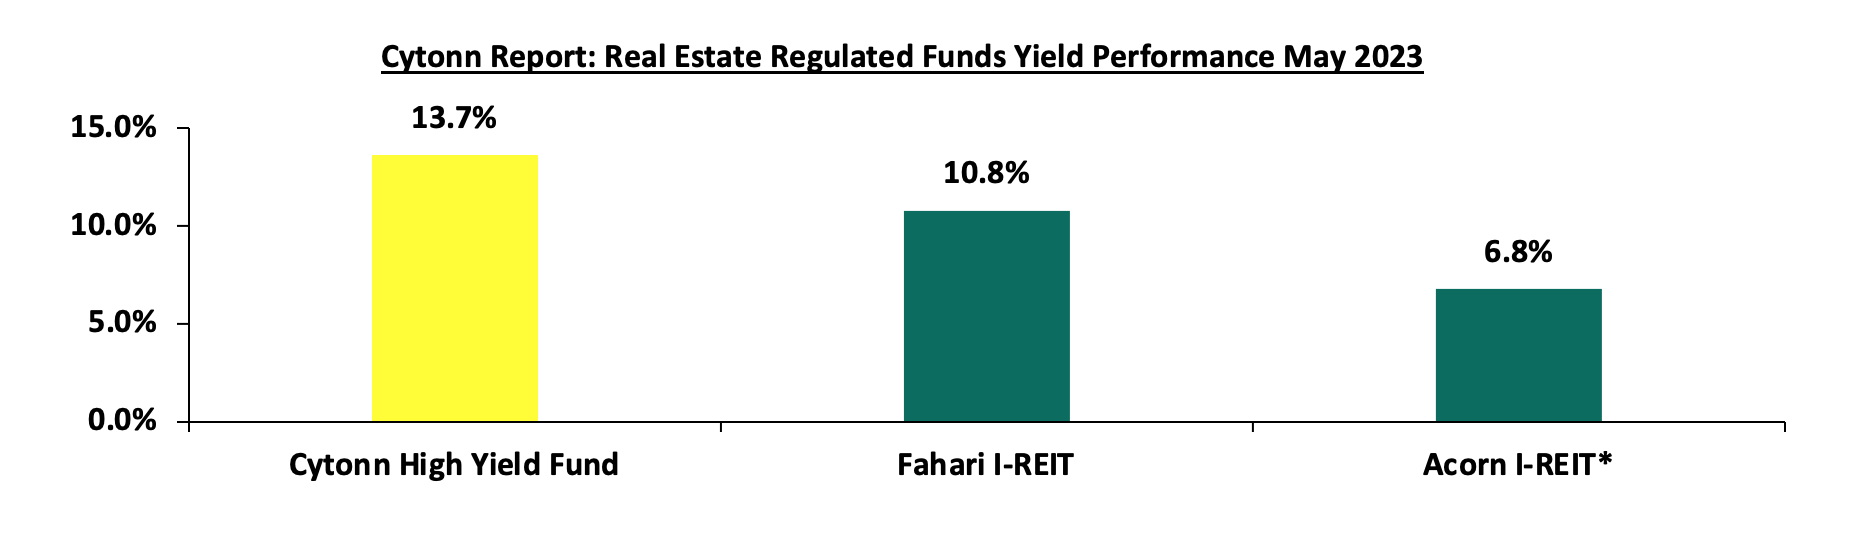
*FY’2022
Source: Cytonn Research
We expect the performance of Kenya’s Real Estate sector to remain on an upward trajectory, supported by factors such as; i) increased activities in the residential sector thus facilitating subsequent positive performance in the mortgage industry, ii) aggressive expansion drive of both local and international retailers, and, iii) increasing demand for Real Estate facilitated by positive demographics such as high urbanization and population growth rates. However, the existing oversupply of physical space in the retail and commercial office sectors, rising inflation driving up cost of construction as well as costs of operations thereby hindering consumer purchasing power, and low investor appetite for REITs are expected to continue subduing the optimum performance of the sector.
People face various financial obligations in different stages of their lives that range from medical expenses, education expenses and other miscellaneous expenses. Currently, the expenses have been worsened by the high cost of living in Kenya that has adversely impacting the financial stability and overall well-being of the people. Despite the high cost of living, it is key to note that a lot of financial challenges are often caused by poor financial planning. Financial Planning refers to a process that help an individual to make sound decision about money that can help one to achieve financial goals. Having a sound personal financial plan is important because it helps reduce and possibly eliminate financial distress arising from various responsibilities and unexpected situations. As such, the purpose of this focus note is to highlight the importance of financial planning, the various considerations to make based on one’s own characteristics, needs and preferences, and some of the investment avenues available in Kenya. We shall undertake this by discussing the following:
- What is Personal Financial Planning?
- Factors Behind the High Cost of Living in Kenya,
- Financial Planning Process,
- Factors to Consider When Making Investment Decision,
- Investment Products in The Kenyan Market, and,
- Conclusion.
Section I: What is Financial Planning?
Personal Financial Planning refers to a process that help an individual in managing one’s finances aimed at maximizing the use of these resources in order to order to achieve financial goals and objectives. Having a sound financial plan is important because it helps reduce and possibly eliminate financial distress arising from various responsibilities and unexpected situations. Financial planning largely depends on one’s age, income level, risk tolerance, the responsibilities at hand, and future objectives. These factors have led to the broad classification of investors into three phases:
- Accumulation Phase: It constitutes the young population of ages 18- 30 years. Their net worth is low and restricts them to low-priced investments. They have a high-risk tolerance because of their long-term investment lifespan since a loss incurred during this phase can be recovered in the next investment cycle,
- Consolidation Phase: It encompasses the middle age income earners of ages 30-55 years. At this stage, the net worth of individuals is relatively high and they can afford a range of investment commodities. However, their risk tolerance is lower than that of individuals in the accumulation phase. They seek out ventures that would not imbalance their accumulated capital while still investing to offset inflationary rates, and,
- Spending/ Gifting Phase: Most people at this stage are retired and are of ages 55 years and beyond. Their source of income is majorly from the investments held. They have a low-risk tolerance and prefer little to no risk investments.
Section II: Factors Behind the High Cost of Living in Kenya
- High Inflation
Inflation refers to the general rise in prices of commodities leading to erosion of purchasing power of money. Key to note is that when inflation rate exceeds the rate earned on an investment it leads to negative real returns. Kenya has continued to witness elevated Inflationary pressures with the rates persistently remaining above the target range of 2.5% - 7.5% for the 11 months to April 2023 despite easing to 7.9% in April 2023 from 9.2% recorded in March 2023. The headline inflation has mainly been driven by:
- High fuel and energy cost: Kenya heavily rely on imported fuel to meet its energy needs. High global oil prices and transportation costs occasioned by persistent supply chain constraints and high global inflationary pressures directly impact the price of electricity, fuel, and cooking gas. These high energy costs have ripple effects on various aspects of daily life such as transportation, cooking, and heating, and,
- High Food Prices: The costs of essential foodstuffs in Kenya have been on the rise as a result of decreased agricultural productivity occasioned by climate change as well as erratic rainfall patterns. The increased food prices have limited access to essential food particularly by those with low incomes due to increased burden,
- Currency Depreciation
Currency depreciation refers to the decline in value of currency of a particular country with respect to other foreign currencies. The fall in value of a country’s currency increase the cost of importing raw materials, goods and services and thus leading to high cost of production and eventually leads to high prices of commodities. The Kenyan shilling has continued to depreciate against the dollar having depreciated by 11.4% YTD in 2023 to Kshs 137.5 as at 19 May 2023, from Kshs 123.4 at the beginning of the year. Additionally, the shilling depreciated by 9.0% in 2022 closing the year at Kshs 123.4, from Kshs 113.1 in January 2022. The continued depreciation of the Kenyan shilling is mainly attributable to the ever-present current account deficit which was at 4.9% of GDP in 2022 given that Kenya is a net importer as well as increase in dollar demand in the market leading to further depreciation,
- High Taxes and increased Levies
Kenyan employees face increased pressure on their incomes due high tax rates as well as increased levies such as the recently rolled out National Social Security Fund (NSSF) deductions of 6.0%. Additionally, the recently released Finance Bill 2023, as highlighted in our Cytonn Weekly #18/2023, has various proposals of increasing taxes and levies such as the 3.0% housing levy which are expected to increase the burden among the Kenyan employees in the formal sector. Despite the taxation being essential for government revenue, high taxes and levies on goods and services continue to inflate prices and thus contributing to the high cost of living in Kenya. Further, excessive tax rates adversely impact affordability and place an additional burden on individuals and households, and,
- Increased Interest Rates
Rising interest rates increase borrowing cost, reduce disposable income and consequentially limit consumer spending. In 2022, the Monetary Policy Committee (MPC) increased its lending rate by a cumulative of 175.0 bps in order to anchor inflation which averaged at 7.6% in 2022. So far in 2023, the MPC has raised the CBR rate by a total of 75.0 bps to 9.5% in March 2023. Notably, the continued increase in the Central Bank Rates (CBR) has led to an increase in the commercial bank’s lending rates to 13.1% in February 2023, from 12.1% seen in January 2022.
Section III: Financial Planning Process
Personal Financial planning is a continuous process founded on four pillars namely; budgeting, saving, investing and debt management. The planning process considers every aspect of your financial situation and how they affect your ability to achieve your goals and objectives. Achieving financial freedom can be done through the following steps:
- Assessment: This step involves identifying factors that are likely to affect one’s financial plan by evaluating his/her income, spending habits, lifestyle and see how each of them will affect their financial plan,
- Goal Setting: Prior to creating financial action plans, one should outline their financial end goal. Typically, financial goals and priorities differ from person to person and over time, influencing the path one takes toward achievement of their financial goal. Your financial planning goals should be measurable and achievable through one or a combination of the following four practices:
- Investing - Saving and investments are frequently conflated but they are not the same thing. Saving allows you to earn a lower return but with low or no risk involved, while investing gives a higher return but at the risk of loss. Investing involves purchasing an asset with an intention of generating income in future or the asset appreciating hence being able to sell it at a profit. There are different asset classes to consider and an investor will choose them depending on their risk appetite, the returns expected and the liquidity requirement. As you invest, it is important to diversify one’s portfolio through investing in different instruments in a bid to mitigate risks,
- Saving - Saving basically means deferred consumption and entails consuming less out of a given amount of resources in the present in order to have enough for future consumption. Consistency is necessary for effective saving.
- Debt and Debt Management – Debt is beneficial when utilized for an investment or for future financial gain such as business, education, or property. However, it is advisable to incur debt for investment purposes only if the economic rate of return, which is simply how an investment’s economic benefits compare to its costs are able to finance the debt. Here are a few do’s and don’ts for debt management;
-
-
- Plan before you borrow,
- You should never use more than one third of your net income in loan repayment,
- Never borrow for things you desire but don’t need,
- Avoid borrowing on consumption items, and,
- Live within your means.
-
-
- Budgeting – Budgeting refers to creating a plan on how to spend your money. It is important that you have the discipline to design and keep to a budget based on the resources you have. When budgeting, it is important to prioritize your needs and necessary expenses and aim to cut down on needless expenses as much as possible,
- Plan Creation and Execution: A financial plan is a well-detailed procedure that outlines how one intends to accomplish their financial goals, how long it would take to achieve the goals and the best strategy for achieving those goals. Execution refers to how best to put the created plan to action. A well laid out plan should highlight the following items:
- Suitable channels and investment instruments to achieve your goals- This involves selecting the best strategies to achieve your financial targets. This may be accomplished by prudent budgeting, cost-cutting, investing and saving, and,
- Timelines- Your strategy should specify how long you are willing to invest in a certain investment instrument on whether your goals are long term or short term. Bonds and real estate are mostly suitable for long-term goals while money markets are suitable for short term investments, and,
- Monitoring and Reassessment: Financial planning is a continuous process because goals and priorities change over time and therefore monitoring a financial plan for possible adjustments or reassessments is necessary. A review allows you to analyse individual investments and determine if they are helping in the achievement of your goals. The following factors should prompt one to make changes on their financial plan during a review:
-
- Status of Set Goals- Achievement of pre-determined goals should prompt you to change your financial plan. If the goals are yet to be achieved it is necessary to determine if they can still be achieved, given the present circumstances,
- Change in Income- A change in income levels directly impacts your financial plan because it may require a change in priorities and may also lead to early maturity or a delay of set goals and therefore affect the set timelines,
- Number of Dependents- An increase/ decrease in the number of dependents may mean that one has less or more disposable income to put into investments, and,
- Change in Risk Appetite and Risk Tolerance- Factors such as age, number of dependents and income levels of an individual affect the risk appetite and tolerance of individuals, therefore their financial plan should adjust to suit their new risk appetite and tolerance.
Section IV: Factors to Consider When Making Investment Decision
The main considerations while making investments decisions will largely depend on one’s individual risk tolerance and appetite. Some of the key factors likely to inform one’s individual investment decision include:
- Risk Profile- Risk is the potential threat that may affect the outcome of your investments. Risk-averse individuals generally avoid riskier investments. Their financial planning decisions are geared towards safer investment plans and their portfolio will most likely include investment instruments such as treasury bonds, bills, and bank deposits. They can also invest in these securities through money market funds or fixed income funds. Risk-tolerant investors, on the other hand, will channel their planning towards high-risk investments such as real estate and equities, with the aim of generating higher returns,
- Investment Goals- A person objective will determine the type of investment they venture in, it might be long-term or short-term investments. Investment goals address two major themes regarding money and money management. First, they generate accountability, forcing individuals to review progress from time to time and second, they help in generating motivation,
- Income- A change in an individual’s income affects their disposable income and the amount of money they have left to invest. The investment vehicles one uses in achieving their financial goals will largely depend on their level of income. Collective investments schemes allow low-income earners to gain access to various securities such as bank deposits, treasury bills, bonds, equities and structured products given the relatively lower initial investment requirement,
- Age- Younger people have a longer time horizon and therefore they can make riskier investment decisions as they have time to recover if they end up making losses. They can skew their investments towards real estate and equities which allow the investor time to grow value in their investment. For older people, the time horizon is shorter and therefore they are averse to high-risk investments. Safer investment options are preferred because they offer steady and predictable income. Therefore, older people can have their investments skewed towards government-backed assets such as bills and bonds, which offer an almost guaranteed return after a given period. They may also invest in various collective investment schemes such as fixed income or money market funds, which are professionally managed, offer liquidity and principal protection, and,
- Marital Status and Number of Dependents- People with few dependents have the freedom to make riskier investment decisions as compared to those with many people depending on their income. Married individuals often prioritize their families and would always look for less risky portfolios due to their responsibilities in the family.
The table below summarizes the investment allocation depending on the highlighted factors.
|
Investors Age (Years) |
Expected Risk Profile |
Income Level |
Skew investments towards |
Reasoning |
|
Below 25 |
High |
Low to Medium |
Collective Investment Schemes, Pensions, and Equities |
Has a long investment horizon to withstand volatility and get enhanced returns |
|
25- 35 |
High |
Medium to high |
Collective Investment Schemes, Pensions, Real Estate and Equities |
Few cash flow requirements. Still has time to withstand volatility |
|
35-45 |
Medium |
Medium to high |
Pensions, Collective Investment Schemes, Real Estate, Equities, and Fixed Income |
There are constant cash flow obligations. Still has time to withstand medium volatility |
|
45-55 |
Medium |
Medium to high (Generating income from prior investments) |
Real Estate, Equities, and Fixed Income |
There are constant cash flow obligations. Still has time to withstand medium volatility |
|
Above 60 |
Low |
Low or non-existent |
REITs and Fixed Income |
Stability of income is key |
Section V: Investment Products in the Kenyan Market
There are various investment products available in Kenyan market and their variation mainly depend on return and risk they carry. An investor need to decide on different channels based on their risk appetite, the returns expected and the liquidity requirement. Investment products available are broadly categorized into two categories:
- Traditional Investments
- Alternative Investments
- Traditional Investments
Traditional investments involve putting capital into well-known assets that are sometimes referred to as public-market investments. The main categories of traditional investment products under this category include:
- Equities- Equities are ownership stake in a company. They are traditional investments that are relatively liquid yet highly volatile making them very risky. They provide returns in the form of dividends and capital growth, making them attractive investment option for long-term investors. To invest in Kenya’s equity market, one need to open a Central Depository and Settlement (CDS) account, which is an electronic account that holds your shares and bonds, and allows for the process of transferring of shares at the Securities Exchange through a licensed stockbroker,
- Fixed Income- These securities which contractually provide an investor with a predetermined return in the form of interest and principal payments. They are also moderately liquid and have low volatility, hence considered less risky. They are suitable for medium to long-term investors. They include fixed deposits, Treasury bills and bonds, and commercial papers,
- Mutual Funds- A Collective Investment Scheme that presents investors with an opportunity to participate in the various asset classes by pooling money together from many investors. The funds are managed by a professional fund manager who invests the pooled funds in a portfolio of securities to achieve objectives of the trust. The funds in the mutual funds earn income in the form of dividends, interest income and capital gains depending on the asset class the funds are invested in. The following are the main types of funds:
-
- Money Market Fund- This fund mainly invests in short-term debt securities with high credit quality such as bank deposits, treasury bills, and commercial paper. The fund is best suited for investors who require a low-risk investment that offers capital stability, liquidity and a high-income yield. The fund is a good safe haven for investors who wish to switch from a higher risk portfolio to a low risk, high-interest portfolio, especially during times of high stock market volatility,
- Fixed Income Fund– This fund invests in interest-bearing securities, which include treasury bills, treasury bonds, preference shares, corporate bonds, loan stock, approved securities, notes and liquid assets consistent with the portfolio’s investment objective. The fund is suitable for investors who are seeking a regular income from their investment, including those who intend to secure a safe haven for their investments in times of stock market instability,
- Equity Fund- This type of fund aims to offer superior returns over the medium to longer-term by maximizing capital gains through investing in listed securities. This fund is suited for investors seeking medium to long-term capital growth in their portfolios and want to gain exposure to equity investments. The fund has a medium to high-risk profile. Due to the volatile nature of the stock markets, risk is usually reduced through holding a diversified portfolio of shares across different sectors,
- Balanced Fund– This fund invests in a diversified spread of equities and fixed income securities with the objective to offer investors a reasonable level of current income and long-term capital growth. The fund is suited to investors who seek to invest in a balanced portfolio offering exposure to all sectors of the market. It is also suitable for pension schemes, treasury portfolios of institutional clients, co-operatives and high net worth individuals amongst others. The fund is a medium risk fund and has a medium risk profile, and,
- High Yield Fund – This type of fund invests in securities that generally pay above average interests and dividends, with the fund’s objective being delivery of high returns to investors. The fund has a high-risk profile and is suited for long-term investors who are looking for growth of their portfolio’s over-time.
- Alternative Investments
Alternative investments are those that fall outside the conventional investment types such as publicly-traded stocks, bonds, and cash. The most common alternative investments today are:
- Real Estate - This involves investment in property and land. Real Estate is considered an alternative investment that is illiquid, relatively stable and uncorrelated to traditional investments. They are suitable for long-term investment plans, which makes them a risky investment. Real Estate can yield high returns, and is useful for diversification and as a hedge against inflation since its value increases over time. Real Estate offers returns in the form of rental yield and price appreciation, and,
- Private Equity - It generally involves buying shares in companies that are not listed on a public exchange or buying shares of public companies with the intent to make them private. Private equity can involve many strategies that may help provide money to companies at different stages of their development. The most widely used strategies are venture capital, buyouts and distressed investing.
In determining the appropriate investment option, one should consider:
- Liquidity needs and time horizon for investment- The liquidity varies from one asset to another. An individual must evaluate the target for the investment chosen and the length of time they for which they require illiquid assets,
- The rate of return- A rational investor seeks out a venture that would provide maximum return for a given level of risk,
- The cost of the investment- One should harbor the same sentiments in purchasing an investment as they do in buying groceries. The price of the investment is a key element. Over time, the returns received should exceed the cost of the investment, and,
- The regulatory and legal constraints placed on the venture- Awareness of the tax treatments that the selected investment options are subject to assists one in evaluating their longstanding returns.
Section VI: Conclusion
In conclusion, financial planning is an ongoing process that involves a series of decisions about how money is spend in a way that can help an individual realizes the set goals in life. A person can build a plan on their own or seek an assistance from a financial planner if the needs are more complex. Aside from just buying products like pension, financial planning is important for the following reasons;
- Act as guide to investment. It enables one to choose the right investment that meet their needs and objectives,
- Measuring Progress. A financial plan helps an individual to track their progress, by ensuring one doesn’t deviate from the plan,
- Emergency funds. A well detailed plan will enable to set aside an investment with high liquidity such as a money market fund or bank deposit, which will act as a safety net during times of emergency
- Defining Financial Goals – Having a financial plan allows you to identify your financial goals as opposed to focusing on “side-shows”. Thus, one is able to focus on execution which ultimately increases the chances of realizing their objectives,
- Income Management – A well detailed financial plan is key in ensuring an individual manage income through budgeting and prioritizing spending. Additionally, a good financial plan will enable one to pick out unnecessary expenses and quickly adapt to the financial situation changes, and,
- Comfortable Retirement – Once individual proceeds to retirement, they will cease to generate income, however, they will need to continue finance their expenses and other commitments. Therefore, a good financial plan will play a critical role in ensuring one have a level income enough to fund the lifestyle in retirement.
Disclaimer: The views expressed in this publication are those of the writers where particulars are not warranted. This publication, which is in compliance with Section 2 of the Capital Markets Authority Act Cap 485A, is meant for general information only and is not a warranty, representation, advice or solicitation of any nature. Readers are advised in all circumstances to seek the advice of a registered investment advisor.

- Talk to us
- Kenya
- P.O Box 20695 - 00200, Nairobi, Kenya
- Cell +254709101200
- Tel +254709101200
- WhatsApp +254741676635
- United States
- +254709101200
- DOWNLOAD OUR APP
-


- Kenya
- 8th Floor, Pinetree Plaza, Kaburu Drive, Ngong Road, Nairobi, Kenya
- USA
- Suite 1150, 1775 Eye Street NW, USA, Washington DC 20006, USA
- Investments
- High Yield
- Private Equity
- Real Estate
- Real Estate
- RiverRun Estates
- Cytonn Towers
- The Ridge
- Taraji Heights
- The Alma