Foreign Direct Investments (FDIs) in Kenya, & Cytonn Weekly #36/2025
By Research Team, Sep 14, 2025
Executive Summary
Fixed Income
During the week, T-bills were oversubscribed for the fourth consecutive week, with the overall subscription rate coming in at 161.5%, higher than the subscription rate of 141.2% recorded the previous week. Investors’ preference for the shorter 91-day paper persisted, with the paper receiving bids worth Kshs 15.4 bn against the offered Kshs 4.0 bn, translating to a subscription rate of 385.2%, higher than the subscription rate of 146.7%, recorded the previous week. The subscription rates for the 182-day paper decreased to 31.3% from the 49.1% recorded the previous week, while that of the 364-day paper decreased to 202.3% from the 231.0% recorded the previous week. The government accepted a total of Kshs 28.9 bn worth of bids out of Kshs 38.7 bn bids received, translating to an acceptance rate of 74.6%.The yields on the government papers were on a downward trajectory with the yields on the 364-day paper decreasing the most by 3.1 bps to 9.55% from the 9.58% recorded the previous week while the yields on the 91-day and 182-day papers decreased by 1.5 bps and 1.4 bps to 7.97% and 8.02% respectively, from the 7.99% and 8.03% respectively recorded the previous week;
During the week the Treasury released Kenya’s Annual Borrowing Plan for FY’2025/26 outlining a strategic approach to financing a projected Kshs 1.5 tn gross borrowing requirement, driven by a fiscal deficit of Kshs 901.0 bn and substantial debt refinancing needs. Anchored on a stable macroeconomic outlook with 5.3% GDP growth and improved revenue collection, the plan emphasizes a shift toward increased domestic borrowing to reduce exposure to external shocks, complemented by diversified external financing. Key features include active liability management through bond switches, buybacks, and innovative debt instruments aimed at smoothing maturities and lowering costs, all within the broader goal of fiscal consolidation and debt sustainability;
During the week, The Energy and Petroleum Regulatory Authority (EPRA) released their monthly statement on the maximum retail fuel prices in Kenya, effective from 15th September 2025 to 14th October 2025. Notably, the maximum allowed price for Super Petrol, Diesel and Kerosene decreased by Kshs 0.8, Kshs 0.1 and Kshs 0.8 per litre respectively. Consequently, Super Petrol, Diesel and Kerosene will now retail at Kshs 184.5, Kshs 171.5 and Kshs 154.8 per litre respectively, from Kshs 185.3, Kshs 171.6 and Kshs 155.6 per litre respectively, representing decreases of 0.4%, 0.1% and 0.5% for Super Petrol, Diesel and Kerosene respectively
Equities
During the week, the equities market was on an upward trajectory, with NSE 20 gaining the most by 1.7%, while NSE 25, NSE 10 and NASI gained by 1.6%, 1.0% and 0.2% respectively, taking the YTD performance to gains of 46.6%, 42.6%, 33.8% and 33.8% for NSE 20, NASI, NSE 10 and NSE 25 respectively. The equities market performance was driven by gains recorded by large-cap stocks such as ABSA, NCBA and KCB of 11.1%, 9.8% and 3.9% respectively. The performance was, however, weighed down by losses recorded by large cap stocks such as SCBK, Equity and Co-Operative Bank of 6.3%, 2.3% and 2.0% respectively;
Additionally, in the regional equities market, the East African Exchanges 20 (EAE 20) share index lost by 87.0 bps to 99.05 from 99.95 recorded the previous week, attributable to losses recorded by large cap stocks such as CRDB Bank, Equity Group Holdings and KCB Group Plc of 5.7%, 2.2% and 1.9% respectively. The performance was, however, supported by gains recorded by large cap stocks such as The Co-Operative Bank of Kenya, ABSA Bank Kenya and Stanbic Uganda of 22.1%, 11.9% and 7.5% respectively;
Real Estate
During the week, Hounen, a global real estate developer and solar energy manufacturer, joined the Tatu City Special Economic Zone (SEZ) with plans for a major mixed-use project. The company is investing in solar product manufacturing alongside its real estate initiatives. Their development will span 43,500 square meters within Tatu City’s living and business district. The project will include a blend of office, retail, commercial, and residential spaces. As part of the plan, four high-rise towers ranging from 21 to 26 storeys will be constructed;
On the Unquoted Securities Platform, Acorn D-REIT and I-REIT traded at Kshs 27.4 and Kshs 23.2 per unit, respectively, as per the last updated data on 5th September 2025. The performance represented a 37.0% and 16.0% gain for the D-REIT and I-REIT, respectively, from the Kshs 20.0 inception price. Additionally, ILAM Fahari I-REIT traded at Kshs 11.0 per share as of 5th September 2025, representing a 45.0% loss from the Kshs 20.0 inception price;
Focus of the Week
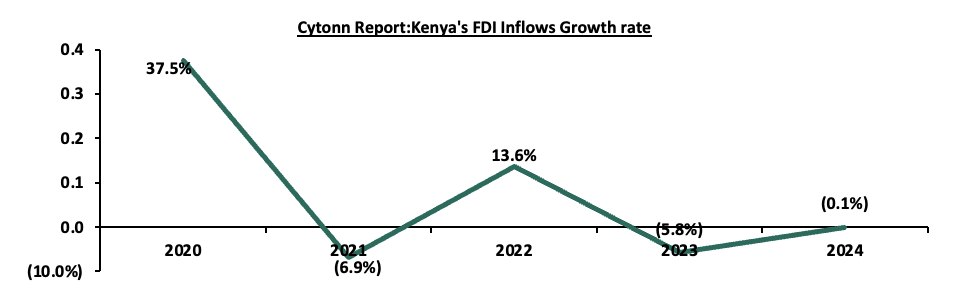
In an increasingly interconnected global economy, Foreign Direct Investments (FDIs) serve as a pivotal conduit for economic growth, innovation, and integration, and have emerged as a key indicator of a country’s economic attractiveness and competitiveness. According to the United Nations Conference on Trade and Development (UNCTAD) World Investments Report 2025, global Foreign Direct Investments (FDIs) inflows increased marginally by 3.7% in 2024 to USD 1.45 tn, from USD 1.51 tn in 2023. . However, the growth was magnified by volatility in European economies that act as investments conduits. As such the global FDIs inflows declined by 12.1% to USD 1.5 tn in 2024 , from USD 1.7 tn in 2023 marking the second consecutive year a double-digit contraction has been recorded when volatile financial flow are excluded. The slowdown was mainly on the back of the Ukrainian war, high food and energy prices, as well as debt pressures due to uncertainty about exchange and interest rates levels. On the contrary, Foreign Direct Investment (FDI) inflows in Kenya recorded a marginal decline, having declined by 0.1% to estimate of USD 1,503.0 mn in 2024 from USD 1,504.0 mn in 2023.
Investment Updates:
- Weekly Rates:
- Cytonn Money Market Fund closed the week at a yield of 13.0% p.a. To invest, dial *809# or download the Cytonn App from Google Play store here or from the Appstore here;
- We continue to offer Wealth Management Training every Tuesday, from 7:00 pm to 8:00 pm. The training aims to grow financial literacy among the general public. To register for any of our Wealth Management Trainings, click here;
- If interested in our Private Wealth Management Training for your employees or investment group, please get in touch with us through wmt@cytonn.com;
- Cytonn Insurance Agency acts as an intermediary for those looking to secure their assets and loved ones’ future through insurance namely; Motor, Medical, Life, Property, WIBA, Credit and Fire and Burglary insurance covers. For assistance, get in touch with us through insuranceagency@cytonn.com;
- Cytonn Asset Managers Limited (CAML) continues to offer pension products to meet the needs of both individual clients who want to save for their retirement during their working years and Institutional clients that want to contribute on behalf of their employees to help them build their retirement pot. To more about our pension schemes, kindly get in touch with us through pensions@cytonn.com;
Hospitality Updates:
- We currently have promotions for Staycations. Visit cysuites.com/offers for details or email us at sales@cysuites.com;
Money Markets, T-Bills Primary Auction:
This week, T-bills were oversubscribed for the fourth consecutive week, with the overall subscription rate coming in at 161.5%, higher than the subscription rate of 141.2% recorded the previous week. Investors’ preference for the shorter 91-day paper persisted, with the paper receiving bids worth Kshs 15.4 bn against the offered Kshs 4.0 bn, translating to a subscription rate of 385.2%, higher than the subscription rate of 146.7%, recorded the previous week. The subscription rates for the 182-day paper decreased to 31.3% from the 49.1% recorded the previous week, while that of the 364-day paper decreased to 202.3% from the 231.0% recorded the previous week. The government accepted a total of Kshs 28.9 bn worth of bids out of Kshs 38.7 bn bids received, translating to an acceptance rate of 74.6%.The yields on the government papers were on a downward trajectory with the yields on the 364-day paper decreasing the most by 3.1 bps to 9.55% from the 9.58% recorded the previous week while the yields on the 91-day and 182-day papers decreased by 1.5 bps and 1.4 bps to 7.97% and 8.02% respectively, from the 7.99% and 8.03% respectively recorded the previous week.
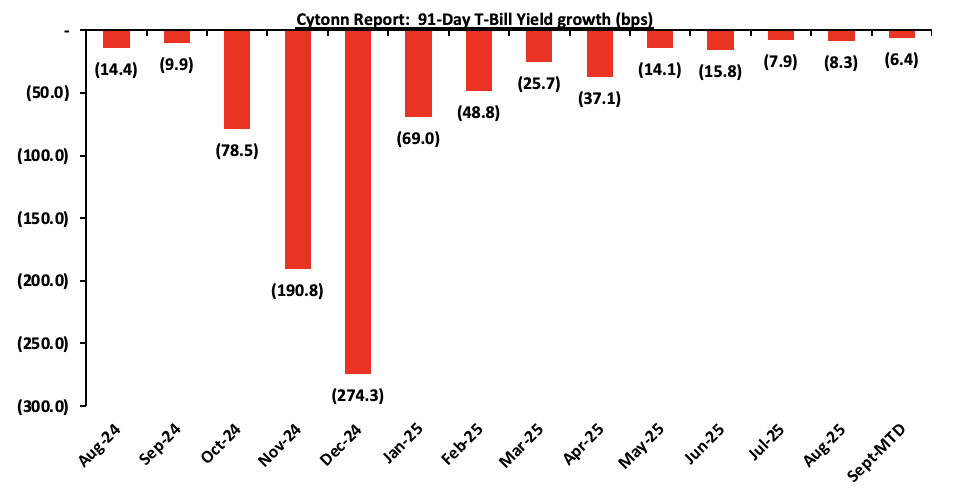
The chart below shows the yield growth rate for the 91-day paper in the year to August 2025 and month-to-date:
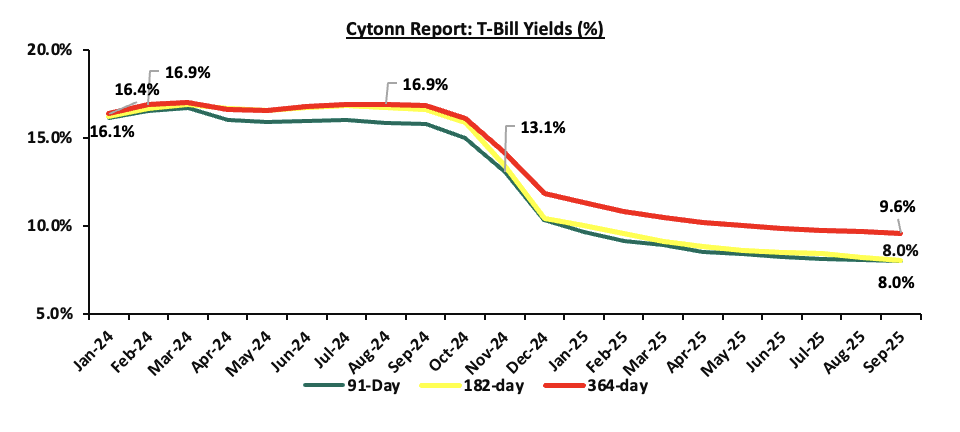
The charts below show the performance of the 91-day, 182-day and 364-day papers from January 2024 to September 2025:
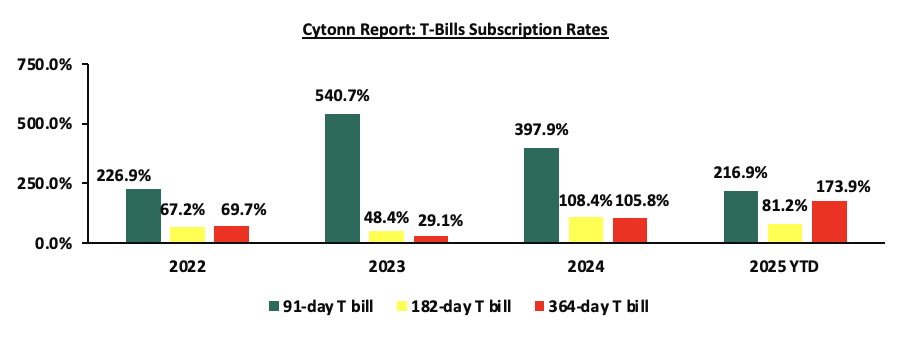
The chart below compares the overall average T-bill subscription rates obtained in 2022,2023, 2024 and 2025 Year-to-date (YTD):
Money Market Performance:
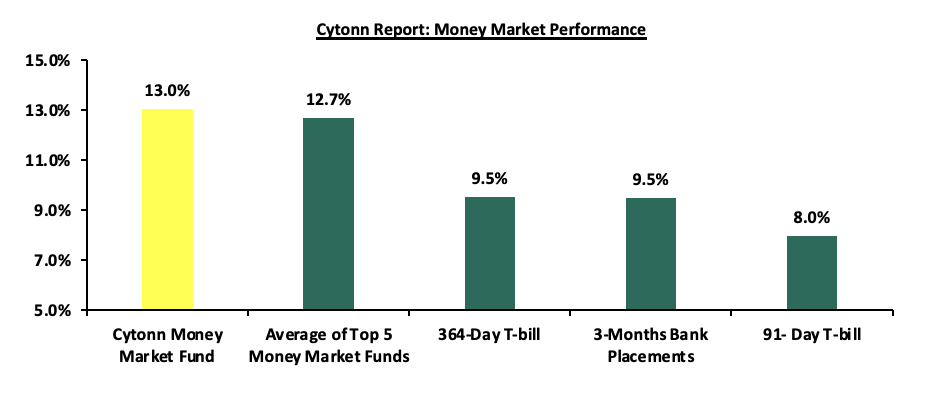
In the money markets, 3-month bank placements ended the week at 9.5% (based on what we have been offered by various banks), The yield on the 91-day paper decreased by 1.5 bps to 7.97% , from the 7.99% recorded the previous week while the yield on the 364-day paper decreased by 3.1 bps to 9.55% from the 9.58% recorded the previous week. The yield on the Cytonn Money Market Fund decreased by 7.0 bps to 13.0% to 13.1% recorded in the previous week, while the average yields on the Top 5 Money Market Funds decreased by 24.0 bps to 12.7% from 12.9 recorded the previous week.
The table below shows the Money Market Fund Yields for Kenyan Fund Managers as published on 12th September 2025
|
Money Market Fund Yield for Fund Managers as published on 12th September 2025 |
||
|
Rank |
Fund Manager |
Effective Annual Rate |
|
1 |
Ndovu Money Market Fund |
13.1% |
|
2 |
Cytonn Money Market Fund ( Dial *809# or download Cytonn App) |
13.0% |
|
3 |
Nabo Africa Money Market Fund |
12.7% |
|
4 |
Lofty-Corban Money Market Fund |
12.3% |
|
5 |
Arvocap Money Market Fund |
12.3% |
|
6 |
Etica Money Market Fund |
12.0% |
|
7 |
Orient Kasha Money Market Fund |
12.0% |
|
8 |
Kuza Money Market fund |
11.6% |
|
9 |
Enwealth Money Market Fund |
11.1% |
|
10 |
GenAfrica Money Market Fund |
11.0% |
|
11 |
Madison Money Market Fund |
10.9% |
|
12 |
Gulfcap Money Market Fund |
10.9% |
|
13 |
British-American Money Market Fund |
10.9% |
|
14 |
Old Mutual Money Market Fund |
10.8% |
|
15 |
Jubilee Money Market Fund |
10.6% |
|
16 |
Apollo Money Market Fund |
10.1% |
|
17 |
Dry Associates Money Market Fund |
9.9% |
|
18 |
Faulu Money Market Fund |
9.9% |
|
19 |
Sanlam Money Market Fund |
9.6% |
|
20 |
Mali Money Market Fund |
9.4% |
|
21 |
KCB Money Market Fund |
9.3% |
|
22 |
Absa Shilling Money Market Fund |
9.2% |
|
23 |
ICEA Lion Money Market Fund |
9.1% |
|
24 |
Co-op Money Market Fund |
9.1% |
|
25 |
CPF Money Market Fund |
9.1% |
|
26 |
Genghis Money Market Fund |
9.0% |
|
27 |
CIC Money Market Fund |
8.5% |
|
28 |
Mayfair Money Market Fund |
8.5% |
|
29 |
AA Kenya Shillings Fund |
7.5% |
|
30 |
Ziidi Money Market Fund |
6.9% |
|
31 |
Stanbic Money Market Fund |
6.7% |
|
32 |
Equity Money Market Fund |
5.2% |
Source: Business Daily
Liquidity:
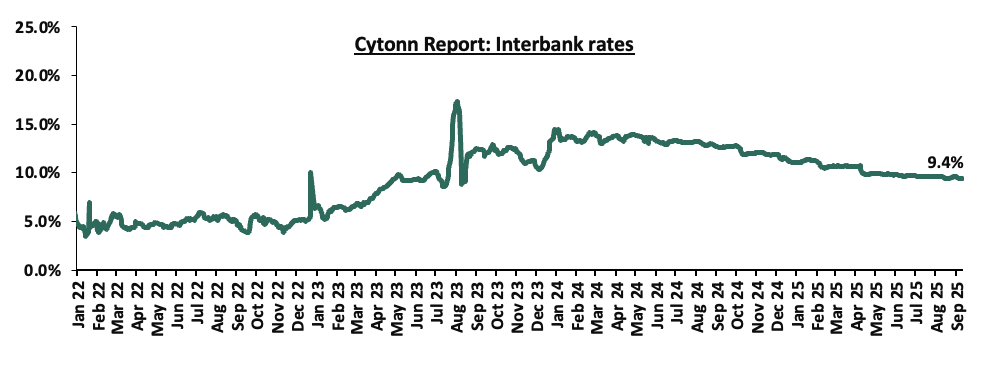
During the week, liquidity in the money markets marginally eased, with the average interbank rate decreasing by 7.7 bps, to 9.46% from the 9.53% recorded the previous week, partly attributable to tax remittances that were offset by government payments. The average interbank volumes traded increased significantly by 55.0% to Kshs 12.7 bn from Kshs 8.2 bn recorded the previous week.
The chart below shows the interbank rates in the market over the years:
Kenya Eurobonds:
During the week, the yields on Kenya’s Eurobonds were on a downward trajectory with the yields on the 13-year Eurobond issued in 2021 decreasing the most by 67.9 bps to 8.4% from 9.1% recorded the previous week. The table below shows the summary performance of the Kenyan Eurobonds as of 11th September 2025;
|
Cytonn Report: Kenya Eurobond Performance |
|||||||
|
|
2018 |
2019 |
2021 |
2024 |
2025 |
||
|
Tenor |
10-year issue |
30-year issue |
7-year issue |
12-year issue |
13-year issue |
7-year issue |
11-year issue |
|
Amount Issued (USD) |
1.0 bn |
1.0 bn |
0.9 bn |
1.2 bn |
1.0 bn |
1.5 bn |
1.5 bn |
|
Years to Maturity |
2.5 |
22.5 |
1.7 |
6.7 |
8.8 |
5.5 |
10.5 |
|
Yields at Issue |
7.3% |
8.3% |
7.0% |
7.9% |
6.2% |
10.4% |
9.9% |
|
2-Jan-25 |
9.1% |
10.3% |
8.5% |
10.1% |
10.1% |
10.1% |
|
|
1-Sep-25 |
6.8% |
9.8% |
- |
8.7% |
9.2% |
8.4% |
|
|
4-Sep-25 |
6.6% |
9.7% |
- |
8.6% |
9.1% |
8.3% |
|
|
5-Sep-25 |
6.6% |
9.6% |
- |
8.5% |
8.9% |
8.2% |
|
|
8-Sep-25 |
6.4% |
9.5% |
- |
8.3% |
8.8% |
8.1% |
|
|
9-Sep-25 |
6.3% |
9.5% |
- |
8.3% |
8.7% |
8.1% |
|
|
10-Sep-25 |
6.2% |
9.3% |
- |
8.1% |
8.5% |
7.9% |
10.0% |
|
11-Sep-25 |
6.0% |
9.2% |
- |
8.0% |
8.4% |
7.7% |
|
|
Weekly Change |
(0.7%) |
(0.5%) |
- |
(0.6%) |
(0.7%) |
(0.6%) |
- |
|
MTD Change |
(0.8%) |
(0.6%) |
- |
(0.7%) |
(0.8%) |
(0.6%) |
0.0% |
|
YTD Change |
(3.1%) |
(1.0%) |
- |
(2.1%) |
(1.7%) |
(2.4%) |
0.0% |
Source: Central Bank of Kenya (CBK) and National Treasury
Kenya Shilling:
During the week, the Kenya Shilling depreciated marginally against the US Dollar by 0.04 bps, to remain relatively unchanged from the Kshs.129.2 recorded previous week. On a year-to-date basis, the shilling has appreciated by 0.1 % against the dollar, compared to the 17.6% appreciation recorded in 2024.
We expect the shilling to be supported by:
- Diaspora remittances standing at a cumulative USD 5,079.9 mn in the twelve months to July 2025, 11.1% higher than the USD 4,571.7 mn recorded over the same period in 2024. These has continued to cushion the shilling against further depreciation. In the July 2025 diaspora remittances figures, North America remained the largest source of remittances to Kenya accounting for 58.8% in the period,
- The tourism inflow receipts which came in at Kshs 452.2 bn in 2024, a 19.8% increase from Kshs 377.5 bn inflow receipts recorded in 2023, and owing to tourist arrivals that improved by 8.0% to 2,303,028 in the 12 months to February 2025 from 2,133,612 in the 12 months to February 2024, and,
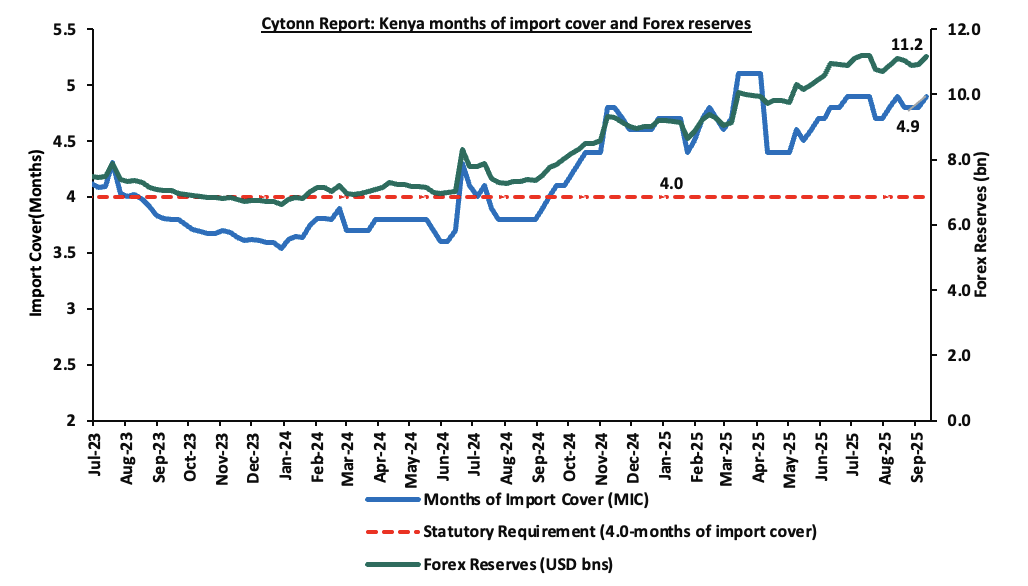
- Improved forex reserves currently at USD 11.2 bn (equivalent to 4.9-months of import cover), which is above the statutory requirement of maintaining at least 4.0-months of import cover and above the EAC region’s convergence criteria of 4.5-months of import cover.
The shilling is however expected to remain under pressure in 2025 as a result of:
- An ever-present current account deficit which came at 1.6% of GDP in the twelve months to June 2025, and,
- The need for government debt servicing, continues to put pressure on forex reserves given that 61.4% of Kenya’s external debt is US Dollar-denominated as of March 2025.
Key to note, Kenya’s forex reserves increased by 2.5% during the week, to USD 11.2 bn from the USD 10.9 bn recorded in the previous week, equivalent to 4.9 months of import cover, and above the statutory requirement of maintaining at least 4.0-months of import cover and above the EAC region’s convergence criteria of 4.5-months of import cover.
The chart below summarizes the evolution of Kenya's months of import cover over the years:
Weekly Highlights
- Kenya’s Annual Borrowing Plan (ABP) for FY’2025/26
During the week the National Treasury of Kenya unveiled the Annual Borrowing Plan (ABP) for FY’2025/26, outlining how the government intends to finance its fiscal deficit, refinance maturing debt, and maintain debt sustainability in alignment with the 2025 Medium-Term Debt Management Strategy (MTDS). This plan is central to the country’s broader fiscal consolidation agenda, which aims to reduce the budget deficit, curb the pace of debt accumulation, and free up fiscal space for key investments under the Fourth Medium-Term Plan (MTP IV) and the Bottom-Up Economic Transformation Agenda (BETA).
The ABP is anchored on optimistic macroeconomic assumptions, including real GDP growth of 5.3%, up from 5.0% in FY’2024/25, supported by agricultural recovery and private sector growth. Inflation is expected to rise slightly to 5.0%, and revenue collection is projected to grow by 13.6% to Kshs 3.3 tn, buoyed by intensified tax efforts. While total expenditure is projected at Kshs 4.3 trillion, the fiscal deficit is expected to narrow to 4.7% of GDP, down from 5.8% in the previous year, with the primary balance swinging to a surplus for the first time in recent years. The following table summarizes the gross financing requirements for FY’2025/26.
|
Cytonn Report: Gross Financing Requirements for FY’2025/2026 |
||
|
|
FY’2025/2026 (Kshs Tn) |
As % of GDP |
|
Total Revenue (Inclusive of Grants) |
3.4 |
17.5% |
|
Primary Expenditure |
3.2 |
16.5% |
|
Primary Balance |
0.2 |
1.0% |
|
Interest Payments |
||
|
Domestic |
0.9 |
4.4% |
|
External |
0.2 |
1.3% |
|
Total Interest Payments |
1.1 |
5.7% |
|
Net Financing Requirements |
0.9 |
4.7% |
|
Principal Payments |
||
|
Domestic* |
0.3 |
1.6% |
|
External |
0.3 |
1.8% |
|
Total Principal Payments |
0.6 |
3.4% |
|
Gross Financing Needs |
1.5 |
8.0% |
Source: National Treasury, *Excludes treasury bill redemptions but includes IMF on-lent loans and pre-1997 government overdraft
The FY’2025/26 Annual Borrowing Plan represents a balancing act between fiscal consolidation and the need to finance critical development projects. With gross borrowing rising sharply to Kshs 1.5 tn from Kshs 1.0 tn in FY’2024/25, the challenge will lie in maintaining debt sustainability amid revenue shortfalls and heightened refinancing needs. The strategic shift towards domestic financing, complemented by innovative liability management operations and concessional external borrowing, reflects the Government’s commitment to prudent debt management. Ultimately, the success of the plan will hinge on the Government’s ability to sustain revenue mobilization, manage exchange rate volatility, and maintain investor confidence both domestically and externally.
For a more detailed analysis, please see our Kenya’s Annual Borrowing Plan (ABP) for FY’2025/26 Note
- Fuel Highlight, September 15th- October 14th 2025
During the week, The Energy and Petroleum Regulatory Authority (EPRA) released their monthly statement on the maximum retail fuel prices in Kenya, effective from 15th September 2025 to 14th October 2025. Notably, the maximum allowed price for Super Petrol, Diesel and Kerosene decreased by Kshs 0.8, Kshs 0.1 and Kshs 0.8 per litre respectively. Consequently, Super Petrol, Diesel and Kerosene will now retail at Kshs 184.5, Kshs 171.5 and Kshs 154.8 per litre respectively, from Kshs 185.3, Kshs 171.6 and Kshs 155.6 per litre respectively, representing decreases of 0.4%, 0.1% and 0.5% for Super Petrol, Diesel and Kerosene respectively.
Other key take-outs from the performance include;
- The average landing costs per cubic meter for Super Petrol, Diesel and Kerosene decreased by 0.5%, 3.3% and 2.9% to USD 620.8, USD 614.1 and USD 609.6 respectively from the USD 623.7, USD 635.6 and USD 628.0 respectively recorded in July 2025.
- The Kenyan Shilling remained stable against the US Dollar, depreciating slightly by 3.1 bps to remain relatively unchanged from the Kshs 129.6 recorded in July 2025.
We note that fuel prices in the country have stabilized in recent months largely due to the government's efforts to stabilize pump prices through the petroleum pump price stabilization mechanism which expended Kshs 9.9 bn in the FY’2023/24 to cushion the increases applied to the petroleum pump prices, coupled with the stabilization of the Kenyan Shilling against the dollar and other major currencies, as well as a decrease in international fuel prices. Additionally, the government has reduced spending through the price stabilization mechanism, subsidizing Kshs 1.4 per litre for Kerosene, resulting in stabilization in fuel prices for the period under review. Going forward, we expect that fuel prices will stabilize in the coming months as a result of the government's efforts to mitigate the cost of petroleum through the pump price stabilization mechanism and a stable exchange rate. As such, we expect the business environment in the country to improve as fuel is a major input cost, as well as continued stability in inflationary pressures, with the inflation rate expected to remain within the CBK’s preferred target range of 2.5%-7.5% in the short to medium-term.
Rates in the Fixed Income market have been on a downward trend due to high liquidity in the money market which allowed the government to front load most of its borrowing. The government is 163.2% ahead of its prorated net domestic borrowing target of Kshs 132.5, having a net borrowing position of Kshs 348.8 bn (inclusive of T-bills). However, we expect a stabilization of the yield curve in the short and medium term, with the government looking to increase its external borrowing to maintain the fiscal surplus, hence alleviating pressure in the domestic market. As such, we expect the yield curve to stabilize in the short to medium-term and hence investors are expected to shift towards the long-term papers to lock in the high returns
Market Performance:
During the week, the equities market was on an upward trajectory, with NSE 20 gaining the most by 1.7%, while NSE 25, NSE 10 and NASI gained by 1.6%, 1.0% and 0.2% respectively, taking the YTD performance to gains of 46.6%, 42.6%, 33.8% and 33.8% for NSE 20, NASI, NSE 10 and NSE 25 respectively. The equities market performance was driven by gains recorded by large-cap stocks such as ABSA, NCBA and KCB of 11.1%, 9.8% and 3.9% respectively. The performance was, however, weighed down by losses recorded by large cap stocks such as SCBK, Equity and Co-Operative Bank of 6.3%, 2.3% and 2.0% respectively.
Additionally, in the regional equities market, the East African Exchanges 20 (EAE 20) share index lost by 87.0 bps to 99.05 from 99.95 recorded the previous week, attributable to losses recorded by large cap stocks such as CRDB Bank, Equity Group Holdings and KCB Group Plc of 5.7%, 2.2% and 1.9% respectively. The performance was, however, supported by gains recorded by large cap stocks such as The Co-Operative Bank of Kenya, ABSA Bank Kenya and Stanbic Uganda of 22.1%, 11.9% and 7.5% respectively.
During the week, equities turnover decreased by 36.5% to USD 35.2 mn, from USD 55.3 mn recorded the previous week, taking the YTD total turnover to USD 694.6mn. Foreign investors remained net sellers for the second consecutive week, with a net selling position of USD 4.1 mn, from a net selling position of USD 9.1 mn recorded the previous week, taking the YTD foreign net selling position to USD 32.0 mn, compared to a net selling position of USD 16.9 mn in 2024.
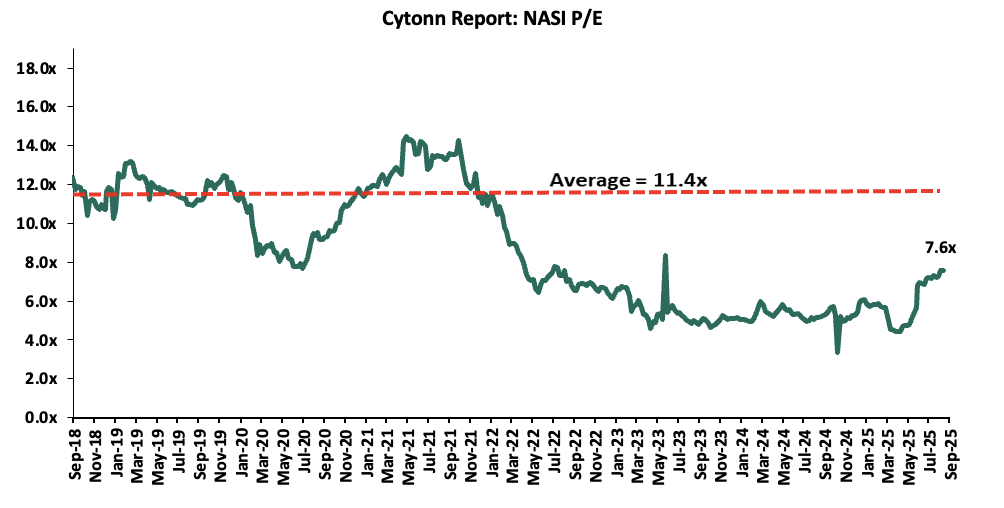
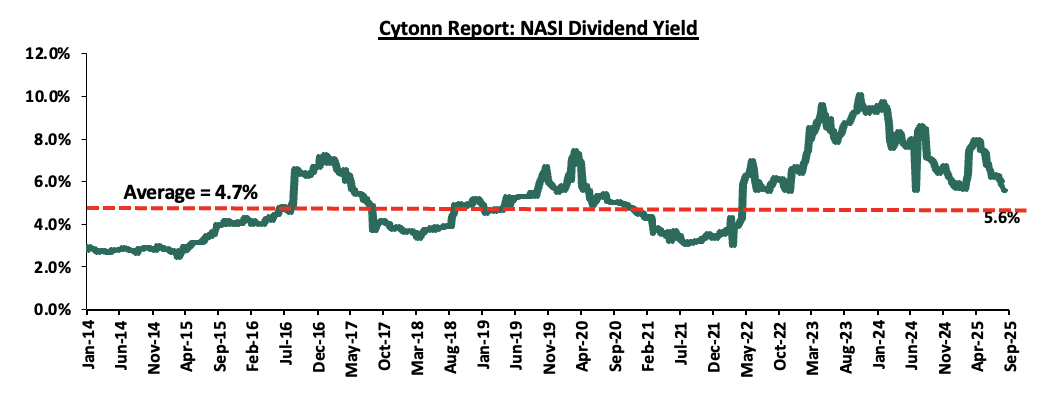
The market is currently trading at a price-to-earnings ratio (P/E) of 7.6x, 33.4% below the historical average of 11.4x. The dividend yield stands at 5.6%, 0.9% points above the historical average of 4.7%. Key to note, NASI’s PEG ratio currently stands at 1.0x, an indication that the market is fairly valued relative to its future growth. A PEG ratio greater than 1.0x indicates the market is overvalued while a PEG ratio less than 1.0x indicates that the market is undervalued. The charts below indicate the historical P/E and dividend yields of the market;
Universe of Coverage:
|
Cytonn Report: Equities Universe of Coverage |
|||||||||||
|
Company |
Price as at 05/09/2025 |
Price as at 12/09/2025 |
w/w change |
YTD Change |
Year Open 2025 |
Target Price* |
Dividend Yield |
Upside/ Downside** |
P/TBv Multiple |
Recommendation |
|
|
Standard Chartered Bank |
325.0 |
304.5 |
(6.3%) |
6.7% |
285.3 |
393.4 |
14.8% |
44.0% |
1.7x |
Buy |
|
|
ABSA Bank |
55.5 |
54.3 |
(2.3%) |
13.0% |
48.0 |
61.7 |
7.8% |
21.6% |
0.9x |
Buy |
|
|
Equity Group |
180.3 |
180.3 |
0.0% |
29.0% |
139.8 |
193.4 |
11.5% |
18.8% |
1.1x |
Accumulate |
|
|
Stanbic Holdings |
20.3 |
19.9 |
(2.0%) |
14.0% |
17.5 |
21.6 |
7.5% |
16.0% |
0.7x |
Accumulate |
|
|
NCBA |
51.0 |
53.0 |
3.9% |
25.0% |
42.4 |
56.1 |
5.7% |
11.5% |
0.7x |
Accumulate |
|
|
KCB Group |
104.0 |
105.3 |
1.2% |
57.7% |
66.8 |
108.9 |
6.7% |
10.1% |
0.4x |
Accumulate |
|
|
Co-op Bank |
20.8 |
23.1 |
11.1% |
22.3% |
18.9 |
23.5 |
7.6% |
9.5% |
1.5x |
Hold |
|
|
Diamond Trust Bank |
66.0 |
72.5 |
9.8% |
42.2% |
51.0 |
72.3 |
7.6% |
7.3% |
1.2x |
Hold |
|
|
I&M Group |
8.9 |
8.9 |
0.2% |
52.6% |
5.8 |
9.5 |
0.0% |
7.2% |
0.8x |
Hold |
|
|
Britam |
305.3 |
310.8 |
1.8% |
77.8% |
174.8 |
312.9 |
4.3% |
5.0% |
0.5x |
Hold |
|
|
Jubilee Holdings |
40.2 |
43.8 |
9.0% |
21.5% |
36.0 |
41.2 |
6.9% |
1.0% |
0.8x |
Lighten |
|
|
CIC Group |
5.3 |
5.4 |
1.9% |
152.3% |
2.1 |
4.0 |
2.4% |
(23.0%) |
1.5x |
Sell |
|
|
*Target Price as per Cytonn Analyst estimates **Upside/ (Downside) is adjusted for Dividend Yield ***Dividend Yield is calculated using FY’2024 Dividends |
|||||||||||
We are “Bullish” on the Equities markets in the short term due to current cheap valuations, lower yields on short-term government papers and expected global and local economic recovery, and, “Neutral” in the long term due to persistent foreign investor outflows. With the market currently trading at par with its future growth (PEG Ratio at 1.0x), we believe that investors should reposition towards value stocks with strong earnings growth and that are trading at discounts to their intrinsic value. We expect the current high foreign investors sell-offs to continue weighing down the economic outlook in the short term.
- Commercial office Sector
- UN to spend Kshs 43.0 bn in renovation and construction of offices
During the week, the United Nations highlighted that they will be spending Kshs 43.0 bn on renovation and construction of conference facilities and office blocks in Gigiri. In July, UN revealed that three major UN agencies, including the UN Children’s Fund (UNICEF), the UN Population Fund and UN Women are in the process of moving their headquarters from expensive western cities to Nairobi.
The United Nations Office in Nairobi (UNON) Director General Mrs. Zainab Bangura said the move is meant to build capacity for the complex to be able to host more UN agency offices, events and activities in the future. The work on the office side will involve renovation of existing blocks and construction of new ones to bring to 25 blocks from the current 11 blocks. On the conference side, a new assembly hall with 1,600 capacity will be constructed, increasing its ability to host meetings to 9,000 participants from the current 2,000 participants.
This will positively impact the commercial office sector in Kenya by increased demand for premium office space. Gigiri is already one of Nairobi’s prime international agency clusters. With new UN-offices and conference facilities being renovated and built, demand for modern, high-quality office space in this area will increase. This could push up occupancy rates and rents in nearby high-end office buildings, (ii) Increased international confidence. A big, visible investment by the UN adds to Kenya’s credibility as a location for international organizations. This may attract other intergovernmental and non-profit agencies to locate offices there, or multinational firms that serve such clients. That could raise demand for office space tailored to diplomatic or high-security needs, (iii) increased employment and skills development. Projects of this magnitude require skilled construction labor, planners, designers, managers. That can help spur skills development in the built environment sector.
The UN’s Kshs 43.0 bn investment in new and renovated offices at Gigiri is set to reshape Kenya’s commercial office landscape. By elevating construction standards and attracting greater international presence, the project will stimulate demand for premium space, raise property values, and enhance Nairobi’s position as a hub for global institutions.
- Real Estate Investments Trusts (REITs)
On the Unquoted Securities Platform, Acorn D-REIT and I-REIT traded at Kshs 27.4 and Kshs 23.2 per unit, respectively, as per the last updated data on 12th September 2025. The performance represented a 37.0% and 16.0% gain for the D-REIT and I-REIT, respectively, from the Kshs 20.0 inception price. Additionally, ILAM Fahari I-REIT traded at Kshs 11.0 per share as of 12th September 2025, representing a 45.0% loss from the Kshs 20.0 inception price. The volumes traded for the D-REIT and I-REIT came in at Kshs 12.8 mn and Kshs 39.8 mn shares, respectively, with a turnover of Kshs 323.5 mn and Kshs 791.5 mn, respectively, since inception in February 2021. Additionally, ILAM Fahari I-REIT traded at Kshs 11.0 per share as of 12th September 2025, representing a 45.0% loss from the Kshs 20.0 inception price. The volume traded to date came in at 1,235,285 shares for the I-REIT, with a turnover of Kshs 1.5 mn since inception in November 2015.
REITs offer various benefits, such as tax exemptions, diversified portfolios, and stable long-term profits. However, the ongoing decline in the performance of Kenyan REITs and the restructuring of their business portfolios are hindering significant previous investments. Additional general challenges include:
- Insufficient understanding of the investment instrument among investors leading to a slower uptake of REIT products,
- Lengthy approval processes for REIT creation,
- High minimum capital requirements of Kshs 100.0 mn for REIT trustees compared to Kshs 10.0 mn for pension funds Trustees, essentially limiting the licensed REIT Trustee to banks only
- The rigidity of choice between either a D-REIT or and I-REIT forces managers to form two REITs, rather than having one Hybrid REIT that can allocate between development and income earning properties
- Limiting the type of legal entity that can form a REIT to only a trust company, as opposed to allowing other entities such as partnerships, and companies,
- We need to give time before REITS are required to list – they would be allowed to stay private for a few years before the requirement to list given that not all companies may be comfortable with listing on day one, and,
- Minimum subscription amounts or offer parcels set at Kshs 0.1 mn for D-REITs and Kshs 5.0 mn for restricted I-REITs. The significant capital requirements still make REITs relatively inaccessible to smaller retail investors compared to other investment vehicles like unit trusts or government bonds, all of which continue to limit the performance of Kenyan REITs.
We expect Kenya’s Real Estate sector to remain resilient, supported by: i) Proposed Kshs 43.0 bn by the United Nations to construct and renovate their offices and conference facilities. However, challenges including high capital requirements and regulatory constraints for REITs, rising construction costs, strain on infrastructure, and oversupply in select market segments will continue to limit optimal performance by constraining development pipelines and deterring some investor participation.
Foreign Direct Investments (FDIs) refer to investments made by a firm or individual in one country into business interests located in another country. Generally, FDI takes place when an investor establishes foreign business operations or acquires foreign business assets, including establishing ownership or controlling interest in a foreign company. FDIs are crucial for economic growth as they not only bring investment capital but also facilitate technology transfer, management skills, and international trade integration, which can lead to higher productivity, employment, and economic stability in the host country.
Kenya’s FDI inflows decreased by marginally 0.1% to USD 1,503.0 mn in 2024 from USD 1,504.0 mn in 2023 and the country has been experiencing dwindling FDIs amongst her peers, hence our interest into delving in this topical. We shall do an in-depth analysis of the historical trend of FDIs in the country, compare it to other developed and peer economies, as well as give actionable initiatives to improve FDIs into the country. We shall cover the following:
- Overview of Foreign Direct Investments in Kenya,
- Economic Benefits of FDIs and Challenges to FDI Growth in Kenya,
- Recommendations, and,
- Conclusion and our Outlook.
Section I: Overview of Foreign Direct Investments in Kenya
According to the United Nations Conference on Trade and Development (UNCTAD) World Investments Report 2025, global Foreign Direct Investments (FDIs) inflows increased marginally by 3.7% in 2024 to USD 1.45 tn, from USD 1.51 tn in 2023. However, the growth was magnified by volatility in European economies that act as investments conduits. As such the global FDIs inflows declined by 12.1% to USD 1.5 tn in 2024 , from USD 1.7 tn in 2023 marking the second consecutive year a double-digit contraction has been recorded when volatile financial flow are excluded. The slowdown was mainly on the back of the Ukrainian war, high food and energy prices, as well as debt pressures due to uncertainty about exchange and interest rates levels. On the contrary, Foreign Direct Investment (FDI) inflows in Kenya recorded a marginal decline, having declined by 0.1% to estimate of USD 1,503.0 mn in 2024 from USD 1,504.0 mn in 2023. The chart below shows Kenya’s FDI inflows growth rate from 2018 to 2024:
Source: UNCTAD
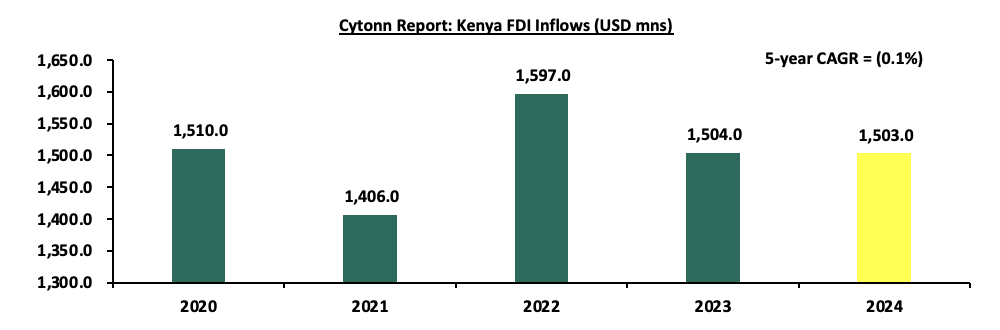
The slight improvement on the decline registered year-on-year was mainly attributable to a range of policy interventions to mobilize resources and investments within the renewable energy sector. FDIs into the country have decreased over the years, recording a 5-year CAGR of (0.1%) to USD 1,503.0 mn in 2024, from USD 1,510.0 mn in 2020. The chart below shows the movement in Kenya’s FDI inflows over the years;
Source: UNCTAD
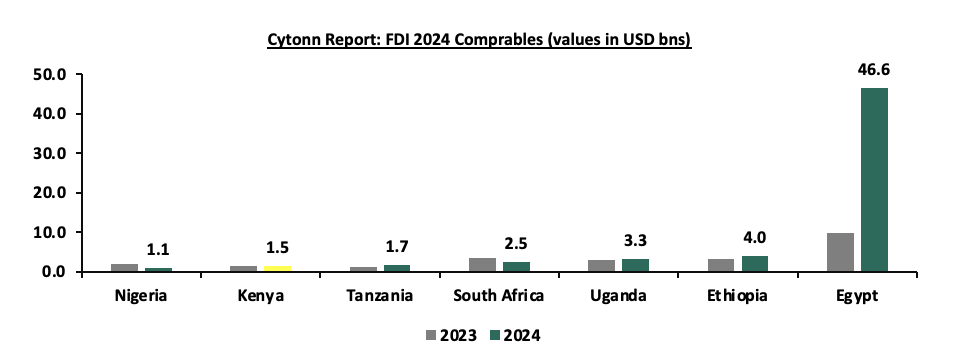
Kenya still lags behind its peers in terms of its ability to attract foreign investors to the country due to factors such as high taxation and high levels of corruption. The East African region recorded 12.1% increase in FDI inflows to USD 12.7 bn, from USD 11.3 bn in 2023 with Ethiopia accounting for the largest share of the region's FDIs with its inflows increasing by 21.9% to USD 4.0 bn in 2024 from USD 3.3 bn recorded in 2023, while Tanzania recorded the highest growth rate of 28.3% to USD 1.7 bn up from USD 1.3 bn in 2023. Notably, Nigeria’s FDI inflows experienced a 42.3% decrease to USD 1.1 bn from USD 1.9 bn in 2023, attributable to the equity divestments experienced mainly in stock markets. The chart below shows a comparison of FDI in 2023 and 2024 in select economies:
Source: UNCTAD-World Development Report 2025
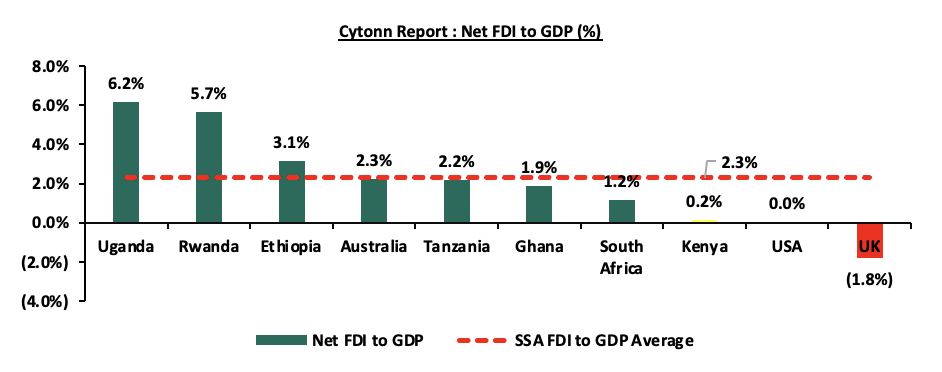
Notably, the sharp rise in Egypt’s FDI was driven by the Ras El-Hekma urban development project. The initiative includes building a hospital, hotels, schools, universities, residential areas, tourist resorts, public service infrastructure, and entertainment facilities in Ras El-Hekma City. The project, sponsored by Abu Dhabi Developmental Holding in partnership with the Egyptian government, is valued at an estimated USD 35.0 bn. Additionally, Kenya’s FDI to GDP ratio stood at 0.2% as of 2024 which is below the SSA region average of 2.3% and above global average of (0.1%) for the same period. Additionally, compared to peer and other developed economies, Kenya’s FDI to GDP remains low. The chart below compares to Kenya’s FDI to GDP ratio to peer and advanced economies;
Source: World Bank, UNCTAD, data as of 2024
Sources of Foreign Direct Investments
According to the Kenya National Bureau of Statistics (KNBS) Foreign Investment Survey 2024, Europe accounted for the largest source of investment to Kenya, accounting for 35.0% of Foreign Liabilities in 2023 up from 32.9% in 2022,attributable to 2.6% points increase in the stock of Foreign liabilities in United Kingdom to Kshs 380.0 bn in 2023 from Kshs 309.0 bn in 2022. Africa came in second at 26.4% in 2023 down from 26.6% in 2022 attributable to the 0.9% points decline in Foreign Liabilities in Mauritius to Kshs 144.7 bn in 2023 from Kshs 161.2 bn in 2022 . The graph below outlines the percentage of Foreign Liabilities from select countries;
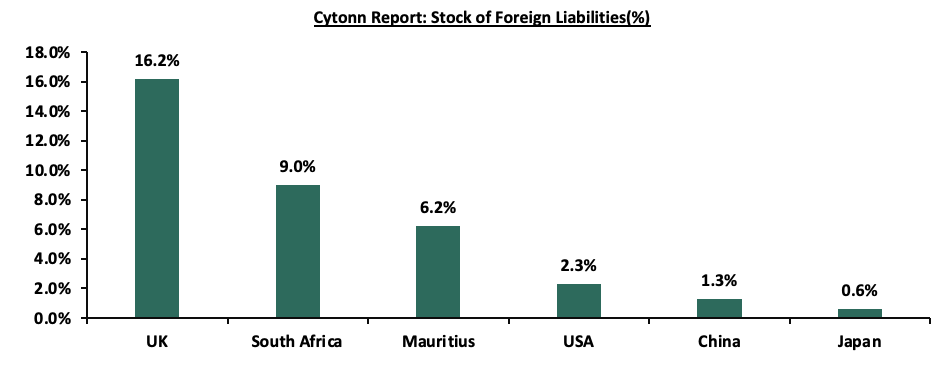
Source: KNBS Foreign Investment Survey 2024.
In terms of sectoral distribution, the finance and insurance sector attracted the highest FDI at Kshs 409.7 bn representing 28.1%, followed by manufacturing which made up 14.8% and ICT which accounted for 12.8%. Meanwhile, wholesale and retail trade saw a decline in FDI liabilities, falling by 1.8% to Kshs 169.8 bn in 2023, from Kshs 172.9 bn in 2022.
Section II: Economic Benefits of FDIs and Challenges to FDI Growth in Kenya
In Kenya, Foreign Direct Investment (FDI) plays a crucial role in driving economic growth and advancing sustainable development. Beyond providing capital, it introduces international expertise that stimulates innovation and strengthens the country’s competitiveness in global markets. Some of the economic benefits of FDIs include:
- Fueling Economic Growth- FDI is a major source of foreign capital inflow and funds which are used to supplement domestic capital and other earnings from exports. FDI can deliver diverse benefits to a country, including job opportunities, technology transfer, skills development, and greater access to international markets, all of which results in increased productivity leading to economic growth. Additionally, Foreign firms contribute to tax revenues through corporate taxes, payroll taxes, and customs duties, giving the government more fiscal space for public spending and debt servicing,
- Reduced Balance of Payment(BOP) Deficit- FDI strengthens a country’s export capacity by generating higher foreign exchange earnings, which directly narrows the current account deficit and supports currency stability,
- Domestic Currency Support- Increased FDIs provide a buffer for the domestic currency against other stronger currencies by increasing the supply of the foreign currencies, hence reducing the demand for foreign currency by importers and dependency on external borrowing,
- Advancing Technology and Productivity- FDI inflows mainly come with the introduction of advanced technology and management practices, which can be used to improve the productivity of the host country, improve efficiency and competitiveness, making the industry more attractive to investors,
- Increased Job Opportunities- Mostly, FDIs lead to the establishment of new industries which leads to increased opportunities for higher-paying jobs as most of these industries enjoy a global presence. Additionally, this in turn leads to an improvement in the standards of living of the local population, while also fostering skills development through training and knowledge transfer,
- Development of Local Capital Markets- Growth in FDI leads to increased activity in the capital markets resulting in increased liquidity, deepening of products offerings and depth of the markets. Additionally, the presence of multi-national companies can boost confidence in the market, attracting more foreign investments,
- Driving Infrastructure Development- Infrastructure is capital intensive and often underfunded in developing economies. FDI provides essential capital for infrastructure projects, which are costly for developing countries to fund on their own. Countries can make use of strategies like Public-Private Partnerships (PPPs), where private investors finance projects like infrastructure, which often leads to better service provision, and,
- Promoting Sustainable Development-FDIs help in the development of Sustainable Development Goals (SDGs) since it is a global interest, constituting the majority of foreign investment projects. As such, a country can benefit from a faster transition to renewable energy, green infrastructure, and sustainable buildings, which are essential for long-term economic health.
Despite the obvious benefits of a vibrant FDI sector, Kenya has remained behind her peers in the region, attracting fewer foreign investors comparatively. Some of the challenges to FDI growth include;
- High Levels of Corruption - The constant corruption scandals are a significant deterrent to FDI in Kenya as investors see it as the increase in the cost of doing business as well as a reduction of operations efficiency. According to Transparency International 2024 Corruption Perception Index, Kenya was ranked 121st out of 180 economies and 120th out of 176 in the 2025 Index of Economic Freedom, which was worse compared to other peer economies like Tanzania and Ghana,
- High Interest Rates in Developed Economies - As a result of global inflationary pressures registered in 2024, major Central Banks resulted to increasing their interest rates . As such, frontier markets like Kenya have experienced capital flight in the past three years as investors preferred higher returns in less risky markets. As a result, the Kenyan equities market recorded a net foreign investor outflow of USD 23.6 mn, USD 16.9 mn and USD 92.0 mn in 2025,2024 and 2023 respectively,
- Political Unrest - Kenya experiences a fair share of political unrest at least every five years, which erodes investor confidence since it increases the risks associated with an investment. Notably, in 2024, the business environment was affected by widespread protest triggered by Finance Bill 2024 leading to eroded investor confidence with Stanbic PMI declining by 8.7% to 43.1 in July 2024 from 47.2 in June 2024, the lowest recording since April 2021. Such recurring unrest discourages foreign investors, who prioritize stability and predictability,
- High taxes - The government through the Finance Act 2023 increased taxes including the doubling of VAT on fuel products to 16.0%, from 8.0%, which led to an increase in input costs. Additionally, the Finance Act 2025 introduced 16.0% VAT on items such as goods under the Affordable Housing Programme, goods used exclusively in building tourism infrastructure like hotels, parks (minimum 50 acres), and conference venues which also adds additional costs to businesses. As such, foreign investors might find the returns uncompetitive when compared to other countries, resulting in low FDIs,
- Regulatory Hurdles and Lack of Transparency - The slow and bureaucratic procedures can discourage foreign investors from investing in the country. Key to note, according to the World Bank, Kenya is ranked 56 among 190 economies in the ease of doing business, which is worse than economies like Rwanda which is ranked 38, while on ease of starting a business, it is ranked 129, while a country like Rwanda ranks 34, and,
- Underdeveloped Infrastructure and Security Concerns - Despite the deliberate effort to develop infrastructure by the former governments, some areas remain inaccessible as a result of poor roads. Additionally, Kenya still faces security concerns in some areas which can limit foreign investments into the country.
Section III: Recommendations
Foreign Direct Investment (FDI) plays a crucial role in driving economic growth and development, especially in emerging markets such as Kenya. Strengthening FDI inflows requires creating an environment that both attracts and sustains investors. Kenya’s strategic location as a hub for East and Central Africa, combined with its expanding consumer base, presents significant opportunities. Realizing this potential calls for a comprehensive strategy, and additional measures are needed to support FDI growth. Some of the steps the government can consider include:
- Stimulate our Moribund Capital Markets – The government should strengthen capital markets by adopting policies that attract foreign investors, simplifying regulations, and rolling out initiatives that promote investor confidence. Encouraging more companies, especially in sectors like technology, manufacturing, and renewable energy, to list on the stock exchange would deepen the market. A stronger capital market not only draws foreign capital but also improves liquidity and broadens investment choices. Currently, capital markets in Kenya finance only about 5.0% of businesses, compared to 60.0% in developed economies. See the chart below,
Source: World Bank
- Improve Diaspora Funding - Diaspora remittances have registered a consistent growth y/y, standing at a cumulative USD 5,079.9 mn in the 12 months to July 2025, 11.1% higher than the USD 4,571.7 mn recorded over the same period in 2024. However, the government can expand the sector inflows by formulating investment-friendly policies, offering tax holidays for investments made back home as well as issuing diaspora-specific bonds to encourage participation in government securities. The chart below shows diaspora remittances growth over the years,
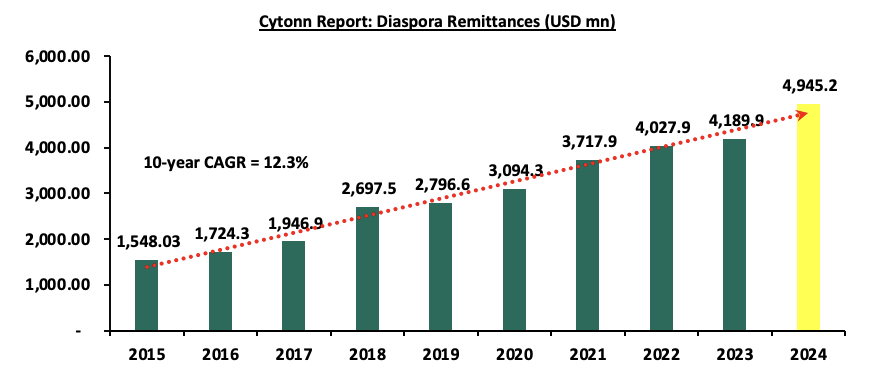
Source: CBK
- Improve the Ease of Doing Business – The government can make it easier to start and run businesses by cutting red tape and simplifying procedures. This includes digitizing services, introducing online registration platforms, and lowering the time and cost of securing permits and licenses. Offering incentives and support to small and medium-sized enterprises (SMEs) would further strengthen the business environment and help attract both domestic and foreign investment,
- Investment Attraction through Aggressive Marketing – The government has been promoting Kenya globally as a prime investment destination by sharing key investment information to attract potential investors. This effort includes roadshows organized by Kenyan missions abroad to showcase opportunities across different sectors. At the same time, measures have been taken to encourage local investors to scale up their investments through policies that create a favourable investments climate for both domestic and foreign players,
- Key Infrastructure Development – Good infrastructure makes a country more appealing to foreign investors. Investing in transport networks can ease the movement of goods and people, lowering operational barriers for businesses. At the same time, with rapid advances in technology, the government should prioritize digital infrastructure such as high-speed internet and reliable communication systems to enhance connectivity and give businesses better access to global markets. Additionally, there is a need to leverage more on innovation, digitization, and product development in the capital markets and larger investment environment. This will allow quick access to investment avenues by investors and open up the markets to retail investors, reduce the lead time between making an investment decision and its practical execution, and reduce costs incurred during physical applications,
- Operationalize Special Economic Zones (SEZs) – Kenya should place greater focus on Special Economic Zones (SEZs) as a critical driver of manufacturing, industrialization, and investment-led social transformation. For instance, Tatu City is Kenya’s first operational Special Economic Zone, providing reduced corporate taxes, zero-rated VAT, and import duty exemptions, among other benefits. Other SEZs under development include the Dongo Kundu Special Economic Zone in Mombasa, the Naivasha Special Economic Zone, and the Konza Technopolis,
- Public-Private Partnerships (PPPs) – Collaboration with the private sector allows the government to share risks, mobilize extra financing, and leverage private expertise in project execution. Expanding Public-Private Partnerships (PPPs) beyond infrastructure into areas like healthcare, education, and tourism can open new investment avenues, enhance service delivery, generate jobs, and stimulate economic growth, thereby strengthening Kenya’s position as an investment hub,
- Developing Kenya's Key Sectors – Kenya should focus on sectors with high growth potential that give it a competitive edge in Sub-Saharan Africa by offering tax incentives and streamlined regulations for specific sectors. The sustainable energy sector is especially promising, supported by established geothermal generation and wind power projects in Lake Turkana, aligning with the current investor emphasis on Sustainable Development Goals(SDGs). Other priority areas for investment include agriculture and agro-processing, healthcare, education, financial services, ICT, infrastructure, manufacturing, real estate, construction, and tourism, and,
- Ensure a Strong and Conducive Regulatory Framework – A clear and transparent regulatory framework gives investors the assurance and security needed to commit capital. It is therefore important that investors fully understand the rules governing their operations and have confidence in the stability of future regulations. This requires regular reviews and updates of existing laws and regulations to address existing gaps with regard to the changing business environment.
Section IV: Conclusion and Our Outlook
Kenya’s FDI still lags behind its peers in terms of its ability to attract foreign investors to the country. However, we expect a high growth rate in 2025 and 2026, as the country continues to be a magnet for foreign investors interested in renewable energy which has become a global interest. Kenya’s FDI attractiveness in 2025 and 2026 will likely hinge on a mixture of strategic policy reform, modernized infrastructure (physical and digital), enhanced risk frameworks, and regional economic integration. These factors, combined with improved financial structures and state asset privatization, should create a compelling value proposition for global and regional investors alike. We also expect high FDI growth on the back of revised government policies to encourage more foreign investors. For example, the removal of the 30.0% local ownership requirement for foreign companies in the ICT sector in 2023 encouraged more ICT company setups. Additionally, the current government is keen on signing trade agreements that are set to increase FDIs into the country, for example, the signed trade agreement with the United Arab Emirates is expected to encourage more flows into the country, as it will provide Kenya with investment opportunities in several sectors of the Kenyan economy, including energy, water, agriculture, health, ports, airports, logistics, human resource development, and ICT. Further, the improved investor perception regarding the country’s credit risk following upgrade by global rating agencies such as S&P Global and Moody, will help drive investors back to the frontier markets. However, the high levels of corruption scandals are a major concern among foreign investors interested in investing in Kenya.
Disclaimer: The views expressed in this publication are those of the writers where particulars are not warranted. This publication, which is in compliance with Section 2 of the Capital Markets Authority Act Cap 485A, is meant for general information only and is not a warranty, representation, advice or solicitation of any nature. Readers are advised in all circumstances to seek the advice of a registered investment advisor.

- Talk to us
- Kenya
- P.O Box 20695 - 00200, Nairobi, Kenya
- Cell +254709101200
- Tel +254709101200
- WhatsApp +254741676635
- United States
- +254709101200
- DOWNLOAD OUR APP
-


- Kenya
- 8th Floor, Pinetree Plaza, Kaburu Drive, Ngong Road, Nairobi, Kenya
- USA
- Suite 1150, 1775 Eye Street NW, USA, Washington DC 20006, USA
- Investments
- High Yield
- Private Equity
- Real Estate
- Real Estate
- RiverRun Estates
- Cytonn Towers
- The Ridge
- Taraji Heights
- The Alma