Kenya Economic Review 2018, & Cytonn Weekly #45/2018
By Cytonn Research Team, Nov 25, 2018
Executive Summary
Fixed Income
T-bills were under-subscribed during the week, with the overall subscription rate coming in at 48.8%, down from 93.8% recorded the previous week. Yields on the 91-day T-bill remained unchanged at 7.3% while the yields on the 182-day paper declined to 8.2% from 8.3%. The yields on the 364-day paper however increased to 9.6% from 9.5% recorded the previous week. The Monetary Policy Committee (MPC) is set to meet on Tuesday, 27th November 2018, on their last meeting for 2018, to review the prevailing macroeconomic conditions and make a decision on the direction of the Central Bank Rate (CBR);
Equities
During the week, the equities market was on a declining trend with NASI, NSE 20 and NSE 25, declining by 0.5%, 1.6% and 1.7%, respectively, taking their YTD performance to declines of 15.8%, 25.6% and 16.0%, for NASI, NSE 20 and NSE 25, respectively. During the week, Standard Chartered Bank Kenya, Diamond Trust Bank Kenya and Barclays Bank of Kenya Ltd released their Q3’2018 financial results, recording core Earnings per Share (EPS) growth of 33.9%, 10.0% and 2.0% to Kshs 18.4, Kshs 20.2 and Kshs 1.0, respectively, from Kshs 13.7, Kshs 18.3 and Kshs 0.98, respectively, in Q3’2017. Stanbic Bank Kenya released their Q3’2018 results with Profit After Tax (PAT) increasing by 46.7% to Kshs 4.7 bn from Kshs 3.2 bn in Q3’2017;
Private Equity
In fundraising, UNICAF, the largest online higher education platform in Africa, announced a USD 28.0 mn Series B financing. The new investment round is led by Goldman Sachs with other participants in the round being existing investors, including the UK Government's Development Finance Institution, CDC Group, leading higher education fund University Ventures, and the Educational Excellence Corporation Ltd (EDEX), the Founder of the University of Nicosia and UNICAF. The funds are to meet the growing demand for high-quality university education across Africa;
Real Estate
During the week, in the commercial office sector, Coca-Cola, a multi-national beverage company, announced the selling of its Upperhill office, which has been the company’s headquarters for the East and Central Africa Region since 2008, as it relocates to new offices in Lavington. In addition, City Clock chief, Tilman Wolfgang, has announced plans to develop a 12-floor office block along Riverside Drive in Westlands, Nairobi. In the retail sector, South African retailer, Shoprite, announced plans to take up space as an anchor tenant at the proposed mall dubbed ‘The Beacon’, near the Bunyala roundabout, in Nairobi. In the residential sector, Centum Investment Company announced that it has already signed agreements worth Kshs 1.2 bn for residential units at its Vipingo Estate in Kilifi County;
Focus of the Week
The year 2018 has witnessed improved economic growth amid political stability and improved weather conditions. This week, we review the economic progress relative to the previous year, with a focus on economic growth, fiscal reforms and monetary policies effected by the Kenyan Government and Central Bank, as well as the socio-political environment, ease of doing business and investor sentiment.
- On Thursday 22nd November 2018, Cytonn Asset Managers Limited, “CAML”, the regulated affiliate of Cytonn Investments Management Plc conducted a training for Sacco Officials at the Cytonn Chancery office along valley road. The training focused on educating the participants on the investment opportunities available in the alternative space and the benefits of investing in alternatives. See the Event Note here;
- Our Chief Executive Officer, Edwin H. Dande was on KTN’s entrepreneurship show, ‘Captains of Industry’ to discuss Cytonn’s journey since inception. Watch the interview here;
- Our Distribution Manager, Moses Njuguna was on Inooro TV to discuss money-spending habits for families over the holiday season. Watch the interview here;
- Our Investments Analyst, Faith Maina was on KBC Channel 1 to discuss the expectations from the Blue Economy Conference, which will be held in Nairobi, Kenya on 26th – 28th November 2018. Watch the interview here;
- We invite you to the ongoing exhibition of Situ Village, our Kshs 5.5 bn gated community development in Oloolua Ridge, Karen. The exhibition is at the Amara Ridge Clubhouse (Location Pin: https://goo.gl/maps/B3GVnu8pHyn) from 9:00 am to 5:00 pm daily, and it will end on 30th November 2018. Do not miss the opportunity! See the video for the completed Amara Ridge here;
- We continue to hold weekly workshops and site visits on how to build wealth through real estate investments. The weekly workshops and site visits target both investors looking to invest in real estate directly and those interested in high yield investment products to familiarize themselves with how we support our high yields. Watch progress videos and pictures of The Alma, Amara Ridge, The Ridge, and Taraji Heights. Key to note is that our cost of capital is priced off the loan markets, where all-in pricing ranges from 16.0% to 20.0%, and our yield on real estate developments ranges from 23.0% to 25.0%, hence our top-line gross spread is about 6.0%. If interested in attending the site visits, kindly register here;
- We continue to see very strong interest in our weekly Private Wealth Management Training (largely covering financial planning and structured products). The training is at no cost and is open only to pre-screened participants. We also continue to see institutions and investment groups interested in the training for their teams. The Wealth Management Training is run by the Cytonn Foundation under its financial literacy pillar. If interested in our Private Wealth Management Training for your employees or investment group, please get in touch with us through wmt@cytonn.com. To view the Wealth Management Trainingtopics, click here;
- For recent news about the company, see our news section here;
- We have 10 investment-ready projects, offering attractive development and buyer targeted returns of around 23.0% to 25.0% p.a. See further details here: Summary of Investment-Ready Projects;
- We continue to beef up the team with ongoing hires for Financial and Real Estate Advisors for our offices in Nairobi, Nakuru, Kisumu, and Nyeri. Visit the Careers sectionon our website to apply; and
- Cytonn Centre for Affordable Housing (CCFAH) is looking for a 2-acre land parcel for a joint venture/buy in Kiambu County (Ruiru, Kikuyu, Lower Kabete), Nairobi County and its environs. The parcel should be; i) fronting a main road, or not more than 800 metres from the main road, and ii) priced at Kshs 20 mn per acre or below. For more information or leads email us at affordablehousing@cytonn.com
T-Bills & T-Bonds Primary Auction:
T-bills were under-subscribed during the week, with the overall subscription rate coming in at 48.8%, down from 93.8% recorded the previous week. The under-subscription is partly attributable to the tight liquidity in the inter-bank markets evidenced by the rise in the average inter-bank rate to 4.7% from 3.3% recorded the previous week. The tightened liquidity is mainly due to the statutory tax payments that were due this week, coupled with the beginning of a new cash reserve ratio (CRR) cycle. The subscription rate for the 91-day, 182-day and 364-day paper decreased to 43.5%, 19.3% and 80.4% from 182.1%, 24.4% and 127.9% recorded the previous week, respectively. The yields on the 91-day remained unchanged at 7.3% while the yields on the 182-day paper declined to 8.2% from 8.3%. The yields on the 364-day paper however increased to 9.6% from 9.5% recorded the previous week. The acceptance rate for T-bills declined to 76.2% from 96.0% the previous week, with the government accepting Kshs 8.9 bn of the Kshs 11.7 bn worth of bids received.
This week, the Kenyan Government went back in the primary market with a tap sale for the 20-year infrastructure bond, issue No. IFBI/2018/20 with similar features as the initial issue, the previous week in a bid to raise Kshs 22.4 bn. The coupon is set at 11.95% while the average yield is set at 12.2%. Last week, the Government accepted Kshs 27.6 bn compared to a target of Kshs 50.0 bn at an average yield of 12.2%. The funds received from the IFB Sale mainly went to the redemption of Kshs 34.6 bn 5-Year bond issue no: FXD3/2013/5 that was due for payment on Monday. The proceeds will be used for funding infrastructure projects in the road, water and energy sectors. The period of sale in the tap sale has however been lengthened to 6 days from, 21st November 2018 to 27th November 2018 or upon attainment of quantum, whichever comes first.
We are of the view that the continued issuance of medium to long-term domestic securities is well guided as lengthening the average maturity will reduce the potential rollover risks in the medium term. The issuance of medium to long-term securities have however been having a lacklustre performance, which we attribute to the saturation of long-end offers, leading to a relatively flat yield curve on the long-end and the government will need to offer more incentive for the long-term bonds by increasing the yields to attract investors.
Liquidity:
The average interbank rate increased to 4.7% from 3.3% the previous week, while the average volumes traded in the interbank market increased by 34.6% to Kshs 27.3 bn, from Kshs 20.3 bn the previous week. The higher interbank rate points to tightened liquidity conditions attributed to the statutory tax payments that were due, coupled with the beginning of a new cash reserve ratio (CRR).
Kenya Eurobonds:
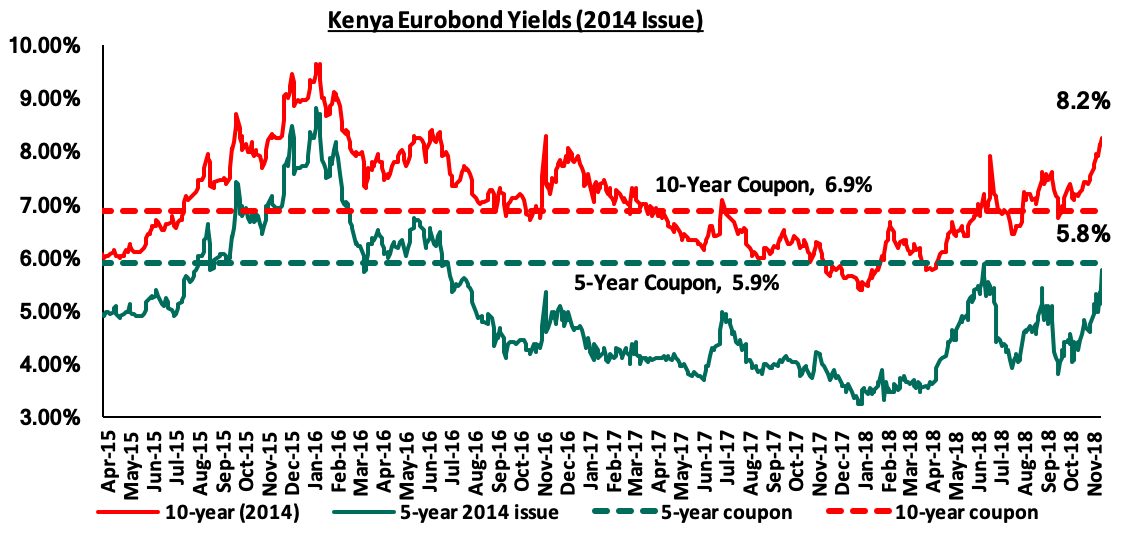
According to Bloomberg, the yields on the 5-year and 10-year Eurobonds issued in 2014 both increased by 0.5% and 0.3% points to 5.8% and 8.2%, from 5.3% and 7.9% recorded the previous week, respectively. Since the mid-January 2016 peak, yields on the Kenyan Eurobonds have declined by 1.4% points and 3.0% points for the 10-year and 5-year Eurobonds, respectively, an indication of the relatively stable macroeconomic conditions in the country. Key to note is that these bonds have 0.6-years and 5.6-years to maturity for the 5-year and 10-year, respectively.
For the February 2018 Eurobond issue, during the week, the yields on both the 10-year and 30-year Eurobonds rose by 0.4% and 0.3% points to 9.1% and 9.9% from 8.7% and 9.6% the previous week, respectively. Since the issue date, the yields on the 10-year and 30-year Eurobonds have both increased by 1.8% and 1.6% points, respectively.
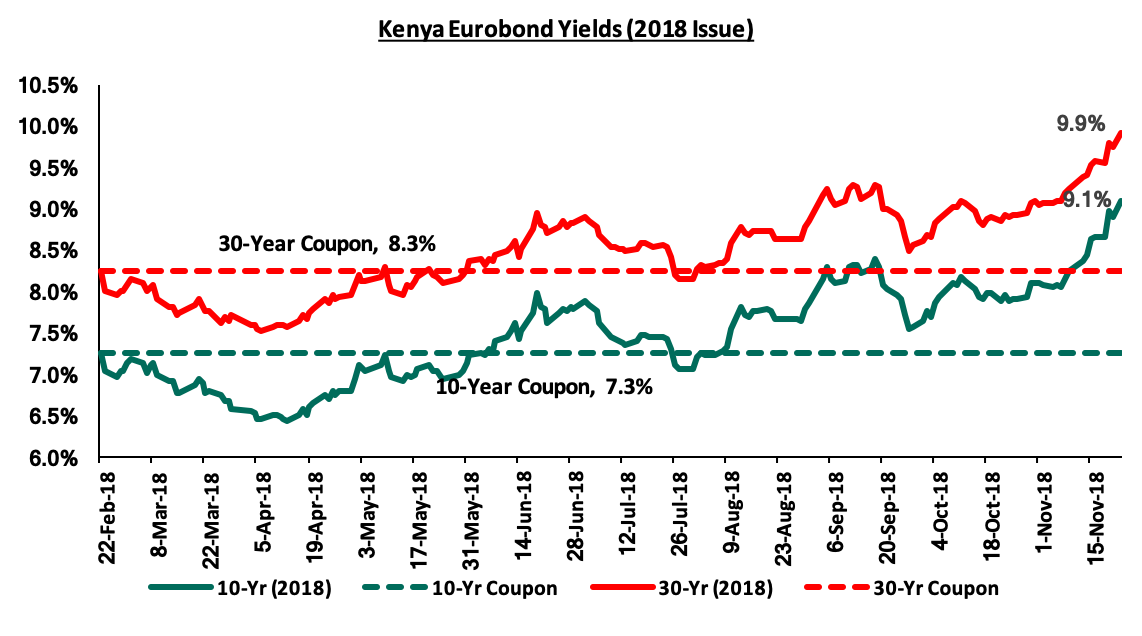
Key to note, the yields on all the Eurobonds have been on the rise in recent weeks. The rising yield on all the Eurobonds signals higher country risk perception by investors, partly attributed to International Monetary Fund (IMF) raising the risk of Kenya’s debt distress from low to moderate in October, resulting in investors demanding a higher return for the risk. In November, the yields on the 5-year and 10-year 2014 issues have both increased by 1.0% points and 0.8% points, respectively while the yields on the 10-year and 30-year 2018 issues have increased by 1.0% points and 0.8% points, respectively. The increment in the Federal Rate twice this year, currently at 2.0% - 2.25% has also led to market correction in Eurobond yields in the emerging markets with the 2014 Eurobond issues having increased by 2.4% points and 2.6% points for the 5-year and 10-year 2014 Eurobond issues, respectively.
Kenya Shilling:
During the week, the Kenya Shilling gained by 0.7% against the US Dollar to close at Kshs 102.4 from Kshs 103.2, recorded the previous week. This was partly attributed to tightened liquidity, as well as support from inflows from horticulture exports and diaspora remittances that helped to meet increased dollar demand from merchandise importers shipping goods ahead of the festive season. The Kenya Shilling has appreciated by 0.7% year to date, and in our view the shilling should remain relatively stable to the dollar in the short term, supported by:
- CBK’s activities in the money market, such as repurchase agreements and selling of dollars,
- High levels of forex reserves, currently at USD 8.1 bn, equivalent to 5.3-months of import cover, compared to the one-year average of 5.5-months, which is above the IMF threshold for emerging markets, which is 3-months, and,
- Improving diaspora remittances, which increased by 71.9% y/y to USD 266.2 mn in June 2018 from USD 154.9 mn in June 2017 and by 4.9% m/m, from USD 253.7 mn in May 2018, with the largest contributor being North America at USD 130.1 mn, attributed to; (a) recovery of the global economy, (b) increased uptake of financial products by the diaspora due to financial services firms, particularly banks, targeting the diaspora, and (c) new partnerships between international money remittance providers and local commercial banks making the process more convenient.
Monetary Policy Committee Meeting:
The Monetary Policy Committee (MPC) is set to meet on Tuesday, 27th November 2018, on their last meeting in 2018, to review the prevailing macroeconomic conditions and make a decision on the direction of the Central Bank Rate (CBR). Key factors that will shape MPC’s decision include:
- Inflation that has averaged 4.5% in the first 10-months of 2018 compared to 8.7% experienced in a similar period in 2017, and is expected to remain within the government target of 2.5% - 7.5%, despite the expectations of upwards inflationary pressure in H2’2018 due to the imposition of the 8.0% VAT charge on fuel as well as other tax measures as introduced in the Finance Bill,
- The currency that has lost by 1.4% since the last meeting on 25th September 2018 to Kshs 102.4 from Kshs 101.0, and,
- The macroeconomic environment that has remained relatively stable despite the low private sector credit growth, which has remained unchanged at 4.3% since July to September 2018. This has been the highest growth rate since December 2016, pointing to a recovery albeit slow and still way below the 5-year average of 13.0%.
We are of the view that the MPC will adopt a wait and see approach given the macroeconomic environment is relatively stable. We expect the MPC to hold the Central Bank Rate (CBR) at 9.0% with their decision being on the back of:
- Despite expectations of inflationary pressure in the remainder of the year as the effects of the various tax policy measures introduced through the Finance Bill 2018 continue to be felt, we do not believe that the pressure is high enough to warrant a policy shift. Inflationary pressure has further been mitigated by the declining food prices due to the improved weather conditions and as such, inflation is expected to be within the government set target of 2.5%-7.5%,
- Despite the recent depreciation of the Kenyan Shilling against the US dollar, it has remained relatively stable, reflecting a more stable economic environment, which saw the IMF reclassifying Kenya, from a floating arrangement to stabilized arrangement, in their Annual Report on Exchange Arrangements and Exchange Restrictions released on 30th April 2018. The classification of the arrangement, is primarily based on the degree to which the exchange rate is determined by the market, rather than by official action. For a country to be classified as a stabilized arrangement, the market exchange rate should remain within a margin of 2.0% for 6 months or more with respect to a single currency or a basket of currencies, thus showing the stability of the Kenyan shilling. Volatility of the Kenyan shilling has however mainly been cushioned by Central Bank’s activities, which has seen the forex reserves decline by 4.4% to USD 8.1 bn, equivalent to 5.3 months of import cover, from USD 8.4 bn, since the last MPC meeting but still remain high and above the optimal level of reserves for Kenya as per the IMF set at 3.5 months of imports. The ongoing prospects of the Treasury issuing another Eurobond could also eliminate the need for tightening the monetary policy, as it will enhance the forex reserves thus cushioning the shilling, and,
- Private sector credit growth has remained unchanged at 4.3% for the 3 months to September, since the lowering of the CBR to 9.0% in July, higher than the 3.3% average for the 9 months to September 2018 as well as the 2017 average of 2.5% but is still below the 5-year average of 12.6%.
For a comprehensive analysis, read our MPC Note
Inflation Projection:
We are projecting the inflation rate for the month of November to range between 5.7% - 6.1% from 5.5% recorded in September. We expect inflation to rise mainly due to the base effect as well as:
- The 2.1% increase in petrol prices to Kshs 118.1 from Kshs 115.7 per litre, while diesel prices increased by 2.8% to Kshs 112.8 from Kshs 109.7 per litre from the previous month. The changes in prices have been attributed to the increase in average landing costs of imported super petrol by 4.0% to USD 758.3 per ton in October from USD 729.0 per ton in September. Landing costs for diesel also increased by 5.8% to USD 741.3 per ton in October from USD 700.4 per ton in September. The price increase will directly affect transport costs and indirectly affect food prices in November, and,
- On the housing, water, electricity, gas and other fuels index, kerosene prices increased by 2.7% to Kshs 111.8 from Kshs 108.8 recorded the previous month. The increase in the prices of Kerosene can be attributed to the increase in landing costs of imported Kerosene by 5.8% to USD 763.5 per ton in October from USD 721.6 per ton in September. Electricity costs are however expected to mitigate the rise in kerosene prices due to the reduction of electricity bills as per the released reviewed electricity tariffs by the Energy Regulatory Commission (ERC). Electricity prices for households and businesses consuming a maximum of 100 units of power declined by 31.6% to Kshs 1,517 in November from Kshs 2,219 in October, after factoring in variable pass-through charges such as 16% VAT, fuel cost charge, forex levy and inflation charge.
The increase in Inflation is expected to be mitigated by a decline in the food and non- alcoholic beverages index, which has a weight of 36.0%. This is due to declined food prices mainly driven by a decline in grain products with the maize harvest having increased by 20.0% to 40.9 mn bags from 34.0 mn bags last year. These has effectively reduced the prices of maize flour. Key to note, according to Kenya National Bureau of Statistics (KNBS), we expect inflation in H2’2018 to experience upward pressure but at a lower rate following the reduction in the rate of VAT charge on fuel to 8.0% from 16.0%, affirming the expectations of inflation for the year averaging within the government’s set target of 2.5%-7.5%.
Rates in the fixed income market have been on a declining trend, as the government continues to reject expensive bids, as it is currently 18.2% ahead of its pro-rated domestic borrowing target for the current financial year, having borrowed Kshs 136.0 bn against a pro-rated target of Kshs 109.8 bn. The 2018/19 budget had given a domestic borrowing target of Kshs 271.9 bn, 8.6% lower than the 2017/2018 fiscal year’s target of Kshs 297.6 bn, which may result in reduced pressure on domestic borrowing. With the rate cap still in place, we maintain our expectation of stability in the interest rate environment. With the expectation of a relatively stable interest rate environment, our view is that investors should be biased towards medium-term fixed-income instrument.
Market Performance
During the week, the equities market was on a declining trend, with NASI, NSE 20 and NSE 25 declining by 0.5%, 1.6% and 1.7%, respectively, taking their YTD performance to declines of 15.8%, 25.6% and 16.0%, for NASI, NSE 20 and NSE 25, respectively. The decline in the NASI was driven by declines in large cap stocks such as Diamond Trust Bank Kenya Ltd, Barclays Bank of Kenya, NIC and EABL, which declined by 8.8%, 5.2%, 4.3% and 3.0%, respectively.
Equities turnover declined by 16.3% during the week to USD 16.3 mn, from USD 19.5 mn the previous week, taking the YTD turnover to USD 1.7 bn. Foreign investors turned net buyers for the week, with a net buying position of USD 1.1 mn, an increase from last week’s net selling position of USD 0.7 mn. We expect the market to remain subdued in the near-term as international investors exit the broader emerging markets due to the expectation of rising US interest rates coupled with the strengthening of the US Dollar.
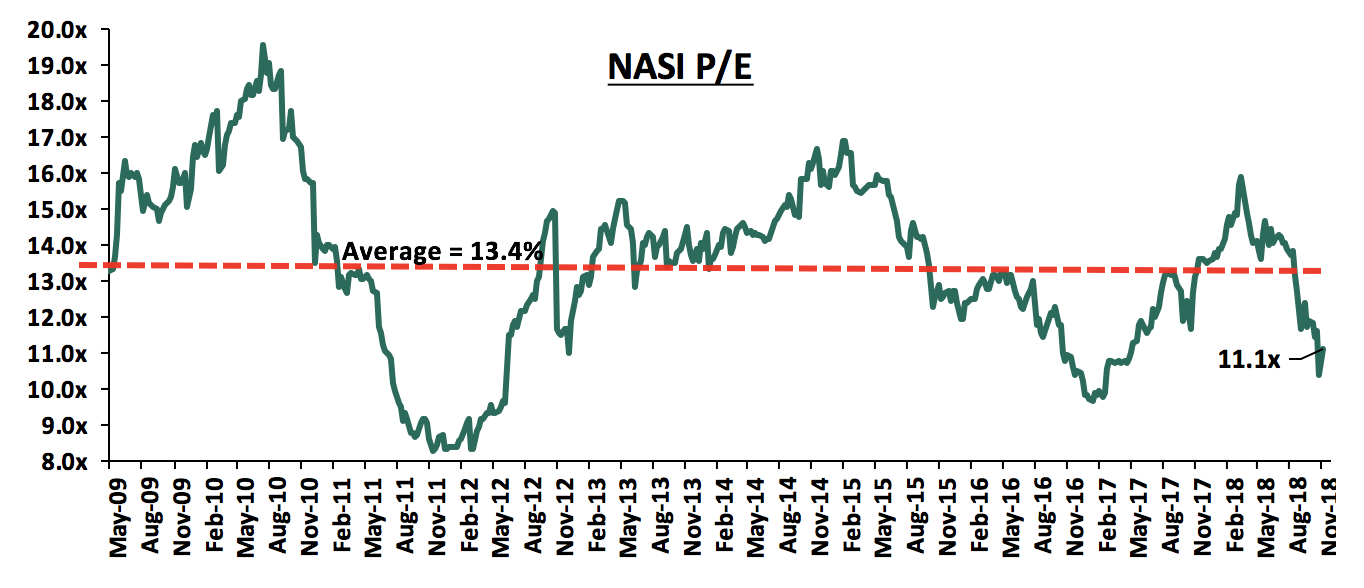
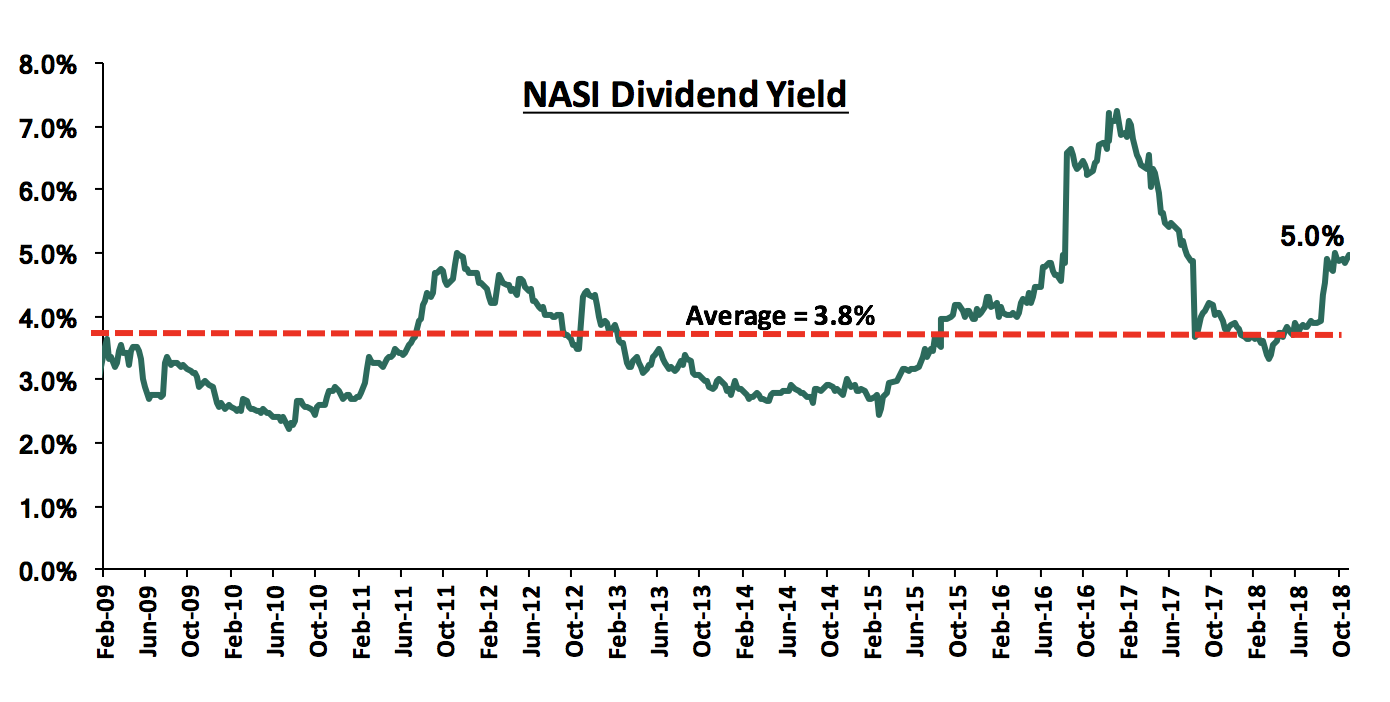
The market is currently trading at a price to earnings ratio (P/E) of 11.1x, 17.2% below the historical average of 13.4x, and a dividend yield of 5.0%, above the historical average of 3.8%. With the market trading at valuations below the historical average, we believe there is value in the market. The current P/E valuation of 11.1x is 14.4% above the most recent trough valuation of 9.7x experienced in the first week of February 2017, and 33.7% above the previous trough valuation of 8.3x experienced in December 2011. The charts below indicate the historical P/E and dividend yields of the market.
Earnings Releases
Barclays Bank of Kenya released their Q3’2018 financial results:
Barclays Bank of Kenya released their Q3’2018 financial results, with core Earnings per Share (EPS) increasing by 2.0% to Kshs 1.0, from Kshs 0.98 in Q3’2017, exceeding our expectation of a 1.5% decline to Kshs 0.97. The performance was driven by a 5.5% increase in total operating income, and was weighed down by the 8.3% increase in the total operating expenses. The variance in core earnings per share growth against our expectations was largely due to the 14.0% growth in Non-Funded Income (NFI) to Kshs 7.4 bn from Kshs 6.5 bn in Q3’2017. We expected a 0.6% decline in NFI to Kshs 6.4 bn from Kshs 6.5 bn in Q3’2017.
Highlights of the performance from Q3’2017 to Q3’2018 include:
- Total operating income increased by 5.5% to Kshs 23.9 bn in Q3’2018, from Kshs 22.6 bn over the same period to Q3’2017. This was due to a 2.1% increase in Net Interest Income (NII) to Kshs 16.5 bn, from Kshs 16.2 bn in Q3’2017, coupled with the 14.0% increase in Non-Funded Income (NFI) to Kshs 7.4 bn, from Kshs 6.5 bn in Q3’2017,
- Interest income increased by 7.7% to Kshs 21.7 bn, from Kshs 20.1 bn in Q3’2017. This was largely driven by the 34.8% growth in interest income from government securities to Kshs 5.6 bn from Kshs 4.1 bn in Q3’2017, and a 0.7% increase in interest income on loans and advances to Kshs 16.0 bn, from Kshs 15.9 bn in Q3’2017. Interest income on deposits and placements with banking institutions rose by 26.8% to Kshs 0.1 bn from Kshs 0.08 bn in Q3’2017. However, the yield on interest earning assets declined to 11.8% in Q3’2018, from 12.1% in Q3’2017, due to a faster increase of 29.5% in government securities that have relatively lower yields than loans,
- Interest expense increased by 30.1% to Kshs 5.2 bn, from Kshs 4.0 bn in Q3’2017, following a 26.9% increase in the interest expense on customer deposits to Kshs 4.5 bn, from Kshs 3.6 bn in Q3’2017. Interest expense on deposits and placements from banking institutions increased by 57.1% to Kshs 0.7 bn from Kshs 0.4 bn in Q3’2017. The cost of funds thus increased to 3.1%, from 2.8% in Q3’2017. As a consequence, the Net Interest Margin (NIM) declined to 6.8%, from 7.2% in Q3’2017,
- Non-Funded Income (NFI) increased by 14.0% to Kshs 7.4 bn, from Kshs 6.5 bn in Q3’2017. The growth in NFI was largely driven by the 16.6% growth in foreign exchange trading income to Kshs 2.5 bn from Kshs 2.2 bn in Q3’2017, coupled with a 52.2% growth in Fees and commissions on loans to Kshs 0.8 bn from Kshs 0.5 bn in Q3’2017. Furthermore, other income grew by 114.9% to Kshs 0.6 bn, from Kshs 0.3 bn in Q3’2017. However, the other fees and commission income declined by 1.7% to Kshs 3.4 bn from Kshs 3.5 bn in Q3’2017. As a result of the above performance, the current revenue mix shifted to 69:31 funded to non-funded income as compared to 71:29 in Q3’2017. The proportion of NFI to total revenue increased owing to the faster growth in NFI than in NII,
- Total operating expenses increased by 8.3% to Kshs 16.1 bn, from Kshs 14.9 bn in Q3’2017, largely driven by a 31.0% increase in other operating expenses to Kshs 5.9 bn in Q3’2018, from Kshs 4.5 bn in Q3’2017, coupled with a 21.3% increase in Loan Loss Provisions (LLP) to Kshs 2.8 bn in Q3’2018, from Kshs 2.3 bn in Q3’2017. Staff costs however declined by 7.9% to Kshs 7.5 bn from Kshs 8.1 bn in Q3’2017,
- As a result, Cost to Income Ratio (CIR) deteriorated to 67.6%, from 65.9% in Q3’2017. Without LLP, the cost to income ratio also deteriorated, albeit marginally, to 55.8%, from 55.6% in Q3’2017,
- Profit before tax increased by 0.1% to Kshs 7.72 bn, up from Kshs 7.71 bn in Q3’2017. Profit after tax however increased by 2.0% to Kshs 5.4 bn in Q3’2018, from Kshs 5.3 bn in Q3’2017, due to the Kshs 0.5 bn deferred tax in Q3’2018,
- The balance sheet recorded an expansion as total assets increased by 15.9% to Kshs 322.2 bn, from Kshs 278 bn in Q3’2017. This growth was largely driven by a 29.5% increase in government securities to Kshs 74.6 bn, from Kshs 57.6 bn in Q3’2017, coupled with a 6.7% increase in the loan book to Kshs 178.4 bn, from Kshs 167.3 bn in Q3’2017,
- Total liabilities rose by 18.7% to Kshs 279.5 bn, from Kshs 235.4 bn in Q3’2017, driven by a 9.9% increase in total deposits to Kshs 220.3 bn, from Kshs 200.4 bn in Q3’2017. Deposits per branch increased by 34.6% to Kshs 2.5 bn, from Kshs 1.8 bn in Q3’2017, with 2 branches closed in H1’2018 bringing the total number of branches to 89. Placement liabilities increased by 37.3% to Kshs 2.4 bn from Kshs 1.7 bn in Q3’2017. The bank did not have any borrowed funds,
- The faster growth in deposits as compared to loans led to a decline in the loan to deposit ratio to 81.0% from 83.5% in Q3’2017. However, the proportion of government securities to deposits increased to 33.9% from 28.8% in Q3’2017,
- Gross Non-Performing Loans (NPLs) increased by 22.3% to Kshs 14.6 bn in Q3’2018 from Kshs 11.9 bn in Q3’2017. Consequently, the NPL ratio deteriorated to 7.7% in Q3’2018 from 6.8% in Q3’2017. General Loan Loss Provisions (LLPs) increased by 34.5% to Kshs 7.2 bn from Kshs 5.4 bn in Q3’2017. With the growth in NPLs outpaced by the increase in provisioning, the NPL coverage improved to 70.5% in Q3’2018, from 70.3% in Q3’2017,
- Shareholders’ funds increased marginally by 0.3% to Kshs 42.7 bn in Q3’2018 from Kshs 42.5 bn in Q3’2017, as the 231.7% increase in the revaluation reserve to Kshs 0.6 bn from Kshs 0.2 bn, was outweighed by the 0.7% decline in retained earnings to Kshs 39.2 bn from Kshs 39.4 bn, and the 8.9% decline in the other reserves to Kshs 0.19 bn from Kshs 0.21 bn in Q3’2017,
- Barclays Bank of Kenya Ltd is currently sufficiently capitalized with a core capital to risk weighted assets ratio of 14.8%, 4.3% points above the statutory requirement. In addition, the total capital to risk weighted assets ratio was 16.7%, exceeding the statutory requirement by 2.2% points. Adjusting for IFRS 9, the core capital to risk weighted assets stood at 15.1%, while total capital to risk weighted assets came in at 17.1%, indicating that the bank’s total capital relative to its risk-weighted assets declined by 0.4% points due to implementation of IFRS 9,
- The bank currently has a Return on Average Assets (ROaA) of 2.5%, and a Return on Average Equity (ROaE) of 16.5%.
Key Take-Outs:
- The bank had a steep increase in its interest expense, coming in at a 30.1%, an indication that the bank mobilized deposits at higher costs, as deposits grew only by 9.9%, while interest expense on deposits grew by 26.9%. Furthermore, the bank increased its placement liabilities, which grew 37.2%, while the interest expenses on placements increased by 57.1%, an indication of expensive mobilization of funding, which compressed the bank’s top line revenue,
- The bank’s other operating expenses increased by 31.0% y/y, with the bank indicating that the ongoing rebranding efforts to Absa Group, coupled with the upgrade and installation of IT infrastructure have increased the bank’s other operating expenses. However, staff costs declined by 7.9% y/y indicating the bank benefited from its strategy of lowering its staff number, from its retirement programs, with 323 staff leaving in H2’2017, and,
- The bank’s asset quality deteriorated, with the NPL Ratio deteriorating to 7.7%, from 6.8% in Q3’2017. The deterioration in asset quality is likely being experienced with the trade sector clients facing delayed payments from governments, affecting their debt servicing. This, coupled with the relatively tighter macroeconomic environment, led to a deterioration in asset quality. However, with the bank employing prudence in provisioning, the coverage improved to 70.5% in Q3’2018.
For more information, see our Barclays Bank of Kenya Q3’2018 Earnings Note
Standard Chartered Bank Kenya Ltd released their Q3’2018 financial results:
Standard Chartered Bank Kenya Ltd released their Q3’2018 financial results with core EPS increasing by 33.9% to Kshs 18.4, from Kshs 13.7 in Q3’2017, exceeding our expectation of an 18.9% increase to Kshs 16.3. The performance was driven by a 7.1% increase in total operating income, coupled with a 7.1% decline in the total operating expenses. The variance in core earnings per share growth against our expectations was largely due to the faster 9.7% growth in Non-Funded Income (NFI) to Kshs 7.0 bn from Kshs 6.4 bn, coupled with a faster 49.6% decline in Loan Loss Provisions (LLP) to Kshs 1.9 bn, from Kshs 3.7 bn in Q3’2017. Important to note for Standard Chartered Bank is that the decline in the specific provisions, that came despite a deterioration in asset quality, is due to banks being allowed to charge provisions through the balance sheet during the first year of the implementation of IFRS 9. We expected a slower 3.4% growth in NFI to Kshs 6.6 bn, from Kshs 6.4 bn in Q3’2017, and a slower 36.5% decline in LLP to Kshs 2.4 bn.
Highlights of the performance from Q3’2017 to Q3’2018 include:
- Total operating income increased by 7.1% to Kshs 21.6 bn year-to-date (YTD) Q3’2018, from Kshs 20.2 bn over the same period to Q3’2017. This was due to a 5.9% increase in Net Interest Income (NII) to Kshs 14.6 bn from Kshs 13.8 bn in Q3’2017, coupled with the 9.7% increase in Non-Funded Income (NFI) to Kshs 7.0 bn, from Kshs 6.4 bn in Q3’2017,
- Interest income increased by 4.8% to Kshs 20.3 bn, from Kshs 19.4 bn in Q3’2017. This was driven by a 15.2% growth in interest income from government securities to Kshs 9.5 bn, from Kshs 8.3 bn in Q3’2017, which outpaced the 1.7% decline in interest income on loans and advances to Kshs 9.9 bn, from Kshs 10.1 bn in Q3’2017, and a 2.5% decline in interest income on deposits and placements with banking institutions, to Kshs 0.39 bn from Kshs 0.4 bn in Q3’2017. As a result of the increase in interest income, the yield on interest earning assets rose to 11.9% in Q3’2018, from 11.3% in Q3’2017,
- Interest expense increased by 2.1% to Kshs 5.8 bn, from Kshs 5.7 bn in Q3’2017, following a 5.4% increase in the interest expense on customer deposits to Kshs 4.9 bn, from Kshs 4.7 bn in Q3’2017. However, Interest expense on deposits and placements from banking institutions declined by 69.0% to Kshs 0.1 bn from Kshs 0.2 bn in Q3’2017. Furthermore, other interest expenses declined by 2.9% to Kshs 0.77 bn, from Kshs 0.79 bn in Q3’2017. As a result of the increase in interest expenses, the cost of funds increased to 3.4%, from 3.3% in Q3’2017. The Net Interest Margin (NIM) rose to 8.5%, from 8.1% in Q3’2017,
- Non-Funded Income (NFI) increased by 9.7% to Kshs 7.0 bn, from Kshs 6.4 bn in Q3’2017. Fees and commissions on loans rose by 66.7% to Kshs 0.2 bn, from Kshs 0.1 bn in Q3’2017. Other fees and commission income rose by 29.9% to Kshs 4.0 bn, from Kshs 3.1 bn in Q3’2017. Forex trading income increased by 10.9% to Kshs 2.1 bn, from Kshs 1.9 bn in Q3’2017. However, other income declined by 43.6% to Kshs 0.7 bn, from Kshs 1.3 bn in Q3’2017. As a result of the above performance, the current revenue mix shifted to 67:33 funded to non-funded income as compared to 68:32 in Q3’2017, with the NFI as proportion of total operating income slightly lower than the 34.8% industry average. The proportion of NII to total revenue decreased owing to the faster growth in NFI,
- Total operating expenses declined by 7.1% to Kshs 12.4 bn, from Kshs 13.3 bn in Q3’2017, largely driven by a 49.6% decrease in Loan Loss Provisions (LLP) to Kshs 1.9 bn in Q3’2018, from Kshs 3.7 bn in Q3’2017, coupled with a 1.9% decline in staff costs to Kshs 5.1 bn in Q3’2018, from Kshs 5.2 bn in Q3’2017. However, other operating expenses rose by 22.7% to Kshs 5.4 bn from Kshs 4.4 bn in Q3’2017,
- As a consequence, the Cost to Income Ratio (CIR) improved to 57.2%, from 66.0% in Q3’2017. However, without LLP, the cost to income ratio deteriorated to 48.5%, from 47.5% in Q3’2017,
- Profit before tax increased by 34.6% to Kshs 9.2 bn, up from Kshs 6.9 bn in Q3’2017. Profit after tax increased by 33.9% to Kshs 6.3 bn in Q3’2018, from Kshs 4.7 bn in Q3’2017,
- The balance sheet recorded a contraction as total assets decreased by 7.1% to Kshs 288.6 bn from Kshs 310.5 bn in Q3’2017. This decline was largely driven by a 6.1% decline in government securities to Kshs 107.2 bn, from Kshs 114.1 bn in Q3’2017, coupled with a 2.8% decline in the loan book to Kshs 111.0 bn, from Kshs 114.2 bn in Q3’2017,
- Total liabilities declined by 9.0% to Kshs 241.8 bn from Kshs 265.7 bn in Q3’2017, driven by an 8.0% decrease in total deposits to Kshs 219.5 bn from Kshs 238.5 bn in Q3’2017. Deposits per branch also decreased by 9.0% to Kshs 6.1 bn, from Kshs 6.6 bn in Q3’2017, with no new branches opened or closed. Placement liabilities increased by 9.8% to Kshs 4.1 bn from Kshs 3.7 bn in Q3’2017. The bank does not have any borrowed funds,
- The faster decline in deposits as compared to loans led to an increase in the loan to deposit ratio to 50.6%, from 47.9% in Q3’2017.The proportion of government securities to deposits also increased, to 48.8% from 47.8% in Q3’2017
- Gross Non-Performing Loans (NPLs) increased by 14.9% to Kshs 19.5 bn in Q3’2018, from Kshs 17.0 bn in Q3’2017. Consequently, the NPL ratio deteriorated to 15.6% in Q3’2018, from 13.4% in Q3’2017. General Loan Loss Provisions (LLPs) increased by 5.7% to Kshs 7.2 bn from Kshs 6.8 bn in Q3’2017. The NPL coverage declined marginally to 74.2% in Q3’2018 from 74.3% in Q3’2017, supported by the 25.5% increase in interest in suspense to Kshs 7.3 bn, from Kshs 5.8 bn in Q3’2017. The decline in the specific provisions despite a deterioration in asset quality, is due banks being allowed to charge provisions on equity, on the initial implementation of IFRS 9,
- Shareholders’ funds increased by 4.4% to Kshs 46.8 bn in Q3’2018 from Kshs 44.8 bn in Q3’2017, as retained earnings grew by 1.7% y/y to Kshs 31.0 bn from Kshs 30.4 bn, coupled with a 76.9% increase in the revaluation reserve to Kshs 0.7 bn from Kshs 0.4 bn in Q3’2017,
- Standard Chartered Bank Kenya Ltd remains sufficiently capitalized with a core capital to risk weighted assets ratio of 16.9%, 6.4% points above the statutory requirement. In addition, the total capital to risk weighted assets ratio was 19.0%, exceeding the statutory requirement by 5.3% points. Adjusting for IFRS 9, the core capital to risk weighted assets stood at 17.1%, while total capital to risk weighted assets came in at 20.1%, indicating that the bank’s total capital relative to its risk-weighted assets declined by 0.3% points due to implementation of IFRS 9,
- The bank currently has a Return on Average Assets (ROaA) of 2.8% and a Return on Average Equity (ROaE) of 18.6%.
Key Take-Outs:
- The bank had a deterioration in its quality, with the gross NPLs rising by 14.9% y/y, as the industry wide asset quality continues to deteriorate, sighting delayed government payments coupled with the relatively tighter macroeconomic environment, affecting borrowers’ credit servicing ability,
- The bank had a contraction in its balance sheet as the net loans and advances declined by 2.8%, and its customer deposits declined by 8.0% y/y. The decline in the bank’s core funding base, coupled with the bank’s stringent lending policies on asset quality concerns led to a decline in the bank’s lending activities, and,
- The bank managed to improve on its operational efficiency as the CIR improved to 57.2% from 66.0% in Q3’2017. However, this seems to have stemmed from a lower cost of risk on reduced provisioning, as the CIR without LLP deteriorated to 48.5%. This was due to a 22.7% increase in other operating expenses.
For more information, see our Standard Chartered Bank Kenya Ltd Q3’2018 Earnings Note
Diamond Trust Bank Limited released the Q3’2018 results:
Diamond Trust Bank Limited released the Q3’2018 results with core EPS growing by 10.0% to Kshs 20.2, from Kshs 18.3 in Q3’2017, which was in line with our projections of a 10.3% growth. Performance was driven by a 3.6% increase in total operating income to Kshs 19.0 bn, from Kshs 18.4 bn in Q3’2017, coupled with a 0.1% decline in total operating expenses to Kshs 10.8 bn, from Kshs 10.9 bn.
Highlights of the performance from Q3’2017 to Q3’2018 include:
- Total operating income increased by 3.6% to Kshs 19.0 bn, from Kshs 18.4 bn in Q3’2017. This was due to a 2.9% increase in Net-Interest Income (NII) to Kshs 14.9 bn, from Kshs 14.5 bn in Q3’2017, coupled with a 6.3% increase in Non-Funded Income (NFI) to Kshs 4.1 bn, from Kshs 3.9 bn in Q3’2017,
- Interest income increased by 3.0% to Kshs 26.5 bn from Kshs 25.7 bn in Q3’2017. This was driven by an 11.1% rise in Interest income on government securities, to Kshs 9.7 bn in Q3’2018 from Kshs 8.7 bn in Q3’2017. Interest income on loans and advances however declined by 1.5% to Kshs 16.5 bn from Kshs 16.8 bn in Q3’2017. The yield on interest earning assets declined to 10.8% in Q3’2018, from 11.4% in Q3’2017, due to the relatively faster growth in interest-earning assets by 8.7% to Kshs 341.7 bn, from Kshs 314.3 bn in Q3’2017, with the increase mainly driven by government securities that increased by 17.7% to Kshs 128.3 bn, from Kshs 109.0 bn in Q3’2017. The decline in the yield on interest earning assets also led to a decline in the Net Interest Margin to 6.1%, from 6.4% recorded in Q3’2017,
- Interest expense increased by 3.0% to Kshs 11.6 bn from Kshs 11.2 bn in Q3’2017, as interest expense on customer deposits increased by 1.2% to Kshs 10.3 bn from Kshs 10.1 bn in Q3’2017. Interest expense on deposits from other banking institutions increased by 60.2% to Kshs 628.5 mn, from Kshs 392.3 mn in Q3’2017. The cost of funds declined to 4.9% from 5.2% in Q3’2017, owing to the faster increase in interest-bearing liabilities by 8.1% to Kshs 324.1 bn, from Kshs 299.7 bn in Q3’2017, compared with the 3.0% increase in interest expense,
- Non-Funded Income increased by 6.3% to Kshs 4.1 bn from Kshs 3.9 bn in Q3’2017. The increase in NFI was driven by a 7.7% increase in fees and commissions on loans to Kshs 1.0 bn from Kshs 0.9 bn, coupled with a 7.2% increase in other fees and commission income to Kshs 1.6 bn from Kshs 1.5 bn in Q3’2017. Forex trading income also rose albeit marginally, by 2.8% to Kshs 1.19 bn from Kshs 1.16 bn in Q3’2017. The revenue mix shifted to 78:22 funded to non-funded income in Q3’2018 from 79:21 in Q3’2017, owing to the faster increase in NFI compared to NII,
- Total operating expenses declined marginally by 0.1% to Kshs 10.84 bn from Kshs 10.85 bn, largely driven by a 17.3% decline in loan loss provisions to Kshs 2.4 bn in Q3’2018 from Kshs 2.9 bn in Q3’2017, despite staff costs increasing by 4.3% to Kshs 3.1 bn in Q3’2018 from Kshs 3.0 bn in Q3’2017,
- The cost to income ratio improved to 56.9% from 59.1% in Q3’2017. Without LLP, however, the cost to income ratio deteriorated to 44.4% from 43.3% in Q3’2017,
- Profit before tax increased by 9.1% to Kshs 8.2 bn, up from Kshs 7.5 bn in Q3’2017. Profit after tax increased by 10.0% to Kshs 5.6 bn in Q3’2018 from Kshs 5.1 bn in Q3’2017,
- The balance sheet recorded an expansion with total assets recording a growth of 7.8% to Kshs 385.0 bn from Kshs 357.2 bn in Q3’2017. This growth was largely driven by a 17.7% increase in government securities to Kshs 128.3 bn in Q3’2018 from Kshs 109.0 bn in Q3’2017,
- The loan book expanded by 0.7% to Kshs 197.7 bn in Q3’2018 from 196.3 bn in Q3’2017,
- Total liabilities rose by 7.4% to Kshs 328.0 bn from Kshs 305.2 bn in Q3’2017, driven by a 6.5% increase in customer deposits to Kshs 282.2 bn from Kshs 265.1 bn in Q3’2017. Deposit per branch also grew by 6.5% to Kshs 2.0 bn from Kshs 1.9 bn, with no new branch openings/closures,
- The faster growth in deposits compared with loan growth led to a decline in the loan to deposit ratio to 70.0%, from 74.1% in Q3’2017. The proportion of government securities to deposits rose to 45.4% from 41.1% in Q3’2017,
- Gross non-performing loans declined by 1.4% to Kshs 16.3 bn in Q3’2018 from Kshs 16.6 bn in Q3’2017. Consequently, the NPL ratio improved to 7.7% in Q3’2018, from 8.0% in Q3’2017. General loan loss provisions increased by 40.8% to Kshs 9.3 bn from Kshs 6.6 bn in Q3’2017. As a result, the NPL coverage improved to 72.5% from 54.9% in Q3’2017,
- Shareholders’ funds increased by 11.0% to Kshs 51.9 bn in Q3’2018, from Kshs 46.7 bn in Q3’2017, driven by a 4.6% increase in retained earnings to Kshs 41.0 bn, from Kshs 34.6 bn in Q3’2017,
- DTB is currently sufficiently capitalized with a core capital to risk-weighted assets ratio of 17.8%, 7.3% points above the statutory requirement. In addition, the total capital to risk-weighted assets ratio was 19.1%, exceeding the statutory requirement by 4.6% points. Adjusting for IFRS 9, the core capital to risk weighted assets stood at 18.8%, while total capital to risk-weighted assets came in at 20.1%, indicating that the bank’s total capital relative to its risk-weighted assets declined by 1.0% points due to implementation of IFRS 9,
- DTB currently has a Return on Average Assets (RoAA) of 1.8% and a Return on Average Equity (RoAE) of 13.3%.
Key Take-Outs:
- The asset quality of DTB improved, with gross NPLs declining by 1.4% to Kshs 16.3 bn from Kshs 16.6 bn in the period under review, with the NPL ratio declining to 7.7% from 8.0% a year earlier. The 40.8% increase in the general loss provisions led to an improvement in the NPL coverage to 72.5%, due to the increase in the general loss provisions coupled with a 1.4% decline in non-performing loans.
- The bank managed to improve on its operational efficiency as the CIR improved to 56.9% from 59.1% in Q3’2017. However, this seems to have stemmed from a lower cost of risk on reduced provisioning, as the CIR without LLP deteriorated to 44.4 from 43.3% in Q3’2017.
For more information, see our Diamond Trust Bank Q3’2018 Earnings Note
Stanbic Bank Kenya released their Q3’2018 results:
- Profit after tax increased by 46.7% to Kshs 4.7 bn in Q3’2018, from Kshs 3.2 bn in Q3’2017. The performance was driven by a 14.1% increase in total operating income and a 3.7% decline in operating expenses,
- Total operating income increased by 14.1% to Kshs 15.9 bn, from Kshs 14.0 bn in Q3’2017, driven by a 9.7% increase in Net Interest Income to Kshs 8.5 bn in Q3’2018, from Kshs 7.8 bn in Q3' 2017, coupled with a 19.6% increase in Non-Funded Income to Kshs 7.4 bn, from Kshs 6.2 bn in Q3’2017,
- Interest income increased by 13.3% to Kshs 13.8 bn in Q3’2018, from Kshs 12.2 bn in Q3’2017. This was largely due to the interest income on loans and advances, which increased by 15.6% to Kshs 10.3 bn in Q3’2018, from Kshs 8.9 bn in Q3’ 2017. The yield on interest-earning assets dropped to 5.1% from 5.5% in Q3’2017,
- Interest expense increased by 19.7% to Kshs 5.3 bn from Kshs 4.4 bn in Q3’2017, following a 21.8% increase in the interest expense on customer deposits to Kshs 3.3 bn from Kshs 2.7 bn in Q3’2017 as well as the Interest expense on deposits and placements from banking institutions, which increased by 12.6% to Kshs 1.5 bn from Kshs 1.3 bn in Q3’2017. The cost of funds thus rose to 3.1%, from 2.6% in Q3’2017. Net Interest Margin declined to 6.2%, from 7.0% in Q3’2017
- Non-Funded Income (NFI) increased by 19.6% to Kshs 7.4 bn in Q3’2018 from Kshs 6.2 bn in Q3’2017. The growth in NFI was driven by a 56.9% increase in other income to Kshs 2.1 bn from Kshs 1.3 bn in Q3’2017, and a 9.4% increase in foreign exchange trading income to Kshs 2.3 bn from Kshs 2.1 bn in Q3’2017. Fees and commissions grew by 9.3% to Kshs 3.0 bn from Kshs 2.7 bn in Q3’2017. The current revenue mix stands at 53:47 funded to non-funded income in Q3’2018 from the 56:42 ratio recorded in Q3’2017, owing to a faster increase in NFI,
- Total operating expenses declined by 3.7% to Kshs 9.2 bn in Q3’2018 from Kshs 9.6 bn in Q3’2017, largely driven by a 44.9% decrease in the loan loss provision to Kshs 1.2 bn from Kshs 2.3 bn in Q3’2017, given that the non-performing loans increased by 13.9%, the decline in loan loss provision could possibly be attributed to the bank passing some of the provisions through the retained earnings as IFRS 9 allows this during the first year of implementation. The staff cost increased by 17.4% to Kshs 4.2 bn from Kshs 3.6 bn in Q3’2017,
- The cost to income ratio with LLP improved to 57.9% in Q3’2018 from 68.6% in Q3’2017. Without LLP, the Cost to income ratio also improved to 50.1% in Q3’2018 from 52.4% in Q3’2017,
- Profit before tax increased by 56.5% and stood at Kshs 6.7 bn, up from Kshs 4.2 bn in Q3’2017. Profit after tax increased by 46.7% to Kshs 4.7 bn in Q3’2018 from Kshs 3.2 bn in Q3’2017,
- The balance sheet recorded an expansion as total assets increased by 21.0% to Kshs 286.3 bn from Kshs 236.56 bn in Q3’2017. This growth was largely driven by a 16.3% increase in the loan book to Kshs 141.1 bn from Kshs 121.3 bn, and balances due from the Central Bank, which increased by 116.0% to stand at Kshs 19.2 bn from Kshs 8.9 bn in Q3’2017,
- Total liabilities rose by 23.7% to Kshs 253.2 bn from Kshs 204.6 bn in Q3’2017, largely driven by a 45.5% increase in borrowings to Kshs 12.3 bn in Q3’2018 from Kshs 8.5 bn in Q3’ 2017, and deposits that grew by 20.3% to Kshs 181.5 bn from Kshs 150.9 bn in Q3’2017. Other liabilities increased by 87.7% to Kshs 13.1 bn in Q3’2018 from Kshs 7.0 bn in Q3’2017,
- The faster increase in deposits as compared to the loans lead to the decrease in the loan to deposit ratio to 77.8% in Q3’2018 from 80.4% in Q3’2017.Government securities to deposits declined to 23.1% from 23.8 % in Q3'2017
- Gross non-performing loans increased by 13.9% to Kshs 10.6 bn from Kshs 9.3 bn in Q3’2017. The NPL ratio improved to 7.5% in Q3’2018 from 7.7% in Q3’2017, owing to a faster 16.3% growth in the net loans. General Loan Loss Provisions (LLPs) increased by 51.0% to Kshs 3.9 bn from Kshs 2.6 bn in Q3’2017. The NPL coverage thus improved to 60.6% in Q3’2018 from 43.0% in Q3’2017. The decline in the specific provisions despite a deterioration in asset quality is due banks being allowed to charge provisions on equity, on the initial implementation of IFRS 9,
- Shareholders’ funds increased by 3.8% to Kshs 33.1 bn in Q3’2018 from Kshs 31.9 bn in Q3’2017, largely due to the 7.6% increase in the retained earnings to Kshs 26.3 bn from Kshs 24.4 bn in Q3’2017,
- Stanbic Bank is currently sufficiently capitalized with a core capital to risk weighted assets ratio of 13.9%, 3.4% points above the statutory requirement. In addition, the total capital to risk weighted assets ratio was 16.9%, exceeding the statutory requirement by 2.4% points. Adjusting for IFRS 9, core capital to risk weighted assets ratio was at 14.8% while total capital to risk weighted assets was 17.7%, indicating that the bank’s total capital relative to its risk-weighted assets declined by 0.8% points due to the implementation of IFRS 9.
For more information, please see the Stanbic bank Q3’2018 Earnings Update
The summary of the performance is highlighted in the table below:
|
Bank |
Core EPS Growth |
Interest Income Growth |
Interest Expense Growth |
Net Interest Income Growth |
Net Interest Margin |
Non-Funded Income (NFI) Growth |
NFI to Total Operating Income |
Growth in Total Fees & Commissions |
Deposit Growth |
Growth In Govt Securities |
Loan Growth |
LDR |
Cost of Funds |
Return on Average Equity |
|
Stanbic Bank |
46.7% |
13.3% |
19.7% |
9.7% |
6.2% |
19.6% |
47.0% |
9.3% |
20.3% |
(17.6%) |
16.3% |
77.8% |
2.2% |
14.3% |
|
SCBK |
33.9% |
4.8% |
2.1% |
5.9% |
8.5% |
9.7% |
32.6% |
31.2% |
(8.0%) |
(6.1%) |
(2.8%) |
50.6% |
3.4% |
18.6% |
|
KCB Group |
19.7% |
5.1% |
16.0% |
1.8% |
8.5% |
2.6% |
33.1% |
(7.9%) |
6.2% |
15.3% |
3.8% |
82.6% |
3.2% |
21.7% |
|
DTB |
10.0% |
3.0% |
3.0% |
2.9% |
6.1% |
6.3% |
21.7% |
7.4% |
6.5% |
17.7% |
0.7% |
70.0% |
4.9% |
13.3% |
|
Co-op Bank |
8.2% |
3.5% |
0.7% |
4.7% |
8.3% |
4.3% |
32.7% |
(29.7%) |
2.5% |
16.9% |
(2.0%) |
85.9% |
3.8% |
17.6% |
|
Equity Group |
8.1% |
8.6% |
13.5% |
7.2% |
8.5% |
(6.7%) |
40.0% |
(1.7%) |
9.1% |
24.1% |
8.6% |
71.7% |
2.7% |
22.2% |
|
Barclays Bank |
2.0% |
7.7% |
30.1% |
2.1% |
9.1% |
14.0% |
30.8% |
5.5% |
9.9% |
29.5% |
6.7% |
81.0% |
3.1% |
16.5% |
|
Weighted Average Q3'2018* |
11.5% |
6.1% |
12.8% |
4.3% |
8.3% |
2.2% |
33.8% |
(5.2%) |
6.5% |
19.5% |
4.2% |
77.3% |
3.3% |
19.6% |
|
Weighted Average Q3'2017** |
(7.8%) |
(5.8%) |
0.0% |
(7.3%) |
8.7% |
11.3% |
34.3% |
12.5% |
13.9% |
10.4% |
5.8% |
76.0% |
3.3% |
18.2% |
|
*Weighted average as at 23rd November 2018 **Weighted average as at 23rd November 2017 |
||||||||||||||
Key take-outs from the table above include:
- The listed banks that have released results for Q3’2018 have recorded an 11.5% average increase in core Earnings Per Share (EPS), compared to a decline of 7.8% in Q3’2017. None of the banks that have released their results have recorded declines in core EPS. Stanbic Bank recorded the highest growth at 46.7% y/y, with Barclays Bank recording the slowest growth in core EPS, recording a 2.0% growth y/y,
- The sector is recording weaker deposit growth, which came in at 6.5%, slower than the 13.9% growth recorded in Q3’2017. Despite the slower deposit growth, interest expenses increased by 12.8%, indicating banks have been mobilizing expensive deposits. Thus, the cost of funds rose, albeit marginally to 3.29%, from 3.27%,
- Average loan growth was anemic coming in at 4.2%, which was lower than 5.8% recorded in Q3’2017, indicating that there was an even slower credit extension in the economy, due to sustained effects of the interest rate cap. Government securities on the other hand recorded a growth of 19.5% y/y, which was faster compared to the loans, and faster than 10.4% recorded in Q3’2017. This indicates that banks’ continued preference towards investing in government securities, which offer better risk-adjusted returns. Interest income increased by 6.1%, as banks adapted to the interest rate cap regime, with increased allocations in government securities,
- The average Net Interest Margin in the banking sector currently stands at 8.3%, down from the 8.7% recorded in H1’2017, despite the Net Interest Income by increasing 4.3% y/y. The decline was mainly due to the faster 19.5% increase in allocation to relatively lower yielding government securities, and,
- Non-funded Income grew by 2.2% y/y, slower than 11.3% recorded in Q3’2017. The growth in NFI was weighed down as total fee and commissions declined by 5.2%, slower than the 12.5% growth recorded in Q3’2017. The growth in fee and commission income continued to be subdued by the slow loan growth.
It is worth noting that some banks reduced their specific provisioning levels, even after experiencing a deterioration in asset quality. This is largely due to the fact that on implementation of IFRS 9, banks are allowed to charge an initial amount on their equity, hence reducing the specific provisioning demands for the quarter, even after the implementation of IFRS 9.
Universe of Coverage
Below is a summary of our SSA universe of coverage:
|
Banks |
Price as at 16/11/2018 |
Price as at 23/11/2018 |
w/w change |
YTD Change |
LTM Change |
Target Price* |
Dividend Yield |
Upside/Downside** |
P/TBv Multiple |
||||||||
|
NIC Bank*** |
23.0 |
22.8 |
(1.1%) |
(32.6%) |
(31.4%) |
48.8 |
4.4% |
118.9% |
0.6x |
||||||||
|
Diamond Trust Bank |
160.0 |
146.0 |
(8.8%) |
(24.0%) |
(23.2%) |
283.7 |
1.8% |
96.1% |
0.8x |
||||||||
|
Ghana Commercial Bank*** |
4.9 |
4.8 |
(2.2%) |
(5.1%) |
11.4% |
7.7 |
7.9% |
69.1% |
1.1x |
||||||||
|
I&M Holdings |
90.0 |
85.0 |
(5.6%) |
(33.1%) |
(32.5%) |
138.6 |
4.1% |
67.2% |
0.9x |
||||||||
|
KCB Group |
39.0 |
38.8 |
(0.6%) |
(9.4%) |
(10.4%) |
61.3 |
7.7% |
65.9% |
1.2x |
||||||||
|
Union Bank Plc |
5.1 |
5.1 |
0.0% |
(35.3%) |
(18.5%) |
8.2 |
0.0% |
61.4% |
0.5x |
||||||||
|
Zenith Bank*** |
24.0 |
24.0 |
0.0% |
(6.4%) |
(4.0%) |
33.3 |
11.3% |
50.1% |
1.1x |
||||||||
|
Equity Group |
39.3 |
39.0 |
(0.6%) |
(1.9%) |
(9.3%) |
56.2 |
5.1% |
49.2% |
1.9x |
||||||||
|
UBA Bank |
7.8 |
7.8 |
0.0% |
(24.3%) |
(20.8%) |
10.7 |
10.9% |
48.1% |
0.5x |
||||||||
|
Co-operative Bank |
14.1 |
14.2 |
0.4% |
(11.6%) |
(14.2%) |
19.9 |
5.7% |
46.3% |
1.2x |
||||||||
|
CAL Bank |
1.0 |
1.0 |
(4.0%) |
(11.1%) |
3.5% |
1.4 |
0.0% |
45.8% |
0.8x |
||||||||
|
Ecobank |
7.5 |
7.5 |
0.0% |
(1.3%) |
9.3% |
10.7 |
0.0% |
43.1% |
1.6x |
||||||||
|
CRDB |
150.0 |
150.0 |
0.0% |
(6.3%) |
0.0% |
207.7 |
0.0% |
38.5% |
0.5x |
||||||||
|
Access Bank |
7.7 |
7.4 |
(3.9%) |
(29.2%) |
(26.0%) |
9.5 |
5.4% |
33.8% |
0.5x |
||||||||
|
HF Group |
5.5 |
5.4 |
(0.9%) |
(48.1%) |
(53.8%) |
6.6 |
6.5% |
28.7% |
0.2x |
||||||||
|
Barclays |
11.6 |
11.0 |
(5.2%) |
14.1% |
10.1% |
12.5 |
9.1% |
23.3% |
1.5x |
||||||||
|
Stanbic Bank Uganda |
32.8 |
32.0 |
(2.6%) |
17.4% |
17.4% |
36.3 |
3.7% |
17.0% |
2.3x |
||||||||
|
SBM Holdings |
6.2 |
6.1 |
(0.6%) |
(18.4%) |
(19.5%) |
6.6 |
4.9% |
12.1% |
0.9x |
||||||||
|
Standard Chartered |
190.0 |
188.0 |
(1.1%) |
(9.6%) |
(14.2%) |
196.3 |
6.6% |
11.1% |
1.5x |
||||||||
|
Guaranty Trust Bank |
36.9 |
36.4 |
(1.4%) |
(10.7%) |
(13.3%) |
37.1 |
6.6% |
8.5% |
2.3x |
||||||||
|
Bank of Kigali |
280.0 |
290.0 |
3.6% |
(3.3%) |
1.8% |
299.9 |
4.8% |
8.2% |
1.6x |
||||||||
|
Bank of Baroda |
125.0 |
126.0 |
0.8% |
11.5% |
14.5% |
130.6 |
2.0% |
5.6% |
1.1x |
||||||||
|
Stanbic Holdings |
91.0 |
92.5 |
1.6% |
14.2% |
13.5% |
92.6 |
2.4% |
2.5% |
0.9x |
||||||||
|
Standard Chartered |
20.2 |
20.2 |
(0.1%) |
(20.1%) |
(7.6%) |
19.5 |
0.0% |
(3.6%) |
2.5x |
||||||||
|
FBN Holdings |
7.5 |
7.6 |
2.0% |
(13.6%) |
9.4% |
6.6 |
3.3% |
(9.5%) |
0.4x |
||||||||
|
National Bank |
5.8 |
5.8 |
(0.9%) |
(38.5%) |
(45.2%) |
4.9 |
0.0% |
(14.8%) |
0.4x |
||||||||
|
Stanbic IBTC Holdings |
48.0 |
49.0 |
2.1% |
18.1% |
21.0% |
37.0 |
1.2% |
(23.3%) |
2.5x |
||||||||
|
Ecobank Transnational |
15.8 |
15.8 |
0.0% |
(7.4%) |
(4.5%) |
9.3 |
0.0% |
(41.1%) |
0.6x |
||||||||
|
*Target Price as per Cytonn Analyst estimates **Upside / (Downside) is adjusted for Dividend Yield ***Banks in which Cytonn and/or its affiliates holds a stake. ****Stock prices indicated in respective country currencies |
|||||||||||||||||
We are “NEUTRAL” on equities for investors with a short investment horizon. However, pockets of value exist, with a number of undervalued sectors like Financial Services, which provide an attractive entry point for medium to long-term investors, and with expectations of higher corporate earnings supported by sectors such as banking sector, we are “POSITIVE” for investors with a long-term investment horizon.
UNICAF, the largest online higher education platform in Africa, announced a USD 28.0 mn Series B financing. The new investment round is led by Goldman Sachs, with other participants in the round being existing investors, including the UK Government's Development Finance Institution, CDC Group, leading higher education fund University Ventures, and the Educational Excellence Corporation Ltd (EDEX), the Founder of the University of Nicosia and UNICAF.
UNICAF was founded in 2012, with over 70 flexible online undergraduate and postgraduate degree program in fields like education, business and public health. UNICAF’s virtual learning involves using videos, podcasts, research articles, e-books, topic overviews and other interactive tools. The unique learning model is delivered using UNICAF's dynamic, mobile-friendly platform and blends online instruction with on-the-ground instructional centers and virtual coaching. The company has a physical presence in eight African countries; Zambia, Malawi, Uganda, Kenya, Ghana, Nigeria, Egypt, and Somalia. More than 16,000 students are currently enrolled through UNICAF in academic programs that lead to accredited undergraduate and postgraduate degrees awarded from UK, US, European and African universities. The funds are to meet the growing demand for high-quality university education across Africa. The new funding will enable UNICAF to grow enrolment to over 100,000 students, expand the program offering and open as many as five additional African campuses in the next five-years.
In Kenya, we have seen increased interest in the Education sector evidenced by the following investments in the sector;
- Advtech Group, a private education provider, listed in the Johannesburg stock exchange, which opened a school under its Crawford Schools brand in Tatu City on 4th September 2018, offering pre-primary education focusing on the THRASS (Teaching, Handwriting, Reading and Spelling Skills) curriculum,
- Nova Pioneer, a South African educator, has set up a primary school and a high school in Tatu city offering the 8-4-4 curriculum,
- Centum Limited, an investment firm, in partnership with Sabis Education Network, has set up the Sabis International School in Runda,
- Cytonn Investments, through its education affiliate Cytonn Education Services, will provide education at all levels. From Early Childhood Development Education (ECDE) to tertiary education, beginning with a technical college-branded Cytonn College of Innovation and Entrepreneurship,
- Advtech Group, Schole (Mauritius) Limited, a London based education provider, and Caerus Capital, a leading international education consultancy group jointly acquired Makini Schools at an estimated value of ZAR 184.2 mn (Kshs 1.7 bn), and,
- Fanisi Capital, a private equity and venture capital firm agreed to invest Kshs 400.0 mn in Kitengela International School (KISC) in September 2018.
The investments are an indication of investors’ interest in the education sector in Sub-Saharan Africa, which is motivated by;
- Increasing demand for quality and affordable education, according to The Business of Education in Africa report by Caerus Capital, the Gross Enrollment Ratio (GER) has doubled over the last ten years, from 4.5% in 2006 to 8.5% in 2016. According to World Bank fewer than 10% of potential students in Sub-Saharan Africa have access to higher education, making it the most underserved region in the world, a challenge compounded by rising demand as access to primary and secondary education increases, and,
- Support, such as ease of approvals, offered to investors in the education sector by governments looking to meet Sustainable Development Goals (SDGs) targets of universal access to education.
Private equity investments in Africa remains robust as evidenced by the increasing investor interest, which is attributed to; (i) rapid urbanization, a resilient and adapting middle class and increased consumerism, (ii) the attractive valuations in Sub Saharan Africa’s private markets compared to its public markets, (iii) the attractive valuations in Sub Saharan Africa’s markets compared to global markets, and (iv) better economic projections in Sub Sahara Africa compared to global markets. We remain bullish on PE as an asset class in Sub-Sahara Africa. Going forward, the increasing investor interest and stable macro-economic environment will continue to boost deal flow into African markets.
- Commercial Office Sector
Coca-Cola, a multi-national beverage company, intends to sell its Upperhill office, which been the company’s headquarters for the East and Central Africa Region since 2008, and relocate to newly built 90 James Gichuru office in Lavington, Nairobi. This is in line with its Vision 2020 on workplace agenda that aims at achieving a new modernized space built to suit the needs of a more agile, and fast paced business. According to the dailies, the 66,360 SQFT (6,165 SQM) office building in Upperhill, sitting on 4-acres of land, was constructed at a cost of Kshs 700 mn, which equates to Kshs 10,549 per SQFT, and is being currently valued at Kshs 1.03 bn, translating to a value of Kshs 15,521 per SQFT. This is 14.0% higher than the current market average price for office space in Upperhill at Kshs 13,386 per SQFT, according to Cytonn Research. We estimate that, at the current valuation of Kshs 15,521 per SQFT, a buyer would generate a 7.0% yield, assuming rental income at the current Upperhill market average of Kshs 100.0 per SQFT and occupancy of 90.1%. Given that commercial properties in Nairobi generate yields of 9.0%-10.0%, we are, therefore, of the view that the building may not be a good bargain at the proposed value. If the building is sold at the current market average price of Kshs 13,386 per SQFT, the exit value of the same would come in at Kshs 888.3 mn, and the buyer would generate a rental yield of 8.1%. To achieve a rental yield of 10.0%, at Upperhill average market rent and assuming 100% occupancy, an investor would buy at Kshs 12,000 per SQFT and thus the building would be sold at a value of Kshs 796.3 mn.
Below is our analysis showing the same;
|
All values in Kshs unless stated otherwise |
|||||
|
Coca- Cola Plaza Value Analysis |
|||||
|
|
Current Valuation |
Upperhill Market Price of Kshs 13,386 per SQFT |
10% Investor Yield at Upperhill Market Occupancy |
10% Investor Yield assuming 100% Occupancy |
|
|
Upperhill Avg Rent per SQFT |
100 |
100 |
100 |
100 |
|
|
Occupancy Rate |
90.1% |
90.1% |
90.1% |
100.0% |
|
|
Price Per SQFT |
15,521 |
13,386 |
10,812 |
12,000 |
|
|
Exit Value |
1.03 bn |
888.3 mn |
717.5 mn |
796.3 mn |
|
|
Investor Yield |
7.0% |
8.1% |
10.0% |
10.0% |
|
|
· We estimate that, at the current valuation of Kshs 15,521 per SQFT, a buyer would generate a 7.0% yield, assuming rental income at the current Upperhill market average of Kshs 100.0 per SQFT (exclusive of service charge) and occupancy of 90.1% · This is a low return compared to average market yields of 9.0%-10.0% for commercial properties, and we are, therefore, of the view that the building is not a good buy at the proposed value |
|||||
|
· Assuming the building is sold at the current market average price of Kshs 13,386 per SQFT, the exit value of the same would come in at Kshs 888.3 mn, and the buyer would generate a rental yield of 8.1% |
|||||
|
· To achieve a rental yield of 10%, at Upperhill average market rent and assuming 100% occupancy, an investor would buy at Kshs 12,000 per SQFT and thus the building would be sold at a value of Kshs 796.3 mn |
|||||
Source: Cytonn Research
The main risk factors for investors in the building include; i) the existing oversupply of office space, which stood at 4.7 mn SQFT in 2017 undermining the performance of the office sector, ii) traffic congestion along the key access routes to the Upperhill area, Mbagathi Way and Ngong Road, which continues to discourage businesses setting up offices in the area, and iii) unavailability of social amenities such as shopping malls in Upperhill, unlike other growing business nodes such as Westlands, Lavington and Karen. Given that the office sector is currently a buyer’s market, the seller is likely to accept lower bids for the building. The trend to exit Upperhill continues to gather pace after the recent exit by European Union and now Coca-Cola, this is mainly due to accessibility challenges in Upperhill.Source: Cytonn Research
City Clock chief, Tilman Wolfgang, has announced plans to develop a 12-floor office block along Riverside Drive in Westlands, Nairobi. The block, which is awaiting approval from the National Environment Management Authority (NEMA), will sit on a 0.85-acre parcel of land, and will bring to the market 164,440 SQFT of office and retail space, as well as a 5-floor basement parking area. This highlights the continued investor interest in development of commercial space in the Westlands node, and we attribute its attractiveness to i) the ease of accessibility given the good transport network, ii) availability of social amenities such as the Westgate Mall and Sarit Centre, and iii) relatively high returns with the average rental yield coming in at 10.0%, compared to the market average at 9.5%. According to Cytonn Q3’ 2018 Market Review, the Westlands Sub- market, of which Riverside Drive is part, recorded one of highest yields of 10.0% with an average occupancy of 89.0%, as properties in the area charge a relatively high asking rent of Kshs 111 per SQFT compared to the market average of Kshs 102 per SQFT. This is because it hosts several Grade A and high-quality Grade B offices, and thus tenants are willing to pay premium rates for both the quality of the offices and the prime location.
Below is a summary of the sub-markets analysis:
|
(All values in Kshs unless otherwise stated) |
||||||||||
|
Nairobi Commercial Office Performance by Nodes: Q3’2018 |
||||||||||
|
Nodes |
Price Kshs / SQFT Q3'2018 |
Rent Kshs/SQFT Q3’2018 |
Occupancy (%) Q3’2018 |
Rental Yield (%) Q3’2018 |
Price Kshs / SQFT Q2’2018 |
Rent Kshs/SQFT Q2’2018 |
Occupancy (%) Q2’2018 |
Rental Yield (%) Q2’2018 |
Q/Q Δ in Rents (%) |
Q/Q Δ in Yields (%) |
|
Karen |
12,888 |
117 |
89% |
10.8% |
13,776 |
118 |
87% |
10.2% |
-0.7% |
0.6% |
|
Westlands |
10,667 |
111 |
89% |
10.0% |
12,567 |
109 |
85% |
9.7% |
2.0% |
0.3% |
|
Parklands |
12,208 |
103 |
86% |
9.8% |
12,433 |
103 |
86% |
9.8% |
0.0% |
0.0% |
|
Kilimani |
13,031 |
101 |
87% |
9.6% |
12,694 |
101 |
85% |
9.4% |
0.0% |
0.2% |
|
Nbi CBD |
11,333 |
88 |
92% |
9.1% |
11,750 |
87 |
92% |
8.7% |
1.3% |
0.4% |
|
Upperhill |
13,386 |
100 |
90% |
9.0% |
12,708 |
101 |
86% |
9.0% |
-1.0% |
0.0% |
|
Msa Road |
11,750 |
82 |
71% |
8.7% |
11,770 |
83 |
68% |
8.6% |
-1.0% |
0.1% |
|
Thika Road |
11,750 |
85 |
89% |
8.7% |
11,500 |
85 |
80% |
8.7% |
0.0% |
0.0% |
|
Grand Average |
12,202 |
102 |
87% |
9.5% |
12,527 |
102 |
85% |
9.3% |
0.1% |
0.2% |
|
· Karen and Westlands recorded the highest yields of 10.8% and 10.0%, respectively, as properties in these areas charge the highest asking rents of Kshs 117 and Kshs 111 per SQFT, respectively. This is because they are regarded as prime locations with Grade A and high-quality Grade B offices, thus enabling the developers to charge premium rates |
||||||||||
Source: Cytonn Research
Given the existing oversupply of office space, which stood at 4.7 mn SQFT in 2017, we are of the view that increasing office space supply will result in increased competition thus constraining the performance of the sector. We therefore recommend adoption of differentiated concepts such as serviced offices with average rental yields of 13.4%, in Mixed-Use Developments and Green Buildings going forward. See our Focus Note on Mixed-Use Developments here
- Retail Sector
On the retail front, South African retailer, Shoprite, is set to take up space as an anchor tenant, at the proposed mall dubbed “The Beacon”, set to be built off Uhuru Highway towards Bunyala Roundabout, in Nairobi. The 306,771 SQFT mall will be a Mixed-Use Development (MUD) containing 261,563 SQFT of retail, food and beverage space, as well as a 45,208 SQFT 7-storey office tower overlooking the shopping center’s roof garden and bar, and is set to be complete by 2020, which in our opinion might not be achievable, given that the project is yet to be launched. Shoprite intends to take up approximately 43,055 SQFT of retail space at the mall, representing 14.0% booking at the project. This is part of the retailer’s ambitious plans to open 7 other stores in malls across Kenya, including; the Garden City Mall along Thika Road, the Westgate Mall in Westlands, and the City Mall in Mombasa. We continue to see international retailers coming into Kenya and expanding rapidly demonstrating the attractiveness of the sector. Some of the other retailers who have entered the market in the last 3-years include French retailer, Carrefour, Botswana-based retailer, Choppies and South African retailer, Game. In our view, their expansion into Kenya is supported by,
- Stable economic growth, with Kenya’s GDP growth averaging at 5.1% over the last five-years, and set to come in at 5.7% in 2018, according to Cytonn Research,
- Kenya’s improvement in ease of doing business rankings, with the World Bank Doing Business Report 2019 ranking the country #61, which is a rise in 19 ranks from #80 in the 2018 Report, mainly on account of the protection of minority investors, ease of getting credit, and ease of resolving insolvency, among others. For more information, see our Topical on the World Bank Doing Business Report 2019 here,
- The rising middle-class that has increased purchasing power as well as varying tastes and preferences for different goods and services, thus creating demand for international brands,
- The provision of high-quality spaces in line with international standards with the supply of formal retail space in Nairobi growing at a 2-year CAGR of 9.5% to 6.5 mn SQFT in 2018, with an estimated pipeline of 1.3 mn SQFT set to be complete by 2020, and,
- The exits of struggling retailers such as Nakumatt and Uchumi, vacating prime retail stores, thus creating an opportunity for other retailers to increase their foothold.
For developers and property managers, the entry of strong anchor tenants is an added advantage as it drives footfall into a mall, and this in turn, attracts other retailers. In our view, therefore, this will have a positive impact on the performance of retail real estate developments, where we currently estimate an oversupply of 2.0 mn SQFT. As per our last research, Cytonn’s Q3 2018 Market Review Report, retail developments in the Nairobi Metropolitan Area recorded an average rental yield of 9.4% with average occupancy rates of 83.7%. This is a 0.3% point’s decrease q/q in rental yields from the 9.7% recorded in Q2’2018 as a result of a 5.8% decrease q/q in rental charges attributed to increased competition due to increased supply that has led to developers decreasing rents to attract retailers.
We expect global retailers to continue showing interest in the Kenyan retail sector, mainly attracted by the rise in disposable incomes, change in consumer tastes & preferences, and fast economic growth enabled by infrastructural developments.
- Residential Sector
During the week, Centum Investment Company announced that it had signed agreements for residential units worth Kshs 1.2 bn at its Vipingo Estate in Kilifi County. This brings the total number of stand-alone units sold so far to 46 out of 152 units, which translates to 30.2% sales, and 100% booking of the 156 apartments in the first phase of the development. Vipingo Estate is part of the mixed use Vipingo Development sitting on 10,254-acres of land. It comprises of an industrial park that covers 250-acres, Palm Ridge residential apartments on 20-acres consisting of 1, 2 and 3-bedroom units, currently being sold at Kshs 2.3 mn, Kshs 3.5 mn and Kshs 4.6 mn, respectively, and Awali Estate on 30-acres, comprising of 3-bedroom maisonettes and bungalows, currently selling at Kshs 13.0 mn and Kshs 17.0 mn, respectively. We attribute the investor interest in the coastal location to its proximity to sandy beaches and the Vipingo airstrip making it ideal as a source of rental income from visiting tourists, affordability of the units to the middle class with the apartments prices ranging from Kshs 2.3 mn to Kshs 4.6 mn per unit, ease of accessibility through two main roads, Mombasa-Malindi Road, and Mariakani-Marueni Bypass and to Mombasa Town, which is situated approximately 35 km away.
Kilifi County, like Mombasa County, has seen an influx of real estate developments as investors aim to satisfy demand for housing by the growing coastal population and for accommodation by mid to long-term stay tourists. According to Cytonn’s report, Mombasa Investment Opportunity 2018 Report, residential properties in Mombasa generate an average rental yield of 4.4% and an average price appreciation of 2.5%, thus total returns of 6.9%. The best performing segment in the residential sector in 2018 is the upper mid-end sector, which recorded the highest returns to investors of 8.1% on average, that is, average rental yields of 5.5% and a capital appreciation of 2.6%, with investors in the region purchasing apartments in order to rent them to the growing middle class as well as long-stay visitors in the county.
Below is a summary of the residential sector performance for the Mombasa Market;
|
All values in Kshs unless stated otherwise |
||||||||
|
Mombasa Residential Sector- Segment Performance |
||||||||
|
Segment |
Average Price Per SQM |
Average Rent Per SQM |
Average Occupancy |
Average Annualized Uptake |
Average Rental Yield |
Average Price Appreciation |
Average Total Returns |
|
|
Upper Mid-End |
115,199 |
600 |
81.1% |
22.2% |
5.5% |
2.6% |
8.1% |
|
|
Lower Mid-End |
60,240 |
288 |
89.2% |
18.4% |
4.6% |
3.0% |
7.6% |
|
|
High-End |
174,102 |
637 |
61.2% |
15.3% |
3.1% |
1.8% |
4.9% |
|
|
Average |
116,514 |
508 |
77.2% |
18.6% |
4.4% |
2.5% |
6.9% |
|
|
• The upper mid-end segment recorded the highest average total returns to investors of 8.1%, attributable to the demand from the constantly growing middle class in the region particularly from the Asian families, evidenced by the relatively high annual uptake of 22.2% and average occupancy rates of 81.1%, in comparison to the high-end market average of 61.2% and 15.3%, respectively |
||||||||
Source: Cytonn Research
Other highlights during the week;
- Real estate developer, Superior Homes, has launched their gated retirement village in Athi River. The development, referred to as Fadhili Care, comprises of 1 and 2 bedroom cottages, sitting on 5-acres and is located within the developer’s Green Park Estate. The project targets the elderly seeking a retirement village concept, and is set to provide 24-hour care with a 24-hour ambulance, a clubhouse, medical care, resident team of nurses who will provide psychological, physiotherapy, and social home care services.
We expect continued increase in activities in the real estate sector driven by; i) continued demand for quality office spaces (Grade A and B), ii) continued entry and expansion of international retailers, and iii) positive demographics such as a high population growth rate of 2.6%, 1.4% point higher than global averages of 1.2%, and iv) the relatively high urbanization rate in Kenya at 4.4% compared to the global average of 2.1%, necessitating the need for adequate housing in the urban areas.
The year 2018 is shaping up to be a year of stable economic growth, with the economy recovering from the effects of the previous year that slowed down economic growth, including prolonged drought and the protracted electioneering period. Kenya is one of the fastest growing economies in the Sub-Saharan Africa region, with GDP growth expected to average 5.5% in 2018, an increase from the 4.9% GDP growth recorded in 2017. By contrast, the International Monetary Fund (IMF) estimates the Sub Saharan African average economic growth to average 3.8% in 2018, from 3.1% in 2017.The table below highlights the GDP growth expectations from different bodies;
|
Kenya 2018 Annual GDP Growth Outlook |
|||||
|
No. |
Organization |
Q1'2018 |
Q2'2018 |
Q3'2018 |
Q4'2018 |
|
1 |
Central Bank of Kenya |
6.2% |
6.2% |
6.2% |
|
|
2 |
Kenya National Treasury |
5.8% |
5.8% |
5.8% |
|
|
3 |
Oxford Economics |
5.7% |
5.7% |
5.7% |
|
|
4 |
African Development Bank (AfDB) |
5.6% |
5.6% |
5.6% |
|
|
5 |
Stanbic Bank |
5.6% |
5.6% |
5.6% |
|
|
6 |
Citibank |
5.6% |
5.6% |
5.6% |
|
|
7 |
International Monetary Fund (IMF) |
5.5% |
5.5% |
5.5% |
|
|
8 |
World Bank |
5.5% |
5.5% |
5.5% |
5.7% |
|
9 |
Fitch Ratings |
5.5% |
5.5% |
5.5% |
|
|
10 |
Barclays Africa Group Limited |
5.5% |
5.5% |
5.5% |
|
|
11 |
Cytonn Investments Management Plc |
5.4% |
5.5% |
5.5% |
|
|
12 |
Focus Economics |
5.3% |
5.3% |
5.3% |
|
|
13 |
BMI Research |
5.3% |
5.2% |
5.2% |
|
|
14 |
The Institute of Chartered Accountants in England and Wales |
|
5.6% |
5.6% |
|
|
15 |
Standard Chartered |
4.6% |
4.6% |
4.6% |
|
|
|
Average |
5.5% |
5.5% |
5.5% |
5.7% |
In this weekly focus, we seek to review the performance of economic environment in Kenya, the fiscal and monetary policies in place, as well as other factors affecting the country’s economic growth and our view on the way forward. As such, we shall discuss the following items:
- Analysis of the economy, where we shall examine the Gross Domestic Product (GDP) growth for the first half of the year, in comparison with last year’s economic performance,
- A review of the fiscal and monetary policies in place, and how they have contributed to economic growth during the review period. Here, we shall look at factors such as interest rates, public debt, private sector credit growth and the recent tax reforms,
- Other factors affecting the economic environment, including socio-political issues, ease of doing business, security and investor sentiment, and,
- Our view and way forward.
Section I: Economic Overview
The country's Gross Domestic Product (GDP), adjusted for inflation, has been on the rise in 2018 having expanded by 5.7% in Q1’2018 and 6.3% in Q2’2018, higher than the 4.8% and 4.7% growth in similar periods the previous year, respectively. The improved growth has been against a backdrop of a stable macroeconomic environment, driven by:
A recovery in agriculture, which saw the sector record a growth of 5.2% and 5.6% in Q1’2018 and Q2’2018, respectively, due to improved weather conditions. In terms of sectoral contribution, agriculture remains the highest contributor coming in at 25.5% and 23.2% in Q1’2018 and Q2’2018, respectively,Improved business and consumer confidence, evidenced by the Stanbic Bank’s Monthly Purchasing Managers Index (PMI), which has averaged 54.5 in the 10-months to October 2018, a rise from 46.4, recorded in a similar period in 2017. Key to note, a PMI reading of above 50 indicates improvements in the business environment, while a reading below 50 indicates a worsening outlook. The improvement in the business environment has also been facilitated by the improved ease of doing business, which saw Kenya’s rank improved by 19 positions to #61 from #80 as per the World Bank Doing Business Report 2019 as highlighted in our Analysis of Kenya’s Doing Business Environment. This was mainly driven by improvements in protection of minority investors, getting credit and resolving insolvency, and,Increased output in the real estate, manufacturing, and wholesale & retail trade sectors, which grew by 6.6%, 3.1% and 7.7%, respectively, and favorable weather conditions that positively affected output from agricultural and hydroelectricity activities.
Analysis by sector showed that there was accelerated growth in the manufacturing sector, though the major concern was on its declining sectoral contribution to GDP, recording a 9.6% contribution in both quarters from 9.9% in Q2’2017. This is despite the Kenyan Government singling it out as one of the key pillars to drive the economy in the Big 4 Agenda. The sector’s contribution is still way below the government’s target of increasing it to 15.0% of GDP by 2022, which is expected to increase manufacturing sector jobs by more than 800,000 per annum over the next four years.
Section II: Review of the Fiscal and Monetary Policy
In this section, we examine the monetary and fiscal policies put in place by the Central Bank as well as the Treasury, and how they affected macroeconomic fundamentals in the country.
- Fiscal Policy
Kenya’s fiscal policy has been expansionary over the years as the country’s economic growth is mainly reliant on government spending, which has seen the expenditure side exceeding the revenue collections, leading to the budget deficits, which have been plugged in by borrowing. In the FY’2018/2019 budget, the government was keen on fiscal consolidation as a key agenda in order to narrow the fiscal deficit to 5.7% of GDP, from the 6.8% recorded in FY’2017/2018, which was below the 7.2% target; and in effect stabilize the Debt-to-GDP ratio (currently at 52.2%) to below 50.0%. The government aimed to implement this through revenue enhancement measures in the form of introduction of new tax policies that included:
- The introduction of 8.0% VAT on petroleum products, which was lowered from the planned 16.0%, as from September 2018,
- The Housing Development Fund Levy that requires workers in formal employment to submit 0.5% of their gross salary towards a National Fund for Affordable Housing, with employers required to match employee’s contribution,
- Increase in excise tax on mobile money transactions to 12.0% from 10.0%,
- Increase in excise duty for cars above 2,500cc to 30.0% from 20.0%, and,
- Capital gains tax of 5.0% on property transfers by insurance firms.
The Government also aimed at strengthening expenditure control and improving the efficiency of public spending through public financial management reforms and various austerity measures. This was in a bid to free fiscal space for priority social and economic projects, such as the affordable housing and universal healthcare initiatives.
According to the Q1’2018/2019 budget outturn numbers, the government managed to meet 83.5% of its revenue target, with the main issue having been the delay of implementation of the new tax measures. The expenditure side however, continued to grow faster, recording a 9.8% growth, compared to the 5.9% growth in revenue collection, but lower than the targeted Kshs 502.9 bn, with the government spending Kshs 452.5 bn, which was 90.0% of its budget. The faster growth in expenditure compared to the revenues led to widening of the fiscal deficit to Kshs 82.9 bn, or 0.8% of GDP in Q1’2018/2019, from Kshs 65.1 bn, translating to 0.7% of GDP in Q1’2017/2018. This, in effect, has led to increased total government borrowing, both foreign and domestic to plug in the deficit, with domestic borrowing having increased by 40.7% to Kshs 69.2 bn from Kshs 49.2 bn in Q1’2017/2018, while foreign borrowing has increased by 124.0% to Kshs 16.8 bn, from Kshs 7.5 bn in Q1’2017/2018.
According to the Treasury, the gross public debt as at 30th September 2018 was Kshs 5.0 tn as compared to Kshs 4.5 tn as of 30th September 2017, with external debt comprising 52.0% (Kshs 2.6 tn) and domestic debt taking up 48.0% of the total debt (Kshs 2.4 tn) by end September 2018. Of the external debt obligations, 30.6% is owed to bilateral institutions; 35.4% to multilateral institutions, and 33.3% and 0.7% of debt owed to commercial banks and suppliers’ credit, respectively. The Debt-to-GDP ratio as at FY’2017/2018 increased to 52.2%, from 47.9% in FY’2016/2017, attributed to external loan disbursements and the uptake of domestic debt during the period. This led to the International Monetary Fund (IMF) raising the risk of Kenya’s debt distress from low to moderate in October 2018. We maintain our view that, in order to reduce our debt levels in line with the IMF sustainable levels, the government should consider achieving:
- Enhanced tax revenue collection growth by increasing the tax base as well as introducing Value Added Tax (VAT) on fuel products,
- Involve private sector in development through Public-Private Partnerships (PPP’s), and,
- Reduce recurrent expenditure and improve on development budget absorption rates.
2. Monetary Policy
On the monetary policy front, the direction this year has been expansionary, with the Monetary Policy Committee having lowered the Central Bank Rate (CBR) twice, in the 5 meetings held so far in order to support economic activity, citing that economic output was below its potential level, and there was room for further accommodative monetary policy. During their meeting in March 2018, the MPC lowered the CBR to 9.5% from the earlier 10.0% that had been set in September 2016. The MPC later lowered the CBR by another 50 bps during their July 2018 meeting to 9.0%, from the 9.5% set in March 2018. The decision by the MPC to lower the CBR this year has mainly been guided by:
- Inflation: Inflationary pressure has been relatively muted in 2018, with y/y inflation having averaged 4.5% in the 10-months to October, down from 8.7% recorded in a similar period in 2017, and well within the 2.5% - 7.5% government set target. The decline has mainly driven by a decline in the food prices on the back of improved food production due to improved weather conditions, which has mitigated the rise in fuel prices and other Consumer Price Index (CPI) components. Inflation in the remaining part of the year is expected to experience upward pressure due to the various tax amendments as per the Finance Bill 2018, but at a lower rate than earlier anticipated. This is due to the reduction of the VAT charge on fuel to 8.0% from 16.0% effective 21st September 2018, affirming our expectations of a 7.0% inflation rate for the year from 8.0% last year, averaging within the government’s set target of 2.5% - 7.5%.
- Exchange Rates and Forex Reserves: The Kenya Shilling remained relatively stable during the year, which saw the IMF reclassifying Kenya from a floating arrangement to stabilized arrangement, in their Annual Report on Exchange Arrangements and Exchange Restrictions released on 30th April 2018. The classification of the arrangement is primarily based on the degree to which the exchange rate is determined by the market rather than by official action. For a country to be classified as a stabilized arrangement, the market exchange rate should remain within a margin of 2.0% for 6-months or more with respect to a single currency or a basket of currencies, thus showing the stability of the Kenyan Shilling. Against the US Dollar, the exchange rate has remained relatively stable, exchanging at Kshs 103.2 in November 2018 from Kshs 103.7 in November 2017. The stability is on the backdrop of strong inflows from coffee and horticultural exports, resilient diaspora remittances as well as improved receipts from services such as tourism. The volatility of the Kenyan Shilling has also been cushioned by Central Bank’s efforts to pump dollars into the market, which has seen the forex reserves decline by 4.4% to USD 8.1 bn, from USD 8.4 bn since the last MPC meeting in September 2018. Despite the decline, forex reserves remain high with an average of 5.1 months of import cover, well above the optimal level of reserves for Kenya as per the IMF, set at 3.5-months of import cover. The ongoing prospects of the Treasury issuing another Eurobond could also eliminate the need for tightening the monetary policy, as it will enhance the forex reserves, thus cushioning the shilling.
- Private Sector Credit Growth: Private sector credit growth has started picking up, albeit slowly, attributed to constrained access to credit since the implementation of the interest rate caps. Despite the recommendations by the IMF, as well as lobbying by the National Treasury for the repeal of the interest rate cap law, the National Assembly voted to retain the cap on borrowings at 4.0% above the Central Bank Rate (CBR) and only scrapped off the minimum rate on deposits. The legislators cited that that there was no justification for the repeal the interest rate cap, as there was no effort by banks to address the issue of high credit risk pricing. Despite this, private sector credit growth has remained unchanged at 4.3% since July to September 2018. This has been the highest growth rate since December 2016. Sectoral credit growth analysis, according to the Treasury, indicates that lending to manufacturing sector grew by 12.1%, while credit growth to the building and construction sector was 11.3%. Credit expansion to the consumer durables and financial/insurance sectors was at 7.9% and 6.6%, respectively. We expect private sector credit to pick up gradually as the economy continues to recover, despite the retention of the interest rate caps in the recently passed Finance Bill 2018.
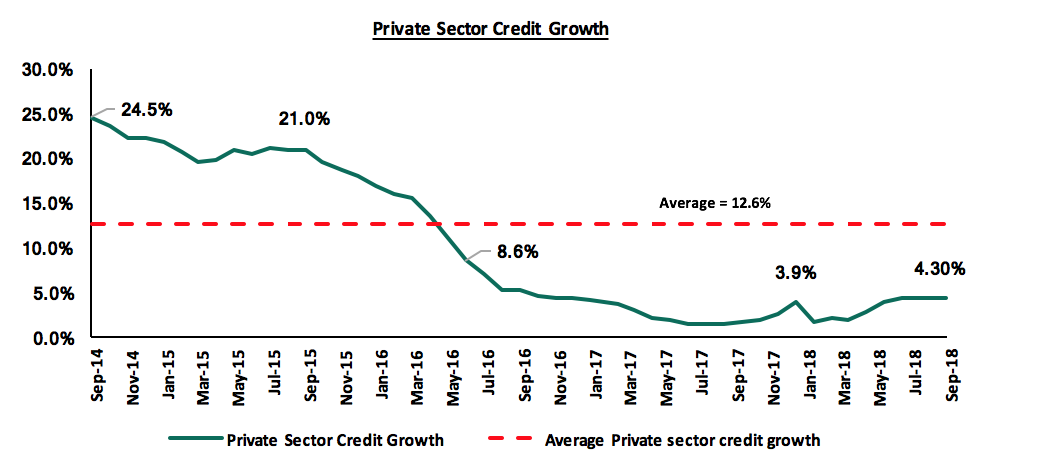
The key concern however remains the effectiveness of monetary policy with the interest rate cap still in place.
Section III: Other Factors That Affect Economic Growth
- Socio-Political Environment - The year 2017 was characterized by, among other factors, a protracted electioneering period that negatively affected economic growth due to the political unrest that ensued. Real GDP expanded by 4.9%, compared to 5.9% for FY’2016. The economy has since been on a recovery trajectory, with real GDP expanding by 6.3% in Q2’2018, compared to 4.7% in Q2’2017. With the next elections slated for 2022, we expect the economy to continue its recovery due to political stability evidenced by the handshake between the President and the opposition leader, thereby improving confidence in the government’s agenda of implementing economic reforms.
- Ease of Doing Business - The World Bank Group released the Doing Business 2019 Report, noting that Kenya’s ranking improved by 19 positions to #61 from #80 in the 2018 Report, out of 190 countries ranked. In addition, Kenya maintained its 4thposition in Africa from last year’s report after Mauritius, Rwanda and Morocco, and the score improved by 5.1 points to 70.3, from 65.2 in the previous report. The main drivers for improvement included protection of minority investors, access to credit, and insolvency resolution. For more information, see our weekly focus on Analysis of Kenya’s Doing Business Environment.
- Investor Sentiment - Yields on the Kenyan Eurobonds have been on the rise during the year. The yield on the 2014 issues rose by 190 bps and 230 bps for the 5-year and 10-year Eurobonds issued in 2014, respectively; while the yields on the 10-year and 30-year Eurobonds issued in 2018 have risen by 140 bps and 130 bps, respectively, since the issue date. The rising yield on all the Eurobonds signals higher country risk perception and declined investor sentiments by investors, partly attributed to International Monetary Fund (IMF) raising the risk of Kenya’s debt distress from low to moderate on October, resulting in investors demanding a higher return for the risk. The increased yields have also been attributed to the monetary stance adopted by the Federal Reserve, having hiked the Federal Rate twice this year, currently at 2.0% - 2.25%. This has led to market correction in Eurobond yields in the emerging markets. More recently, global investors have been shunning risky assets in broader emerging markets, prompting net sell-offs as foreign investors exited the local markets. This has been due to fears of a global economic slowdown and an aggressive monetary stance adopted by the Federal Reserve Bank of the US.
- Security - The political climate in the country has eased, with security maintained and business picking up. The handshake between the Kenyan President and the opposition leader served to calm any political tension. Kenya recently commenced direct flights to and from the USA, which is a sign of improving security in the country. We expect security to be maintained in 2018, especially given that there is relative calm as the two principals, alongside other legislators across the political divide, work together towards combating corruption and promoting economic transformation agenda.
Section IV: Conclusion
The table below shows the macro-economic indicators that we track, indicating our expectations for each variable
|
Macro-Economic & Business Environment Outlook |
||||||
|
Macro-Economic Indicators |
2018 Expectations at Beginning of Year |
YTD 2018 Experience |
Going Forward |
Outlook - Beginning of Year |
Current Position |
|
|
Government Borrowing |
Government to come under pressure to borrow as it is well behind both domestic and foreign borrowing targets for FY 2017/18, and KRA is unlikely to meet its collection target due to expected suppressed corporate earnings in 2017 |
i. The government surpassed its domestic borrowing target for the 2017/18 fiscal year, having borrowed Kshs 390.2 bn against a target of 297.6 bn |
With the interest rate cap still in place, we do not expect upward pressure on interest rates. However, with National Assembly against a complete repeal and The Draft Financial Markets Conduct Bill, 2018 having not addressed the issue of the interest rate cap, we are positive on government borrowing. |
Negative |
Positive |
|
|
Exchange Rate |
Currency projected to range between Kshs 102.0 and Kshs 107.0 against the USD in 2018. With the possible widening of the current account deficit being a possible point of concern, we expect the CBK to continue to support the Shilling in the short term through its sufficient reserves of USD 8.1 bn (equivalent to 5.3-months of import cover) |
The Shilling has eroded all the YTD gains it had made against the US Dollar, exchanging at Kshs 103.2. |
The government projects the current account deficit to narrow to 5.4% of GDP in 2018 due to lower food and SGR imports. |
Neutral |
Neutral |
|
|
Interest Rates |
Upward pressure expected on interest rates, especially in the first half of the year, as the government falls behind its borrowing targets for the fiscal year. However, with the Banking (Amendment) Act, 2015, the MPC might be unable to do much with the CBR which has remained at 10.0% throughout 2017 |
The MPC met on 28th May 2018 and maintained the CBR at 9.5 citing that the impact of the 50 bps reduction in March had not yet been fully transmitted to the economy, despite there being room for monetary policy easing to further support economic activity |
The interest rate environment is expected to remain relatively stable with the CBK not accepting |
Neutral |
Neutral |
|
|
Inflation |
Inflation expected to average 7.5% compared to 8.0% last year |
Inflation has averaged 4.4% in the 9 months to September 2018, from 9.0% over a similar period in 2017. The year on year inflation rate for the month of September rose to 5.7% from 4.0% in August, driven by the introduction of the 8.0% VAT on petroleum products. |
Inflation in FY’2018 is expected to experience upward pressure, partly due to the base effect, and the rise in fuel and transport prices with the introduction of 8.0% VAT on petroleum products as from September 2018. |
Positive |
Positive |
|
|
GDP |
GDP growth projected to come in at between 5.3% - 5.5% |
Kenya’s economy grew by 6.3% in Q2’2018, compared to 4.7% in Q2’2017. The consensus GDP growth projection for Kenya in 2018 is at 5.5% (an average taken from 15 research firms, global agencies and government organizations projections), which is an improvement from the GDP growth experienced in 2017 |
GDP growth is projected to come in between 5.4% - 5.6% in 2018 driven by recovery of growth in the agriculture sector, continued growth in the tourism, real estate and construction sectors, and growth in the manufacturing sector |
Positive |
Positive |
|
|
Investor Sentiment |
Investor sentiment expected to improve in 2018 given the now settling operating environment after conclusion of the 2017 elections |
The Kenya Eurobond yields have been increasing, with the yields on the 2014 Eurobond issue rising by 190 bps and 230 bps YTD for the 5-year and 10-year Eurobonds, while the yields on the 10-year and 30-year Eurobonds issued in 2018 have risen by 140 bps and 130 bps, respectively, since the issue date. There has also been increased sell-offs by foreign equity investors amid fears of global economic slowdown, coupled with rising US Treasury yields. |
Given (i) the now settling operating environment following the elections in Q3’2017, (ii) the increased sell-offs by foreign investors in the equity markets due to rising bond yields in the US, and (iii) expectations of a relatively stable shilling, we still expect investor sentiment to improve in 2018 |
Positive |
Neutral |
|
|
Security |
Security expected to be maintained in 2018, especially given that the elections were concluded and the USA lifted its travel warning for Kenya, placing it in the 2nd highest tier of its new 4-level advisory program, indicating positive sentiments on security from the international community |
The political climate in the country has eased, compared to Q3’2017 with security maintained and business picking up. Kenya now has direct flights to and from the USA, a signal of improving security in the country |
We expect security to be maintained in 2018, especially given that the elections are now concluded, the government has settled into office, and the country's two principals are working together towards growing the economy |
Positive |
Positive |
|
Out of the seven areas that we track, four have a positive outlook while three factors have a neutral outlook, compared to the beginning of the year where four had a positive outlook, two had a neutral outlook and one factor had a negative outlook. Therefore, in conclusion, we expect macroeconomic fundamentals to remain positive because of an improved business environment created through political goodwill and improved security in the country.
Disclaimer: The Cytonn Weekly is a markets report published by Cytonn Asset Managers Limited, “CAML”, which is regulated by the Capital Markets Authority. CAML is also an affiliate of Cytonn Investments Management Plc. However, the views expressed in this publication are those of the writers where particulars are not warranted. This publication, which is in compliance with Section 2 of the Capital Markets Authority Act Cap 485A, is meant for general information only and is not a warranty, representation, advice or solicitation of any nature. Readers are advised in all circumstances to seek the advice of a registered investment advisor.

- Talk to us
- Kenya
- P.O Box 20695 - 00200, Nairobi, Kenya
- Cell +254709101200
- Tel +254709101200
- WhatsApp +254741676635
- United States
- +254709101200
- DOWNLOAD OUR APP
-


- Kenya
- 8th Floor, Pinetree Plaza, Kaburu Drive, Ngong Road, Nairobi, Kenya
- USA
- Suite 1150, 1775 Eye Street NW, USA, Washington DC 20006, USA
- Investments
- High Yield
- Private Equity
- Real Estate
- Real Estate
- RiverRun Estates
- Cytonn Towers
- The Ridge
- Taraji Heights
- The Alma