
Kenya H1’2026 Listed Insurance `Report & Cytonn Weekly #44.2026
By Research Team, Nov 8, 2026
Executive Summary
Fixed Income
During the week, T-bills were oversubscribed for the fourteenth consecutive week, with the overall subscription rate coming in at 241.8% higher than the subscription rate of 185.2% recorded the previous week. Investors’ preference for the shorter 91-day paper persisted, with the paper receiving bids worth Kshs 34.5 bn against the offered Kshs 8.0 bn, translating to a subscription rate of 431.2% significantly lower than the subscription rate of 507.9%, recorded the previous week. The subscription rates for the 182-day and 364-day papers increased to 218.9% and 113.1%, from 53.2% and 59.1% recorded the previous week, respectively. The government accepted a total of Kshs 53.1 bn worth of bids out of Kshs 67.7 bn bids received, translating to an acceptance rate of 78.5%. The yields on the government papers showed a mixed performance, with the yield on the 91-day paper increasing by 0.02 bps to remain relatively unchanged at 8.8% recorded the previous week, while the yields on the 182-day and 364-day papers decreased by 0.6 bps and 0.1 bps, respectively, to remain relatively unchanged at 8.9% and 9.0% respectively, recorded the previous week;
During the week, the CBK released the auction results for the re-opened treasury bonds FXD3/2019/015 and FXD1/2026/030 with tenors to maturities of 7.8 years and 29.5 years respectively and fixed coupon rates of 12.3% and 12.5% respectively. The bonds were oversubscribed, with the overall subscription rate coming in at 198.9%, receiving bids worth Kshs 99.5 bn against the offered Kshs 50.0 bn. The government accepted bids worth Kshs 70.9 bn, translating to an acceptance rate of 71.2%. The weighted average yield for the accepted bids for the FXD3/2019/015 and FXD1/2026/030 came in at 12.7% and 14.1% respectively. Notably, the yield on FXD3/2019/015 remained unchanged at 12.7% from the last reopening in October 2026 while the 14.1% yield on the FXD1/2026/030 was marginally lower than the 14.2% recorded at the last reopening in October 2026. With the Inflation rate at 7.3% as of October 2026, the real returns of the FXD3/2019/015 and FXD1/2026/030 are 5.4% and 6.8% respectively. Given the 10.0% withholding tax on the bonds, the tax equivalent yields for shorter term bonds with 15.0% withholding tax are 13.4% for FXD3/2019/015 and 14.9% for FXD1/2026/030;
During the week, Stanbic Bank released its monthly Purchasing Manager’s Index (PMI), indicating that Kenya's Purchasing Managers' Index (PMI) improved by 1.2 points to 52.5 in October 2026, from 51.3 in September 2026;
During the week, Kenya’s balance of payment (BoP) surplus narrowed by 74.2% in Q2’2026, to Kshs 40.6 bn, from a surplus of Kshs 157.0 bn in Q2’2025. The y/y narrowing of the BoP surplus was mainly driven by the 264.1% widening of the current account deficit to Kshs 252.5 bn from Kshs 69.4 bn in Q2’2025 and the 66.2% decline in the capital account surplus to Kshs 6.0 bn from Kshs 17.6 bn, which outweighed the 23.9% increase in net financial inflows to Kshs 244.1 bn from Kshs 197.0 bn;
Equities
During the week, the equities market was on an upward trajectory, with the NSE 10, NSE 25, NSE 20, and NASI increasing by 2.9%, 2.7%, 2.2%, and 0.7% respectively, taking their YTD performance to gains of 33.3%, 32.9%, 31.5%, and 28.0% respectively for NSE 20, NSE 10, NSE 25 and NASI respectively. The week-on-week equities market performance was mainly driven by gains recorded by large-cap stocks such as DTBK, Equity and KCB of 5.4%, 4.2% and 4.1% respectively. The performance was however weighed down by losses recorded by large-cap stocks such as Standard Chartered Bank Kenya, and EABL of 0.5% and 0.3% respectively;
During the week, the banking sector index increased by 3.0% to 279.8 from the 271.5 recorded the previous week. This is attributable to gains recorded by large cap stocks such as DTBK, Equity and KCB of 5.4%, 4.2% and 4.1% respectively. The performance was however weighed down by losses recorded by large-cap stocks such as SCBK of 0.5% respectively;
During the week, equities turnover increased by 3008.1% to USD 846.7 mn from USD 27.2 mn recorded the previous week, taking the YTD total turnover to USD 4,317.3 mn. Foreign investors became net buyers for the first time in five weeks with a net buying position of USD 820.2 mn, from a net selling position of USD 6.8 mn recorded the previous week, taking the YTD foreign net buying position to USD 622.6 mn, compared to a net selling position of USD 92.9 mn recorded in 2025;
During the week, Safaricom Plc released its H1’2027 financial results for the period ending 30th September 2026, highlighting that the profit after tax (PAT) for the Group increased by 72.5% to Kshs 50.4 bn, from 29.2 bn recorded in H1’2026, largely attributable to a 14.2% increase in Total Revenue to Kshs 233.7 bn from Kshs 204.7 bn recorded in H1’2026, which outpaced the 1.0% increase in operating costs to Kshs 104.5 bn in H1’2027 from Kshs 103.4 bn in H1’2026;
During the week, the Quick Mart PLC (Quickmart) IPO results were released, showing that the offer was 122.7% subscribed, hence oversubscribed by 22.7%, with investors subscribing for 2.5 bn shares worth Kshs 18.4 bn against 2.0 bn shares worth Kshs 15.0 bn offered at Kshs 7.50 per share. The IPO offered 50.0% of the company’s stake to the public by way of an Offer for Sale by Sokoni Retail Kenya Limited and is set to be listed on the NSE’s Main Investment Market Segment on 12th November 2026;
Real Estate
During the week, the Capital Markets Authority (CMA) proposed reducing the minimum subscription for Real Estate Investment Trusts (REITs) from Kshs 5.0 mn to Kshs 100,000.0 per investor, alongside lower conversion fees of Kshs 150,000.0 and a reduced public shareholding threshold, a development expected to broaden retail participation and support the role of REITs in the Government’s affordable housing agenda.
On the Unquoted Securities Platform Acorn D-REIT and I-REIT traded at Kshs 29.7 and Kshs 24.4 per unit, respectively, as per the last updated data on 30th October 2026. The performance represented a 48.5% and 22.0% gain for the D-REIT and I-REIT, respectively, from the Kshs 20.0 inception price. The volumes traded for the D-REIT and I-REIT came in at 13.7 mn and 46.0 mn shares, respectively. Additionally, ILAM Fahari I-REIT traded at Kshs 13.8 per share as of 30th October 2026, representing a 31.0% loss from the Kshs 20.0 inception price. The volume traded came in at 1.2 mn shares;
Digital Payments
During the week, Mastercard Incorporated announced its support for the launch of Samsung Pay in Morocco, enabling eligible Mastercard cardholders at participating banks to make tokenized mobile payments on compatible Samsung devices, in line with its global ambition to tokenize 100% of online transactions by 2030;
During the week, Circle Internet Group, Inc. reported third-quarter 2026 total revenue and reserve income which increased by 16.9% to USD 864.9 mn from USD 739.8 mn, including USD 182 mn from the ARC token presale, while net income from continuing operations increased by 5.4% to USD 226.0 mn from USD 214.4 mn;
During the week, Global Payments Inc. reported third-quarter 2026 adjusted earnings per share which increased by 9.8% to USD 3.58 from USD 3.26, while GAAP diluted EPS decreased by 59.8% to USD 1.06 from USD 2.64, and raised its expected annual run-rate Worldpay integration expense synergies to USD 650 mn;
The digital payment stocks we track (AXP, Visa, Mastercard, Circle, Block, and PayPal) are currently trading at an average forward P/E of 26.0x, implying that investors continue to price in resilient earnings growth and strong digital payment adoption, although elevated operating costs and higher client incentives across legacy card networks may moderate valuation expansion in the near term.
Focus of the Week
Following the release of H1’2026 results by insurance companies, the Cytonn Financial Services Research Team undertook an analysis on the performance of the 5 listed insurance companies in Kenya, identified the key factors that influenced their performance, and gave our outlook for the insurance sector going forward.
Investment Updates:
- Weekly Rates: Cytonn Money Market Fund closed the week at a yield of 11.11% p.a. To invest, dial *809# or download the Cytonn App from Google Play store here or from the Appstore here;
- We continue to offer Wealth Management Training every Tuesday, from 7:00 pm to 8:00 pm. The training aims to grow financial literacy among the general public. To register for any of our Wealth Management Trainings, click here; If interested in our Private Wealth Management Training for your employees or investment group, please get in touch with us through wmt@cytonn.com;
- Cytonn Asset Managers Limited (CAML) continues to offer pension products to meet the needs of both individual clients who want to save for their retirement during their working years and Institutional clients that want to contribute on behalf of their employees to help them build their retirement pot. To more about our pension schemes, kindly get in touch with us through pensions@cytonn.com;
Hospitality Updates:
- We currently have promotions for Staycations. Visit cysuites.com/offers for details or email us at sales@cysuites.com;
Money Markets, T-Bills Primary Auction:
This week, T-bills were oversubscribed for the fourteenth consecutive week, with the overall subscription rate coming in at 241.8% higher than the subscription rate of 185.2% recorded the previous week. Investors’ preference for the shorter 91-day paper persisted, with the paper receiving bids worth Kshs 34.5 bn against the offered Kshs 8.0 bn, translating to a subscription rate of 431.2% significantly lower than the subscription rate of 507.9%, recorded the previous week. The subscription rates for the 182-day and 364-day papers increased to 218.9% and 113.1%, from 53.2% and 59.1% recorded the previous week, respectively. The government accepted a total of Kshs 53.1 bn worth of bids out of Kshs 67.7 bn bids received, translating to an acceptance rate of 78.5%. The yields on the government papers showed a mixed performance, with the yield on the 91-day paper increasing by 0.02 bps to remain relatively unchanged at 8.8% recorded the previous week, while the yields on the 182-day and 364-day papers decreased by 0.6 bps and 0.1 bps, respectively, to remain relatively unchanged at 8.9% and 9.0% respectively, recorded the previous week.
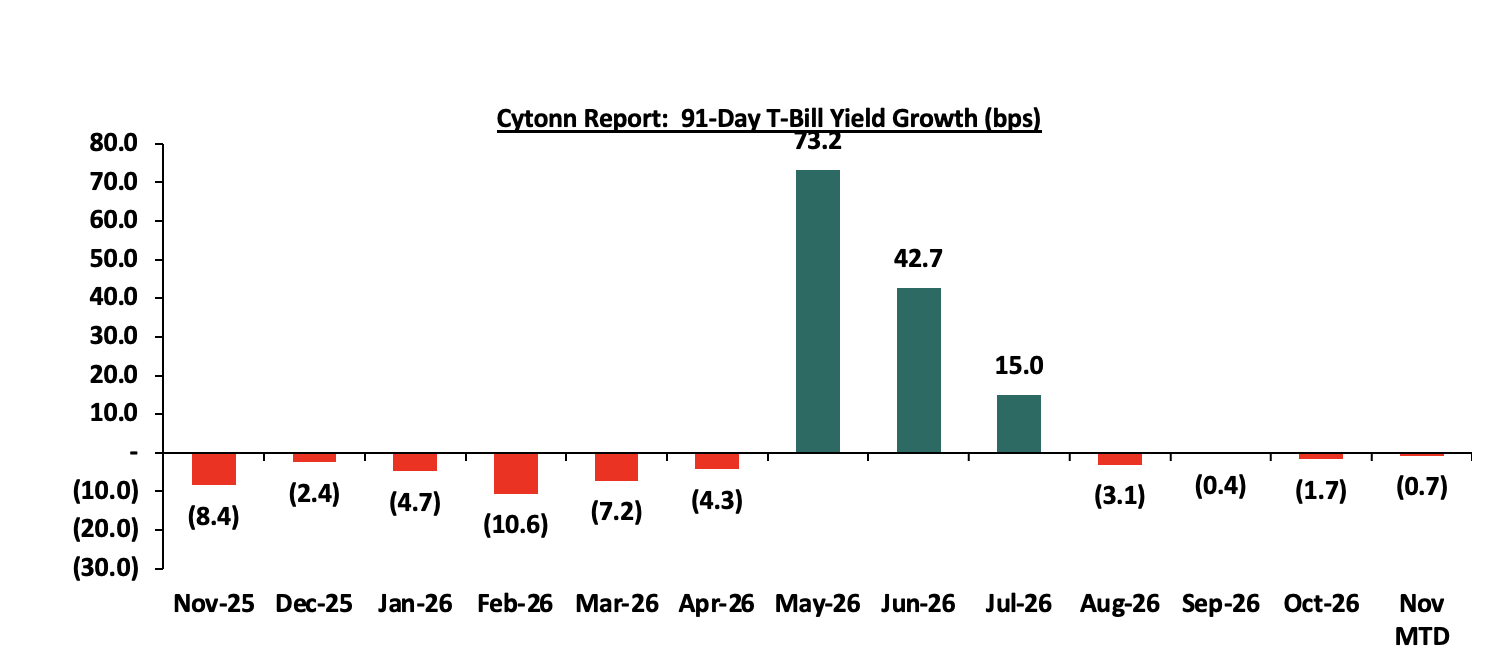
The chart below shows the yield growth rate for the 91-day paper from Nov 2025 to date:
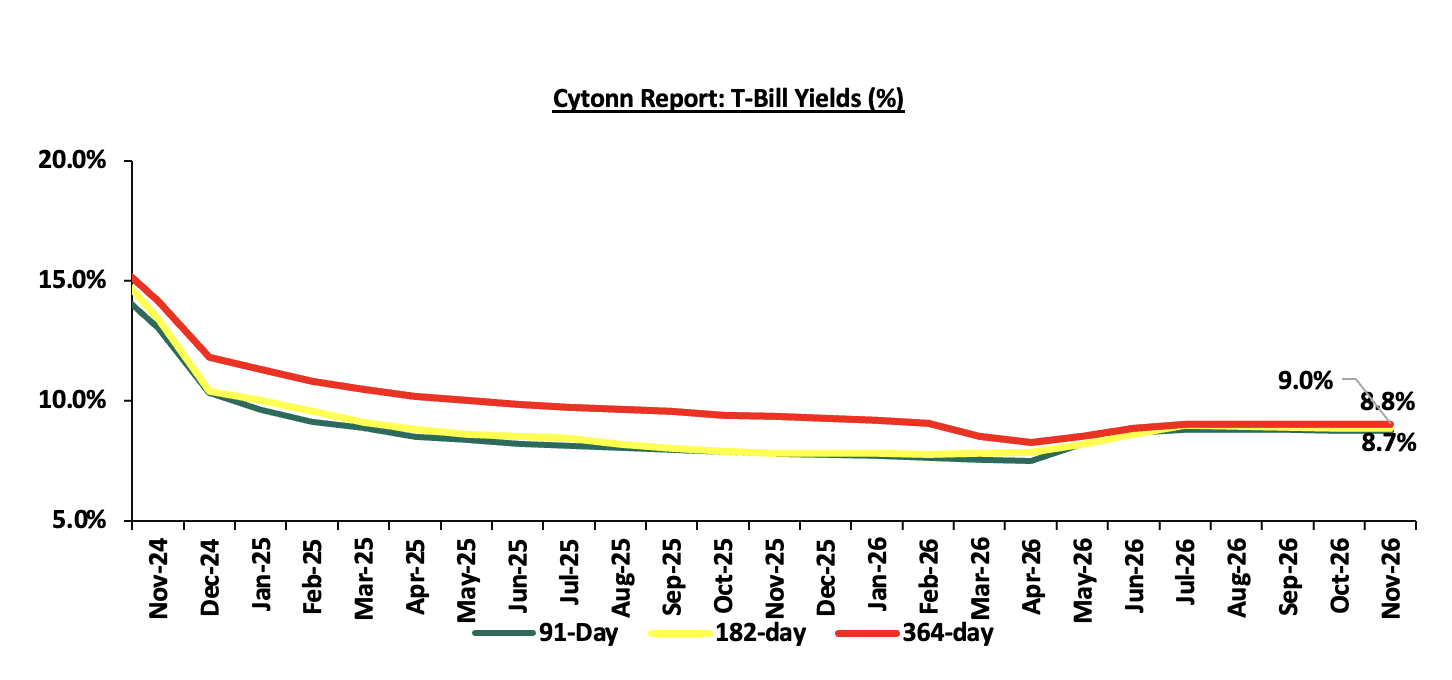
The chart below shows the performance of the 91-day, 182-day and 364-day papers from November 2024 to November 2026:
The chart below compares the overall average T-bill subscription rates obtained in 2023, 2024, 2025 and 2026 Year-to-date (YTD):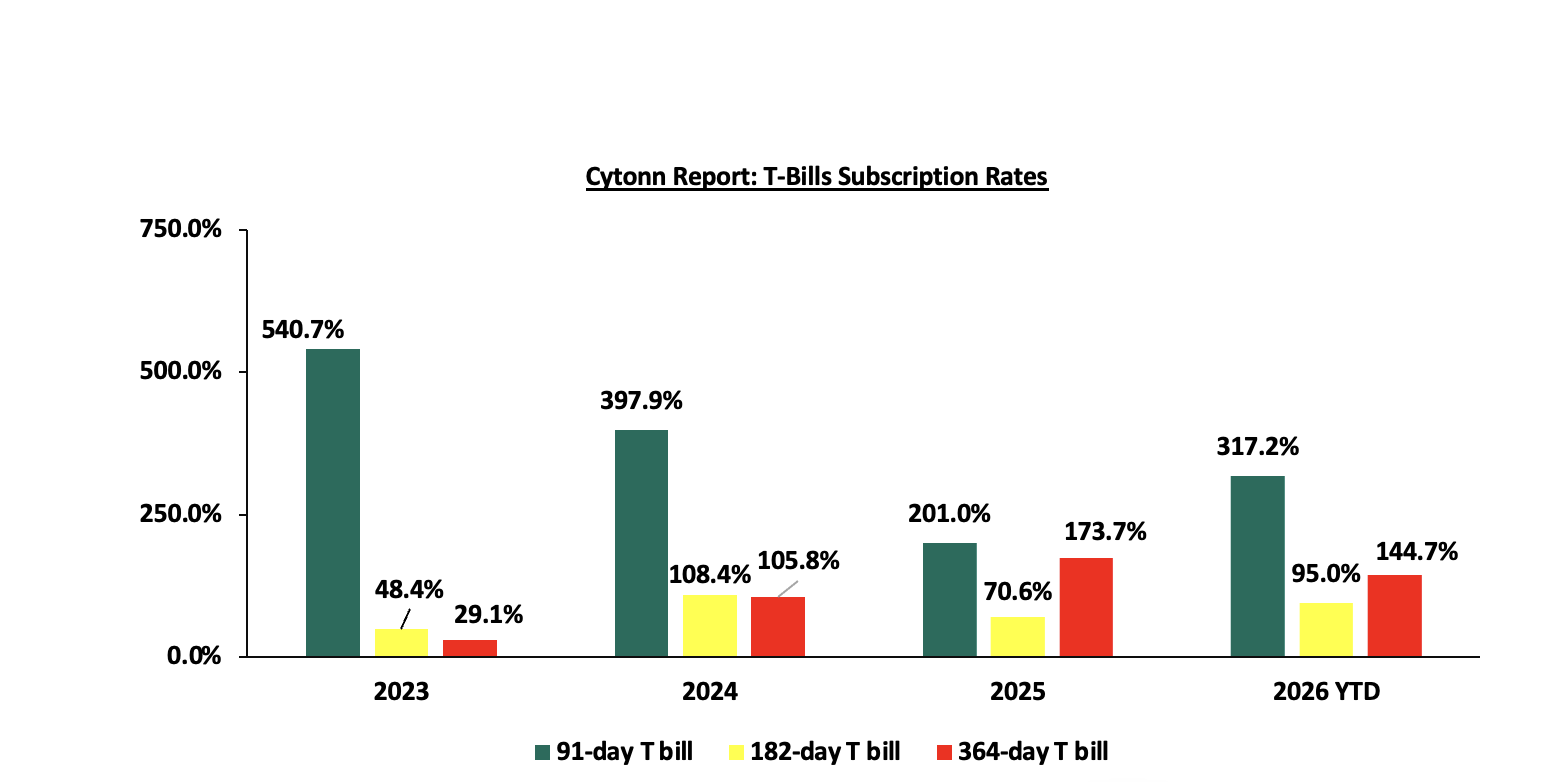
T-Bonds Primary Auction:
During the week, the CBK released the auction results for the re-opened treasury bonds FXD3/2019/015 and FXD1/2026/030 with tenors to maturities of 7.8 years and 29.5 years respectively and fixed coupon rates of 12.3% and 12.5% respectively. The bonds were oversubscribed, with the overall subscription rate coming in at 198.9%, receiving bids worth Kshs 99.5 bn against the offered Kshs 50.0 bn. The government accepted bids worth Kshs 70.9 bn, translating to an acceptance rate of 71.2%. The weighted average yield for the accepted bids for the FXD3/2019/015 and FXD1/2026/030 came in at 12.7% and 14.1% respectively. Notably, the yield on FXD3/2019/015 remained unchanged at 12.7% from the last reopening in October 2026 while the 14.1% yield on the FXD1/2026/030 was marginally lower than the 14.2% recorded at the last reopening in October 2026. With the Inflation rate at 7.3% as of October 2026, the real returns of the FXD3/2019/015 and FXD1/2026/030 are 5.4% and 6.8% respectively. Given the 10.0% withholding tax on the bonds, the tax equivalent yields for shorter term bonds with 15.0% withholding tax are 13.4% for FXD3/2019/015 and 14.9% for FXD1/2026/030.
Money Market Performance:
In the money markets, 3-month bank placements ended the week at 9.0% (based on rates offered by various banks). The yields on the government papers showed a mixed performance, with the yield on the 91-day paper increasing by 0.02 bps to remain relatively unchanged at 8.8% recorded the previous week, while the yields on the 364-day papers decreased by 0.1 bps, to remain relatively unchanged at 9.0% recorded the previous week. The yield on the Cytonn Money Market Fund remained relatively unchanged from the 11.1% recorded the previous week, while the average yields on Top 5 Money Market Funds increased by 1.6 bps to remain relatively unchanged at 10.7% recorded the previous week.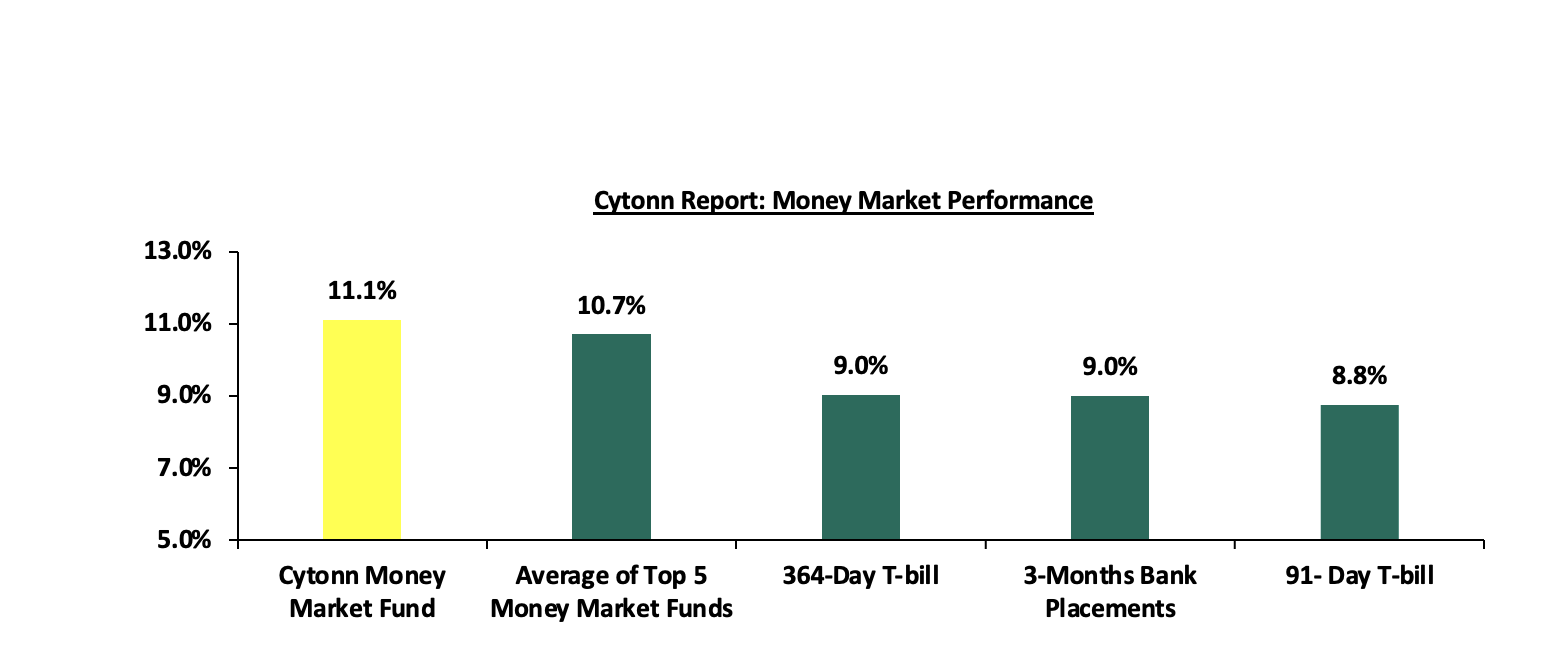
The table below shows the Money Market Fund Yields for Kenyan Fund Managers as published on 6th November 2026
|
Money Market Fund Yield for Fund Managers as published on 6th November 2026 |
||
|
Rank |
Fund Manager |
Effective Annual Rate |
|
1 |
Cytonn Money Market Fund (Dial *809# or download Cytonn App) |
11.1% |
|
2 |
Faulu Money Market Fund |
11.0% |
|
3 |
Lofty-Corban Money Market Fund |
10.5% |
|
4 |
Ndovu Money Market Fund |
10.5% |
|
5 |
Rejesha Money Market Fund |
10.5% |
|
6 |
Orient Kasha Money Market Fund |
10.4% |
|
7 |
Arvocap Money Market Fund |
10.4% |
|
8 |
Nabo Africa Money Market Fund |
10.4% |
|
9 |
Old Mutual Money Market Fund |
10.3% |
|
10 |
Enwealth Money Market Fund |
10.3% |
|
11 |
Jubilee Money Market Fund |
10.2% |
|
12 |
Kuza Money Market fund |
10.2% |
|
13 |
Gulfcap Money Market Fund |
10.1% |
|
14 |
Etica Money Market Fund |
10.1% |
|
15 |
Madison Money Market Fund |
10.0% |
|
16 |
SanlamAllianz Money Market Fund |
9.6% |
|
17 |
Apollo Money Market Fund |
9.6% |
|
18 |
British-American Money Market Fund |
9.6% |
|
19 |
Globetec Money Market Fund |
9.6% |
|
20 |
GenAfrica Money Market Fund |
9.5% |
|
21 |
KCB Money Market Fund |
9.3% |
|
22 |
Dry Associates Money Market Fund |
9.2% |
|
23 |
Genghis Money Market Fund |
8.9% |
|
24 |
CPF Money Market Fund |
8.9% |
|
25 |
CIC Money Market Fund |
8.4% |
|
26 |
AA Kenya Shillings Fund |
8.3% |
|
27 |
Mali Money Market Fund |
8.3% |
|
28 |
Mayfair Money Market Fund |
8.2% |
|
29 |
Co-op Money Market Fund |
8.0% |
|
30 |
ICEA Lion Money Market Fund |
7.9% |
|
31 |
Absa Shilling Money Market Fund |
7.4% |
|
32 |
Ziidi Money Market Fund |
6.1% |
|
33 |
Equity Money Market Fund |
5.4% |
|
34 |
Stanbic Money Market Fund |
5.4% |
Source: Business Daily
Liquidity:
During the week, liquidity in the money markets remained relatively stable with the average interbank rate remaining unchanged at 8.8% recorded the previous week, partly attributable to government payments that offset tax remittances. The average interbank volumes traded decreased by 24.4% to Kshs 9.2 bn from Kshs 12.2 bn recorded the previous week. The chart below shows the interbank rates in the market over the years: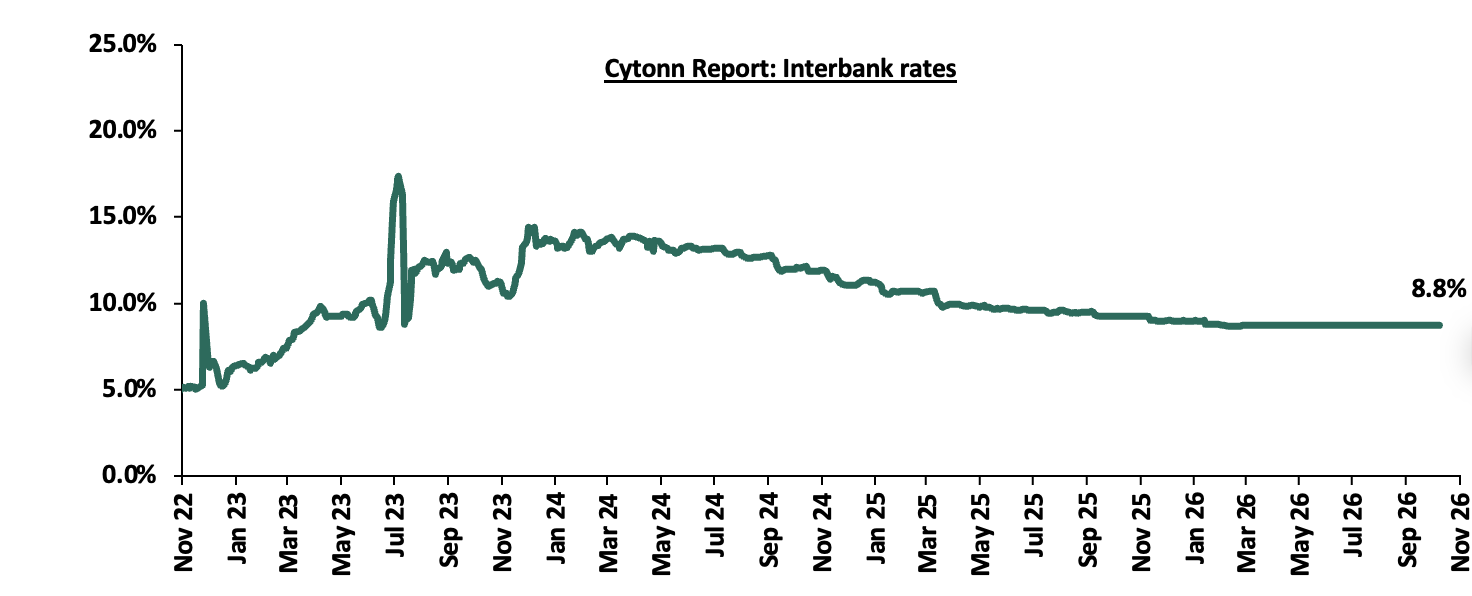
Kenya Eurobonds:
During the week, the yields on the Eurobonds were on a downward trajectory with the yields on the 13 -year 2021 issue decreasing the most by 34.7 bps to 9.0% from 9.3% recorded the previous week. The table below shows the summary performance of the Kenyan Eurobonds as of 5th November 2026:
|
Cytonn Report: Kenya Eurobonds Performance |
||||||
|
|
2018 |
2019 |
2021 |
2024 |
||
|
Tenor |
10-year issue |
30-year issue |
12-year issue |
13-year issue |
7-year issue |
|
|
Amount Issued (USD) |
1.0 bn |
1.0 bn |
1.0 bn |
1.5 bn |
1.5 bn |
|
|
Years to Maturity |
2.5 |
22.5 |
8.8 |
5.5 |
10.5 |
|
|
Yields at Issue |
7.3% |
8.3% |
6.2% |
10.4% |
9.9% |
|
|
2-Jan-26 |
6.1% |
8.8% |
7.2% |
7.8% |
7.1% |
|
|
29-Oct-26 |
7.3% |
9.9% |
8.8% |
9.3% |
8.0% |
|
|
30-Oct-26 |
7.3% |
10.0% |
8.9% |
9.4% |
8.0% |
|
|
2-Nov-26 |
7.3% |
9.9% |
8.7% |
9.2% |
7.9% |
|
|
3-Nov-26 |
7.3% |
10.0% |
8.8% |
9.3% |
8.0% |
|
|
4-Nov-26 |
7.2% |
9.6% |
8.6% |
9.0% |
7.6% |
|
|
5-Nov-26 |
7.1% |
9.7% |
8.6% |
9.0% |
7.7% |
|
|
Weekly Change |
(0.2%) |
(0.3%) |
(0.2%) |
(0.3%) |
(0.3%) |
|
|
MTD Change |
(0.1%) |
(0.2%) |
(0.1%) |
(0.2%) |
(0.2%) |
|
|
YTD Change |
1.1% |
0.8% |
1.4% |
1.2% |
0.6% |
|
Source: Central Bank of Kenya (CBK) and National Treasury
Kenya Shilling:
During the week, the Kenya Shilling appreciated by 3.1 bps against the US Dollar, to Kshs 129.9 from the Kshs 130.0 recorded the previous week. On a year-to-date basis, the shilling has depreciated by 66.6 bps against the dollar, as compared to the 22.9 bps appreciation recorded in 2025.
We expect the shilling to be supported by:
- Diaspora remittances standing at a cumulative USD 5,031.5 mn in the twelve months to September 2026, slightly lower than the USD 5,080.5 mn recorded over the same period in 2025. These have continued to cushion the shilling against further depreciation. In the September 2026 diaspora remittances figures, North America remained the largest source of remittances to Kenya accounting for 49.1% in the period,
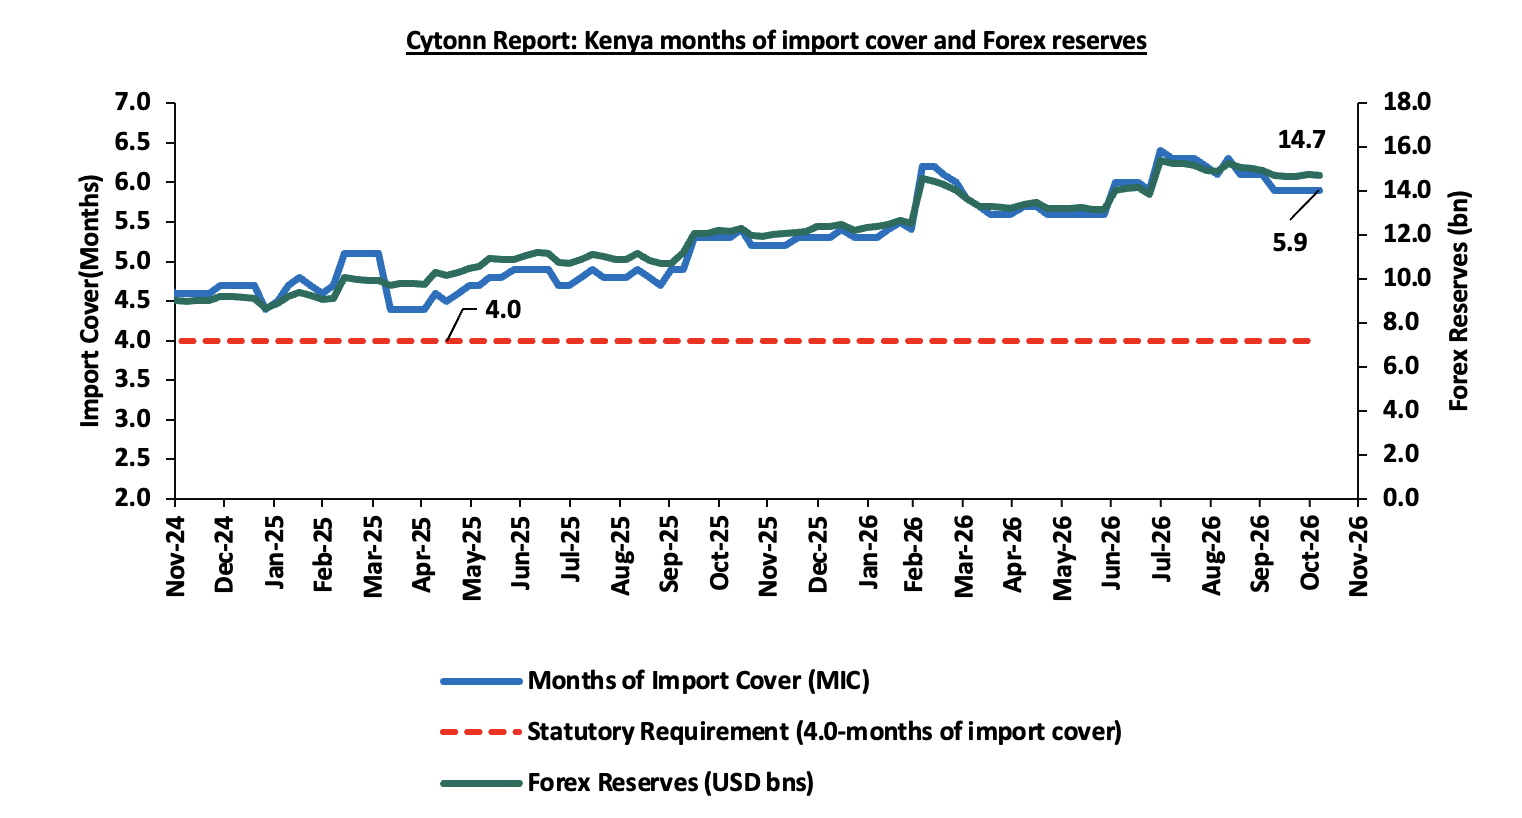
- Improved forex reserves currently at USD 14.7 bn (equivalent to 5.9-months of import cover), which is above the statutory requirement of maintaining at least 4.0-months of import cover and above the EAC region’s convergence criteria of 4.5-months of import cover
The shilling is however expected to remain under pressure in 2026 as a result of:
- An ever-present current account deficit which widened to 3.1% of GDP in the 12 months to August 2026 compared to 2.1% of GDP in a similar period in 2025 and,
- The need for government debt servicing, continues to put pressure on forex reserves given that 54.7% of Kenya’s external debt is US Dollar-denominated as of July 2026.
- Rising geopolitical tensions in the Middle East, which could exert pressure on the shilling through higher global oil prices and increased uncertainty in international markets. Given that Kenya is a net importer of petroleum products, any sustained increase in oil prices would widen the import bill, increase demand for US Dollars, and consequently put depreciation pressure on the shilling
Kenya’s forex reserves marginally decreased by 0.3% during the week to remain relatively unchanged at USD 14.7 bn recorded the previous week, equivalent to 5.9 months of import cover, and above the statutory requirement maintaining at least 4.0-months of import cover.
Weekly Highlights
- Stanbic Bank’s October 2026 Purchasing Manager’s Index (PMI)
Stanbic Bank released its monthly Purchasing Manager’s Index (PMI), indicating that Kenya's Purchasing Managers' Index (PMI) improved by 1.2 points to 52.5 in October 2026, from 51.3 in September 2026. The October reading was the highest in 2026 so far, marking a second consecutive month of improvement in private sector conditions. The improvement was demand-led. New orders grew at the fastest pace in almost a year, supported by customer referrals, greater footfall and new tenders and contracts. This fed through to activity, with output rising for the first time in eight months, though only modestly as cash flow constraints and inflation concerns weighed on firms. Purchasing activity returned to growth at the fastest pace since January, feeding through to a steep rise in input inventories that is the sharpest in exactly four years, supported by the quickest shortening of supplier delivery times since September 2021. Employment continued to expand for the fifth month running, though at the slowest rate in the current sequence, while rising workloads led to backlogs of work accumulating at the fastest pace in seven years. Inflationary pressures intensified, with 36.0% of monitored firms reporting higher total input costs driven mainly by rising fuel and transport costs. Consequently, selling price inflation quickened to its second-fastest pace in three years, exceeded only by June 2026, as firms sought to protect margins. Key to note, a PMI reading of above 50.0 indicates an improvement in business conditions, while readings below 50.0 indicate a deterioration.
The chart below shows Kenya's Purchasing Managers' Index trajectory up to October 2026: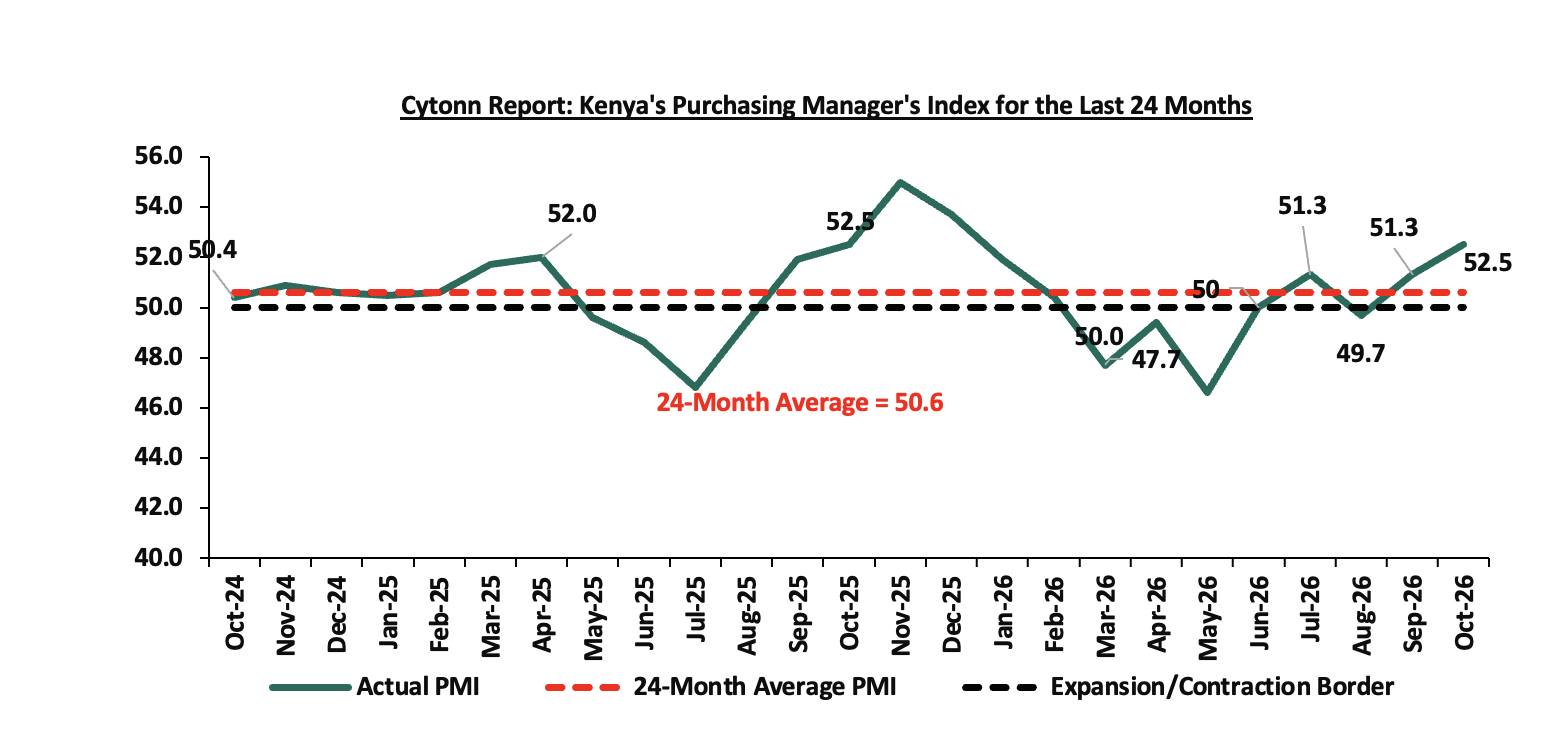
Going forward, the October PMI suggests that Kenya's private sector is experiencing a demand-led recovery with output returning to growth, led by strong performance in manufacturing while construction remained the only monitored sector to register lower sales. The near-term outlook is notably optimistic, with 51.0% of surveyed firms expecting higher output in a year's time, driving business expectations to their highest level since March 2020 on the back of planned expansions, new products and services, marketing campaigns, and investments. However, cost pressures remain a key constraint to sustained recovery, as elevated fuel, transport, and purchase costs continue to squeeze operating capacity and drive-up selling prices. Sustained expansion will therefore depend on an easing of input cost inflation and improved cash flow conditions; otherwise, the recovery may remain constrained by price pressures and modest hiring.
- Balance of Payments
Kenya’s balance of payment (BoP) surplus narrowed by 74.2% in Q2’2026, to Kshs 40.6 bn, from a surplus of Kshs 157.0 bn in Q2’2025. The y/y narrowing of the BoP surplus was mainly driven by the 264.1% widening of the current account deficit to Kshs 252.5 bn from Kshs 69.4 bn in Q2’2025 and the 66.2% decline in the capital account surplus to Kshs 6.0 bn from Kshs 17.6 bn, which outweighed the 23.9% increase in net financial inflows to Kshs 244.1 bn from Kshs 197.0 bn. The table below shows the breakdown of the various balance of payments components, comparing Q2’2026 and Q2’2025:
|
Item |
Q2’2025 |
Q2’2026 |
Y/Y % Change |
|
Current Account Balance |
(69.4) |
(252.5) |
264.1% |
|
Capital Account Balance |
17.6 |
6.0 |
(66.2%) |
|
Financial Account Balance |
(197.0) |
(244.1) |
23.9% |
|
Net Errors and Omissions |
11.8 |
43.0 |
265.5% |
|
Balance of Payments |
157.0 |
40.6 |
(74.2%) |
All values in Kshs bns
Key take-outs from the table include;
- The current account deficit (value of goods and services imported exceeds the value of those exported) widened by 264.1% to Kshs 252.5 bn from Kshs 69.4 bn in Q2’2025. The y/y increase of the current account deficit was brought about by the 47.9% widening in the merchandise trade balance deficit to Kshs 481.9 bn from a Kshs 325.8 bn in Q2’2025.
- The capital account balance (shows capital transfers receivable and payable between residents and non-residents, including the acquisition and disposal of non-produced non-financial items), declined by 66.2% to a surplus of Kshs 6.0 bn in Q2’2026, from a surplus of Kshs 17.6 bn in Q2’2025,
- The financial account balance (the difference between the foreign assets purchased by domestic buyers and the domestic assets purchased by foreign buyers) recorded a 23.9% increase in net inflow to a deficit of Kshs 244.1 bn in Q2’2026, from a deficit of Kshs 197.0 bn in Q2’2025.
- Consequently, the Balance of Payments (BoP) surplus narrowed to Kshs 40.6 bn in Q2’2026, from a surplus of Kshs 157.0 bn recorded in Q2’2025.
Rates in the fixed income market have declined MTD, reversing the recent upward trend. The decline comes despite the CBK's decision to pause its rate-cutting cycle at 8.75%, with inflation remaining elevated with inflation at 7.3%, just 0.2% points below the upper bound of CBK’s target range of 2.5%-7.5%. The government is 218.3% ahead of its prorated net domestic borrowing target of Kshs 919.4 bn, having a net borrowing position of Kshs 722.3 bn (inclusive of T-bills). We expect investors to maintain a preference for short to medium-term papers as they monitor the pace of government issuance and the path of inflation before committing further out on the curve, with the yield curve likely to remain under upward pressure rather than stabilize, at least until the inflation trajectory becomes clearer.
Market Performance:
During the week, the equities market was on an upward trajectory, with the NSE 10, NSE 25, NSE 20, and NASI increasing by 2.9%, 2.7%, 2.2%, and 0.7% respectively, taking their YTD performance to gains of 33.3%, 32.9%, 31.5%, and 28.0% respectively for NSE 20, NSE 10, NSE 25 and NASI respectively. The week-on-week equities market performance was mainly driven by gains recorded by large-cap stocks such as DTBK, Equity and KCB of 5.4%, 4.2% and 4.1% respectively. The performance was however weighed down by losses recorded by large-cap stocks such as Standard Chartered Bank Kenya, and EABL of 0.5% and 0.3% respectively;
During the week, the banking sector index increased by 3.0% to 279.8 from the 271.5 recorded the previous week. This is attributable to gains recorded by large cap stocks such as DTBK, Equity and KCB of 5.4%, 4.2% and 4.1% respectively. The performance was however weighed down by losses recorded by large-cap stocks such as SCBK of 0.5% respectively;
During the week, equities turnover increased by 3008.1% to USD 846.7 mn from USD 27.2 mn recorded the previous week, taking the YTD total turnover to USD 4,317.3 mn. Foreign investors became net buyers for the first time in five weeks with a net buying position of USD 820.2 mn, from a net selling position of USD 6.8 mn recorded the previous week, taking the YTD foreign net buying position to USD 622.6 mn, compared to a net selling position of USD 92.9 mn recorded in 2025.
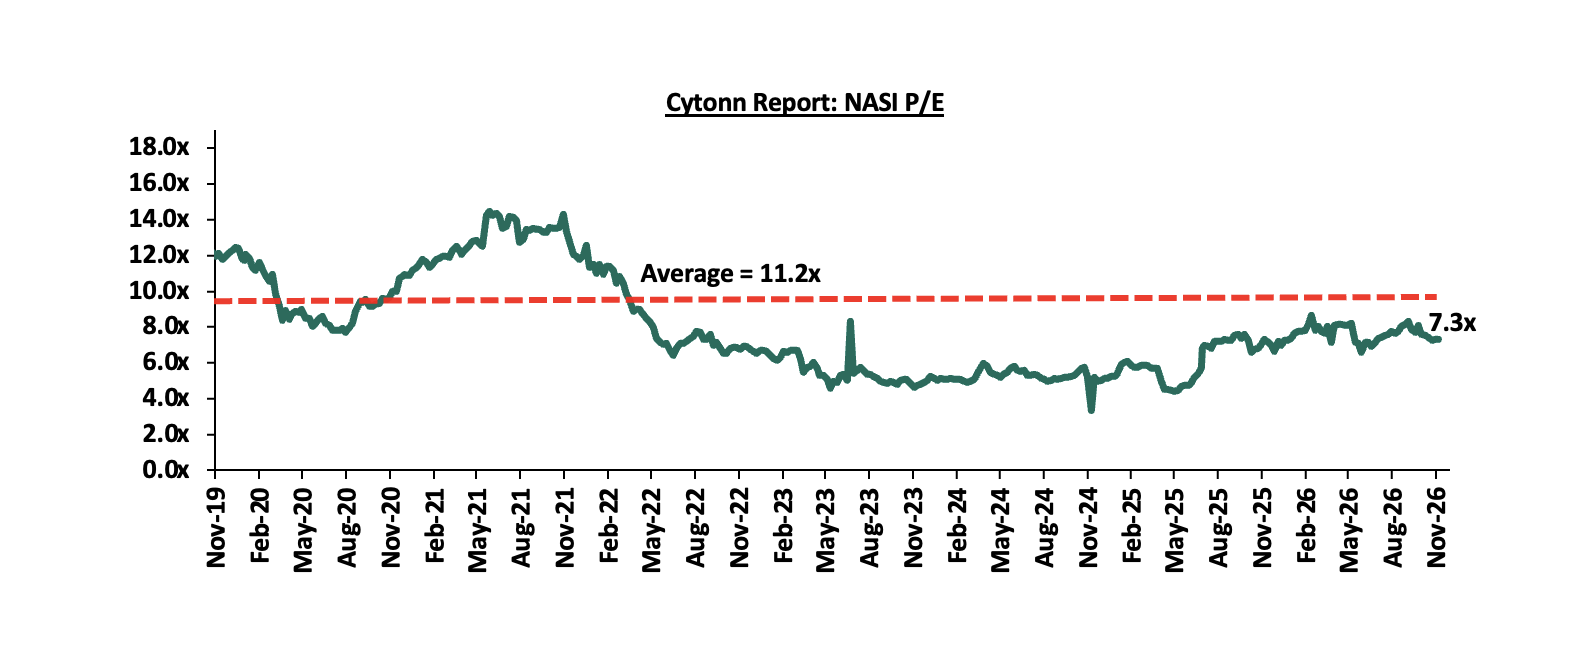
The market is currently trading at a price to earnings ratio (P/E) of 7.3x, 34.4% below the historical average of 11.2x, and a dividend yield of 6.0%, 1.2% points above the historical average of 4.8%. Key to note, NASI’s PEG ratio currently stands at 0.9x, an indication that the market is slightly undervalued relative to its future growth. A PEG ratio greater than 1.0x indicates the market may be overvalued while a PEG ratio less than 1.0x indicates that the market is undervalued;
The charts below indicate the historical P/E and dividend yields of the market: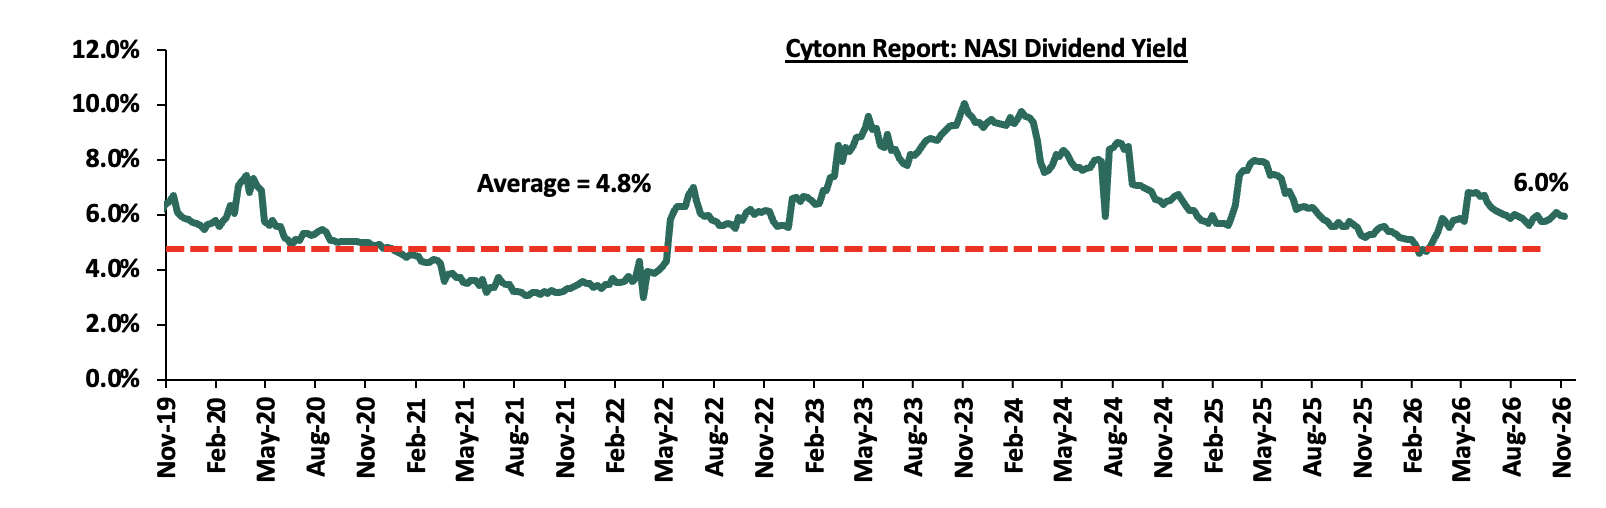
|
Cytonn Report: Equities Universe of Coverage |
||||||||||||
|
Company |
Price as at 30/10/2026 |
Price as at 06/11/20266 |
w/w change |
m/m change |
YTD Change |
Year Open 2026 |
Target Price* |
Dividend Yield |
Upside/ Downside** |
P/TBv Multiple |
Recommendation |
|
|
Co-op Bank |
35.5 |
36.1 |
1.7% |
1.7% |
51.0% |
23.9 |
46.1 |
6.9% |
34.6% |
1.3x |
Buy |
|
|
NCBA |
88.0 |
89.5 |
1.7% |
1.7% |
5.3% |
85.0 |
108.9 |
7.9% |
29.7% |
1.2x |
Buy |
|
|
ABSA Bank |
30.0 |
30.9 |
3.0% |
3.0% |
24.1% |
24.9 |
36.8 |
6.6% |
26.1% |
1.7x |
Buy |
|
|
KCB Group |
86.0 |
89.5 |
4.1% |
4.1% |
36.1% |
65.8 |
104.4 |
7.8% |
24.5% |
0.9x |
Buy |
|
|
Standard Chartered Bank |
304.8 |
303.3 |
(0.5%) |
(0.5%) |
1.2% |
299.8 |
345.8 |
10.2% |
24.3% |
1.9x |
Buy |
|
|
Stanbic Holdings |
259.5 |
266.3 |
2.6% |
2.6% |
34.6% |
197.8 |
300.3 |
8.4% |
21.2% |
1.5x |
Buy |
|
|
Equity Group |
95.0 |
99.0 |
4.2% |
4.2% |
47.8% |
67.0 |
113.5 |
5.8% |
20.5% |
1.3x |
Buy |
|
|
Family Bank |
27.2 |
26.7 |
(1.7%) |
(1.7%) |
48.3% |
18.0 |
29.5 |
4.5% |
15.0% |
1.4x |
Accumulate |
|
|
I&M Group |
81.3 |
85.0 |
4.6% |
4.6% |
98.6% |
42.8 |
90.4 |
4.4% |
10.8% |
1.4x |
Accumulate |
|
|
Diamond Trust Bank |
179.3 |
189.0 |
5.4% |
5.4% |
64.7% |
114.8 |
199.5 |
4.8% |
10.3% |
0.5x |
Accumulate |
|
|
Jubilee Holdings |
396.8 |
404.5 |
2.0% |
2.0% |
25.4% |
322.5 |
420.5 |
3.7% |
7.7% |
0.6x |
Hold |
|
|
CIC Group |
4.7 |
4.9 |
3.8% |
3.8% |
8.4% |
4.5 |
5.1 |
2.6% |
5.5% |
1.2x |
Hold
|
|
|
Britam |
18.1 |
18.0 |
(0.6%) |
(0.6%) |
98.1% |
9.1 |
18.5 |
0.0% |
2.8% |
1.3x |
Lighten |
|
|
*Target Price as per Cytonn Analyst estimates **Upside/ (Downside) is adjusted for Dividend Yield ***Dividend Yield is calculated using FY’2025 Dividends |
||||||||||||
Weekly highlights
- Safaricom H1’2027 Financial Performance
During the week, Safaricom Plc released its H1’2027 financial results for the period ending 30th September 2026, highlighting that the profit after tax (PAT) for the Group increased by 72.5% to Kshs 50.4 bn, from 29.2 bn recorded in H1’2026, largely attributable to a 14.2% increase in Total Revenue to Kshs 233.7 bn from Kshs 204.7 bn recorded in H1’2026, which outpaced the 1.0% increase in operating costs to Kshs 104.5 bn in H1’2027 from Kshs 103.4 bn in H1’2026.
The tables below show the breakdown of the group’s financial statements from the report;
|
Cytonn Report: Safaricom PLC Income Statement |
|||
|
Item (All figures in Bns) |
H1'2026 |
H1'2027 |
y/y change |
|
Total Revenue |
204.7 |
233.7 |
14.2% |
|
Operating costs |
(103.4) |
(104.5) |
1.0% |
|
EBITDA |
101.3 |
129.2 |
27.5% |
|
EBITDA Margin |
49.5% |
55.3% |
5.8% |
|
Depreciation & Amortization |
(36.1) |
(38.0) |
5.5% |
|
Operating Profit |
65.2 |
91.1 |
39.8% |
|
Net Finance Costs |
(9.9) |
(9.9) |
0.2% |
|
Profit Before Tax |
55.2 |
81.3 |
47.2% |
|
Profit After Tax |
29.2 |
50.4 |
72.5% |
|
Core EPS |
0.7 |
1.3 |
72.5% |
|
Cytonn Report: Safaricom PLC Balance Sheet |
|||
|
Item (All figures in Bns) |
H1'2026 |
H1'2027 |
y/y change |
|
Current Assets |
89.6 |
94.5 |
5.5% |
|
Non-Current Assets |
419.0 |
479.3 |
14.4% |
|
Total Assets |
508.6 |
573.8 |
12.8% |
|
Current Liabilities |
130.1 |
151.2 |
16.2% |
|
Non-Current Liabilities |
162.8 |
186.3 |
14.4% |
|
Total liabilities |
293.0 |
337.5 |
15.2% |
|
Shareholder funds |
184.4 |
210.7 |
14.3% |
|
Minority Interest |
31.2 |
25.6 |
(18.1%) |
|
Total Equity |
215.6 |
236.3 |
9.6% |
Key take outs from the report include;
- Total revenue increased by 14.2% to Kshs 233.7 bn in H1’2027, from Kshs 204.7 bn in H1’2026, mainly attributable to the 13.1% increase in service revenue to Kshs 226.1 bn in H1’2027, from Kshs 199.9 bn in H1’2026. Notably, MPESA revenue increased by 13.6% to Kshs 100.1 bn, from Kshs 88.1 bn in H1’2026,
- Voice revenue for the group increased by 6.7% to Kshs 43.9 bn, from Kshs 41.1 in H1’2026, while mobile data revenue increased by 19.5% to Kshs 53.1 bn, from Kshs 44.4 in H1’2026.
- Earnings before interest, taxes, depreciation and amortization (EBITDA) increased by 27.5% to 129.2 bn in H1’2027 from 101.3 bn in H1’2026, owing to a 14.2% increase in total revenue to Kshs 233.7 bn in H1’2027, from Kshs 204.7 bn in H1’2026, which outpaced the 1.0% increase in Operating costs to Kshs 104.5 bn in H1’2027 from Kshs 103.4 bn in H1’2026. As such, EBITDA margin recorded an 5.8%-points increase to 55.3% in H1’2027 from 49.5% in H1’2026,
- Ethiopian subsidiary recorded a 42.9% decrease in net losses after tax to Kshs 16.6 bn from a net loss of Kshs 29.0 bn in H1’2026, while the Kenyan business recorded a 13.8% increase in profit after tax to Kshs 66.3 bn, from 58.2 bn in H1’2026. As such, the Group recorded a 72.5% increase in profit after tax to Kshs 50.4 bn in H1’2027, from Kshs 29.2 bn in H1’2026,
- The balance sheet recorded an expansion as total assets increased by 12.8% to Kshs 573.8 bn, from Kshs 508.6 bn in H1’2026, mainly driven by a 14.4% increase in Non-Current assets to Kshs 479.3 bn, from Kshs 419.0 bn in H1’2026, coupled with a 5.5% increase in current assets to Kshs 94.5 bn in H1’2027 from Kshs 89.6 bn in H1’2026,
- The Group’s three-month active customers grew by 22.3% to 79.0 mn from 64.6 mn in H1’2026, while Safaricom’s market share in Kenya increased to 69.8% as of June 2026, from 65.1% recorded same period last year.
- The Board of Directors did not recommend any dividends consistent with a similar period in H1’2026.
Additionally, its Ethiopian subsidiary recorded a total revenue of Kshs 11.2 bn, with service revenue coming at Kshs 10.6 bn and operating cost at Kshs 11.6 bn leading to a loss after tax of Kshs 16.6 bn which weighed down on the group’s overall performance.
The 72.5% increase in the firm’s core earnings per share to Kshs 1.3 in H1’2027, from Kshs 0.7 in H1’2026 shows that Safaricom continues to have a strong long-term proposition, owing to its 69.8% of market share in Kenya, with M-Pesa recording a 11.7% year on year growth in one-month active customers to 44.5 mn in H1’2027 from 39.8 mn in H1’2026. Additionally, the Ethiopian subsidiary is expected to gain further traction with the firm expecting to tap into Ethiopian market with a population of more than 138.9 mn people. However, the adverse macroeconomic situation, coupled with the ongoing depreciation of the Ethiopian Birr against the US dollar is likely to weigh on the group’s overall performance during this period when it is aggressively expanding its network in Ethiopia.
- Quick Mart PLC Initial Public Offer (IPO) results
During the week, the Quick Mart PLC (Quickmart) IPO results were released, showing that the offer was oversubscribed by 122.7%, with investors subscribing for 2.5 bn shares worth Kshs 18.4 bn against 2.0 bn shares worth Kshs 15.0 bn offered at Kshs 7.50 per share. The IPO offered 50.0% of the company’s stake (2,000,000,000 existing ordinary shares) to the public by way of an Offer for Sale by Sokoni Retail Kenya Limited and is set to be listed on the NSE’s Main Investment Market Segment on 12th November 2026.
The tables below represent a summary of the Quickmart IPO results;
|
Cytonn report: Summary of the Quickmart IPO Results |
|
|
Offer Price (Kshs) |
7.5 |
|
Shares Offered (bn) |
2.0 |
|
Shares Applied For (bn) |
2.5 |
|
Subscription Rate |
122.7% |
|
Amount Targeted (Kshs bn) |
15.0 |
|
Amounts Received (Kshs bn) |
18.4 |
|
Amounts to be Refunded (Kshs bn) |
3.4 |
Source: Quick Mart PLC IPO Results
|
Cytonn Report: Quickmart IPO Subscription Rate Figures in Kshs bn |
||||||
|
Investor Category |
Offered Shares |
Value of Offered Shares |
Published Pool (% of Offer) |
Shares Applied For |
Value Applied For (KES) |
Pool Subscription Rate |
|
Foreign Investors |
0.2 |
1.2 |
8.0% |
0.5 |
3.6 |
298.0% |
|
Kenyan and EAC Retail Investors |
0.2 |
1.8 |
12.0% |
0.3 |
2.4 |
132.6% |
|
Kenyan and EAC Institutional Investors |
0.6 |
4.8 |
32.0% |
0.7 |
5.3 |
109.4% |
|
Cornerstone Investors |
1.0 |
7.2 |
48.0% |
1.0 |
7.2 |
99.9% |
|
Total |
2.0 |
15.0 |
100.0% |
2.5 |
18.4 |
122.7% |
Source: Quick Mart PLC IPO Results
|
Cytonn Report: Quickmart IPO Shares Allocation Figures in Kshs bn |
||||
|
Investor Category |
Offer Share Applied for |
Offer Share Allocated |
Allocation Rate |
% of Offer Allocated |
|
Kenyan and EAC Retail Investors |
0.2* |
0.2* |
100.0% |
10.0% |
|
Kenyan and EAC Institutional |
0.7 |
0.7 |
100.0% |
35.0% |
|
Foreign Investors |
0.5 |
0.2 |
49.5% |
11.8% |
|
Cornerstone Investor: IFC |
0.3 |
0.3 |
96.8% |
12.9% |
|
Cornerstone Investor: 337 Frontier |
0.3 |
0.3 |
100.0% |
13.0% |
|
Cornerstone Investor: RWC Asset |
0.2 |
0.2 |
100.0% |
8.7% |
|
Cornerstone Investor: Mobilist |
0.3 |
0.2 |
66.7% |
8.7% |
|
TOTAL |
2.3* |
2.0* |
85.6% |
100.0% |
Note: * Excludes 5 Applications for 118,666,500 of Offer Shares by Founder Shareholders.
Source: Quick Mart PLC IPO Results
|
Cytonn Report: Quickmart Shareholding Structure before and After IPO |
|||||
|
|
No. of Shares before after IPO |
Stake before IPO |
No. of Shares Held after IPO |
Stake Post IPO |
|
|
Sokoni Retail Kenya Limited |
4,000,000,000 |
100.0% |
2,000,000,000 |
50.0% |
50.0% |
|
Cornerstone Investor: IFC |
- |
- |
258,000,000 |
6.5% |
21.6% |
|
Cornerstone Investor: 337 Frontier |
- |
- |
259,700,000 |
6.5% |
|
|
Cornerstone Investor: RWC Asset |
- |
- |
173,150,000 |
4.3% |
|
|
Cornerstone Investor: Mobilist |
- |
- |
173,333,333 |
4.3% |
|
|
Kenyan and EAC Institutional Investors |
- |
- |
700,171,500 |
17.5% |
17.5% |
|
Foreign Investors |
- |
- |
236,003,847 |
5.9% |
5.9% |
|
Kenyan and EAC Retail Investors |
- |
- |
199,641,320 |
5.0% |
5.0% |
|
Total |
4,000,000,000 |
100.0% |
4,000,000,000 |
100.0% |
100.0% |
Source: Quick Mart PLC IPO Results and Cytonn Research
Key takeouts from the results include:
- Sokoni Retail Kenya Limited retained a 50.0% stake post-IPO with 2.0 bn shares.
- Cornerstone Investors (comprising IFC, 337 Frontier, RWC Asset Management Frontier, and Mobilist) emerged as the largest new shareholder block post-IPO, accounting for 21.6% of the shareholding, equivalent to 864.2 mn shares.
- Kenyan and EAC Institutional Investors secured 17.5% of the total post-IPO shareholding, equivalent to 700.2 mn shares, having been allocated 100.0% of their applied shares (700.2 mn Offer Shares).
- Foreign Investors were allocated 236.0 mn shares (an allocation rate of 49.5%), resulting in a 5.9% stake post-IPO.
- Kenyan and EAC Retail Investors (including direct staff and applications via Safaricom’s Ziidi Trader platform) were allocated 100.0% of their valid applied shares (199.6 mn Offer Shares), representing a 5.0% post-IPO stake across 18,173 valid applications. The allocation excludes applications for 118,666,500 of Offer Shares by Founder Shareholders
- Due to the oversubscription, Kshs 3.4 bn will be processed for refunds where applicable.
- Kenyan and EAC investors (institutional and retail, excluding cornerstones) secured 22.5% of the total post-IPO company shares (889.8 mn shares), highlighting solid domestic and regional market participation.
The overall oversubscription of 122.7% reflects robust confidence from institutional, regional, and international investors in Quickmart’s retail footprint and growth strategy. Foreign investor interest was notably strong, generating a 298.0% pool subscription level. To accommodate higher allocations for domestic institutions and foreign investors, cornerstone investor Mobilist agreed to a voluntary scale-back of USD 5.0 mn. Meanwhile, Founder Shareholders who applied for 118.7 mn shares received zero allocation in accordance with the oversubscription policy. As this transaction represents an Offer for Sale of existing shares by Sokoni Retail Kenya Limited, the Kshs 15.0 billion raised will accrue to the selling shareholder. The IPO represents a major milestone in deepening Kenya's capital markets by listing one of the region's leading retail supermarket chains on the NSE.
Following the publication of results on 6th November 2026, the deadline for payment by Qualified Institutional Investors is set for 10th November 2026. Transfer of shares to successful applicants' CDS accounts and refund processing will occur on 11th November 2026, leading up to the official commencement of trading on the Nairobi Securities Exchange (NSE) on 12th November 2026.
We maintain a “cautiously optimistic” short-term outlook supported primarily earnings-led attractive valuations, despite heightened geopolitical risks such as Iran war that may weigh on investor sentiment, and, “neutral” in the long term as persistent foreign investor outflows continue to constrain market liquidity and limit broad-based market re-rating. With the market currently trading at a discount to its future growth (PEG Ratio at 0.9x), where performance will be driven by company-specific fundamentals rather than general market direction, we believe that investors should reposition towards value stocks exhibiting strong earnings growth, attractive dividend yields, solid balance sheets, sustainable competitive advantages and trading at compelling discounts to their intrinsic value. While foreign investor sell-offs are expected to continue exerting pressure in the near term, we believe this will create selective entry opportunities for long-term investors
Real Estate Investments Trusts
- CMA Proposes to Reduce Minimum REIT Subscription from Kshs 5.0 mn to Kshs 100,000
During the week, the Capital Markets Authority (CMA) proposed reducing the minimum subscription for Real Estate Investment Trusts (REITs) from Kshs 5.0 mn to Kshs 100,000.0 per investor, in a bid to spur interest in the investment vehicle. The Authority had set the minimum investment at Kshs 5.0 mn in 2013 when REITs were introduced to the market, to ensure that only sophisticated investors who understood the risks associated with the vehicles participated. This is the second attempt by the CMA to lower the threshold, following a recommendation made three years ago to reduce the amount to Kshs 10,000.0, which was not backed by an amendment to the Act. There is currently no regulatory minimum amount for investors in unrestricted income REITs.
The proposal forms part of a wider set of legal changes recommended by the regulator to increase the role of REITs in contributing to the Government’s affordable housing agenda. The CMA has also made it easier for issuers to convert between REIT types by standardizing the conversion fee at Kshs 150,000.0, from as much as Kshs 7.5 mn previously for converting a D-REIT to an I-REIT. Additionally, the CMA is seeking to reduce the percentage of property that can be held by the public from 25.0% to 15.0% to allow higher participation by corporate investors, since large investors such as pension funds and insurance companies would otherwise be forced to sell down their stakes to avoid breaching ownership limits. The CMA is also proposing to give REIT managers the power to guarantee loans taken by their project or special purpose vehicles, which is expected to improve access to financing as lenders are more willing to lend when a guarantee is in place. There are currently three REITs trading on the main market segment of the Nairobi Securities Exchange (NSE), namely the ALP Industrial REIT, the Trific Green USD I-REIT and the Laptrust Imara I-REIT, with the first two being dollar-denominated. Two REITs issued this year were oversubscribed, with the ALP Investment REIT’s initial public offer receiving a 115.0% subscription, while the Trific Green I-REIT recorded a 103.3% uptake.
Going forward, we expect the lower entry threshold, reduced conversion costs and enhanced financing flexibility to improve the accessibility of REITs to a wider pool of investors and support new issuances, particularly for developers seeking alternative sources of capital for housing projects. For the broader Real Estate sector, a deeper REIT market is expected to widen the sources of capital available to developers, reducing reliance on bank credit and land sales. It would also give developers an exit route for stabilized assets, allowing them to recycle capital into new projects and sustain the pipeline of residential, commercial and industrial developments. Wider retail and institutional participation should also improve liquidity and price discovery in listed real estate, while easing the transfer of assets into REITs and the lowering of the public shareholding threshold should encourage more institutional capital, such as pension funds and insurers, to move into income-generating property. However, the extent of these benefits will depend on secondary market liquidity and returns, which remain weak for listed REITs.
- REITs Weekly Performance
On the Unquoted Securities Platform Acorn D-REIT and I-REIT traded at Kshs 29.7 and Kshs 24.4 per unit, respectively, as per the last updated data on 30th October 2026. The performance represented a 48.5% and 22.0% gain for the D-REIT and I-REIT, respectively, from the Kshs 20.0 inception price. The volumes traded for the D-REIT and I-REIT came in at 13.7 mn and 46.0 mn shares, respectively. Additionally, ILAM Fahari I-REIT traded at Kshs 13.8 per share as of 30th October 2026, representing a 31.0% loss from the Kshs 20.0 inception price. The volume traded came in at 1.2 mn shares. REITs offer various benefits, such as tax exemptions, diversified portfolios, and stable long-term profits. However, the ongoing decline in the performance of Kenyan REITs and the restructuring of their business portfolios are hindering significant previous investments. Additional general challenges include:
- Insufficient understanding of the investment instrument among investors leading to a slower uptake of REIT products,
- Lengthy approval processes for REIT creation,
- High minimum capital requirements of Kshs 100.0 mn for REIT trustees compared to Kshs 10.0 mn for pension funds Trustees, essentially limiting the licensed REIT Trustee to banks only
- The rigidity of choice between either a D-REIT or and I-REIT forces managers to form two REITs, rather than having one Hybrid REIT that can allocate between development and income earning properties
- Limiting the type of legal entity that can form a REIT to only a trust company, as opposed to allowing other entities such as partnerships, and companies,
- We need to give time before REITS are required to list - they would be allowed to stay private for a few years before the requirement to list given that not all companies maybe comfortable with listing on day one, and,
- Minimum subscription amounts or offer parcels set at Kshs 0.1 mn for D-REITs and Kshs 5.0 mn for restricted I-REITs. The significant capital requirements still make REITs relatively inaccessible to smaller retail investors compared to other investment vehicles like unit trusts or government bonds, all of which continue to limit the performance of Kenyan REITs.
We expect the performance of Kenya’s Real Estate sector to remain resilient, supported by several factors, including: I) the CMA’s proposal to reduce the minimum REIT subscription from Kshs 5.0 mn to Kshs 100,000, lower conversion fees to Kshs 150,000 and allow REIT managers to guarantee loans, and ii) strong demand for new REIT issuances, with the ALP REIT and Trific Green I-REIT IPOs subscribed at 115.0% and 103.3%, respectively. However, challenges such as weak secondary market appetite for listed REITs and high capital requirements, with the current Kshs 5.0 mn minimum subscription, will continue to constrain the sector’s optimal performance.
- Mastercard Supports the Launch of Samsung Pay in Morocco to Expand Tokenized Mobile Payment Choice
During the week, Mastercard Incorporated announced its support for the launch of Samsung Pay in Morocco, which expands mobile payment choice for consumers in the country. Enabled by Mastercard's tokenization technology, the Mastercard Digital Enablement Service (MDES), eligible Mastercard cardholders at participating banks can make payments using compatible Samsung devices, with sensitive card details replaced by a unique digital token and supported by authentication and risk-based safeguards. Merchants that accept supported contactless payments can accommodate the additional payment option, and no physical card is needed for supported transactions. The launch builds on Mastercard's work with financial institutions and technology partners to advance Morocco's digital payments ecosystem and reflects its global ambition to tokenize 100.0% of online transactions by 2030. Mastercard and Samsung will also roll out a joint campaign in Morocco that combines promotional activity with consumer education to accelerate everyday adoption of Samsung Pay. The launch strengthens Mastercard's position in the shift toward tokenized mobile wallets in North Africa, although no financial terms or adoption targets were disclosed and availability is limited to eligible cardholders at participating banks, which means that the pace of uptake will depend on how quickly banks enable the service and how effective the joint campaign is.
- Circle Reports 16.9% Q3 2026 Revenue Growth to USD 864.9 Mn, Boosted by USD 182 Mn of ARC Token Presale Revenue
During the week, Circle Internet Group, Inc. reported its third-quarter 2026 results, with total revenue and reserve income increasing by 16.9% to USD 864.9 mn in Q3 2026 from USD 739.8 mn in Q3 2025. Reserve income decreased by 7.5% to USD 657.6 mn from USD 711.2 mn, as the reserve return rate declined by 61 bps to 3.5%, partly offset by an 8.0% increase in average USDC in circulation to USD 73.3 bn, while other revenue increased by 627.0% to USD 207.3 mn from USD 28.5 mn, driven by USD 182 mn from the ARC token presale. Total distribution, transaction and other costs decreased by 8.0% to USD 411.6 mn from USD 447.6 mn, mostly on lower distribution payments, which lifted revenue less distribution costs by 55.0% to USD 453 mn. Operating expenses increased by 16.0% to USD 244.9 mn from USD 211.1 mn, primarily on higher general and administrative, depreciation and amortization, IT infrastructure and marketing expenses, partly offset by lower stock-based compensation. Net income from continuing operations increased by 5.4% to USD 226.0 mn from USD 214.4 mn, with diluted earnings per share (EPS) rising by 31.3% to USD 0.84 from USD 0.64, while adjusted EBITDA increased by 85.0% to USD 317 mn. On the platform, USDC onchain transaction volume grew by 49.0% to USD 13.9 tn, the Circle Payments Network reached USD 41.3 bn in annualized total payment volume, and Circle signed a definitive agreement to acquire Tazapay, a Singapore-headquartered business-to-business cross-border payments platform with more than USD 25 bn in annualized payment volume, expected to close in 2027 pending regulatory approvals. Circle also launched the Arc public mainnet on 16 September, and Binance announced a USD 100 mn equity investment in Circle alongside the renewal and expansion of their strategic partnership. Management guided to FY 2026 adjusted operating expenses of USD 570 mn to USD 585 mn. Excluding the USD 182 mn of presale revenue, total revenue and reserve income would have been about USD 682.9 mn, a decrease of 7.7% from Q3 2025, which indicates that the growth in revenue was driven by a one-off item while core reserve income was pressured by the lower reserve return rate, with USDC in circulation at the end of the period flat year-on-year at USD 73.9 bn.
- Global Payments Reports 9.8% Growth in Q3 2026 Adjusted EPS to USD 3.58 and Raises Worldpay Synergy Target to USD 650 Mn
During the week, Global Payments Inc. reported its third-quarter 2026 results, with GAAP revenue increasing by 63.7% to USD 3.31 bn in Q3 2026 from USD 2.02 bn in Q3 2025 and adjusted net revenue increasing by 31.0% to USD 3.18 bn from USD 2.43 bn, which was an increase of more than 4.0% on a normalized basis that includes the pre-acquisition results of Worldpay and excludes the divested Issuer Solutions business. Adjusted operating margin expanded by 220 bps on a normalized basis to 42.5%, and adjusted EPS increased by 9.8% to USD 3.58 from USD 3.26. On a GAAP basis, diluted EPS decreased by 59.8% to USD 1.06 from USD 2.64, with net income attributable to the company decreasing by 55.8% to USD 280.9 mn from USD 635.2 mn and operating income decreasing by 68.2% to USD 246.2 mn from USD 774.0 mn, as total operating expenses increased by 145.7% to USD 3.06 bn from USD 1.25 bn, driven by a 131.9% increase in cost of service and a 71.2% increase in selling, general and administrative expenses, and as the prior-year quarter included a USD 343.9 mn gain on business dispositions. By segment, SMB revenue increased by 21.4% to USD 1.66 bn, Enterprise revenue increased by 435.6% to USD 836.3 mn and Platforms revenue increased by 122.5% to USD 633.6 mn. Management raised its expectation for annual run-rate Worldpay integration expense synergies to USD 650 mn, reaffirmed its 2026 outlook of normalized, constant-currency adjusted net revenue growth of approximately 4.0% to 5.0% and adjusted EPS of USD 13.60 to USD 13.80, and said it has returned more than USD 1.4 bn of capital to shareholders year-to-date, with a quarterly dividend per share (DPS) of USD 0.25 declared, unchanged from a year earlier. The gap between GAAP EPS of USD 1.06 and adjusted EPS of USD 3.58 mainly reflects USD 754.5 mn of acquired intangibles amortization and USD 222.4 mn of acquisition, integration and separation expenses that are excluded from the adjusted figures, while the year-on-year GAAP changes are not like-for-like because 2026 includes Worldpay and 2025 excludes the divested Issuer Solutions business, which suggests that normalized growth of just over 4.0% is a better gauge of underlying performance.
- Digital Payments Financial Results
The table below compares the latest reported results of Circle and Global Payments with the corresponding prior-year period:
|
Cytonn Report: Digital Payments Financial Results |
||||
|
Company |
Metric |
2025 |
2026 |
y/y Change |
|
Circle (Q3) |
Total revenue and reserve income (USD mn) |
16.9% |
||
|
Net income from continuing operations (USD mn) |
5.4% |
|||
|
Diluted EPS (USD) |
31.3% |
|||
|
Total operating expenses (USD mn) |
16.0% |
|||
|
Global Payments (Q3) |
Revenues (USD bn) |
63.7% |
||
|
Net income attributable to Global Payments (USD mn) |
(55.8%) |
|||
|
Diluted EPS (USD) |
(59.8%) |
|||
|
Dividend per share (USD) |
0.0% |
|||
|
Total operating expenses (USD bn) |
145.7% |
|||
Source: Circle and Global Payments earnings releases
Digital Payments Stock Performance
The table below presents a snapshot of NYSE-listed digital payments stocks, covering Visa, Mastercard, American Express (AXP), Wise Plc, Block, Global Payments and PayPal:
|
Cytonn Report: Digital Payments NYSE and LSE stock perfomance |
|||||||
|
Company |
Year Open 2026 |
Price 30/10/2026 |
Price 06/11/2026 |
w/w change |
YTD change |
Forward P/E |
|
|
American Express |
372.7 |
319.1 |
321.0 |
0.6% |
(13.9%) |
||
|
Visa |
346.5 |
413.6 |
422.7 |
2.2% |
22.0% |
||
|
Mastercard |
563.1 |
638.0 |
652.7 |
2.3% |
15.9% |
||
|
Circle |
83.5 |
72.5 |
67.9 |
(6.4%) |
(18.7%) |
||
|
Block |
65.2 |
76.2 |
85.5 |
12.1% |
31.2% |
||
|
PayPal Holdings |
58.1 |
57.0 |
59.2 |
3.9% |
1.9% |
||
|
Global Payments Inc |
77.0 |
96.8 |
97.4 |
0.6% |
26.5% |
||
|
Average |
|
|
|
|
|
26.0x |
|
Source: Visa, AXP, Circle, Global Payments, Mastercard, Block and PayPal financials, NYSE, PE* calculated using forward estimates FY’2027 financials
The stocks are currently trading at an average P/E multiple of 26.0x, indicating that investors are pricing in strong future earnings growth and are prepared to pay a substantial premium for current earnings. This also suggests that valuations may be stretched relative to near-term fundamentals.
We expect the global digital payments sector to continue shifting toward greater payment sovereignty and reduced reliance on traditional card-based networks, as governments and financial institutions prioritize control over domestic payment ecosystems. The European Central Bank's progress toward launching the Digital Euro signals a growing move toward central bank-backed payment infrastructure, which is likely to intensify competition with established private networks such as Visa Inc. and Mastercard Incorporated. However, despite these favourable long-term tailwinds, valuations remain elevated, with the companies under coverage trading at an average forward P/E of 26.0x, suggesting that much of the expected growth may already be priced in. As such, we expect near-term performance to remain sensitive to regulatory developments, execution risk, and how quickly incumbents and new entrants adapt to the changing payments landscape.
Following the release of the H1’2026 results by Kenyan insurance firms, the Cytonn Financial Services Research Team undertook an analysis on the financial performance of the listed insurance companies and the key factors that drove the performance of the sector. In this report, we assess the main trends in the sector, and areas that will be crucial for growth and stability going forward, seeking to give a view on which insurance firms are the most attractive and stable for investment. As a result, we shall address the following:
- Insurance Penetration in Kenya,
- Key Themes that Shaped the Insurance Sector in H1’2026,
- Interest rates
- Industry Highlights and Challenges,
- Performance of The Listed Insurance Sector in H1’2026, and,
- Conclusion & Outlook of the Insurance Sector.
Section I: Insurance Penetration in Kenya
Insurance uptake in Kenya remains low compared to other key economies, with insurance penetration coming in at 2.5%, according to Atlas Magazine. The low penetration rate, which is below the global average of 7.2%, according to the Allianz Global Insurance Report 2026, is attributable to the fact that insurance uptake is still seen as a luxury and mostly taken only when it is necessary or a regulatory requirement. Notably, insurance penetration growth declined by 0.2% points to 2.5% from 2.7% recorded in H1'2025, as the industry’s gross premium grew 20.4% to Kshs290.6 bn in H1'2026, from Kshs241.3 bn in H1'2025. The chart below shows Kenya’s insurance penetration for the last 15 years: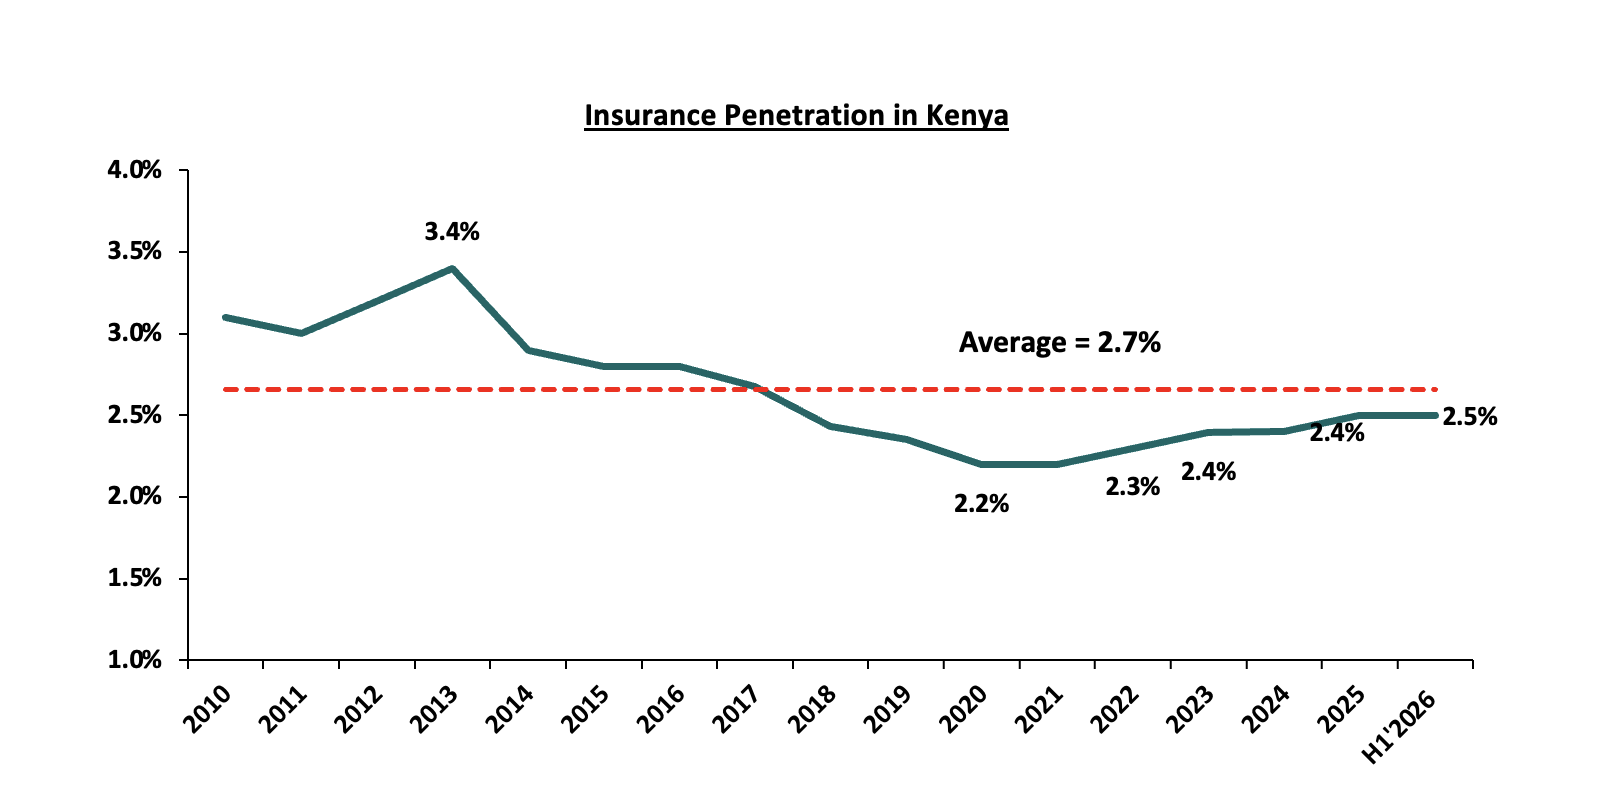
Source: Cytonn Research
The chart below shows the insurance penetration in other economies across Africa: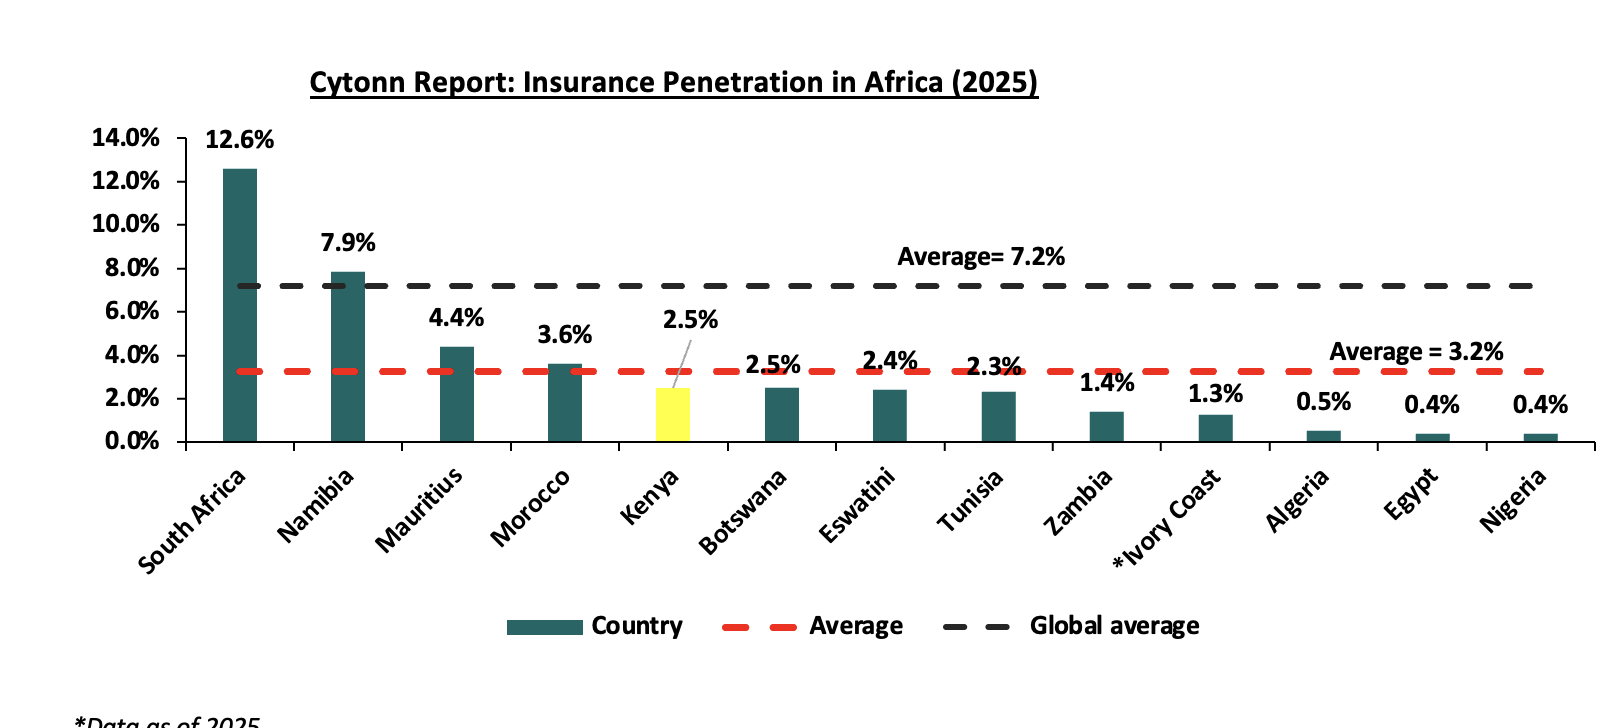
*Data as of 2025
Source: Atlas Magazine
Insurance penetration in Africa has remained relatively low, averaging 3.2% in h1’2026. The below average figures indicate that while digital transformation and product innovation are advancing, they have not yet overcome structural barriers like low disposable income, limited awareness, and skepticism about insurers. South Africa remains the leading in the continent, but most of the continent continues to grapple with underinsurance, leaving households and businesses vulnerable to shocks as the gap between Africa and the rest of the world remans wide.
Section II: Key Themes that Shaped the Insurance Sector in H1’2026
In H1’2026, Kenya’s macroeconomic conditions tightened, with inflation picking up and the Shilling weakening against the dollar. Notably, the inflation rate in H1’2026 averaged 5.3%, 1.6% points higher than the 3.7% average in H1’2025, with the Kenyan Shilling having depreciated by 20.5 bps against the USD to Kshs 129.5 from Kshs 129.2 in H1’2025. As such, according to the Q2'2026 Insurance Regulatory Authority Insurance Industry Release, the insurance sector showcased resilience recording a 20.4% growth in gross premium to Kshs 290.6 bn in H1'2026, from Kshs 241.3 bn in H1'2025. Insurance claims also increased by 7.4% to Kshs 132.0 bn in H1'2026, from Kshs 122.9 bn in H1'2025.
On the other hand, the overall GDP growth rate improved to 5.1% in Q2’2026, from 4.9% recorded in a similar period last year according to Q2’2026 Quarterly Gross Domestic Product Report. Higher economic growth generally supports the insurance industry by increasing household incomes, business activity, and investment, which, in turn, boosts demand for insurance products and expands the industry's premium base. The strong performance of the insurance sector in H1'2026 therefore reflects resilient underlying economic growth, even as insurers had to navigate a tougher operating backdrop of elevated inflation and a weaker Shilling over the same period, underscoring the sector’s ability to grow premiums despite the broader macro environment.
Notably, premium income in H1'2026 compared to a 45.7% contribution in H1'2025, while general insurance business contributed 48.8% of the industry’s premium income compared to 53.8% in the same period. During the period, long-term insurance premiums increased by 33.6% to Kshs 147.5 bn from Kshs 110.4 bn in H1'2025, while general insurance premiums grew by 9.2% to Kshs 141.9 bn from Kshs 129.9 bn in H1'2025. Microinsurance premiums amounted to Kshs 1.2 bn, bringing the industry’s total gross premium income to Kshs 290.6 bn in H1'2026. Additionally, motor insurance and medical insurance classes of insurance accounted for 68.1% of the gross premium income under the general insurance business, compared to 67.6% recorded in H1'2025. As for long-term insurance business, the major contributors to gross premiums were deposit administration and life assurance class, accounting for 29.4% and 19.9% respectively in H1'2026, compared to the 54.8% combined contribution by the two classes in H1'2025.
Key highlights from the industry performance:
- The sector’s investment income declined in H1'2026 by 5.3% to Kshs 73.0 bn from Kshs 77.1 bn in H1'2025, mainly attributable to a 7.5% decrease in investment income under the long-term insurance business to Kshs 62.4 bn from Kshs 67.5 bn in H1'2025. The performance was however supported by a 10.3% increase in investment income under the general insurance business to Kshs 10.5 bn from Kshs 9.5 bn in H1'2025,
- Insurance uptake improved in H1'2026, with industry gross premiums increasing by 20.4% to Kshs 290.6 bn from Kshs 241.3 bn in H1'2025. The growth was driven by increased activity in both the long-term and general insurance segments, reflecting the sector’s resilience amid tightened macroeconomic conditions, marked by elevated inflation and a weaker Shilling during the period. Nevertheless, low insurance penetration and limited awareness of insurance products continue to constrain the industry’s growth potential.
- Enhanced convenience and operational efficiency driven by the continued diversification of distribution and premium collection channels, including bancassurance, digital platforms, and strengthened agency networks. Partnerships between insurers and both banks and telecommunications companies have deepened in H1'2026, with players such as Britam, CIC, Jubilee, and Sanlam leaning further into mobile and digital channels to cut distribution costs and reach previously underserved segments. Safaricom’s continued push into insurance distribution adds another layer to this shift, positioning telco infrastructure as a genuine alternative to the branch-and-agent model that has traditionally defined how Kenyans buy cover, and
- Rising smartphone penetration is quietly becoming a distribution channel in its own right for insurers. Financing schemes such as “Lipa Mdogo Mdogo,” which let consumers acquire smartphones through instalment plans stretching up to twelve months, continue to push device ownership higher across income segments that previously found smartphones out of reach. As more Kenyans come online through these financing models, insurers gain a growing pool of potential customers reachable through mobile premium payments, policy servicing, and embedded insurance products bundled directly into digital ecosystems, presenting insurers an opportunity to design device, health, and microinsurance products tailored to first-time insurance buyers discovering cover through their phones rather than an agent.
On valuations, listed insurance companies are trading at a price to book (P/Bv) of 1.0x, lower than listed banks at 1.3x, but both are lower than their 20-year historical averages of 1.3x and 1.6x, for the insurance and banking sectors respectively. These two sectors are attractive for long-term investors supported by the strong economic fundamentals. The chart below shows the price to book comparison for Listed Banking and Insurance Sectors: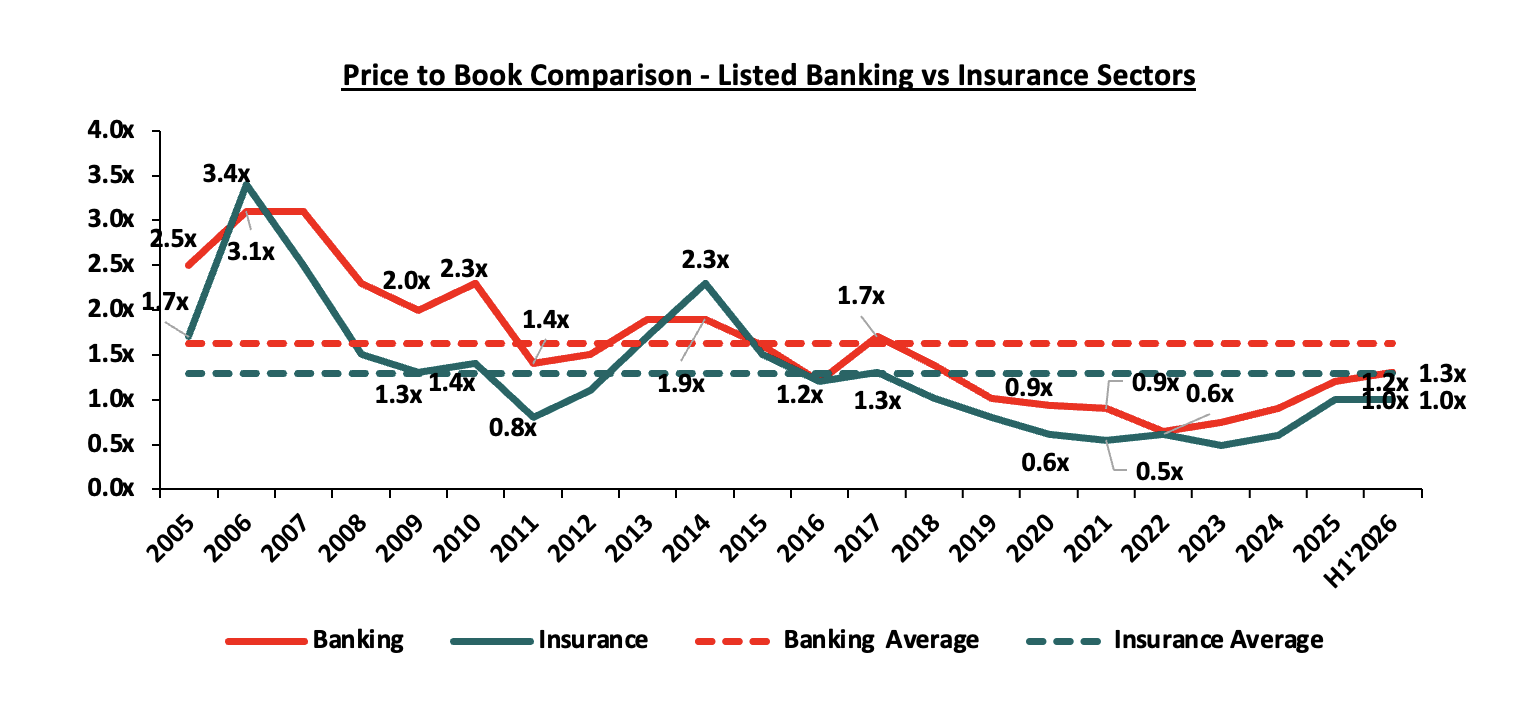
Source: Cytonn Research
The key themes that have continued to drive the insurance sector include:
- Technology and Innovation
The Kenyan insurance industry’s embrace of AI deepened further in H1'2026, moving from isolated pilots toward tools now handling claims at scale. Britam General Insurance launched its AI Motor Assessment Service in March 2026, a drive-through facility that uses AI to assess accident damage via photographs and settle minor motor claims within two hours, down from the industry’s typical five-day turnaround, while also screening for fraud by verifying image authenticity and flagging inconsistent damage claims. On the fraud detection front specifically, Smart Applications International Unveiled Smart Detect AI in May 2026, a platform using machine learning, behavioural analytics, and clinical logic to flag suspicious healthcare claims before and after submission, giving insurers earlier visibility into hidden risks at a time when industry estimates put fraud prevalence as high as 20% of total claims. IRA also advanced regulatory sandboxes and tighter digital insurance guidelines to ensure oversight evolves alongside AI-driven underwriting and claims automation. Collectively, these developments suggest the industry’s digital shift, once driven by a handful of first-mover products, is now reinforced by purpose-built fraud detection tools and a regulator actively building the rules to match, pointing to AI becoming a permanent rather than experimental feature of how Kenyan insurance is distributed, serviced, and policed against abuse.
- Regulation
To position the sector within a globally competitive financial services landscape, the regulator has been actively implementing regulations aimed at tackling both longstanding and emerging challenges. The COVID-19 environment proved challenging especially on the regulatory front, as it was a balance between remaining prudent as an underwriter and adhering to the set regulations given the negative effects the pandemic. Regulations used for the insurance sector in Kenya include the Insurance Act Cap 487 and its accompanying schedule and regulations, Retirement Benefits Act Cap 197 and The Companies Act. In H1’2026, regulation remained a key aspect affecting the insurance sector and the key themes in the regulatory environment include;
- IFRS 17- IFRS 17, Insurance Contracts, replaced IFRS 4 and became effective for annual periods beginning on or after 1st January 2023. The standard establishes the principle for recognition, measurement, presentation and disclosure of insurance contracts with the objective of ensuring insurance companies provide relevant information that faithfully represents the contracts. Kenyan insurers have now reported under the standard for multiple financial years, and the sustained rise in claims-driven combined ratios observed through FY’2024, FY’2025 and into H1'2026 continues to reflect, in part, the standard’s more granular recognition of insurance service expenses. The standard continues to give better information on profitability by providing more insights into the current and future profitability of insurance contracts. Separation of financial and insurance results in the income statement continues to allow for better analysis of core performance for the entities and better comparability of insurance companies,
- Risk Based Supervision - IRA has been implementing risk-based supervision through guidelines that require insurers to maintain a capital adequacy ratio of at least 200.0% of the minimum capital, with insurers falling below the 100.0% floor subject to regulatory intervention by the Authority. The risk-based capital requirement is derived by aggregating the capital charges for insurance risk, market risk and credit risk using the square root of the sum of their squares to account for diversification benefits, with the operational risk charge then added to arrive at the total requirement. This sits above hard capital floors set out in the Insurance Act, which require general insurers to hold the highest of Kshs 600.0 mn, the IRA-determined risk-based capital, or 20.0% of net earned premiums from the preceding financial year, while life insurers must hold the highest of Kshs 400.0 mn, the risk-based capital, or 5.0% of life business liabilities for the year. The regulation requires insurers to monitor capital adequacy and solvency margins on a quarterly basis, with the main objective being to safeguard the insurer's ability to continue as a going concern and provide shareholders with adequate returns. Looking ahead, the IRA is set to roll out Risk-Based Supervision Phase II, which will further tie capital held to actual risk exposure. We expect more mergers within the industry as smaller companies struggle to meet the minimum capital adequacy ratios. We also expect insurance companies to adopt prudential practices in managing and taking on risk and reduction of premium undercutting in the industry as insurers will now have to price risk appropriately.
- Mandatory Reinsurance Cessions to Kenya Re: The reinsurance cession framework flagged in the FY’2025 report has since been formally gazetted as the Insurance (Amendment) Regulations, 2025 (Legal Notice 55 of 2026), commencing 26 March 2026. The regulations require every insurer to submit copies of all general insurance reinsurance treaties, both existing and future, to Kenya Reinsurance Corporation, while long-term insurers must cede a prescribed share of every policy issued in Kenya to the Corporation on the basis set out in the regulations. Formalizing this requirement into law, rather than leaving it as a circular-level directive, strengthens the Corporation’s claim on industry cession flows and reduces insurers’ room to negotiate around it, continuing the regulator’s broader push to retain more domestic risk and premium within the local market rather than ceding it to foreign reinsurers.
- Capital Raising, M&A, and Corporate Restructuring
- Sanlam Allianz’s Rights Issue Reaches Its Conclusion: The IRA approved the final tranche of deferred shares from the 2025 rights issue in September 2026. The allotment expanded Sanlam Allianz Holdings’ issued share capital by 18.5%, from 543.4 million to 644.0 million shares, with the bulk of the unsubscribed rights absorbed directly by parent company Sanlam Allianz Africa (SAZ) in its capacity as underwriter. This has had an unintended regulatory consequence: SAZ’s stake has climbed to 71.47%, breaching the Insurance Act’s 66.67% cap on foreign ownership, forcing a mandated sell-down of 4.81% on the NSE by September 2027. The episode is a useful illustration of how capital raising initiatives, even when well-intentioned and compliance-driven, can create new regulatory friction when underwriting arrangements push ownership structures past statutory limits.
- Absa Exits Insurance Manufacturing in Kenya: Absa Group agreed to sell its entire 63.3% stake in both First Assurance Company Limited and Absa Life Assurance Kenya Limited to First Assurance Investments Limited for approximately Kshs 3.8 bn, conditional on IRA approval. The transaction effectively returns these assets to the same ownership network Barclays Africa originally bought out, now at a materially higher valuation than Kshs 2.9 bn paid at the time. The move fits a broader pattern among regional banking groups of retreating from capital-intensive insurance underwriting while retaining the more capital-light banking and distribution relationships, a trend worth watching given how much of the sector’s growth narrative has otherwise centred on banks deepening, rather than exiting, their insurance exposure through bancassurance.
- Sanlam Allianz Consolidates Its Life Insurance Structure: Sanlam Allianz Holdings announced plans to absorb its wholly-owned life subsidiary, Sanlam Allianz Life Insurance (Kenya) Limited, directly into the NSE-listed parent, transferring Kshs 38.5 bn in assets and collapsing a corporate layer that has existed since the group’s prior general insurance consolidation in 2025. The subsidiary will surrender its license and eventually dissolve, with the listed entity itself renamed Sanlam Allianz Life Insurance (Kenya) PLC pending shareholder approval. While this does not alter the group’s 2.9% share of the long-term insurance market, it reflects a broader push toward structural simplification across the group, aimed at reducing overhead and consolidating oversight rather than raising fresh capital or changing ownership.
- CAK Cleared First Chartered’s Full Takeover of ICEA Lion: The Competition Authority of Kenya authorized First Chartered Securities Capital to acquire sole control of ICEA Lion Insurance Holdings. The clearance paves the way for First Chartered, which already held 75.9% of ICEA Lion, to buy out the remaining 24.1% stake from Eastern Africa Holdings Limited, the Leapfrog-managed vehicle through which Prudential Financial held its interest. The regulatory sign-off effectively closes out Prudential’s five-year exposure to Kenyan insurance, after the US insurer agreed in January 2026 to exit the market entirely, and adds to a broader theme of foreign and institutional investors reassessing their exposure to Kenyan insurance manufacturing, even as the capital-intensive underwriting side sees ownership consolidate back toward founding shareholders.
D. Section III: Interest rates
The interest rate environment has remained on a declining trend since FY’2025, and the insurance sector’s preference for government securities has only deepened as a result. Government securities now make up 78.4% Kshs 893.7 bn of long-term insurers’ investment portfolios in H1'2026, up 25.6% from Kshs 711.5 bn in H1'2025, and 58.8% Kshs 123.4 bn of general insurers’ portfolios, up 14.5% from Kshs 107.8 bn. Industry-wide, government securities holdings grew 23.3% to Kshs 1.1 tn, now accounting for 73.2% of the sector’s total Kshs 1.4 tn investment book. The sustained increase in holdings of government securities, even as yields moderate, reflects insurers’ continued preference for low-risk and liquid assets that are well suited to meeting policyholder obligations and matching long-term liabilities.
On the policy rate itself, the Central Bank of Kenya’s Monetary Policy Committee cut the Central Bank Rate (CBR) by 25.0 bps to 8.75% at its February 10, 2026 meeting. The Committee has since held the CBR unchanged at 8.75% across four consecutive meetings through October 2026, most recently at its October 7, 2026 meeting, as inflation crept up to 7.3% in October, within CBK’s target range of between 2.5%-7.5%. Private sector credit growth held firm at 10.6%. The extended hold, now stretching eight months since the February cut, signals the MPC’s preference to let prior easing work through the economy rather than risk reigniting inflationary pressure, even as insurers’ investment income growth continues to feel the lagged effect of lower yields locked in earlier in the cycle.
We expect the rate environment to continue weighing on insurers’ investment income growth into H2'2026, given the sector’s heavy skew toward government securities, which made up 78.4% of long-term insurers’ investments and 58.8% of general insurers’ investments as at H1'2026. On the liability side, the lower rate environment reduces the discount rates typically applied to actuarial liabilities and annuity or guaranteed-return products, which could push up reserving requirements for life insurers with rate-sensitive guarantees, further compressing the net benefit of the easing cycle to date. We expect insurers to keep favouring government securities given this dominant allocation, but with growing incentive to extend duration on new purchases to lock in still-elevated long-end yields before any resumption of easing, and to watch the MPC’s December 2026 meeting closely for signals on whether the current hold persists or gives way to either direction.
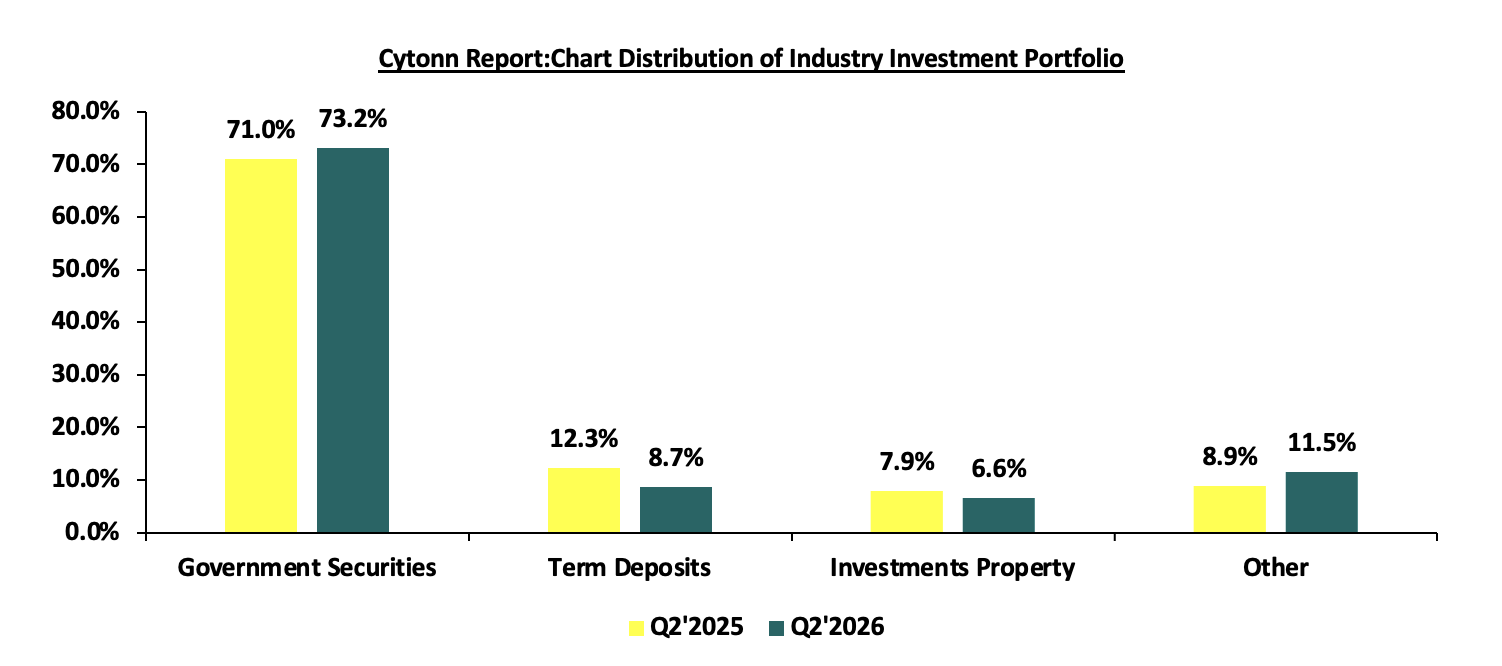
Source: IRA
Section IV: Industry Highlights and Challenges
The insurance sector has recorded consistent growth over the past ten years, though recent global uncertainties including the impact of regional conflicts and supply chain disruptions have introduced second guesses about the pace of expansion. Even so, the industry is expected to continue growing at a moderate rate, supported by Kenya’s improving economic fundamentals and a steady rise in insurance premiums, factors which are likely to enhance the sector’s capacity to maintain profitability.
On the regulatory front, the Finance Act, 2026, introduced several provisions with direct implications for insurers. The Act replaced the term “life insurance fund” with “statutory fund” across the Income Tax Act, aligning the tax framework more closely with the Insurance Act and broadening the tax base for insurance companies. It also removed the VAT exemption on payment processing, settlement, merchant acquiring, gateway, and aggregation services, subjecting digital premium collection channels to the standard 16% VAT rate effective July 1, 2026. While these reforms are intended to enhance revenue collection and harmonize fiscal and regulatory frameworks, they impose additional financial and administrative burdens on insurers, making regulatory compliance an increasingly important challenge for the industry.
Industry Challenges:
- Insolvency: A major challenge facing Kenya’s insurance industry is the financial instability and insolvency of key players. During H1'2026, IRA placed Corporate Insurance Company and KUSCCO Mutual Assurance Limited under statutory management, a move that reduced industry paid-up capital by Kshs 200.0 mn and Kshs 400.1 mn respectively. Separately, Star Discover Micro Insurance Limited was excluded from the Q2'2026 industry release entirely for failing to meet statutory reporting requirements, continuing a pattern of non-compliant insurers being dropped from official analysis. These interventions reflect broader structural problems within the sector, inadequate risk management practices, weak corporate governance, and exposure to unprofitable business lines, that continue to undermine consumer confidence and disrupt policyholders forced to seek alternative coverage.
- Insurance fraud: Insurance fraud is an intentional deceit performed by an applicant or policyholder for financial advantage. The problem persists particularly in medical and motor insurance, with industry estimates still indicating roughly one in every five medical claims is fraudulent. In H1'2026, 77 fraud cases were reported to the Insurance Fraud Investigation Unit,17 in April, 15 in May, and a sharp jump to 45 in June alone, the top categories being forgery. To curb these challenges, the industry has continued implementing artificial intelligence to detect and prevent fraud, with Britam launching an AI-powered motor claims assessment service in March 2026 and Smart Applications International Unveiling Smart Detect AI for healthcare claims fraud in May 2026.,
- High Market competition: Despite Kenya’s relatively low insurance penetration, the industry remains highly fragmented, with numerous insurers competing for a limited customer base across life, general, and microinsurance segments. Competition has intensified with non-traditional players, particularly banks and telecommunications companies, expanding into insurance distribution. Safaricom’s continued push into insurance distribution and Equity Group’s expansion through Equity Life Assurance have accelerated the convergence between the insurance, banking, and telecommunications sectors, compelling traditional insurers to innovate and diversify their products to retain market share. This competitive pressure has continued to drive product innovation: across H1'2026, IRA approved 42 new or repackaged insurance products across general insurance, long-term insurance, and microinsurance business lines, reflecting the industry’s ongoing efforts to remain competitive in a rapidly evolving market.
- Declining consumer confidence in the insurance industry: Consumer complaints against insurers remained a persistent challenge in H1'2026. IRA registered 354 complaints from policyholders and beneficiaries during the period, with general insurers accounting for 85.3% of complaints against long-term insurers’ 14.7%. Resolution rates stood at 42.1% for general insurance complaints and 57.7% for long-term insurance complaints, meaning a majority of general insurance complaints, and a meaningful share of long-term ones, remained unresolved within the period. Most complaints continue to relate to delayed or disputed claims settlements, policy interpretation, and other service delivery issues, experiences that continue to erode consumer trust and slow the uptake of insurance products,
- Macroeconomic Uncertainty Global conflicts, commodity price volatility, and supply chain disruptions have created a fragile economic outlook. For insurers, this translates into unpredictable investment returns and slower premium growth. The uncertainty makes long‑term planning more difficult, forcing companies to adopt conservative strategies while still trying to meet growth targets, and,
Section V: Performance of the Listed Insurance Sector in H1’2026
The table below highlights the performance of the listed insurance sector, showing the performance using several metrics, and the key take-outs of the performance.
|
Listed Insurance Companies H1’2026 Earnings and Growth Metrics |
|||||||||
|
Insurance |
Core EPS Growth |
Insurance revenue growth |
Claims growth |
Loss Ratio |
Expense Ratio |
Combined Ratio |
ROaE |
ROaA |
|
|
CIC |
70.3% |
17.8% |
18.9% |
95.8% |
95.8% |
191.5% |
4.3% |
1.3% |
|
|
Britam |
56.7% |
13.7% |
30.7% |
76.8% |
57.0% |
133.7% |
7.7% |
1.2% |
|
|
Jubilee Insurance |
12.7% |
1.2% |
4.6% |
92.2% |
42.8% |
135.0% |
6.1% |
1.4% |
|
|
Sanlam |
(7.4%) |
1.1% |
9.2% |
85.1% |
41.3% |
126.4% |
2.9% |
0.3% |
|
|
Liberty |
(46.0%) |
99.1% |
(14.9%) |
58.1% |
63.6% |
121.7% |
2.3% |
0.5% |
|
|
*H1'2026 Weighted Average |
38.2% |
14.7% |
18.1% |
83.3% |
60.7% |
144.1% |
6.4% |
1.2% |
|
|
**H1'2025 Weighted Average |
(6.6%) |
13.7% |
19.8% |
85.2% |
102.5% |
187.7% |
5.6% |
1.3% |
|
|
*Market cap weighted as at 06/11/2026 **Market cap weighted as at 06/10/2025 |
|
||||||||
The key take-outs from the above table include;
- Core EPS growth recorded a significant weighted increase of 38.2% in H1’2026, from the weighted decline of 6.6% recorded in H1’2025. The increase in earnings was largely supported by the decrease in the expense ratio to 60.7% in H1’2026, from 102.5% in H1’2025,
- Insurance revenue grew at 14.7% in H1’2026, compared to a growth of 13.7% in H1’2025, while claims growth decreased marginally to 18.1% in H1’2026, compared to 19.8% growth recorded in H1’2025 on a weighted average basis,
- The loss ratio across the sector decreased to 83.3% in H1’2026, from 85.2% in H1’2025,
- The expense ratio decreased to 60.7% in H1’2026, from 102.5% in H1’2025, pointing to increased operating efficiency across the sector,
- The insurance core business remained unprofitable, with the combined ratio decreasing to 144.0% as at H1’2026, from 187.7% in H1’2025, and,
- On average, the insurance sector delivered a Return on Average Equity (ROaE) of 6.4%, an increase from a weighted Return on Average Equity of 5.6% in H1’2026, even as Return on Average Assets (ROaA) declined to 1.2% in H1’2026, from 1.3% in H1’2025.
Based on the Cytonn H1’2026 Insurance Report, we ranked insurance firms from a franchise value and from a future growth opportunity perspective with the former getting a weight of 40.0% and the latter a weight of 60.0%.
For the franchise value ranking, we included the earnings and growth metrics as well as the operating metrics shown in the table below in order to carry out a comprehensive review:
|
Listed Insurance Companies H1’2026 Franchise Value Score |
||||||
|
Insurance Co. |
Loss Ratio |
Expense Ratio |
Combined Ratio |
Tangible Common Ratio |
Franchise Value Score |
Ranking |
|
Liberty Holdings |
58.1% |
63.6% |
121.7% |
18.3% |
15 |
1 |
|
Jubilee Holdings |
92.2% |
42.8% |
135.0% |
19.8% |
17 |
2 |
|
Britam Holdings |
76.8% |
57.0% |
133.7% |
12.9% |
17 |
2 |
|
CIC Group |
95.8% |
95.8% |
191.5% |
13.6% |
20 |
4 |
|
Sanlam Kenya |
85.1% |
41.3% |
126.4% |
10.7% |
21 |
5 |
|
* H1’2026 Weighted Average |
83.3% |
57.8% |
141.1% |
15.4% |
|
|
The Intrinsic Valuation is computed through a combination of valuation techniques, with a weighting of 40.0% on Discounted Cash-flow Methods, 35.0% on Residual Income and 25.0% on Relative Valuation. The overall H1’2026 ranking is as shown in the table below:
|
Listed Insurance Companies H1’2026 Comprehensive Ranking |
|||||
|
Insurance Co. |
Franchise Value Score |
Intrinsic Value Score |
Weighted Score |
H1'2026 Ranking |
H1'2025 Ranking |
|
Britam Holdings |
2 |
1 |
1.4 |
1 |
5 |
|
Liberty Holdings |
1 |
2 |
1.6 |
2 |
3 |
|
Jubilee Holdings |
2 |
3 |
2.6 |
3 |
2 |
|
CIC Group |
4 |
4 |
4.0 |
4 |
1 |
|
Sanlam Kenya |
5 |
5 |
5.0 |
5 |
4 |
Major Changes from the H1’2026 Ranking are;
- Britam Holdings improved to position 1 in H1'2026, from position 5 in H1'2025, driven by a strengthened franchise score,
- Liberty Holdings improved to position 2 in H1'2026, from position 3 in H1'2025, supported by a strong improvement in underlying underwriting performance as the insurance service result nearly doubled, up 99.0% to Kshs 448.0 mn,
- Jubilee Holdings declined to position 3 in H1'2026, from position 2 in H1'2025, weighed down by a weakened franchise score as the insurance service result fell 60.0% to Kshs 445.0 mn amid high claims and rising medical costs in the health insurance segment,
- CIC Group declined to position 4 in H1'2026, from position 1 in H1'2025, driven by a weakened franchise score as underwriting profit declined during the period, with the 70.3% growth in profit after tax to Kshs 1.1 bn driven mainly by investment gains rather than improved underwriting performance, and,
- Sanlam Allianz Kenya declined to position 5 in H1'2026, from position 4 in H1'2025, driven by a weakened franchise score as profit before tax from continuing operations fell 28.0% to Kshs 201.0 mn on higher claims and lower investment returns, with the 32.0% growth in gross written premiums insufficient to offset the margin pressure during the period.
Section VI: Conclusion & Outlook of the Insurance Sector
Kenya’s insurance industry navigated a more challenging macroeconomic backdrop in H1'2026 compared to the prior year. Inflation averaged 5.3%, up from 3.7% in H1'2025, though it remained within the Central Bank of Kenya’s target range of 2.5%-7.5%, while the Kenyan Shilling depreciated by 20.5 bps against the US Dollar over the same period. The Monetary Policy Committee cut the Central Bank Rate by 25.0 bps to 8.75% in February 2026 before holding it unchanged across four consecutive meetings through October 2026, a stance that has continued to weigh on insurers’ investment income even as the broader economy expanded, with GDP growth improving to 5.1% in Q2'2026 from 4.9% a year earlier. Despite this tougher operating environment, the sector demonstrated clear resilience, with industry gross premiums growing 20.4% to Kshs 290.6 bn and the sector-wide combined ratio improving markedly to 144.1% from 187.7% in H1'2025, driven primarily by a sharp reduction in the expense ratio to 60.7% from 102.5%. However, insurance penetration remains low at 2.5% in H1’2026, underscoring the significant untapped market potential that persists despite the sector’s improved underwriting discipline. Going forward, insurers that strengthen consumer trust, improve operational efficiency and develop affordable, customer-centric products will be better positioned to capitalize on the sector’s long-term growth opportunities.
The outlook for the insurance industry remains positive, supported by structural growth opportunities across retail insurance, health insurance, digital distribution and regional expansion. The increasing adoption of technology, changing consumer behaviour and growing demand for financial protection products are expected to reshape how insurers design, distribute and price insurance solutions. To sustain growth and improve profitability, insurers will need to focus on the following strategic priorities:
- Rebuilding customer confidence through better claims handling: Consumer confidence continues to be a defining factor in how quickly insurance uptake can grow across the market. Despite strong premium growth, IRA registered 354 complaints in H1'2026 alone, with resolution rates of just 42.1% for general insurance and 57.7% for long-term insurance, meaning a majority of complaints, particularly those tied to delayed or disputed claims settlements, remained unresolved within the period. Insurers will need to enhance transparency, simplify policy wording, improve claims turnaround times and adopt customer-centric approaches to rebuild trust and encourage greater voluntary uptake of insurance products.
- Deepening digital adoption to widen insurance reach: Reaching underserved and informal market segments is increasingly being driven by how far insurers can push their digital capabilities. The period saw AI move from isolated pilots toward tools handling claims at scale, exemplified by Britam’s AI Motor Assessment Service, which settles minor motor claims within two hours, and Smart Applications International’s Smart Detect AI platform for healthcare fraud detection. Continued partnerships with fintechs, mobile network operators and digital platforms, alongside IRA’s advancement of regulatory sandboxes, will provide further opportunities to distribute affordable microinsurance and usage-based insurance products at scale.
- Diversifying investment portfolios beyond Government Securities - Insurers’ heavy reliance on a single asset class is becoming harder to justify as the rate cycle turns. With government securities now accounting for 73.2% of the industry’s Kshs 1.4 tn investment book, even as yields moderate in a declining rate environment, insurers face growing pressure to diversify beyond their traditional concentration in government paper. Exploring alternative investments, including infrastructure, climate-related assets and other long-term development financing vehicles, can help insurers enhance investment returns while reducing the sector’s vulnerability to the lagged effects of monetary easing on income from fixed-income holdings.
- Strengthening Governance and Risk Oversight Amid Evolving Regulation: The regulatory environment showed no signs of standing still in H1'2026, with fresh rules and enforcement action adding to the sector’s compliance load. The formal gazettement of the Insurance (Amendment) Regulations, 2025 tightened mandatory reinsurance cessions to Kenya Reinsurance Corporation, while IRA’s statutory management interventions at Corporate Insurance Company and KUSCCO Mutual Assurance Limited underscored persistent governance and solvency risks within the sector. Insurers will need to strengthen governance frameworks, improve capital management ahead of the IRA’s planned Risk-Based Supervision Phase II, and adopt stronger enterprise risk management practices to remain resilient and competitive.
- Designing Products Around Untapped Consumer Segments: Several underserved segments, among them health, agriculture, climate risk, retirement and small business cover, continue to represent untapped room for growth. With long-term insurance overtaking general insurance as the largest contributor to industry premium in H1'2026, driven heavily by deposit administration and life assurance classes, insurers that develop affordable and relevant products across both life and general lines will be better positioned to capture new market segments.
- Pursuing Growth Beyond Kenya’s Borders: Beyond its borders, Kenya’s standing as East Africa’s financial hub keeps opening doors for insurers looking to diversify away from a single domestic market. Expanding into underserved markets across Africa, where insurance penetration averaged just 3.2% in H1'2026, well below the global average of 7.2%, can help insurers reduce concentration risk while benefiting from rising demand for risk management solutions as economies continue to develop.
Overall, Kenya’s insurance sector continues to show meaningful room for growth, and the sharp improvement in underwriting discipline seen in H1'2026, reflected in the combined ratio’s decline to 144.1% from 187.7% in H1'2025, is an encouraging signal even as the sector’s core business remains unprofitable on an underwriting basis alone. Unlocking the sector’s full potential will still require a continued shift away from traditional insurance models toward more accessible, technology-driven and customer-focused solutions. The insurers that successfully close trust gaps, embrace innovation and diversify their sources of growth will be best positioned to capture the long-term opportunities presented by the evolving insurance landscape.
Disclaimer: The views expressed in this publication are those of the writers where particulars are not warranted. This publication is meant for general information only and is not a warranty, representation, advice or solicitation of any nature. Readers are advised in all circumstances to seek the advice of a registered investment advisor.

- Talk to us
- Kenya
- P.O Box 20695 - 00200, Nairobi, Kenya
- Cell +254709101200
- Tel +254709101200
- WhatsApp +254741676635
- United States
- +254709101200
- DOWNLOAD OUR APP
-


- Kenya
- 8th Floor, Pinetree Plaza, Kaburu Drive, Ngong Road, Nairobi, Kenya
- USA
- Suite 1150, 1775 Eye Street NW, USA, Washington DC 20006, USA
- Investments
- High Yield
- Private Equity
- Real Estate
- Real Estate
- RiverRun Estates
- Cytonn Towers
- The Ridge
- Taraji Heights
- The Alma