Kenya Listed Banks FY’2021 Report, & Cytonn Weekly #15/2022
By Cytonn Research, Apr 17, 2022
Executive Summary
Fixed Income
During the week, T-bills remained undersubscribed, with the overall subscription rate coming in at 48.6%, down from the 60.4% recorded last week. The 91-day paper recorded the highest subscription rate, receiving bids worth Kshs 4.8 bn against the offered Kshs 4.0 bn, translating to a subscription rate of 120.0%, an increase from the 59.6% recorded the previous week. The subscription rate for the 182-day and 364-day papers declined to 26.0% and 42.5%, respectively, from 39.3% and 81.7%, recorded the previous week. The yields on the government papers were on an upward trajectory with yields on the 91-day, 182-day and 364-day papers increasing by 4.7 bps, 9.6 bps and 0.2 bps, to 7.4%, 8.2% and 9.7%, respectively;
During the week, the Cabinet Secretary for the National Treasury tabled the Finance Bill 2022 in Parliament for consideration. Key to note, the Finance Bill has been tabled two months earlier in April as compared to June in previous years, in order to provide Parliament with ample time to discuss the bill, before it winds down ahead of the August 2022 general elections. Additionally, the Energy and Petroleum Regulatory Authority (EPRA) released their monthly statement on the maximum fuel price in Kenya effective 15th April 2022 to 14th May 2022 highlighting that super petrol, diesel and kerosene prices increased by 7.3%, 8.6% and 9.6% to Kshs 144.6 per litre, Kshs 125.5 per litre and Kshs 113.4 per litre, from Kshs 129.7 per litre, Kshs 110.6 per litre and Kshs 103.5, respectively. Key to note, the current prices are the highest ever recorded in the country;
Equities
During the week, the equities market was on an upward trajectory, with NASI, NSE 20 and NSE 25 gaining by 0.6%, 1.2% and 0.7%, respectively, taking their YTD performance to losses of 5.3%, 2.2% and 4.5% for NASI, NSE 20 and NSE 25, respectively. The equities market performance was driven by gains recorded by large cap stocks such as Bamburi and Equity Group of 5.8% and 1.4%, respectively while ABSA and Co-operative Bank both gained by 1.2%. The gains were however weighed down by losses recorded by other large cap stocks such as EABL and BAT of 1.2% and 0.9%, respectively. Additionally during the week, Equity Group Holdings Plc, announced that it has injected USD 100 mn (Kshs 11.5 bn) to its recently opened subsidiary in the Democratic Republic of Congo (DRC), Equity BCDC, in an aim to fund development projects as well as large manufacturing and mining companies in DRC;
Real Estate
During the week, Co-operative Bank of Kenya revealed in its FY’2021 annual report that it had received Kshs 549.8 mn loan from the Kenya Mortgage Refinance Company (KMRC) in June 2021, with the aim of financing affordable housing mortgage loans. Additionally, the University of Nairobi (UoN) announced plans to build a 4,000-bed capacity hostels through a Public Private Partnership (PPP) deal with the Private Infrastructure Group (PIDG), an international infrastructure development and finance organization. In the retail sector, Naivas supermarket, a local retail chain, opened a new outlet in Kiambu Mall, along Kiambu Road bringing its total operating outlets to 83. In the hospitality sector, hotel chain Sarova Woodlands took over management of Kisumu’s Imperial hotel, after entering into a 7-year agreement with the Gilani Family, the owners of the facility. For statutory reviews, the Finance Bill 2022 which was tabled to the parliament for debate highlights that a property includes land, building, aircraft, ship, or motor vehicle, thus sufficient to serve as security for unpaid taxes, and therefore if a taxpayer who is also the owner of a property fails to pay tax by the stipulated date, the subject property shall be the security for the unpaid tax. For the Real Estate Investments Trusts (REITs), ICEA Lion Asset Management (ILAM) Limited revealed that it had purchased five million units of Fahari I-REIT in 2021, currently worth Ksh 33.0 mn, as the REIT closed the week trading at an average price of Kshs 6.6 per share;
Focus of the Week
Following the release of the FY’2021 results by Kenyan listed banks, this week we analyze the performance of the 10 listed local banks, identify the key factors that influenced their performance, and give our outlook for the banking sector;
- Weekly Rates:
- Cytonn Money Market Fund closed the week at a yield of 10.58%. To invest, dial *809#;
- Cytonn High Yield Fund closed the week at a yield of 14.06% p.a. To invest, email us at sales@cytonn.com and to withdraw the interest, dial *809#;
- Effie Otieno, a Real Estate Research Analyst, moderated a panel on Twitter Spaces to discuss the performance of Real Estate Investments Trusts in Kenya. The panel included Edwin H. Dande, the CEO of Cytonn Investments, and, Doreen Onwong’a, Partner at KN Law LLP. Listen to the conversation here,
- We continue to offer Wealth Management Training every Thursday and every third Saturday of the month, from 9:00 am to 11:00 am, through our Cytonn Foundation. The training aims to grow financial literacy among the general public. To register for any of our Wealth Management Trainings, click here;
- If interested in our Private Wealth Management Training for your employees or investment group, please get in touch with us through wmt@cytonn.com;
- Any CHYS and CPN investors still looking to convert through assignment of debt are welcome to consider one of the five projects currently available for assignment, click here for the latest term sheet;
- Cytonn Insurance Agency acts as an intermediary for those looking to secure their assets and loved ones’ future through insurance namely; Motor, Medical, Life, Property, WIBA, Credit and Fire and Burglary insurance covers. For assistance, get in touch with us through insuranceagency@cytonn.com;
- Cytonnaire Savings and Credit Co-operative Society Limited (SACCO) provides a savings and investments avenue to help you in your financial planning journey. To enjoy competitive investment returns, kindly get in touch with us through clientservices@cytonn.com;
Real Estate Updates:
- For an exclusive tour of Cytonn’s real estate developments, visit: Sharp Investor's Tour, and for more information, email us at sales@cytonn.com;
- Phase 3 of The Alma is now ready for occupation. To rent please email properties@cytonn.com;
- We have 8 investment-ready projects, offering attractive development and buyer targeted returns; See further details here: Summary of Investment-ready Projects;
- For recent news about the group, see our news section here;
Hospitality Updates:
- We currently have promotions for Staycations. Visit cysuites.com/offers for details or email us at sales@cysuites.com;
Money Markets, T-Bills & T-Bonds Primary Auction:
During the week, T-bills remained undersubscribed, with the overall subscription rate coming in at 48.6%, down from the 60.4% recorded last week despite liquidity in the money markets easing as evidenced by the decline in the interbank rate to 4.5% from 4.8% recorded last week. The 91-day paper recorded the highest subscription rate, receiving bids worth Kshs 4.8 bn against the offered Kshs 4.0 bn, translating to a subscription rate of 120.0%, an increase from the 59.6% recorded the previous week. The subscription rate for the 182-day and 364-day papers declined to 26.0% and 42.5%, respectively, from 39.3% and 81.7%, recorded the previous week. The yields on the government papers were on an upward trajectory with yields on the 91-day, 182-day and 364-day papers increasing by 4.7 bps, 9.6 bps and 0.2 bps, to 7.4%, 8.2% and 9.7%, respectively. The government accepted bids worth Kshs 11.6 bn, out of the Kshs 11.7 bn worth of bids received, translating to an acceptance rate of 99.2%, reflecting the government’s debt appetite.
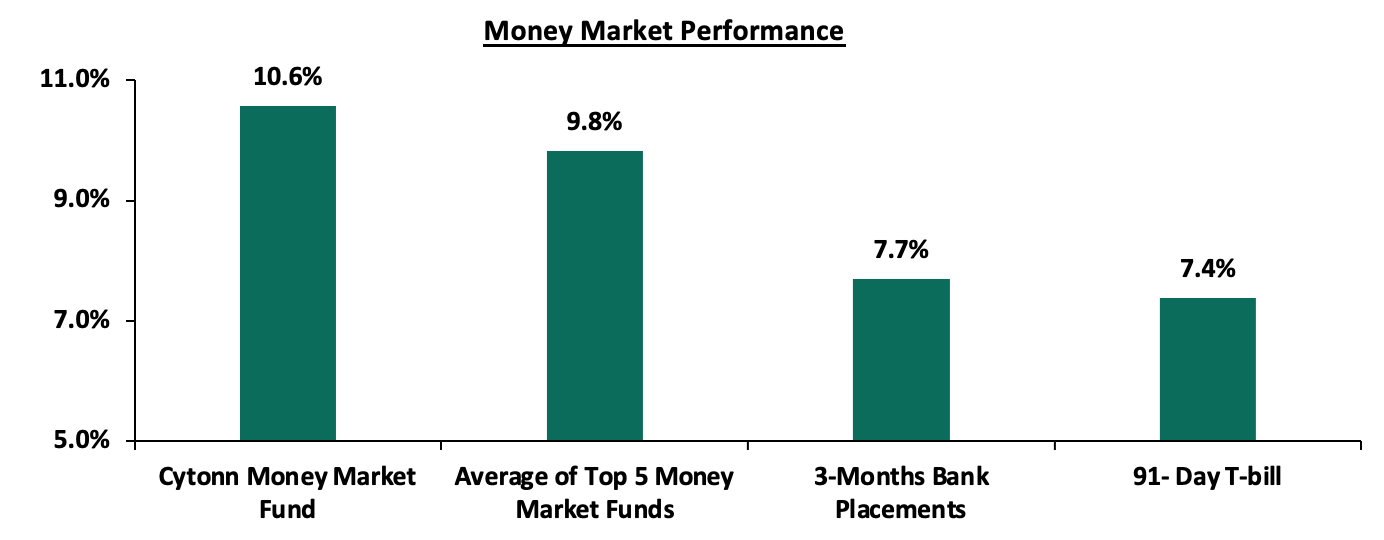
In the money markets, 3-month bank placements ended the week at 7.7% (based on what we have been offered by various banks), while the yield on the 91-day T-bill increased by 4.7 bps to 7.4%. The yield on the Cytonn Money Market Fund increased by 0.1% to 10.6%, from 10.5% recorded the previous week while the average yield of the Top 5 Money Market Funds remained relatively unchanged at 9.8%, as recorded the previous week.
The table below shows the Money Market Fund Yields for Kenyan Fund Managers as published on 14th April 2022:
|
Money Market Fund Yield for Fund Managers as published on 14th April 2022 |
||
|
Rank |
Fund Manager |
Effective Annual Rate |
|
1 |
Cytonn Money Market Fund |
10.6% |
|
2 |
Zimele Money Market Fund |
9.9% |
|
3 |
Nabo Africa Money Market Fund |
9.8% |
|
4 |
Madison Money Market Fund |
9.5% |
|
5 |
Sanlam Money Market Fund |
9.3% |
|
6 |
Apollo Money Market Fund |
9.3% |
|
7 |
Dry Associates Money Market Fund |
9.2% |
|
8 |
CIC Money Market Fund |
9.0% |
|
9 |
Co-op Money Market Fund |
8.6% |
|
10 |
GenCap Hela Imara Money Market Fund |
8.4% |
|
11 |
NCBA Money Market Fund |
8.4% |
|
12 |
Orient Kasha Money Market Fund |
8.4% |
|
13 |
ICEA Lion Money Market Fund |
8.4% |
|
14 |
AA Kenya Shillings Fund |
7.9% |
|
15 |
Old Mutual Money Market Fund |
7.5% |
|
16 |
British-American Money Market Fund |
7.1% |
Source: Business Daily
Liquidity:
During the week, liquidity in the money markets eased, with the average interbank rate declining to 4.5%, from 4.8%, recorded the previous week, partly attributable to government payments which offset tax remittances. The average interbank volumes traded declined by 53.7% to Kshs 14.5 bn, from Kshs 31.3 bn recorded the previous week.
Kenya Eurobonds:
During the week, the yields on Kenyan Eurobonds were on an upward trajectory, partly attributable to investors attaching higher risk premium on the country due to increasing inflationary pressures, local currency depreciation and risks around the August 2022 elections. Yields on the 10-year and 30-year bonds issued in 2018, 12-year bond issued in 2019 and the 12-year bond issued in 2021 all increased by 0.4% points to 8.7%, 10.0%, 9.2% and 9.1%, respectively. Similarly, yields on the 7-year bond issued in 2019 increased by 0.5% points to 8.9%, while yields on the 10-year bond issued in 2014 increased by 0.3% points to 7.2%. Below is a summary of the performance:
|
Kenya Eurobond Performance |
||||||
|
2014 |
2018 |
2019 |
2021 |
|||
|
Date |
10-year issue |
10-year issue |
30-year issue |
7-year issue |
12-year issue |
12-year issue |
|
3-Jan-22 |
4.4% |
8.1% |
8.1% |
5.6% |
6.7% |
6.6% |
|
1-Apr-22 |
6.7% |
8.1% |
9.4% |
8.1% |
8.5% |
8.3% |
|
8-Apr-22 |
6.9% |
8.3% |
9.6% |
8.4% |
8.8% |
8.7% |
|
11-Apr-22 |
7.0% |
8.4% |
9.7% |
8.4% |
8.9% |
8.7% |
|
12-Apr-22 |
7.1% |
8.5% |
10.0% |
8.8% |
9.1% |
9.0% |
|
13-Apr-22 |
7.2% |
8.7% |
10.0% |
8.9% |
9.2% |
9.1% |
|
Weekly Change |
0.3% |
0.4% |
0.4% |
0.5% |
0.4% |
0.4% |
|
MTD Change |
0.5% |
0.6% |
0.6% |
0.8% |
0.7% |
0.8% |
|
YTD Change |
2.8% |
0.6% |
1.9% |
3.3% |
2.5% |
2.5% |
Source: CBK
Kenya Shilling:
During the week, the Kenyan shilling depreciated by 0.1% against the US dollar, to close the week at Kshs 115.4, from Kshs 115.3 recorded the previous week, partly attributable to increased dollar demand from the oil and energy sectors. Key to note, this is the lowest the Kenyan shilling has ever depreciated against the dollar. On a year to date basis, the shilling has depreciated by 2.0% against the dollar, in comparison to the 3.6% depreciation recorded in 2021. We expect the shilling to remain under pressure in 2022 as a result of:
- Rising global crude oil prices on the back of supply constraints and geopolitical pressures at a time when demand is picking up with the easing of COVID-19 restrictions and as economies reopen. Key to note, risks abound the recovery following the emergence of the new COVID-19 variants,
- Increased demand from merchandise traders as they beef up their hard currency positions in anticipation for more trading partners reopening their economies globally,
- An ever-present current account deficit due to an imbalance between imports and exports, with Kenya’s current account deficit estimated to come in at 5.6% of GDP in the 12 months to February 2022 compared to the 4.3% for a similar period in 2021. The wider deficit reflects a higher import bill, particularly for oil, which more than offset increased receipts from agricultural and services exports, and remittances, and,
- The aggressively growing government debt, with Kenya’s public debt having increased at a 10-year CAGR of 18.4% to Kshs 8.0 tn in December 2021, from Kshs 1.5 tn in December 2011 thus putting pressure on forex reserves to service some of the public debt.
The shilling is however expected to be supported by:
- High Forex reserves currently at USD 8.3 bn (equivalent to 4.9-months of import cover), which is above the statutory requirement of maintaining at least 4.0-months of import cover, and the EAC region’s convergence criteria of 4.5-months of import cover. In addition, the reserves were boosted by the USD 1.0 bn proceeds from the Eurobond issued in July 2021, USD 972.6 mn IMF disbursement, USD 130.0 mn World Bank loan financing received in June 2021, and, the USD 750.0 mn World Bank loan facility issued in March 2022, and,
- Improving diaspora remittances evidenced by a 23.5% y/y increase to USD 321.5 mn as of February 2022, from USD 260.3 mn recorded over the same period in 2021, which has continued to cushion the shilling against further depreciation.
Weekly Highlights:
- Finance Bill 2022
During the week, the Cabinet Secretary for the National Treasury tabled the Finance Bill 2022 in Parliament for consideration. Key to note, the Finance Bill has been tabled two months earlier in April as compared to June in previous years, in order to provide Parliament with ample time to discuss the bill, before it winds down ahead of the August 2022 general elections. If Parliament approves the bill, the bill will be forwarded for presidential assent, after which the proposals will come into effect. Some of the proposals include;
Under the Income Tax Act;
- The Finance Bill 2022 proposes to increase digital service tax (DST) to 3.0% from the current 1.5% of either consideration received in respect of the service provided in the case of a digital service provider or the commission or fee paid for the use of the platform in the case of a digital marketplace provider excluding VAT charged for the service. The bill also proposes to exempt non-resident entities with a permanent establishment in Kenya from DST. The increase in DST, is commendable as it will allow the Government to tap more into the growing online economy while allowing the Government a share of revenues made by multinational companies. However, we expect the increased taxes to be passed on to the end users and increase cost of online transactions, and,
- The Finance bill proposes to increase the Capital Gains Tax (CGT) on transfer or sale of property by an individual or company to 15.0% from the current 5.0%. Key to note, the government had proposed to increase capital gains tax to 12.5% in the Finance Bill 2019, but the proposal was rejected by parliament. An increase in CGT rate would be unfavorable for individuals and companies dealing in sale of property and would result in increased dealing and transaction costs. The Bill also proposes to tax gains from financial derivatives for foreigners under the CGT rate of 15.0%. We expect that taxing gains from financial derivatives for foreigners will worsen their uptake, which has been slow since their introduction in 2019, and,
- The Finance Bill 2022 seeks to limit the allowable deductions on investments made outside Nairobi and Mombasa Counties to expenditure on investments in hotel buildings, buildings used for manufacturing and machinery used for manufacturing, from the current 100.0% of start-up expenditure. The incentives were in place to encourage investments outside Nairobi and Mombasa Counties in order to spur economic growth. Rolling back of the incentives is expected to reduce the attractiveness of investments outside the two counties.
Under the Excise Duty Act;
- The Finance Bill proposes to empower the Kenya Revenue Authority’s Commissioner General to exempt specific excisable products from the annual inflation adjustments depending on the economic circumstances in the relevant year. Key to note, KRA had gazetted an inflationary adjustment of 5.0% in November 2021 on specific products in a bid to raise Kshs 3.7 bn in excise duty tax. However, the inflation adjustment was frozen by the High Court of Kenya. We expect that this provision will allow the Commissioner general to exempt critical products like fuel from inflationary adjustment particularly for periods when fuel prices are high, in order to prevent further increase in the cost of living, and,
- The Finance Bill 2022 seeks to increase excise duty on various goods such as bottled water and non-alcoholic beverages by 9.5% to Kshs 6.6 per litre, from the current Kshs 6.0 per litre. Excise duty on fruit and vegetable juices will increase by 9.3% from Kshs 13.3 per litre from Kshs 12.2 per litre. The bill further proposes to increase excise duty on items such as cosmetic and beauty products, powdered beer and spirits, among others. Should the bill be passed, we expect the contribution of excise duty tax to total tax revenue to increase from the current 13.8% as estimated for the Fiscal Year 2022/2023 in the Budget Statement.
Under the Value Added Tax Act;
- The Finance Bill 2022 proposes to remove maize flour, cassava flour, wheat and meslin flour from the list of tax exempt goods under the Second Schedule to the Value Added Tax (VAT) Act 2013. This would see the named goods subjected to the VAT at a rate of 16.0% and a subsequent increase in food prices. The implication of this increase will be an increase in the cost of living with maize flour being a staple meal in Kenyan households. We also expect this changes to exert upward pressure on the inflation basket as food is a headline contributor to Kenya’s inflation.
Under the Capital Markets Act;
- The Finance Bill has proposed to amend the definition of an investment advisor by deleting the requirement for an investment advisor to be a company incorporated under the Companies act and substituting it with such legal entity as prescribed by the regulations. We expect this provision to allow for individuals and partnerships to seek regulatory approval to provide investment advisory services.
We expect the increase in excise duty scope to significantly contribute to the projected Kshs 50.2 bn in additional tax revenue for the FY’2022/23. The main focus of the Finance Bill 2022 has been on increasing the government’s revenue, which is key in the path towards fiscal consolidation. We expect the aggressive revenue collection measures to propel the government towards reducing the fiscal deficit as a percentage of GDP from the current 11.4%, to the target of 6.2%, for FY’2022/2023.
- Fuel Prices
During the week, the Energy and Petroleum Regulatory Authority (EPRA) released their monthly statement on the maximum fuel price in Kenya effective 15th April 2022 to 14th May 2022. Notably, super petrol, diesel and kerosene prices increased by 7.3%, 8.6% and 9.6% to Kshs 144.6 per litre, Kshs 125.5 per litre and Kshs 113.4 per litre, from Kshs 129.7 per litre, Kshs 110.6 per litre and Kshs 103.5, respectively. Key to note, the current prices are the highest ever recorded in the country. Below are the key take-outs from the statement:
The performance in fuel prices was attributable to:
- An increase in the average landed costs of Super Petrol by 20.5% to USD 814.9 per cubic meter in March 2022, from USD 676.4 per cubic meter in February 2022,
- An increase in the average landed costs of Diesel by 24.7% to USD 844.6 per cubic meter in February 2022, from USD 677.3 per cubic meter in 2022,
- An increase in the average landed costs of Kerosene by 11.8% to USD 693.0 per cubic meter in February 2022, from USD 619.6 per cubic meter in February 2022, and,
- The depreciation of the Kenyan shilling during the period by 0.7% to Kshs 114.6 in March 2022, from Kshs 113.8 in February 2022.
However, the fuel prices were supported from further increase by:
- The fuel subsidy program under the Petroleum Development Fund which resulted in subsidies of Kshs 29.1 on Super Petrol, Kshs 40.2 on Diesel and Kshs 26.5 on Kerosene during the month,
- Removal of suppliers margins since October 2021, and,
- The decline in the Free on Board (FOB) price of Murban crude oil in March 2022 by 11.5% to USD 85.1 per barrel, from USD 74.4 per barrel in February 2022.
Globally, global fuel prices have continued to increase, recording a 36.2% increase to USD 106.1 per barrel as of 16th April 2022, from USD 77.9 per barrel recorded on 1st January 2022, driven by persistent supply chain constraints worsened by the geopolitical pressures occasioned by the Russian invasion of Ukraine. Largely, the fuel subsidy program under the National Treasury has cushioned Kenyans from the high fuel prices. However, we believe that the program is unsustainable and will be depleted should the average landed costs of fuel continue to rise. Further the program has come under increasing pressure from the Oil Marketing Companies (OMCs) due to delayed payment of compensation amounts. Key to note, the compensation amounts for Super Petrol and Diesel in April 2022 increased by 42.6% and 45.7% to Kshs 29.1 per litre and Kshs 40.2 per litre from Kshs 20.4 per litre and Kshs 27.6 per litre, respectively in March 2022, while those for Kerosene declined by 1.5%, to Kshs 26.5 per litre in April 2022 from Kshs 26.9 per litre in March 2022. Despite the additional Kshs 24.9 bn for stabilization of oil market prices and the rationalization of Capital expenditure, allocated in the recently assented-to Supplementary Budget, the National Treasury would have to disburse an estimated Kshs 15.0 bn monthly to meet the full subsidy in the period of review. As such, the additional amount to the program would be depleted in two months. We expect an elevation in the cost of living and inflation, attributable to fuel being a major contributor to Kenya’s headline inflation and fuel prices being a major input cost in majority of Kenya’s sectors such as manufacturing, transport and energy.
Rates in the Fixed Income market have remained stable due to the relatively ample liquidity in the money market. The government is 3.9% ahead of its prorated borrowing target of Kshs 534.4 bn having borrowed Kshs 555.5 bn of the Kshs 661.6 bn borrowing target for the FY’2021/2022. We expect a gradual economic recovery as evidenced by the revenue collections of Kshs 1.2 tn during the first eight months of the current fiscal year, which was equivalent to 100.8% of the prorated revenue collection target. However, despite the projected high budget deficit of 11.4% and the affirmation of the `B+’ rating with negative outlook by Fitch Ratings, we believe that the support from the IMF and World Bank will mean that the interest rate environment will remain stable since the government is not desperate for cash. Owing to this, our view is that investors should be biased towards short-term fixed-income securities to reduce duration risk.
Markets Performance
During the week, the equities market was on an upward trajectory, with NASI, NSE 20 and NSE 25 gaining by 0.6%, 1.2% and 0.7%, respectively, taking their YTD performance to losses of 5.3%, 2.2% and 4.5% for NASI, NSE 20 and NSE 25, respectively. The equities market performance was driven by gains recorded by large cap stocks such as Bamburi and Equity Group of 5.8% and 1.4%, respectively while ABSA and Co-operative Bank both gained by 1.2%. The gains were however weighed down by losses recorded by other large cap stocks such as EABL and BAT of 1.2% and 0.9%, respectively.
During the week, equities turnover increased by 20.4% to USD 11.6 mn, from USD 9.6 mn recorded the previous week, taking the YTD turnover to USD 269.4 mn. Foreign investors remained net sellers, with a net selling position of USD 5.0 mn, from a net selling position of USD 2.7 mn recorded the previous week, taking the YTD net selling position to USD 22.4 mn.
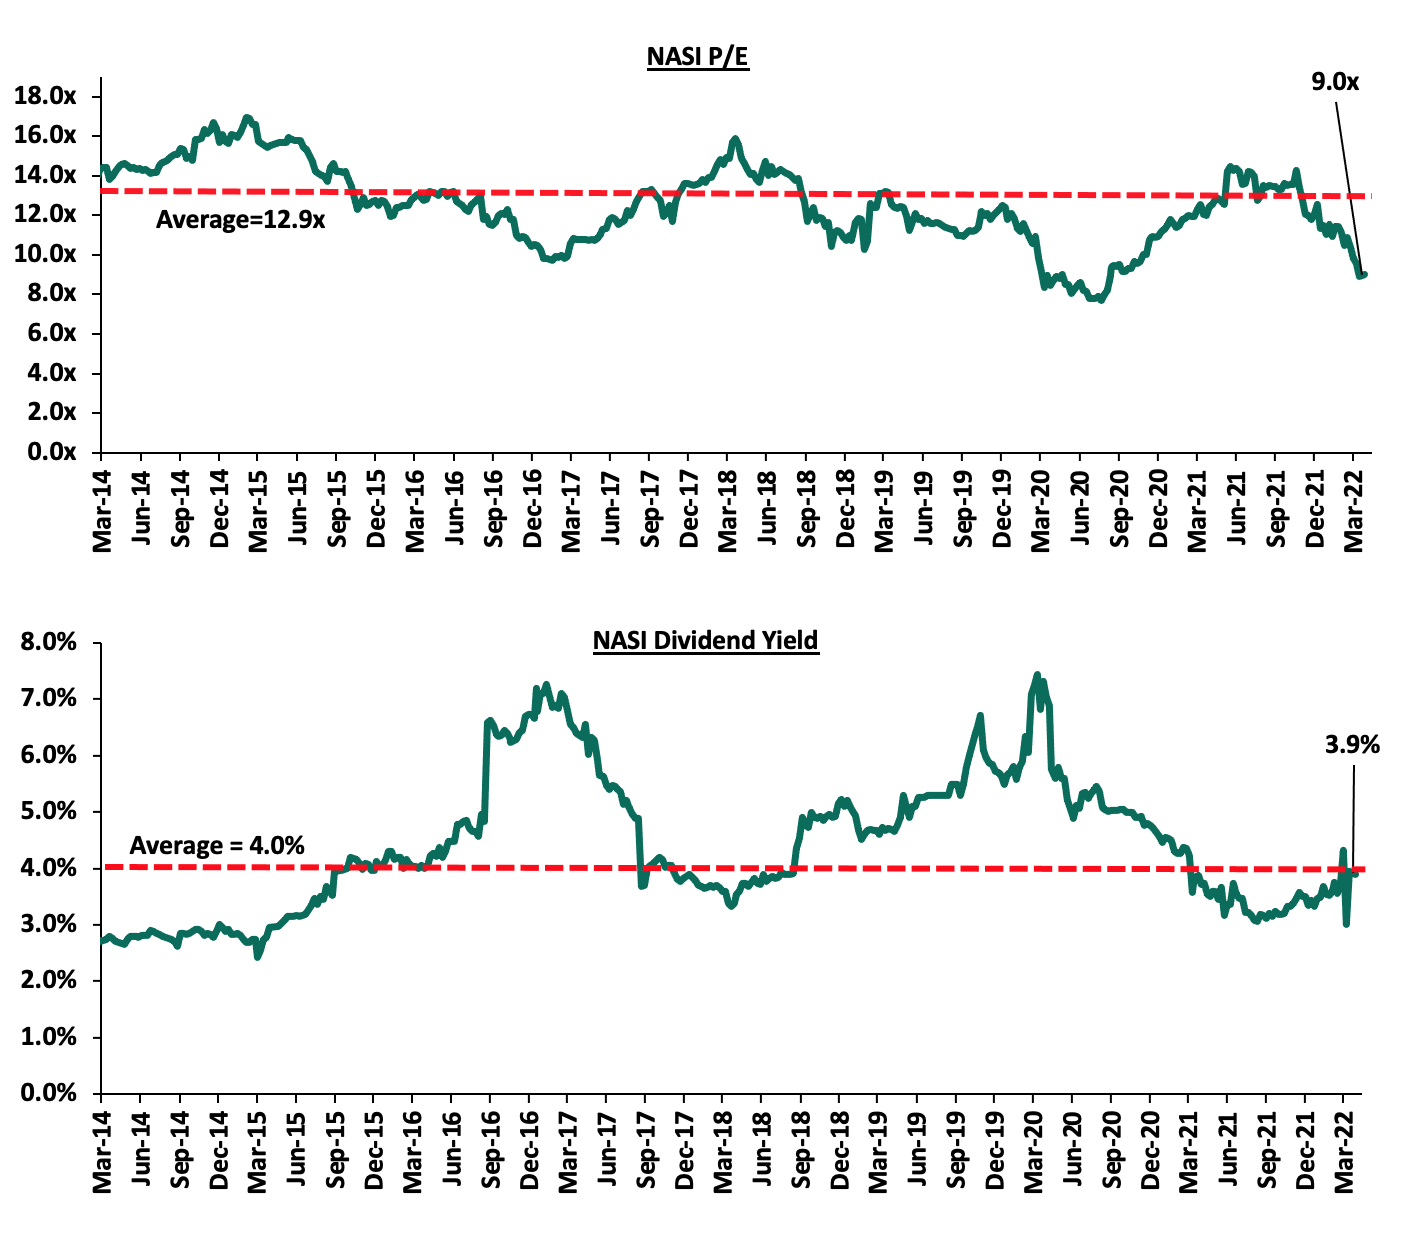
The market is currently trading at a price to earnings ratio (P/E) of 9.0x, 30.2% below the historical average of 12.9x, and a dividend yield of 3.9%, 0.1% points below the historical average of 4.0%. Key to note, NASI’s PEG ratio currently stands at 1.2x, an indication that the market is trading at a premium to its future earnings growth. A PEG ratio greater than 1.0x indicates the market may be overvalued while a PEG ratio less than 1.0x indicates that the market is undervalued. The current P/E valuation of 9.0x is 16.8% above the most recent trough valuation of 7.7x experienced in the first week of August 2020. The charts below indicate the historical P/E and dividend yields of the market:
Weekly Highlights:
Equity Group Invests USD 100.0 mn (Kshs 11.5 bn) in its Congo Subsidiary
During the week, Equity Group Holdings Plc announced that it has injected USD 100.0 mn (Kshs 11.5 bn) to its subsidiary in the Democratic Republic of Congo (DRC), Equity BCDC, in order to fund development projects as well as large manufacturing and mining companies in the DRC given the country’s diverse and immense natural resources as well as the sectors contribution to economic growth. Notably, the two sectors contribute only 7.0% to the Group’s loan book, thus providing an opportunity that the bank can tap into, to diversify its revenues. The additional funding adds to the Kshs 17.4 bn that Equity had already invested in Equity BCDC by the end of 2021, making it the subsidiary with the highest investment after Kenya, where Equity’s value of investment stood at Kshs 40.7 bn as of December 2021. Additionally, the Group announced a USD 1.6 bn (Kshs 184.7 bn) trade investment commitment in the Democratic Republic of Congo by 26 Kenyan investors including Small and Medium Enterprises (SMEs) and entrepreneurs. The increased interest by Kenyan investors in DRC follows the signing of the accession treaty into the East African Community (EAC) after admission as the seventh member of the EAC regional block on 8th March 2022. This will allow free movement to the other countries and consequently effective trade.
According to the World Bank, DRC’s interest rate spread in 2020 stood at of 19.8%, higher than Kenya’s spread of 5.0% during the same period and as such, we believe that these spreads will continue to attract more Kenyan banks into the market. Some of the companies that have shown interest in investing in DRC include Rentco Africa, Optiven Group, Greenlight Planet, Jumbo Foam, BIDCO, Geomaps, Nyanja Associates, Kenya Builders and Concreate Company among others.
In the recently released FY’2021 Equity Group Financial results, the group’s geographical diversification strategy continued to emerge as a net positive, with the bank’s various subsidiaries in Uganda, DRC, Rwanda, Tanzania, and South Sudan cumulatively contributing 19.7% to the bank’s total profitability and 32.7% to the group’s total asset base with Equity BCDC contributing 10.0% of the Group’s Profit after tax and 32.2% of the total assets. The firm has also been making efforts to make clients navigate through the tough operating environment brought about by the pandemic having collectively received approximately Kshs 38.0 bn to boost credit flows and liquidity to MSMEs since the pandemic began. As such, we believe that Equity Group will continue to register growth in earnings and revenues as well as expansion in the asset base.
Cytonn Coverage:
|
Company |
Price as at 08/04/2022 |
Price as at 14/04/2022 |
w/w change |
YTD Change |
Year Open 2022 |
Target Price* |
Dividend Yield |
Upside/ Downside** |
P/TBv Multiple |
Recommendation |
|
Kenya Reinsurance |
2.2 |
2.2 |
(2.2%) |
(4.4%) |
2.3 |
3.2 |
4.6% |
49.7% |
0.2x |
Buy |
|
Jubilee Holdings |
273.5 |
267.8 |
(2.1%) |
(15.5%) |
316.8 |
381.7 |
5.2% |
47.8% |
0.5x |
Buy |
|
I&M Group*** |
20.4 |
20.4 |
0.0% |
(4.7%) |
21.4 |
25.4 |
7.4% |
31.8% |
0.6x |
Buy |
|
Liberty Holdings |
6.0 |
5.9 |
(1.0%) |
(15.9%) |
7.1 |
7.7 |
0.0% |
28.9% |
0.4x |
Buy |
|
KCB Group*** |
43.0 |
43.5 |
1.0% |
(4.6%) |
45.6 |
50.5 |
6.9% |
23.1% |
0.9x |
Buy |
|
Co-op Bank*** |
12.7 |
12.9 |
1.2% |
(1.2%) |
13.0 |
14.6 |
7.8% |
21.3% |
1.0x |
Buy |
|
Diamond Trust Bank*** |
56.5 |
57.0 |
0.9% |
(4.2%) |
59.5 |
65.6 |
5.3% |
20.3% |
0.2x |
Buy |
|
Britam |
6.7 |
6.6 |
(1.5%) |
(12.4%) |
7.6 |
7.9 |
0.0% |
18.9% |
1.1x |
Accumulate |
|
Equity Group*** |
49.3 |
50.0 |
1.4% |
(5.2%) |
52.8 |
56.2 |
6.0% |
18.3% |
1.3x |
Accumulate |
|
ABSA Bank*** |
12.3 |
12.4 |
1.2% |
5.5% |
11.8 |
13.4 |
8.9% |
17.1% |
1.2x |
Accumulate |
|
NCBA*** |
26.9 |
26.9 |
0.0% |
5.5% |
25.5 |
28.2 |
11.2% |
16.2% |
0.6x |
Accumulate |
|
Standard Chartered*** |
143.5 |
144.3 |
0.5% |
11.0% |
130.0 |
147.1 |
9.7% |
11.6% |
1.1x |
Accumulate |
|
Stanbic Holdings |
104.0 |
104.3 |
0.2% |
19.8% |
87.0 |
107.2 |
8.6% |
11.5% |
0.9x |
Accumulate |
|
Sanlam |
11.0 |
11.0 |
0.0% |
(4.8%) |
11.6 |
12.1 |
0.0% |
9.6% |
1.2x |
Hold |
|
CIC Group |
2.1 |
2.1 |
(1.4%) |
(4.6%) |
2.2 |
1.9 |
0.0% |
(9.0%) |
0.7x |
Sell |
|
HF Group |
3.0 |
3.0 |
(1.3%) |
(21.1%) |
3.8 |
2.5 |
0.0% |
(17.7%) |
0.2x |
Sell |
|
*Target Price as per Cytonn Analyst estimates **Upside/ (Downside) is adjusted for Dividend Yield ***For Disclosure, these are stocks in which Cytonn and/or its affiliates are invested in |
||||||||||
We are “Neutral” on the Equities markets in the short term. With the market currently trading at a premium to its future growth (PEG Ratio at 1.2x), we believe that investors should reposition towards value stocks with strong earnings growth and that are trading at discounts to their intrinsic value. We expect the discovery of new COVID-19 variants, the upcoming Kenyan general elections and the slow vaccine rollout to continue weighing down the economic outlook. On the upside, we believe that the relaxation of COVID-19 containment measures in the country will lead to improved investor sentiments.
- Residential Sector
- Co-operative Bank Receives Kshs 549.8 mn loan to Finance Mortgages
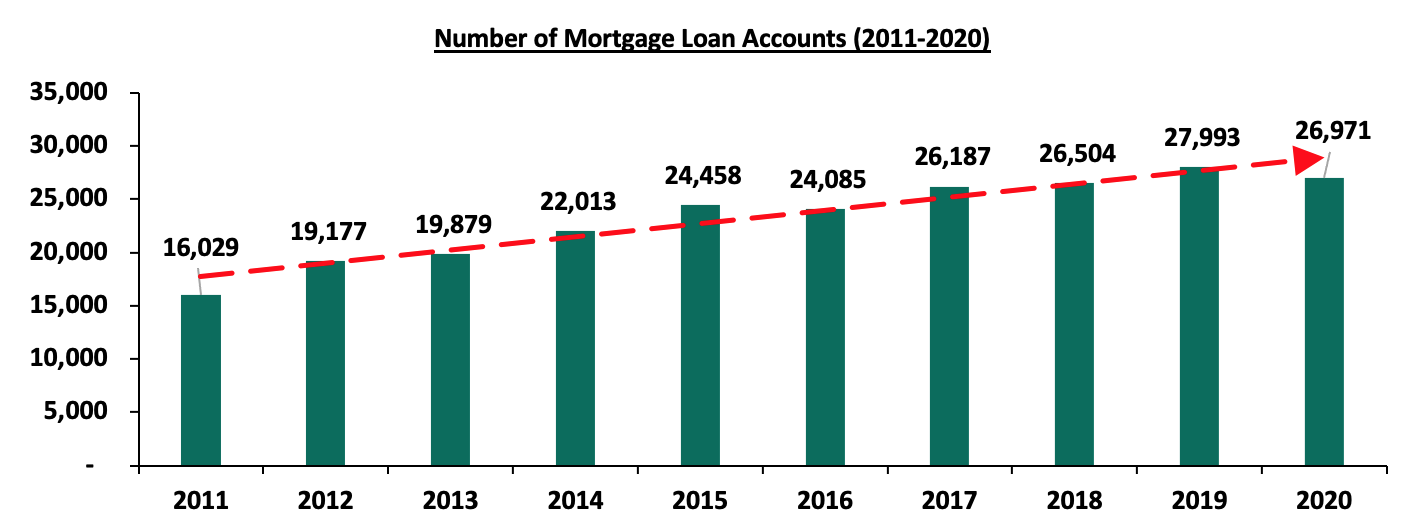
During the week, Co-operative Bank of Kenya revealed in its FY’2021 annual report that it had received Kshs 549.8 mn loan from the Kenya Mortgage Refinance Company (KMRC) in June 2021, with the aim of financing affordable housing mortgage loans. This represents 1.3% of the bank’s total borrowed funds worth Kshs 42.9 bn as of December 2021. The banking institution which also currently accounts for 11.0% of KMRC’s shares totaling 2.0 mn as of 2021 entered into an agreement with the mortgage refinancer in June 2021 for a credit facility at 5.0% p.a, for onward lending to home buyers. Co-operative bank will therefore lend the amount to home buyers earning less than Kshs 150,000 per month at single digit interest rates. Upon lending the whole amount received to home buyers, it would increase their mortgage loans to Kshs 749.8 mn. In turn, the move by the lender is expected to boost mortgage availability and loan accounts which recorded a 3.7% decline to 26,971 in December 2020 from 27,993 in December 2019 according to the Central Bank of Kenya- Bank Supervision Annual Report 2020. The graph below shows the number of mortgage loan accounts in Kenya over the last 10 years;
Source: Central Bank of Kenya (CBK)
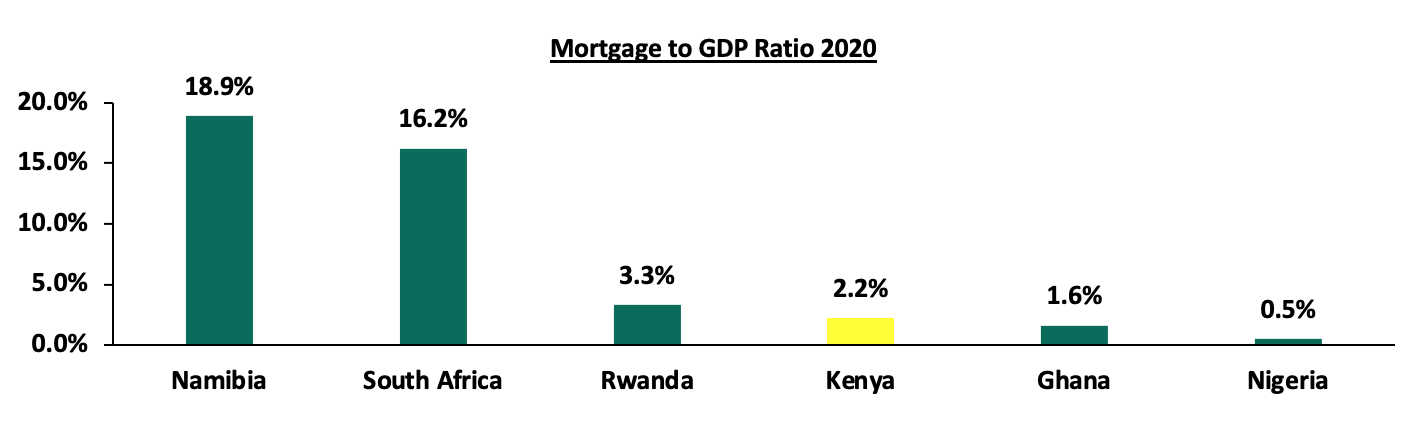
With the above, the Kenyan mortgage sector performance continues to lag behind evidenced by a 2.2% mortgage to GDP ratio, compared to countries such as Namibia and South Africa at 18.9% and 16.2%, respectively as shown in the graph below;
Source: Centre for Affordable Housing Africa
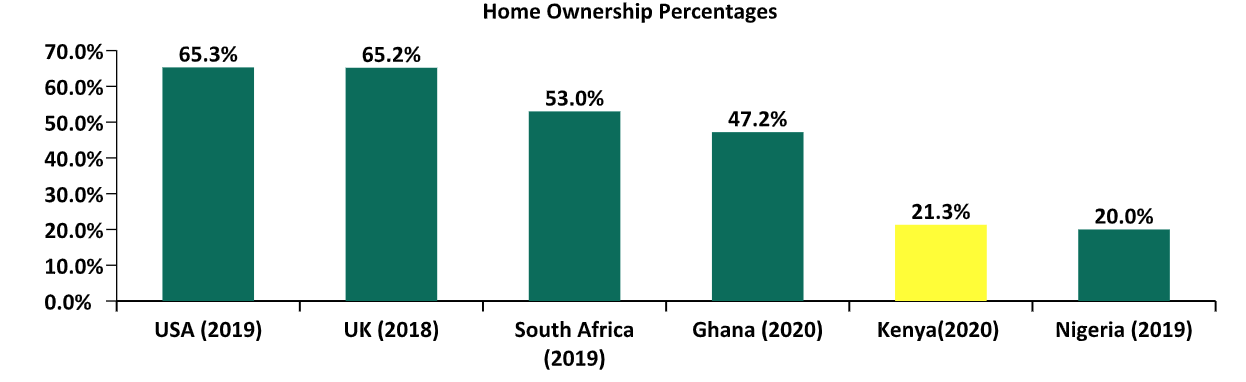
Despite the above, the anticipated increase in mortgage uptake is expected to boost home ownership rates in Kenya which is currently at 21.3% in urban areas as at 2020, compared to other African countries such as South Africa and Ghana at 53.0% and 47.2%, respectively. This is in addition to KMRC’s aggressive efforts to provide affordable home loans to Kenyans through various strategies such as debt sourcing and issuing of corporate bonds. In January 2022 KMRC got approval from the Capital Markets Authority (CMA) to roll out a Kshs 10.5 bn medium-term bond programme, whereby the first tranche received a 478.5% oversubscription. The graph below shows the home ownership percentages of different countries compared to Kenya;
Source: Centre for Affordable Housing Africa, Federal Reserve Ban
- University of Nairobi to Build 4,000 – Bed Capacity Hostels
Additionally, during the week the University of Nairobi (UON) announced plans to build 4,000 - bed capacity hostels through a Public Private Partnership (PPP) deal with the Private Infrastructure Group (PIDG), an international infrastructure development and finance organization. According to the two parties, 1,000 slots will be built at the Chiromo campus, another 1,000 at the Kenyatta National Hospital (KNH) Campus, while the remaining 2,000 slots will be established at the university’s main campus. Moreover, the hostels will be availed to the UON students at an affordable rate not exceeding Kshs 7,500 per month.
PPPs continue to gain momentum in the country having proven to be a cost effective way of implementing projects. Some of the ongoing projects under the strategy include; i) Nairobi Expressway which will be Kenya’s first road to be tolled under PPP platform upon its completion by December 2022, ii) University Of Embu Hostel Project, iii) Kenyatta University Students Hostels, and, iv) Pangani Affordable Housing Project, among many others. With student housing also gaining traction in the country, we expect various developments to continue being initiated and implemented by developers due to;
- The need to increase security levels of students,
- Increased Tertiary Institutions: According to the Kenya National Bureau of Statics (KNBS) 2021 Economic Survey, the overall number of Technical and Vocational Education and Training (TVET) institutions increased by 7.5% to 2,301 in 2020, from 2,140 in 2019,
- Rising population of students necessitating supply of hostels. According to KNBS, the student population in universities and vocational centres stood at 997,904 in FY’2020/21 from 664,000 in FY’2014/15,
- Public Policy: Government measures such as scrapping visa requirements for other African countries is a boost for enrolment of international students to local institutions, and,
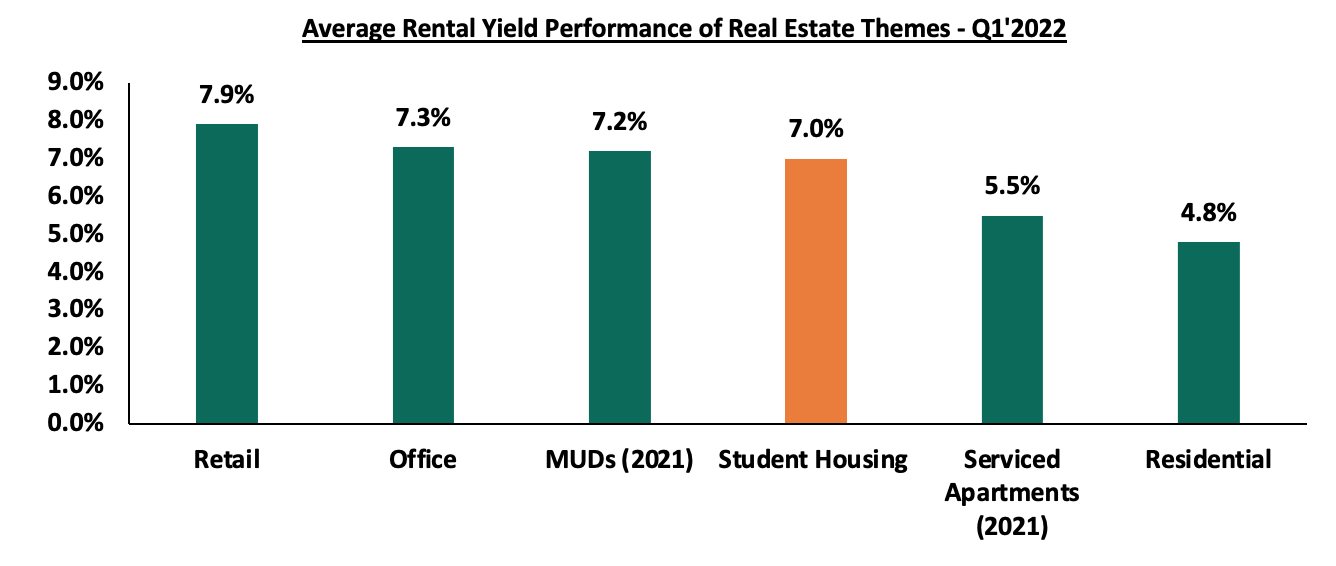
- Relatively higher returns to investors, with the sector having recorded average rental yields of 7.0% in Q1’2022, compared to other Real Estate sectors like the residential sector that realized yields of 4.8%, according to our Student Housing in the Nairobi Metropolitan Area 2022 report. The graph below shows the performance of rental yields in student housing compared to the different Real Estate asset classes in Q1’2022;
Source: Cytonn Research 2022
We expect the residential sector to continue witnessing remarkable activities and developments aimed towards boosting its overall performance. This will be achieved mainly through increased mortgage availability and uptake by home buyers, increasing popularity of PPPs as a cost efficient way of financing projects, and, increased focus towards the development of student accommodation facilities.
- Retail Sector
During the week, Naivas supermarket, a local retail chain, opened a new outlet in Kiambu Mall, along Kiambu Road bringing its total operating outlets to 83. This will become Naivas’ third store to be opened so far in 2022, whereas it also plans to open two more stores in Meru and Naivasha towns. As per Cytonn Weekly #12/2022, Naivas took up the prime retail space that was previously occupied by troubled Choppies Supermarket, an international retail chain. The table below shows the summary of the number of stores of the key local and international retailer supermarket chains in Kenya;
|
Main Local and International Retail Supermarket Chains |
||||||||||
|
Name of Retailer |
Category |
Highest number of branches that have ever existed as at FY’2018 |
Highest number of branches that have ever existed as at FY’2019 |
Highest number of branches that have ever existed as at FY’2020 |
Highest number of branches that have ever existed as at FY’2021 |
Number of branches opened in 2022 |
Closed branches |
Current number of Branches |
Number of branches expected to be opened |
Projected number of branches FY’2022 |
|
Naivas |
Local |
46 |
61 |
69 |
79 |
3 |
0 |
83 |
2 |
85 |
|
QuickMart |
Local |
10 |
29 |
37 |
48 |
2 |
0 |
50 |
0 |
50 |
|
Chandarana |
Local |
14 |
19 |
20 |
23 |
1 |
1 |
24 |
4 |
28 |
|
Carrefour |
International |
6 |
7 |
9 |
16 |
0 |
0 |
16 |
0 |
16 |
|
Cleanshelf |
Local |
9 |
10 |
11 |
12 |
0 |
0 |
12 |
0 |
12 |
|
Tuskys |
Local |
53 |
64 |
64 |
3 |
0 |
61 |
3 |
0 |
3 |
|
Game Stores |
International |
2 |
2 |
3 |
3 |
0 |
0 |
3 |
0 |
3 |
|
Uchumi |
Local |
37 |
37 |
37 |
2 |
0 |
35 |
2 |
0 |
2 |
|
Choppies |
International |
13 |
15 |
15 |
0 |
0 |
13 |
0 |
0 |
0 |
|
Shoprite |
International |
2 |
4 |
4 |
0 |
0 |
4 |
0 |
0 |
0 |
|
Nakumatt |
Local |
65 |
65 |
65 |
0 |
0 |
65 |
0 |
0 |
0 |
|
Total |
|
257 |
313 |
334 |
186 |
6 |
179 |
193 |
6 |
199 |
Source: Online Search
Kenyan retail sector continues to witness rapid developments and expansion activities by various retailers, which in turn boost the performance of the sector. We expect a similar trend in the sector supported by factors such as; i) positive demographics driving demand for services and investments, ii) infrastructure developments enhancing accessibility to retail stores, and, iii) stiff market competition among retailers thus driving rapid expansion. However, e-commerce and the existing oversupply at 3.0 mn SQFT in the Nairobi Metropolitan Area, is expected to weigh down performance of the sector.
- Hospitality Sector
During the week, hotel chain Sarova Woodlands took over management of Kisumu’s Imperial hotel, after having entered into a 7-year agreement with the Gilani Family, the owners of the facility. This will bring the hotelier’s number of operating hotels countrywide to 8, with the 93–bed hotel having been renamed as Sarova Imperial Kisumu. Other hotels by Sarova include; Sarova Stanley and Sarova Panafric in Nairobi, Sarova Whitesands Beach Resort in Mombasa, and Sarova Woodlands and Sarova Lion Hill in Nakuru City. The move by Sarova comes barely a week after Norfolk hotel resumed operations in Nairobi’s CBD, whereas Radison Blu announced plans to resume operations in its Upperhill branch in May 2022. This is a sign that investors are confident about the sector picking up after having been one of the hardest hit sectors by the onset of COVID-19 pandemic. Sarova’s decision to invest in Kisumu is driven by;
- The need to increase its footprint in the Kenyan hospitality market,
- Strategic location of the hotel along Achieng Oneko Road and near Lake Victoria,
- Increasing modernization of Kisumu city thus boosting tourism activities in the area, and,
- Presence of the Kisumu International Airport facilitating access to the city and hotel by air.
According to Central Bank of Kenya’s Monetary Policy Committee Hotels Survey March 2022, the overall hotel bed occupancies came in at 57.0% in March 2022, 34.0% points increase from the 23.0% realized in March 2021. Based on this and various hotels resuming and expanding their operations, we expect the hospitality sector to record improved performance driven by the lowered pandemic restrictions, as well as improved events and tourism activities boosting performance of the sector.
- Statutory Reviews
During the week, the Finance Bill 2022, a report aimed to increase the government’s revenue collection base, was tabled to the parliament for debate, and the following were the key take-outs relating to the Real Estate sector;
- Clarification on the definition of property as included in section 40 of No. 29 of 2015 Act to mean; land, building, aircraft, ship, or motor vehicle, thus sufficient to serve as security for unpaid taxes,
- Where a taxpayer who is also the owner of a property in Kenya fails to pay a tax by the stipulated date, the Commissioner may notify the Registrar in writing that the property, to the extent of the taxpayer’s interest in the property, shall be the subject of a security for the unpaid tax specified in the notification, and,
- Where the Registrar has been notified by the Commissioner, the Registrar shall, without levying or charging a fee, register the Commissioner’s notification as if it were an instrument of restraint on the disposal, mortgage on, or charge, as the case may be, the property specified in the notification.
We expect these regulations to provide clarification as well as streamline activities in the Real Estate sector, thus in turn foster the growth and performance of the economy as a whole.
- Real Estate Investment Trusts (REITS)
During the week, ICEA Lion Asset Management (ILAM) Limited revealed though the Fahari I-REIT FY’2021 annual report, that it had bought five million units of Fahari I-REIT’s units in 2021 as normal market purchases. At the current price of Kshs 6.6, the units value stand at Kshs 33.0 mn. ICEA Lion which became Fahari I-REIT’s promoter in December 2020 therefore become the 8th largest shareholder of the REIT, with a 2.8% stake. The move comes after the REIT recorded a net loss of Kshs 123.9 mn in 2021, following lowered rental income realized by its assets such as the Greenspan Mall that had its former anchor tenant Tuskys Supermarket default rents thus evicted. However, ILAM and other unit holders anticipate a restructuring of the property fund in order to improve its performance in the future, as well as boosting investor confidence in the fund. Some of the strategies in place to increase the REIT’s performance include;
- Redefining and implementation of the portfolio strategy, which manages risk through portfolio diversification, and seeks to deliver appropriately risk-adjusted returns through superior asset allocation and selection,
- Cash management i.e. all cash collected from rentals to continue being invested in a diversified portfolio of near cash instruments,
- Liquidity planning whereby once the cash is optimally invested, sufficient liquidity is available to make payments when due),
- Efficient use of capital at the subsidiary level, through management of capital expenditure to improve core asset value, and,
- Deal management by ensuring that risk is managed and obligations are met through to deal execution.
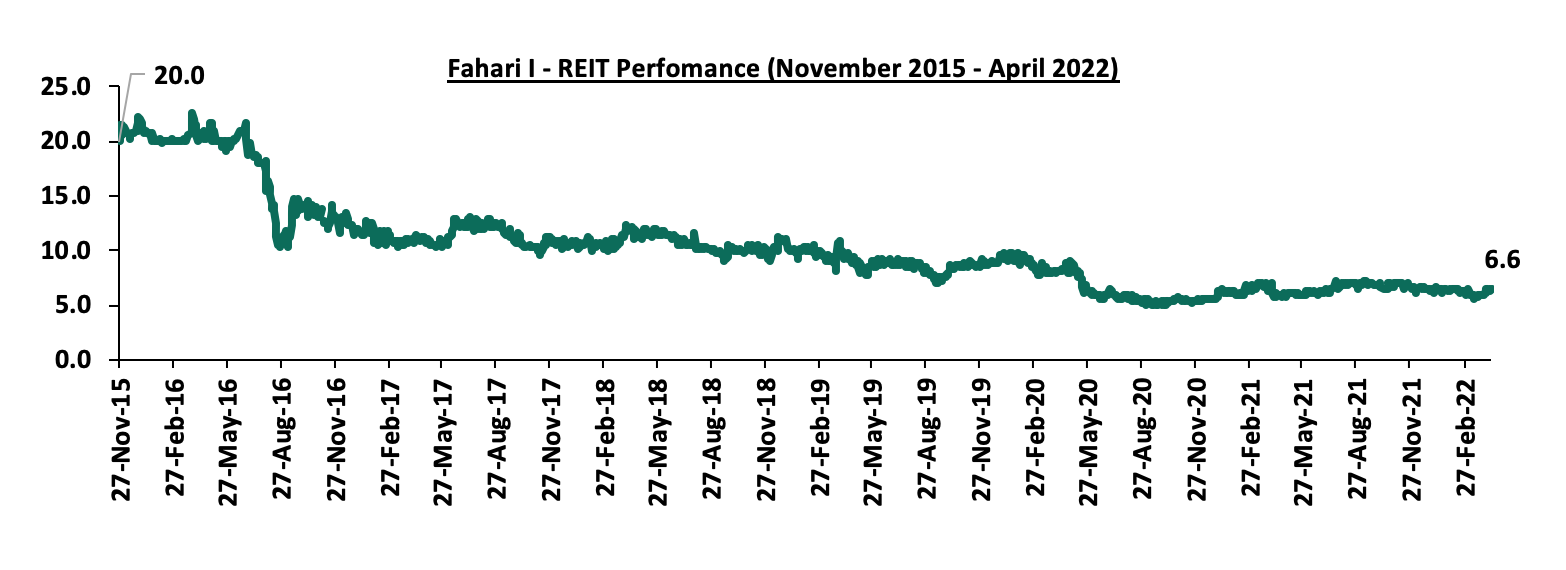
In the Nairobi Stock Exchange, ILAM Fahari I-REIT closed the week trading at an average price of Kshs 6.6 per share. This represented a 1.5% and 3.1% Week-to-Date (WTD) and Year-to-Date (YTD) increase respectively, from Kshs 6.5 per share and Kshs 6.4 per share, respectively. On Inception-to-Date (ITD) basis, the REIT’s performance continues to be weighed down having realized a 67.0% decline from Kshs 20.0. Overall, the Kenyan REIT market performance continues to be weighed down by; i) a general lack of knowledge on the financing instrument, ii) general lack of interest of the REIT by investors, and, iii) lengthy approval processes to get all the necessary requirements thus discouraging those interested in investing in it. The graph below shows Fahari I-REIT’s performance from November 2015 to April 2022:
We expect Kenya’s property market to be on an upward trajectory driven by; i) efforts by KMRC and banking institutions to make mortgages available to home buyers, coupled with increased construction activities in the residential sector, ii) aggressive expansion in the retail sector, and iii) increased activities in the hospitality sector thereby boosting performance of hotels and serviced apartments. However, lagging performance of REITs in Kenya is expected to continue weighing down the overall performance of the property sector.
Following the release of the FY’2021 results by Kenyan listed banks, the Cytonn Financial Services Research Team undertook an analysis on the financial performance of the listed banks and identified the key factors that shaped the performance of the sector.
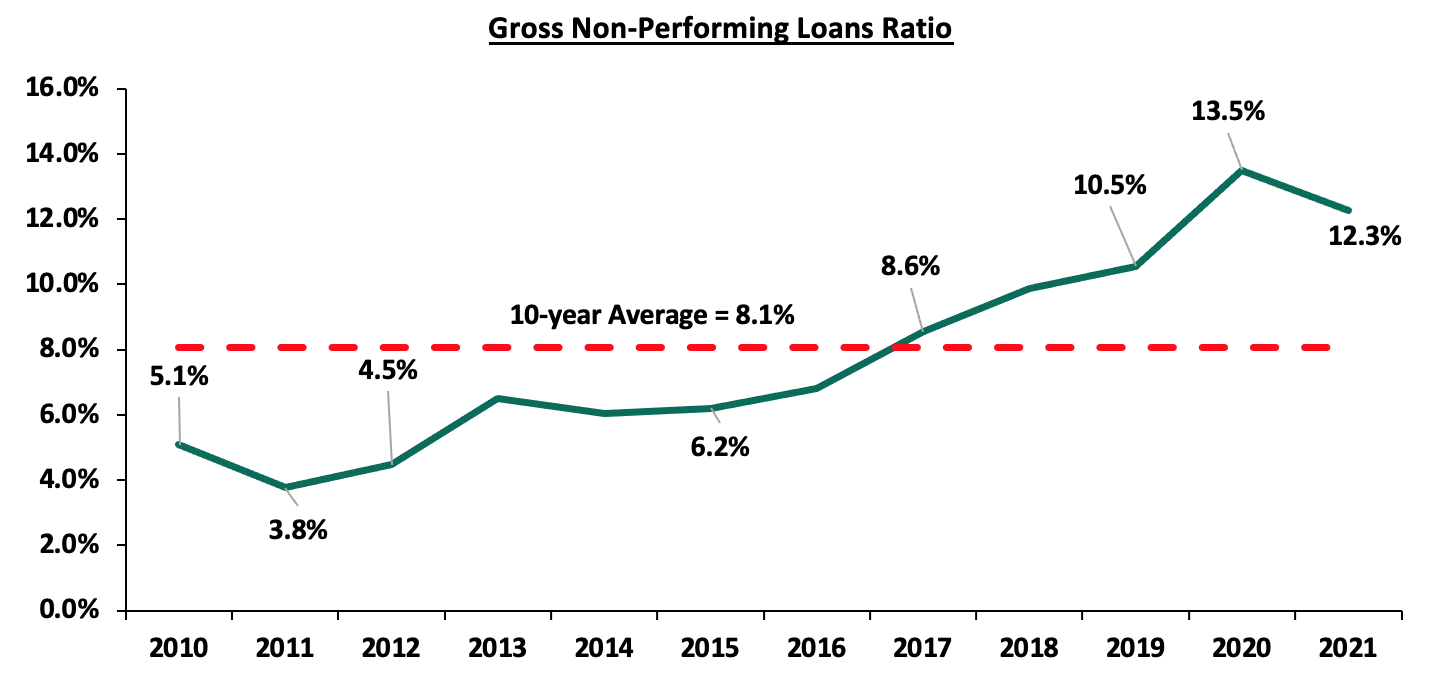
The Asset Quality for the listed banks improved in FY’2021, with the gross NPL ratio declining by 1.2% points to 12.3%, from 13.5% in FY’2020. We however note that despite this improvement in the asset quality, the NPL ratio remains higher than the 10-year average of 8.1%. The listed banks’ management quality also improved, with the Cost to Income ratio improving by 16.9% points to 56.4%, from 73.3% recorded in FY’2020, as banks continued to reduce their provisioning levels following the improved business environment during the period.
Consequently, Core Earnings per Share (EPS) recorded a weighted growth of 82.9% in FY’2021, from a weighted decline of 26.8% recorded in FY’2020. The performance is however skewed by the strong performance from ABSA, NCBA Group and Equity Group, which recorded core EPS growths of 161.2%, 123.7% and 99.4%, respectively.
The report is themed “Reduced Loan Provisions Spur Banking Sector Recovery in 2021” where we assess the key factors that influenced the performance of the banking sector in FY’2021, the key trends, the challenges banks faced, and areas that will be crucial for growth and stability of the banking sector going forward. As such, we shall address the following:
- Key Themes that Shaped the Banking Sector Performance in FY’2021,
- Summary of the Performance of the Listed Banking Sector in FY’2021,
- The Focus Areas of the Banking Sector Players Going Forward, and,
- Brief Summary and Ranking of the Listed Banks based on the Outcome of Our Analysis.
Section I: Key Themes That Shaped the Banking Sector Performance in FY’2021
Below, we highlight the key themes that shaped the banking sector in FY’2021 which include; regulations, regional expansion through mergers and acquisitions, asset quality and capital raising for onward lending:
- Regulation:
- Closure of Loan restructuring Window: The loan restructuring window as per the Banking Circular No 3 of 2020 by the Central Bank of Kenya provided to commercial banks and mortgage finance companies on loan restructuring came to an end on March 2nd, having seen a total of loans worth Kshs 1.7 tn restructured, representing 57.0% of the banking sector’s loan book. With this expiry the banks are now back to normal loan risk management. However, despite the expiry of the loan restructuring window, some banks still supported their borrowers during the period. Equity Group, KCB Group, Diamond Trust Bank and Cooperative Bank disclosed the cumulative amount of loans they have restructured as at Q1’2021;
|
No. |
Bank |
Cumulative Amount Restructured (Kshs bn) |
% of restructured loans to total loans |
Q1’2021 y/y Change in Loan loss provision |
|
1 |
Equity Group Holdings |
171.0 |
31.0% |
(59.3%) |
|
2 |
Kenya Commercial Bank |
102.5 |
18.8% |
(1.3%) |
|
3 |
Diamond Trust Bank |
72.0 |
33.0% |
67.7% |
|
4 |
Co-operative Bank of Kenya |
49.0 |
14.3% |
153.5% |
|
|
Total |
394.5 |
24.3% |
40.2% |
- Decrease in Capital Adequacy risk weighting for all residential mortgages: The Central Bank of Kenya (CBK) published the Banking Circular No 2 of 2021, indicating that they had reduced the capital adequacy risk weighting for all residential mortgages to 35.0% from 50.0%, effective 1st July 2021. The move by CBK to reduce the capital adequacy risk weighting aims at creating an enabling environment for the banking sector to be able to lend more to the domestic residential mortgage market through availing long-term and secured funds to primary mortgage lenders. However, banks have recently been seen taking precautionary measures such as conducting frequent evaluations and demanding additional security from borrowers using real estate as collateral during the loan repayment period in the event that the value of the existing collateral drops to a level below that of the loan. Additionally, banks are anticipated to only accept collateral whose value is seven times bigger than the value of the loan being applied for,
- Integration of Climate-Related Risk Management: The Central Bank of Kenya (CBK) released Guidance on Climate-Related Risk Management, highlighting that all banks and mortgage finance companies ought to integrate the risks and opportunities arising from climate change in their risk management, strategy and governance structure. Opportunities expected to arise from climate change include financing activities such as the transition to renewable energy, appropriate housing, resilient infrastructure and innovative agricultural practices. On the other hand, banks are expected to build their capacity going forward to identify and mitigate the risks arising from climate change,
- Suspension of the Listing of Borrower’s Negative Credit Information: The Central Bank of Kenya (CBK) announced a 12 months suspension of listing of negative credit information for borrowers with loans below Kshs 5.0 mn, whose loans were performing previously, but have become non-performing from 1st October, 2021. The move by the CBK is an intervention measure aiming to cushion Micro Small and Medium Enterprises from adverse effects of the COVID-19 pandemic. We expect banks to be more cautious towards lending to MSMEs due to lack of adequate credit risk information on potential loan borrowers, and,
- Regulation of Digital Lenders: The Central Bank of Kenya (CBK) enacted the law to regulate digital lenders on 7th December 2021, granting the bank the authority to license and oversee previously unregulated digital credit providers. The regulations published on 18th March 2022, are aimed at protecting borrowers against the predatory practices of unregulated digital credit providers, particularly their high costs, unethical debt collection practices, and misuse of personal information. We expect the move to streamline the digital lending services sector and weed out unscrupulous digital lenders who have taken advantage of the unregulated space to violate various consumer rights and privacy. Additionally, lenders will be able to acquire licenses to increase their market share and operate in a more favourable environment. For more information see our Cytonn Weekly #49/2021.
- Regional Expansion through Mergers and Acquisitions: Kenyan banks are looking at having an extensive regional reach and to this end, the following were the major M&A’s activities announced in FY’2021:
- On 3rd May 2021, I&M Group announced that it had completed the 90.0% acquisition of Orient Bank Limited Uganda (OBL) share capital, after receiving all the required regulatory approvals. As highlighted in our Cytonn Weekly #50/2020, I&M Group was set to pay Kshs 3.6 bn for the deal. However, the final cost is yet to be revealed as it was expected to be higher after the base price was adjusted to take into account multiple factors such as appreciation of the Ugandan shilling against the US dollar, integration support, the short-term financial performance of the subsidiary and the sale of its property. I&M Group took over 14 branches from OBL, taking its total branches to 87, from 75 branches as at the end of 2020. For more information, please see Cytonn Weekly #18/2021, and Cytonn Weekly #45/2021,
- On 16th May 2021, Equity Group disclosed that it had acquired an additional 7.7% stake valued at Kshs 996.0 mn in Equity bank Congo (EBC) from the German Sovereign Wealth Fund (KfW). The acquisition raised the total ownership in EBC to 94.3%, indicating that they valued the company at Kshs 14.2 bn. This follows the acquisition of 66.5% stake in Banque Commerciale Du Congo (BCDC) by Equity Group at a cost of Kshs 10.2 bn in August 2020. For more information, please see Cytonn Weekly#20/2021,
- On 25th August 2021, KCB Group announcedthat it had completed the 62.1% acquisition of Banque Populaire du Rwanda Plc (BPR), after receiving all the required regulatory approvals. KCB Group and Atlas Mara Limited had signed a definitive agreement in November 2020 for KCB’s acquisition of a 62.1% stake in BPR subject to shareholder and regulatory approval. In May 2021, KCB Group disclosed that it made an offer to the remaining BPR shareholders to raise its acquisition stake in the bank to 100.0% from 62.1% and received shareholders’ approval for the acquisitions, with only regulatory approval pending for the finalization of the transactions. As highlighted in our Cytonn Weekly #29/2021 and Cytonn Weekly #19/2021, KCB Group agreed to purchase 62.1% stake in BPR from Atlas Mara Limited using a Price to Book Value (P/Bv) of 1.1x. According to the BPR financials released as of June 2021, the bank had a book value of Rwf 52.9 bn (Kshs 5.8 bn), and thus at the trading multiple of 1.1x, we expect KCB Group to have spent an estimated Kshs 6.3 bn to acquire BPR Rwanda. For more information on the acquisition, see our Cytonn Weekly #19/2021, and,
- On 2nd December 2021, KCB announced the termination of their initial plans to acquire a 100.0% stake in African Banking Corporation Limited (ABC Tanzania) following the failure to receive certain regulatory approvals. In November 2020, KCB Group and Atlas Mara Limited came to an agreement for KCB to acquire a 62.1% stake in Banque Populaire Du Rwanda (BPR) and a 100.0% stake in Africa Banking Corporation Tanzania Limited (BancABC) at a total of USD 56.9 mn (Kshs 6.4 bn), subject to shareholder and regulatory approval in the respective countries. However, despite the cancellation of the acquisition plans, KCB has assured its shareholders that it will continue pursuing attractive regional expansion opportunities to enhance their regional participation and accelerate growth. For more information on, see our Cytonn Monthly – November 2021.
We expect to see continued consolidation by the Kenyan banking sector as the weaker banks are merged with the big banks to form a stronger banking system. The COVID-19 pandemic exposed the weak banks in the industry which might need to be acquired by larger banks in order to boost their capital adequacy and liquidity ratios to the required minimum statutory levels. We also expect to see Kenyan banks continue to diversify into other African regions as they look to reduce their reliance on the Kenyan Market.
Below is a summary of the deals in the last 9years that have either happened, been announced or expected to be concluded:
|
Acquirer |
Bank Acquired |
Book Value at Acquisition (Kshs bn) |
Transaction Stake |
Transaction Value (Kshs bn) |
P/Bv Multiple |
Date |
|
KCB Group |
Banque Populaire du Rwanda |
5.3 |
100.0% |
5.6 |
1.1x |
August-21 |
|
I&M Holdings PLC |
Orient Bank Limited Uganda |
3.3 |
90.0% |
3.6 |
1.1x |
April-21 |
|
KCB Group** |
ABC Tanzania |
Unknown |
100% |
0.8 |
0.4x |
Nov-20* |
|
Co-operative Bank |
Jamii Bora Bank |
3.4 |
90.0% |
1 |
0.3x |
Aug-20 |
|
Commercial International Bank |
Mayfair Bank Limited |
1 |
51.0% |
Undisclosed |
N/D |
May-20* |
|
Access Bank PLC (Nigeria) |
Transnational Bank PLC. |
1.9 |
100.0% |
1.4 |
0.7x |
Feb-20* |
|
Equity Group ** |
Banque Commerciale Du Congo |
8.9 |
66.5% |
10.3 |
1.2x |
Nov-19* |
|
KCB Group |
National Bank of Kenya |
7 |
100.0% |
6.6 |
0.9x |
Sep-19 |
|
CBA Group |
NIC Group |
33.5 |
53%:47% |
23 |
0.7x |
Sep-19 |
|
Oiko Credit |
Credit Bank |
3 |
22.8% |
1 |
1.5x |
Aug-19 |
|
CBA Group** |
Jamii Bora Bank |
3.4 |
100.0% |
1.4 |
0.4x |
Jan-19 |
|
AfricInvest Azure |
Prime Bank |
21.2 |
24.2% |
5.1 |
1.0x |
Jan-18 |
|
KCB Group |
Imperial Bank |
Unknown |
Undisclosed |
Undisclosed |
N/A |
Dec-18 |
|
SBM Bank Kenya |
Chase Bank Ltd |
Unknown |
75.0% |
Undisclosed |
N/A |
Aug-18 |
|
DTBK |
Habib Bank Kenya |
2.4 |
100.0% |
1.8 |
0.8x |
Mar-17 |
|
SBM Holdings |
Fidelity Commercial Bank |
1.8 |
100.0% |
2.8 |
1.6x |
Nov-16 |
|
M Bank |
Oriental Commercial Bank |
1.8 |
51.0% |
1.3 |
1.4x |
Jun-16 |
|
I&M Holdings |
Giro Commercial Bank |
3 |
100.0% |
5 |
1.7x |
Jun-16 |
|
Mwalimu SACCO |
Equatorial Commercial Bank |
1.2 |
75.0% |
2.6 |
2.3x |
Mar-15 |
|
Centum |
K-Rep Bank |
2.1 |
66.0% |
2.5 |
1.8x |
Jul-14 |
|
GT Bank |
Fina Bank Group |
3.9 |
70.0% |
8.6 |
3.2x |
Nov-13 |
|
Average |
|
|
76.7% |
|
1.3x |
|
|
* Announcement Date ** Deals that were dropped |
||||||
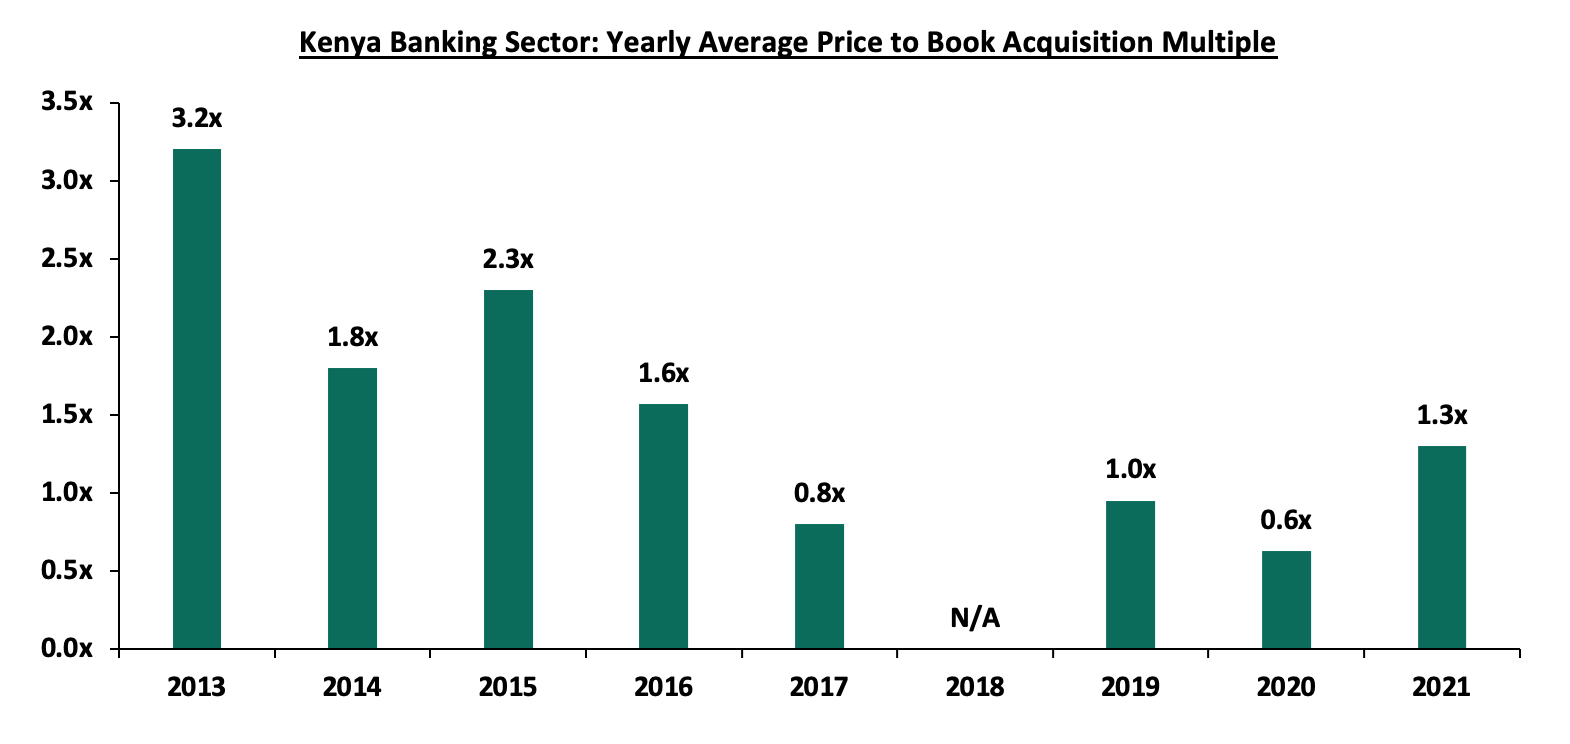
The acquisition valuations for banks has been recovering, with the valuations increasing from the average of 0.6x in 2020 to 1.3x in 2021. This however still remains low compared to historical prices paid as highlighted in the chart below;
The number of commercial banks in Kenya currently stands at 38, same as in FY’2021 but lower than the 43 licensed in FY’2015. The ratio of the number of banks per 10 million population in Kenya now stands at 7.1x, which is a reduction from 9.0x in FY’2015 demonstrating continued consolidation of the banking sector. However, despite the ratio improving, Kenya still remains overbanked as the number of banks remains relatively high compared to the population. For more on this see our topical.
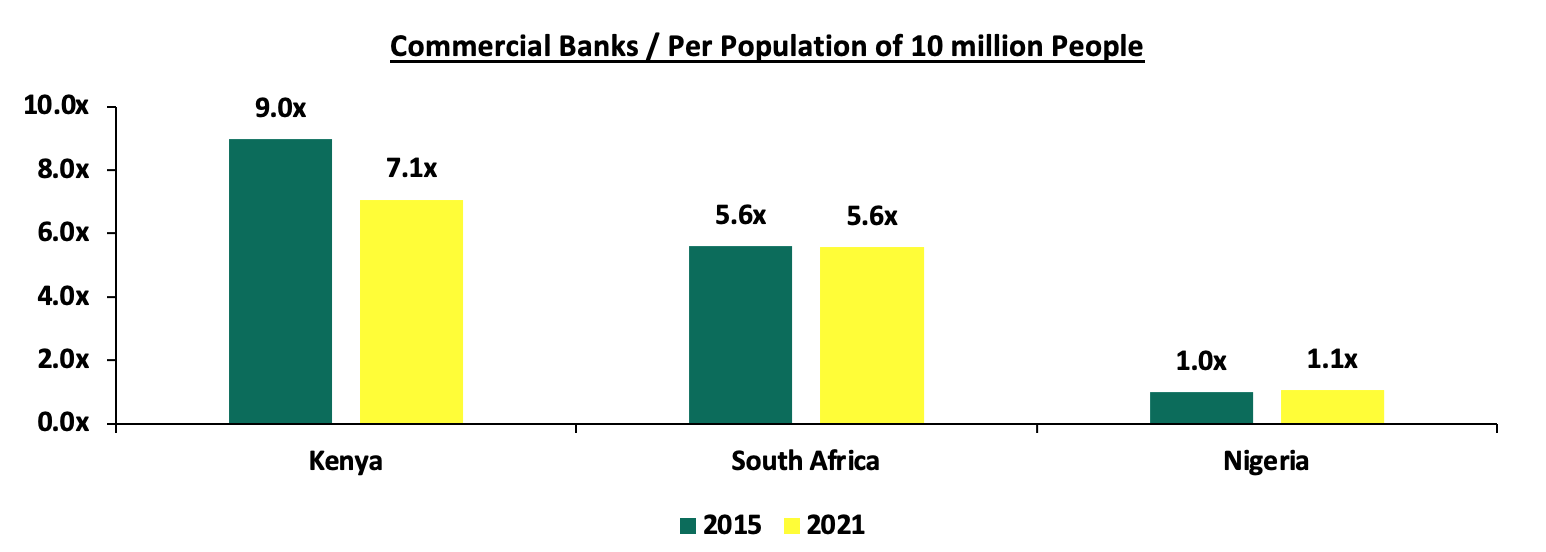
Source: Worl Bank, Central Bank of Kenya, South Africa Reserve Bank, Central Bank of Nigeria,
- Asset Quality: Asset quality for listed banks improved in FY’2021, with the Gross NPL ratio declining by 1.2% points to 12.3%, from 13.5% in FY’2020. The improvement in asset quality is attributable to the declining credit risk on the back of the improving operating environment. The NPL coverage rose to 65.5% in FY’2021, from 62.3% recorded in FY’2020, in accordance with IFRS 9, where banks are expected to provide both for the incurred and expected credit losses. According to the March 2022 MPC Press Release, the NPL ratio for the entire banking sector stood at 13.1% as at December 2021, an improvement from the 14.1% in December 2020, signifying an improvement in asset quality for the sector in FY’2021. However, the economic recovery has not been entirely smooth with the NPL ratio increasing to 14.0% in February 2022 with notable increases in the manufacturing, tourism, restaurant and hotels, building and construction and real estate sectors. We expect credit risk to decline gradually but remain at relatively elevated levels compared to previous years. The chart below highlights the asset quality trend for the listed banks:
The table below highlights the asset quality for the listed banking sector:
FY'2020 NPL Ratio**
FY'2021 NPL Ratio*
% point change in NPL Ratio
FY'2020 NPL Coverage**
FY'2021 NPL Coverage*
% point change in NPL Coverage
ABSA Bank Kenya
7.7%
7.9%
0.2%
71.1%
77.7%
6.6%
Equity Group
11.5%
8.6%
(2.9%)
62.4%
68.7%
6.3%
Stanbic Bank
11.8%
9.3%
(2.5%)
60.6%
51.8%
(8.8%)
I&M Holdings
11.6%
9.5%
(2.1%)
66.8%
71.4%
4.6%
Diamond Trust Bank
11.9%
12.9%
1.0%
40.0%
41.8%
1.8%
Co-operative Bank of Kenya
18.7%
14.6%
(4.1%)
50.3%
60.6%
10.3%
Standard Chartered Bank Kenya
16.0%
16.0%
0.0%
80.6%
84.4%
3.8%
NCBA Group
14.7%
16.0%
1.3%
60.9%
73.6%
12.7%
KCB
14.8%
16.6%
1.8%
59.8%
52.9%
(6.9%)
HF Group
24.6%
21.1%
(3.5%)
63.4%
73.6%
10.2%
Mkt Weighted Average
13.5%
12.3%
(1.2%)
62.2%
65.5%
3.1%
*Market cap weighted as at 14/04/2022
**Market cap weighted as at 15/04/2021
Key take-outs from the table include;
- Asset quality for the listed banks improved during the period, with the weighted average NPL ratio declining by 1.2% point to a market cap weighted average of 12.3%, from an average of 13.5% for the listed banking sector in FY’2020. The improvement in asset quality is attributable to declining credit risk on the back of increased business activities in 2021 driven by the gradual economic recovery,
- NPL Coverage for the listed banks increased to a market cap weighted average of 65.5% in FY’2021, from 62.2% recorded in FY’2020, as the banks increased their provisioning levels to proactively manage risks brought about by the emergence of new COVID-19 variants coupled with the slow recovery of some sectors such as tourism and hospitality, and,
- KCB Group recorded a decline in their NPL coverage despite the NPL ratio rising, which would suggest modest provisioning. Given the slow recovery in some sectors locally and the high NPL ratios in some of the group’s subsidiaries, we expected the group to provision more to cater for the prevailing credit risk. Key to note, If KCB’s NPL Coverage remained at the 59.8% level recorded in 2020, the bank would have had an additional provisioning of Kshs 8.4 bn, which would have reduced the earnings per share from the reported Kshs 10.6 to Kshs 8.6.
- Capital Raising: In FY’2021, listed banks’ turned to borrowing from international institutions to not only strengthen their capital position but also boost their ability to lend to the perceived riskier Micro Small and Medium Sized Enterprises (MSMEs) segment in order to support the small businesses in the tough operating environment occasioned by the COVID-19 pandemic. In the period under review, Equity Group received Kshs 34.9 bn from several instutions including a Kshs 5.5 bn loan from Proparco, a private sector financing arm of Agence Française de Dévelopement Group (AFD Group). This was in addition to the two guarantee facilities totalling Kshs 5.0 bn (€ 39.0 mn) for onward lending to MSMEs and a Kshs 70.0 mn (€ 550,000) technical assistance grant to support Equity Group Foundation’s health projects. Additionally, in November 2021, the Co-operative Bank of Kenya received Kshs 6.3 bn (USD 56.1 mn) from the European Investment Bank for lending to MSME firms with up to 250 workers. The trend has continued beyond the FY’2021 following the USD 165.0 mn (Kshs 18.6 bn) facility from the International Finance Corporation (IFC) to Equity Bank Kenya which was announced in January 2022. The loan is expected to be used to shore up the Bank’s Tier 2 capital and for onward lending to climate smart projects and Small and Medium Enterprises (SMEs) in Kenya. The table below highlights the disclosed loan facilities that banks have secured for capital injection and lending to the MSMEs so far:
|
Bank |
Amount Borrowed For Onward Lending (Kshs bn) |
Purpose |
|
Equity Bank |
86.5* |
MSME lending |
|
KCB Bank |
16.4 |
MSME lending |
|
Cooperative Bank |
17.3*** |
MSME lending and Tier II Capital** |
|
I&M Bank |
5.4 |
MSME lending and Tier II Capital** |
|
Total |
125.6 |
|
|
*Includes a Kshs 18.6 bn **Tier II Capital refers to a bank’s supplementary capital which includes senior debt (debt that a company must repay first before going out of business) with a tenure of not less than five years ***Includes a Kshs 6.3 bn loan from European Investment Bank (EIB) for onward lending to MSMEs |
||
Section II: Summary of the Performance of the Listed Banking Sector in FY’2021:
The table below highlights the performance of the banking sector, showing the performance using several metrics, and the key take-outs of the performance;
|
Bank |
Core EPS Growth |
Interest Income Growth |
Interest Expense Growth |
Net Interest Income Growth |
Net Interest Margin |
Non-Funded Income Growth |
NFI to Total Operating Income |
Growth in Total Fees & Commissions |
Deposit Growth |
Growth in Government Securities |
Loan to Deposit Ratio |
Loan Growth |
Return on Average Equity |
|
ABSA |
161.2% |
1.9% |
(15.9%) |
8.0% |
7.1% |
4.7% |
31.6% |
11.6% |
5.9% |
5.2% |
87.2% |
12.2% |
21.1% |
|
NCBA |
123.7% |
5.1% |
3.9% |
6.1% |
5.9% |
5.6% |
45.0% |
2.5% |
11.5% |
20.9% |
51.9% |
(1.8%) |
13.6% |
|
Equity |
99.4% |
27.9% |
37.2% |
24.8% |
6.8% |
15.8% |
39.3% |
29.4% |
29.5% |
30.0% |
61.3% |
23.0% |
26.6% |
|
KCB |
74.3% |
15.1% |
17.6% |
14.4% |
8.4% |
8.8% |
28.0% |
9.0% |
9.1% |
29.7% |
80.7% |
13.5% |
21.8% |
|
SCBK |
66.2% |
(6.1%) |
(24.7%) |
(1.6%) |
6.4% |
24.9% |
35.5% |
19.9% |
3.5% |
(4.2%) |
47.5% |
3.7% |
17.4% |
|
Co-op |
53.0% |
13.9% |
17.0% |
12.9% |
8.5% |
11.0% |
32.1% |
18.1% |
7.7% |
13.7% |
76.1% |
8.2% |
17.3% |
|
Stanbic |
38.8% |
2.1% |
(17.2%) |
12.3% |
5.0% |
1.7% |
42.5% |
1.1% |
(2.1%) |
(17.4%) |
83.0% |
16.8% |
13.3% |
|
DTB-K |
25.1% |
9.1% |
6.9% |
10.6% |
5.1% |
3.0% |
24.0% |
10.8% |
11.2% |
11.9% |
66.5% |
5.7% |
6.8% |
|
I&M |
0.7% |
18.8% |
(0.4%) |
33.8% |
6.3% |
1.1% |
29.0% |
16.9% |
13.0% |
23.4% |
71.0% |
12.4% |
12.2% |
|
HF Group |
(65.1%) |
(8.0%) |
(12.7%) |
(2.1%) |
4.2% |
3.6% |
22.8% |
21.2% |
(5.6%) |
(7.8%) |
92.0% |
(6.2%) |
(7.2%) |
|
FY'21 Mkt Weighted Average* |
82.9% |
13.8% |
11.5% |
15.2% |
7.1% |
10.9% |
34.7% |
16.6% |
13.5% |
18.1% |
69.7% |
13.5% |
20.2% |
|
FY'20 Mkt Weighted Average** |
(26.8%) |
16.7% |
12.5% |
18.9% |
7.3% |
6.4% |
35.4% |
(2.1%) |
22.3% |
26.3% |
69.8% |
11.7% |
13.2% |
|
*Market cap weighted as at 14/04/2022 |
|||||||||||||
|
**Market cap weighted as at 15/04/2021 |
|||||||||||||
Key takeaways from the table above include:
- For the FY’2021, listed banks recorded an 82.9% weighted average growth in core Earnings per Share (EPS), compared to a weighted average decline of 26.8% in FY’2020 for the listed banking sector. The performance was however largely skewed by the strong performance from ABSA Bank, NCBA and Equity Group whose core EPS grew by 161.2%, 123.7% and 99.4%, respectively,
- The Banks have recorded a weighted average deposit growth of 13.5%, slower than the 22.3% growth recorded in FY’2020,
- Interest expense recorded a slower growth of 11.5%, compared to the 12.5% growth in FY’2020 leading to a decline in the cost of funds to a weighted average of 2.8% in FY’2021, from 2.9% in FY’2020. This was due to the faster growth in average interest-bearing liabilities, an indication that the listed banks were able to mobilize cheaper deposits,
- Average loan growth came in at 13.5%, 1.8% points higher than the 11.7% growth recorded in FY’2020. Notably, the loan growth was lower than the 18.1% growth in government securities, an indication that banks shied away from lending due to uncertainties surrounding the emergence of new COVID-19 variants coupled with the slow recovery of some sectors such as tourism and hospitality,
- Interest income grew by 13.8%, slower than the growth of 16.7% recorded in FY’2020 while the weighted average Yield on Interest Earning Assets (YIEA) declined to 9.7%, from the 10.1% recorded in FY’2020 for the listed banking sector, an indication of the increased allocation to higher-yielding assets by the sector during the period. Net Interest Margin (NIM) now stands at 7.1%, 0.2% points lower than the 7.3% recorded in FY’2020 for the whole listed banking sector, and,
- Non-Funded Income grew by 10.9%, compared to the 6.4% growth recorded in FY’2020. This can be attributable to the faster growth in the fees and commission which grew by 16.6% compared to a decline of 2.1% in FY’2020, following the expiry of the waiver on fees on mobile transactions.
Section III: Outlook of the banking sector:
The banking sector recorded significant recovery in FY’2021, as evidenced by the increase in their profitability, with the Core Earnings Per Share (EPS) growing by 82.9%. The increase in EPS is mainly attributable to the reduced provisioning levels by the sector, as the Loan Loss Provisions declined by 44.3% in FY’2021, from the 233.2% growth recorded in FY’2020. However, despite this decline, we believe that the uncertainty surrounding the August 2022 elections coupled with the resurgence of COVID-19 variants in the country's trading partners, will see banks continue overprovisioning in the medium term, albeit lower than in 2020. Based on the current operating environment, we believe the future performance of the banking sector will be shaped by the following key factors:
- Growth in Interest income: Going forward, we expect interest income growth to remain a key driver in the industry, evidenced by the 13.8% growth recorded in FY’2021. Despite the growth being slower than the 16.7% growth that was recorded in FY’2020, we believe the continued allocation to government securities which are witnessing increases in yields will lead to an increase in overall interest income. The disclosure by banks that most customers that had restructured their loans are now servicing them as normal means that banks are now earning interest on loans restructured at the height of the pandemic. Additionally, banks continued to have negotiations with the Central Bank of Kenya (CBK) seeking to switch to risk based lending, a model that has the ability to assess the risk profile of each customer and assign them a rate that matches their risk profile. In our view, this move will play a big role in increasing the lenders interest income, as more people who are not able to access credit due to their risk profile, will be able to borrow money,
- Revenue Diversification: In FY’2021, Non-Funded Income recorded a 10.9% weighted average growth, a significant increase from the 6.4% growth recorded in FY’2020, attributable to the expiry of the waiver on fees and commissions on loans and advances issued by the CBK in March 2020. However, the banking sector’s Non-Funded Income to Operating Income declined, coming in at 34.7% in FY’2021, compared to 35.4% in FY’2020. There exists an opportunity for the sector to further increase NFI contribution to revenue going forward. The expiry of the waiver on bank charges on 2nd March 2021 is also expected to continue spurring NFI growth in the medium-long term due to the increased adoption of digital channels, which present an avenue for an increase in fees on transactions. According to Central Bank Annual Report 2019/2020, 67.0% of banking transactions were conducted on mobile phones after the onset of the pandemic, compared to 55.0% of transactions before the pandemic. The increase in mobile-banking transactions therefore provides an opportunity for banks to increase their Non-Funded income going forward,
- Provisioning: Loan Loss Provisions recorded a weighted average decline of 44.3% in FY’2021, compared to a growth of 233.2% in FY’2020. However, given the resurgence of COVID-19 variants in Kenya’s trading partners as well as the uncertainties surrounding the upcoming elections which are likely to disrupt the economic environment, we believe that a cautious approach is still required to manage credit risk in the banking sector,
- Cost Rationalization: The majority of banks have continued to pursue their cost-cutting strategy by riding on the digital revolution wave to improve operational efficiency and the reliability of out-of-branch transactions. Increased adoption of alternative transaction channels such as mobile, internet, and agency banking has resulted in an increase in transactions carried out through alternative channels, limiting branch transactions to high-value transactions and other services such as advisory. This has seen banks reduce front-office operations, thereby cutting the number of staff required and by extension, reducing operating expenses and hence, improving operational efficiency. Increased efficiency has been witnessed across the listed banks with the cost to income ratio having declined by 16.9% points to 73.3% in FY’2021, from 56.4% in FY’2020. However, some of the banks such as NCBA and DTB-K have announced plans to open more branches with an aim of increasing their physical presence,
- Expansion and Further Consolidation: With consolidation remaining a key theme going forward, the current environment may provide opportunities for larger banks with a sufficient capital base to expand and take advantage of the market's low valuations, as well as further consolidate/buy out smaller and weaker banks. Consolidation will be critical for the smaller banks that are still struggling during the recovery period, and it will also benefit larger banks by providing them with the opportunity to expand their operations locally and regionally and drive future growth. Furthermore, we believe Kenyan banks will continue to diversify into other African countries in order to reduce their reliance on the Kenyan market and distribute risks as well, and,
- Integration of Climate-Related Risk Management: Following the release of Guidance on Climate-Related Risk Management by the Central Bank of Kenya (CBK), we expect to see banks channel their long term financing into environmental-friendly assets that are more sustainable and have lower risk of damage loss as a result of climate change. Additionally, banks will focus on lending to companies whose activities do not pose an environmental risk and will ultimately lead to improvement of collateral quality consequently reducing their exposure to unexpected loss and obsolesce. This will lead to reduced non-performing loans and provisioning in the sector.
Section IV: Brief Summary and Ranking of the Listed Banks:
As per our analysis on the banking sector from a franchise value and a future growth opportunity perspective, we carried out a comprehensive ranking of the listed banks. For the franchise value ranking, we included the earnings and growth metrics as well as the operating metrics shown in the table below in order to carry out a comprehensive review of the banks:
|
Bank |
Loan to Deposit Ratio |
Cost to Income (With LLP) |
Return on Average Capital Employed |
Deposits/ Branch (bn) |
Gross NPL Ratio |
NPL Coverage |
Tangible Common Ratio |
Non Funded Income/Revenue |
|
Absa Bank |
87.2% |
57.9% |
21.1% |
3.2 |
7.9% |
74.5% |
13.1% |
32.0% |
|
NCBA Group |
51.9% |
68.1% |
13.6% |
4.5 |
16.0% |
70.2% |
12.3% |
44.3% |
|
Equity Bank |
61.3% |
49.1% |
26.6% |
2.8 |
8.6% |
60.6% |
12.2% |
39.7% |
|
KCB Group |
80.7% |
56.0% |
21.8% |
1.7 |
16.6% |
63.4% |
14.5% |
29.4% |
|
SCBK |
47.5% |
56.8% |
17.4% |
12.1 |
16.0% |
82.8% |
14.9% |
33.9% |
|
Coop Bank |
76.1% |
63.0% |
17.3% |
2.3 |
14.6% |
65.5% |
16.4% |
35.4% |
|
Stanbic Bank |
83.0% |
50.9% |
13.3% |
10.2 |
9.3% |
54.9% |
14.5% |
42.6% |
|
DTBK |
66.5% |
75.6% |
6.8% |
2.6 |
12.9% |
40.0% |
14.6% |
24.5% |
|
I&M Holdings |
71.0% |
59.9% |
12.2% |
3.4 |
9.5% |
70.6% |
15.4% |
30.7% |
|
HF Group |
92.0% |
136.3% |
(7.2%) |
1.7 |
21.1% |
60.0% |
12.6% |
24.7% |
|
Weighted Average FY’2021 |
69.7% |
56.4% |
20.2% |
4.0 |
12.3% |
65.5% |
13.9% |
35.4% |
The overall ranking was based on a weighted average ranking of Franchise value (accounting for 60.0%) and intrinsic value (accounting for 40.0%). The Intrinsic Valuation is computed through a combination of valuation techniques, with a weighting of 40.0% on Discounted Cash-flow Methods, 35.0% on Residual Income and 25.0% on Relative Valuation, while the Franchise ranking is based on banks operating metrics, meant to assess efficiency, asset quality, diversification, and profitability, among other metrics. The overall FY’2021 ranking is as shown in the table below:
|
Bank |
Franchise Value Rank |
Intrinsic Value Rank |
Weighted Rank |
Q3'2021 |
FY’2021 |
|
I&M Holdings |
4 |
1 |
23.4 |
3 |
1 |
|
Coop Bank |
3 |
3 |
23.8 |
6 |
2 |
|
KCB Group |
4 |
2 |
24.0 |
1 |
3 |
|
Equity Bank |
2 |
5 |
24.6 |
4 |
4 |
|
Absa Bank |
1 |
7 |
24.6 |
2 |
4 |
|
SCBK |
6 |
8 |
30.8 |
5 |
6 |
|
Stanbic Bank |
6 |
9 |
31.4 |
8 |
7 |
|
NCBA Group |
8 |
6 |
32.8 |
7 |
8 |
|
DTBK |
9 |
4 |
35.6 |
9 |
9 |
|
HF Group |
10 |
10 |
45.6 |
10 |
10 |
Major Changes from the Q3’2021 Ranking are:
- I&M Holdings’ rank recorded an improvement in the overall ranking to position 1 from position 3 in Q3’2021 attributable to a decline in the bank‘s Gross NPL ratio to 9.5%, from the 10.2% recorded in Q3’2021, leading to an increase in the bank’s franchise value score, coupled with an improvement in the bank’s Cost to Income ratio, which recorded a 2.2% points decline to 59.9% from 62.1% recorded in Q3’2021,
- Co-operative Bank’s rank improved to position 2 from position 6 in Q3’2021, attributable to an increase in the bank’s return on average equity to 17.3%, higher than the 14.2% recorded in Q3’2021. The bank’s Net Interest Margin ratio remained constant at 8.5%, which was the highest in the listed banking sector, and,
- KCB Group’s rank declined to position 3 after being ranked position 1 in Q3’2021, mainly due to a deterioration in the bank‘s asset quality, as the Gross NPL ratio rose to 16.6%, from the 13.7% recorded in Q3’2021.
For more information, see our Cytonn FY’2021 Listed Banking Sector Review
Disclaimer: The views expressed in this publication are those of the writers where particulars are not warranted. This publication, which is in compliance with Section 2 of the Capital Markets Authority Act Cap 485A, is meant for general information only and is not a warranty, representation, advice or solicitation of any nature. Readers are advised in all circumstances to seek the advice of a registered investment advisor.

- Talk to us
- Kenya
- P.O Box 20695 - 00200, Nairobi, Kenya
- Cell +254709101200
- Tel +254709101200
- WhatsApp +254741676635
- United States
- +254709101200
- DOWNLOAD OUR APP
-


- Kenya
- 8th Floor, Pinetree Plaza, Kaburu Drive, Ngong Road, Nairobi, Kenya
- USA
- Suite 1150, 1775 Eye Street NW, USA, Washington DC 20006, USA
- Investments
- High Yield
- Private Equity
- Real Estate
- Real Estate
- RiverRun Estates
- Cytonn Towers
- The Ridge
- Taraji Heights
- The Alma