Kenya Listed Banks FY’2017 Report, & Cytonn Weekly #15/2018
By Cytonn Research Team, Apr 15, 2018
Executive Summary
Fixed Income
Treasury bills were undersubscribed this week with the overall subscription rate coming in at 87.1%, compared to an overall subscription of 107.0% the previous week. Yields on the 91, 182 and 364-day papers remained unchanged at 8.0%, 10.3% and 11.1%, respectively, the previous week. Stanbic Bank released their Monthly Purchasing Manager’s Index (PMI) for March 2018, which indicated that the business operating environment in the country improved further during the month of March, with the index coming in at 55.7, up from 54.7 in February
Equities
During the week, the equities market was on a declining trend, with NASI, NSE 20 and NSE 25 declining by 1.8%, 0.4% and 0.9%, respectively. For the last twelve-months (LTM), NASI, NSE 20 and NSE 25 have gained 41.7%, 22.6% and 39.4%, respectively. The Central Bank of Kenya (CBK) revised its capital waiver rules, now stating that banks will have to take a full hit on provisions for loans issued from 2019 onwards, down from the initial 5-year adoption period they had previously given. Banks with poor asset quality may now have to raise capital soon
Private Equity
In the FinTech space, Branch International, who are a mobile-based Microfinance Institution (MFI) operating in Kenya, Tanzania, Nigeria and California, raised USD 70.0 mn in Series B funding, which combines debt and equity, for expansion of financial services beyond credit access, to savings and payments, and to start operations in India. This funding was led by California-based Trinity Ventures, a venture capital firm specializing in growth capital investments
Real Estate
During the week, the hospitality sector received further international recognition with the entry of global brand and Swiss hotelier, Movenpick Hotels and Resorts, through the opening of a 276-key hotel in Westlands, Nairobi. This week also saw the World Bank release their Kenya Economic Update 2018, with propositions on the creation of an enabling environment so as to achieve the Kenyan Government’s Big Four Agenda, which includes the development of 500,000 affordable homes in 5-years
Focus of the Week
Following the release of the FY’2017 results by Kenyan listed banks, we analyze the results of the listed banks for FY’2017 to determine which banks are the most attractive and stable for investment from a franchise value and from a future growth (intrinsic value) perspective. The theme for the year is “Diversification and efficiency key to growth amidst tighter regulation” as we assess what factors will be crucial for the sustainability of the Kenyan banking sector going forward.
- Cytonn Real Estate, our real estate development affiliate, held a stakeholders and public participation forum with regard to the Kshs 20.0 bn Cytonn Towers development to be constructed in Kilimani. See the Statement on the Cytonn Towers Stakeholders Engagement Forum
- On Tuesday, 10th April 2018, Cytonn Real Estate (CRE) held a Tender Award Ceremony at the Park Inn by Radisson in Westlands. The ceremony celebrated the newly formed partnership between Cytonn Real Estate and China Railway Jianchang Engineering Ltd (CRJE), who were awarded the tender as main contractor for The Ridge, a Kshs 14.0 bn Mixed Use Development project on a 10-acre piece of land in Ridgeways, Kiambu County. See Event Note
- Our Senior Investment Analyst, Caleb Mugendi, discussed the new guidelines for banks by the Central Bank of Kenya, and the National Assembly’s view on repealing of the rate cap. Watch Caleb on CNBC here
- We continue to hold weekly workshops and site visits on how to build wealth through real estate investments. The weekly workshops and site visits target both investors looking to invest in real estate directly and those interested in high yield investment products to familiarize themselves with how we support our high yields. Watch progress videos and pictures of The Alma, Amara Ridge, The Ridge, and Taraji Heights. Key to note is that our cost of capital is priced off the loan markets, where all-in pricing ranges from 16.0% to 20.0%, and our yield on real estate developments ranges from 23.0% to 25.0%, hence our top-line gross spread is about 6.0%. If interested in attending the site visits, kindly register here
- We continue to see very strong interest in our weekly Private Wealth Management Training (largely covering financial planning and structured products). The training is at no cost and is open only to pre-screened participants. We also continue to see institutions and investment groups interested in the trainings for their teams. The Wealth Management Trainings are run by the Cytonn Foundation under its financial literacy pillar. If interested in our Private Wealth Management Training for your employees or investment group please get in touch with us through wmt@cytonn.com or book through this link Wealth Management Training. To view the Wealth Management Training topics, click here
- For recent news about the company, see our news section here
- We have 10 investment-ready projects, offering attractive development and buyer targeted returns of around 23.0% to 25.0% p.a. See further details here: Summary of Investment-Ready Projects
- We continue to beef up the team with ongoing hires for: Full Stack Software Engineer, Application Security Engineer and Distribution and Unit Managers for Nakuru and Kisumu, among others. Visit the Careers section at Cytonn’s Website to apply
Treasury bills were undersubscribed this week with the overall subscription rate coming in at 87.1%, compared to an overall subscription of 107.0% the previous week. The subscription rates for the 91, 182 and 364-day papers came in at 43.9%, 69.5%, and 121.9% compared to 73.9%, 71.6%, and 155.6%, respectively, the previous week. Yields on the 91, 182 and 364-day papers remained unchanged at 8.0%, 10.3% and 11.1%, respectively. The overall acceptance rate remained unchanged at 99.4%, with the government accepting a total of Kshs 20.8 bn of the Kshs 20.9 bn worth of bids received, against the Kshs 24.0 bn on offer. The government is currently 17.9% ahead of its domestic borrowing target for the current fiscal year, having borrowed Kshs 276.7 bn, against a target of Kshs 234.6 bn (assuming a pro-rated borrowing target throughout the financial year of Kshs 297.6 bn).
The Kenyan Government has re-opened 2 bonds, FXD 1/2008/15 and FXD 1/2018/20, with 4.9-years and 19.9-years to maturity, and coupons of 12.5% and 13.2%, respectively. The government will be seeking to raise Kshs 40.0 bn for budgetary support. The re-open sale period will end on 24th April and hence we will give our bidding range in next week’s report.
Liquidity levels increased in the money market as indicated by the decline in the average interbank rate to 6.1%, from 6.3% recorded the previous week, and there was an increase in the average volumes traded in the interbank market by 9.7% to Kshs 22.7 bn, from Kshs 20.7 bn the previous week, as banks borrowed from each other for PAYE tax remittances.
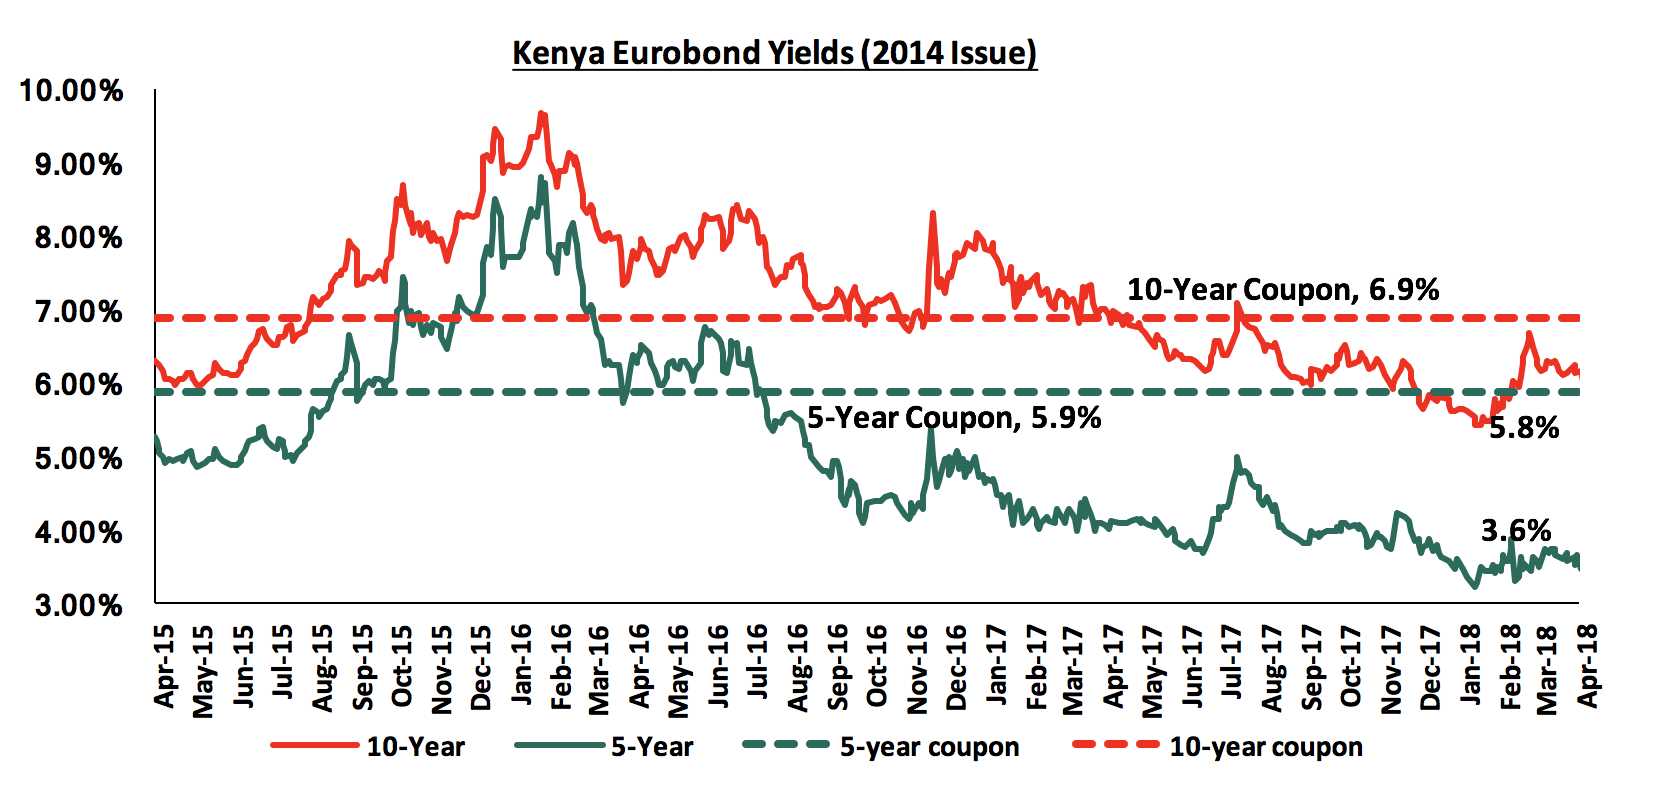
According to Bloomberg, the yield on the 5-year Eurobond issued in June 2014 remained flat at 3.6%, while the yield on the 10-year Eurobond increased by 10 bps to 5.8%, from 5.7% the previous week. Since the mid-January 2016 peak, yields on the Kenya Eurobonds have declined by 5.2% points and 3.8% points for the 5-year and 10-year Eurobonds, respectively, due to the relatively stable macroeconomic conditions in the country. Key to note is that these bonds currently have 1.2 and 6.2-years to maturity for the 5-year and 10-year bonds, respectively.
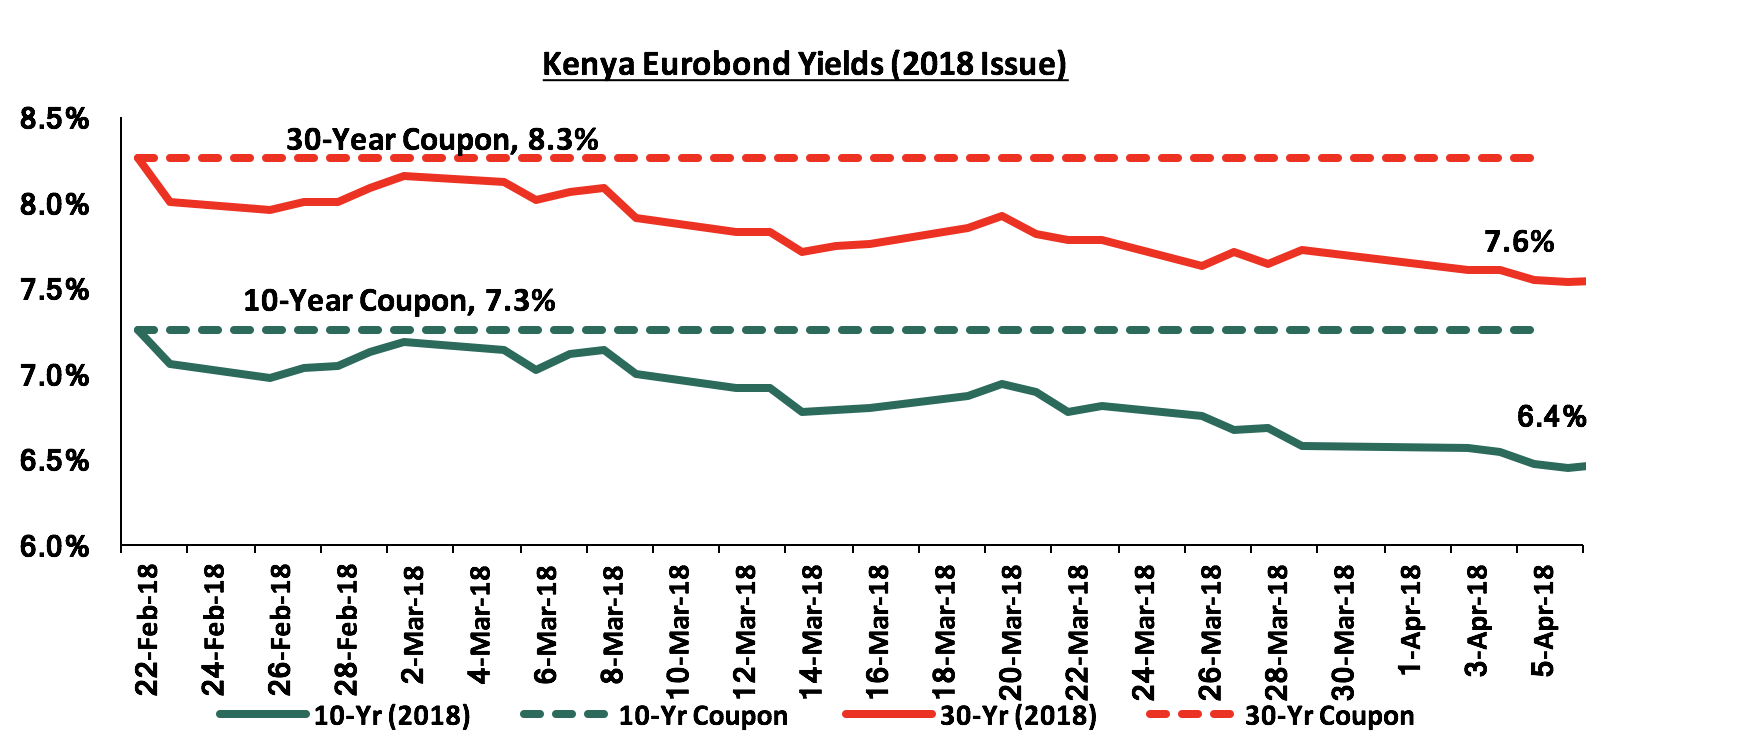
For the February 2018 Eurobond issue, during the week, the yields on the 10-year and 30-year Eurobonds remained the same at 6.4% and 7.6%, respectively. Since the issue date, yields on the 10-year and 30-year Eurobonds have declined by 0.8% points and 0.7% points, respectively, indicating foreign investor confidence in Kenya’s macro-economic prospects.
The Kenya Shilling appreciated by 0.2% against the US Dollar during the week, to close at Kshs 100.9 from Kshs 101.0 the previous week, driven by horticulture export inflows. On a YTD basis, the shilling has gained 2.3% against the USD. In our view, the shilling should remain relatively stable against the dollar in the short term, supported by:
- Weakening of the USD in the global markets as indicated by the US Dollar Index, which shed 9.9% in 2017, and has shed 2.5% YTD, as the Euro and the Sterling Pound continue to strengthen against the USD with the continued recovery of the Eurozone,
- Improving diaspora remittances, which increased by 47.5% to USD 210.4 mn in February 2018 from USD 142.7 mn in February 2017, driven by continued marketing of Kenya as an attractive investment destination for Kenyans in the diaspora, and,
- CBK’s intervention activities, as they have sufficient forex reserves, currently at USD 8.8 bn (equivalent to 5.9 months of import cover), and the USD 1.5 bn stand-by credit and precautionary facility by the IMF, still available until September 2018, after which a new facility will be discussed.
According to the Stanbic Bank’s Monthly Purchasing Manager’s Index (PMI), the business environment in the country had the greatest improvement in March 2018 since December 2016, mainly driven by favorable economic conditions and greater inflows from new export orders. The PMI rose to 55.7 in March from 54.7 in February. The Q1’2018 performance was notably strong, averaging 54.4, 4.4 points above the 50-point mark. A PMI reading of above 50 indicates improvements in the business environment, while a reading below 50 indicates a worsening outlook. Firms reported faster growth in value of outputs, while new orders accelerated bolstered by a record rise in new export orders. This was despite high input costs experienced towards the end of March. Output is expected to continue rising, driven by a recovery in agricultural produce, mainly horticulture, as the Eurozone (Kenya’s main horticultural export destination) continues to recover and boost demand. We maintain our view that GDP is expected to grow at 5.4% in 2018 supported by growth in the manufacturing, agriculture, real estate, construction and tourism sectors. Stanbic maintained their GDP growth projection for 2018 at 5.6%, same as their Q1’2018 projection.
The World Bank released their World Economic Update, April 2018, during the week. As per the update, Kenya’s GDP growth is expected to recover and grow at 5.5% in 2018, up from the estimated 4.8% in 2017, driven by (i) expected improvement in agricultural output due to better rains, (ii) recovery in the global economy supporting a rebound in business sentiment, which is expected to support a broad-based recovery in private investment, and (iii) the improved political environment after the elections. The growth is however expected to be abated by the rising oil prices, currently at USD 72.7 per barrel up from USD 66.9 at the end of 2017, and the weak private sector credit growth, at 2.1% as at February 2018, following the implementation of the interest rate cap in 2016. With the ongoing talks and the push by the IMF to repeal the interest cap, the outlook is positive since if this is to happen, there will be improvement in credit to the private sector. As per the report, Kenya is also expected to move towards becoming an upper middle-income economy following implementation of the government’s Big Four Agenda, which addresses areas of agricultural and food security, real estate and affordable housing, manufacturing, and Universal Health Coverage (UHC). These goals are in line with the third Medium Term Plan (MTP 2018-2022) of Kenya’s Vision 2030. Below is a table showing that the Kenyan economy is expected to grow by an average of 5.4% in 2018 according to updated projections by the organizations that we track. We shall continue to update this table as these organizations release their updated 2018 projections:
|
Kenya 2018 GDP Growth Outlook |
|||
|
No. |
Organization |
Q1'2018* |
Q2'2018** |
|
1 |
Central Bank of Kenya |
6.2% |
|
|
2 |
Kenya National Treasury |
5.8% |
|
|
3 |
Oxford Economics |
5.7% |
|
|
4 |
African Development Bank (AfDB) |
5.6% |
|
|
5 |
Stanbic Bank |
5.6% |
5.6% |
|
6 |
Citibank |
5.6% |
|
|
7 |
International Monetary Fund (IMF) |
5.5% |
|
|
8 |
World Bank |
5.5% |
5.5% |
|
9 |
Fitch Ratings |
5.5% |
|
|
10 |
Barclays Africa Group Limited |
5.5% |
|
|
11 |
Cytonn Investments Management Plc |
5.4% |
|
|
12 |
Focus Economics |
5.3% |
|
|
13 |
BMI Research |
5.3% |
5.2% |
|
14 |
Standard Chartered |
4.6% |
|
|
|
Average |
5.5% |
5.4% |
|
*Q1’2018 projections are annual GDP projections for 2018 as at Q1’2018 |
|||
|
**Q2’2018 projections are updated annual GDP projections as at Q2’2018 |
|||
Rates in the fixed income market have remained stable as the government rejects expensive bids. The government is under no pressure to borrow for this fiscal year due to: (i) they are currently ahead of their domestic borrowing target by 17.9%, (ii) they have met 72.9% of their total foreign borrowing target and 92.4% of its pro-rated target for the current fiscal year, and (iii) the KRA is not significantly behind target in revenue collection, and therefore we expect interest rates to remain stable. With the expectation of a relatively stable interest rate environment, our view is that investors should be biased towards medium to long-term fixed income instruments.
During the week, the equities market was on a downward trend with NASI, NSE 20 and NSE 25 losing 1.8%, 0.4% and 0.9%, respectively, taking their YTD performance to 11.8%, 2.5% and 15.5%, for NASI, NSE 20 and NSE 25, respectively. This week’s performance was driven by losses in KCB, BAT and Safaricom that declined by 4.5%, 4.1% and 3.9%, respectively, due to profit taking by investors. For the last twelve months (LTM), NASI, NSE 20 and NSE 25 have gained 41.7%, 22.6%, and 39.4%, respectively.
Equities turnover increased by 11.3% to USD 31.5 mn, from USD 28.3 mn the previous week. We expect the market to remain supported by positive investor sentiment this year, as investors take advantage of the attractive stock valuations in select counters.
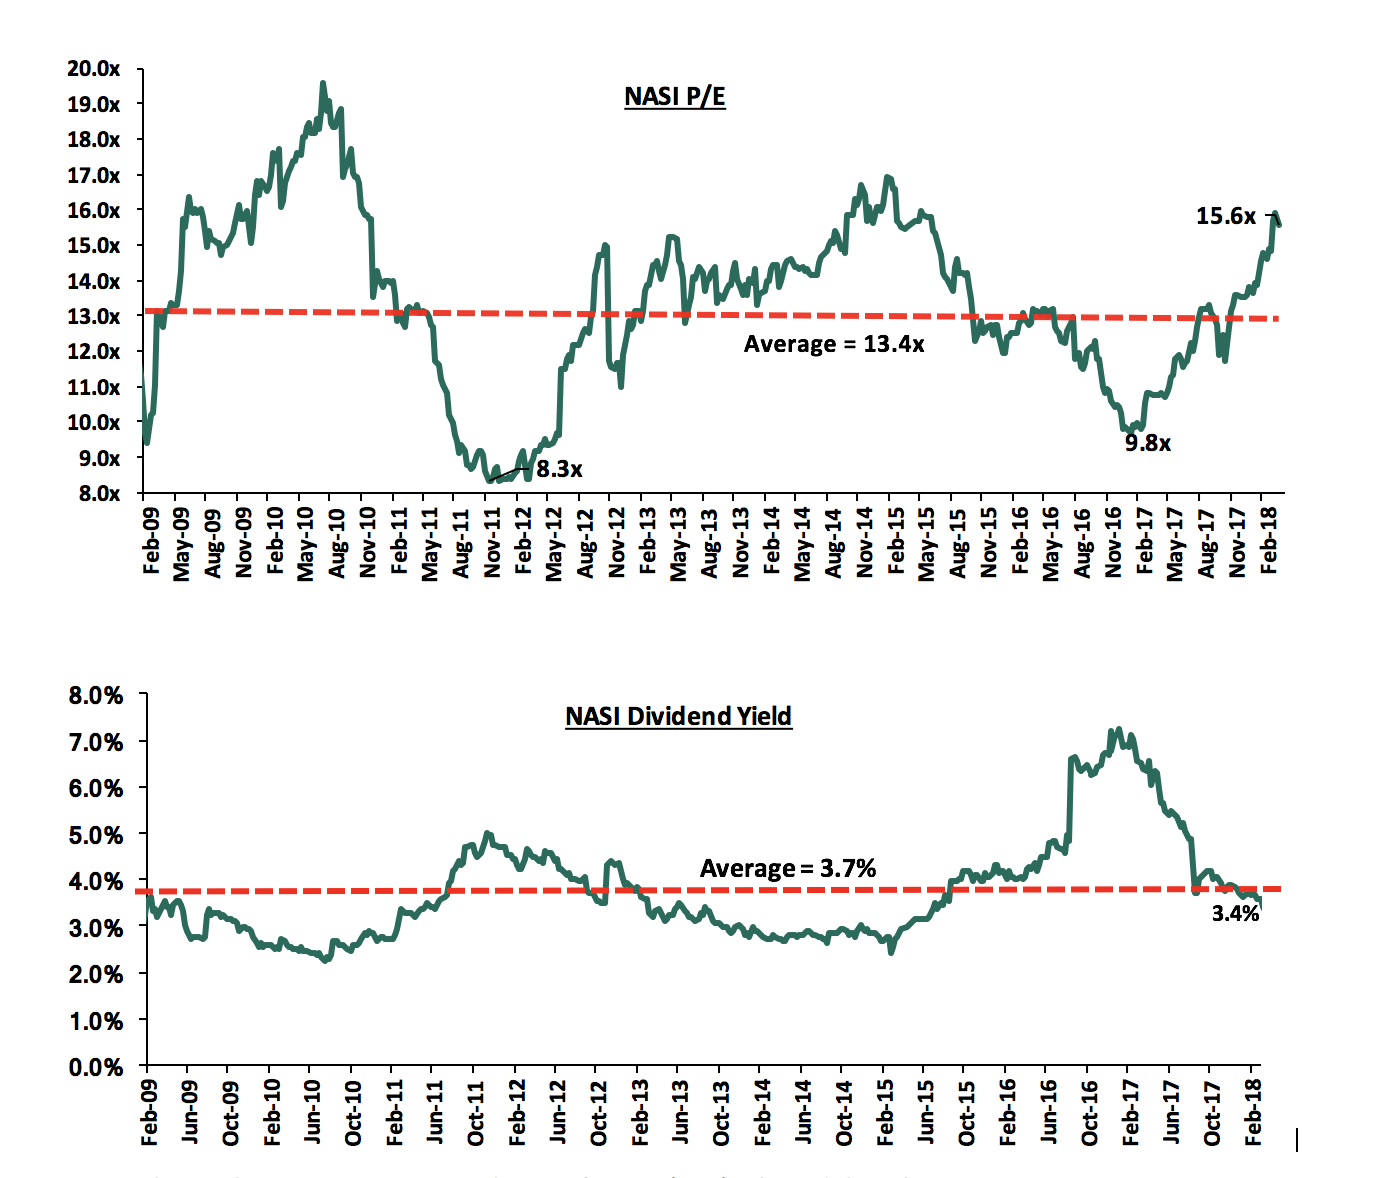
The market is currently trading at a price to earnings ratio (P/E) of 15.6x, which is 16.4% above the historical average of 13.4x, and a dividend yield of 3.4%, lower than the historical average of 3.7%. The current P/E valuation of 15.6x is 60.8% above the most recent trough valuation of 9.7x experienced in the first week of February 2017, and 88% above the previous trough valuation of 8.3x experienced in December 2011. The charts below indicate the historical P/E and dividend yields of the market.
During the week, Communications Authority of Kenya (CAK) released the telecommunications sector statistics of FY’2017/2018. The performance of the sector is as highlighted below:
|
Indicators |
July-Sep |
Oct-Dec |
Percentage change |
|
Q1’2017/2018 |
Q2’2017/2018 |
From Q1 to Q2 |
|
|
Mobile Subscriptions (in millions) |
41.0 |
42.8 |
4.4% |
|
Fixed Subscriptions |
71,118 |
69,861 |
(1.8%) |
|
Mobile Penetration |
90.4% |
94.3% |
4.3% |
|
Data/ Internet Subscriptions (in millions) |
30.9 |
33.0 |
8.0% |
|
Mobile Money Subscriptions (in millions) |
28.2 |
30.0 |
6.4% |
|
Mobile Money Agents |
184,537 |
198,234 |
7.4% |
|
Value of Transactions (in Kshs billion) |
1,659 |
1,763 |
63.7% |
Source- CAK
Key highlights include:
- Mobile subscriptions rose by 1.8 mn new subscriptions, representing a 4.4% growth to 42.8 mn from 41.0 mn, and as a consequence mobile penetration increased to 94.3% from 90.4%,
- Safaricom registered a 2.8% decline in market share to 69.1% from 71.9% in Q1’2017/18. The market share for Airtel Networks Limited rose to 17.2% from 14.9% in the previous quarter. The two companies command an 86.3% market share, although Safaricom remains a dominant player in the sector,
- As at 31st December 2017, there were 607.4 million transactions with the overall value of the transactions standing at Kshs 1.8 trillion. Moreover, there were 308.6 million mobile commerce transactions value at Kshs 1.1 trillion. This translates to a person to person transfer amount of Kshs 596.4 million in Q2’2017/18, up from Kshs 544.2 million in Q1’2017/18,
- The total data/internet subscriptions rose by 8.0% to 33 mn subscriptions from 30.6 mn, following the rollout of the 4G network. Safaricom’s market share in the segment decline by 3.2% from 76% in Q1’2017/18 to 72.8% in Q2’2017/18. Moreover, the market shares for Airtel Network limited and Telkom Kenya limited increased to 18.5% and 7.8% in Q2’2017/18 from 15.7% and 7.3%, respectively, in Q1’2017/18.
The mobile money segment continues to experience increased competition evidenced by a marginal reduction in Safaricom’s market share by value of transactions to 79.9% in Q2’2017/2018, from 80.4% in Q1’2017/18. Equitel however registered a 0.5% increase in its market share from 19.4% in Q1 2017/2018 to 19.9% in Q2’2017/2018. The mobile money market overview is as shown in the table below:
|
Company |
July-Sep |
Oct-Dec |
% Change in Market Share |
||
|
Value of transactions (Kshs bns) |
Market Share |
Value of transactions (Kshs bns) |
Market Share |
||
|
M-Pesa |
1,334.7 |
80.4% |
1,409.8 |
79.9% |
(0.5%) |
|
Airtel Money |
1.2 |
0.1% |
1.6 |
0.1% |
(0.0%) |
|
Equitel |
322.4 |
19.4% |
350.0 |
19.9% |
0.5% |
|
MobiKash |
0.1 |
0.0% |
0.1 |
0.0% |
0.0% |
|
MobilePay |
1.5 |
0.1% |
1.5 |
0.1% |
(0.0%) |
|
Total |
1,659.9 |
100.0% |
1,763.6 |
100.0% |
|
|
Source- CAK |
|
|
|
|
|
On the money transfer, we have seen great developments with;
- The transaction fees for cross-network money transfer transactions declining and matching the same network transfer charges. The cost of transferring between Kshs 101 and Kshs 500 from M-Pesa to Airtel Money declined by 75% to Kshs 11 from the previous Kshs 44. Furthermore, sending Kshs 1,100 from Airtel Money to M-Pesa will costs Kshs 15 compared to the previous Kshs 25, representing a 40% drop following the activation of the interoperability between Airtel and Safaricom. Mobile money subscribers will now be charged a similar amount when sending money to either an Airtel money or Safaricom Mpesa registered user, and,
- The amounts that can be transferred across networks increased since Safaricom raised the maximum transfer limit across networks to Kshs 70,000 from the initial Kshs 35,000.
The Central Bank of Kenya refined its capital waiver rules in accordance with the adoption of the IFRS 9 reporting standard, and stated that banks will have to take a full hit in the provisions for loans issued from 2019 onwards. According to the IFRS 9 reporting standard, banks are required to provide forward-looking provisioning for expected loan losses, rather than the previous retrospective method of provisioning. The initial drafted guidelines proposed a 5-year waiver period during which incremental provisions, emerging from the forward-looking provisions for expected credit losses, may be added to the earnings when computing core capital amounts. This move is likely to reduce capital positions for banks with poor asset quality, forcing them to raise capital in the near future, and lower tier banks that are constrained on capital will be the worst affected. We expect banks to adopt more stringent lending policies, thereby locking out risky borrowers, in order to mitigate the impact of expected credit losses on their respective capital positions.
The renewed push by the National Treasury and the Central Bank of Kenya to repeal the interest rate cap has been met with opposition from Parliament, who cite CBK’s failure to enforce the law as required. The Banking Amendment Act 2015 that capped lending rates at 4 percentage points above the CBR and deposit rates at 70 percentage points of the CBR was enforced in August 2016, in a move which stifled growth in private sector credit, as banks were unable to price risky borrowers in the set margins and instead opted to devote funds to investments with higher returns on a risk adjusted basis, such as government paper. Repeal of the rates cap was one of a raft of changes promised by The National Treasury to the IMF during the negotiations of the credit standby facility. This puts the CBK and Treasury in an unfavorable position, as the repeal of the law requires a passing vote by the legislators, which may lead to the law remaining in effect for much longer.
Below is our Equities Universe of Coverage:
|
all prices in Kshs unless stated otherwise |
||||||||||||
|
No. |
Company |
Price as at 06/04/18 |
Price as at 13/04/18 |
w/w Change |
YTD Change |
LTM Change |
Target Price* |
Dividend Yield |
Upside/ (Downside)** |
P/TBv Multiple |
||
|
1. |
NIC Group*** |
40.8 |
44.0 |
8.0% |
30.4% |
77.8% |
61.6 |
2.3% |
42.3% |
0.9x |
||
|
2. |
Zenith Bank |
27.3 |
26.1 |
(4.4%) |
1.8% |
86.4% |
33.3 |
10.3% |
38.0% |
1.4x |
||
|
3. |
Union Bank Plc |
6.7 |
6.3 |
(6.0%) |
(19.9%) |
44.0% |
8.2 |
0.0% |
30.4% |
0.7x |
||
|
4. |
Diamond Trust Bank |
214.0 |
210.0 |
(1.9%) |
9.4% |
69.4% |
272.9 |
1.2% |
31.2% |
1.2x |
||
|
5. |
CRDB |
170.0 |
170.0 |
0.0% |
6.3% |
(8.1%) |
207.7 |
5.6% |
27.8% |
0.7x |
||
|
6. |
KCB Group |
54.0 |
52.5 |
(2.8%) |
22.8% |
59.1% |
63.7 |
5.7% |
27.0% |
1.6x |
||
|
7. |
Ghana Commercial |
6.1 |
6.5 |
6.6% |
28.5% |
27.5% |
7.7 |
5.8% |
24.8% |
1.7x |
||
|
8. |
Stanbic Bank Uganda |
30.3 |
31.0 |
2.5% |
13.8% |
19.2% |
36.3 |
3.2% |
20.2% |
2.0x |
||
|
9. |
I&M Holdings |
120.0 |
129.0 |
7.5% |
1.6% |
39.5% |
151.2 |
2.7% |
19.9% |
1.4x |
||
|
10. |
Barclays |
13.0 |
13.0 |
0.4% |
35.4% |
45.3% |
13.7 |
7.7% |
12.9% |
1.6x |
||
|
11. |
Co-operative Bank |
19.8 |
19.3 |
(2.8%) |
20.3% |
68.0% |
20.5 |
4.2% |
10.8% |
1.7x |
||
|
12. |
UBA Bank |
11.9 |
10.7 |
(10.5%) |
3.4% |
84.9% |
10.7 |
8.0% |
8.5% |
1.0x |
||
|
13. |
Bank of Kigali |
290.0 |
290.0 |
0.0% |
(3.3%) |
18.9% |
299.9 |
4.2% |
7.7% |
1.7x |
||
|
14. |
National Bank |
9.0 |
8.3 |
(7.8%) |
(11.8%) |
37.5% |
8.6 |
0.0% |
4.2% |
0.5x |
||
|
15. |
Ecobank GH |
11.2 |
11.3 |
0.4% |
48.0% |
54.1% |
10.7 |
7.3% |
2.7% |
4.0x |
||
|
16. |
Equity Group |
54.5 |
55.5 |
1.8% |
39.6% |
70.8% |
54.3 |
3.6% |
1.5% |
2.5x |
||
|
17. |
Stanbic Holdings |
91.0 |
91.0 |
0.0% |
12.3% |
44.4% |
87.1 |
5.8% |
1.5% |
1.1x |
||
|
18. |
Bank of Baroda |
125.0 |
135.0 |
8.0% |
19.5% |
22.7% |
130.6 |
0.0% |
(3.3%) |
1.1x |
||
|
19. |
HF Group*** |
11.8 |
12.1 |
3.0% |
16.3% |
19.2% |
11.0 |
2.9% |
(6.4%) |
0.4x |
||
|
20. |
Guaranty Trust Bank |
44.1 |
44.1 |
(0.1%) |
8.1% |
73.8% |
37.2 |
6.1% |
(9.4%) |
2.7x |
||
|
21. |
SBM Holdings |
7.7 |
7.7 |
1.0% |
3.2% |
9.0% |
6.6 |
5.2% |
(10.0%) |
0.9x |
||
|
22. |
Access Bank |
12.0 |
11.5 |
(4.6%) |
9.6% |
84.7% |
9.5 |
5.7% |
(11.3%) |
0.8x |
||
|
23. |
Standard Chartered KE |
229.0 |
240.0 |
4.8% |
15.4% |
8.6% |
192.6 |
7.1% |
(12.7%) |
1.9x |
||
|
24. |
Stanbic IBTC Holdings |
48.0 |
49.0 |
2.1% |
14.5% |
172.2% |
37.0 |
1.0% |
(23.4%) |
2.9x |
||
|
25. |
CAL Bank |
1.6 |
1.9 |
12.8% |
71.3% |
277.6% |
1.4 |
0.0% |
(24.3%) |
1.2x |
||
|
26. |
Stanchart GH |
35.2 |
35.1 |
(0.3%) |
39.0% |
127.1% |
19.5 |
3.2% |
(41.4%) |
5.0x |
||
|
27. |
FBN Holdings |
12.2 |
12.3 |
0.8% |
39.2% |
303.0% |
6.6 |
1.6% |
(44.3%) |
0.7x |
||
|
28. |
Ecobank Transnational |
17.0 |
18.4 |
8.2% |
8.2% |
111.5% |
9.3 |
3.3% |
(46.3%) |
0.9x |
||
|
*Target Price as per Cytonn Analyst estimates |
|
|||||||||||
|
**Upside / (Downside) is adjusted for Dividend Yield |
|
|||||||||||
|
***Banks in which Cytonn and/or its affiliates holds a stake. For full disclosure, Cytonn and/or its affiliates holds a significant stake in NIC Bank, ranking as the 5th largest shareholder |
|
|||||||||||
We are “NEUTRAL” on equities for investors with a short-term investment horizon since the market has rallied and brought the market P/E slightly above its’ historical average. However, pockets of value exist, with a number of undervalued sectors like Financial Services, which provide an attractive entry point for long-term investors, and with expectations of higher corporate earnings this year, we are “POSITIVE” for investors with a long-term investment horizon.
Branch International, a mobile-based microfinance institution for emerging markets, headquartered in California and with operations in Kenya, Tanzania and Nigeria, raised USD 70.0 mn in Series B funding, which combines USD 50.0 mn in debt and USD 20.0 mn in equity of an undisclosed stake. The funding was led by California-based Trinity Ventures, a venture capital firm specializing in growth capital investments. Other investors include China-based CreditEase Fintech Investment Fund, Victory Park, IFC, and Andreessen Horowitz, which are based in the US. Branch International uses M-Pesa and Facebook established data to provide financial services to over one million borrowers. The funds will enable the mobile loan app company to expand its services beyond credit access, to savings and payments, and to start operations in India. Branch International processes loans worth Kshs 400.0 mn in a month in amounts ranging from Kshs 250.0 (USD 2.48) to Kshs 50,000 (USD 495.75). In Kenya, the company has disbursed Kshs 3.6 bn via mobile money platform M-Pesa since its launch in April 2015. Branch International targets to disburse over Kshs 25.2 bn (USD 250.0) mn in 2018. According to a March 2018 report from McKinsey, 2.0 bn people and 200.0 mn small businesses in emerging markets lack access to savings and credit, and technology-led financial services firms have the potential to acquire 1.6 bn new retail customers and grow individual and business loan volumes by USD 2.1 tn. The Series B investment brings Branch’s total funding to USD 80.0 mn in the three-years since it was founded. Similar investments in the past include debt financing led by Nabo Capital in 2017 of Kshs 200.0 mn (USD 2.0 mn), a Series A equity funding round for Branch International, the company's first significant round of venture capital financing, of USD 9.6 mn led by Andreessen Horowitz US-based venture capital firm in 2016, which was used for expansion into Nigeria, and an undisclosed seed capital from US-based Formation 8 and Khosla Ventures. This indicates growth in alternative lending platforms driven by a decline in private sector credit growth in Kenya, which sunk to 2.4% in 2017, from highs of 25.0% before the introduction of the interest rates capping regulation in 2016.
Private equity investments in Africa remains robust as evidenced by the increasing investor interest, which is attributed to: (i) rapid urbanization, a resilient and adapting middle class and increased consumerism, (ii) the attractive valuations in Sub Saharan Africa’s private markets compared to its public markets, (iii) the attractive valuations in Sub Saharan Africa’s markets compared to global markets, and (iv) better economic projections in Sub Sahara Africa compared to global markets. We remain bullish on PE as an asset class in Sub-Sahara Africa. Going forward, the increasing investor interest and stable macro-economic environment will continue to boost deal flow into African markets.
The hospitality sector continues to record increased investment and global interest, with the latest being the launch of the Movenpick Hotel in Westlands, Nairobi, on Monday 9th April 2018. The property is the first in Kenya under the Swiss hotelier brand, Movenpick Hotels and Resorts, and is owned by Golf Course Hotel based in Kampala. The 5-star hotel brings to the market 128 guest rooms, 94 suites, 54 one and two-bedroom residential apartments, and 4,000 SQM of conference space. The brand joins other top global brands, which have already established themselves in the Nairobi market, and they include; Four Points by Sheraton, Accor Hotels, Kempinski, Hilton and Radisson Hotel Group, which operates Radisson Blu Hotel in Upperhill. According to Cytonn Research, the supply of top-rated (3,4 and 5-star) hotel rooms has been growing at a 7-year CAGR of 4.6% to 1.9 mn room nights in 2017, from 1.5 mn in 2011, driven by the growing number of international arrivals, projected to increase by 11.0% in 2018, from 1.5 mn arrivals in 2017 to 1.6 mn in 2018. Through the opening of the Hilton Garden Inn Hotel and City Lodge along Kiambu Road, Nairobi currently has a total of 5,620 top-rated hotel rooms.
Below is a table showing the recent top-rated hotels opening in Nairobi and those in the pipeline;
|
Hotel Openings in Nairobi, 2018 |
|||||
|
Operator |
Name |
Location |
Rating |
Hotel Rooms |
Opening Date |
|
City Lodge |
City Lodge |
Limuru Road |
3 |
170 |
January- 2018 |
|
Hilton |
Hilton Garden Inn |
Mombasa Road |
3 |
175 |
March- 2018 |
|
Movenpick Hotels and Resorts |
Movenpick |
Westlands |
5 |
*222 |
April- 2018 |
|
Green Hills Investments |
Trade Mark Hotel |
Limuru Road |
4 |
215 |
February- 2018 |
|
Carlson Rezidor |
Radisson Residence |
Kilimani |
5 |
123 |
**2018 |
|
Local |
Ole Sereni (Expansion) |
Mombasa Road |
4 |
154 |
**2018 |
|
Total |
|
|
|
1,059 |
|
|
*Movenpick Hotel rooms excludes the apartments ** Expected completion of construction |
|||||
Source: Cytonn Research
The World Bank’s Kenya Economic Update, April 2018, highlighted that if the government is to achieve one of its pillars, which is affordable housing , then they need to work on the key policies that will support the supply of affordable housing, which include (i) implementation of regulations that will alleviate the land registration process and unlock land for development, (ii) the establishment of a one stop shop for property registration through land records storage systems and digitalization of other processes to ease title transfers, and (iii) the amendment of the Sectional Properties Act that will allow the issuing of titles to multi-story units.
On the other hand, with the aim of boosting actionable demand for these affordable houses, the report recommends: (i) amendments of policies that constrain provision of mortgages to encourage borrowing and standardization of mortgage accounts to lower the cost of mortgages, (ii) efficient management of the bond market, which should lead rates, with the aim of unlocking housing finance, and (iii) review of stamp duty for first-time buyers, thus lowering the purchasing costs. In our view, the delivery of affordable housing will be a significant step in addressing the housing deficit that currently stands at approximately 2.0 mn units and growing at 200,000 units annually according to the National Housing Corporation. Its realization is however significantly dependent upon the effectiveness of the government in meeting its pledges and addressing the key limitations to affordable housing.
Nakumatt Holdings closed its Village Market branch, following financial constraints that have seen the retailer close down most of its branches. The crisis surrounding Nakumatt is attributed to internal challenges on financing and supply chain management. The troubled retailer has been undergoing restructuring aimed at recovering from insolvency. For more details on this see our focus on Restructuring an Insolvent Business – Case Study of Nakumatt Holdings. We currently do not see any viable path to recovery for Nakumatt given (i) the inability of the administrator to develop a credible restructuring plan, (ii) the desire by most creditors, especially trade creditors, to get a liquidation so as to achieve a bad debt tax write off amounting to 30.0% to 45.0%, if VAT refunds are factored in, (iii) the falling apart of the deal with Tuskys, and (iv) the coming together of all remaining landlords, and their resolve to see Nakumatt leave their premises even by deploying frustration tactics such as switching off basic utilities among other services. We now anticipate the expansion of other retailers in the market will pick up speed; they have been on the forefront seeking to occupy prime locations previously occupied by Nakumatt, as they look to gain from the opportunities in the retail market driven by (i) positive demographics characterized by population growth rates that currently stand at 2.6%, 1.4% points higher than global averages of 1.2%, (ii) urbanization rates of 4.4% against global averages of 2.1%, and (iii) an expanding middle class with increased purchasing power due to higher disposable incomes, which create demand for retail products.
We expect increased activities in the real estate sector during the year driven by (i) a calm political environment, (ii) economic recovery with the GDP projected to come in between 5.3% and 5.5% compared to an estimated 4.8% in 2017, and (iii) sustained infrastructural development.
Following the release of the FY’2017 results by Kenyan listed banks, the Cytonn Financial Services Research Team undertook an analysis on the Kenyan Banking Sector to point out any material changes from our Q3’2017 Banking Report. In our FY’2017 Banking Report, we analyze the results of the listed banks in order to determine which banks are the most attractive and stable for investment from a franchise value and from a future growth opportunity perspective.
The report is themed “Diversification and efficiency key to growth amidst tighter regulation” as we assess what factors will be crucial for the sustainability of the banking sector, with banks adjusting their business models in an effort to manage increased regulation and the tougher business environment. As a result, we seek to answer the question, “What must banks focus on going forward?”, as we look forward to a relatively challenging operating environment for the banking sector due to (i) IFRS 9 having coming into effect in 2018, and (ii) the interest rate caps. We expect more emphasis on alternative revenue streams by banks to non-funded income as they work on their efficiency.
Below are the 6 key themes that shaped the banking sector over 2017:
- Regulation – The effects of the Banking (Amendment) Act 2015 have been felt over 2017, with banks recording a decline in core EPS by 1.0% compared to a growth of 4.4% in 2016, and a five-year average of 6.7%. The private sector credit growth remains low at 2.1% as at February 2018, compared to 5.4% when the Banking (Amendment) Act 2015 came into play, and way below the set government target of 18.3%. The amendment stipulates a deposit and loan-pricing framework, with (i) a cap on lending rates at 4.0% above the Central Bank Rate (CBR), and (ii) a floor on the deposit rates at 70% of the CBR. The capping of interest rates, however, has seen banks prefer not to lend to customers but rather invest in risk-free treasuries that offer better returns on a risk adjusted basis. This can be witnessed through increased allocation by listed banks towards government securities, with allocation growing by 22.2% during the year to Kshs 799 bn from Kshs 654 bn in 2016;
- Revenue Diversification – With banks registering compressed net interest margins following the capping of interest rates, much of the attention has shifted to diversifying income, through non-funded income, as this section of the bank’s revenue is not affected by the interest rate caps. Non-funded income (NFI) has grown by 9.1% in FY’2017, compared to the 5-year average growth of 8.1%, taking its contribution to total income to 33.6%, from 31.0% registered in FY’2016, compared to the 5-year average contribution of 33.4%. We expect this to continue going into 2018, as banks seek alternative sources of income to boost profitability. We believe revenue and product diversification is one of the core opportunities for the banking sector;
- Efficiency – The focus for the banking sector in 2017 was on adjusting business models to conform to the Banking (Amendment) Act 2015. To this effect, banks took proactive measures aimed at increasing operational efficiency in response to the challenging operating environment, such as laying off staff, closure of branches, reviewing operating hours for some branches, or outright sales in the case of struggling Tier III banks. Going forward, we are likely to witness banks’ push for efficiency gather pace to balance off the expected reduction in absolute profitability going forward as they shy away from the physical branch model, which is very expensive compared to other alternative channels such as digital platforms.
Below is a summary of the branches closed and staff laid off over the last one year as the banks seek efficiency:
|
Kenya Banking Sector Restructuring |
|||
|
|
Bank |
Staff Retrenchment |
Branches Closed |
|
1. |
Sidian Bank |
108 |
- |
|
2. |
Equity Group |
400 |
7 |
|
3. |
Ecobank |
- |
9 |
|
4. |
Family Bank |
Unspecified |
- |
|
5. |
First Community Bank |
106 |
- |
|
6. |
Bank of Africa |
- |
12 |
|
7. |
National Bank |
150 |
- |
|
8. |
NIC Bank |
32 |
Unspecified |
|
9. |
Standard Chartered Bank Kenya |
300 |
4 |
|
10. |
KCB Group |
223 |
Unspecified |
|
11. |
Barclays Bank |
301 |
7 |
|
12. |
I&M Holdings |
- |
Unspecified |
|
|
TOTAL |
1,620 |
39 |
- Asset Quality – The banking sector has witnessed a deterioration in its asset quality over the past year, with the gross non-performing loans ratio rising to 12.4% from 10.9% in FY’2016, much higher than the 5-year average of 8.4%, owing to the challenging operating environment in 2017 that saw an increase in bad loans. We are seeing banks becoming more selective, prudent and conservative in terms of loan disbursement, since with the current pricing framework, it is difficult to price riskier clients within the loan limit cap in the cost of loans. This has led banks to reduce their unsecured and micro loans to small businesses, which are deemed risky, and allocating towards perceived less risky government instruments, and we expect loan growth to be subdued in 2018, as banks tighten their risk assessment framework;
- Prudence – With the implementation of IFRS 9 from the previous IAS 39, which took effect from 1st January 2018, banks are required to provide additionally for loans. IFRS 9 takes on a forward looking or expected impairment approach, meaning that the issuer of the loan is to calculate unrealized default on a facility, depending on the stage of the financial instrument. Some banks have estimated a 25.0% general increase in provisions as a result of the new regulation, though it is expected that most banks, those with adequate capital buffers, will pass the effect through the balance sheet, affecting retained earnings, with a consequential reduction in Tier I capital. We believe that the new regulation will mean that banks should and will be much more prudent in loan disbursement as the impact of non-performing loans will adversely affect them, through either (i) decreased profitability, brought about by increased provisioning, or (ii) lower capital adequacy buffers, that may see some banks edge under the regulatory minimum requirements, requiring to raise more cash in order to sustain themselves. The Central Bank of Kenya had initially published draft guidelines proposing a 5-year transition period for IFRS 9, during which a bank’s incremental provisions may be added back to earnings for purposes of computing core capital. This was however revised to end of 2018, after which banks are expected to fully comply to the new standard;
- Consolidation – Consolidation in the banking sector picked up at the start of 2017, but slowed as the year progressed. Diamond Trust Bank Kenya (DTBK) completed the acquisition of Habib Bank (K) Limited (HBL), with the deal finalized in Q3’2017. We would have expected even a lot more consolidation in 2017, due to the attractive valuations in the banking sector and the effects of tighter regulation. It is notable that acquisitions are also happening at much cheaper valuations currently compared to earlier bank acquisitions. For instance, Fina Bank, K-Rep and Equatorial Commercial Bank that were acquired between 2013 and 2015, traded at 3.2x, 1.8x and 2.3x P/B, respectively, while recent acquisitions are happening at between 0.8x to 1.7x P/B, with DTBK acquiring Habib Bank at 0.8x in 2017, and SBM Holdings acquiring Fidelity Commercial Bank at 1.6x in 2016; hence it is a great time to be an acquirer. We are surprised that some of the smaller banks have managed to stay independent this long, as we would have expected weaker banks (that don’t serve a niche, or don’t have a clear deposit gathering strategy), being forced to merge or be acquired. We however expect that the sustained effects of the rate cap and the reduction in the transition period for IFRS 9 adoption to have an effect on profitability and capital levels going forward and therefore still lead to more consolidation in the industry.
Below is the summary of the transaction metrics of some of the acquisitions that have happened in the banking sector, including DTBK’s acquisition of Habib Bank Kenya.
|
Acquirer |
Bank Acquired |
Book Value at Acquisition (Kshs bn) |
Transaction Stake |
Transaction Value (Kshs bn) |
P/BV Multiple |
Date |
|
Diamond Trust Bank Kenya |
Habib Bank Limited Kenya |
2.4 |
100.0% |
1.8 |
0.8x |
Mar-17 |
|
SBM Holdings |
Fidelity Commercial Bank |
1.8 |
100.0% |
2.8 |
1.6x |
Nov-16 |
|
M Bank |
Oriental Commercial Bank |
1.8 |
51.0% |
1.3 |
1.4x |
Jun-16 |
|
I&M Holdings |
Giro Commercial Bank |
3.0 |
100.0% |
5.0 |
1.7x |
Jun-16 |
|
Mwalimu SACCO |
Equatorial Commercial Bank |
1.2 |
75.0% |
2.6 |
2.3x |
Mar-15 |
|
Centum |
K-Rep Bank |
2.1 |
66.0% |
2.5 |
1.8x |
Jul-14 |
|
GT Bank |
Fina Bank Group |
3.9 |
70.0% |
8.6 |
3.2x |
Nov-13 |
|
Average |
80.3% |
1.8x |
Based on the above, we believe the sector is shaping up to a more diversified banking model and prudence in operations, as can be seen through the increase in alternative channels and restructuring in the sector, as banks adjust to the business environment and the current regulatory framework.
Below is a summary of the FY’2017 results for the eleven listed banks and key take-outs from the results:
|
Listed Banks FY'2017 Earnings and Growth Metrics |
|||||||||||
|
Bank |
Core EPS Growth (%) |
Interest Income Growth (%) |
Interest Expense Growth (%) |
Net Interest Income Growth (%) |
Net Interest Margin (%) |
Non-Funded Income (NFI) Growth (%) |
NFI to Total Operating Income (%) |
Growth in Total Fees& Commissions (%) |
Deposit Growth (%) |
Loan Growth (%) |
Growth in Govt. Securities (%) |
|
NBK |
479.0 |
(17.7) |
(24.9) |
(13.7) |
7.4 |
(15.0) |
26.5 |
(1.2) |
0.4 |
0.4 |
(4.8) |
|
Equity Group |
14.0 |
(6.6) |
8.1 |
(10.2) |
9.0 |
24.2 |
42.0 |
22.0 |
10.7 |
4.9 |
27.3 |
|
KCB Group |
(0.1) |
1.4 |
(3.1) |
2.9 |
8.7 |
2.5 |
32.2 |
16.4 |
11.5 |
9.6 |
7.4 |
|
Stanbic |
(2.5) |
(3.0) |
(5.3) |
(2.0) |
5.2 |
10.0 |
44.2 |
38.6 |
24.1 |
8.1 |
42.6 |
|
NIC Group |
(4.3) |
(3.2) |
11.5 |
(11.5) |
6.3 |
3.6 |
27.9 |
14.2 |
24.2 |
4.6 |
77.9 |
|
Barclays Bank |
(6.4) |
(3.4) |
(7.2) |
(2.4) |
9.7 |
(9.5) |
27.9 |
8.6 |
12.5 |
(0.7) |
20.1 |
|
I&M Holdings |
(7.1) |
(0.1) |
0.0 |
0.6 |
7.8 |
15.9 |
27.0 |
22.0 |
15.5 |
13.6 |
10.9 |
|
Co-op Bank |
(10.0) |
(4.5) |
(3.9) |
(4.7) |
9.2 |
5.6 |
32.4 |
0.3 |
9.2 |
7.1 |
19.7 |
|
DTBK |
(10.3) |
2.4 |
3.6 |
1.5 |
6.5 |
4.1 |
21.1 |
5.3 |
11.8 |
5.2 |
23.3 |
|
Stanchart |
(24.0) |
1.9 |
20.3 |
(4.1) |
8.4 |
2.3 |
32.1 |
(0.4) |
14.3 |
2.9 |
26.7 |
|
HF Group |
(86.1) |
(17.1) |
(11.1) |
(24.3) |
5.2 |
78.2 |
31.1 |
(37.6) |
(3.7) |
(8.9) |
(44.0) |
|
Weighted Average** |
(1.0%) |
(2.4%) |
2.6% |
(3.8%) |
8.4% |
9.1% |
33.6% |
13.4% |
12.5% |
6.1% |
22.2% |
|
Weighted 2016 Average |
4.4% |
15.5% |
6.2% |
20.3% |
9.2% |
2.4% |
31.0% |
12.6% |
6.4% |
6.3% |
45.8% |
Key takeaways from the table above include:
- The listed banks recorded a 1.0% decline in core EPS, compared to a growth of 4.4% in 2016. Only National Bank and Equity Group recorded a growth in core EPS, registering at 479%, and 14% growth in earnings, respectively. National Bank restated their 2016 results, and benefitted from a decline in loan loss provisioning, while Equity Group gained on the back of a 24.2% growth in Non-Funded income (NFI). HF Group recorded the biggest decline at 86.1%, on the back of a 24.3% decline in Net Interest Income (NII);
- Average deposit growth came in at 12.5%. However, despite the average deposits having grown, the interest expense paid on deposits recorded a slower growth of 2.6% on average, indicating that banks are growing deposits but opening less interest earning accounts and possibly transferring some existing interest earning accounts to transaction accounts;
- Average loan growth has been recorded at 6.1%, however interest income has decreased by 2.4%, showing the effects of the rate cap;
- Investment in government securities has grown by 22.2%, outpacing loan growth of 6.1%, showing increased lending to the government by banks as they avoid the risky borrowers;
- The average Net Interest Margin in the banking sector currently stands at 8.4%, a decline from the 9.2% recorded in 2016, and,
- Non-funded income has grown by 9.1%, which included a Fee and Commissions growth of 13.4%. This shows that banks are charging more fee income to improve their income on loans above the rate cap maximum.
Private sector credit growth continues to remain low, coming in at 2.1% in February 2018, way below the government set target of 18.3%, as banks channel funds more actively towards government securities, depriving the private sector of credit.
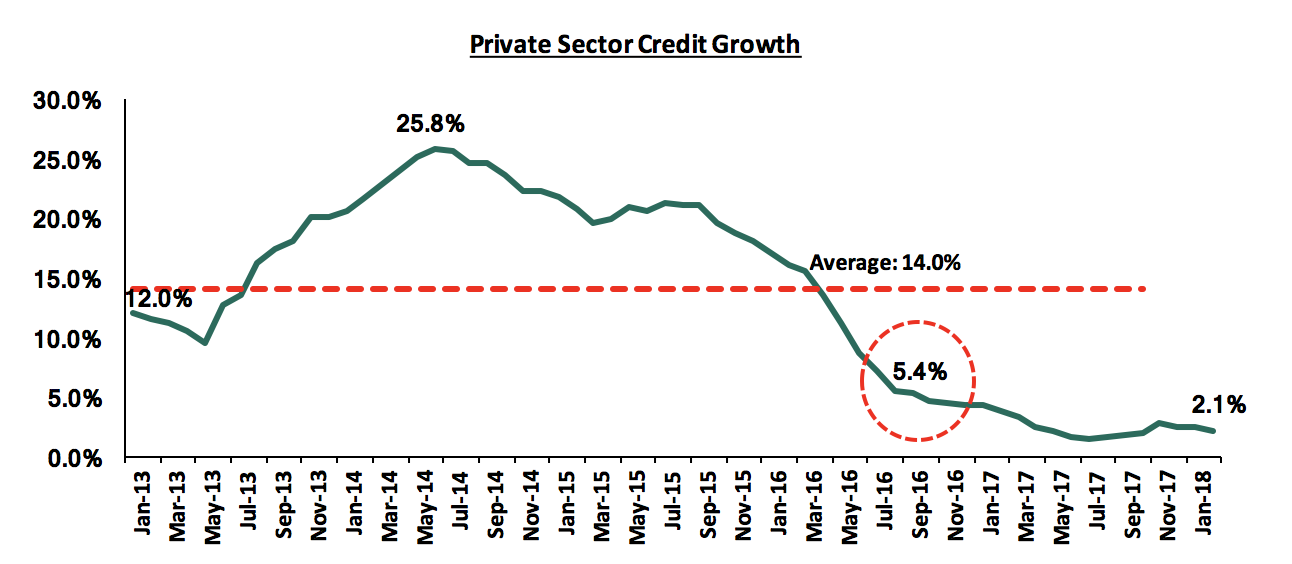
Rate cap came into effect in August 2016 when private sector credit growth was at 5.4% as highlighted above, with the decline before that as a result of a challenging operating environment
Following the challenges that the banking sector has been facing, primarily (i) the deteriorating asset quality brought about by a challenging operating environment, and (ii) the capping of interest rates, which has led to decreased profitability by banks in 2017, as private sector remains subdued, we believe the key factors banks will consider going into 2018 are diversification, prudency and efficiency. Banks will have to diversify their income sources to more fee-income business, be prudent in loan disbursement, as well as enhancing their risk assessment framework, coupled with efficiency, in a bid to protect their profit margins. The challenging operating environment is further underpinned by the coming into effect of IFRS 9 and Basel III, which will require banks to embrace both prudence and efficiency in order to be compliant and enhance profitability, which we believe will lead to a more stable and robust sector.
As per our analysis on the banking sector, from a franchise value and from a future growth opportunity perspective, we carried out a comprehensive ranking of the listed banks. For the franchise value ranking, we included the earnings and growth metrics in the table above as well as the operating metrics in the table below in order to carry out a comprehensive review of the banks.
|
Listed Banks FY’2017 Operating Metrics |
|||||||
|
Bank |
LDR |
CIR |
ROACE |
Deposits per Branch (bns) |
Gross NPL Ratio |
NPL Coverage |
Tangible Common Ratio |
|
Co-operative Bank |
88.3% |
60.9% |
15.9% |
1.9 |
7.2% |
37.6% |
17.6% |
|
KCB Group |
84.6% |
59.2% |
19.5% |
1.9 |
8.4% |
67.9% |
15.9% |
|
Diamond Trust Bank |
73.6% |
59.6% |
13.9% |
1.9 |
7.2% |
67.5% |
13.0% |
|
Equity Group |
74.8% |
58.7% |
21.6% |
1.3 |
6.2% |
50.3% |
16.6% |
|
I&M Holdings |
90.4% |
56.2% |
17.9% |
4.0 |
12.1% |
40.0% |
18.5% |
|
NIC Group |
86.2% |
62.5% |
12.9% |
3.0 |
11.9% |
45.7% |
16.0% |
|
Barclays Bank |
90.5% |
65.8% |
16.0% |
2.1 |
7.1% |
70.0% |
15.9% |
|
Standard Chartered |
59.2% |
63.2% |
16.5% |
4.8 |
12.8% |
74.4% |
15.3% |
|
Stanbic Holdings |
74.1% |
71.7% |
10.4% |
5.5 |
7.0% |
47.4% |
13.5% |
|
HF Group |
135.4% |
92.3% |
1.1% |
1.5 |
15.6% |
36.4% |
15.6% |
|
National Bank |
55.5% |
91.4% |
5.8% |
1.3 |
40.6% |
57.1% |
5.6% |
|
Weighted Average |
80.0% |
61.1% |
17.6% |
2.4 |
8.3% |
56.4% |
16.1% |
The overall ranking was based on a weighted average ranking of Franchise value (accounting for 40%) and Intrinsic value (accounting for 60%). The Intrinsic Valuation is computed through a combination of valuation techniques, with a weighting of 75.0% on Discounted Cash-flow Methods and 25.0% on Relative Valuation, while the Franchise ranking is based on banks operating metrics, meant to assess the efficiency, asset quality, diversification, corporate governance and profitability, among other metrics.
|
CYTONN’S FY’2017 BANKING REPORT – COMPOSITE RANKINGS |
|||||
|
Bank |
Franchise Value Total Score |
Intrinsic Value Score |
Weighted Score |
FY‘2017 Rank |
Q3‘2017 Rank |
|
KCB Group |
53.0 |
3.0 |
23.0 |
1 |
1 |
|
Equity Group |
55.0 |
8.0 |
26.8 |
2 |
4 |
|
I&M Holdings |
68.0 |
4.0 |
29.6 |
3 |
7 |
|
Co-operative Bank |
66.0 |
6.0 |
30.0 |
4 |
2 |
|
NIC Bank |
74.0 |
1.0 |
30.2 |
5 |
5 |
|
Barclays Bank |
71.0 |
5.0 |
31.4 |
6 |
3 |
|
Diamond Trust Bank |
78.0 |
2.0 |
32.4 |
7 |
6 |
|
Standard Chartered Bank |
77.0 |
11.0 |
37.4 |
8 |
9 |
|
Stanbic Holdings |
85.0 |
9.0 |
39.4 |
9 |
8 |
|
National Bank of Kenya |
111.0 |
11.0 |
48.6 |
10 |
10 |
|
HF Group |
117.0 |
10.0 |
52.8 |
11 |
11 |
Major changes include:
- I&M Holdings climbed up 4 spots to Position 3 from Position 7 in our Q3’2017 Banking Sector Report, owing to its efficiency, with the bank having the lowest Cost to Income ratio at 56.2%, lower than industry average of 67.4%, and good deposit mobilization, with a deposit per branch of Kshs 4.0 bn, much higher than the industry at Kshs 2.7 bn,
- Barclays Bank dropped 3 spots to Position 6 from Position 3 in our Q3’2017 Banking Sector Report, due to a high Cost to Income ratio at 65.8% and relative expensive valuation, with the bank trading at a P/TBv of 1.6x.
For a comprehensive analysis on the ranking and methodology behind it, see our Cytonn FY’2017 Banking Sector Report.
Disclaimer: The views expressed in this publication, are those of the writers where particulars are not warranted. This publication, which is in compliance with Section 2 of the Capital Markets Authority Act Cap 485A, is meant for general information only, and is not a warranty, representation, advice or solicitation of any nature. Readers are advised in all circumstances to seek the advice of a registered investment advisor.

- Talk to us
- Kenya
- P.O Box 20695 - 00200, Nairobi, Kenya
- Cell +254709101200
- Tel +254709101200
- WhatsApp +254741676635
- United States
- +254709101200
- DOWNLOAD OUR APP
-


- Kenya
- 8th Floor, Pinetree Plaza, Kaburu Drive, Ngong Road, Nairobi, Kenya
- USA
- Suite 1150, 1775 Eye Street NW, USA, Washington DC 20006, USA
- Investments
- High Yield
- Private Equity
- Real Estate
- Real Estate
- RiverRun Estates
- Cytonn Towers
- The Ridge
- Taraji Heights
- The Alma