Kenya Listed Banks H1'2018 Report, & Cytonn Weekly #36/2018
By Cytonn Research Team, Sep 23, 2018
Executive Summary
Fixed Income
T-bills were oversubscribed during the week, with the overall subscription rate coming in at 123.9%, a decline from 181.1% recorded the previous week. The yields on the 91-day and 364-day papers remained unchanged at 7.6% and 9.7%, respectively, while the yield on the 182-day paper declined by 10 bps to 8.7% from 8.8%, the previous week. During the week, the National Assembly convened for special parliamentary sittings held on 18th September and 20th September to discuss the budget supplementary estimates and the President’s reservations against the Finance Bill. All the proposals as per the president’s memorandum tabled in parliament were passed despite a chaotic sitting, after which the president assented to the Finance Bill 2018 on 21st September 2018;
Equities
During the week, the equities market was on a downward trend with NASI, NSE 20 and NSE 25 declining by 8.0%, 5.4% and 8.4%, respectively, taking their YTD performance to declines of 15.0%, 23.7% and 15.9%, respectively. For the last twelve months (LTM), NASI, NSE 20 and NSE 25 have declined by 12.4%, 25.0% and 15.9%, respectively. The President assented to the Finance Bill 2018, which effectively scraps the 70.0% base rate on bank deposits while retaining the cap on loan pricing at 4.0% above the Central Bank Rate (CBR);
Private Equity
In the financial services sector, Kuramo Capital, a New York based investment management firm focused on alternative investments in frontier and emerging markets, has acquired an additional 17.5% stake in GenAfrica Asset Managers Ltd from the management and staff of GenAfrica Asset Managers for Kshs 554.2 mn, bringing its total stake to 90.8%, and effectively valuing GenAfrica at Kshs 3.2 bn;
Real Estate
During the week, the National government invited bids from local and international developers to build 2,000 affordable residential units at Nairobi’s Park Road estate situated in Ngara for low – income earners. Plans are underway to construct a 61-storey Mixed Use Development (MUD) in Watamu, named ‘Palm Exotjca’ whereas Aviation Industry Corporation of China (Avic) International Real Estate Limited launched their project termed ‘Global Trade Center’ (GTC) in Westlands, Nairobi. Lastly, French retailer, Carrefour, expressed interest to take up tenancy at Nakumatt Mega, along Uhuru Highway in Nairobi, after the expiration of Nakumatt’s lease at the end of this month of September;
Focus of the Week
Following the release of the H1’2018 results by Kenyan listed banks, we analyze the results of the listed banks for H1’2018 to determine which banks are the most attractive and stable for investment from a franchise value, and from a future growth opportunity (intrinsic value) standpoint. The theme for the report is “Growth and Efficiency aided by Technology, amid deteriorating Asset Quality” as we assess what factors will be crucial for sustainable growth and stability of the Kenyan banking sector going forward;
- Maurice Oduor, the Principal Officer of Cytonn Asset Managers Ltd was on Citizen T.V. to discuss the proposed taxes on petroleum products. Watch him here
- Faith Maina, Investments Analyst was on KBC Channel 1 to discuss about the impact of the Finance Bill 2018. Watch her here
- Faith Maina, Investments Analyst was on KBC Channel 1 to discuss about the impact of the passing of the Finance Bill 2018. Watch her here
- Beatrice Mwangi, Research Assistant was on Ebru T.V. to discuss property trends. Watch her here
- We continue to hold weekly workshops and site visits on how to build wealth through real estate investments. The weekly workshops and site visits target both investors looking to invest in real estate directly and those interested in high yield investment products to familiarize themselves with how we support our high yields. Watch progress videos and pictures of The Alma, Amara Ridge, The Ridge, and Taraji Heights. Key to note is that our cost of capital is priced off the loan markets, where all-in pricing ranges from 16.0% to 20.0%, and our yield on real estate developments ranges from 23.0% to 25.0%, hence our top-line gross spread is about 6.0%. If interested in attending the site visits, kindly register here
- We continue to see very strong interest in our weekly Private Wealth Management Training (largely covering financial planning and structured products). The training is at no cost and is open only to pre-screened participants. We also continue to see institutions and investment groups interested in the training for their teams. The Wealth Management Training is run by the Cytonn Foundation under its financial literacy pillar. If interested in our Private Wealth Management Training for your employees or investment group please get in touch with us through wmt@cytonn.com. To view the Wealth Management Training topics, click here
- For recent news about the company, see our news section here
- We have 10 investment-ready projects, offering attractive development and buyer targeted returns of around 23.0% to 25.0% p.a. See further details here: Summary of Investment-Ready Projects
- We continue to beef up the team with ongoing hires for Business Manager-Commercialization and Unit Managers - Mt. Kenya Region. Visit the Careers section on our website to apply
- Cytonn Real Estate is looking for a 0.75-acre land parcel for a joint venture in any of the following areas, Lavington, Loresho (near Loresho Shopping Centre and its environs), Spring Valley Shopping Centre and its environs, Redhill Road (should be between Limuru Road Junction and Westlands Link Road), Lower Kabete Road (between Ngecha Road Junction and UON Campus), and Karen. The parcel should be in a good location with frontage to a tarmac road. For more information or leads, email us at rdo@cytonn.com
T-Bills & T-Bonds Primary Auction:
T-bills were oversubscribed during the week, with the overall subscription rate coming in at 123.9%, a decline from 181.1% recorded the previous week. The yields on the 91-day and 364-day papers remained unchanged at 7.6% and 9.7%, respectively, while the yield on the 182-day paper declined by 10 bps to 8.7% from 8.8%, the previous week. The acceptance rate for T-bills improved to 95.8% from 59.8% the previous week, with the government accepting Kshs 28.5 bn of the Kshs 29.7 bn worth of bids received. The subscription rate for the 91-day, 182-day and 364-day papers declined to 143.5%, 111.6% and 128.3% from 182.9%, 170.9% and 190.7%, recorded the previous week, respectively.
For the month of September, the Kenyan Government re-opened 2 bonds, FXD 1/2018/10 and FXD 2/2018/20, with 10-years and 19.9-years to maturity, and coupon rates of 12.7% and 13.2%, respectively in a bid to raise Kshs 40.0 bn for budgetary support. The issue was under-subscribed at an overall subscription rate of 81.2%, while the weighted average rate of accepted bids came in at 12.7% and 12.9%, for the 10-year and 20-year bonds, respectively in line with our expectations of 12.5%-12.7% for the FXD 1/2018/10, and 12.8%-13.1% for the FXD 2/2018/20. The government accepted Kshs 26.6 bn out of the Kshs 32.5 bn worth of bids received, translating to an acceptance rate of 81.8%. The 10-year bond had a subscription rate of 55.3% while the 20-year bond recorded poor performance with the subscription rate coming in at 25.8% which we attribute to the relatively flat yield curve on the long-end as compared to the relatively steep short-end of the yield curve, making it unattractive to hold longer-term bonds.
Liquidity:
The average interbank rate declined to 3.6%, from 4.2% the previous week, while the average volumes traded in the interbank market declined by 22.2% to Kshs 14.3 bn, from Kshs 18.4 bn the previous week with the decline in activity being attributed to the reduced demand for liquidity by banks following the beginning of the new Cash Reserve ratio (CRR) cycle. The decline in the average interbank rate points to improved liquidity, attributed to large banks trading at lower interest rates.
Kenya Eurobonds:
According to Bloomberg, the yield on the 10-Year and 5-year Eurobonds issued in 2014 declined by 0.1% points and 0.6% points to 7.3% and 4.2% from 7.4% and 4.8%, the previous week, respectively. Since the mid-January 2016 peak, yields on the Kenya Eurobonds have declined by 4.6% points and 2.3% points for the 5-year and 10-year Eurobonds, respectively, an indication of the relatively stable macroeconomic conditions in the country. Key to note is that these bonds have 0.8-years and 5.8-years to maturity for the 5-year and 10-year, respectively.
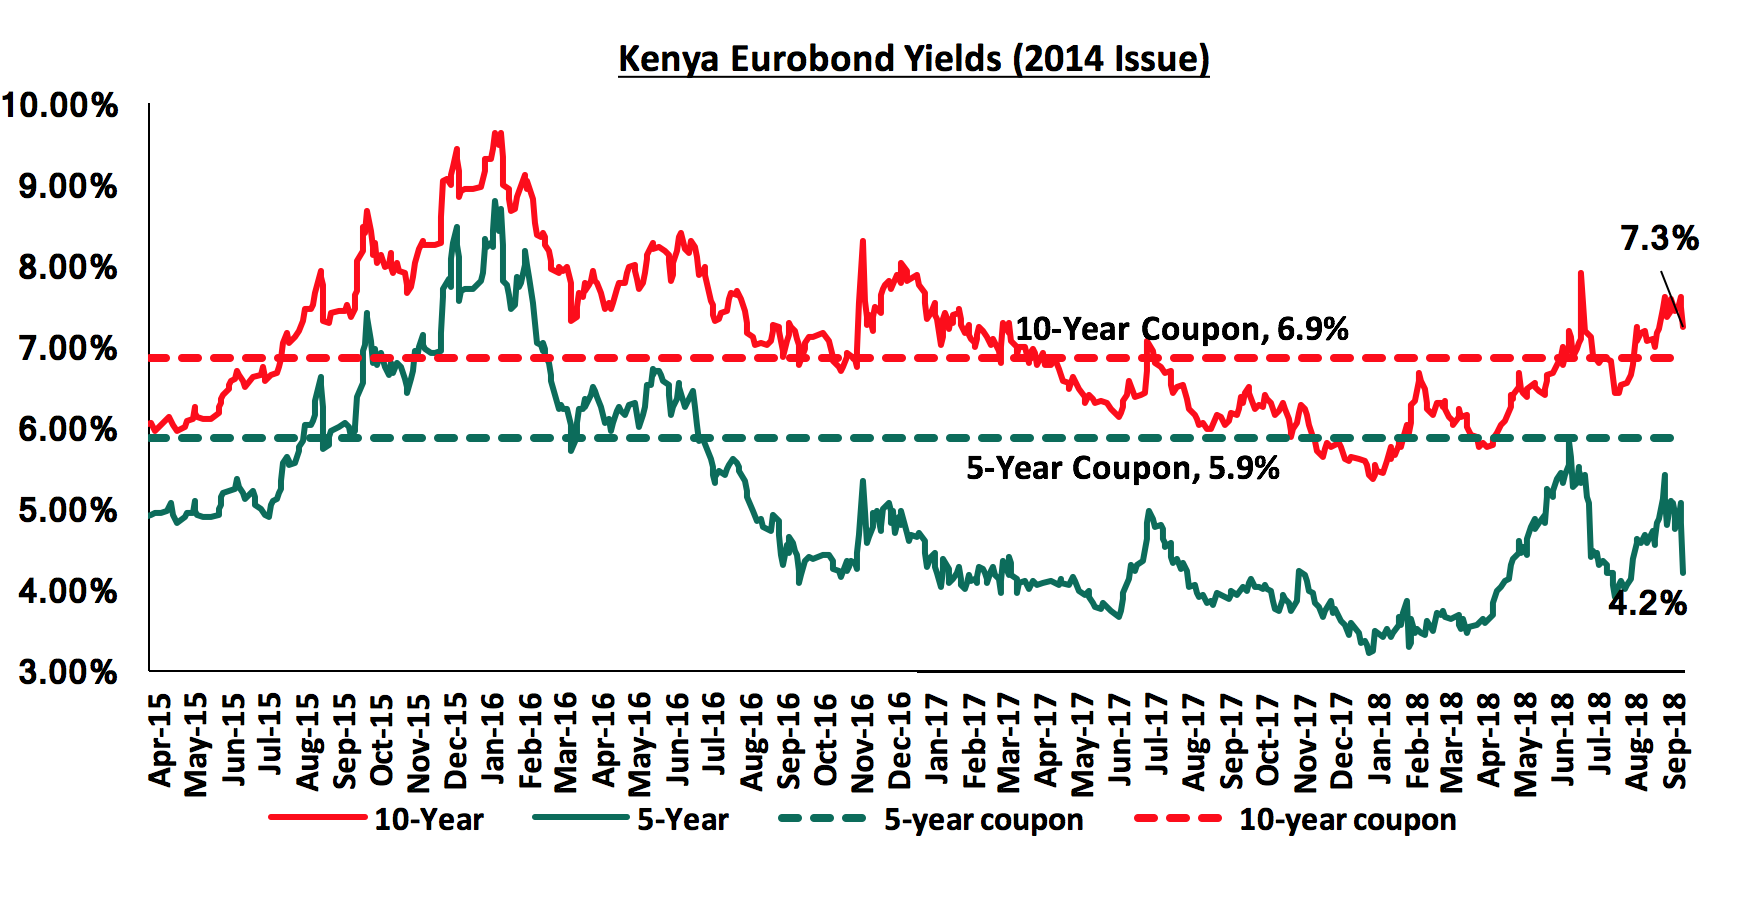
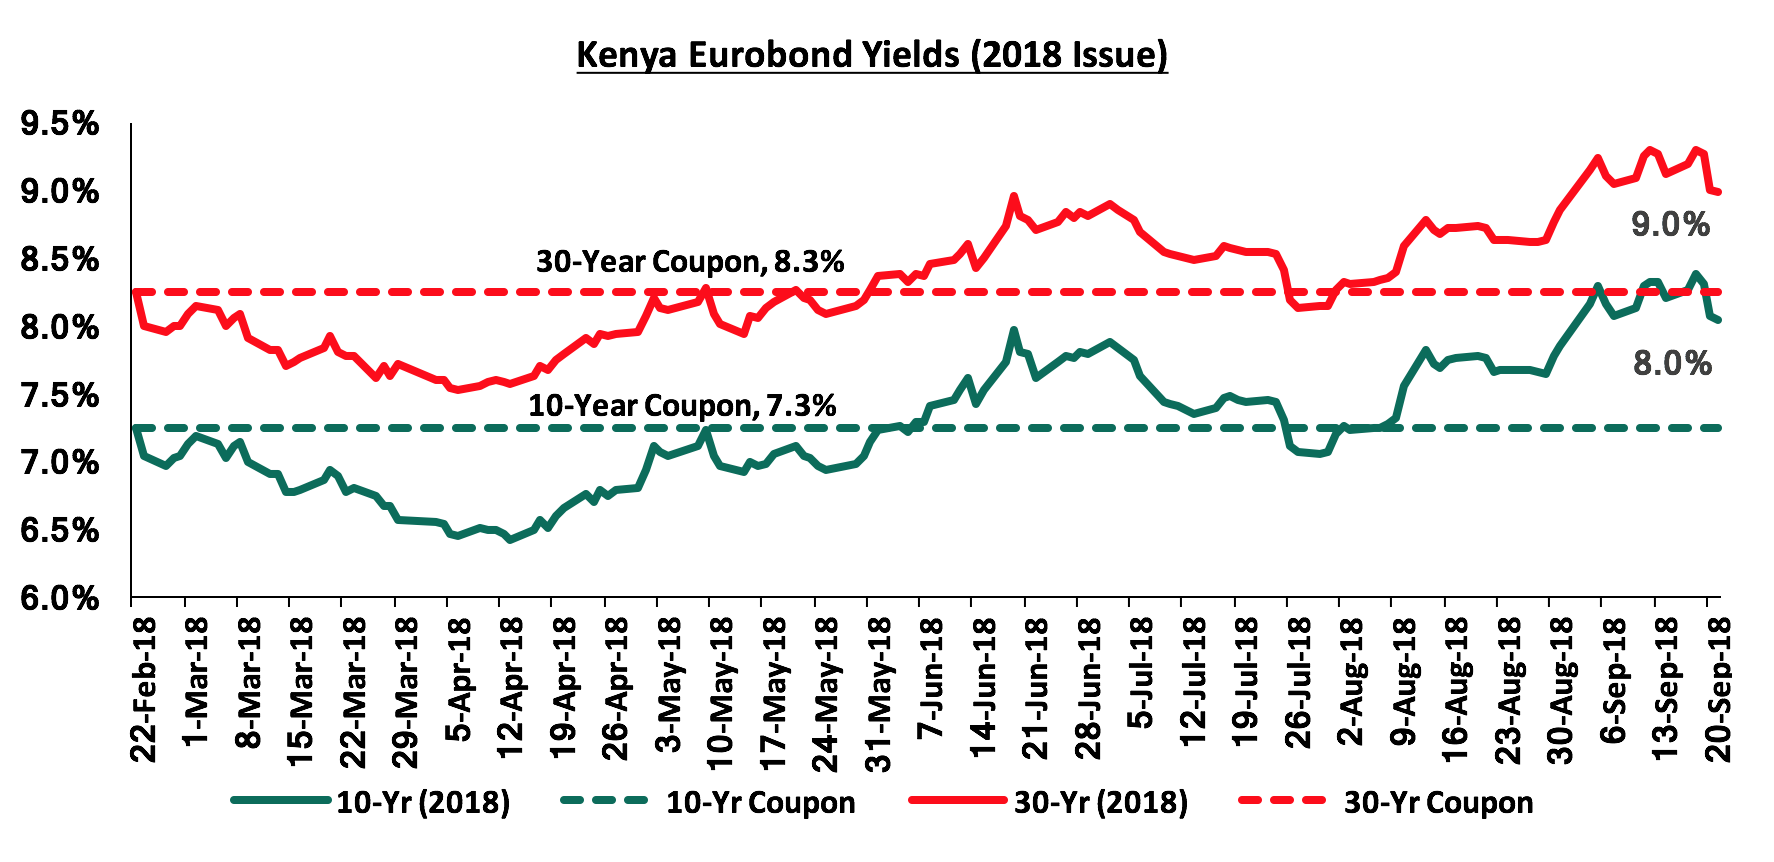
For the February 2018 Eurobond issue, during the week, the yields on both the 10-year and 30-year Eurobonds declined by 0.2% and 0.1% points to 8.0% and 9.0% from 8.2% and 9.1%, the previous week, respectively. Since the issue date, the yields on the 10-year and 30-year Eurobonds have both increased by 0.7% points.
The Kenya Shilling:
During the week, the Kenya Shilling appreciated by 0.4% against the US Dollar to close at Kshs 100.8 from Kshs 101.2, the previous week, mainly driven by reduced dollar demand from importers as well as recovery from the uncertainties regarding the IMF stand-by arrangement that were there the previous week. The Kenya Shilling has appreciated by 1.9% year to date and in our view the shilling should remain relatively stable against the dollar in the short term, supported by:
- The narrowing of the current account deficit to 5.8% in the 12-months to June 2018, from 6.3% in March 2018, attributed to improved agriculture exports, and lower capital goods imports following the completion of Phase I of the Standard Gauge Railway (SGR) project,
- Stronger inflows from principal exports, which include coffee, tea, and horticulture, which increased by 10.8% during the month of May to Kshs 24.3 bn from Kshs 21.9 bn in April, with the exports from coffee, tea and horticulture improving by 11.0%, 19.1% and 2.0% m/m, respectively,
- Improving diaspora remittances, which increased by 71.9% y/y to USD 266.2 mn in June 2018 from USD 154.9 mn in June 2017 and by 4.9% m/m, from USD 253.7 mn in May 2018, with the largest contributor being North America at USD 130.1 mn attributed to; (a) recovery of the global economy, (b) increased uptake of financial products by the diaspora due to financial services firms, particularly banks, targeting the diaspora, and (c) new partnerships between international money remittance providers and local commercial banks making the process more convenient, and,
- High forex reserves, currently at USD 8.5 bn, equivalent to 5.6 months of import cover, compared to one-year average of 5.4 months.
Monetary Policy Committee Meeting:
The Monetary Policy Committee (MPC) is set to meet on Tuesday 25th September 2018 to review the prevailing macroeconomic conditions and give direction on the Central Bank Rate (CBR). Key factors that will shape MPC’s decision include:
- Inflation that has averaged 4.2% in the first 8-months of 2018 compared to 9.3% experienced in a similar period in 2017, and is expected to remain within the government target of 2.5% - 7.5%, despite the expectations of upwards inflationary pressure in H2’2018 due to the imposition of the 8.0% VAT charge on fuel as well as other tax measures as introduced in the Finance Bill,
- The currency that has lost by 0.4% since the last meeting on July 30th 2018 to Kshs 100.8 from Kshs 100.5, and,
- The macroeconomic environment that has remained relatively stable despite the low private sector credit growth, which came in at 4.3% in July 2018. This was the fastest growth rate since December 2016, pointing to a recovery albeit slow and still way below the 5-year average of 13.0%
We are of the view that the MPC will adopt a wait and see approach, holding the Central Bank Rate(CBR) at 9.0% as they monitor the effects of the July rate cut by 50 bps to 9.0%. For a comprehensive analysis, read our Cytonn Note on the MPC Meeting for September 2018.
Inflation Projection:
We are projecting the inflation rate for the month of September to range between 5.3% - 5.7%. We expect the month on month inflation to rise mainly due to:
- An increase in petrol prices that increased by 10.4% to Kshs 125.6 from Kshs 113.7 per litre, while diesel and kerosene prices increased by 12.4% and 15.0% to Kshs 115.5 and 97.7 per litre from Kshs 102.7 and Kshs 85.0, respectively, from the end of August – 20th September 2018, following the earlier imposition of the 16.0% VAT on fuel for the better part of the month before the assent of the Finance Bill 2018 that halved the charge to 8.0%. The price increase will directly affect transport costs and indirectly affect food prices in September,
- On the housing, water, electricity, gas and other fuels index, Kerosene prices went up during the month by 15.0%. This is however expected to be mitigated by a decline in electricity costs as per comments by the Energy Regulatory Commission (ERC) citing that homes and business were due for a refund of Kshs 1.3 per kilowatt hour (kWh) after it used a higher dollar rate to compute the foreign exchange levy last month which had brought a rise in tariffs of up to 52.8% in August, and
- An increase in some food prices such as beans and kales outweighing a decline in others as well as the pass through effect from transport costs.
We expect inflation in H2’2018 to experience upward pressure but at a lower rate following the reduction in the rate of VAT charge to 8.0% from 16.0%, affirming the expectations of inflation for the year averaging within the government’s set target of 2.5%-7.5%.
Following the signing of the Finance Bill 2018, the ERC has released an addendum revising the prices released on 14th September 2018, adjusting for the halving of the VAT charged on fuel from the earlier 16.0% to 8.0%. The adjustments have also taken into account the anti-adulteration levy of Kshs 18.0 per liter of kerosene. As a result, the prices of petrol and diesel declined by 7.0% and 6.4% to 116.8 and Kshs 108.1 from 125.6 and 115.5, respectively, while the prices of kerosene have increased by 11.0% to Kshs 108.4 from Kshs 97.7. The new prices take effect from 21st September to 14th October. The reduction in the prices as a result of halving of the VAT charge is expected slightly to mitigate the earlier concerns of inflationary pressures in H2’2018. The housing, electricity, gas and other fuels index is however expected to be adversely affected by the anti-adulteration levy which will effectively increase kerosene prices which is used by a large percentage of the population.
Highlights of the Week:
During the week, the National Assembly convened for special parliamentary sittings held on 18th September and 20th September to discuss the budget supplementary estimates and the President’s reservations against the Finance Bill through his memorandum. All the proposals as per the president’s memorandum tabled in parliament were passed despite a chaotic sitting, after which the president assented to the Finance Bill 2018 on 21st September 2018.
The major adjustments made on the Finance Bill 2018 as a result of passing of the proposals from the memorandum include;
- Deletion of Clause 18(b) of the Finance Bill which sought to postpone the imposition of VAT on fuel by another 2 years to commence in September 2020: The President had argued that the postponement of the VAT charge on fuel would affect the estimated revenue targets for FY’2018/2019 creating a budget deficit that would require use of other measures to bridge. He further proposed an amendment of the VAT Act 2013, to reduce the VAT charge on fuel to 8.0% from the earlier 16.0% which was passed by the National Assembly, to take effect upon enactment of the supplementary Appropriation Act and is projected to raise close to Kshs 35.0 bn in revenue,
- Imposition of excise duty: There will be an increase on the excise duty charged on excisable value on telephone and internet data service to 15.0% from the earlier 10.0%, as well excise duty fees charged for money transfer services by banks, agencies and other financial services providers to 20.0% from the earlier 10.0%. Excise duty charge on other fees charged by financial institutions will also be increased to 20.0% from the earlier 10.0%. The imposition of these would replace the robin hood tax deemed more expensive and complicated to implement and the projected Kshs 20.2 bn revenue to be collected is set to be channeled to finance universal health care,
- A further reduction in taxation on winnings: There will be a reduction in the taxation on winnings under the betting, lotteries and gaming Act to 15.0% from the earlier proposed 20.0% as per the Finance Bill which had been submitted to the president which was still a decline from the initial 35.0% in order to enhance equity and fairness by distributing the tax burden fairly between the winnings and the companies which is expected to have a net effect of encouraging players to continue betting on local platforms as the higher taxes would be punitive forcing players to bet on other international platforms. The National Treasury expects to raise revenue from Kshs 8.7 bn to an estimated Kshs 24-30 bn.
- An amendment to the employment Act: This will see employees contribute 1.5% of the monthly basic salary while the employer will match the same amount provided that the sum of the employer and employee contributions do not exceed Kshs 5000 monthly, payable to the National Housing Development Fund. The introduction of the contributory scheme is in a bid to support the housing pillar under the government’s Big 4 Agenda, which is set to enable contributors own houses upon the maturity of the individual schemes, and,
- An amendment to the miscellaneous fees and levies Act: There will be an introduction of an anti-adulteration levy on kerosene at the rate of Kshs 18.0 per litre of the customs value of kerosene payable by the importer at the time of entry of the Kerosene into the country. This is in a bid to harmonize the prices of kerosene and diesel thus eliminating fuel adulteration that has led to pollution, damage to vehicle engines as well as adversely affecting government’s revenue.
The National Assembly also discussed the supplementary estimates for FY’2018/2019 presented by the Budget and Appropriations Committee, which proposed a reduction in the total budget estimate by Kshs 55.1 bn due to the expected shortfall in revenue arising from the amendments made in the Finance Bill 2018. The National Assembly however passed an expenditure reduction of Kshs 37.6 bn, which is to be achieved through a reduction in recurrent expenditure and capital expenditure for FY’2018/2019 by Kshs 9.1 bn and Kshs 28.5 bn, respectively coupled with a reinstatement of Kshs 1.5 bn to the judiciary. The most hit budgetary allocations as per the adjusted estimates include, the National Treasury set to lose Kshs 6.6 bn, the ministry of Information communications and Technology which is set to lose Kshs 5.9 bn, State department of Infrastructure set to lose Kshs 8.7 bn under emergency road repairs, among others.
Due to assent of the Finance Bill 2018, we are of the view that imposition of some of the tax measures as introduced in the Finance Bill raise a concern in the country’s economic growth, especially on corporate earnings this year with the main focus being on the Telecommunication and Financial services industry due to the increased excise tax on both money transfers and internet charges which could slow down consumption of these services. In other sectors, consumers will also be faced with the additional taxes on fuel as well as the housing levy, which we believe will put a strain on overall consumption. This is because consumers will have to rationalize their consumption on goods and services due to the dilution of their purchasing power, which effectively means a reduction in the quantity of goods and services a single unit of currency can buy. This will lead to reduced demand of goods and services across various economic sectors. We also expect inflation to rise in H2’2018 but a lower rate than earlier anticipated due to the halving of the VAT charge on fuel to 8.0% from the earlier 16.0%. Inflation is however still expected to be within the government set target of 2.5%-7.5%.
Rates in the fixed income market have been on a declining trend, as the government continues to reject expensive bids as it is currently 83.9% ahead of its pro-rated borrowing target for the current financial year, having borrowed Kshs 125.0 bn against a pro-rated target of Kshs 68.0 bn. The 2018/19 budget had given a domestic borrowing target of Kshs 271.9 bn, 8.6% lower than the 2017/2018 fiscal year’s target of Kshs 297.6 bn, which may result in reduced pressure on domestic borrowing. With the rate cap still in place, with the president having ascended to the Finance Bill 2018, we maintain our expectation of stability in the interest rate environment. With the expectation of a relatively stable interest rate environment, our view is that investors should be biased towards medium-term fixed-income instruments.
Market Performance:
During the week, the equities market was on a downward trend with NASI, NSE 20 and NSE 25 declining by 8.0%, 5.4% and 8.4%, respectively, taking their YTD performance to declines of 15.0%, 23.7% and 15.9%, respectively. This week’s performance was driven by declines in large cap counters such as Co-operative Bank, Equity Group, Safaricom, Bamburi Cement and KCB Group that declined by 14.0%, 10.9%, 9.4%, 8.6% and 8.0%, respectively. For the last twelve months (LTM), NASI, NSE 20 and NSE 25 have declined by 12.4%, 25.0% and 15.9%, respectively.
Equities turnover increased by 4.5% to USD 27.2 mn from USD 26.0 mn the previous week, bringing the YTD turnover to USD 1.4 bn. Foreign investors remained net sellers, with net weekly outflows increasing by 99.2% to USD 8.1 mn from USD 4.1 mn previously. We expect the market to remain subdued in the near-term as international investors exit the broader emerging markets due to the expectation of rising US interest rates coupled with the strengthening US dollar.
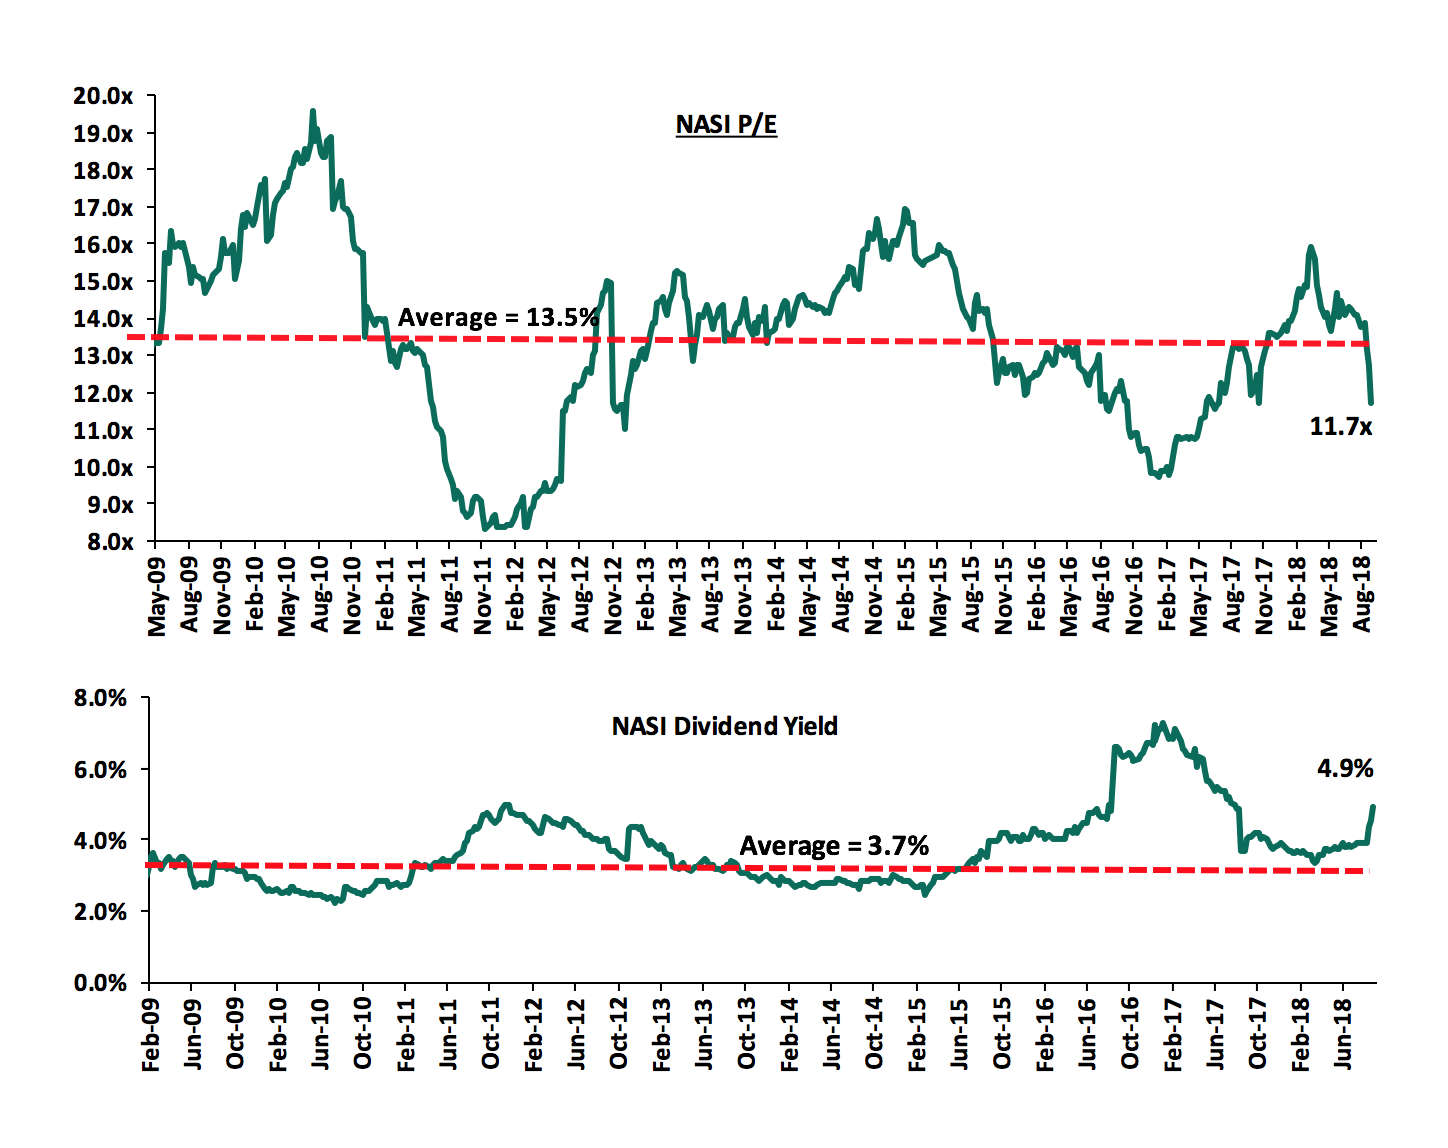
The market is currently trading at a price to earnings ratio (P/E) of 11.7x, which is 13.3% below the historical average of 13.5x, and a dividend yield of 4.9%, higher than the historical average of 3.7%. The current P/E valuation of 11.7x is 19.4% above the most recent trough valuation of 9.8x experienced in the first week of February 2017, and 41.0% above the previous trough valuation of 8.3x experienced in December 2011. The charts below indicate the historical P/E and dividend yields of the market:
Weekly highlights:
The Finance Bill 2018 was signed into law by President Uhuru Kenyatta on Friday 21st September, 2018, after Members of Parliament passed the proposed amendments to the Bill. The President had earlier failed to assent to the Bill, referring it back to the National Assembly for reconsideration due to the reservations he had, mainly on the postponement of VAT on fuel by another 2 years to September 2020 as earlier voted by the National Assembly. Key to note, however, is that the President did not voice concerns on the proposal to scrap off the base deposit rate of 70.0% of the Central Bank Rate (CBR) while retaining the cap on loan pricing at 4.0% above the CBR, therefore it was not part of Parliament’s reconsiderations. This means that the assented Finance Bill 2018 does away with the floor on customer deposits, thereby giving lenders free will to price deposits at lower rates compared to the initial requirement of 70.0% of the prevailing CBR. We are of the view that the new legislation will mean increased net interest margins (NIM) for banks due to reduced interest expense on deposits going forward.
Equities Universe of Coverage:
Below is our Equities Universe of Coverage:
|
Banks |
Price as at 14/09/2018 |
Price as at 21/09/2018 |
w/w change |
YTD Change |
LTM Change |
Target Price |
Dividend Yield |
Upside/Downside |
|
NIC Bank |
28.5 |
26.5 |
(7.0%) |
(21.5%) |
(27.1%) |
48.8 |
3.8% |
87.9% |
|
Zenith Bank |
20.1 |
20.8 |
3.7% |
(18.9%) |
(5.5%) |
33.3 |
13.0% |
73.2% |
|
KCB Group |
41.3 |
38.0 |
(7.9%) |
(11.1%) |
(11.6%) |
61.3 |
7.9% |
69.2% |
|
Diamond Trust Bank |
181.0 |
172.0 |
(5.0%) |
(10.4%) |
(5.5%) |
283.7 |
1.5% |
66.5% |
|
I&M Holdings |
101.0 |
90.0 |
(10.9%) |
(10.0%) |
(29.7%) |
138.6 |
3.9% |
57.9% |
|
Ghana Commercial Bank |
5.3 |
5.3 |
(0.6%) |
5.1% |
23.5% |
7.7 |
7.2% |
52.5% |
|
Equity Group |
43.5 |
38.8 |
(10.9%) |
(2.5%) |
(3.1%) |
56.2 |
5.2% |
50.2% |
|
Co-operative Bank |
16.1 |
13.9 |
(14.0%) |
(13.4%) |
(17.6%) |
19.9 |
5.8% |
49.5% |
|
UBA Bank |
7.4 |
8.0 |
8.1% |
(22.3%) |
(6.4%) |
10.7 |
10.6% |
44.4% |
|
Union Bank Plc |
5.0 |
5.8 |
16.0% |
(25.6%) |
0.2% |
8.2 |
0.0% |
40.5% |
|
Barclays |
10.2 |
10.2 |
0.0% |
5.7% |
(2.9%) |
12.5 |
9.9% |
33.0% |
|
Ecobank |
8.1 |
8.1 |
0.4% |
7.0% |
27.8% |
10.7 |
0.0% |
32.0% |
|
CRDB |
160.0 |
160.0 |
0.0% |
0.0% |
(8.6%) |
207.7 |
0.0% |
29.8% |
|
Access Bank |
7.8 |
8.2 |
4.5% |
(22.0%) |
(16.0%) |
9.5 |
4.9% |
21.5% |
|
CAL Bank |
1.2 |
1.2 |
0.0% |
9.3% |
34.9% |
1.4 |
0.0% |
18.6% |
|
Guaranty Trust Bank |
34.8 |
34.7 |
(0.1%) |
(14.8%) |
(10.9%) |
37.1 |
6.9% |
13.8% |
|
Stanbic Bank Uganda |
33.0 |
33.0 |
0.0% |
21.1% |
21.1% |
36.3 |
3.5% |
13.5% |
|
Bank of Kigali |
290.0 |
290.0 |
0.0% |
(3.3%) |
3.6% |
299.9 |
4.8% |
8.2% |
|
Standard Chartered |
199.0 |
195.0 |
(2.0%) |
(6.3%) |
(18.8%) |
196.3 |
6.4% |
7.1% |
|
Bank of Baroda |
140.0 |
126.0 |
(10.0%) |
11.5% |
14.5% |
130.6 |
2.0% |
5.6% |
|
Stanbic Holdings |
95.5 |
90.0 |
(5.8%) |
11.1% |
14.6% |
92.6 |
2.5% |
5.4% |
|
SBM Holdings |
6.6 |
6.6 |
(0.6%) |
(12.5%) |
(16.1%) |
6.6 |
4.6% |
4.6% |
|
HF Group |
6.5 |
6.7 |
3.1% |
(35.6%) |
(32.7%) |
6.6 |
5.2% |
3.7% |
|
National Bank |
5.2 |
5.5 |
4.8% |
(41.7%) |
(45.5%) |
4.9 |
0.0% |
(10.1%) |
|
Stanbic IBTC Holdings |
42.3 |
42.0 |
(0.6%) |
1.2% |
6.3% |
37.0 |
1.4% |
(10.5%) |
|
FBN Holdings |
9.0 |
8.6 |
(4.4%) |
(2.3%) |
60.1% |
6.6 |
2.9% |
(20.0%) |
|
Standard Chartered |
26.0 |
26.0 |
0.0% |
3.1% |
52.1% |
19.5 |
0.0% |
(25.2%) |
|
Ecobank Transnational |
18.0 |
18.0 |
0.0% |
5.9% |
0.0% |
9.3 |
0.0% |
(48.4%) |
|
*Target Price as per Cytonn Analyst estimates **Upside / (Downside) is adjusted for Dividend Yield ***Banks in which Cytonn and/or its affiliates holds a stake. For full disclosure, Cytonn and/or its affiliates holds a significant stake in NIC Bank, ranking as the 5th largest shareholder **** Stock prices are in respective country currency
|
||||||||
We are “NEUTRAL” on equities for investors with a short-term investment horizon since the market has rallied and brought the market P/E slightly above its’ historical average. However, pockets of value exist, with a number of undervalued sectors like Financial Services, which provide an attractive entry point for long-term investors, and with expectations of higher corporate earnings this year, we are “POSITIVE” for investors with a long-term investment horizon.
Kuramo Capital, a New York based investment management firm focused on alternative investments in frontier and emerging markets, has acquired an additional 17.5% stake in GenAfrica Asset Managers Ltd from the management and staff of GenAfrica. GenAfrica Asset Managers, formerly known as Genesis Kenya Investment Management Limited, is an investment manager providing its services to retirement benefits schemes, endowment funds, and insurance companies. It manages separate client focused equity portfolios, investing in the public markets of Kenya. GenAfrica Asset Managers is based in Nairobi, Kenya with an additional office in Kampala, Uganda.
The additional investment brings Kuramo’s total shareholding in GenAfrica to 90.8%, after Kuramo completed the purchase of a 73.4% stake from Centum Investments in August this year, with the remaining 9.2% remaining in the hands of management and staff of GenAfrica. Kuramo bought the additional stake on the same terms as the Centum transaction. According to Centum’s 2018 Annual Report, their 73.4% stake in GenAfrica was valued at Kshs 2.3 bn, implying Kuramo bought the additional 17.5% stake from the management and staff for Kshs 554.2 mn. This values GenAfrica at Kshs 3.2 bn. GenAfrica had earnings of Kshs 134.2 mn for the year ending March 2018, implies that the last transaction was carried out at a P/E multiple of 23.6x. The high P/E multiple is an indicator that Kuramo sees value in the Assets Manager, especially in its management.
Kuramo earlier in the year also completed a transaction to acquire a minority stake in Kenyan investment bank Sterling Capital for an undisclosed amount. Another similar transaction that has been carried out in the past include the acquisition of a 100% stake in ApexAfrica Capital by Axys, a Mauritian private equity fund in 2015 for Kshs 470.0 mn, translating to a P/E multiple of 40.2x. The table below summarizes the details of the transactions:
|
Asset Manager Acquired |
Seller |
Acquirer |
Earnings at Acquisition (Kshs mn) |
Acquisition Stake |
Transaction Value (Kshs mn) |
P/E Multiple |
Date |
|
Apex Africa |
Founding Shareholders |
Axys (Mauritius) |
11.7 |
100.0% |
470.0 |
40.2x |
Aug-15 |
|
GenAfrica |
Centum Investments |
Kuramo Capital |
134.2 |
73.4% |
2,324.2 |
23.6x |
Aug-18 |
|
GenAfrica |
Management and Staff |
Kuramo Capital |
134.2 |
17.5% |
554.2 |
23.6x |
Sep-18 |
The acquisition by Kuramo is driven by; (i) the expected growth of the equities market in Kenya and Sub-Saharan Africa, driven by product diversification, new listings, and continued investor interest fueled by existing low valuations in sections in the market such as the financial services, and (ii) the increasing number of institutional and retail investors in Kenya and Sub-Saharan Africa and the assets under their management. In Kenya, the retirement benefits assets under management grew by 18.3% from Kshs 912.7 bn in 2016 to Kshs 1,080.1 bn in 2017 an indicator of the growing opportunity for asset managers in Kenya.
Private equity investments in Africa remains robust as evidenced by the increasing investor interest, which is attributed to; (i) rapid urbanization, a resilient and adapting middle class and increased consumerism, (ii) the attractive valuations in Sub Saharan Africa’s private markets compared to its public markets, (iii) the attractive valuations in Sub Saharan Africa’s markets compared to global markets, and (iv) better economic projections in Sub Sahara Africa compared to global markets. We remain bullish on PE as an asset class in Sub-Sahara Africa. Going forward, the increasing investor interest and stable macro-economic environment will continue to boost deal flow into African markets.
Residential
In the residential sector, this week we saw activities in relation to the affordable housing initiative under the government’s Big Four agenda, as the National Government invited bids from both international and local developers to build 1,500 affordable residential units at Nairobi’s Park Road estate situated in Ngara for low–income earners, expected to be delivered within 36 months. This is in line with the government’s plan to develop 500,000 affordable housing units by the end of their term in 2022. The government plans to achieve this through Public-Private Partnerships where the government’s role is to provide the land while the developer is tasked with the role of designing, funding and constructing the units.
According to the Request For Proposals (RFPs) advertised by the government, bidders are required to pay a bid security of Kshs. 40 mn during submission of the RFP and a commitment fee of 10% of the project value within 30 days after notification of award, that will act as proof of financial capability of the developer to deliver the project. In regards to the bid security and commitment fees required to be paid, we are of the view that this will force developers to incur huge upfront costs which is a limitation, given that access to funding for developers still remains a challenge with the growth of credit to the private sector declining by 21.5% points over the last 3 years , coming in at 4.3% as at June 2018 compared to 25.8% in June 2014 as a result of introduction of capped lending rates at 4.0% points above the Central Bank Rate(CBR). In our view, the government may consider alternative ways to gauge the financial capability of developers such as requiring letters of commitment by financiers and evaluation of financial records of the firms. The government also needs to look into ways to spur the development of alternative sources of funding at competitive rates such as structured products which will reduce the overreliance on banks and provide financing for affordable housing.
Other affordable housing projects that are set to come up in Nairobi Metropolis are as shown below;
|
Low – Cost Housing Projects in Nairobi Metropolis |
|||
|
Project Name / Location |
No of Units |
Developer |
Project Value (in Kshs) |
|
Pangani |
1,000 |
M/S Sovereign Group |
Approx. Kshs |
|
Ngong Road |
2,520 |
Lordship Africa |
Kshs. 24.6 bn |
|
Jeevanjee-Bachelors |
1,500 |
Jabavu Village Ltd |
Kshs. 9.1 bn |
|
New Ngara |
1,500 |
KCB/ S&L |
Kshs. 9.0 bn |
|
Uhuru Road |
* |
Stanlib Group |
Kshs. 3.5 bn |
|
Old Ngara |
1,050 |
Kiewa Group |
Kshs. 7.0 bn |
|
Suna Road |
1,050 |
Directline Assurance Limited |
Kshs. 3.5bn |
|
Shauri Moyo |
5,000 |
Not yet Awarded |
* |
|
Makongeni |
20,000 |
Not yet Awarded |
* |
|
Starehe |
3,000 |
Not yet Awarded |
* |
To drive the affordable housing initiative, the government has already put in place various policies and strategies to support both developers and homebuyers, some of which include;
- Measures to support home buyers;
- 15% tax relief, for buyers of units developed under the affordable housing scheme up to a maximum of Kshs 108,000 p.a,
- Establishment of the National Housing Development Fund (NHDF), with the president approving the Finance Bill 2018, which includes a 1.5% levy on employee’s basic salaries up to Kshs. 5000 and the employer expected to match the same amount that will be channeled into the fund. This contribution will act as a saving for employees aimed towards house purchase,
- Exemption from stamp duty tax for first time home buyers, and
- Plans to establish the Kenya Mortgage Refinancing Company (KMRC) by 2019, whose aim is to enhance mortgage affordability by enabling long-term loans at attractive market rates.
- Measures to support developers;
- 15.0% tax rate for developers who provide at least 100 low – cost housing units p.a,
- Scrapping off of NEMA and NCA levies, encouraging developers to construct more units due to the reduction in costs,
- National Housing Development Fund that will provide a source of finance for development of residential units although it is still not yet clear how it will be operated,
- Partnerships with developers through availing of public land for development, and,
- Establishment of a land bank whereby excess land will be gathered together in a bid to address the challenges faced by investors and developers seeking to acquire land.
We applaud the steps that have been made so far towards development of affordable housing. However, it is imperative to note that in the past Private – Public Partnerships (PPPs) have proven to be ineffective as evidenced by projects such as the one in Ngara which has failed to take off due to; (i) lengthy and slow approval processes, (ii) uncertainty regarding revenue-sharing and the returns to private investors in PPPs, (iii) extended PPP time – frames that make them unattractive to private developers who prefer to exit projects in 3 – 5 years, and (iv) lack of a mechanism to transfer public land to a Special Purpose Vehicle (SPV) to facilitate access to private capital. We thus recommend a review of the PPP framework to facilitate the approvals process and to aid in establishment of Special Purpose Vehicles.
Mixed Use Developments (MUDs)
Investors are increasingly undertaking the Mixed Used Development (MUD) concept in order to; (i) reduce risk by diversification as MUDs generally offer a safe bet regardless of downturns in either of the incorporated themes, (ii) densify in more compact pacts of land thus maximizing on returns, and (iii) encourage use of resources efficiently as mostly residential and commercial tenants would occupy the same building thus utilities such as energy and sewage can be used more efficiently. One of these is a 61 storey building in Watamu, named Palm Exotjca, that is set to break ground in December 2018. The MUD, developed by Palm Exotjca Ltd and designed by Lorenzo Pagnini Architetto, an Italian architectural firm, will feature 180 serviced apartments, a 5-star hotel with 270 rooms, a commercial office space and a convention center. The project will offer amenities such as swimming pool, spa and gym, children’s play area, theatre and cinema observatory, and a private beach. Interest in the coastal region is largely driven by the low supply of MUDs especially in Watamu and the area being a hub for tourist attraction due to the proximity to the Indian Ocean which will attract occupancy for the hotel and serviced apartments.
In addition, during the week, Aviation Industry Corporation of China (Avic) International Real Estate Limited, the development affiliate under the Avic group in Kenya, launched their Kshs 40.0 bn project termed ‘Global Trade Center’ (GTC) located in Westlands, Nairobi. The project whose construction began in 2015 and set to be completed by 2020 will comprise of a 42-storey, 485,678 SQFT office tower of 184m in height, a 35-storey luxury 5-star hotel with 365 rooms that will be operated by the JW Marriot Hotel Group, 405 residential apartments and a 124,097 SQFT mall. The concept of MUDs is growing in the country with some of the completed MUDs being Sifa Towers and Timau plaza in Kilimani and ones under construction or yet to commence construction being, The Beacon to be located off Uhuru Highway towards Bunyala Road roundabout, Le Mac in Westlands, Montave and Pinnacle Towers in Upper Hill, and Cytonn Towers in Kilimani. In our opinion, given the oversupply of office and retail space that lies at 4.7mn SQFT as at March, 2018 and 2.0mn SQFT as at September, 2018, respectively, we recommend investments in MUDs as they enable multiple channels of revenue, symbiotic nature of uses thus relatively high yields of 11.0% according to Cytonn Annual Market Outlook 2018 compared to retail, residential and office sector that attained 8.6%, 5.5% and 9.3%, respectively as at H1’ 2018. This is well represented on the table below;
|
Rental Yields by Sector in Nairobi |
|
|
Theme |
Rental Yield |
|
Mixed Use Developments (MUDs) |
11.0% |
|
Retail Sector |
9.4% |
|
Office Sector |
9.3% |
|
Residential |
5.5% |
Source: Cytonn Research
Retail
During the week, French retailer, Carrefour, expressed interest to take up tenancy at the Nakumatt Mega space in the wake of expiration of Nakumatt’s lease at the end of the month. If the move by Carrefour materializes, it will bring their total count of outlets in the country to 7 with the rest being located at The Hub in Karen, Sarit center along Karuna Road, Westlands, Thika Road Mall along Thika Road, Junction Mall along Ngong road, Galleria Mall in Karen and Two Rivers Mall along Limuru Road. Exiting of local struggling retailers from malls as a result of poor corporate governance and financial constraints has driven the expansion of international retailers within the country as they hurry to occupy the prime spaces left behind. Additionally, the expansion into the country has also been encouraged by; (i) a stable economic environment, (ii) expanding middle-class in the country, iii) high economic growth rates with the GDP growth rate averaging at more than 5.0% p.a over the last 5 years thus boosting disposable incomes and increasing purchasing power, and (iv) Kenya’s growing position as a regional and continental hub hence witnessing an increase in multinationals operating in the country. Other spaces taken up by retailers that were previously occupied by struggling local retailers are highlighted below;
|
Occupancy of Malls in Kenya by International Retailers |
||
|
Retail Spaces |
Previous Anchor Tenant |
Current Anchor Tenant |
|
Sarit Center |
Uchumi |
Carrefour |
|
Thika Road Mall, Junction Mall and Galleria Mall |
Nakumatt |
Carrefour |
|
Garden City, Mombasa City Mall and Westgate |
Nakumatt |
Shoprite |
Source: Cytonn Research
The expansion of retailers who serve as anchors to these malls will result in enhanced footfall (number of people visiting the mall at a given time) as consumers increasingly seek the wide variety of products and new brands offered thus boosting uptake of retail spaces in malls by other retailers. This will improve the overall performance of the retail sector in Kenya which recorded average rental yields of 8.6% in 2018 and occupancy of 86.0% (and Nairobi with rental yield of 9.4%, occupancy of 83.7%) according to Cytonn Kenya Retail Report 2018. We have a positive outlook regardless of the oversupply in the retail sector, which stands at 2.0mn SQFT in Nairobi, as this expansion by retailers will increase uptake for retail spaces in malls thus improving performance of the sector. In our view however, developers ought to shift their focus to markets such as Mombasa and Mt. Kenya regions that have retail space demand of 0.3mn and 0.2mn SQFT, attractive yields at 8.3% and 9.9% and occupancy rates at 96.3% and 84.5%, respectively.
Hospitality
During the week, Mediview Limited, a company based in Dublin, Ireland, announced plans to set up a 200-room, 7-storey, 5-star hotel along Limuru Road on 2.5 acres pending approvals from regulatory authorities such as the National Environmental Management Authority (NEMA). The company has since invited global hotel brands such as JW Marriot Hotel, Accor Hotels and Intercontinental Hotel Group to place bids for managing the facility that will encompass amenities such as a restaurant, meeting rooms, a business center, swimming pool, a gym and spa. In our view, Limuru Road offers a good investment opportunity as; (i) it offers security with the area being blue zoned and hosting the US, Moroccan, Italian, Swedish, Turkish, Brazilian, Danish embassies and UNEP global, and (ii) it has a low supply of 5-star hotels with an 11% market share compared to nodes such a Nairobi CBD and Westlands that recorded 41% and 19%, respectively as per CytonnHospitality Report 2017. Other hotels in the area include the 137 -room Tribe Hotel and the 165 - room Trademark Hotel located along Limuru road near Village Market. We attribute the increased interest in the hospitality sector to the demand from both local and international guests with the total room nights growing at a 6-year CAGR of 4.6% from 1.5 mn room nights in 2011 to 1.9 mn room nights in 2017 according to Kenya National Bureau of Statistics Economic Survey 2018. We expect this to result in an overall improvement of accommodation and services standards in hotels so as to remain competitive in the wake of stiff competition from global brands. Other hotels that are set to come up in the Nairobi Metropolitan area are as shown below;
|
Hotels that are set to come up in Nairobi Metropolis |
||||
|
Name |
Location |
Rooms |
Status |
Year of Completion |
|
The Alba |
Westlands |
83 |
Under Construction |
2019 |
|
Global Trade Center |
Westlands |
365 |
Under construction |
2020 |
|
Pinnacle |
Upperhill |
255 |
Under construction |
2020 |
|
Cytonn Towers |
Kilimani |
180 |
Planned |
2022 |
|
Grenadier |
Kiambu/Limuru Rd |
200 |
Planned |
2020 |
|
Paddock Runda |
Kiambu/Limuru Rd |
200 |
Planned |
2020 |
Source: Cytonn Research
Infrastructure
Infrastructure in the country continues to be a key focus area for the national government as the Cabinet Secretary (CS) of Transport, James Macharia, announced plans aimed at reducing traffic jams in the Nairobi city through completion of four link roads i.e. the Northern Bypass, the Eastern Bypass, the Southern Bypass and the Western Bypass. The plans will majorly involve the completion of the Western Bypass, a 16.5 km expressway costing Kshs 17.3bn that will connect with the Northern Bypass at Ruaka and with the Southern Bypass at Gitaru. The Western Bypass will include features such as a 17.7 km of service lane and 2-meter wide walkways on both sides of the road. Moreover, the road will encompass interchanges and overpasses at Gitaru, Wangige, Kahara, Ndenderu, Rumingi and Ruaka, 11 traffic bridges and 7-foot bridges. The CS also announced plans to construct a 30 km bridge from Jomo Kenyatta International Airport (JKIA) to Kangemi on Waiyaki way aimed at easing movement to the airport thus providing convenience to passengers travelling to and fro the airport. The completion of these roads will result in increased demand for property and thus cause a rise in property values in the areas situated nearby. For example, after the completion of the Northern Bypass in 2014, Ruaka area recorded a 4-year Compound Annual Growth Rate (CAGR) of 18.9% in land prices from Kshs. 40mn in 2011 to Kshs. 80mn as at 2015. We thus commend the government’s efforts to improve infrastructure in the country aimed at opening up areas for development and promoting economic development through value creation for other sectors.
Listed Real Estate
- Fahari I - REIT
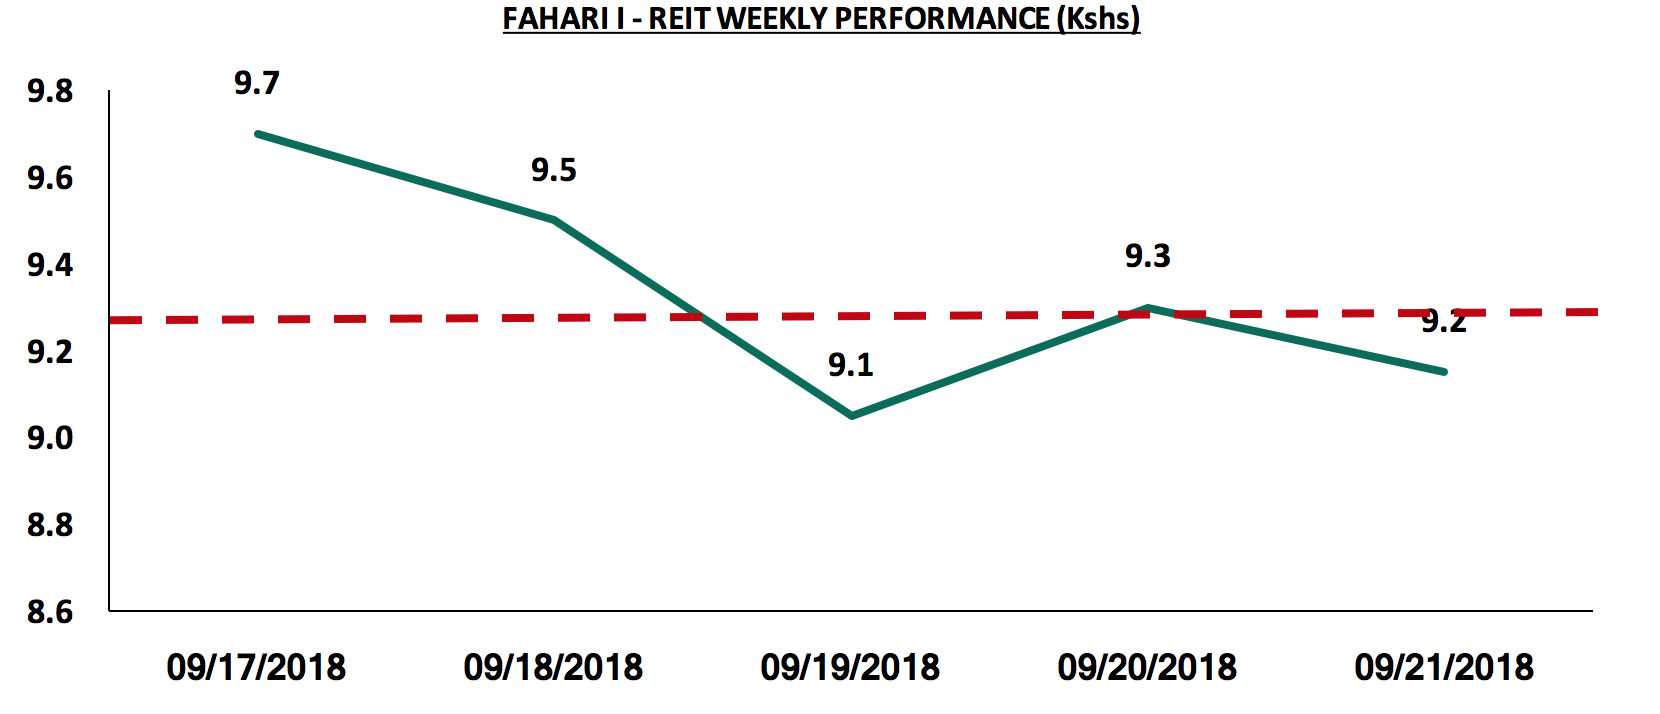
The Fahari I-REIT closed the week at Kshs 9.2, 5.2% lower than the week’s opening price of Kshs 9.7 and 4.2% lower than last week’s closing price of Kshs 9.3. Additionally, during the week, it recorded an average price of Kshs 9.3, which is a decline of 5.1% from the previous week average of Kshs 9.8. The instrument continues to trade at low prices and in low volumes largely due to: (i) the negative sentiments currently engulfing the sector given the poor performance of Fahari and Fusion REIT (FRED), (ii) inadequate investor knowledge, and (iii) the poor performance of Fahari I-REIT recording a dividend yield of 5.7% compared to brick and mortar office and retail at 9.3% and 9.7%, respectively.
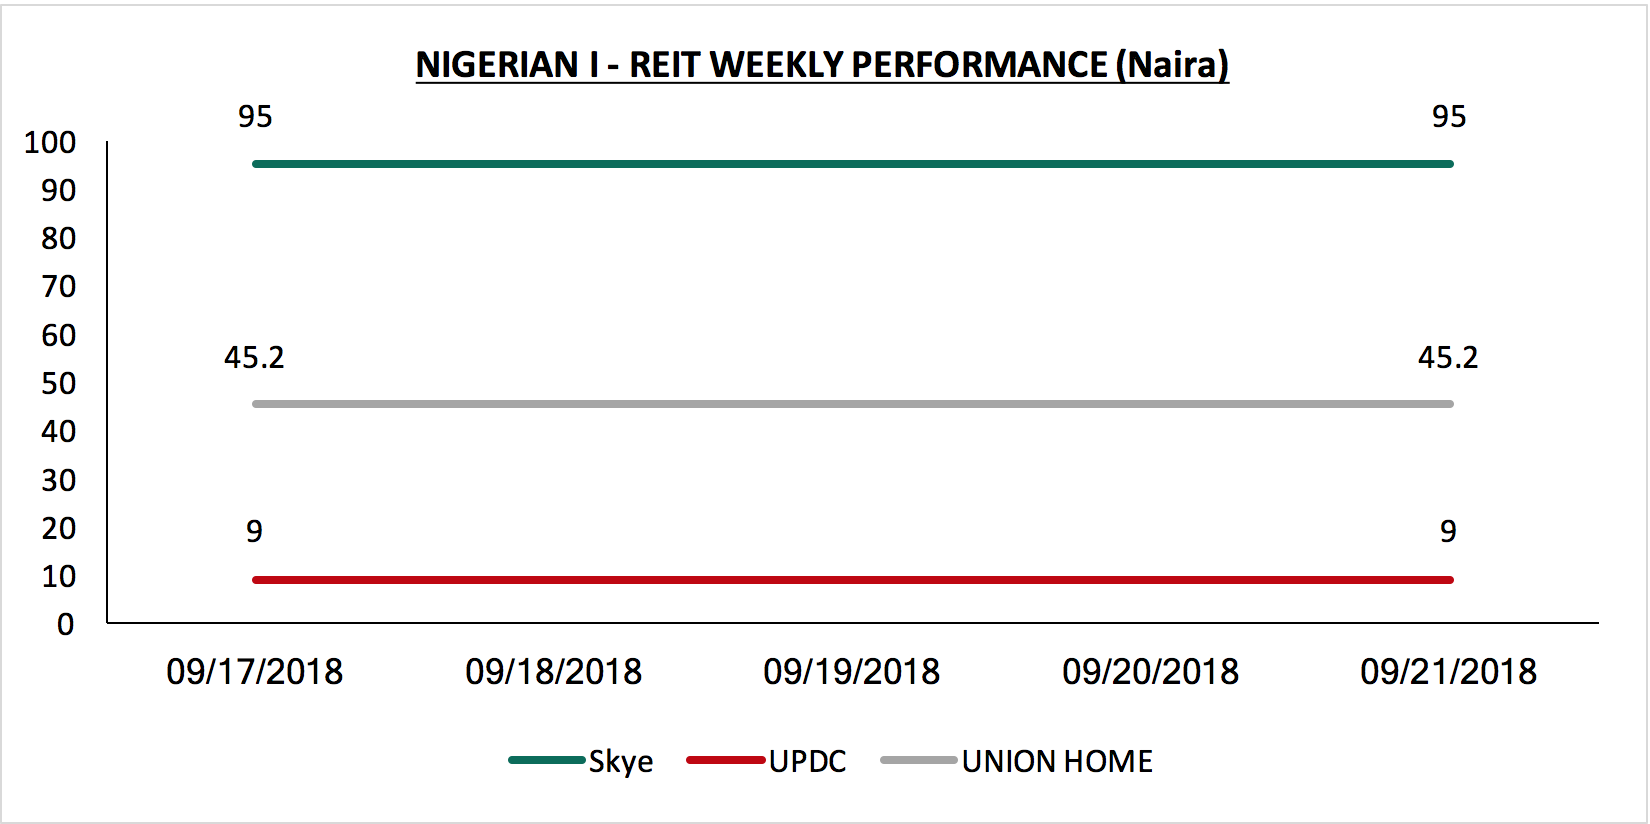
- Nigerian I – REIT
The Nigerian I-REIT market remained unchanged during the week, with, Skye Shelter, Union Homes and UPDC, retaining a price per share of N95, N45.2, and N9, respectively. We attribute the plateaued performance to inadequate investor knowledge about the market hence low investor interest in the instrument.
We expect the real estate sector to continue on an upward performance trajectory boosted by: (i) increased local and international investor interest, (ii) continued investment in infrastructure, (iii) an expanding middle class, (iv)the huge housing deficit of 2.0 mn units, which is growing by 200,000 houses p.a, and (v) relatively high real estate returns which have averaged at 24.3% p.a. over the last 5 years.
Following the release of the H1’2018 results by Kenyan listed banks, the Cytonn Financial Services Research Team undertook an analysis on the Kenyan Banking Sector to point out any material changes from our FY’2017 Banking Report. In our H1’2018 Banking Report, we analyze the results of the listed banks in order to determine which banks are the most attractive and stable for investment from a franchise value and from a future growth opportunity perspective.
The report is themed “Growth and Efficiency aided by Technology, amid deteriorating Asset Quality”as we assess the key factors that influenced the improved performance of the banking sector during the period under review, and also areas that will be crucial for growth of banks going forward. As a result, we seek to answer the questions, (i) “what influenced the banking sector’s performance?”, and (ii) “what should be the focus areas for the banking sector going forward?”, as we look forward to a relatively better operating environment for the banking sector compared to a similar period the previous. As such, we shall address the following:
- The key themes that shaped the banking sector performance in H1’2018;
- Summary of the performance of the banking sector in H1’2018;
- The focus areas of the banking sector players going forward; and,
- Brief summary of the outcome of our analysis.
Section I: The key themes that shaped the banking sector in H1’2018
Below, we highlight the key themes that shaped the banking sector in H1’2018:
- Regulation– The effects of the Banking (Amendment) Act 2015 have continued to be felt in the sector, with banks recording a slow 2.4% growth in loans and advances to Kshs 1.94 tn in H1’2018 from Kshs 1.90 tn in H1’2017. This is in stark contrast to the 7.2% growth y/y to Kshs 1.8 tn in H1’2016 from Kshs 1.6 tn in H1’2015, before the law was enacted. Reduced loan growth could be attributed to banks’ tightening their credit standards owing to the Banking (Amendment) Act 2015, coupled with industry wide deteriorating asset qualities. The amendment stipulated a deposit and loan-pricing framework, with (i) a cap on lending rates at 4.0% above the Central Bank Rate (CBR), and (ii) a floor on the deposit rates at 70.0% of the CBR. The capping of interest rates constrained banks from lending to SMEs and the private sector, and as a result, they preferred to invest in risk-free government securities, unable to price risky borrowers within the set margins. The law, which was originally set up to address the high cost of borrowing and improve credit access to mainly the Micro, Small and Medium Enterprises (MSMEs), has failed to achieve any of the initial objectives, since (i) credit access to the MSMEs has not improved, with private sector credit growth remaining below 5.0% since the enactment of the law, compared to a 5-year average of 13.0%, as banks were unable to price risk within the set margins. Thus, with banks unwilling to lend to MSMEs at the rated prescribed with Banking (Amendment) Act, there were increased allocations to government securities, (ii) in addition to constraints in credit access, the law has inhibited the central bank in its monetary policy function, as any monetary policy decision it makes, have the converse of the desired impact. Thus, when the central bank adopts expansionary policy by lowering the policy rate, this has the opposite effect of reducing credit access due to the lower rate. Plans to repeal the Banking (Amendment) Act 2015 were dealt a blow, with a majority of the members of The National Assembly voting to retain the law, whose repeal proposition was included in the Finance Bill. The proposition to remove the floor of 70.0% of the CBR on deposits was included in the Finance Bill, in a move that is set to see banks reduce interest payable on deposit, given that the bill has been passed, thereby possibly alleviating the reduced Net Interest Margins (NIMs) that came with the law.
To mitigate the reduced lending, the National Treasury formulated the draft Financial Markets Conduct Bill, which was drafted to assess the whole credit management in the economy. The bill seeks to:
- Ensure better conduct by banks and other lenders in terms of extending credit to retail financial customers. By categorically not defining lenders as banks, this, in our view, might be the introduction of licensing for credit companies that are not banks,
- Provide consumer protection, mainly for retail customers by ensuring their credit contracts are clear and well understood in terms of interest, fees, charges and costs on credit facilities, thereby removing the opacity that has been existent in loan pricing.
However, as noted in our focus note The Draft Financial Markets Conduct Bill, 2018, the bill only addresses consumer protection and fails to address the problem of access to credit by the private sector. We are of the view that a lot more still needs to be done to address the issue of credit access as banks will still prefer to lend to the risk free government as opposed to lending to a riskier retail private sector at the current 13.0%, (4.0% points above the current CBR of 9.0%) as dictated by the Banking (Amendment) Act 2015.
To further add more regulatory requirements, The Central Bank of Kenya proposed to introduce a Banking Sector Charter that will guide service provision in the sector. The Charter aims to instill discipline in the banking sector in order to make it responsive to the needs of the banked population. It is expected to facilitate a market-driven transformation of the Kenyan banking sector, thereby considerably improving the quality of service provided, and increasing access to affordable financial services for the unbanked and under-served population. In achieving its objective, the Banking Sector Charter will be guided by the following objectives:
- To enhance the quality of financial services to the banked population that is negatively affected by the lack of credit access,
- To create a roadmap that will guide in the development of a more resilient, competitive and dynamic financial system based on the four central pillars of the banking sector’s vision,
- To ensure that institutions proactively engage their customers in financial literacy and consumer education drives, to enhance customers’ financial knowledge and skills for them to make informed financial decisions,
- To provide the basis for the sector’s engagement with other stakeholders,
- To establish targets and quantified responsibilities with respect to each objective and outline processes for implementing the Charter as well as mechanisms to monitor and report on progress towards given goals which are aligned with Kenya Vision 2030,
- To ensure institutions develop and submit a time bound plan approved by the Board in compliance with the Charter for CBK’s monitoring purposes, and,
- To ensure institutions submit quarterly reports to CBK on the progress of their implementation of the Charter by timelines determined by the CBK.
The achievement of the above objectives will be hinged on transformation of financial institutions around key areas such as; fairness, transparency, financial inclusion and access to financial services. We are of the view that, if adopted, the Banking Sector Charter will go a long way towards removing the existing opacity in loan prices, and promote the adoption of the risk-based loan-pricing framework. However, we are of the stronger view, that the best way to bring discipline in the banking sector is to reduce banking sector dominance by promoting alternative financial products. In a developed economy, bank-funding makes about only 40% of business funding, while in Kenya, it makes up 95% of business funding, thus meaning businesses and individuals alike are over reliant on bank funding. Thus, a free market that promotes competing sources of financing will trigger its own price regulation, thereby benefiting the credit consumers in the process.
- Revenue Diversification – With banks registering declining interest income and by extension compressed net interest income following the capping of interest rates, banks shifted their business models with increased focus on diversifying income sources, mainly through non-funded income. Non-funded income (NFI) grew by 6.9% in H1’2018, higher than 5.1% growth witnessed in H1’2017 taking its contribution to total income to 34.3%, compared to 34.0% in H1’2017. We expect this to continue going forward, as banks seek alternative sources of income to boost profitability under the interest rate cap regime. Banks have been venturing into various NFI growth initiatives such bancassurance. Notable forays into the bancassurance segment include:
- I&M Holdings having completed a full buyout of Youjays Insurance Brokers for an undisclosed amount on 5th April 2018,
- Standard Chartered partnered with Sanlam in October 2017, to offer general insurance products via its bancassurance division,
- KCB partnering with Liberty Holdings for the education savings plan dubbed Elimisha in June 5th 2018,
- Barclays acquired First Assurance in 2015 for Kshs 2.2 bn,
- Equity Group Holdings setting up an insurance arm (Equity Insurance Agency) in December 2006 that offers both life and non-life insurance products,
- NIC Group setting up an insurance agency (NIC insurance agency) in 2008, which provides general insurance products,
- Co-operative Bank’s bancassurance arm that provides Medical insurance, Motor cover, agricultural insurance and life insurance, and
- National Bank of Kenya setting up NBK insurance Agency insurance which provides property insurance, education policies, medical insurance, annuities and agricultural insurance.
Banks have also been seeking to grow the NFI by promoting the usage of alternative channels of transactions such as mobile banking, internet banking, and agency banking. Notable moves towards the alternative channels segment include:
- Housing Finance launching their own mobile banking app dubbed HF Whizz. The app aims to change the way consumers open and access their bank accounts. The application promises to set itself apart from by prioritizing on customer experience, with frequent software upgrades suited to the lifestyle of the customer, key integrations to be able to have the social experience whilst ensuring seamless transactions. Users of the app will be able to open an account, access loans, and deposit and transfer cash via their mobile phones,
- Barclays bank launched its own digital platform, dubbed Timiza, which allows customers to send money to their respective accounts, pay for utilities such as water and electricity, procure micro insurance, and pay for online taxi hailing services. In addition to this, the app grants customers with the access to micro loans of between Kshs 100 and Kshs 150,000 from the platform at interest rates of 1.2% monthly, and one-off facilitation fee of 5.0%, repayable after 30 days,
- Equity Group launched its fintech subsidiary, Finserve, a technological service company, tasked to drive disruptive technology innovation in the financial services segment. Finserve will operate as an autonomous commercial enterprise, delivering technological solutions not just for Equity Group, but also to the entire economy. Finserve houses products like Equitel, Equity Eazzy app, EazzyBiz and EazzyNet. Through Finserve, Equity group aims to provide an edge in terms of integration with all major global card associations including American Express, Mastercard, Visa, JCB, Dinners, and Union Pay, becoming the single largest aggregator of card payments in the region, in its quest to grow the payment services segment, and the alternative channels in its various regional subsidiaries.
We believe that revenue expansion by product diversification is one of the core opportunities for the banking sector, in the quest to achieve sustainable growth in the long run.
- Asset Quality – The banking sector continued to witness a deterioration in its asset quality over quarter, with the gross non-performing loans ratio rising to a weighted average of 10.0% from 7.7% in H1’2017, much higher than the 5-year average of 8.4%, owing to the challenging operating environment witnessed in 2017. The effects of the harsh operating environment spilled over to the first half of 2018, and resulted in an increase in the number of bad loans. The major sectors touted as leading in asset quality deterioration include tourism, manufacturing, retail, agriculture and real estate, all of which were affected by the tough operating environment experienced last year that was occasioned by a volatile political environment due to the prolonged electioneering period, and a severe prolonged drought that affected the agriculture which remains the largest GDP contributor. Owing to the deteriorating asset quality, banks have adopted stringent lending policies in a bid to curb the relatively high number of Non-Performing Loans (NPLs). The stringent lending policies have further contributed to the tightening of the credit standards in the economy. To mitigate this deterioration, banks have adopted a raft of measures to try to improve their asset qualities. Main strategies include (i) remediation of collapsed businesses and thereby enabling them to service their obligations to the bank, and (ii) Collateralization of bad debt to third parties. A relatively new strategy banks have also been using is the adoption of sophisticated credit pre-scoring models through the use of new technologies such as artificial intelligence, to pre-identify any delinquencies before they happen. This relatively new method is likely to contribute to the transition to a risk-based credit-pricing model, in line with the Central Bank of Kenya’s recommendation.
- Efficiency – With the inception of the Banking (Amendment) Act 2015 in 2016, Banks sought to mitigate the reduced interest income via various cost rationalization measures. This saw banks align their employee head count to their operational needs as several banks laid of staff in voluntary retirement programs. Furthermore, a number of banks also closed branches. Thus, operational efficiency has improved as shown by the Cost to Income Ratio (CIR), which improved to 55.7% in H1’2018 from 59.2% in H1’2017. Another key avenue that banks have been using to improve their efficiency, is the product development centered on leveraging on alternative distribution channels. The use of alternative channels has gained prominence among bank customers due to the convenience it provides. Thus, increased use of alternative channels has also contributed to increased non-funded income in the form of transactional income due to the high number of transactions via these channels, thereby also contributing in the improvement in the cost to income ratio. Cost reduction has to be accompanied by revenue expansion for banks to achieve sustainable growth. The table below highlights the various staff layoffs and branch closures:
|
Kenya Banking Sector Restructuring |
|||
|
No. |
Bank |
Staff Lay-off |
Branches Closed |
|
1 |
Bank of Africa |
0 |
12 |
|
2 |
Barclays Bank |
301 |
7 |
|
3 |
Ecobank |
0 |
9 |
|
4 |
Equity Group |
400 |
7 |
|
5 |
Family Bank |
Unspecified |
0 |
|
6 |
First Community Bank |
106 |
0 |
|
7 |
KCB Group |
223 |
Unspecified |
|
8 |
National Bank |
150 |
4 |
|
9 |
NIC Group |
32 |
Unspecified |
|
10 |
Sidian Bank |
108 |
0 |
|
11 |
I&M Holdings |
0 |
Unspecified |
|
12 |
Standard Chartered |
300 |
4 |
|
13 |
HF Group |
112 |
0 |
|
Total |
1,732 |
42 |
|
- Prudence – With the implementation of IFRS 9 from January of 2018, departing from the previous IAS 39, banks are required to provide for both the non-performing loans and performing loans. This then points to increased provisioning levels by banks. IFRS 9 takes on a forward-looking credit assessment approach. Credit losses under IFRS 9 have to be computed under the Expected Credit Loss (ECL) model, as opposed to the Incurred Credit Loss (ICL) model, that was used under IAS 39 framework. The implementation of IFRS 9 saw the total capital position of banks relative to the risky assets decline by an average of 0.4% after adjusting for IFRS 9, on account of increasing provisions. To operate under this new standard, banks have adopted stringent lending policies, with some banks adopting advanced credit pre-scoring methods. The implementation of IFRS 9 was done ensure financial institutions had adequate provisions to cover for credit losses as and when they occur.
- Consolidation– In 2018, only one acquisition has been completed. SBM Bank Kenya Ltd completed the acquisition of certain assets and liabilities of Chase Bank Limited, which was under receivership. Following the agreement between the Central Bank of Kenya (CBK), Kenya Deposit Insurance Corporation (KDIC) and SBM Bank Kenya, 75% of the value of all moratorium deposits at Chase Bank will be transferred to SBM Bank Kenya. The remaining 25% will remain with Chase bank Limited. This is a major milestone as this is the first successful instance, in the history of Kenya, of a bank being successfully brought out of receivership. Chase Bank was put under receivership in 2016, with customer deposits in excess of Kshs 100.0 bn. The acquisition will see SBM take control of the 62 Chase Bank branches, significantly increasing the bank’s foothold in the country to 60 branches after closing 20 braches initially with Chase Bank. SBM Bank has injected Kshs 2.6 bn in Chase Bank, and is planning to inject a further Kshs 6.0 bn to aid in the revival Chase bank. In addition to this, the bank is expected to absorb a significant number of the 1,300 former employees of Chase Bank Limited.
KCB Group offered its second bid to acquire a stake in Imperial Bank Limited (IBL), which is under receivership. IBL was put under receivership in August 2015, with a loan book of Kshs 41.0 bn and deposits of Kshs 58.0 bn. KCB Group and Diamond Trust Bank (DTB) submitted offers in April, whose details were undisclosed, but were tasked with revising their offers, with DTB declining to participate further. Kenya Deposit Insurance Corporation (KDIC) highlighted that it had received the revised proposal from KCB Group, while the other bidder had withdrawn from the process. The Central Bank of Kenya (CBK) and KDIC will engage KCB Group in discussions with the aim of maximizing the value for depositors. The bidders were tasked to disclose the oversight frameworks they planned to implement, the type of transaction they intended to proceed with, and the financial resources that could be deployed to compete the transaction. The impending resolution of the matter, which could possibly result in the bank coming out of receivership, will be a boost to customers, whose deposits have been locked in the bank since August 2015. We note that The process needs to be expedited as the transaction falls way behind the expected timelines shared by the CBK, who, in September 2017, had scheduled to have a winning bidder by February 2018. If successful, this would mark the second instance a bank is successfully brought out of receivership.
We are of the view that the industry needs more consolidation, as smaller banks with depleted capital positions need to be acquired as their performance deteriorates due to the sustained effects of the Banking (Amendment) Act 2015. We note that the industry needs fewer but stronger players to ensure the sector remains stable.
Below is a summary of the completed deals in the last 5 years:
|
Summary of Acquisition Transactions |
||||||
|
Acquirer |
Bank Acquired |
Book Value at Acquisition (Kshs bns) |
Transaction Stake |
Transaction Value (Kshs bns) |
P/Bv Multiple |
Date |
|
SBM bank Kenya |
Chase Bank ltd |
Unknown |
75.0% |
Undisclosed |
N/A |
Aug-18 |
|
Diamond Trust Bank Kenya |
Habib Bank Limited Kenya |
2.38 |
100.0% |
1.82 |
0.8x |
Mar-17 |
|
SBM Holdings |
Fidelity Commercial Bank |
1.75 |
100.0% |
2.75 |
1.6x |
Nov-16 |
|
M Bank |
Oriental Commercial Bank |
1.80 |
51.0% |
1.30 |
1.4x |
Jun-16 |
|
I&M Holdings |
Giro Commercial Bank |
2.95 |
100.0% |
5.00 |
1.7x |
Jun-16 |
|
Mwalimu SACCO |
Equatorial Commercial Bank |
1.15 |
75.0% |
2.60 |
2.3x |
Mar-15 |
|
Centum |
K-Rep Bank |
2.08 |
66.0% |
2.50 |
1.8x |
Jul-14 |
|
GT Bank |
Fina Bank Group |
3.86 |
70.0% |
8.60 |
3.2x |
Nov-13 |
|
Average |
80.3% |
1.8x |
||||
Section II: Summary of the performance of the Banking Sector in H1’2018
The table below, highlights the performance of the banking sector, showing the performance using several metrics, and they the key take outs of the performance.
|
Listed Banking Sector Operating Metrics |
|||||||||||||||
|
Bank |
Core EPS Growth |
Interest Income Growth |
Interest Expense Growth |
Net Interest Income Growth |
Net Interest Margin |
Cost to Income Ratio |
Non-Funded Income (NFI) Growth |
NFI to Total Operating Income |
Growth in Total Fees & Commissions |
Deposit Growth |
Growth In Govt Securities |
Loan Growth |
LDR |
Cost of Funds |
Return on Average Equity |
|
CFC Stanbic |
104.5% |
15.4% |
21.7% |
11.9% |
4.9% |
50.1% |
34.0% |
50.0% |
(4.2%) |
21.3% |
26.9% |
15.4% |
71.4% |
3.1% |
14.8% |
|
National Bank |
39.3% |
(9.6%) |
(10.1%) |
(8.9%) |
6.9% |
95.6% |
(13.1%) |
28.8% |
(15.7%) |
(2.8%) |
9.8% |
(16.1%) |
49.8% |
3.0% |
(0.6%) |
|
Standard Chartered |
30.3% |
7.9% |
8.8% |
7.5% |
8.0% |
61.0% |
12.2% |
32.9% |
36.2% |
2.8% |
3.5% |
(1.1%) |
48.4% |
3.6% |
18.0% |
|
KCB Group |
18.0% |
6.1% |
11.9% |
4.3% |
8.6% |
52.0% |
(0.1%) |
32.2% |
(6.0%) |
8.7% |
8.7% |
3.6% |
80.3% |
3.0% |
21.9% |
|
Equity Group |
17.6% |
10.2% |
14.0% |
9.1% |
8.8% |
52.8% |
1.5% |
40.2% |
(1.0%) |
8.5% |
18.7% |
3.8% |
69.9% |
2.7% |
23.9% |
|
I&M holdings |
11.7% |
5.1% |
13.2% |
0.1% |
7.1% |
53.7% |
34.4% |
35.1% |
39.5% |
30.6% |
(8.0%) |
12.6% |
77.2% |
4.6% |
17.2% |
|
Co-op Bank |
7.6% |
7.9% |
2.2% |
10.4% |
8.6% |
54.9% |
(1.6%) |
32.1% |
(2.6%) |
3.9% |
12.0% |
(0.6%) |
84.6% |
3.9% |
18.0% |
|
Barclays Bank |
6.2% |
7.6% |
22.4% |
4.0% |
9.0% |
66.3% |
6.9% |
30.0% |
1.9% |
14.9% |
33.6% |
7.5% |
81.2% |
2.60% |
17.5% |
|
DTB |
2.5% |
3.9% |
3.0% |
4.6% |
6.5% |
57.4% |
8.0% |
21.6% |
7.2% |
9.9% |
22.5% |
3.5% |
70.4% |
5.0% |
15.5% |
|
NIC Group |
(2.1%) |
8.6% |
30.0% |
(4.9%) |
6.0% |
60.9% |
7.0% |
29.5% |
(3.0%) |
10.5% |
25.7% |
(1.5%) |
78.2% |
5.4% |
12.8% |
|
Housing Finance |
(95.7%) |
(13.2%) |
(12.7%) |
(13.9%) |
4.9% |
99.3% |
38.2% |
30.4% |
7.2% |
(3.1%) |
17.3% |
(9.8%) |
131.4% |
7.0% |
(0.2%) |
|
Weighted Average H1'2018* |
19.0% |
7.9% |
12.0% |
6.4% |
8.1% |
55.7% |
6.9% |
34.3% |
4.6% |
10.0% |
14.9% |
3.8% |
73.8% |
3.4% |
19.5% |
|
Weighted Average H1'2017** |
(14.4%) |
(7.2%) |
(6.0%) |
(6.9%) |
8.0% |
59.2% |
5.1% |
34.0% |
12.5% |
9.4% |
21.5% |
7.3% |
77.9% |
3.4% |
17.9% |
|
*Market cap weighted as at 31/08/2018 |
|||||||||||||||
|
**Market cap weighted as at 31/08/2017 |
|||||||||||||||
Key takeaways from the table above include:
- The listed banks recorded a 19.0% average increase in core Earnings Per Share (EPS), compared to a decline of 14.4% in H1’2017. Only NIC Group and Housing Finance Group recorded declines in core EPS, registering declines of 2.1% and 95.7%, respectively. CFC Stanbic recorded the highest growth at 104.5% y/y, aided by 21.9% increase in total operating income, coupled with a 14.0% decrease in total operating expenses. HF Group recorded the biggest decline at 95.7%, on the back of a 13.9% decline in Net Interest Income (NII), and a high cost to income ratio of 99.3% ;
- The sector recorded a relatively strong deposit growth, which came in at 10.0%. The strong deposit growth led to a 12.0% growth in the interest expenses. However, the cost of funds remained flat at 3.4%, an indication that the greater proportion of deposit accounts were non-interest bearing;
- Average loan growth was anemic coming in at 3.8%, which was lower than 7.3% recorded in H1’2017, indicating that there was an even slower credit extension in the economy, due to sustained effects of the interest rate cap. Government securities on the other hand recorded a growth of 14.9% y/y, which was faster compared to the loans, albeit slower than 21.5% recorded in H1’2017. This indicates that banks’ continued preference towards investing in government securities, which offer better risk-adjusted returns. Interest income increased by 7.2%, as banks adapted to the interest rate cap regime, with increased allocations in government securities. This, however, should be a point of concern as it points to a reduction in the banking sector’s primary function of intermediation between depositors and credit consumers, with the loan to deposit ratio declining to 73.8% from 77.9% in H1’2017. Reduced credit extension especially to the private sector comprised mainly of the MSMEs, curtails both the short and long-run economic growth;
- The average Net Interest Margin in the banking sector currently stands at 8.1%, a slight improvement from the 8.0% recorded in H1’2017. The improvement was mainly due to the increase in Net Interest Income by 6.4% y/y, aided by the 7.9% improvement in the interest income y/y, and,
- Non-funded Income grew by 6.9% y/y, faster than 5.1% recorded in H1’2017. The growth included a total fee and commissions growth of 4.6% although it was slower than 12.5% recorded in H1’2017. The growth in fee and commission income was however subdued by the slow loan growth, thus impacting the fee and commission income from loans. Banks have however been focusing on expanding the other fee and commission income, with increased focus on transactional income from alternative transaction channels. Banks have been shifting focus to this revenue space, by offering holistic banking services such as advisory. With increased focus on other NFI sources such as transaction income from mobile and online channels, bancassurance, money remittance, and payment services etc., banks will likely see expansion in NFI going forward as net interest income remains somewhat subdued under the current interest rate cap regime.
Section III: The focus areas of the Banking Sector Players going forward
In summary, the banking sector had an improvement in performance, largely aided by the improving economic conditions and a more conducive operating environment compared to a similar period last year, which was marred by election jitters. However, the banking sector has been fraught by two main challenges (i) the deteriorating asset quality brought about by a spilled over effects of challenging operating environment experienced in 2017, and (ii) the capping of interest rates, which has led to subdued growth in the credit extended to the private sector. We however noted that the sector in general has adapted to operating in the tough environment, posting a 19.0% increase in core EPS. We believe the key factors banks need to consider going forward are asset quality management, continued revenue diversification, efficiency, and downside regulatory compliance risks amid tighter regulatory requirements. To grow profitability amidst the tighter regulated environment, banks will:
- Continue diversifying their income sources by growing their fee-income businesses, bancassurance, asset management and advisory services,
- Be more prudent in loan disbursement, as well as enhancing their risk assessment framework to improve asset quality, so as to tame any rising financial impairments arising from implementation of IFRS 9, and,
- Improve efficiency by leveraging on mobile and internet banking, for cost reduction especially on staff numbers and revenue expansion from transaction income, with all these strategies aimed at improving their profitability margins.
We believe the banking sector is well poised to grow in future and continue to outperform other sectors, but there is still a need to address the subdued growth in credit, which has remained below 5.0%, below the 5-year average of 13.0% as seen below.
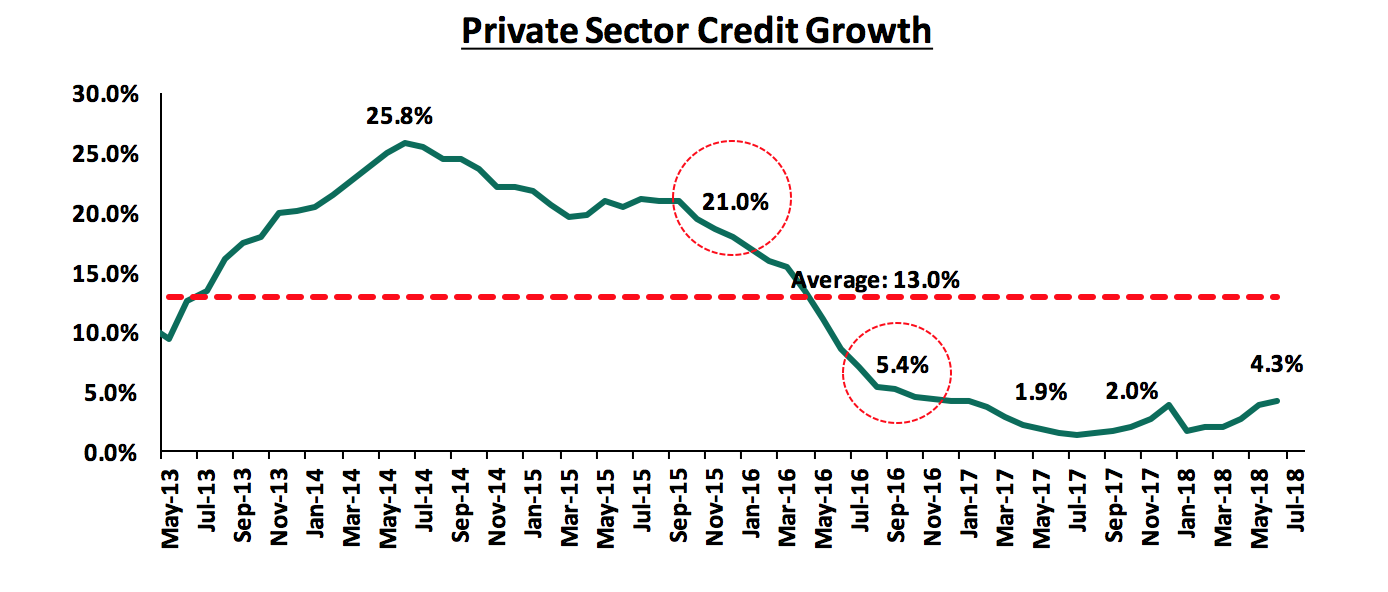
Section IV: Brief Summary of the outcome of our analysis
As per our analysis on the banking sector, from a franchise value and from a future growth opportunity perspective, we carried out a comprehensive ranking of the listed banks. For the franchise value ranking, we included the earnings and growth metrics in the table above as well as the operating metrics in the table below in order to carry out a comprehensive review of the banks.
|
Bank |
LDR |
CIR |
ROACE |
Deposit/Branch |
Gross NPL Ratio |
NPL Coverage |
Tangible Common Ratio |
|
Coop Bank |
84.6% |
54.9% |
18.0% |
1.9 |
10.9% |
31.0% |
16.8% |
|
KCB Group |
80.3% |
52.0% |
21.9% |
2.0 |
8.4% |
63.6% |
14.4% |
|
DTBK |
70.4% |
57.4% |
15.5% |
2.0 |
7.1% |
70.7% |
13.0% |
|
Equity Bank |
69.9% |
52.8% |
23.9% |
1.4 |
8.5% |
51.8% |
14.7% |
|
I&M Holdings |
77.2% |
53.7% |
17.2% |
5.0 |
13.0% |
43.4% |
14.7% |
|
NIC Bank |
78.2% |
60.9% |
12.8% |
3.0 |
13.1% |
52.2% |
13.6% |
|
Barclays Bank |
81.2% |
66.3% |
17.5% |
2.4 |
7.7% |
68.2% |
12.6% |
|
SCBK |
48.4% |
55.2% |
18.0% |
6.6 |
14.8% |
75.0% |
14.5% |
|
CFC Stanbic |
71.4% |
54.0% |
14.8% |
8.3 |
6.6% |
51.5% |
11.8% |
|
HF Group* |
91.1% |
99.3% |
(0.2%) |
1.5 |
17.4% |
39.0% |
15.7% |
|
NBK |
49.8% |
95.6% |
(0.6%) |
1.4 |
46.5% |
56.5% |
4.1% |
|
Weighted Average H1'2018 |
73.8% |
55.6% |
19.5% |
2.9 |
10.0% |
55.9% |
14.4% |
|
*Used Loans to loanable funds due to nature of the business |
|||||||
The overall ranking was based on a weighted average ranking of Franchise value (accounting for 40%) and Intrinsic value (accounting for 60%). The Intrinsic Valuation is computed through a combination of valuation techniques, with a weighting of 75.0% on Discounted Cash-flow Methods and 25.0% on Relative Valuation, while the Franchise ranking is based on banks operating metrics, meant to assess the efficiency, asset quality, diversification, corporate governance and profitability, among other metrics. The overall H1’2018 ranking is as shown in the table below:
|
Bank |
Franchise Value Total Score |
Intrinsic Value Score |
Weighted Score |
H1'2018 Rank |
Q1'2018 Rank |
|
KCB Group |
47 |
3 |
20.6 |
1 |
1 |
|
Equity Bank |
61 |
5 |
27.4 |
2 |
2 |
|
I&M Holdings |
73 |
4 |
31.6 |
3 |
3 |
|
Coop Bank |
71 |
6 |
32.0 |
4 |
6 |
|
DTBK |
80 |
2 |
33.2 |
5 |
4 |
|
Barclays Bank |
76 |
7 |
34.6 |
6 |
5 |
|
SCBK |
75 |
8 |
34.8 |
7 |
8 |
|
NIC Bank |
87 |
1 |
35.4 |
8 |
8 |
|
CFC Stanbic |
76 |
9 |
35.8 |
9 |
7 |
|
NBK |
103 |
11 |
47.8 |
10 |
11 |
|
HF Group |
105 |
10 |
48.0 |
11 |
10 |
Major changes include:
- Co-operative bank climbed 2 spots to Position 4 from Position 6 in our Q1’2018 Banking Sector Report, owing to its net interest margin, with the bank having the third best NIM at 8.6%, higher than industry average of 8.1%, the best loan deposit ratio at 84.6%, above the industry average of 73.8%, and,
- Stanbic Holdings dropped 2 spots to Position 9 from Position 7 in our Q1’2018 Banking Sector Report, due to a low franchise value score caused by low Net Interest Margin at 4.9%, against the industry average 8.1%, a low corporate governance score ranking 10th in the Cytonn Corporate Governance Index, and a high Price to earnings Growth ratio of 0.9x, ranking 9th overall.
For a comprehensive analysis on the ranking and methodology behind it, see our Cytonn H1’2018 Banking Sector Report
Disclaimer: The views expressed in this publication are those of the writers where particulars are not warranted. This publication, which is in compliance with Section 2 of the Capital Markets Authority Act Cap 485A, is meant for general information only and is not a warranty, representation, advice or solicitation of any nature. Readers are advised in all circumstances to seek the advice of a registered investment advisor.

- Talk to us
- Kenya
- P.O Box 20695 - 00200, Nairobi, Kenya
- Cell +254709101200
- Tel +254709101200
- WhatsApp +254741676635
- United States
- +254709101200
- DOWNLOAD OUR APP
-


- Kenya
- 8th Floor, Pinetree Plaza, Kaburu Drive, Ngong Road, Nairobi, Kenya
- USA
- Suite 1150, 1775 Eye Street NW, USA, Washington DC 20006, USA
- Investments
- High Yield
- Private Equity
- Real Estate
- Real Estate
- RiverRun Estates
- Cytonn Towers
- The Ridge
- Taraji Heights
- The Alma