Kenya Listed Banks Q3’2021 Report, & Cytonn Weekly #49/2021
By Research Team, Dec 12, 2021
Executive Summary
Fixed Income
During the week, T-bills remained undersubscribed, with the overall subscription rate coming in at 65.7%, down from 95.2% recorded the previous week, partly attributable to investors shifting their focus to the December bond issue, which was oversubscribed by 102.9%. The 91-day paper recorded the highest subscription rate, receiving bids worth Kshs 5.1 bn against the offered Kshs 4.0 bn, translating to a subscription rate of 126.8%, a decline from the 217.3% recorded the previous week. In the Primary Bond Market, the government re-opened two bonds namely; FXD4/2019/10 and FXD1/2018/20 for the month of December, which recorded an oversubscription of 102.9% having received bids worth Kshs 41.2 bn compared to the Kshs 40 bn on offer. In a bid to maintain stable rates, the government rejected expensive bids, accepting only Kshs 37.8 bn, translating to a 91.9% acceptance rate. The yields on the two bonds came in at 12.6% and 13.4%, respectively.
During the week, Stanbic Bank released its monthly Purchasing Manager’s Index (PMI) highlighting that the index for the month of November increased to 53.0 from 51.4 recorded in October 2021, an indication of an improving operating environment during the period. Notably, this is the highest PMI recorded in the ten months leading to November 2021;
Equities
During the week, the equities market was on an upward trajectory, with both NASI and NSE 25 gaining by 1.7%, while NSE 20 gained by 0.9%, taking their YTD performance to gains of 7.1% and 5.4% for NASI and NSE 25, respectively, while NSE 20 declined by 0.9% on a YTD basis. The equities market performance was driven by gains recorded by large cap stocks such as KCB, Co-operative bank, Safaricom, and Equity of 5.1%, 3.4%, 2.0% and 1.9%, respectively. The gains were however weighed down by losses recorded by other large cap stocks such as Standard Chartered Bank and EABL which declined by 1.6% and 0.7%, respectively. During the week, the Central Bank of Kenya, (CBK), announced that it had approved the liquidation of Imperial Bank Limited In Receivership, (IBLIR) in order to pave way for the sale of IBLIR’s remaining assets to settle any existing debts to depositors and creditors;
Real Estate
During the week, the Central Bank of Kenya (CBK) released the Monetary Policy Committee Hotels Survey - November 2021 aimed at assessing the extent of recovery of hotels between October and November 2021. Overall, all the sampled hotels indicated that they were in operation between October and November 2021, representing a 4.0% points increase from the 96.0% hotels in operation in September 2021. In the retail sector, Naivas Supermarket opened two new outlets. The first is located at Oasis Mall in Malindi, Kilifi County while the second is located at Embakasi off Airport North Road, Nairobi County. For Statutory Reviews, the President of Kenya, Uhuru Kenyatta signed the Public Private Partnerships (PPP) Bill 2021 into law. In the listed REIT, Fahari I-REIT declined by 2.4% to close at Kshs 6.5 per share compared to last week’s Kshs 6.7 per share;
Focus of the Week
Following the release of the Q3’2021 results by Kenyan listed banks, this week we analyse the performance of the 10 listed local banks (previously 11, before the acquisition of National Bank by KCB Group Plc), identify the key factors that influenced their performance, and give our outlook for the banking sector;
Investment Updates:
- Weekly Rates:
- Cytonn Money Market Fund closed the week at a yield of 10.53%. To invest, just dial *809#;
- Cytonn High Yield Fund closed the week at a yield of 13.96% p.a. To invest, email us at sales@cytonn.com and to withdraw the interest, just dial *809#;
- We continue to offer Wealth Management Training Monday through Saturday, from 9:00 am to 11:00 am, through our Cytonn Foundation. The training aims to grow financial literacy among the general public. To register for any of our Wealth Management Trainings, click here;
- If interested in our Private Wealth Management Training for your employees or investment group, please get in touch with us through wmt@cytonn.com;
- Any CHYS and CPN investors still looking to convert is welcome to consider one of the five projects currently available for conversion, click here for the latest conversion term sheet;
- Cytonn Insurance Agency acts as an intermediary for those looking to secure their assets and loved ones’ future through insurance namely; Motor, Medical, Life, Property, WIBA, Credit and Fire and Burglary insurance covers. For assistance, get in touch with us through insuranceagency@cytonn.com;
- Cytonnaire Savings and Credit Co-operative Society Limited (SACCO) provides a savings and investments avenue to help you in your financial planning journey. To enjoy competitive investment returns, kindly get in touch with us through clientservices@cytonn.com;
Real Estate Updates:
- For an exclusive tour of Cytonn’s real estate developments, visit: Sharp Investor's Tour, and for more information, email us at sales@cytonn.com;
- Phase 3 of The Alma is now ready for occupation. To rent please email properties@cytonn.com;
- We have 8 investment-ready projects, offering attractive development and buyer targeted returns; See further details here: Summary of Investment-ready Projects;
- For recent news about the group, see our news section here;
Hospitality Updates:
- We currently have promotions for Staycations. Visit cysuites.com/offers for details or email us at sales@cysuites.com;
- Share a meal with a friend during the Sunday Brunch at The Hive Restaurant at Cysuites Hotel and Apartment. Every Sunday from 11.00 AM to 4.00 PM at a price of Kshs 2,500 for Adults and Kshs 1,500 for children under 12 years;
Money Markets, T-Bills Primary Auction:
During the week, T-bills remained undersubscribed, with the overall subscription rate coming in at 65.7%, down from 95.2% recorded the previous week, partly attributable to investors shifting their focus to the December bond issue, which was oversubscribed by 102.9%. The 91-day paper recorded the highest subscription rate, receiving bids worth Kshs 5.1 bn against the offered Kshs 4.0 bn, translating to a subscription rate of 126.8%, a decline from the 217.3% recorded the previous week. The subscription rate for the 364-day paper declined as well to 51.7%, from 89.0% recorded the previous week, while the subscription rate for the 182-day paper increased to 55.2%, from 52.5% recorded the previous week. The yields on the 91-day, 182-day and 364-day papers increased by 4.8 bps, 13.0 bps and 7.5 bps, to 7.3%, 8.0% and 9.1%, respectively. The government continued to reject expensive bids, accepting Kshs 11.9 bn of the Kshs 15.8 bn worth of bids received, translating to an acceptance rate of 75.6%.
In the Primary Bond Market, the government re-opened two bonds namely; FXD4/2019/10 and FXD1/2018/20 for the month of December, which recorded an oversubscription of 102.9%, driven by the ample liquidity in the money market coupled with the bonds’ attractive yields of 12.6% and 13.4%, respectively. The government sought to raise Kshs 40.0 bn for budgetary support, received bids worth Kshs 41.2 bn and accepted bids worth Kshs 37.8 bn, translating to a 91.9% acceptance rate. Investors subscribed to the bonds in relatively equal measure, with the longer-tenure issue, i.e. FXD1/2018/20, receiving bids worth Kshs 20.9 bn, representing 50.8% of the total bids received while FXD4/2019/10 received bids worth 20.3 bn, representing 49.2% of the total bids received. The coupons for the two bonds were 12.3% and 13.2%.
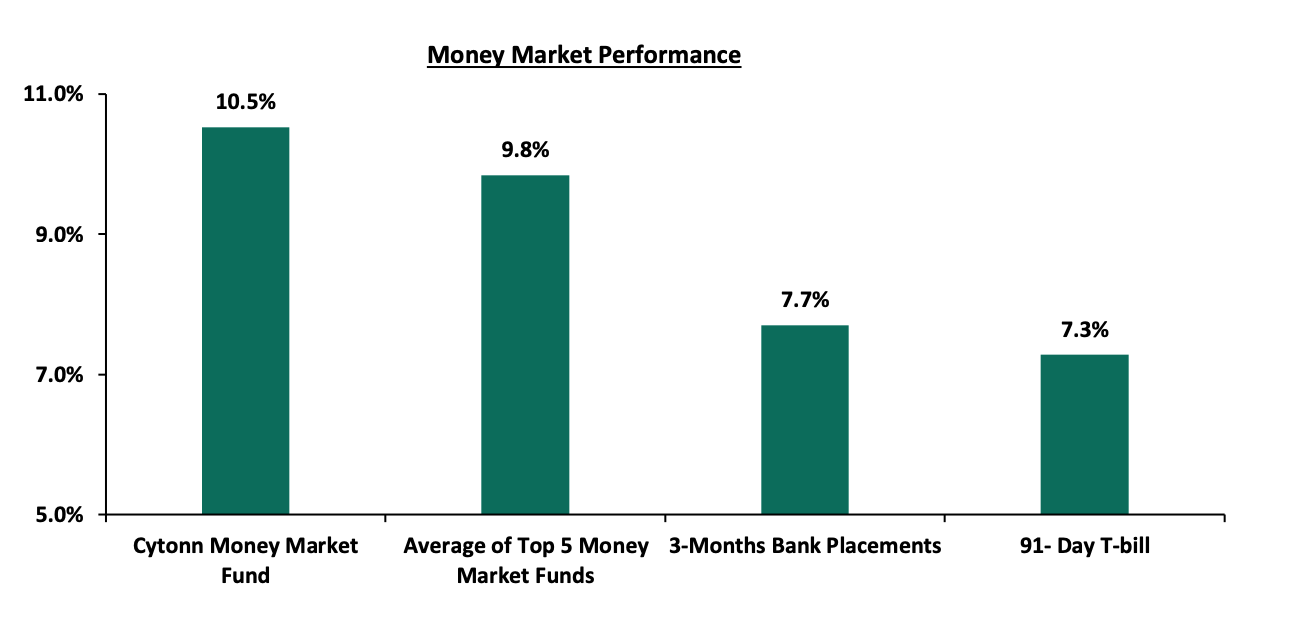
In the money markets, 3-month bank placements ended the week at 7.7% (based on what we have been offered by various banks), while the yields on the 91-day T-bill increased by 4.8 bps to 7.3%. The average yield of the Top 5 Money Market Funds remained relatively unchanged at 9.8% while the yield on the Cytonn Money Market Fund decreased by 0.1% points to 10.5%, from 10.6% recorded the previous week.
The table below shows the Money Market Fund Yields for Kenyan Fund Managers as published on 10th December 2021:
|
|
Money Market Fund Yield for Fund Managers as published on 10th December 2021 |
|
|
Rank |
Fund Manager |
Effective Annual Rate |
|
1 |
Cytonn Money Market Fund |
10.53% |
|
2 |
Zimele Money Market Fund |
9.91% |
|
3 |
Nabo Africa Money Market Fund |
9.70% |
|
4 |
Madison Money Market Fund |
9.54% |
|
5 |
Sanlam Money Market Fund |
9.53% |
|
6 |
CIC Money Market Fund |
9.24% |
|
7 |
Apollo Money Market Fund |
8.95% |
|
8 |
GenCapHela Imara Money Market Fund |
8.95% |
|
9 |
Co-op Money Market Fund |
8.74% |
|
10 |
Dry Associates Money Market Fund |
8.64% |
|
11 |
British-American Money Market Fund |
8.48% |
|
12 |
Orient Kasha Money Market Fund |
8.37% |
|
13 |
NCBA Money Market Fund |
8.34% |
|
14 |
ICEA Lion Money Market Fund |
8.30% |
|
15 |
Old Mutual Money Market Fund |
7.41% |
|
16 |
AA Kenya Shillings Fund |
7.17% |
Source: Business Daily
Liquidity:
During the week, liquidity in the money markets eased, with the average interbank rate declining to 4.8% from the 5.2% recorded the previous week, partly attributable to government payments, including Term Auction Deposits (TADs) maturities of Kshs 26.0 bn, which offset tax remittances and settlements of government securities. The average interbank volumes traded declined by 2.9% to Kshs 6.5 bn, from Kshs 6.7 bn recorded the previous week.
Kenya Eurobonds:
During the week, the yields on all Eurobonds declined, with yields on the 10-year bond issued in 2014, 10-year bond issued in 2018, 30-year bond issued in 2018, the 7-year bond issued in 2019 and 12-year bond issued in 2019, all declining by 0.1% points to 4.3%, 5.9%, 8.1%, 5.7% and 6.8%, respectively, while the yields on the 12-year bond issued in 2021 declined by 0.2% to 6.6%. Below is a summary of the performance:
|
Kenya Eurobond Performance |
||||||
|
|
2014 |
2018 |
2019 |
2021 |
||
|
Date |
10-year issue |
10-year issue |
30-year issue |
7-year issue |
12-year issue |
12-year issue |
|
31-Dec-20 |
3.9% |
5.2% |
7.0% |
4.9% |
5.9% |
- |
|
30-Nov-21 |
4.4% |
6.2% |
8.4% |
6.0% |
7.1% |
7.0% |
|
3-Dec-21 |
4.4% |
6.0% |
8.2% |
5.8% |
6.9% |
6.8% |
|
6-Dec-21 |
4.3% |
5.9% |
8.2% |
5.8% |
6.9% |
6.8% |
|
7-Dec-21 |
4.3% |
5.9% |
8.1% |
5.7% |
6.8% |
6.7% |
|
8-Dec-21 |
4.3% |
5.9% |
8.1% |
5.7% |
6.8% |
6.7% |
|
9-Dec-21 |
4.3% |
5.9% |
8.1% |
5.7% |
6.8% |
6.6% |
|
Weekly Change |
(0.1%) |
(0.1%) |
(0.1%) |
(0.1%) |
(0.1%) |
(0.2%) |
|
M/m Change |
(0.1%) |
(0.3%) |
(0.2%) |
(0.3%) |
(0.4%) |
(0.3%) |
|
YTD Change |
0.4% |
0.7% |
1.1% |
0.8% |
0.9% |
- |
Source: CBK
Kenya Shilling:
During the week, the Kenyan shilling depreciated marginally by 0.2% against the US dollar to close the week at Kshs 112.9, from Kshs 112.6 recorded the previous week, mainly attributable to increased dollar demand from general importers. Key to note, this is the lowest the Kenyan shilling has ever depreciated against the dollar. On a YTD basis, the shilling has depreciated by 3.4% against the dollar, in comparison to the 7.7% depreciation recorded in 2020. We expect the shilling to remain under pressure for the remainder of 2021 as a result of:
- Rising uncertainties in the global market due to the Coronavirus pandemic, which has seen investors continue to prefer holding their investments in dollars and other hard currencies and commodities,
- Increased demand from merchandise traders as they beef up their hard currency positions in anticipation for more trading partners reopening their economies globally,
- Widening current account deficit which stood at 5.4% of GDP in the 12-months to October 2021 compared to the 4.8% of GDP in the 12 months to October 2020 attributable to a higher import bill which offset increased receipts from agricultural and services exports and remittances, and,
- Rising global crude oil prices on the back of supply constraints at a time when demand is picking up with the easing of COVID-19 restrictions and as economies reopen. Key to note, risks abound this global recovery following the emergence of the new COVID-19 Omicron variant. We are of the view that should the variant continue to spread; most nations will respond swiftly by adopting stringent containment measures to curb the spread.
The shilling is however expected to be supported by:
- The Forex reserves, currently at USD 8.7 bn (equivalent to 5.3-months of import cover), which is above the statutory requirement of maintaining at least 4.0-months of import cover, and the EAC region’s convergence criteria of 4.5-months of import cover. Key to note, the forex reserves have been steadily declining and are currently at a 3-month low. In addition, the reserves were boosted by the USD 1.0 bn proceeds from the Eurobond issued in July, 2021 coupled with the USD 407.0 mn IMF disbursement and the USD 130.0 mn World Bank loan financing received in June 2021, and,
- Improving diaspora remittances evidenced by a 24.2% y/y increase to USD 320.1 mn in November 2021, from USD 257.7 mn recorded over the same period in 2020, which has continued to cushion the shilling against further depreciation.
We shall have an in-depth analysis of the shilling’s performance in the coming week.
Weekly Highlights:
- Stanbic Bank’s Monthly Purchasing Manager’s Index (PMI)
During the week, Stanbic Bank released its monthly Purchasing Manager’s Index (PMI) highlighting that the index for the month of November increased to 53.0 from 51.4 recorded in October 2021, an indication that business activities in the country strengthened and new business continued to grow. Notably, this is the highest PMI recorded in the ten months leading to November 2021. There was an increase in output levels and new orders largely driven by the construction, services and wholesale and retail sectors. However, demand fell in sectors such as agriculture and manufacturing. The rate of employment increased, following the increased work backlogs that necessitated an increase of staff levels. As a result, the firms were able to reduce their backlogs for the first time since May. An increase in input purchasing was also recorded during the month of November as businesses aimed to stock up goods due to expectations of an increase in demand. The chart below summarizes the evolution of the PMI over the last 24 months:
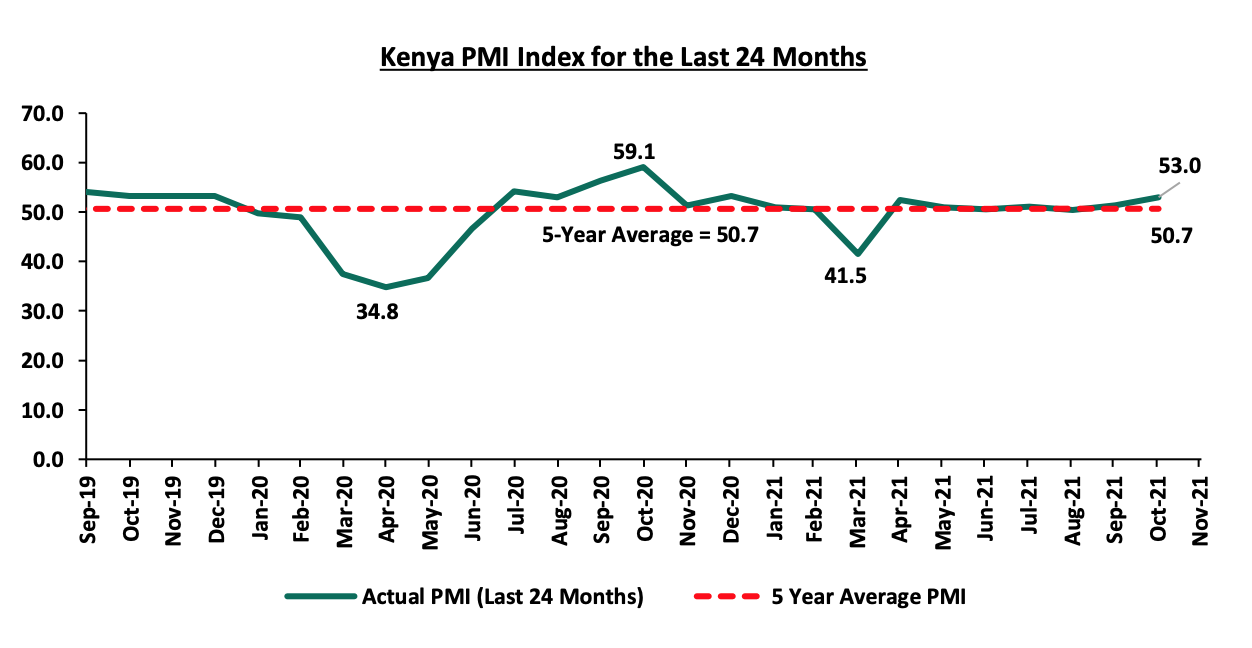
*** Key to note, a reading above 50.0 signals an improvement in business conditions, while readings below 50.0 indicate a deterioration
Despite the increase of the PMI index reading for the month of November 2021, we maintain a cautious outlook in the short-term owing to the increasing cost pressures, high cost of living and concerns of an uptick in COVID-19 infections from the new Omicron variant. We expect the October 2021 lifting of the dusk to dawn curfew that had been in place since March 2020 to continue boosting the economic recovery as local businesses use this opportunity to maximize production and boost sales volumes as they recover from the negative effects of the pandemic. The existence and emergence of new COVID-19 variants, such as the Omicron variant, still pose economic uncertainty as it may lead to another wave of infections and consequently tighter restrictions that will negatively affect the general business environment.
Rates in the fixed income market have remained relatively stable due to the tightened but sufficient levels of liquidity in the money markets. The government is 25.2% ahead of its prorated borrowing target of Kshs 303.9 bn having borrowed Kshs 380.4 bn of the Kshs 658.5 bn borrowing target for the FY’2021/2022. We expect a gradual economic recovery going into FY’2021/2022 as evidenced by KRAs collection of Kshs 598.5 bn in revenues during the first four months of the current fiscal year, which is equivalent to 101.1% of the prorated revenue collection target. However, despite the projected high budget deficit of 7.5% and the lower credit rating from S&P Global to 'B' from 'B+', we believe that the support from the IMF and World Bank will mean that the interest rate environment will remain stable since the government is not desperate for cash.
Markets Performance
During the week, the equities market was on an upward trajectory, with both NASI and NSE 25 gaining by 1.7%, while NSE 20 gained by 0.9%, taking their YTD performance to gains of 7.1% and 5.4% for NASI and NSE 25, respectively, while NSE 20 declined by 0.9% on a YTD basis. The equities market performance was driven by gains recorded by large cap stocks such as KCB, Co-operative bank, Safaricom, and Equity of 5.1%, 3.4%, 2.0% and 1.9%, respectively. The gains were however weighed down by losses recorded by other large cap stocks such as Standard Chartered Bank and EABL which declined by 1.6% and 0.7%, respectively.
During the week, equities turnover increased by 10.8% to USD 35.0 mn, from USD 31.6 mn recorded the previous week, taking the YTD turnover to USD 1.2 bn. Foreign investors remained net sellers, with a net selling position of USD 12.5 mn, from a net selling position of USD 5.7 mn recorded the previous week, taking the YTD net selling position to USD 80.4 mn.
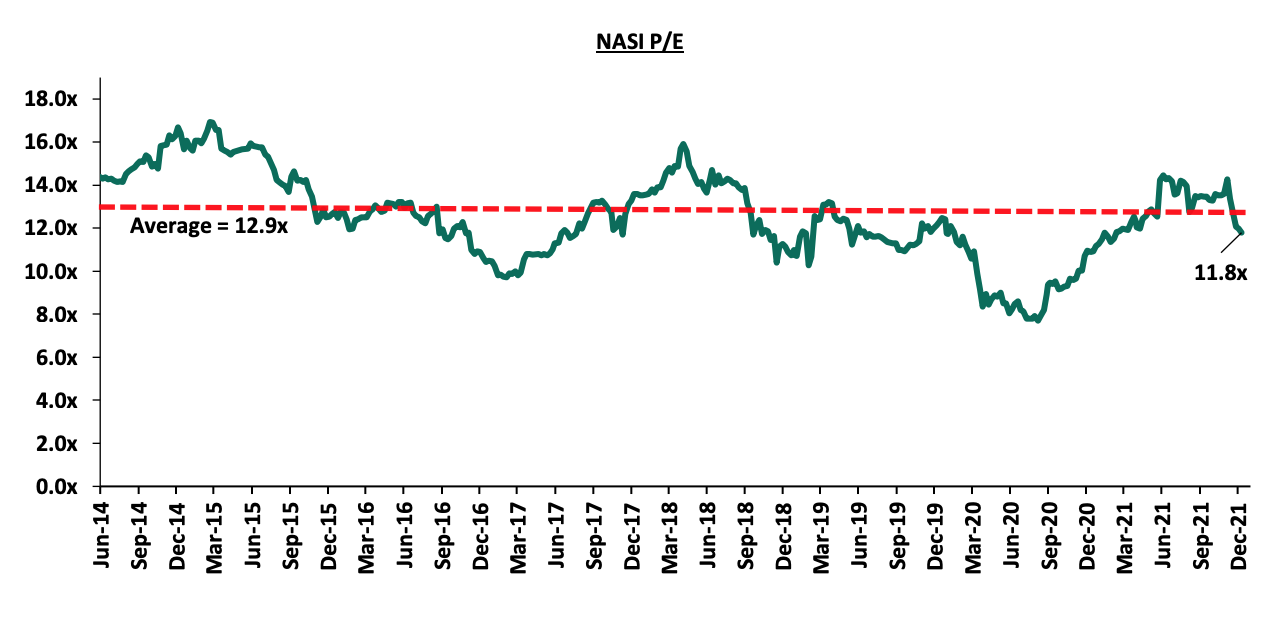
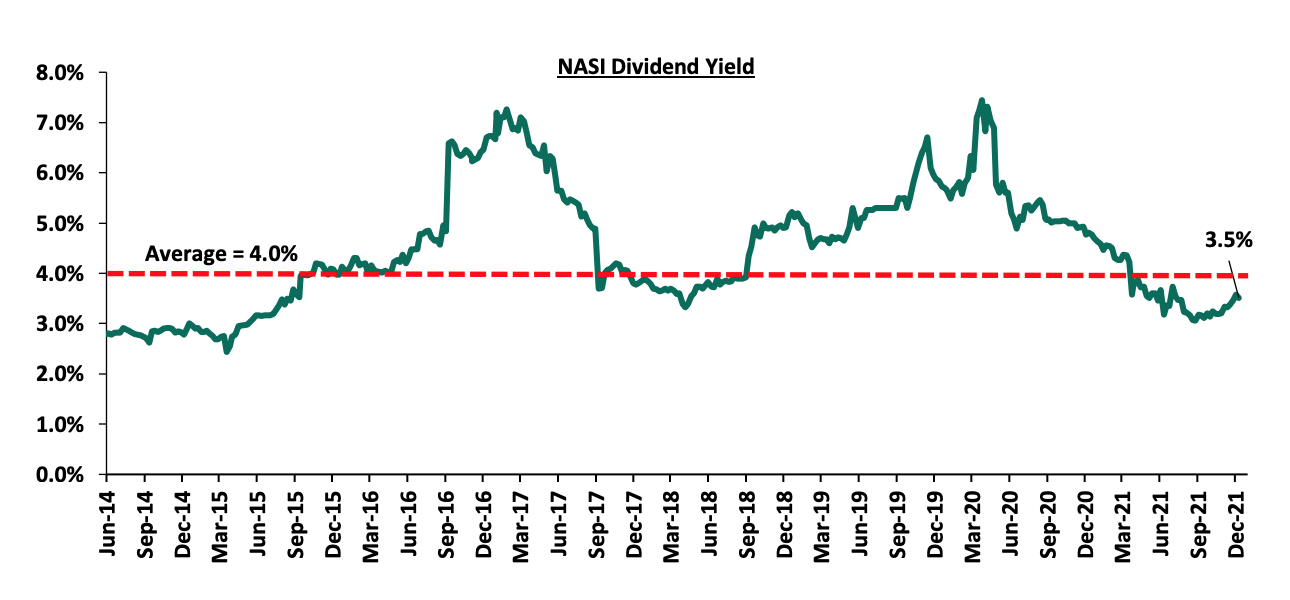
The market is currently trading at a price to earnings ratio (P/E) of 11.8x, 8.8% below the historical average of 12.9x, and a dividend yield of 3.5%, 0.5% points below the historical average of 4.0%. Notably, this week’s P/E is the lowest it has been since February 2021. Key to note, NASI’s PEG ratio currently stands at 1.3x, an indication that the market is trading at a premium to its future earnings growth. Basically, a PEG ratio greater than 1.0x indicates the market may be overvalued while a PEG ratio less than 1.0x indicates that the market is undervalued. The current P/E valuation of 11.8x is 53.1% above the most recent trough valuation of 7.7x experienced in the first week of August 2020. The charts below indicate the historical P/E and dividend yields of the market.
Weekly highlights:
- Imperial Bank liquidation
During the week, the Central Bank of Kenya, (CBK), announced that it had approved the liquidation of Imperial Bank Limited In Receivership, (IBLIR,) in order to pave way for the sale of IBLIR’s remaining assets to settle any existing debts to depositors and creditors. This follows the recommendation by Kenya Deposit Insurance Corporation (KDIC), the receiver, to liquidate the bank, coupled with a report from an external auditor that ascertained that winding down the lender was the only feasible option based on the weak status of IBLIR’s financial position. IBLIR was put under receivership by the CBK on 13th October 2015 due to irregularities and malpractices in the bank which exposed depositors, creditors and the banking sector to financial risk. At the time of receivership, IBLIR had 32 branches, Kshs 70.3 bn (as of 30th June 2015) worth of assets, and Kshs 58.1 bn worth of deposits, owed to 50,000 depositors.
In December 2015, CBK and KDIC announced that 44,300 depositors with deposits of less than Kshs 1.0 mn would get access to their full amounts, while the remaining 5,700 depositors would only access up to 1.0 mn of their deposits. In June 2020, KCB Bank acquired certain assets of IBLIR totalling Kshs 3.2 bn and an equivalent amount of liabilities. For more information, please see our Cytonn Weekly #49/2020.
However, the paid amounts do not include other creditors such as the Kshs 2.0 bn corporate bond that IBLIR, then Imperial Bank, floated in September 2015. It is also key to note that Imperial Bank had listed the Kshs 2.0 bn corporate bond just a month before its eventual collapse, which exposes the regulator for the bonds issuance, the Capital Markets Authority, (CMA), to scrutiny as the listing should not have proceeded under the institution’s financial health. We are of the view that confidence in the financial markets is of paramount importance for any economy. Therefore, the liquidation of IBLIR is a welcome move as it will allow for settling of the remaining amounts owed to the various parties. However, we believe that the CBK should put in sufficient mechanisms to protect depositor’s funds through better supervision of the banking sector.
- Central Bank of Kenya Amendment Act, 2021
During the week, President Uhuru Kenyatta recently signed into law the Central Bank of Kenya (CBK) Amendment Act, 2021 which confers the CBK powers to regulate the digital lending services sector and aims to amend the Central Bank of Kenya Act Chapter 491 to provide and allow for the licensing of digital credit service providers, who are currently not regulated. The act also defines relevant terms for the business of digital credit lending where a digital credit provider is a person licensed by the CBK to carry on digital credit business while a digital credit business is one of providing credit facilities or loan services through a digital channel. Further, the act aims to provide for a fair and non-discriminatory marketplace for access to credit. In order to achieve this, CBK will have the power to;
- License digital credit providers,
- Determine capital adequacy requirements for digital credit providers,
- Determine the minimum liquidity requirements for digital credit providers,
- Approve digital channels and business models through which digital credit business may be conducted,
- Supervise digital credit providers,
- Suspend or revoke a license, and,
- Direct or require changes as the CBK may consider necessary.
The above will be effected through subsequent provisions of the Act which will grant the CBK the ability to make regulations on;
- Registration requirement for digital credit businesses,
- Management requirements for digital credit providers,
- Permissible and prohibited activities,
- Anti-money laundering and measures for countering financing terrorism,
- Credit information sharing,
- Data protection,
- Consumer protection,
- Reporting requirements for digital credit providers,
- Offences and penalties, and,
- Such other measures necessary for regulation of digital lending.
The CBK will have a period of three months to make any regulations aimed at regulating the digital lending space. For businesses providing credit facilities or credit facilities through a digital channel and are not regulated under any other law, they will be required to register with the CBK within six months of coming into force of this Act. This excludes digital service lenders operating under their parent banks as they are regulated by the Banking Act. Any digital credit provider who operates without a license will be susceptible to a fine not exceeding Kshs 5.0 mn or to imprisonment upon conviction for a term not exceeding three (3) years or both.
The Act is a step in the right direction towards streamlining the lending digital lending services sector and will weed out unscrupulous digital lenders who have taken advantage of the unregulated space to infringe on various consumer rights and privacy. This is not only a win for the consumers but also a win for the lenders who will acquire licenses to increase their market share and operate in a better environment. Given that the Act does not provide for capping of interest rates for digital lending, we believe that CBK, through the regulations, will provide an enabling environment by allowing the lenders to continue using their risk and pricing models rather than set interest caps for digital lenders. We also expect the CBK to avoid setting high minimum capital adequacy and liquidity requirements for the digital lenders seeing they are not deposit taking institutions and would be counterproductive to their purpose.
Universe of coverage:
|
Company |
Price as at 03/12/2021 |
Price as at 10/12/2021 |
w/w change |
YTD Change |
Year Open 2021 |
Target Price* |
Dividend Yield |
Upside/ Downside** |
P/TBv Multiple |
Recommendation |
|
Kenya Reinsurance |
2.3 |
2.3 |
(1.3%) |
(0.9%) |
2.3 |
3.3 |
8.7% |
53.6% |
0.2x |
Buy |
|
I&M Group*** |
20.6 |
21.0 |
1.7% |
(53.3%) |
44.9 |
24.4 |
10.7% |
27.1% |
0.6x |
Buy |
|
KCB Group*** |
41.2 |
43.3 |
5.1% |
12.6% |
38.4 |
51.4 |
2.3% |
21.0% |
0.9x |
Buy |
|
Britam |
6.9 |
7.0 |
0.6% |
(0.3%) |
7.0 |
8.3 |
0.0% |
19.5% |
1.2x |
Accumulate |
|
Standard Chartered*** |
129.0 |
127.0 |
(1.6%) |
(12.1%) |
144.5 |
137.7 |
8.3% |
16.7% |
1.0x |
Accumulate |
|
NCBA*** |
24.0 |
24.1 |
0.2% |
(9.6%) |
26.6 |
26.4 |
6.2% |
16.0% |
0.6x |
Accumulate |
|
Co-op Bank*** |
11.8 |
12.2 |
3.4% |
(2.8%) |
12.6 |
13.1 |
8.2% |
15.2% |
0.9x |
Accumulate |
|
Jubilee Holdings |
339.8 |
336.0 |
(1.1%) |
21.8% |
275.8 |
371.5 |
2.7% |
13.2% |
0.6x |
Accumulate |
|
Equity Group*** |
46.6 |
47.5 |
1.9% |
31.0% |
36.3 |
52.5 |
0.0% |
10.6% |
1.2x |
Accumulate |
|
Diamond Trust Bank*** |
55.3 |
56.0 |
1.4% |
(27.0%) |
76.8 |
61.8 |
0.0% |
10.3% |
0.2x |
Accumulate |
|
Liberty Holdings |
7.0 |
7.2 |
2.6% |
(7.0%) |
7.7 |
7.8 |
0.0% |
8.6% |
0.5x |
Hold |
|
ABSA Bank*** |
11.1 |
11.1 |
0.0% |
16.1% |
9.5 |
11.9 |
0.0% |
7.7% |
1.1x |
Hold |
|
Stanbic Holdings |
90.5 |
92.3 |
1.9% |
8.5% |
85.0 |
94.7 |
4.1% |
6.8% |
0.8x |
Hold |
|
Sanlam |
11.5 |
11.5 |
0.0% |
(11.5%) |
13.0 |
12.1 |
0.0% |
5.3% |
1.2x |
Hold |
|
CIC Group |
2.2 |
2.2 |
0.0% |
2.4% |
2.1 |
2.0 |
0.0% |
(5.4%) |
0.7x |
Sell |
|
HF Group |
4.1 |
4.0 |
(3.2%) |
26.4% |
3.1 |
3.0 |
0.0% |
(25.6%) |
0.2x |
Sell |
|
*Target Price as per Cytonn Analyst estimates **Upside/ (Downside) is adjusted for Dividend Yield ***For Disclosure, these are stocks in which Cytonn and/or its affiliates are invested in Key to note, I&M Holdings YTD share price change is mainly attributable to the counter trading ex-bonus issue |
||||||||||
We are “Neutral” on the Equities markets in the short term. With the market currently trading at a premium to its future growth (PEG Ratio at 1.3x), we believe that investors should reposition towards companies with a strong earnings growth and are trading at discounts to their intrinsic value. We expect the discovery of new COVID-19 variants coupled with slow vaccine rollout in developing economies to continue weighing down the economic outlook. On the upside, we believe that the recent relaxation of lockdown measures in the country will lead to improved investor sentiments in the economy.
- Industry Reports
During the week, the Central Bank of Kenya (CBK) released the Monetary Policy Committee Hotels Survey - November 2021, aimed at assessing the extent of recovery of hotels between October and November 2021. The key take outs from the survey were;
- Overall, all the sampled hotels indicated that they were in operation between October and November 2021, representing a 4.0% points increase from the 96.0% operation rate in September 2021. This was attributable to the reopening of some hotels that had previously been closed due to low business resulting to underperformance as a result of COVID-19 regulations. The graph below shows the overall percentage of the number of operating hotels in Kenya between January – November 2021;
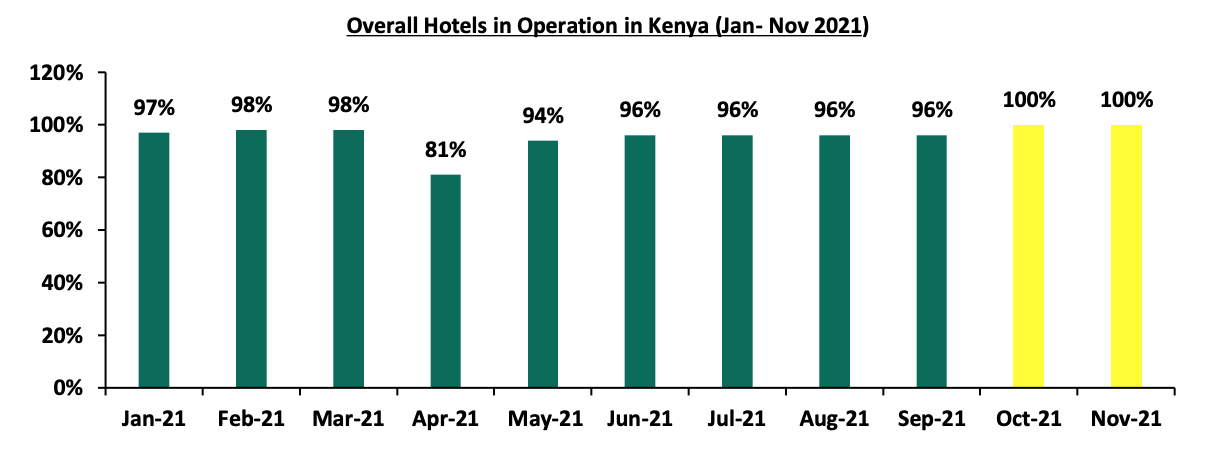
Source: Central Bank of Kenya (CBK)
- The average bed occupancy in the month of October averaged at 56.0%, 18.0% and 4.0% points higher than 38.0% and 52.0% recorded in the months of September and November, respectively. This was attributable to increased demand for hotels during the school holidays in the first weeks of October, particularly in Mombasa and Nairobi. The graph below highlights the hotel bed occupancy rates in Kenya between January - November 2021;
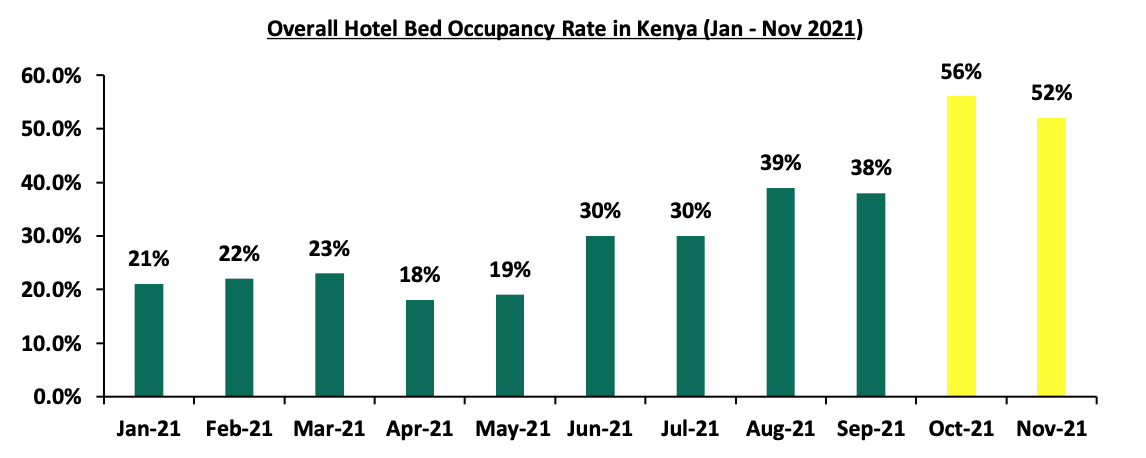
Source: Central Bank of Kenya (CBK)
- Overall, local guests continued to account for majority of clientele population at 75.5% of accommodation and 76.4% restaurant services between October and November 2021, compared to 62.0% and 68.7%, respectively, during the period before the COVID-19 pandemic. The share of foreign clientele in accommodation increased between August-September and October-November by 5.8% points to 24.5%, from 18.7%, respectively. Clients in the restaurant services also increased in the same period by 2.5% points to 23.6%, from 21.1%, following the increased tourist arrivals during the period. The graphs below indicate the summaries of accommodation and restaurant clients served by hotels in Kenya;
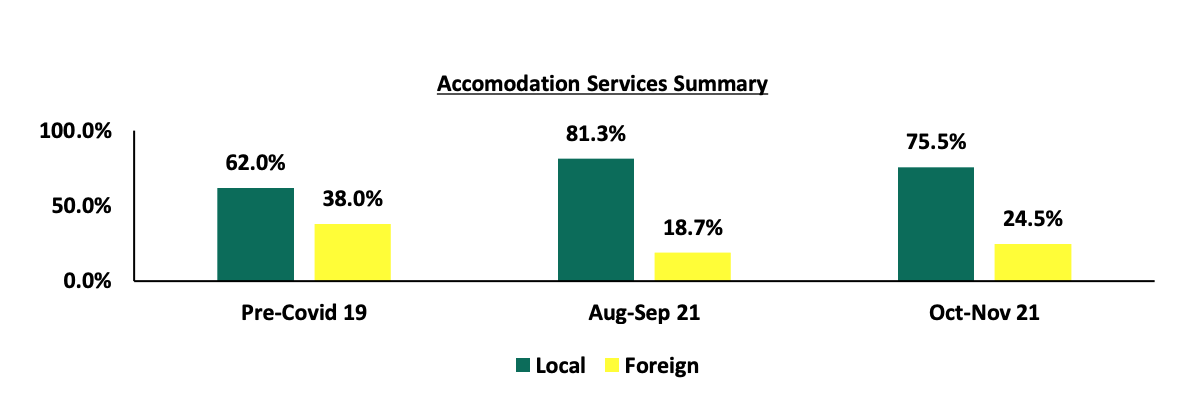
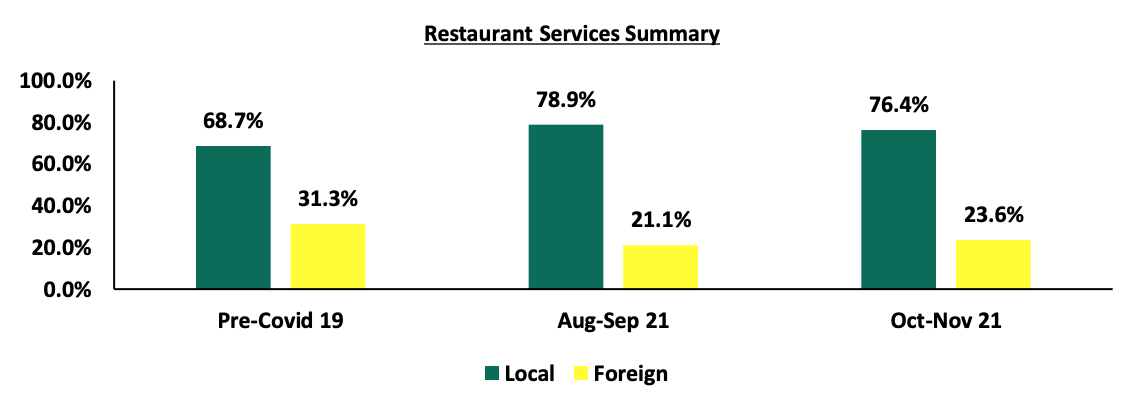
Source: Central Bank of Kenya (CBK)
The MPC hotel survey points to an overall improvement in the general operating environment of hotels evidenced by the increased number of hotels in operations, bed occupancy levels, and share of foreign clientele. We expect the hospitality sector to register improved performance attributed to; i) continued vaccination activities boosting travel confidence into the country, ii) aggressive local and international marketing of Kenya’s Hospitality Industry through price discounts and mobilization through the Magical Kenya Platform, and, iii) support events by the Ministry of Tourism such as the World Rally Championship (WRC) expected to be hosted in Kenya annually until 2026. However, the sector is likely to be weighed down by the uncertainty brought about by COVID-19 Omicron variant which may trigger the return of measures and restrictions such as travel and public gathering bans that have been lifted for now.
- Retail Sector
During the week, Naivas Supermarket opened two new outlets. The first is located at Oasis Mall in Malindi, Kilifi County, taking 28,000 SQFT of space previously occupied by Nakumatt, while the second is located in Embakasi off Airport North Road, Nairobi County taking 27,000 SQFT of space previously occupied by Tuskys Supermarket. This brings its total outlets to 79, making it the leading retailer in the country. Naivas also announced plans to open another outlet at Greenspan Mall in Donholm before the end of the year, a move that will see it take 57,000 SQFT of space previously occupied by Tuskys. The retailer has been on an expansion spree having opened 10 outlets this year, compared to other retailers such as Quickmart and Carrefour which have opened 9 and 5 branches, respectively. The signing of the Kshs 6.0 bn agreement with International Finance Corporation (IFC), private equity firm Amethis and German sovereign wealth fund DEG to sell a 30.0% stake in 2020 has also aided in accelerating growth for the retailer.
The retailer’s decision to take over spaces in Embakasi is supported by presence of a good transport network as the area is served by Airport North Road which will enhance client and supplier accessibility and the presence of the prime space left by Tuskys. In terms of performance, according to Cytonn Q3’2021 Markets Review Report, Eastlands where Embakasi is classified, recorded average rent per SQFT of Kshs 135, which is 19.6% points lower than the market average of Kshs 168 per SQFT. This signifies the retailer’s decision to invest in the area due to affordability of the retail spaces. The affordability of the area has continued to increase demand for space in the area but has not quite picked pace due to fewer social amenities and poor infrastructure.
The table below shows the submarket performance of nodes in the Nairobi Metropolitan Area (NMA) in Q3’2021;
|
Summary NMA Submarket Retail Performance – Q3’2021 |
|||
|
Area |
Rent (Kshs)/SQFT Q3’2021 |
Occupancy % Q3’2021 |
Rental Yield Q3’ 2021 |
|
Westlands |
209 |
80.4% |
9.7% |
|
Karen |
214 |
80.8% |
9.4% |
|
Kilimani |
172 |
83.6% |
9.0% |
|
Ngong Road |
175 |
78.0% |
7.8% |
|
Kiambu road |
178 |
70.4% |
7.2% |
|
Thika Road |
158 |
74.2% |
6.7% |
|
Satellite towns |
138 |
72.2% |
6.1% |
|
Mombasa road |
136 |
70.5% |
6.0% |
|
Eastlands |
135 |
72.5% |
5.9% |
|
Average |
168 |
75.8% |
7.5% |
Source: Cytonn Research 2021
For Malindi, the retailer’s expansion is supported by; i) positive demographics with Kilifi county having a population of 1.5 mn persons in 2019, which was a 23.7% growth from the 1.1 mn persons recorded in 2009, ii) adequate infrastructure network as the area is served by Malindi Road, iii) availability of prime retail spaces as the firm is expected to take up space previously occupied by Nakumatt, and, iv) the area’s recognition as a major tourist destination in Kenya, guaranteeing footfall.
Overall, according to our 2021 Retail Report, the Kenyan retail sector performance recorded a 0.1% increase in average rental yield to 6.8% in 2021 from 6.7% in 2020. Average occupancy rates also increased by 1.8% points to 78.4% in 2021 from 76.6% in 2020, as a result of local and international expansions facilitated by an improving business environment. The table below shows the summary of the number of stores of the Key local and international retailer supermarket chains in Kenya;
|
Main Local and International Retail Supermarket Chains |
|||||||||
|
Name of Retailer |
Category |
Highest number of branches that have ever existed as at FY’2018 |
Highest number of branches that have ever existed as at FY’2019 |
Highest number of branches that have ever existed as at FY’2020 |
Number of branches opened in 2021 |
Closed branches |
Current number of Branches |
Number of branches expected to be opened |
Projected number of branches FY’2021 |
|
Naivas |
Local |
46 |
61 |
69 |
10 |
0 |
79 |
1 |
80 |
|
QuickMart |
Local |
10 |
29 |
37 |
9 |
0 |
46 |
0 |
46 |
|
Chandarana |
Local |
14 |
19 |
20 |
1 |
0 |
22 |
1 |
23 |
|
Carrefour |
International |
6 |
7 |
9 |
5 |
0 |
16 |
0 |
16 |
|
Cleanshelf |
Local |
9 |
10 |
11 |
1 |
0 |
12 |
0 |
12 |
|
Tuskys |
Local |
53 |
64 |
64 |
0 |
61 |
3 |
0 |
3 |
|
Game Stores |
International |
2 |
2 |
3 |
0 |
0 |
3 |
0 |
3 |
|
Uchumi |
Local |
37 |
37 |
37 |
0 |
35 |
2 |
0 |
2 |
|
Choppies |
International |
13 |
15 |
15 |
0 |
13 |
2 |
0 |
2 |
|
Shoprite |
International |
2 |
4 |
4 |
0 |
4 |
0 |
0 |
0 |
|
Nakumatt |
Local |
65 |
65 |
65 |
0 |
65 |
0 |
0 |
0 |
|
Total |
|
257 |
313 |
334 |
26 |
178 |
185 |
2 |
187 |
Source: Online Search
We expect the continued expansion by local and international retailers to cushion the performance of the retail sector, with approximately 26 outlets so far opened in 2021. This will be supported by;
- A favourable business environment following the lifting of the COVID-19 containment measures,
- Presence of prime retail spaces left by beleaguered retailers such as Nakumatt and Tuskys who have since closed most of their operations, and,
- Government’s continued infrastructure developments which will enhance accessibility by clients, thereby increasing footfall.
However, the performance of the retail sector is expected to be weighed down by the oversupply in the retail market at 3.0 mn SQFT in the Nairobi Metropolitan Area (NMA) and 1.7 mn SQFT in Kenya’s retail market, and, the rise of rival e-commerce platforms such as Jumia which are slowly gaining traction and reducing the mainstream retailers’ market share.
- Statutory Reviews
During the week, President Uhuru Kenyatta signed the Public Private Partnerships (PPP) Bill 2021 into law. The Act aims to address the shortcomings of the PPP Act 2013 by including a streamlined project processes with clear timelines, expanded procurement options and robust processes for privately initiated investment proposals. They key take outs from the Act are;
- The law has established the Directorate of Public Private Partnerships to replace the PPP Unit under 2013 legislation, and conferred broad but separate functions from those of a PPP Committee. The Directorate shall be the lead institution in the implementation of PPP projects. This will include guiding the selection of PPP projects, overseeing project appraisals as well as contract management frameworks for projects. This is in an aim to establish open, efficient and equitable processes for the implementation, management and monitoring of projects,
- Concession period for investors involved in State-owned Build-Operate-Transfer (BoT) projects to be capped at 30 years. The timeline set is assumed sufficient for investors to recoup their major initial investments. However, in setting timelines within this range, the contracting authorities must take into account the lifespan of the technology used, investment standards required, economic and financial viability, and, the consideration for maintaining delivery standards,
- The new law expands the role of the private sector in PPP initiatives beyond financing to include construction, operation and maintenance of the projects. It also adds a number of permissible contract structures, including public-private joint ventures and strategic partnerships. The effect of these changes is to broaden the scope of what is classed as a PPP, funnelling more contracting arrangements between the public and private sector, and,
- The County Governments can enter into PPP agreements with a private party and shall be responsible for administration of the entire project after conducting a feasibility study. After approval by the county assembly, the counties are expected to submit a list of projects to the Directorate of Public Private Partnerships for inclusion in the published national list of projects. The counties will be operating under an expanded procurement process with the inclusion of direct procurement and a greater clarification on timelines. This includes the period within which bids must be evaluated and for appeals by bidders.
The table below shows some of the projects currently being undertaken through the PPP initiative in Kenya;
|
Major Real Estate Public-Private Partnership Projects in Kenya |
|||||
|
Theme |
Project |
Partnership |
Project Start Date |
Project Status |
Expected Date of Completion |
|
Infrastructure |
Nairobi Express Way |
National Government and a Private Company |
October 2020 |
Ongoing |
March 2022 |
|
Lamu Port South Sudan Ethiopia Transport (LAPPSET) Berth III |
Kenya, Ethiopia and South Sudan, and Development Bank of South Africa, European Union and African Development Bank |
June 2018 |
Ongoing |
June 2022 |
|
|
Nairobi-Western By Pass |
National Government and China Exim Bank |
February 2020 |
Ongoing |
March 2022 |
|
|
Affordable Housing |
River Estate, Ngara |
National Government and Edderman Property Limited |
March 2019 |
Ongoing |
February 2022 |
|
Pangani Housing Project |
National Government and Tecnofin Kenya Limited |
May 2020 |
Ongoing |
May 2022 |
|
Source; Kenya PPP Platform
The Act is expected to align Kenya's PPPs with international best standards and attempt to address the shortcomings of the 2013 Act. The institutional and operational changes are expected to make a more investor-friendly process to counter the challenges currently being experienced in the sector. Some of these challenges include; i) inadequate planning, ii) insufficient regulatory framework to manage complex PPP transactions, iii) irregularities in the procurement processes, iv) high costs for funding projects, and, v) lengthy approval processes.
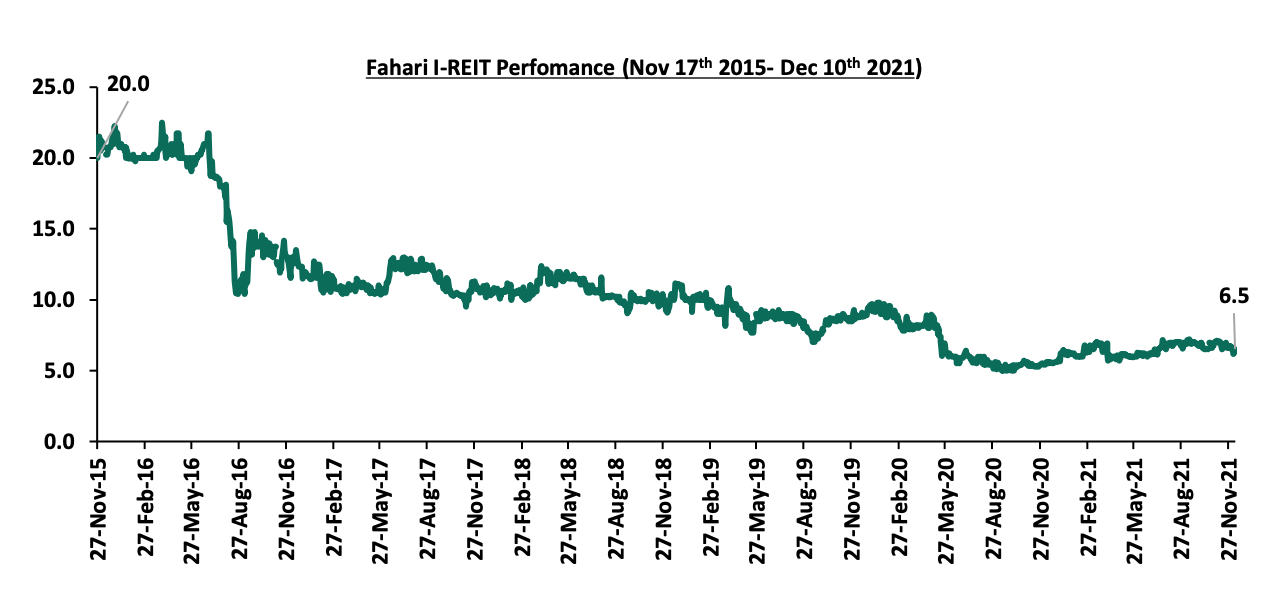
- REIT Performance
During the week, the Fahari I-REIT declined by 2.4% to close at Kshs 6.5 per share compared to last week’s Kshs 6.7 per share. On a YTD basis, the REIT has gained by 15.6% from Kshs 5.6 per share recorded at the beginning of the year. However, on an Inception to Date (ITD) basis, the REIT has declined by 67.4% compared to the listing price of Kshs 20.0 per share. The Kenyan REIT market continues to record subdued performance, forming a mere 0.04% of the total market cap compared to the REIT Market in South Africa at 1.6% of the total market capitalization. This is due to constraining factors such as i) lack of general knowledge about the REIT market and products, ii) high minimum investment amounts set at Kshs 5.0 mn for the D-REIT which is 100x the median income at Kshs 50,000, iii) lengthy regulatory processes discouraging promoters, and, iv) few REIT Trustees currently at 3, due to the high minimum requirements at Kshs 100.0 mn.
The graph below shows the Fahari I-REIT performance from 27th Nov 2015- 10th Dec 2021;
We expect the Real Estate sector to be supported by improving business environment supporting the performance of the hospitality sector, continued expansion of the retailers taking up spaces left by struggling ones and the enactment of progressive legislations to support projects through partnerships in the country.
Following the release of the Q3’2021 results by Kenyan listed banks, the Cytonn Financial Services Research Team undertook an analysis on the financial performance of the listed banks and identified the key factors that shaped the performance of the sector.
The Asset Quality for the listed banks improved in Q3’2021, with the gross NPL ratio declining by 0.4% points to 12.0%, from 12.4% in Q3’2020. We however note that despite this marginal improvement in the asset quality, the NPL ratio remains higher than the 10-year average of 8.1%. The listed banks’ management quality also improved, with the Cost of Income ratio improving by 12.0% points to 58.1%, from 70.1% recorded in Q3’2020, as banks continued to reduce their provisioning levels following the improved business environment during the period.
Consequently, Core Earnings per Share (EPS) recorded a weighted growth of 102.0% in Q3’2021, from a weighted decline of 32.4% recorded in Q3’2020. The performance is however skewed by the strong performance from ABSA, NCBA Group and KCB Group, which recorded core EPS growths of 328.3%, 159.0% and 131.4%, respectively.
The report is themed “Banking Sector Recovers due to Improved Asset and Management Quality” where we assess the key factors that influenced the performance of the banking sector in Q3’2021, the key trends, the challenges banks faced, and areas that will be crucial for growth and stability of the banking sector going forward. As such, we shall address the following:
- Key Themes That Shaped the Banking Sector Performance in Q3’2021,
- Summary of The Performance of the Listed Banking Sector in Q3’2021,
- The Focus Areas of the Banking Sector Players Going Forward, and,
- Brief Summary and Ranking of the Listed Banks based on the Outcome of Our Analysis.
Section I: Key Themes That Shaped the Banking Sector Performance in Q3’2021
Below, we highlight the key themes that shaped the banking sector in Q3’2021 which include; regulations, regional expansion through mergers and acquisitions, asset quality and capital raising for onward lending:
- Regulation:
-
- Decrease in Capital Adequacy risk weighting for all residential mortgages: The Central Bank of Kenya (CBK) published the Banking Circular No 2 of 2021, indicating that they had reduced the capital adequacy risk weighting for all residential mortgages to 35.0% from 50.0%, effective 1st July 2021. The move by CBK to reduce the capital adequacy risk weighting aims at creating an enabling environment for the banking sector to be able to lend more to the domestic residential mortgage market through availing long-term and secured funds to primary mortgage lenders. However, banks have recently been seen taking precautionary measures such as conducting frequent evaluations and demanding additional security from borrowers using real estate as collateral during the loan repayment period in the event that the value of the existing collateral drops to a level below that of the loan. Additionally, banks are anticipated to only accept collateral whose value is seven times bigger than the value of the loan being applied for.
Other regulations/ guidelines issued after Q3’2021 include;
-
- Integration of Climate-Related Risk Management: The Central Bank of Kenya (CBK) released Guidance on Climate-Related Risk Management, highlighting that all banks and mortgage finance companies ought to integrate the risks and opportunities arising from climate change in their risk management, strategy and governance structure. Opportunities expected to arise from climate change include financing activities such as the transition to renewable energy, appropriate housing, resilient infrastructure and innovative agricultural practices. On the other hand, banks are expected to build their capacity going forward to identify and mitigate the risks arising from climate change, and,
- Suspension of the Listing of Borrower’s Negative Credit Information: The Central Bank of Kenya (CBK) announced a 12 months suspension of listing of negative credit information for borrowers with loans below Kshs 5.0 mn, whose loans were performing previously, but have become non-performing from 1st October, 2021. The move by the CBK is an intervention measure aiming to cushion Micro Small and Medium Enterprises from adverse effects of the COVID-19 pandemic. We expect banks to be more cautious towards lending to MSMEs due to lack of adequate credit risk information on potential loan borrowers.
- Regional Expansion through Mergers and Acquisitions: Kenyan banks are looking at having an extensive regional reach and to this end, the following were the major M&A’s activities announced in Q3’2021:
-
- On 25th August 2021, KCB Group announced that it had completed the 62.1% acquisition of Banque Populaire du Rwanda Plc (BPR), after receiving all the required regulatory approvals. KCB Group and Atlas Mara Limited had signed a definitive agreement in November 2020 for KCB’s acquisition of a 62.1% stake in BPR subject to shareholder and regulatory approval. In May 2021, KCB Group disclosed that it made an offer to the remaining BPR shareholders to raise its acquisition stake in the bank to 100.0% from 62.1% and received shareholders’ approval for the acquisitions, with only regulatory approval pending for the finalization of the transactions. As highlighted in our Cytonn Weekly #29/2021 and Cytonn Weekly #19/2021, KCB Group agreed to purchase 62.1% stake in BPR from Atlas Mara Limited using a Price to Book Value (P/Bv) of 1.1x. According to the latest BPR financials released as of June 2021, the bank had a book value of Rwf 52.9 bn (Kshs 5.8 bn), and thus at the trading multiple of 1.1x, we expect KCB Group to have spent an estimated Kshs 6.3 bn to acquire BPR Rwanda. For more information on the acquisition, see our Cytonn Weekly #19/2021.
Other mergers and acquisitions activities announced after Q3’2021 include;
-
- On 8th November 2021, I&M Group PLC announced the rebranding of Uganda’s Orient Bank Limited (OBL) to I&M Bank (Uganda) Limited following the launch of the bank’s operations in Uganda. The rebrand comes six months after I&M Holding PLC announced the completion of the 90.0% acquisition of Orient Bank Limited Uganda (OBL) on 30th April 2021 and after receiving all the required regulatory approvals. As highlighted in our Cytonn Weekly #18/2021, I&M Holdings was to take over 14 branches from Orient Bank Limited Uganda (OBL), taking its total branches to 80, from 66 branches as at the end of 2020. For more information, see our Cytonn Weekly #45/2021, and,
- On 2nd December 2021, KCB announced the termination of their initial plans to acquire a 100.0% stake in African Banking Corporation Limited (ABC Tanzania) following the failure to receive certain regulatory approvals. In November 2020, KCB Group and Atlas Mara Limited came to an agreement for KCB to acquire a 62.1% stake in Banque Populaire Du Rwanda (BPR) and a 100.0% stake in Africa Banking Corporation Tanzania Limited (BancABC), subject to shareholder and regulatory approval in the respective countries. The transaction would have seen KCB spend collectively USD 56.9 mn (Kshs 6.4 bn) in the acquisition of Banque Populaire du Rwanda Plc (BPR) Rwanda and African Banking Corporation (ABC) Tanzania. However, despite the cancellation of the acquisition plans, KCB has assured its shareholders that it will continue pursuing attractive regional expansion opportunities to enhance their regional participation and accelerate growth. For more information on, see our Cytonn Monthly – November.
We expect to see continued consolidation by the Kenyan banking sector as the weaker banks are merged with the big banks to form a stronger banking system. The COVID-19 pandemic exposed the weak banks in the industry which might need to be acquired by larger banks in order to boost their capital adequacy and liquidity ratios to the required minimum statutory levels. We also expect to see Kenyan banks continue to diversify into other African regions as they look to reduce their reliance on the Kenyan Market.
Below is a summary of the deals in the last 7 years that have either happened, been announced or expected to be concluded:
|
Acquirer |
Bank Acquired |
Book Value at Acquisition (Kshs bn) |
Transaction Stake |
Transaction Value (Kshs bn) |
P/Bv Multiple |
Date |
|
I&M Holdings PLC |
Orient Bank Limited Uganda |
3.3 |
90.0% |
3.6 |
1.1x |
April-21 |
|
KCB Group |
Banque Populaire du Rwanda |
5.3 |
100.0% |
5.6 |
1.1x |
August 2021 |
|
KCB Group** |
ABC Tanzania |
Unknown |
100% |
0.8 |
0.4x |
Nov-20* |
|
Co-operative Bank |
Jamii Bora Bank |
3.4 |
90.0% |
1 |
0.3x |
Aug-20 |
|
Commercial International Bank |
Mayfair Bank Limited |
1 |
51.0% |
Undisclosed |
N/D |
May-20* |
|
Access Bank PLC (Nigeria) |
Transnational Bank PLC. |
1.9 |
100.0% |
1.4 |
0.7x |
Feb-20* |
|
Equity Group ** |
Banque Commerciale Du Congo |
8.9 |
66.5% |
10.3 |
1.2x |
Nov-19* |
|
KCB Group |
National Bank of Kenya |
7 |
100.0% |
6.6 |
0.9x |
Sep-19 |
|
CBA Group |
NIC Group |
33.5 |
53%:47% |
23 |
0.7x |
Sep-19 |
|
Oiko Credit |
Credit Bank |
3 |
22.8% |
1 |
1.5x |
Aug-19 |
|
CBA Group** |
Jamii Bora Bank |
3.4 |
100.0% |
1.4 |
0.4x |
Jan-19 |
|
AfricInvest Azure |
Prime Bank |
21.2 |
24.2% |
5.1 |
1.0x |
Jan-18 |
|
KCB Group |
Imperial Bank |
Unknown |
Undisclosed |
Undisclosed |
N/A |
Dec-18 |
|
SBM Bank Kenya |
Chase Bank Ltd |
Unknown |
75.0% |
Undisclosed |
N/A |
Aug-18 |
|
DTBK |
Habib Bank Kenya |
2.4 |
100.0% |
1.8 |
0.8x |
Mar-17 |
|
SBM Holdings |
Fidelity Commercial Bank |
1.8 |
100.0% |
2.8 |
1.6x |
Nov-16 |
|
M Bank |
Oriental Commercial Bank |
1.8 |
51.0% |
1.3 |
1.4x |
Jun-16 |
|
I&M Holdings |
Giro Commercial Bank |
3 |
100.0% |
5 |
1.7x |
Jun-16 |
|
Mwalimu SACCO |
Equatorial Commercial Bank |
1.2 |
75.0% |
2.6 |
2.3x |
Mar-15 |
|
Centum |
K-Rep Bank |
2.1 |
66.0% |
2.5 |
1.8x |
Jul-14 |
|
GT Bank |
Fina Bank Group |
3.9 |
70.0% |
8.6 |
3.2x |
Nov-13 |
|
Average |
|
|
76.7% |
|
1.3x |
|
|
* Announcement Date ** Deals that were dropped |
||||||
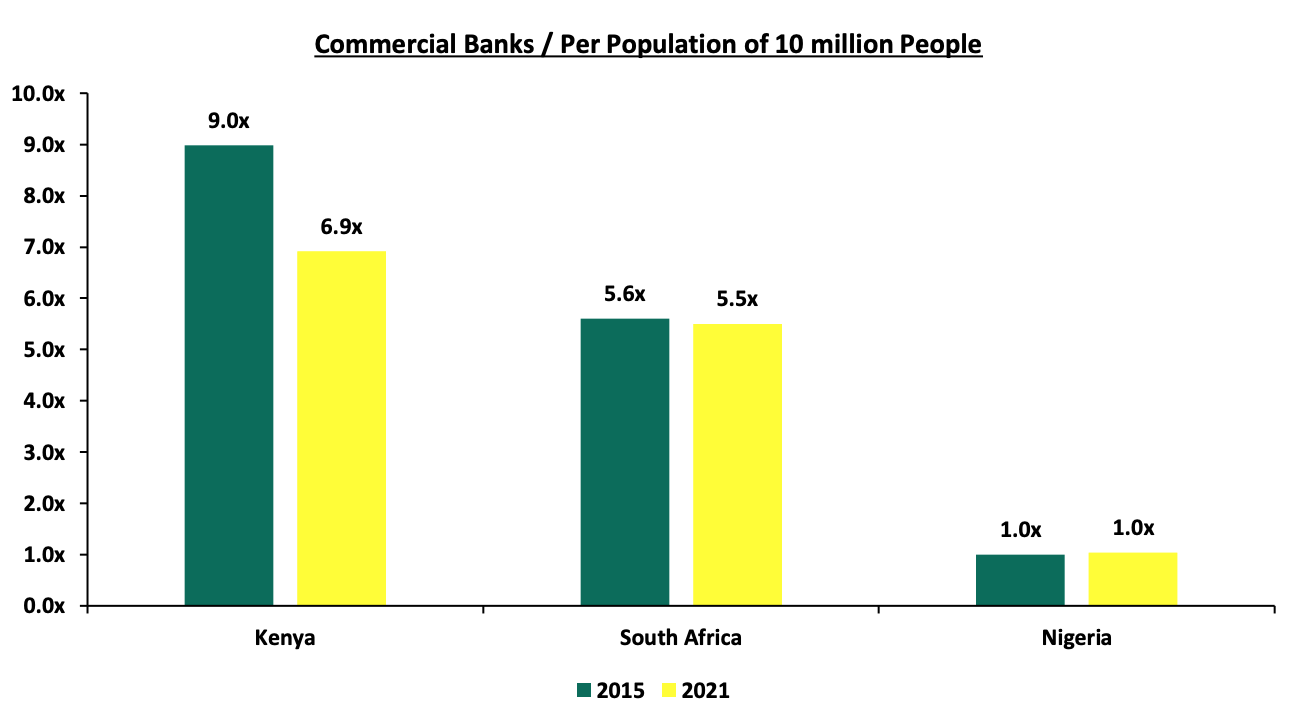
The number of commercial banks in Kenya currently stands at 38, compared to 43 banks 6-years ago. The ratio of the number of banks per 10 million population in Kenya now stands at 6.9x, which is a reduction from 9.0x 6-years ago, demonstrating continued consolidation of the banking sector. However, despite the ratio improving, Kenya still remains overbanked as the number of banks remains relatively high compared to the population. For more on this see our topical.
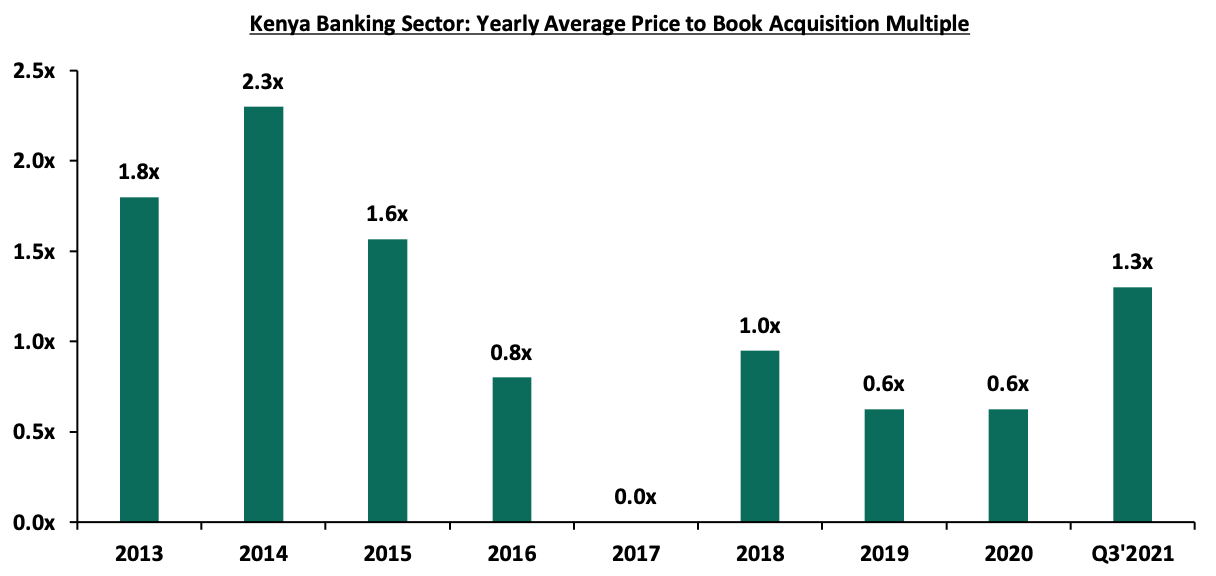
The acquisition valuations for banks has been recovering, with the valuations increasing from the average of 0.6x in 2020 to 1.3x so far in 2021. This however still remains low compared to historical prices paid as highlighted in the chart below;
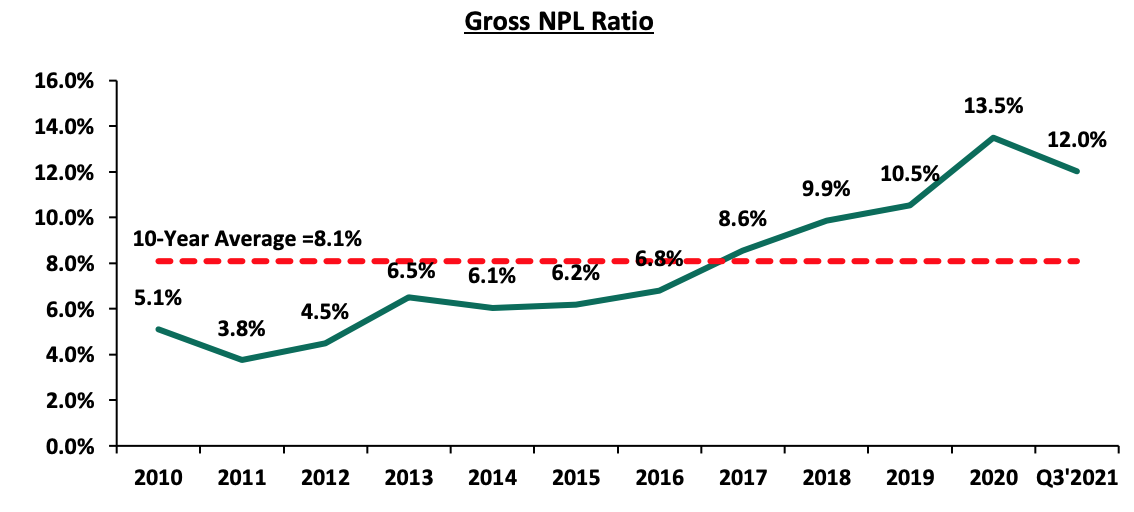
- Asset Quality: Asset quality for listed banks improved in Q3’2021, albeit marginally, with the Gross NPL ratio declining by 0.4% points to 12.0%, from 12.4% in Q3’2020. The improvement in asset quality is attributable to the declining credit risk on the back of the improving operating environment. The NPL coverage rose to 65.1% in Q3’2021, from 59.2% recorded in Q3’2020, in accordance with IFRS 9, where banks are expected to provide both for the incurred and expected credit losses. According to the September 2021 MPC Press Release, the NPL ratio for the entire banking sector stood at 13.9% as at August 2021, an improvement from the 14.0% in June 2021, signifying an improvement in asset quality for the sector in Q3’2021.
The chart below highlights the asset quality trend:
The table below highlights the asset quality for the listed banking sector:
|
|
Q3’2020 NPL Ratio** |
Q3’2021 NPL Ratio* |
Q3’2020 NPL Coverage** |
Q3’2021 NPL Coverage* |
% point change in NPL Ratio |
% point change in NPL Coverage |
|
ABSA Bank Kenya |
7.6% |
8.1% |
64.9% |
74.5% |
0.5% |
9.6% |
|
Equity Group |
10.8% |
9.5% |
52.0% |
60.6% |
(1.3%) |
8.6% |
|
I&M Holdings |
11.2% |
10.2% |
66.8% |
70.6% |
(1.0%) |
3.8% |
|
Stanbic Bank |
12.3% |
11.5% |
61.8% |
54.9% |
(0.8%) |
(6.9%) |
|
Diamond Trust Bank |
8.7% |
11.9% |
62.5% |
40.0% |
3.2% |
(22.5%) |
|
KCB |
15.3% |
13.7% |
58.5% |
63.4% |
(1.6%) |
4.9% |
|
Co-operative Bank of Kenya |
13.2% |
14.6% |
50.1% |
65.5% |
1.4% |
15.4% |
|
Standard Chartered Bank Kenya |
14.8% |
15.3% |
78.2% |
82.8% |
0.5% |
4.6% |
|
NCBA Group |
14.1% |
17.0% |
58.3% |
70.2% |
2.9% |
11.9% |
|
HF Group |
25.4% |
22.0% |
58.2% |
68.9% |
(3.4%) |
10.7% |
|
Mkt Weighted Average |
12.4% |
12.0% |
58.5% |
65.1% |
(0.4%) |
6.6% |
|
*Market cap weighted as at 10/12/2021 |
||||||
|
**Market cap weighted as at 01/12/2020 |
||||||
Key take-outs from the table include;
- Asset quality for the listed banks improved during the period, with the weighted average NPL ratio declining by 0.4% points to a market cap weighted average of 12.0%, from an average of 12.4% for the listed banking sector in Q3’2020. Key to note, the listed banks’ NPL ratio of 12.0% is a decline from the 12.7% recorded in Q2’2021, signifying improving asset quality in Q3’2021, but still remains higher than the 10-year average of 8.1%,
- NPL Coverage for the listed banks increased to a market cap weighted average of 65.1% in Q3’2021, from 58.5% recorded in Q3’2020, as the banks increased their provisioning levels due to the difficult economic conditions caused by the pandemic. Banks are expected to continue over-provisioning in 2021, albeit at a slower pace than in 2020,
- Housing Finance (HF) Group recorded the highest improvement in its asset quality, with its NPL ratio declining by 3.4% points to 22.0%, from 25.4% in Q3’2020. On the other hand, Diamond Trust Bank (DTB) recorded the highest increase in its NPL ratio, which increased by 3.2% points to 11.9%, from 8.7% recorded in Q3’2020, and,
- Notably, Diamond Trust Bank Kenya (DTB-K) reduced their NPL coverage to 40.0%, from 62.5% despite the NPL ratio rising to 11.9%, from 8.7% in Q3’2020. Had DTB-K maintained their NPL coverage at the 62.5% recorded in Q3’2020, the bank would have had an additional provisioning of Kshs 5.8 bn, which would have reduced the earnings per share from the reported Kshs 18.6 to Kshs 12.8.
- Capital Raising: In Q3’2021, listed banks’ continued borrowing from international institutions to not only strengthen their capital position but to also boost their lending ability to the perceived riskier Micro, Small and Medium Sized Enterprises (MSMEs) segment. The capital raising however slowed down in Q3’2021 after significant activity in H1’2021. In October 2021, Proparco, a private sector financing arm of Agence Française de Dévelopement Group (AFD Group), granted Equity Bank two guarantee facilities totalling Kshs 5.0 bn (€ 39.0 mn) for onward lending to MSMEs and a Kshs 70.0 mn (€ 550,000) technical assistance grant to support Equity Group Foundation’s health projects. Additionally, in November 2021, the Co-operative Bank of Kenya received Kshs 6.3 bn (USD 56.1 mn) from the European Investment Bank for lending to MSME firms with up to 250 workers. The table below highlights the disclosed loan facilities that banks have secured for capital injection and lending to the MSMEs so far in 2021:
|
Bank |
Amount Borrowed For Onward Lending (Kshs bn) |
Purpose |
|
Equity Bank |
67.9* |
MSME lending |
|
KCB Bank |
16.4 |
MSME lending |
|
Cooperative Bank |
17.3*** |
MSME lending and Tier II Capital** |
|
I&M Bank |
5.4 |
MSME lending and Tier II Capital** |
|
Total |
107.0 |
|
|
*Includes a Kshs 2.6 bn grant offered by European Investment Bank (EIB) **Tier II Capital refers to a bank’s supplementary capital which includes senior debt (debt that a company must repay first before going out of business) with a tenure of not less than five years ***Includes a Kshs 6.3 bn loan from European Investment Bank (EIB) for onward lending to MSMEs |
||
Section II: Summary of the Performance of the Listed Banking Sector in Q3’2021:
The table below highlights the performance of the banking sector, showing the performance using several metrics, and the key take-outs of the performance;
|
Bank |
Core EPS Growth |
Interest Income Growth |
Interest Expense Growth |
Net Interest Income Growth |
Net Interest Margin |
Non-Funded Income Growth |
NFI to Total Operating Income |
Growth in Total Fees & Commissions |
Deposit Growth |
Growth in Government Securities |
Loan to Deposit Ratio |
Loan Growth |
Return on Average Equity |
|
ABSA |
328.3% |
1.3% |
(19.1%) |
8.6% |
7.0% |
5.2% |
32.0% |
11.9% |
9.0% |
(5.6%) |
85.2% |
9.5% |
21.1% |
|
NCBA |
159.0% |
16.2% |
10.8% |
17.9% |
8.4% |
10.3% |
29.4% |
1.2% |
11.2% |
6.9% |
75.9% |
12.9% |
22.7% |
|
KCB |
131.4% |
28.7% |
45.0% |
23.3% |
7.0% |
28.8% |
39.7% |
34.2% |
26.6% |
25.8% |
63.9% |
23.2% |
22.2% |
|
Equity |
78.6% |
9.8% |
(1.3%) |
19.1% |
6.2% |
(0.2%) |
44.3% |
(4.3%) |
11.2% |
(14.1%) |
53.2% |
(4.6%) |
11.8% |
|
Stanbic |
43.2% |
(2.5%) |
(23.3%) |
2.8% |
6.7% |
19.1% |
33.9% |
17.9% |
6.4% |
(6.8%) |
51.0% |
0.1% |
14.5% |
|
SCBK |
33.7% |
0.5% |
(7.3%) |
12.2% |
6.2% |
4.2% |
42.6% |
(8.5%) |
(5.8%) |
(17.4%) |
83.0% |
11.2% |
14.0% |
|
I&M |
25.1% |
15.7% |
(5.2%) |
34.5% |
6.0% |
(3.5%) |
30.7% |
12.8% |
14.2% |
28.6% |
71.9% |
11.8% |
14.3% |
|
DTBK |
20.1% |
6.0% |
6.2% |
5.9% |
5.4% |
(4.9%) |
24.5% |
0.3% |
12.3% |
(2.7%) |
63.5% |
0.0% |
6.8% |
|
Co-op |
18.0% |
21.6% |
22.4% |
21.3% |
8.5% |
15.6% |
35.4% |
9.4% |
12.0% |
35.9% |
72.9% |
7.8% |
14.2% |
|
HF Group |
(22.0%) |
(18.4%) |
(21.2%) |
(14.8%) |
3.9% |
12.2% |
24.7% |
27.5% |
(1.3%) |
(9.5%) |
92.2% |
(7.9%) |
(19.0%) |
|
Q3'21 Mkt Weighted Average* |
102.0% |
15.9% |
14.9% |
16.9% |
7.3% |
14.3% |
35.2% |
13.8% |
14.3% |
11.7% |
69.7% |
12.4% |
18.7% |
|
Q3'20 Mkt Weighted Average** |
(32.4%) |
10.8% |
8.2% |
11.7% |
7.0% |
2.1% |
35.9% |
(7.9%) |
23.1% |
47.4% |
65.6% |
15.0% |
13.0% |
|
*Market cap weighted as at 10/12/2021 |
|||||||||||||
|
**Market cap weighted as at 01/12/2020 |
|||||||||||||
Key takeaways from the table above include:
- For the third quarter of 2021, core Earnings per Share (EPS) recorded a weighted average growth of 102.0%, compared to a weighted average decline of 32.4% in Q3’2020 for the listed banking sector. The performance is however largely skewed by the strong performance from ABSA, NCBA and KCB Group of 328.3%, 159.0% and 131.4%, respectively,
- The Banks have recorded a weighted average deposit growth of 14.3%, a decline from the 23.1% recorded in Q3’2020,
- Interest expense grew at a faster pace, by 14.9%, compared to the 8.2% growth in Q3’2020 while cost of funds declined, coming in at a weighted average of 2.7% in Q3’2021, from 2.9% in Q3’2020, owing to the faster growth in average interest-bearing liabilities, an indication that the listed banks were able to mobilize cheaper deposits,
- Average loan growth came in at 12.4%, lower than the 15.0% growth recorded in Q3’2020. Notably, the loan growth outpaced the 11.7% growth in government securities, an indication that the banks’ have increased their lending to private sectors due to decrease in credit risk on the back of economic recovery,
- Interest income grew by 15.9%, compared to a growth of 10.8% recorded in Q3’2020. Notably, the weighted average Yield on Interest Earning Assets (YIEA) for the listed banks increased to 9.8%, from the 9.5% recorded in Q3’2020, an indication of the increased allocation to higher-yielding government securities by the sector during the period. Consequently, the Net Interest Margin (NIM) now stands at 7.3%, a 0.3% points increase from the 7.0% recorded in Q3’2020 for the listed banking sector, and,
- Non-Funded Income grew by 14.3%, compared to the 2.1% increase recorded in Q3’2020. This can be attributable to the faster growth in the fees and commission which grew by 13.8% compared to a decline of 7.9% in Q3’2020, and points to the diversification of income in the banking sector.
Section III: Outlook of the banking sector:
The banking sector recorded significant recovery in Q3’2021, as evidenced by the increase in their profitability, with the Core Earnings Per Share (EPS) growing by 102.0%. The increase in EPS is mainly attributable to the reduced provisioning levels by the sector, as the Loan Loss Provisions declined by 32.6% in Q3’2021, from the 322.3% growth recorded in Q3’2020. However, despite this decline, we believe that the uncertainty brought about by the pandemic and the emergence of new variants will see banks continue overprovisioning in the medium term, albeit lower than in 2020. Based on the current operating environment, we believe the future performance of the banking sector will be shaped by the following key factors:
- Growth in Interest income: Going forward, we expect interest income growth to remain a key driver in the industry, evidenced by the 15.9% growth recorded in Q3’2021 which outpaced the 10.8% growth recorded in Q3’2020. The disclosure by banks that most customers that had restructured their loans are now servicing them as normal means that banks are now earning interest on loans restructured at the height of the pandemic,
- Revenue Diversification: In Q3’2021, Non-Funded Income recorded a 14.3% weighted average growth, a significant increase from the 2.1% growth recorded in Q3’2020, attributable to the expiry of the waiver on fees and commissions on loans and advances issued by the CBK in March 2020. However, the banking sector’s Non-Funded Income to Operating Income declined, coming in at 35.2% in Q3’2021, compared to 35.9% in Q3’2020. There exists an opportunity for the sector to further increase NFI contribution to revenue going forward. The expiry of the waiver on bank charges on 2nd March 2021 is also expected to continue spurring NFI growth in the medium-long term due to the increased adoption of digital channels, which present an avenue for an increase in fees on transactions. According to Central Bank Annual Report 2019/2020, 67.0% of banking transactions were conducted on mobile phones after the onset of the pandemic, compared to 55.0% of transactions before the pandemic. The increase in mobile-banking transactions therefore provides an opportunity for banks to increase their Non-Funded income going forward,
- Provisioning: Loan Loss Provisions recorded a weighted average decline of 32.4% in Q3’2021, compared to a growth of 322.3% in Q3’2020 and a decline of 24.8% in H1’2021. However, given that the success of COVID-19 inoculations is reliant on donations from foreign countries and uncertainties caused by emergence of new COVID-19 variants, we believe that a cautious approach is still required to manage credit risk in the banking sector,
- Cost Rationalization: Majority of the banks have continued pursuing their cost rationalization strategy by riding on the digital revolution wave to improve their operational efficiency and enhance reliability of outside the branch transactions. Increased adoption of alternative channels of transactions such as mobile, internet, and agency banking has led to increased transactions carried out via alternative channels, reducing branch transactions to handling high-value transactions and other services such as advisory. This has led to banks such as KCB, Equity and ABSA recording 98.0%, 96.1% and 87.0%, respectively, of their transactions outside the branch as at Q3’2021,
- Expansion and Further Consolidation: With consolidation remaining a key theme going forward, the current environment could provide opportunities for bigger banks with an adequate capital base to expand and take advantage of the low valuations in the market and further consolidate/ buy out smaller and weaker banks. Consolidation will be key for most of the smaller banks that are still struggling during the recovery period, and would also benefit larger banks with the opportunity to expand their operations locally and regionally and drive growth in future. Additional, we believe that Kenyan banks will continue diversifying into other African countries as they look to reduce their reliance in the Kenyan Market, and,
- Integration of Climate-Related Risk Management: Following the release of Guidance on Climate-Related Risk Management by the Central Bank of Kenya (CBK), we expect to see banks channel their long term financing into environmental-friendly assets that are more sustainable and have lower risk of damage loss as a result of climate change. Additionally, banks will focus on lending to companies whose activities do not pose an environmental risk and will ultimately lead to improvement of collateral quality consequently reducing their exposure to unexpected loss and obsolesce. This will lead to reduced non-performing loans and provisioning in the sector.
Section IV: Brief Summary and Ranking of the Listed Banks:
As per our analysis on the banking sector from a franchise value and a future growth opportunity perspective, we carried out a comprehensive ranking of the listed banks. For the franchise value ranking, we included the earnings and growth metrics as well as the operating metrics shown in the table below in order to carry out a comprehensive review of the banks:
|
Bank |
Loan to Deposit Ratio |
Cost to Income (With LLP) |
Return on Average Capital Employed |
Deposits/ Branch (Kshs bn) |
Gross NPL Ratio |
NPL Coverage |
Tangible Common Ratio |
Non Funded Income/Revenue |
|
KCB Group |
75.9% |
55.2% |
22.7% |
1.7 |
13.7% |
63.4% |
14.1% |
29.4% |
|
Equity Bank |
63.9% |
54.5% |
22.2% |
2.6 |
9.5% |
60.6% |
12.5% |
39.7% |
|
Absa Bank |
85.2% |
56.6% |
21.1% |
3.2 |
8.1% |
74.5% |
13.2% |
32.0% |
|
Stanbic Bank |
83.0% |
59.8% |
15.8% |
8.5 |
11.5% |
54.9% |
14.9% |
42.6% |
|
SCBK |
51.0% |
60.1% |
14.5% |
7.2 |
15.3% |
82.8% |
15.0% |
33.9% |
|
I&M Holdings |
71.9% |
62.1% |
14.3% |
3.2 |
10.2% |
70.6% |
15.8% |
30.7% |
|
Coop Bank |
72.9% |
63.0% |
14.2% |
2.4 |
14.6% |
65.5% |
15.0% |
35.4% |
|
NCBA Group |
53.2% |
68.0% |
11.8% |
4.6 |
17.0% |
70.2% |
12.3% |
44.3% |
|
DTBK |
63.5% |
62.0% |
6.8% |
2.5 |
11.9% |
40.0% |
15.4% |
24.5% |
|
HF Group |
92.2% |
128.6% |
(19.0%) |
1.7 |
22.0% |
68.9% |
14.4% |
24.7% |
|
Weighted Average Q3’2021 |
69.7% |
58.1% |
18.8% |
3.3 |
12.0% |
65.1% |
13.8% |
35.5% |
The overall ranking was based on a weighted average ranking of Franchise value (accounting for 60.0%) and intrinsic value (accounting for 40.0%). The Intrinsic Valuation is computed through a combination of valuation techniques, with a weighting of 40.0% on Discounted Cash-flow Methods, 35.0% on Residual Income and 25.0% on Relative Valuation, while the Franchise ranking is based on banks operating metrics, meant to assess efficiency, asset quality, diversification, and profitability, among other metrics. The overall Q3’2021 ranking is as shown in the table below:
|
Bank |
Franchise Value Rank |
Intrinsic Value Rank |
Weighted Rank |
H1'2021 |
Q3’2021 |
|
KCB Group Plc |
2 |
2 |
2.0 |
3 |
1 |
|
ABSA |
1 |
3 |
2.2 |
2 |
2 |
|
I&M Holdings |
4 |
1 |
2.2 |
1 |
3 |
|
Equity Group Holdings Ltd |
2 |
7 |
5.0 |
4 |
4 |
|
SCBK |
7 |
4 |
5.2 |
6 |
5 |
|
Co-operative Bank of Kenya Ltd |
6 |
6 |
6.0 |
8 |
6 |
|
NCBA Group Plc |
8 |
5 |
6.2 |
5 |
7 |
|
Stanbic Bank/Holdings |
5 |
9 |
7.4 |
7 |
8 |
|
DTBK |
9 |
8 |
8.4 |
9 |
9 |
|
HF Group Plc |
10 |
10 |
10.0 |
10 |
10 |
Major Changes from the H1’2021 Ranking are:
- KCB Group recorded an improvement in the overall ranking, coming in at position 1 from position 3 in H1’2021, attributable to a decline in the bank‘s Gross NPL ratio to 13.7%, from the 14.4% recorded in H1’2021, leading to an increase in the bank’s franchise value score, coupled with an improvement in the bank’s Cost to Income ratio, which recorded a 2.0% points decline to 55.2% from 57.2% recorded in H1’2021,
- Co-operative Bank’s rank improved to position 6 from position 8 in H1’2021, attributable to an increase in the bank’s coverage ratio to 65.5%, higher than the 63.5% recorded in H1’2021. The bank’s Net Interest Margin ratio also increased to 8.5%, which was the highest in the listed banking sector,
- I&M Holdings’ rank declined to position 3 after being ranked position 1 six times in a row, mainly due to a deterioration in the bank’s Cost to Income ratio to 62.1%, from 56.3% recorded in H1’2021, and,
- NCBA Group’s rank declined to position 7 from position 5 in H1’2021, attributable to a deterioration in the bank‘s asset quality, as the Gross NPL ratio rose to 17.0%, from the 16.7% recorded in H1’2021.
For more information, see our Cytonn Q3’2021 Listed Banking Sector Review
Disclaimer: The views expressed in this publication are those of the writers where particulars are not warranted. This publication, which is in compliance with Section 2 of the Capital Markets Authority Act Cap 485A, is meant for general information only and is not a warranty, representation, advice or solicitation of any nature. Readers are advised in all circumstances to seek the advice of a registered investment advisor.

- Talk to us
- Kenya
- P.O Box 20695 - 00200, Nairobi, Kenya
- Cell +254709101200
- Tel +254709101200
- WhatsApp +254741676635
- United States
- +254709101200
- DOWNLOAD OUR APP
-


- Kenya
- 8th Floor, Pinetree Plaza, Kaburu Drive, Ngong Road, Nairobi, Kenya
- USA
- Suite 1150, 1775 Eye Street NW, USA, Washington DC 20006, USA
- Investments
- High Yield
- Private Equity
- Real Estate
- Real Estate
- RiverRun Estates
- Cytonn Towers
- The Ridge
- Taraji Heights
- The Alma