Kenya Listed Banks Report FY’2023, & Cytonn Weekly #16/2024
By Research Team, Apr 21, 2024
Executive Summary
Fixed Income
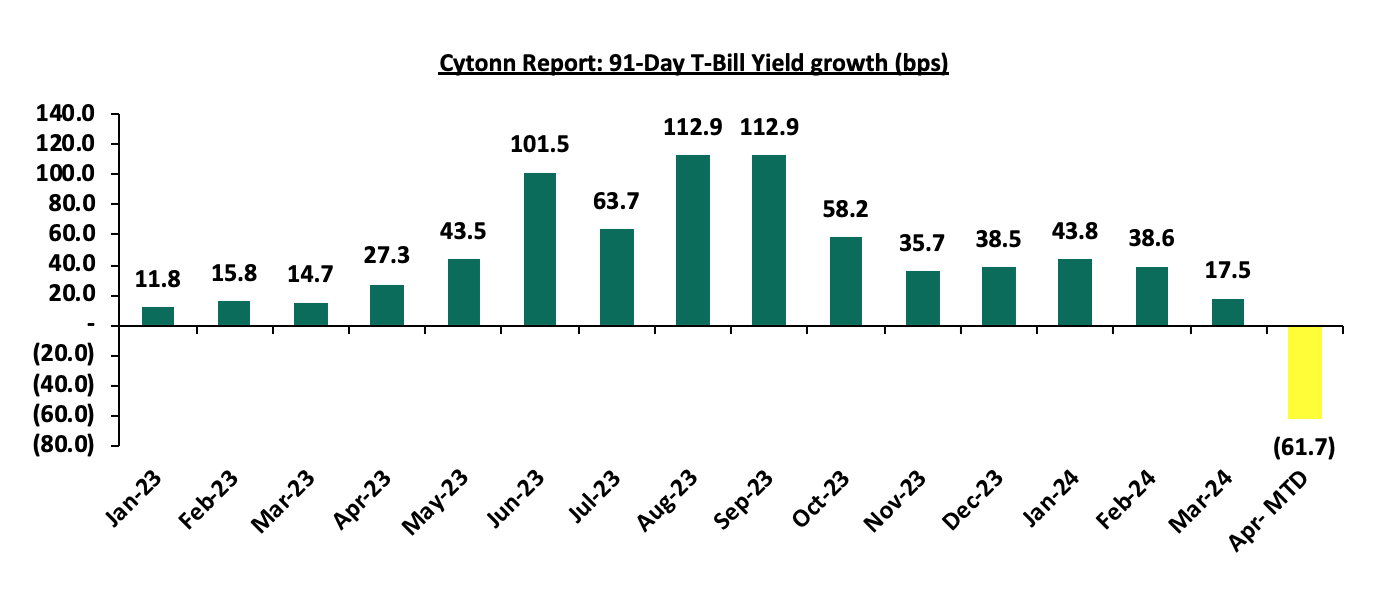
During the week, T-bills were oversubscribed, with the overall oversubscription rate coming in at 108.7%, lower than the oversubscription rate of 192.8% recorded the previous week. Investors’ preference for the shorter 91-day paper persisted, with the paper receiving bids worth Kshs 6.0 bn against the offered Kshs 4.0 bn, translating to an oversubscription rate of 150.1%, significantly lower than the oversubscription rate of 410.4% recorded the previous week. The subscription rates for the 182-day paper and 364-day paper decreased to 78.1% and 122.7% respectively from 105.6% and 192.9% respectively recorded the previous week. The government accepted a total of Kshs 26.0 bn worth of bids out of Kshs 26.1 bn of bids received, translating to an acceptance rate of 99.6%. The yields on the government papers recorded mixed performances, with the yield on the 91-day paper increasing by 7.0 bps to 15.80% from the 15.73% recorded the previous week, while the yields on the 364-day and 182-day papers decreased by 2.3 bps and 40.2 bps to 16.51% and 16.47% from 16.53% and 16.87% respectively recorded the previous week;
During the week, The Central Bank of Kenya released the auction results for the reopened bond FXD1/2023/02 with a tenor to maturity of 2.0 years. The bond was oversubscribed with the overall subscription rate coming in at 118.0%, receiving bids worth Kshs 47.2 bn against the offered Kshs 40.0 bn. The government accepted bids worth Kshs 34.8 bn, translating to an acceptance rate of 73.7%. The weighted average yield of accepted bids came in at 16.99% which was within our expected range of 16.55%-17.00% and a decline of 74.4 bps from the 17.74% yield of the previous similar tenor reopened FXD1/2023/02 bond issued in October 2023. While the coupon rate for the bond was fixed at 16.97%, similar to the previous issue’s rate. With the Inflation rate at 5.7% as of March 2024, the real return of the bonds is 11.3%;
During the week, the Energy and Petroleum Regulatory Authority (EPRA) released their monthly statement on the maximum retail fuel prices in Kenya, effective from 15th April 2024 to 14th May 2024. Notably, the maximum allowed price for Super Petrol, Diesel and Kerosene decreased by Kshs 5.3, Kshs 10.0, and Kshs 18.7 each respectively, and will retail at Kshs 193.8, Kshs 180.4, and Kshs 170.0 per litre respectively from the March 2024 prices of Kshs 199.2, Kshs 190.4 and Kshs 188.7 respectively;
During the week, the National Treasury gazetted the revenue and net expenditures for the ninth month of FY’2023/2024, ending 28th March 2024, highlighting that the total revenue collected as at the end of March 2024 amounted to Kshs 1,589.7 bn, equivalent to 61.7% of the revised estimates of Kshs 2,576.8 bn for FY’2023/2024 and is 82.3% of the prorated estimates of Kshs 1,932.6 bn.
Equities
During the week, the equities market was on a downward trajectory, with NSE 25 declining the most by 3.8%, while NASI, NSE 10, and NSE 20 declined by 3.6%, 3.5%, and 2.1% respectively, taking the YTD performance to gains of 20.9%, 18.2%, 15.9% and 12.0% for NSE 10, NSE 25, NASI and NSE 20 respectively. The equities market performance was driven by losses recorded by large-cap stocks such as Equity Group, KCB, and Safaricom of 9.4%, 7.0%, and 5.6% respectively. The performance was, however, supported by gains recorded by large-cap stocks such as EABL and BAT of 11.2% and 0.9% respectively;
During the week, Bamburi Cement Plc released their FY’2023 results, reporting a loss for the year of Kshs 0.4 bn, a significant 321.7% decline from the Kshs 0.2 bn profit after tax recorded in FY’2022. Profit from continued operations, however, increased by 160.7% to Kshs 0.7 bn from Kshs 0.3 bn recorded in FY’2022. Turnover increased by 6.3% to Kshs 22.0 bn from Kshs 20.7 bn in FY’2022, while total operating costs increased by 3.9% to Kshs 20.8 bn from Kshs 20.1 bn recorded in FY’2022;
Also, during the week, Liberty Kenya Holdings released their FY’2023 results, having fully implemented the new IFRS 17 reporting system. Liberty Kenya Holdings’ Profit After Tax (PAT) increased by 151.0% to Kshs 0.7 bn, from Kshs 0.3 bn recorded in FY’2022, mainly driven by a 148.6% increase in Net insurance income to Kshs 0.9 bn, from Kshs 0.4 bn in FY’2022, and supported by a 41.6% decrease in Net insurance expenses to Kshs 0.3 bn, from Kshs 0.6 bn in FY’2022;
Real Estate
During the week, The Affordable Housing Regulations, 2024 were published for public participation by the State Department for Housing and Urban Development under the framework of the Affordable Housing Act, 2024 outlining crucial guidelines for the development, allocation, and management of affordable housing units;
During the week, Hass Consult, a Kenyan Real Estate consulting and development firm, released its House Price Index Q1’2024 Report which highlighted that quarter-on-quarter (q/q) selling prices for all the properties registered a 2.7% increase in Q1’2024, compared to 0.02% increase in Q1’2023. Additionally, Hass Consult released its Land Price Index Q1’2024 Report which highlighted that the average q/q selling prices for land in the Nairobi suburbs grew by 1.3%, compared to a 0.3% increase recorded in Q1’2023;
During the week, NCBA Bank Kenya disclosed that it extended an additional Kshs 1.6 bn (USD 12 mn) in lending to Grit Services Limited, a Mauritius-based Real Estate firm, during the first half of the fiscal year ending December 2023. This brought the total dollar-denominated credit facilities provided by NCBA to Grit Services to Kshs 3.9 bn (USD 29.5 mn) by December 2023, up from Kshs 2.3 bn (USD 17.5 mn) in June 2023;
On the Unquoted Securities Platform, Acorn D-REIT and I-REIT traded at Kshs 24.4 and Kshs 21.7 per unit, respectively, as of 22nd March 2024. The performance represented a 22.0% and 8.3% gain for the D-REIT and I-REIT, respectively, from the Kshs 20.0 inception price;
Focus of the Week
Following the release of the FY’2023 results by Kenyan banks, the Cytonn Financial Services Research Team undertook an analysis on the financial performance of the listed banks and identified the key factors that shaped the performance of the sector;
Investment Updates:
- Weekly Rates:
- Cytonn Money Market Fund closed the week at a yield of 17.13% p.a. To invest, dial *809# or download the Cytonn App from Google Play store here or from the Appstore here;
- We continue to offer Wealth Management Training every Monday, from 10:00 am to 12:00 pm. The training aims to grow financial literacy among the general public. To register for any of our Wealth Management Trainings, click here;
- If interested in our Private Wealth Management Training for your employees or investment group, please get in touch with us through wmt@cytonn.com;
- Cytonn Insurance Agency acts as an intermediary for those looking to secure their assets and loved ones’ future through insurance namely; Motor, Medical, Life, Property, WIBA, Credit and Fire and Burglary insurance covers. For assistance, get in touch with us through insuranceagency@cytonn.com;
- Cytonn Asset Managers Limited (CAML) continues to offer pension products to meet the needs of both individual clients who want to save for their retirement during their working years and Institutional clients that want to contribute on behalf of their employees to help them build their retirement pot. To more about our pension schemes, kindly get in touch with us through pensions@cytonn.com;
Real Estate Updates:
- For more information on Cytonn’s real estate developments, email us at sales@cytonn.com;
- Phase 3 of The Alma is now ready for occupation and the show house is open daily. To join the waiting list to rent, please email properties@cytonn.com;
- For Third Party Real Estate Consultancy Services, email us at rdo@cytonn.com;
- For recent news about the group, see our news section here;
Hospitality Updates:
- We currently have promotions for Staycations. Visit cysuites.com/offers for details or email us at sales@cysuites.com;
Money Markets, T-Bills Primary Auction:
During the week, T-bills were oversubscribed, with the overall oversubscription rate coming in at 108.7%, lower than the oversubscription rate of 192.8% recorded the previous week. Investors’ preference for the shorter 91-day paper persisted, with the paper receiving bids worth Kshs 6.0 bn against the offered Kshs 4.0 bn, translating to an oversubscription rate of 150.1%, significantly lower than the oversubscription rate of 410.4% recorded the previous week. The subscription rates for the 182-day paper and 364-day paper decreased to 78.1% and 122.7% respectively from 105.6% and 192.9% respectively recorded the previous week. The government accepted a total of Kshs 26.0 bn worth of bids out of Kshs 26.1 bn of bids received, translating to an acceptance rate of 99.6%. The yields on the government papers recorded mixed performances, with the yield on the 91-day paper increasing by 7.0 bps to 15.80% from the 15.73% recorded the previous week, while the yields on the 364-day and 182-day papers decreased by 2.3 bps and 40.2 bps to 16.51% and 16.47% from 16.53% and 16.87% respectively recorded the previous week. The chart below shows the yield growth rate for the 91-day paper over the period:
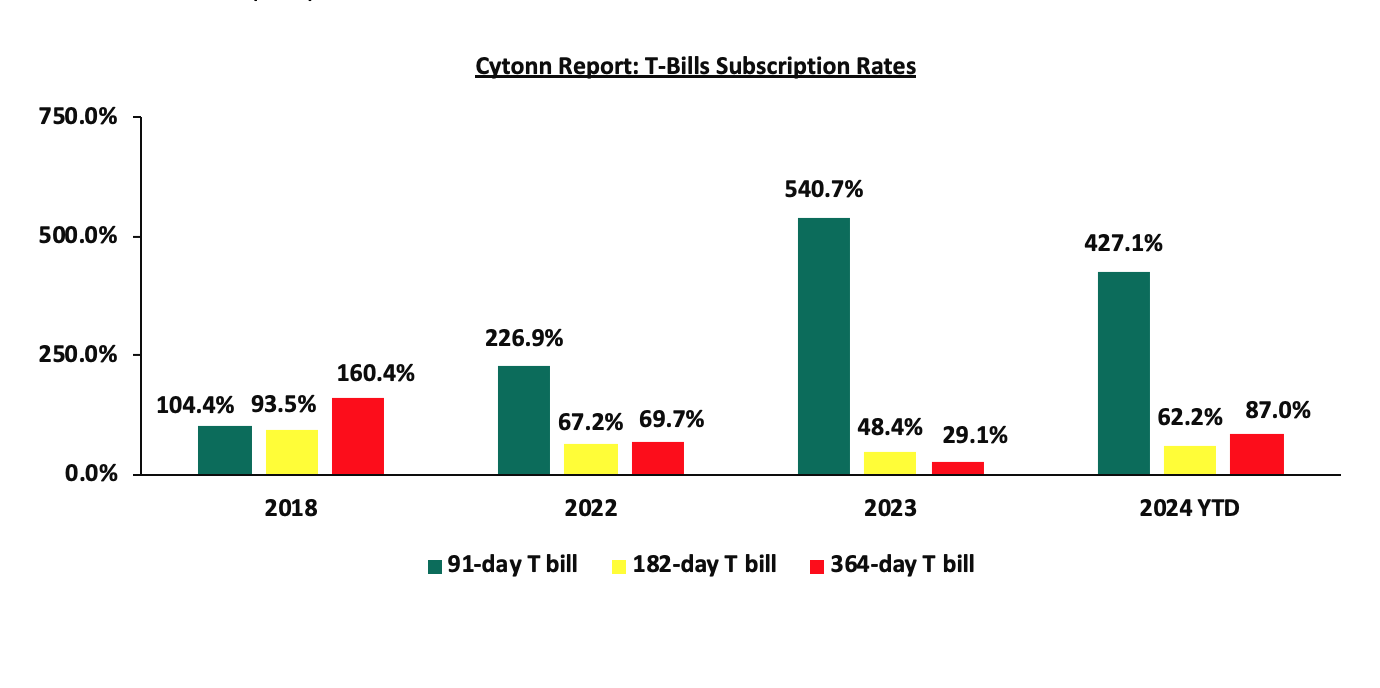
The chart below compares the overall average T-bill subscription rates obtained in 2018, 2022, 2023, and 2024 Year-to-date (YTD):
During the week, The Central Bank of Kenya released the auction results for the reopened bond FXD1/2023/02 with a tenor to maturity of 2.0 years. The bond was oversubscribed with the overall subscription rate coming in at 118.0%, receiving bids worth Kshs 47.2 bn against the offered Kshs 40.0 bn. The government accepted bids worth Kshs 34.8 bn, translating to an acceptance rate of 73.7%. The weighted average yield of accepted bids came in at 16.99% which was within our expected range of 16.55%-17.00% and a decline of 74.4 bps from the 17.74% yield of the previous similar tenor reopened FXD1/2023/02 bond issued in October 2023. The coupon rate for the bond was fixed at 16.97%, similar to the previous issue’s rate. With the Inflation rate at 5.7% as of March 2024, the real return of the bonds is 11.3%;
Money Market Performance:
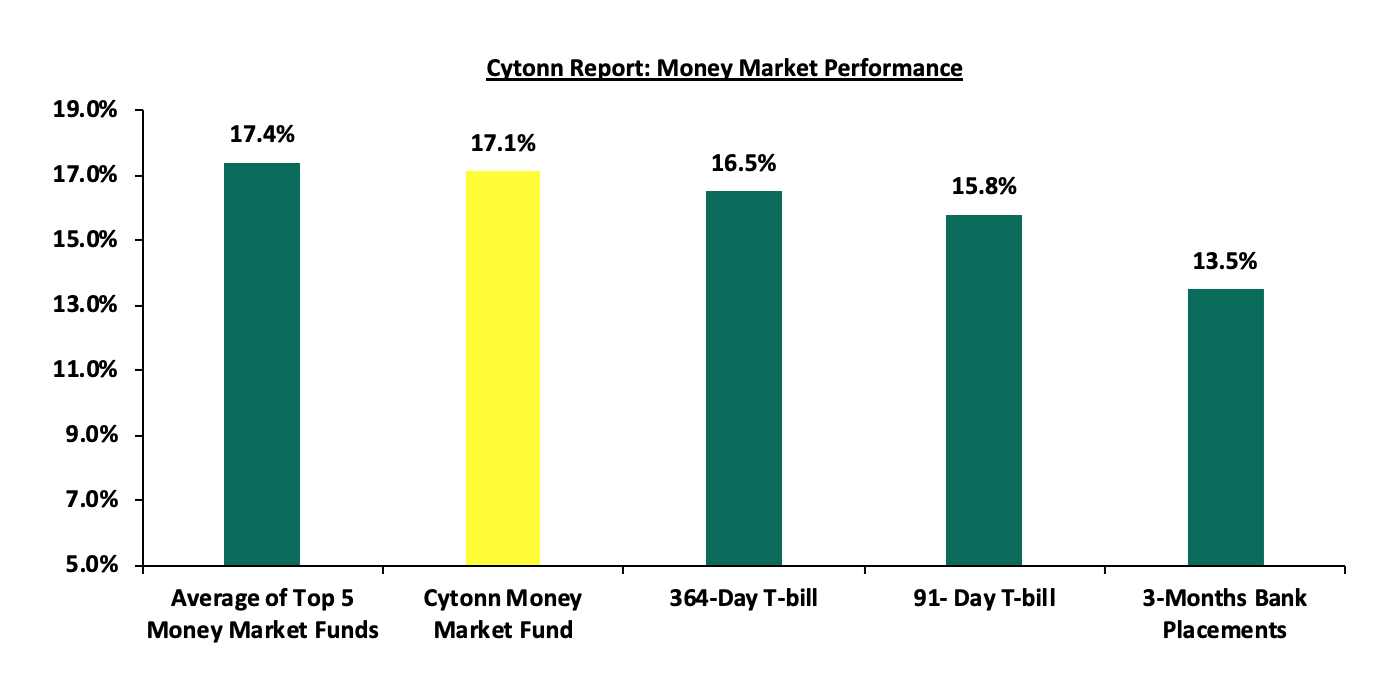
In the money markets, 3-month bank placements ended the week at 13.5% (based on what we have been offered by various banks), and the yields on the 364-day and 91-day papers recorded mixed performances, with the yield on the 91-day paper increasing by 7.0 bps to 15.8% from the 15.7% recorded the previous week while the yield on the 364-day paper decreased by 2.3 bps to 16.5%. The yields of the Cytonn Money Market Fund increased marginally by 6.0 bps to remain relatively unchanged from the 17.1 recorded the previous week, while the average yields on the Top 5 Money Market Funds increased marginally by 0.4 bps to remain unchanged at 17.4% recorded the previous week.
The table below shows the Money Market Fund Yields for Kenyan Fund Managers as published on 19th April 2024:
|
Cytonn Report: Money Market Fund Yield for Fund Managers as published on 19th April 2024 |
||
|
Rank |
Fund Manager |
Effective Annual Rate |
|
1 |
Lofty-Corban Money Market Fund |
18.3% |
|
2 |
Etica Money Market Fund |
18.3% |
|
3 |
Cytonn Money Market Fund (Dial *809# or download the Cytonn app) |
17.1% |
|
4 |
GenAfrica Money Market Fund |
16.9% |
|
5 |
Nabo Africa Money Market Fund |
16.5% |
|
6 |
Kuza Money Market fund |
16.4% |
|
7 |
Enwealth Money Market Fund |
16.2% |
|
8 |
Apollo Money Market Fund |
15.9% |
|
9 |
KCB Money Market Fund |
15.7% |
|
10 |
Madison Money Market Fund |
15.6% |
|
11 |
Jubilee Money Market Fund |
15.4% |
|
12 |
Co-op Money Market Fund |
15.3% |
|
13 |
Absa Shilling Money Market Fund |
15.2% |
|
14 |
Mali Money Market Fund |
15.2% |
|
15 |
Sanlam Money Market Fund |
15.1% |
|
16 |
AA Kenya Shillings Fund |
15.1% |
|
17 |
Mayfair Money Market Fund |
14.9% |
|
18 |
GenCap Hela Imara Money Market Fund |
14.8% |
|
19 |
Equity Money Market Fund |
14.6% |
|
20 |
Dry Associates Money Market Fund |
13.7% |
|
21 |
Old Mutual Money Market Fund |
13.6% |
|
22 |
Orient Kasha Money Market Fund |
13.5% |
|
23 |
CIC Money Market Fund |
13.2% |
|
24 |
ICEA Lion Money Market Fund |
12.4% |
|
25 |
British-American Money Market Fund |
9.9% |
Source: Business Daily
Liquidity:
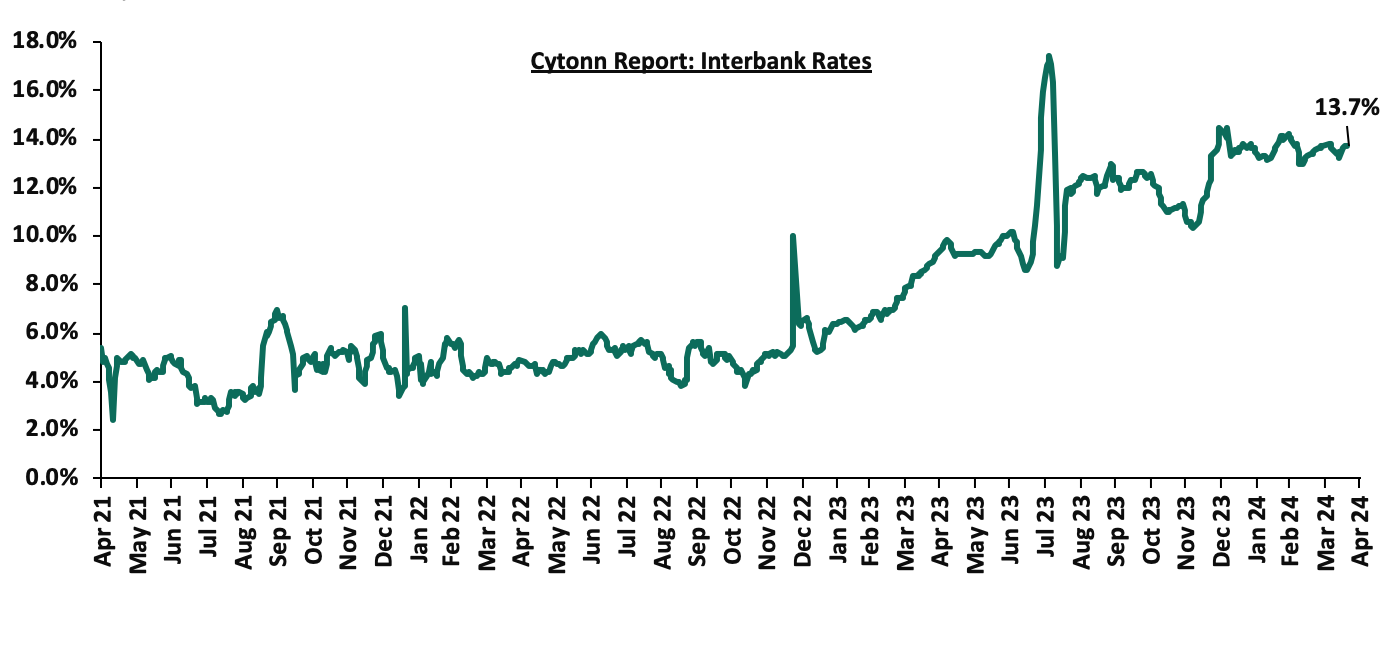
During the week, liquidity in the money markets tightened, with the average interbank rate increasing by 33.6 bps, to 13.7%, from 13.4% recorded the previous week, partly attributable to tax remittances that offset government payments. The average interbank volumes traded decreased by 14.0% to Kshs 21.1 bn from Kshs 24.6 bn recorded the previous week. The chart below shows the interbank rates in the market over the years:
Kenya Eurobonds:
During the week, the yields on Eurobonds were on an upward trajectory, with the yields on the 7-year Eurobond issued in 2019 increasing the most by 15.7 bps to 9.0% from 8.8% recorded the previous week. The table below shows the summary of the performance of the Kenyan Eurobonds as of 19th April 2024;
|
Cytonn Report: Kenya Eurobonds Performance |
||||||
|
|
2018 |
2019 |
2021 |
2024 |
||
|
Tenor |
10-year issue |
30-year issue |
7-year issue |
12-year issue |
13-year issue |
6-year issue |
|
Amount Issued (USD) |
1.0 bn |
1.0 bn |
0.9 bn |
1.2 bn |
1.0 bn |
1.5 bn |
|
Years to Maturity |
3.9 |
23.9 |
3.1 |
8.1 |
10.2 |
6.8 |
|
Yields at Issue |
7.3% |
8.3% |
7.0% |
7.9% |
6.2% |
10.4% |
|
01-Jan-24 |
9.8% |
10.2% |
10.1% |
9.9% |
9.5% |
|
|
01-Apr-24 |
8.7% |
9.8% |
8.4% |
9.3% |
9.3% |
9.2% |
|
11-Apr-24 |
9.0% |
9.9% |
8.8% |
9.5% |
9.6% |
9.5% |
|
12-Apr-24 |
9.0% |
9.9% |
8.7% |
9.5% |
9.6% |
9.5% |
|
15-Apr-24 |
9.0% |
10.0% |
8.8% |
9.6% |
9.7% |
9.6% |
|
16-Apr-24 |
9.2% |
10.2% |
9.2% |
9.9% |
9.9% |
9.9% |
|
17-Apr-24 |
9.1% |
10.1% |
9.0% |
9.7% |
9.8% |
9.7% |
|
18-Apr-24 |
9.0% |
10.1% |
9.0% |
9.7% |
9.7% |
9.6% |
|
Weekly Change |
0.0% |
0.1% |
0.2% |
0.1% |
0.1% |
0.1% |
|
MTD Change |
0.3% |
0.3% |
0.5% |
0.4% |
0.4% |
0.4% |
|
YTD Change |
(0.8%) |
(0.1%) |
(1.1%) |
(0.2%) |
0.2% |
9.6% |
Source: Central Bank of Kenya (CBK) and National Treasury
Kenya Shilling:
During the week, the Kenya Shilling depreciated against the US Dollar by 0.8% to close at Kshs 131.4, from Kshs 130.4 recorded the previous week. On a year-to-date basis, the shilling has appreciated by 16.3% against the dollar, in contrast to the 26.8% depreciation in 2023. We expect the shilling to remain under pressure in 2023 as a result of:
- An ever-present current account deficit which came at 3.5% of GDP in Q3’2023 from 6.4% recorded in a similar period in 2022,
- The need for government debt servicing, continues to put pressure on forex reserves given that 67.5% of Kenya’s external debt was US Dollar denominated as of September 2023, and,
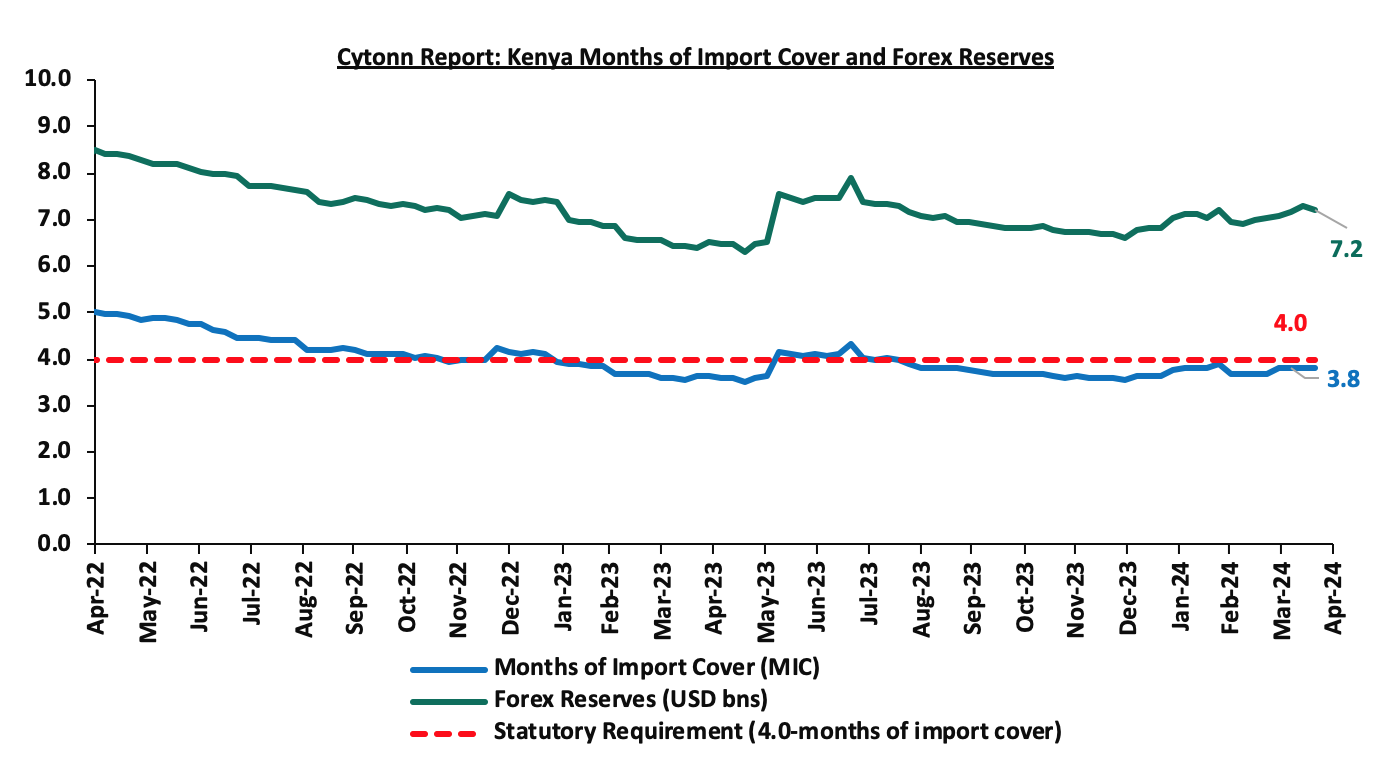
- Dwindling forex reserves, currently at USD 7.2 mn (equivalent to 3.8 months of import cover), which is below the statutory requirement of maintaining at least 4.0 months of import cover.
The shilling is however expected to be supported by:
- Diaspora remittances standing at a cumulative USD 4,380.5 mn in the 12 months to March 2024, 9.0% higher than the USD 4,019.6 mn recorded over the same period in 2023, which has continued to cushion the shilling against further depreciation. In the March 2024 diaspora remittances figures, North America remained the largest source of remittances to Kenya accounting for 56.2% in the period, and,
- The tourism inflow receipts which came in at USD 352.5 bn in 2023, a 31.5% increase from USD 268.1 bn inflow receipts recorded in 2022, and owing to tourist arrivals that improved by 27.6% to 182,000 in the 12 months to January 2024, from 151,000 recorded during a similar period in 2023.
Key to note, Kenya’s forex reserves declined by 0.9% during the week to USD 7.2 bn from USD 7.3 bn recorded the previous week, equivalent to 3.8 months of import cover same as the previous week, and remained below the statutory requirement of maintaining at least 4.0-months of import cover.
The chart below summarizes the evolution of Kenya's months of import cover over the years:
Weekly Highlights
- Fuel Prices Effective 15th April 2024 to 14th May 2024
During the week, the Energy and Petroleum Regulatory Authority (EPRA) released their monthly statement on the maximum retail fuel prices in Kenya, effective from 15th April 2024 to 14th May 2024. Notably, the maximum allowed price for Super Petrol, Diesel and Kerosene decreased by Kshs 5.3, Kshs 10.0, and Kshs 18.7 each respectively, and will retail at Kshs 193.8, Kshs 180.4, and Kshs 170.0 per litre respectively from the March 2024 prices of Kshs 199.2, Kshs 190.4 and Kshs 188.7 respectively.
Other key take-outs from the performance include;
- The average landing costs per cubic meter for Super Petrol increased by 4.9% to USD 737.7 from USD 703.5 recorded in February 2024 while Kerosene decreased marginally by 0.7% to USD 725.3 in March 2024 from USD 728.0 in February 2024 and Diesel remained relatively unchanged from the USD 722.5 recorded in February 2024, and,
- The Kenyan shilling gained against the US Dollar by 9.8% to Kshs. 133.5 in March 2024, compared to the mean monthly exchange rate of Kshs 148.0 recorded in February 2024.
We note that fuel prices in the country have decreased, largely attributable to the government's efforts to stabilize pump prices through the petroleum pump price stabilization mechanism which has so far expended Kshs 9.9 bn in the FY’2023/24 to cushion the increases applied to the petroleum pump prices, coupled with the ongoing appreciation of the Kenyan Shilling against the dollar and other major currencies. Nevertheless, fuel prices in the country still remain under pressure from the high taxation of petroleum products as provided in the Finance Act 2023. We expect that fuel prices will drop in the coming months as a result of the government's efforts to mitigate the cost of petroleum through the pump price stabilization mechanism, strengthening of the Kenyan Shilling against the United States Dollar, having gained by 16.3% against the dollar on a year-to-date basis, coupled with a reduction in international fuel prices. As such, we expect the business environment in the country to improve as fuel is a major input cost, as well as further ease in inflationary pressures, with the inflation rate expected to move further towards the CBK’s preferred target of 5.0%.
- Exchequer Highlight March 2024
During the week, the National Treasury gazetted the revenue and net expenditures for the ninth month of FY’2023/2024, ending 28th March 2024, highlighting that the total revenue collected as at the end of March 2024 amounted to Kshs 1,589.7 bn, equivalent to 61.7% of the revised estimates of Kshs 2,576.8 bn for FY’2023/2024 and is 82.3% of the prorated estimates of Kshs 1,932.6 bn.
The National Treasury gazetted the revenue and net expenditures for the ninth month of FY’2023/2024, ending 28th March 2024. Below is a summary of the performance:
|
FY'2023/2024 Budget Outturn - As at 28th March 2024 |
||||||
|
Amounts in Kshs billions unless stated otherwise |
||||||
|
Item |
12-months Original Estimates |
Revised Estimates |
Actual Receipts/Release |
Percentage Achieved of the Revised Estimates |
Prorated |
% achieved of the Prorated |
|
Opening Balance |
|
|
2.6 |
|
|
|
|
Tax Revenue |
2,495.8 |
2,495.8 |
1,535.1 |
61.5% |
1,871.9 |
82.0% |
|
Non-Tax Revenue |
75.3 |
80.9 |
52.0 |
64.3% |
60.7 |
85.7% |
|
Total Revenue |
2,571.2 |
2,576.8 |
1,589.7 |
61.7% |
1,932.6 |
82.3% |
|
External Loans & Grants |
870.2 |
849.8 |
506.9 |
59.7% |
637.3 |
79.5% |
|
Domestic Borrowings |
688.2 |
851.9 |
603.8 |
70.9% |
638.9 |
94.5% |
|
Other Domestic Financing |
3.2 |
3.2 |
3.5 |
111.1% |
2.4 |
148.1% |
|
Total Financing |
1,561.6 |
1,704.9 |
1,114.3 |
65.4% |
1,278.6 |
87.1% |
|
Recurrent Exchequer issues |
1,302.8 |
1,360.1 |
905.8 |
66.6% |
1,020.1 |
88.8% |
|
CFS Exchequer Issues |
1,963.7 |
2,078.8 |
1,364.6 |
65.6% |
1,559.1 |
87.5% |
|
Development Expenditure & Net Lending |
480.8 |
457.2 |
207.5 |
45.4% |
342.9 |
60.5% |
|
County Governments + Contingencies |
385.4 |
385.4 |
223.5 |
58.0% |
289.1 |
77.3% |
|
Total Expenditure |
4,132.7 |
4,281.6 |
2,701.5 |
63.1% |
3,211.2 |
84.1% |
|
Fiscal Deficit excluding Grants |
1,561.6 |
1,704.9 |
1,111.8 |
65.2% |
1,278.6 |
86.9% |
|
Total Borrowing |
1,558.4 |
1,701.7 |
1,110.7 |
65.3% |
1,276.2 |
87.0% |
Amounts in Kshs bns unless stated otherwise
The Key take-outs from the release include;
- Total revenue collected as at the end of March 2024 amounted to Kshs 1,589.7 bn, equivalent to 61.7% of the revised estimates of Kshs 2,576.8 bn for FY’2023/2024 and is 82.3% of the prorated estimates of Kshs 1,932.6 bn. Cumulatively, tax revenues amounted to Kshs 1,535.1 bn, equivalent to 61.5% of the revised estimates of Kshs 2,495.8 bn and 82.0% of the prorated estimates of Kshs 1,871.9 bn,
- Total financing amounted to Kshs 1,114.3 bn, equivalent to 65.4% of the revised estimates of Kshs 1,704.9 bn and is equivalent to 87.1% of the prorated estimates of Kshs 1,278.6 bn. Additionally, domestic borrowing amounted to Kshs 603.8 bn, equivalent to 70.9% of the revised estimates of Kshs 851.9 bn and is 94.5% of the prorated estimates of Kshs 638.9 bn,
- The total expenditure amounted to Kshs 2,701.5 bn, equivalent to 63.1% of the revised estimates of Kshs 4,281.6 bn, and is 84.1% of the prorated target expenditure estimates of Kshs 3,211.2 bn. Additionally, the net disbursements to recurrent expenditures came in at Kshs 905.8 bn, equivalent to 66.6% of the revised estimates of Kshs 1,360.1 and 88.8% of the prorated estimates of Kshs 1,020.1 bn,
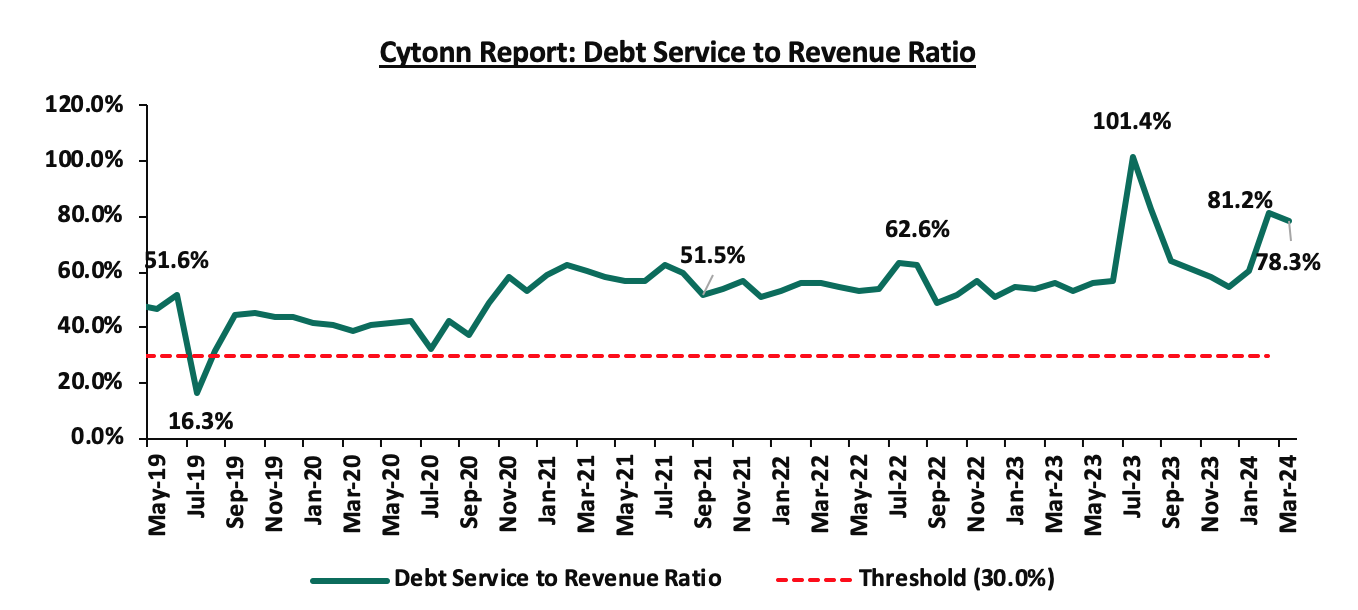
- Consolidated Fund Services (CFS) Exchequer issues came in at Kshs 1,364.6 bn, equivalent to 65.6% of the revised estimates of Kshs 2,078.8 bn, and are 87.5% of the prorated amount of Kshs 1,559.1 bn. The cumulative public debt servicing cost amounted to Kshs 1,244.0 bn which is 66.7% of the revised estimates of Kshs 1,866.0 bn, and is 88.9% of the prorated estimates of Kshs 1,399.5 bn. Additionally, the Kshs 1,244.0 bn debt servicing cost is equivalent to 78.3% of the actual revenues collected as at the end of March 2024. The chart below shows the debt serving to revenue ratio;
- Total Borrowings as at the end of March 2024 amounted to Kshs 1,110.7 bn, equivalent to 65.3% of the revised estimates of Kshs 1,701.7 bn for FY’2023/2024 and are 87.0% of the prorated estimates of Kshs 1,276.2 bn. The cumulative domestic borrowing of Kshs 851.9 bn comprises of Net Domestic Borrowing Kshs 471.4 bn and Internal Debt Redemptions (Rollovers) Kshs 380.5 bn.
The government has been unable to meet its prorated revenue targets for the nine months of the FY’2023/2024, attaining 82.3% of the revenue targets in March 2024, mainly on the back of the tough economic situation exacerbated by the elevated inflationary pressures that despite decreasing by 0.6% points in March to 5.7% from the 6.3% recorded in February, still remains on the upper bound of the CBK target of within a range of 2.5% -7.5%. Additionally, the revenue collection continues to be impeded by the high cost of living, evidenced by the deterioration in the business environment with the PMI coming in at 49.7 in March from the 51.8 recorded in February 2024. In light of this, the government is yet to fully benefit from the strategies put in place to improve revenue collection such as expanding the revenue base and sealing tax leakages, and suspension of tax relief payments. The coming months' revenue collection performance will largely depend on how quickly the country's business climate stabilizes. This stabilization is expected to be aided by the ongoing appreciation of the Shilling, which gained by 8.2% against the dollar in the month of March, and a further ease in inflationary pressures in the country.
Rates in the Fixed Income market have been on an upward trend given the continued high demand for cash by the government and the occasional liquidity tightness in the money market. The government is 20.1% ahead of its prorated net domestic borrowing target of Kshs 383.3 bn, having a net borrowing position of Kshs 460.4 bn out of the domestic net borrowing target of Kshs 471.4 bn for the FY’2023/2024. However, we expect a downward readjustment of the yield curve in the short and medium term, with the government looking to increase its external borrowing to maintain the fiscal surplus, hence alleviating pressure in the domestic market. As such, we expect the yield curve to normalize in the medium to long-term and hence investors are expected to shift towards the long-term papers to lock in the high returns.
Market Performance:
During the week, the equities market was on a downward trajectory, with NSE 25 declining the most by 3.8%, while NASI, NSE 10, and NSE 20 declined by 3.6%, 3.5%, and 2.1% respectively, taking the YTD performance to gains of 20.9%, 18.2%, 15.9% and 12.0% for NSE 10, NSE 25, NASI and NSE 20 respectively. The equities market performance was driven by losses recorded by large-cap stocks such as Equity Group, KCB, and Safaricom of 9.4%, 7.0%, and 5.6% respectively. The performance was, however, supported by gains recorded by large-cap stocks such as EABL and BAT of 11.2% and 0.9% respectively.
During the week, equities turnover increased by 15.7% to USD 12.2 mn from USD 10.6 mn recorded the previous week, taking the YTD total turnover to USD 171.4 mn. Foreign investors remained net buyers for the second time in three weeks with a net buying position of USD 0.2 mn, from a net buying position of USD 2.4 mn recorded the previous week, taking the YTD foreign net selling position to USD 14.9 mn.
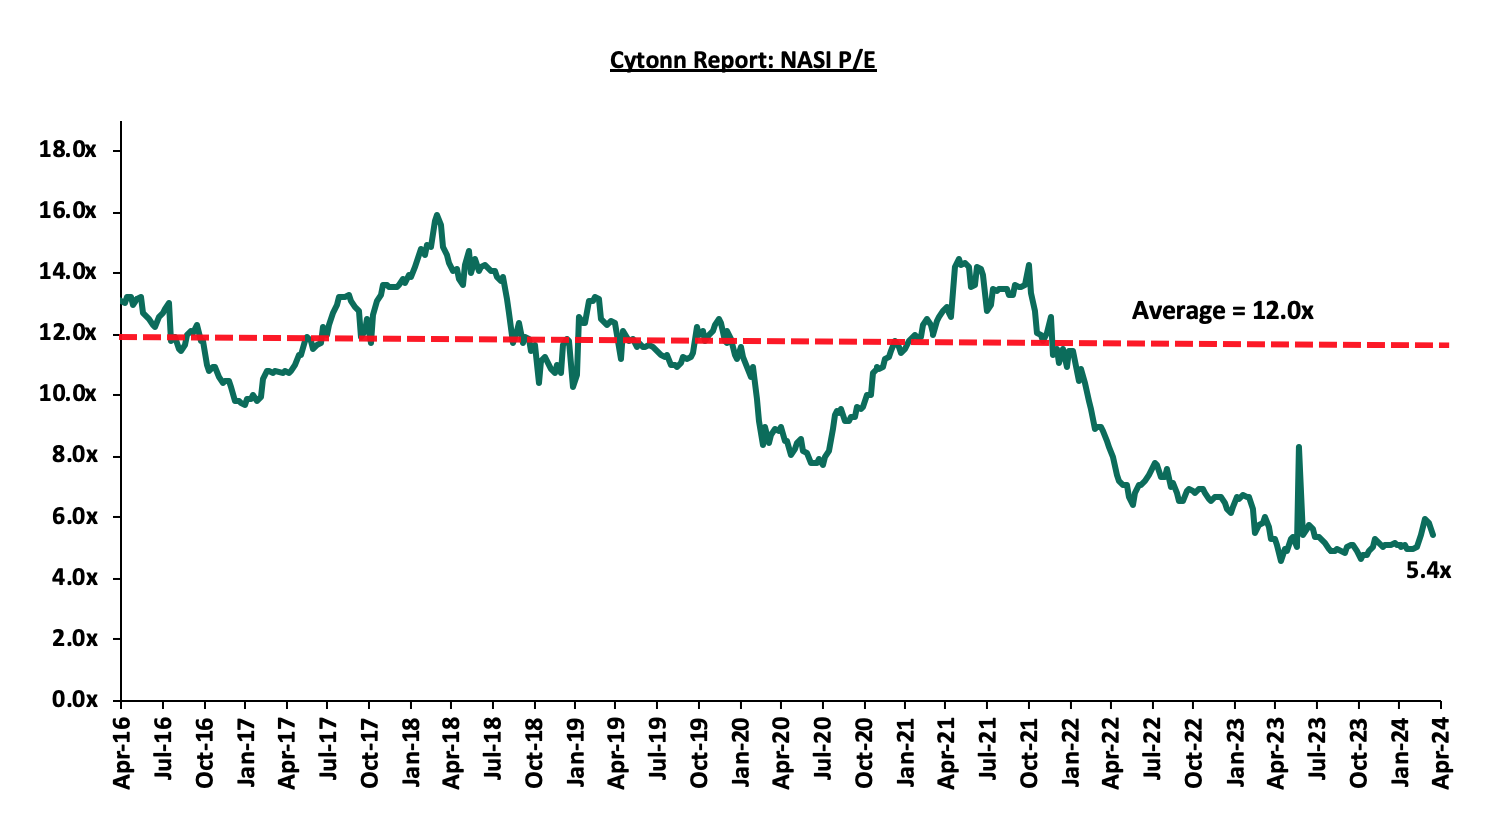
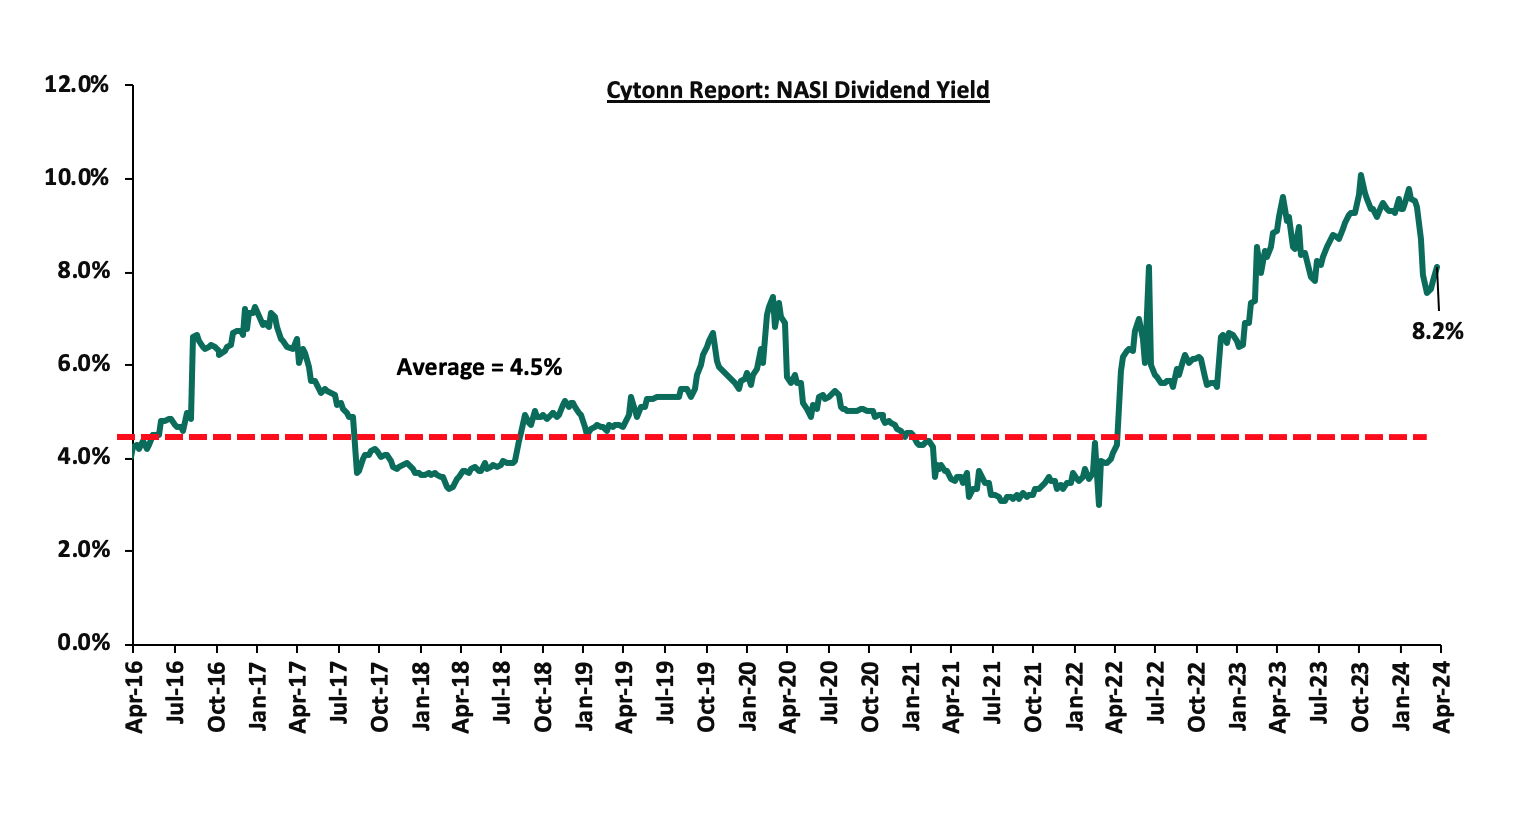
The market is currently trading at a price-to-earnings ratio (P/E) of 5.4x, 55.1% below the historical average of 12.0x. The dividend yield stands at 8.2%, 3.7% points above the historical average of 4.5%. Key to note, NASI’s PEG ratio currently stands at 0.7x, an indication that the market is undervalued relative to its future growth. A PEG ratio greater than 1.0x indicates the market is overvalued while a PEG ratio less than 1.0x indicates that the market is undervalued. The charts below indicate the historical P/E and dividend yields of the market;
Universe of coverage:
|
Cytonn Report: Equities Universe of Coverage |
|||||||||
|
Company |
Price as at 12/04/2024 |
Price as at 19/04/2024 |
w/w change |
YTD Change |
Target Price* |
Dividend Yield |
Upside/ Downside** |
P/TBv Multiple |
Recommendation |
|
Sanlam |
6.9 |
6.0 |
(12.8%) |
0.0% |
10.3 |
0.0% |
71.5% |
1.7x |
Buy |
|
Co-op Bank*** |
14.2 |
13.6 |
(4.6%) |
19.4% |
19.2 |
11.1% |
52.8% |
0.6x |
Buy |
|
Equity Group*** |
46.5 |
42.1 |
(9.4%) |
23.1% |
60.2 |
9.5% |
52.5% |
0.8x |
Buy |
|
I&M Group*** |
21.7 |
19.1 |
(12.2%) |
9.2% |
25.6 |
13.4% |
47.8% |
0.4x |
Buy |
|
ABSA Bank*** |
13.6 |
12.8 |
(5.5%) |
10.8% |
17.3 |
12.1% |
47.3% |
1.0x |
Buy |
|
Stanbic Holdings |
117.8 |
112.5 |
(4.5%) |
6.1% |
145.3 |
13.6% |
42.8% |
0.8x |
Buy |
|
Jubilee Holdings |
198.8 |
191.0 |
(3.9%) |
3.2% |
260.7 |
6.3% |
42.7% |
0.3x |
Buy |
|
Diamond Trust Bank*** |
50.3 |
50.0 |
(0.5%) |
11.7% |
65.2 |
10.0% |
40.4% |
0.2x |
Buy |
|
Kenya Reinsurance |
2.1 |
1.9 |
(8.1%) |
4.9% |
2.5 |
10.3% |
39.7% |
0.2x |
Buy |
|
NCBA*** |
44.5 |
44.9 |
0.9% |
15.6% |
55.2 |
10.6% |
33.5% |
0.8x |
Buy |
|
KCB Group*** |
30.1 |
28.0 |
(7.0%) |
27.3% |
37.2 |
0.0% |
33.1% |
0.4x |
Buy |
|
Standard Chartered*** |
199.3 |
195.3 |
(2.0%) |
21.8% |
225.2 |
14.9% |
30.2% |
1.3x |
Buy |
|
Liberty Holdings |
5.1 |
5.0 |
(2.5%) |
29.3% |
6.1 |
7.5% |
29.7% |
0.4x |
Buy |
|
HF Group |
3.8 |
4.0 |
4.4% |
16.2% |
4.6 |
0.0% |
15.4% |
0.2x |
Accumulate |
|
Britam |
5.8 |
5.7 |
(0.7%) |
11.3% |
6.5 |
0.0% |
13.6% |
0.8x |
Accumulate |
|
CIC Group |
2.3 |
2.3 |
1.3% |
2.2% |
2.5 |
5.6% |
12.4% |
0.7x |
Accumulate |
Weekly Highlights:
- Bamburi Cement Plc FY’2023 Financial Results.
During the week, Bamburi Cement Plc released their FY’2023 results, reporting a loss for the year of Kshs 0.4 bn, a significant 321.7% decline from the Kshs 0.2 bn profit after tax recorded in FY’2022. Profit from continued operations, however, increased by 160.7% to Kshs 0.7 bn from Kshs 0.3 bn recorded in FY’2022. Turnover increased by 6.3% to Kshs 22.0 bn from Kshs 20.7 bn in FY’2022, while total operating costs increased by 3.9% to Kshs 20.8 bn from Kshs 20.1 bn recorded in FY’2022.
Bamburi Cement Plc’s FY’2023 Results:
|
Cytonn Report: Bamburi Cement Plc FY'2023 Income Statement |
|||
|
Income Statement |
FY'2022 Kshs (bn) |
FY'2023 Kshs (bn) |
% Change |
|
Turnover |
20.7 |
22.0 |
6.3% |
|
Total Operating costs |
(20.1) |
(20.8) |
3.9% |
|
Operating Profit |
0.7 |
1.0 |
48.5% |
|
Finance Income & costs (Net) |
(0.03) |
0.04 |
(226.7%) |
|
Profit/(Loss) Before Tax |
0.7 |
1.1 |
61.1% |
|
Income Tax |
(0.4) |
(0.4) |
(2.7%) |
|
Profit(loss) from continuing operations |
0.3 |
0.7 |
160.7% |
|
Loss from discontinued operations |
(0.1) |
(1.1) |
1288.3% |
|
Profit/(Loss) After Tax |
0.2 |
(0.4) |
(321.7%) |
|
Earnings Per Share (EPS) |
0.6 |
0.2 |
(62.5%) |
|
Dividend Per Share |
0.8 |
5.5 |
629.3% |
|
Dividend Yield |
2.7% |
11.7% |
9.1% |
|
Cytonn Report: Bamburi Cement Plc FY'2023 Balance Sheet |
|||
|
Balance Sheet |
FY'2022 Kshs (bn) |
FY'2023 Kshs (bn) |
% Change |
|
Non-Current Assets |
41.2 |
23.6 |
(42.6%) |
|
Current Assets |
5.1 |
21.0 |
313.3% |
|
Total Assets |
46.3 |
44.6 |
(3.5%) |
|
Non-Current Liabilities |
2.7 |
4.9 |
81.5% |
|
Current Liabilities |
9.5 |
3.5 |
(63.1%) |
|
Total Liabilities |
12.2 |
8.4 |
(31.1%) |
|
Total Equity |
34.0 |
36.2 |
6.5% |
Key take outs from the results:
- Core Earnings Per share decreased by 62.5% to Kshs 0.2 from Kshs 0.6 in FY’2022, driven by the 1,288.3% increase in losses from discontinued operations to Kshs 1.1 bn from Kshs 0.1 bn in FY’2022 which outweighed the 160.7% increase in profits from continuing operations to Kshs 0.7 bn from Kshs 0.3 bn in FY’2022,
- The company’s turnover increased by 6.3% to Kshs 22.0 from Kshs 20.7 recorded in FY’2022. Meanwhile, total operating cost increased by 3.9% to Kshs 20.8 bn from Kshs 20.1 bn recorded in FY’2022, resulting in a 48.5 increase in operating profit to Kshs 1.0 bn from Kshs. 0.7 bn recorded in FY’2022, and,
- The balance sheet recorded a slight contraction as total assets decreased by 3.5% to Kshs 44.6 bn in FY’2023 from Kshs 46.3 bn in FY’2022 mainly driven by a 42.6% decrease in non-current assets to Kshs 23.6 bn from Kshs 41.2 bn in FY’2022, attributable to the sale of the Ugandan based subsidiary Hima Cement.
Other highlights from the release include:
- Declaration of dividends – The directors of Bamburi Cement Plc have recommended a first and final dividend of Kshs 5.47 per share, translating to a dividend yield of 11.7%, higher than the 2.7% yield recorded in FY’2022.
Going forward, the factors that would drive the company’s growth would be:
- Government’s Housing Program – The current government’s focus on affordable housing aimed at delivering 250,000 units every year is expected to play a part in the growth of the company, as the demand for cement and concrete is likely to be driven by this initiative.
- Innovative and Sustainable projects and products – The company is expected to create partnerships to explore environmentally friendly solutions to building. Partnerships such as the current one with Geocycle and Haller Park are expected to drive the company towards sustainability.
- Liberty Kenya Holdings Plc FY’2023 Financial Results.
During the week, Liberty Kenya Holdings released their FY’2023 results, having fully implemented the new IFRS 17 reporting system. Liberty Kenya Holdings’ Profit After Tax (PAT) increased by 154.7% to Kshs 0.7 bn, from Kshs 0.3 bn recorded in FY’2022, mainly driven by a 148.6% increase in Net insurance income to Kshs 0.9 bn, from Kshs 0.4 bn in FY’2022, and supported by a 41.6% decrease in Net insurance expenses to Kshs 0.3 bn, from Kshs 0.6 bn in FY’2022.
Liberty Kenya Holdings Plc’s FY’2023 Results:
|
Cytonn Report: Liberty Kenya Holdings Income Statement |
|||
|
Item (All figures in Bns) |
FY'2022 |
FY'2023 |
y/y change |
|
Insurance revenue |
12.3 |
13.8 |
12.5% |
|
Insurance service expense |
(9.9) |
(12.5) |
27.1% |
|
Net expense from reinsurance contracts held |
(2.1) |
(0.4) |
(81.6%) |
|
Net Insurance Income |
0.4 |
0.9 |
148.6% |
|
Net Investment Income |
1.4 |
1.6 |
8.9% |
|
Net Insurance and Finance expenses |
(0.6) |
(0.3) |
(41.6%) |
|
Other Income |
0.1 |
0.1 |
16.0% |
|
Other operating expenses |
(0.9) |
(1.2) |
37.1% |
|
Profit Before Tax |
0.5 |
1.1 |
118.8% |
|
Profit After Tax |
0.3 |
0.7 |
151.0% |
|
Cytonn Report: Liberty Kenya Holdings Balance Sheet |
|||
|
Item (All figures in Bns) |
FY'2022 |
FY'2023 |
y/y change |
|
Intangible assets |
1.4 |
1.5 |
4.7% |
|
Financial Investments |
23.1 |
20.3 |
(11.9%) |
|
Other assets |
16.3 |
21.9 |
34.8% |
|
Total Assets |
40.1 |
43.8 |
9.1% |
|
Insurance Contract Liabilities |
21.7 |
23.9 |
10.2% |
|
Provisions & other payables |
2.2 |
1.8 |
(17.1%) |
|
Other Liabilities |
8.2 |
8.5 |
4.1% |
|
Total liabilities |
31.2 |
34.2 |
7.7% |
|
Shareholder funds |
8.5 |
9.2 |
7.6% |
|
Minority Interest |
0.4 |
0.4 |
5.0% |
|
Total Equity |
8.9 |
9.6 |
7.7% |
Key take outs from the results:
- Core Earnings Per share increased by 190.5% to Kshs 1.2 from Kshs 0.4 in FY’2022, driven by the 148.6% increase in net insurance service revenue (net insurance income) to Kshs 0.9 bn from Kshs 0.4 bn in FY’2022 coupled with a 41.6% decrease in insurance and finance expenses to Kshs 0.3 bn from Kshs 0.6 bn in FY’2022,
- Net Investment Income increased by 8.9% to Kshs 1.6 bn in FY’2023, from Kshs 1.4 bn in FY’2022. This was majorly attributable to a significant 1,186.1% increase in investment income to Kshs. 0.2 bn from Kshs 0.01 bn in FY’2022, but was weighed down by the 25.2% increase in losses on financial assets at fair value to Kshs 0.6 bn from Kshs 0.8 bn in FY’2022,
- Insurance revenue increased by 12.5% to Kshs 13.8 bn in FY’2023 from Kshs 12.3 bn in FY’2022, while insurance expenses increased by 27.1% to Kshs 12.5 bn from Kshs 9.9 bn in FY2022, this translated to a Net insurance service result decrease of 46.9% to Kshs 1.3 bn from Kshs 2.4 bn in FY’2022,
- The balance sheet recorded an expansion as total assets increased by 9.1% to Kshs 43.8 bn in FY’2023 from Kshs 40.1 bn in FY’2022 mainly driven by 52.7% increase in cash and cash equivalents to Kshs 12.9 bn from Kshs 8.4 bn in FY’2022, coupled with a 42.1% increase in reinsurance contract assets Kshs 5.7 bn from Kshs 4.0 bn, and,
- Total liabilities increased by 7.7% to Kshs 34.2 bn from Kshs 31.2 bn in FY2022, majorly on the back of the 10.2% increase in insurance contract liabilities to Kshs 23.9 bn from Kshs 21.7 bn in FY’2022, coupled with a 7.4% increase in financial liabilities under investments contracts to Kshs 7.1 bn, from Kshs 6.6 bn in FY’2022.
Other highlights from the release include:
- Declaration of dividends – The directors of Liberty Holdings have recommended a dividend of Kshs 0.373 per share, translating to a payout ratio of 29.7% and a dividend yield of 7.5%.
Going forward, the factors that would drive the company’s growth would be:
- Diversified Products – In Kenya, the short-term insurance business saw an 11.0% increase in insurance revenue, with an improved claim ratio compared to the previous year. The introduction of a retail medical product in the last quarter is expected to address market gaps in that segment.
Valuation Summary:
- We are of the view that Liberty Kenya Holdings Plc is a “Buy” with a target price of Kshs 6.1 representing an upside of 7%, from the current price of 5.0 as of 19th April 2024, inclusive of a dividend yield of 7.5%, and,
- Liberty Kenya Holdings Plc is currently trading at a P/TBV of 0.4x and a P/E of 3x vs an industry average of 0.6x and 5.6x respectively.
We are “Neutral” on the Equities markets in the short term due to the current tough operating environment and huge foreign investor outflows, and, “Bullish” in the long term due to current cheap valuations and expected global and local economic recovery. With the market currently being undervalued for its future growth (PEG Ratio at 0.7x), we believe that investors should reposition towards value stocks with strong earnings growth and that are trading at discounts to their intrinsic value. We expect the current high foreign investors’ sell-offs to continue weighing down the equities outlook in the short term.
- Statutory Review
During the week, The Affordable Housing Regulations, 2024 were published for public participation by the State Department for Housing and Urban Development under the framework of the Affordable Housing Act, 2024 outlining crucial guidelines for the development, allocation, and management of affordable housing units. These regulations aim to provide guidance and establish procedures for the implementation of affordable housing initiatives in Kenya.
Key highlights from the regulations include:
- Exemption regulations: Individuals or income classes can be exempted from the Levy under specific conditions like pension income, medical reimbursements, insurance compensation, or income tax exemptions under an Act of Parliament. Exemption requests must be made in writing to the Cabinet Secretary with reasons specified and accompanied by a tax clearance certificate. An exemption issued is valid for the period and extent specified in the notice. The Cabinet Secretary may recommend the revocation of an exemption if certain conditions are met, such as disqualification or omission of material information during the application process,
- Allocation regulations: A person eligible for allocation must be a Kenyan citizen, above 18 years, and not previously allocated an affordable housing unit. An application for allocation must be made as per the Affordable Housing Board's specified manner and accompanied by required documents like proof of identification, income, deposit, passport-size photo, and list of beneficiaries of the applicant. The deposit payable by an eligible person for an affordable housing unit allocation is set at 10.0% of the sale price. Individuals unable to raise the required deposit can apply for deposit assistance if their monthly income is below Kshs 20,000 and the estimated monthly repayment is less than 30.0% of their income. Any funds provided as deposit aid will be reimbursed without incurring any interest or administrative charges. Upon receipt of an application, the Board will decide and notify the applicant of its decision within a specified timeframe,
- Changing or Reallocation of a Unit: A person can apply for a change of an affordable housing unit if they meet specified allocation criteria, surrender the current unit in good condition, and have paid all service charges and levies. The Board will decide upon receiving the application and notify the applicant of its decision. If the application is approved, the Board will allocate an appropriate affordable housing unit to the applicant and transfer all payments made to the new unit's account. If a person fails to pay for four consecutive months, the Board can take possession of the unit, reallocate it to another eligible person, change the unit to a lower value one, or enter a restructuring arrangement with the defaulter. The Board may change a unit to a lower value one if the defaulter meets the criteria for the lower value unit and the payments made would cover the purchase price of the lower value unit. The interest rate for a loan issued under the Act should not exceed 0% per annum on a reducing balance basis,
- Developing Institutional Housing: A public institution can develop institutional housing if it proves the need for it, has available land, and has management systems in place. The institution must apply in writing to the Board for approval, accompanied by necessary decisions or resolutions. The Board will review the application, decide, and notify the applicant of its decision. If approved, the Board will include the housing in its annual investment program and enter into an agreement with the institution. In case of rejection, the Board will inform the applicant with reasons for the decision. The Board will engage an implementing agency listed in the First Schedule of the Act for the design, development, and maintenance of approved institutional housing units,
- Financing Regulations: An institution or mortgage scheme must apply in writing to the Board for approval to provide financing for off-take. The application should include various documents like a copy of the certificate of incorporation, valid license, and tax compliance certificates. The interest rate or administration fee charged by an approved institution or mortgage scheme for financing should not exceed 9.0% per annum. This rate or fee is determined based on the typology and dimensions of the affordable housing units relative to the incomes of the individual applicants. Institutions or mortgage schemes eligible to enter into financing agreements must satisfy creditworthiness, tax compliance, and other conditions set by the Board. The Board decides on applications within fourteen days and notifies the applicant of its decision,
- Public Participation Guidelines: When conducting public participation, the Board must issue a notice at least 14 days in advance to the public and interested parties. The notice should specify the period, date, time, and purpose of the participation. The Board is required to publish the notice in two newspapers of nationwide circulation and also on a radio station with wide coverage within the County. This ensures transparency and broad dissemination of information regarding the public participation process,
- Rural Affordable Housing Units: An application for a rural affordable housing unit must be made in writing to the Board. The applicant needs to have an operational voluntary savings account with the Fund to be considered. The amount applied for must not exceed Kshs 4.0 mn. The applicant must prove their ability to repay the amount applied for. Voluntary savings can be withdrawn from a voluntary savings account upon verification, where the administrator of the Fund refunds the savings and any accrued interest to the person and closes their savings account. This process is in accordance with section 52(4)(a) of the Act, and,
- Disposal and Sale of Affordable Housing Unit: The purchaser cannot sell the affordable housing unit until 8 years after completing payment of the agreed price. This restriction does not apply if the unit was purchased through a mortgage. If the owner wants to sell the unit after meeting the 8-year requirement, they must seek consent from the Board and follow the Act's guidelines.
- Industry Report
During the week, Hass Consult, a Kenyan Real Estate consulting and development firm, released its House Price Index Q1’2024 Report, focusing on the residential Real Estate sector's performance in the Nairobi Metropolitan Area (NMA). The following are the main findings of the report;
- The average selling prices for all properties showed a 2.7% increase on a quarter-on-quarter (q/q) basis in Q1’2024, contrasting with a marginal 0.02% increase in Q1’2023. This rise was predominantly driven by a 3.7% increase in detached house prices and a 0.6% increase in semi-detached house prices. Additionally, apartments witnessed a 1.5% uptick in selling prices, further contributing to the overall performance. On a year-on-year (y/y) basis, property prices exhibited a 5.3% increase, compared to a 2.0% increase observed in Q1’2023. The surge in property prices is linked to rising interest rates, which have increased the cost of financing house purchases. Additionally, inflation and the depreciation of the shilling have led to higher input costs for developers. As a result, developers are transferring these heightened expenses to homebuyers by increasing selling prices,
- The overall asking rents of housing units in the NMA during Q1’2024 increased by 0.4% q/q, compared to a 0.5% decline recorded in Q1’2023. On a y/y basis, the average asking rent increased by 3.4% compared to the 1.2% decline recorded in Q1’2023. The increase in performance was attributable to increased rents in detached and apartments, registering q/q improvements of 0.1% and 1.4% respectively in Q1’2024, as the market remained sensitive to tough economic conditions,
- Apartments recorded the highest y/y increase in asking rents of 10.6% in Q1’2024, a 7.4% increase from Q1’2023. Conversely, detached units experienced a price correction of 0.1%, while semi-detached units saw a price increase of 2.9% during the period under review. The decrease in detached units and the uptick in apartments and semi-detached units can be attributed to the continuous expansion of the middle class, which favors apartment rentals due to their affordability, as well as the growing demand for semi-detached housing options,
- Within the Nairobi Suburbs detached and semi-detached houses market, Nyari Estate emerged as the top performer, witnessing a y/y sales price appreciation of 8.8%. This surge can be attributed to factors such as i) the area benefits from a well-connected road network, facilitated by infrastructure developments like the Waiyaki Way and Red Hill Road, and ii) its proximity to the Central Business District (CBD. In contrast, Westlands experienced the highest year-on-year decline of 1.1%, mainly due to reduced demand for houses in the area, prompted by the pursuit of more affordable housing alternatives,
- In the Nairobi Suburbs apartments, Kileleshwa was the best-performing region recording a y/y capital appreciation of 6.8%, due to i) its close proximity to social commercial, social, and recreational amenities such as Fogo Gaucho, and the Lavington Mall ii) close proximity to Central Business District and due to good road connectivity reducing commute time, and, iii) a growing middle-class population in the areas driving demand for apartments in the area upwards. On the other hand, Upperhill realized the highest y/y price correction of 6.0% attributed to city residents opting for neighboring areas such as Westlands and Spring Valley,
- In the satellite towns, properties in Athi River saw the highest year-on-year price appreciation, standing at 12.2%. This surge can be attributed to several factors: i) its proximity to commercial, social, educational institutions, and recreational amenities like Signature Mall, Coloho Mall, and Whistling Morans, ii) enhanced infrastructure development such as the Athi River interchange, the Nairobi Expressway in neighboring Mlolongo, and the presence of the Standard Gauge Railway (SGR) station, all contributing to improved accessibility; iii) the growing population driven by the presence of major mining and cement companies like Bamburi Cement and East Africa Portland Cement Company, creating employment opportunities and increasing demand. Conversely, properties in Limuru experienced the lowest y/y price increase of 2.0% despite an improvement from a price correction of 3.4% in the previous quarter, mainly due to reduced demand resulting from competition from other neighboring residential areas, its distant location from Nairobi CBD and other major urban business centers, as well as key transportation hubs like Jomo Kenyatta International Airport (JKIA) and the SGR, and,
- In satellite towns’ apartments, Thika recorded the highest y/y price appreciation of 8.8% which was supported by good infrastructure access and a growing population. Conversely, Kitengela realized the highest y/y price correction of 1.5% attributed to stiff competition faced from neighbourhoods such as Athi River, Mlolongo, and Syokimau, which are strategically located along the Mombasa-Nairobi Highway enhancing accessibility and demand by buyers as well as their closer proximity to amenities such as Crystal Rivers and Signature malls, and the Nairobi CBD.
The findings of the report are in line with our Cytonn Markets Review – Q1’2024, highlighting that selling prices of residential properties in the Nairobi Metropolitan Area (NMA) recorded a 0.6% appreciation in Q1’2024. The performance was supported by 0.6% price appreciation realized by apartments and detached and semi-detached units each during the period under review.
Additionally, Hass Consult released their Land Price Index Q1’2024 Report which highlights the performance of the Real Estate land sector in the Nairobi Metropolitan Area (NMA). The following were the key take outs from the report;
- The average q/q selling prices for land in the Nairobi suburbs grew by 1.3%, compared to a 0.3% increase recorded in Q1’2023. On a y/y basis, the performance represented a 5.0% increase, compared to the 1.4% increase recorded in Q1’2023. Consequently, q/q and y/y land prices in satellite towns of Nairobi increased by 3.0% and 11.2% respectively, compared to the 1.3% and 8.1% growth respectively, recorded in Q1’2023. The market improvement continues to demonstrate the sector’s resilience, with demand growing on the back of emerging opportunities in retail, manufacturing, and logistics needed to serve the rapidly urbanizing towns as well as the Nairobi CBD,
- Lang’ata was the best-performing node in the Nairobi suburbs with a y/y price appreciation of 10.1%. This was attributed to; i) its close proximity to commercial, social, educational institutions and recreational amenities, ii) enhanced access due to good infrastructure, iii) close proximity to Central Business District, and, iv) a growing middle-class population in the areas driving demand in the area. Conversely, land in Kileleshwa recorded the highest y/y price correction of 1.5%. This is attributed to the land buyer’s preference for neighboring Kilimani and Lavington areas, which offer a wider range of amenities, including better infrastructure, proximity to commercial centers, and a more established residential community, and,
- For satellite towns, Ongata Rongai was the best-performing node with a y/y capital appreciation of 16.0%, followed by Syokimau which recorded a y/y capital appreciation of 15.8%. The improvement in performance in Ongata Rongai was driven by; i) increased demand for land due to its affordability, ii) its close proximity to the Nairobi CBD and major urban nodes as well as opulent residential areas such as Karen, and, iii) good infrastructure enhancing connectivity. On the other hand, land prices in Syokimau were supported by its strategic location along major transportation routes, such as the Nairobi-Mombasa highway, the Nairobi Expressway, and the Standard Gauge Railway (SGR), facilitating easy access to Nairobi and other key areas. Conversely, Limuru was the least performing node with a y/y price appreciation of 4.9%, attributable to increased competition from the neighboring areas which are closer in proximity to the CBD and other urban areas.
The findings of the report are also in line with our Cytonn Markets Review – Q1’2024 which highlighted that the overall average selling prices for land in the NMA appreciated by 4.3% to record an average price per acre of Kshs 133.7 mn per acre in Q1’2024. This was mainly attributed to; i) positive demographics driving demand for land facilitated by high population and urbanization growth rates of 1.9% and 3.7%, above the global averages of 0.9% and 1.6% respectively, ii) improved development of infrastructure such as roads, railways, water and sewer lines which has improved and opened up areas for investment, ultimately increasing property prices, iii) growth in popularity of satellite towns by investors and buyers which provide affordable land options in comparison to the suburbs and key commercial zones, iv) Increased construction activities particularly in the residential sector driven by the government’s affordable housing agenda thus boosting demand for land, v) limited supply of land especially in urban areas which has contributed to rising land prices, vi) rising middle-income class population with more disposable income to invest, and, vii) land is the most preferred choice of investment among a majority of people which further drives up demand for land.
- Industrial Sector
During the week, NCBA Bank Kenya disclosed that it extended an additional Kshs 1.6 bn (USD 12 mn) in lending to Grit Services Limited, a Mauritius-based Real Estate firm, during the first half of the fiscal year ending December 2023. This brought the total dollar-denominated credit facilities provided by NCBA to Grit Services to Kshs 3.9 bn (USD 29.5 mn) by December 2023, up from Kshs 2.3 bn (USD 17.5 mn) in June 2023. Consequently, NCBA's share of Grit's parent company's total borrowings has increased from 3.8% to 7.1% during the period under review.
Grit's parent company, Grit Real Estate Income Group, has been expanding its investments in Kenya and other regional property markets. Grit Services Limited, a key subsidiary of the multinational, holds assets in Kenya such as Buffalo Mall in Naivasha, the US embassy's gated estate in Nairobi, Imperial Warehouse, and Orbit Africa's manufacturing facilities. The firm benefits from a revolving credit facility with NCBA, enabling it to borrow, repay, and borrow again on an ongoing basis.
The increased funding provided by NCBA to Grit Services Limited is set to have a profound effect, not just on the company's growth strategy, but also on Kenya's industrial sector as a whole. This injection of capital is expected to bolster Grit's ongoing investments, particularly through its subsidiary Bora Africa, which functions as a specialized vehicle for industrial Real Estate endeavors. Additionally, Grit is in the process of transferring a 99.9% stake in Bora Africa to its Real Estate development arm, Gateway Real Estate Africa Ltd (GREA). This strategic move aims to raise funds to finance Grit's share of a USD 100.0 mn shareholder cash call initiated by GREA, with the latter aiming to maintain a majority stake in Bora Africa.
With Bora Africa focusing on industrial Real Estate and consolidating Grit's owned assets such as Imperial, Bollore, and Orbit, among others, the increased funding from NCBA will likely facilitate the expansion of Bora Africa's project pipeline. This expansion not only strengthens Grit's presence in the industrial Real Estate market but also contributes to economic growth and job creation in Kenya. Furthermore, the confidence shown by financial institutions like NCBA in supporting large-scale Real Estate developments, particularly in the industrial sector, signals positive prospects for Kenya's Real Estate landscape.
- Real Estate Investments Trusts (REITs)
On the Unquoted Securities Platform, as per the last trading data recorded on 22nd March 2024, Acorn D-REIT and I-REIT traded at Kshs 24.4 and Kshs 21.7 per unit, respectively. The performance represented a 22.0% and 8.3% gain for the D-REIT and I-REIT, respectively, from the Kshs 20.0 inception price. The volumes traded for the D-REIT and I-REIT came in at 12.3 mn and 30.7 mn shares, respectively, with a turnover of Kshs 257.5 mn and Kshs 633.8 mn, respectively, since inception in February 2021.
REITs provide various benefits like tax exemptions, diversified portfolios, and stable long-term profits. However, the continuous deterioration in the performance of Kenyan REITs and the restructuring of their business portfolios is hampering major investments that had previously been made. The other general challenges include; i) inadequate comprehension of the investment instrument among investors, ii) prolonged approval processes for REIT creation, iii) high minimum capital requirements of Kshs 100.0 mn for trustees, and, iv) minimum investment amounts set at Kshs 5.0 mn, continue to limit the performance of the Kenyan REITs market.
We expect the performance of Kenya’s Real Estate sector will be supported by; i) increased initiations and development of affordable housing projects expected to boost the residential sector, ii) relatively positive demographics in the country necessitating the demand for housing and Real Estate, iii) continued infrastructural improvements opening up new areas for investments, and, iv) expansion activities in the industrial sector. However, factors such as rising costs of construction, limited investor knowledge in REITs, and, existing oversupply in select Real Estate sectors will continue to hinder the optimal performance of the sector by limiting developments and investments.
Following the release of the FY’2023 results by Kenyan banks, the Cytonn Financial Services Research Team undertook an analysis on the financial performance of the listed banks and identified the key factors that shaped the performance of the sector. For the earnings notes of the various banks, click the links below:
- Equity Group FY’2023 Earnings Note;
- KCB Group FY’2023 Earnings Note;
- Standard Chartered Bank Kenya FY’2023 Earnings Note;
- ABSA Bank Kenya FY’2023 Earnings Note;
- NCBA Group FY’2023 Earnings Note;
- Co-operative Bank FY’2023 Earnings Note;
- Diamond Trust Bank Kenya (DTB-K) FY’2023 Earnings Note;
- I&M Group Holdings FY’2023 Earnings Note;
- Stanbic Holdings FY’2023 Earnings Note;
- HF Group FY’2023 Earnings Note;
The core earnings per share (EPS) for the listed banks recorded a weighted growth of 11.4% in FY’2023, compared to a weighted growth of 26.6% recorded in FY’2022, an indication of sustained performance despite the tough operating environment occasioned by elevated inflationary pressures experienced during the period, with the inflation rate in FY’2023 averaging 7.7%, marginally higher than the 7.6% average in FY’2022, and a depreciating Shilling, with the Kenyan Shilling having depreciated by 26.8% against the USD in 2023. The performance in FY’2023 was supported by a 20.6% growth in net interest income coupled with a 16.4% growth in non-funded income. The growth in NFI was partly driven by the increase in foreign exchange income recorded by the banks during the period as a result of increased dollar demand in the country. However, the asset quality of listed banks deteriorated, with the weighted average Gross Non-Performing Loan ratio (NPL) increasing by 0.9% points to 12.6%, from 11.7% recorded in FY’2022. The performance remained 1.7% points above the ten-year average of 10.8%.
The report is themed “Steady Profitability Amidst Economic Headwinds”, and examines the primary elements that shaped the banking sector’s performance in FY’2023. It highlights the prevailing trends, the obstacles encountered by banks, and the areas that will be vital for the sector’s future growth and stability. Consequently, we will discuss the following:
- Key Themes that Shaped the Banking Sector Performance in FY’2023,
- Summary of the Performance of the Listed Banking Sector in FY’2023,
- The Focus Areas of the Banking Sector Players Going Forward, and,
- Brief Summary and Ranking of the Listed Banks based on the outcome of our analysis.

Disclaimer: The views expressed in this publication are those of the writers where particulars are not warranted. This publication is meant for general information only and is not a warranty, representation, advice or solicitation of any nature. Readers are advised in all circumstances to seek the advice of a registered investment advisor.

- Talk to us
- Kenya
- P.O Box 20695 - 00200, Nairobi, Kenya
- Cell +254709101200
- Tel +254709101200
- WhatsApp +254741676635
- United States
- +254709101200
- DOWNLOAD OUR APP
-


- Kenya
- 8th Floor, Pinetree Plaza, Kaburu Drive, Ngong Road, Nairobi, Kenya
- USA
- Suite 1150, 1775 Eye Street NW, USA, Washington DC 20006, USA
- Investments
- High Yield
- Private Equity
- Real Estate
- Real Estate
- RiverRun Estates
- Cytonn Towers
- The Ridge
- Taraji Heights
- The Alma