Kenya Retirement Benefits Schemes FY’2021 Performance, & Cytonn Weekly #10/2022
By Research Team, Mar 13, 2022
Executive Summary
Fixed Income
During the week, T-bills remained oversubscribed, albeit at a lower level than the previous week, with the overall subscription rate coming in at 102.1%, down from the 122.1% recorded the previous week. The oversubscription is partly attributable to the eased liquidity in the money market, with the average interbank rate coming in at 5.3%, from 5.5% recorded the previous week. The 364-day paper recorded the highest subscription rate, receiving bids worth Kshs 13.4 bn against the offered Kshs 10.0 bn, translating to a subscription rate of 133.9%, an increase from the 68.7% recorded the previous week. The performance is partly attributable to investors’ preference for the longer-dated paper, which offers a higher yield of 9.8% compared to the 8.0% and 7.2% yields offered by the 182-day and 91-day papers, respectively. The subscription rate for the 182-day paper and 91-day paper declined to 58.1% and 132.4%, from 126.0% and 246.0%, respectively. The government continued rejecting expensive bids, accepting bids worth Kshs 23.1 bn out of the Kshs 24.5 bn worth of bids received, translating to an acceptance rate of 94.3%.
In the Primary Bond Market, the government released the auction results for the recently re-opened bonds namely; FXD1/2021/05, FXD1/2020/015 and FXD1/2021/025. The three bonds recorded an undersubscription, with the subscription rate coming in at 81.9%;
Equities
During the week, the equities market was on a downward trajectory, with NASI, NSE 20 and NSE 25 declining by 3.4%, 1.8% and 2.4%, respectively, taking their YTD performance to losses of 4.8%, 2.6% and 3.8% for NASI, NSE 20 and NSE 25, respectively. The equities market performance was driven by losses recorded by large cap stocks such as Safaricom, EABL, KCB and Equity Group of 5.3%, 2.4%, 1.4% and 1.0%, respectively. The losses were however mitigated by gains recorded by other large cap stocks such as ABSA of 1.3%. Additionally, the Central Bank of Kenya (CBK) released the Commercial Banks’ Credit Survey Report for the quarter ended December 2021, highlighting that banking sector’s loan book recorded an 8.3% y/y growth, with gross loans increasing to Kshs 3.2 tn in December 2021, from Kshs 3.0 tn in December 2020;
Real Estate
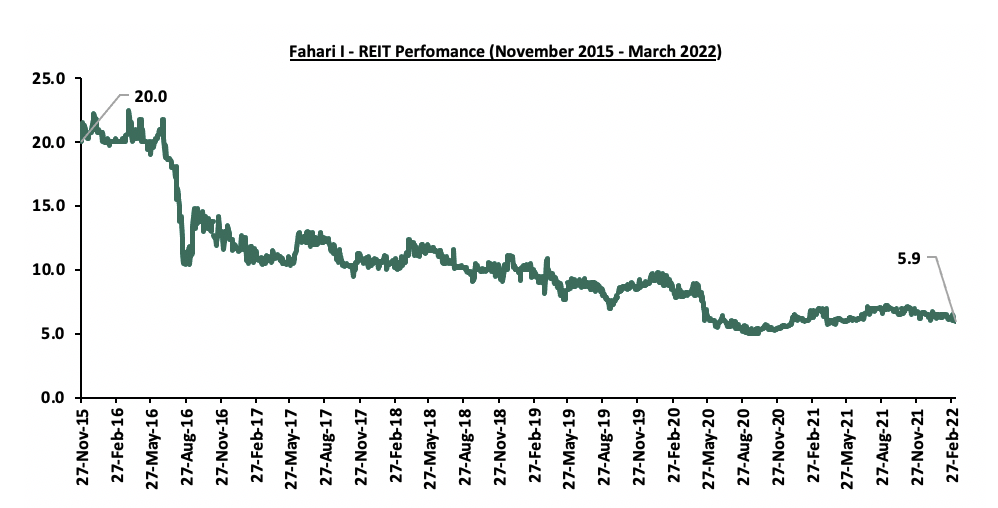
During the week, Cytonn Group, under the hospitality arm of the business, launched CySuites Hospitality Management Company, a serviced apartment hotel management company, whose primary focus is optimizing operational and managerial efficiency of serviced apartments on behalf of owners as well as investors. In the listed Real Estate, the ILAM Fahari I-REIT closed the week trading at an average price of Kshs 5.9 per share. This represented a 9.2% and 7.8% Week-to-Date (WTD) and Year-to-Date (YTD) decline from Kshs 6.5 per share and Kshs 6.4 per share, respectively;
Focus of the Week
According to the ACTSERV 2021 Retirement Benefits Schemes Investments Performance Survey, segregated retirement benefits schemes recorded an 11.6% return in 2021, up from the 7.0% recorded in 2020. The increase was largely supported by the performance of equities investments made by the schemes, which recorded a 16.9% gain, up from a 10.4% decline recorded in 2020. Additionally, the retirement benefits schemes’ Assets under Management increased by 11.8% to Kshs 1.5 tn in June 2021, from Kshs 1.3 tn in June 2020. On a q/q basis, the AUM grew by 5.7% from Kshs 1.4 tn recorded in December 2020. This week we shall review the overall performance of retirement benefits schemes over time with a key focus on FY’2021;
- Weekly Rates:
- Cytonn Money Market Fund closed the week at a yield of 10.56%. To invest, dial *809#;
- Cytonn High Yield Fund closed the week at a yield of 13.94% p.a. To invest, email us at sales@cytonn.com and to withdraw the interest, dial *809#;
- Justin Mwangi, an Investment Analyst, was on Metropol TV to discuss the viability of the Fuel Subsidy Program under the National Treasury, increase in food inflation and overall effect on Kenya’s inflation. Watch Justin here,
- We continue to offer Wealth Management Training every Thursday and every third Saturday of the month, from 9:00 am to 11:00 am, through our Cytonn Foundation. The training aims to grow financial literacy among the general public. To register for any of our Wealth Management Trainings, click here;
- If interested in our Private Wealth Management Training for your employees or investment group, please get in touch with us through wmt@cytonn.com;
- Any CHYS and CPN investors still looking to convert are welcome to consider one of the five projects currently available for conversion, click here for the latest conversion term sheet;
- Cytonn Insurance Agency acts as an intermediary for those looking to secure their assets and loved ones’ future through insurance namely; Motor, Medical, Life, Property, WIBA, Credit and Fire and Burglary insurance covers. For assistance, get in touch with us through insuranceagency@cytonn.com;
- Cytonnaire Savings and Credit Co-operative Society Limited (SACCO) provides a savings and investments avenue to help you in your financial planning journey. To enjoy competitive investment returns, kindly get in touch with us through clientservices@cytonn.com;
Real Estate Updates:
- For an exclusive tour of Cytonn’s real estate developments, visit: Sharp Investor's Tour, and for more information, email us at sales@cytonn.com;
- Phase 3 of The Alma is now ready for occupation. To rent please email properties@cytonn.com;
- We have 8 investment-ready projects, offering attractive development and buyer targeted returns; See further details here: Summary of Investment-ready Projects;
- For recent news about the group, see our news section here;
Hospitality Updates:
- Cytonn Investments Group, under the hospitality arm of the business, launched CySuites Hospitality Management Company, a serviced apartment hotel management company. See further details here;
- We currently have promotions for Staycations. Visit cysuites.com/offers for details or email us at sales@cysuites.com;
Money Markets, T-Bills & T-Bonds Primary Auction:
During the week, T-bills remained oversubscribed, albeit at a lower level than the previous week, with the overall subscription rate coming in at 102.1%, down from the 122.1% recorded the previous week. The oversubscription is partly attributable to the eased liquidity in the money market, with the average interbank rate coming in at 5.3%, from 5.5% recorded the previous week. The 364-day paper recorded the highest subscription rate, receiving bids worth Kshs 13.4 bn against the offered Kshs 10.0 bn, translating to a subscription rate of 133.9%, an increase from the 68.7% recorded the previous week. The performance is partly attributable to investors’ preference for the longer-dated paper, which offers a higher yield of 9.8% compared to the 8.0% and 7.2% yields offered by the 182-day and 91-day papers, respectively. The subscription rate for the 182-day paper and 91-day paper declined to 58.1% and 132.4%, from 126.0% and 246.0%, respectively. The yields on the government papers were on a downward trajectory, with the yields on the 364-day, 182-day and the 91-day papers declining by 0.3 bps, 3.1 bps and 5.9 bps to 9.8%, 8.0% and 7.2%, respectively. The government continued rejecting expensive bids, accepting bids worth Kshs 23.1 bn out of the Kshs 24.5 bn worth of bids received, translating to an acceptance rate of 94.3%.
In the Primary Bond Market, the government released the auction results for the recently re-opened bonds namely; FXD1/2021/05, FXD1/2020/15 and FXD1/2021/25. The three bonds recorded an undersubscription, with the subscription rate coming in at 81.9%, partly attributable to the tightened liquidity in the money markets during the bonds’ sale period, with the interbank rate averaging 5.6%, in comparison to an average rate of 4.7% in February 2022. The government sought to raise Kshs 50.0 bn for budgetary support, received bids worth Kshs 40.9 bn and accepted bids worth Kshs 18.5 bn, translating to a 45.1% acceptance rate. The low acceptance rate for the bonds can be attributed to investors demanding a higher premium to compensate for duration risks and expected inflationary pressures following the continued rise in global fuel prices. Investors preferred the longer-tenure issue; FXD1/2021/25 which received bids worth Kshs 22.6 bn, representing 55.2% of the total bids received due to its higher returns of 14.0% compared to the 13.7% and 12.0% returns offered by FXD1/2020/15 and FXD1/2021/25, respectively. The coupons for the three bonds were 11.3%, 12.8% and 13.9%, and the weighted average yield for the issues were 12.0%, 13.7%, and 14.0%, for FXD1/2021/05, FXD1/2020/15 and FXD1/2021/25, respectively.
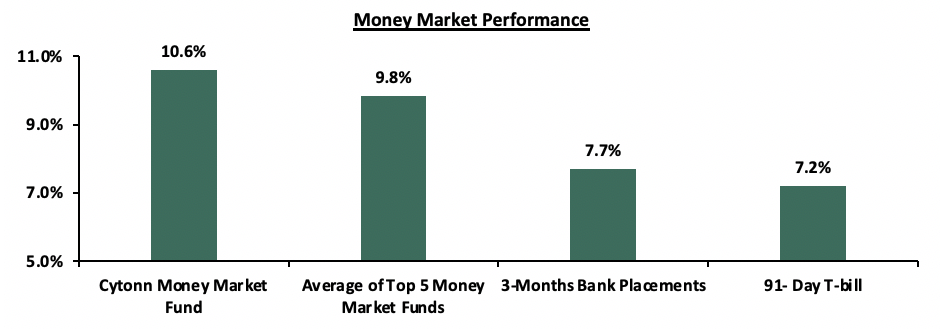
In the money markets, 3-month bank placements ended the week at 7.7% (based on what we have been offered by various banks), while the yield on the 91-day T-bill declined by 5.9 bps to 7.2%. The average yield of the Top 5 Money Market Funds declined marginally by 0.1% points to 9.8%, from 9.9% recorded the previous week. Similarly, the yield on the Cytonn Money Market Fund declined marginally by 0.1% points to 10.6%, from 10.7% recorded the previous week.
The table below shows the Money Market Fund Yields for Kenyan Fund Managers as published on 11th March 2022:
|
Money Market Fund Yield for Fund Managers as published on 11th March 2022 |
||
|
Rank |
Fund Manager |
Effective Annual Rate |
|
1 |
Cytonn Money Market Fund |
10.6% |
|
2 |
Zimele Money Market Fund |
9.9% |
|
3 |
Nabo Africa Money Market Fund |
9.7% |
|
4 |
Sanlam Money Market Fund |
9.6% |
|
5 |
GenCap Hela Imara Money Market Fund |
9.5% |
|
6 |
Madison Money Market Fund |
9.4% |
|
7 |
Apollo Money Market Fund |
9.4% |
|
8 |
Dry Associates Money Market Fund |
9.0% |
|
9 |
CIC Money Market Fund |
8.9% |
|
10 |
Orient Kasha Money Market Fund |
8.7% |
|
11 |
Co-op Money Market Fund |
8.6% |
|
12 |
ICEA Lion Money Market Fund |
8.3% |
|
13 |
NCBA Money Market Fund |
8.3% |
|
14 |
British-American Money Market Fund |
8.3% |
|
15 |
AA Kenya Shillings Fund |
8.2% |
|
16 |
Old Mutual Money Market Fund |
7.1% |
Source: Business Daily
Liquidity:
During the week, liquidity in the money markets eased, with the average interbank rate declining by 0.2% points to 5.3%, from 5.5%, as recorded the previous week, partly attributable to government payments which offset tax remittances. The average interbank volumes traded increased by 2.1% to Kshs 12.3 bn, from Kshs 12.0 bn recorded the previous week.
Kenya Eurobonds:
During the week, Kenyan Eurobonds recorded an improved performance with five out the six Kenyan Eurobonds recording declines in the yields, attributable to foreign investors attaching slightly lower risk premiums from emerging markets' Eurobonds as a result of increased conflict resolution talks between Russia and Ukraine. The geopolitical tensions between the two countries had caused massive selloffs during the previous week in emerging markets Eurobonds with foreign investors preferring relatively safer havens. Yields on the 10-year bond and 30-year bond issued in 2018 declined by 0.6% and 0.5% points to 9.2% and 10.0%, respectively. Similarly, yields on the 7-year and 12-year Eurobonds issued in 2021 declined by 1.0% points to 9.2% and 9.0%, respectively. The 12-year Eurobond issued in 2019 declined by 0.8% points to 9.5%, whereas yields on the 10-year bond issued in 2014 increased by 0.2% points to 6.7%. Below is a summary of the performance:
|
Kenya Eurobond Performance |
||||||
|
|
2014 |
2018 |
2019 |
2021 |
||
|
Date |
10-year issue |
10-year issue |
30-year issue |
7-year issue |
12-year issue |
12-year issue |
|
3-Jan-22 |
4.4% |
5.8% |
8.1% |
5.6% |
6.7% |
6.6% |
|
1-Mar-22 |
5.3% |
8.2% |
9.7% |
8.2% |
8.2% |
8.5% |
|
4-Mar-22 |
6.5% |
9.8% |
10.5% |
10.2% |
10.3% |
10.0% |
|
7-Mar-22 |
6.9% |
10.3% |
10.8% |
9.6% |
10.6% |
9.8% |
|
8-Mar-22 |
6.7% |
10.0% |
10.6% |
9.2% |
10.2% |
9.3% |
|
9-Mar-22 |
6.7% |
9.2% |
10.0% |
9.2% |
9.5% |
9.0% |
|
10-Mar-22 |
6.7% |
9.2% |
10.0% |
9.2% |
9.5% |
9.0% |
|
Weekly Change |
0.2% |
(0.6%) |
(0.5%) |
(1.0%) |
(0.8%) |
(1.0%) |
|
MTD Change |
1.4% |
1.0% |
0.3% |
1.0% |
1.3% |
0.5% |
|
YTD Change |
2.3% |
3.4% |
1.9% |
3.6% |
2.8% |
2.4% |
Source: CBK
Kenya Shilling:
During the week, the Kenyan shilling depreciated by 0.2% against the US dollar, to close the week at Kshs 114.2, from Kshs 113.9 recorded the previous week, partly attributable to increased dollar demand from the oil and energy sectors. Key to note, this is the lowest the Kenyan shilling has ever depreciated against the dollar. In the coming week, we shall be holding a discussion on our Twitter platform on the Performance of the Kenyan Shilling, the factors that have led to its current trend and most importantly what can be done to stem the continued depreciation. On a year to date basis, the shilling has depreciated by 0.9% against the dollar, in comparison to the 3.6% depreciation recorded in 2021. We expect the shilling to remain under pressure in 2022 as a result of:
- Rising global crude oil prices on the back of supply constraints and geopolitical pressures at a time when demand is picking up with the easing of COVID-19 restrictions and as economies reopen. Key to note, risks abound the recovery following the emergence of the new COVID-19 variants,
- Increased demand from merchandise traders as they beef up their hard currency positions in anticipation for more trading partners reopening their economies globally,
- An ever present current account deficit due to an imbalance between imports and exports, with Kenya’s current account deficit estimated to come in at 5.4% of GDP in 2021, having expanded by 44.6% to Kshs 127.6 bn in November 2021, from Kshs 88.3 bn recorded in November 2020, attributable to a robust increase in commercial imports by 1% to Kshs 185.9 bn in November 2021, from Kshs 88.3 bn in November 2020, and,
- The aggressively growing government debt, with Kenya’s public debt having increased at a 10-year CAGR of 18.4% to Kshs 8.0 tn in December 2021, from Kshs 1.5 tn in December 2011 thus putting pressure on forex reserves to service some of the public debt.
The shilling is however expected to be supported by:
- High Forex reserves currently at USD 8.0 bn (equivalent to 4.9-months of import cover), which is above the statutory requirement of maintaining at least 4.0-months of import cover, and the EAC region’s convergence criteria of 4.5-months of import cover. In addition, the reserves were boosted by the USD 1.0 bn proceeds from the Eurobond issued in July 2021 coupled with the USD 972.6 mn IMF disbursement and the USD 130.0 mn World Bank loan financing received in June 2021, and,
- Improving diaspora remittances evidenced by a 21.7% y/y increase to USD 338.7 mn in January 2022, from USD 278.3 mn recorded over the same period in 2021, which has continued to cushion the shilling against further depreciation.
Rates in the Fixed Income market have remained stable due to the relatively ample liquidity in the money market. The government is 11.6% ahead of its prorated borrowing target of Kshs 468.5 bn having borrowed Kshs 523.1 bn of the Kshs 658.5 bn borrowing target for the FY’2021/2022. We expect a gradual economic recovery as evidenced by the revenue collections of Kshs 1.1 tn during the first seven months of the current fiscal year, which was equivalent to 103.8% of the prorated revenue collection target. However, despite the projected high budget deficit of 11.4% and the lower credit rating from S&P Global to 'B' from 'B+', we believe that the support from the IMF and World Bank will mean that the interest rate environment will remain stable since the government is not desperate for cash. Owing to this, our view is that investors should be biased towards short-term fixed-income securities to reduce duration risk.
Markets Performance
During the week, the equities market was on a downward trajectory, with NASI, NSE 20 and NSE 25 declining by 3.4%, 1.8% and 2.4%, respectively, taking their YTD performance to losses of 4.8%, 2.6% and 3.8% for NASI, NSE 20 and NSE 25, respectively. The equities market performance was driven by losses recorded by large cap stocks such as Safaricom, EABL, KCB and Equity Group of 5.3%, 2.4%, 1.4% and 1.0%, respectively. The losses were however mitigated by gains recorded by other large cap stocks such as ABSA of 1.3%.
During the week, equities turnover increased by 5.1% to USD 21.4 mn, from USD 20.4 mn recorded the previous week, taking the YTD turnover to USD 197.6 mn. Foreign investors remained net sellers, with a net selling position of USD 3.8 mn, from a net selling position of USD 3.0 mn recorded the previous week, taking the YTD net selling position to USD 9.2 mn.
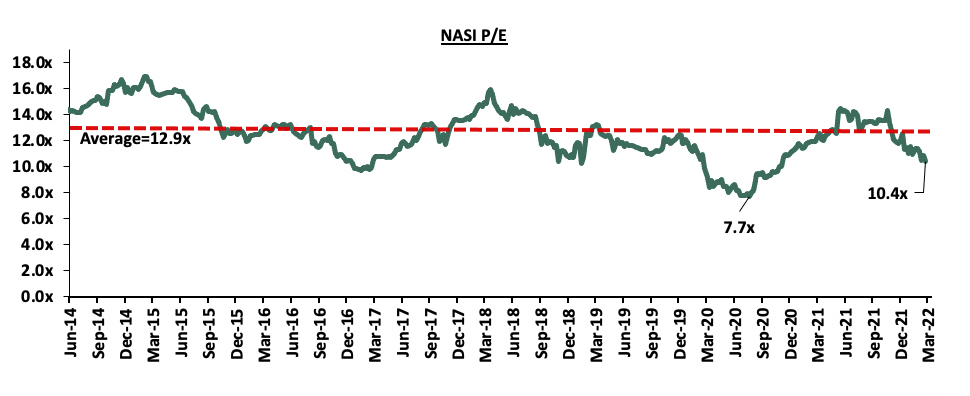
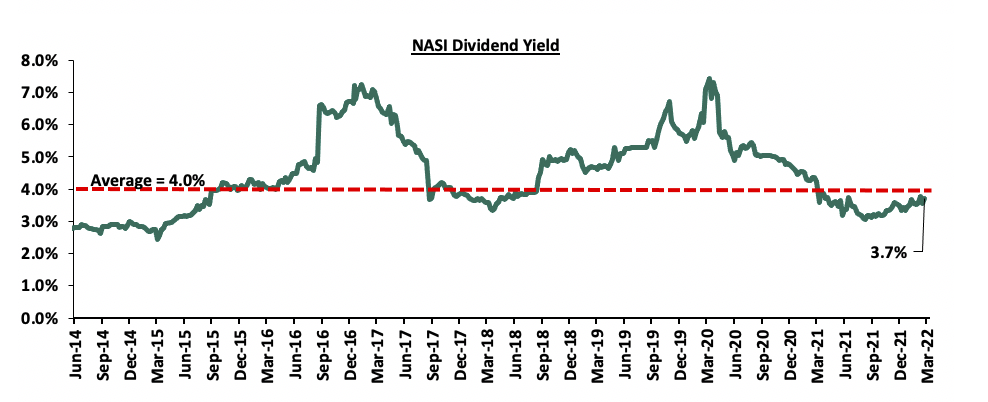
The market is currently trading at a price to earnings ratio (P/E) of 10.4x, 19.2% below the historical average of 12.9x, and a dividend yield of 3.7%, 0.3% points below the historical average of 4.0%. Key to note, NASI’s PEG ratio currently stands at 1.3x, an indication that the market is trading at a premium to its future earnings growth. A PEG ratio greater than 1.0x indicates the market may be overvalued while a PEG ratio less than 1.0x indicates that the market is undervalued. The current P/E valuation of 10.4x is 35.5% above the most recent trough valuation of 7.7x experienced in the first week of August 2020. The charts below indicate the historical P/E and dividend yields of the market:
Weekly highlight:
CBK Credit Survey Report – Q4’2021
During the week, the Central Bank of Kenya (CBK), released the Commercial Banks’ Credit Survey Report for the quarter ended December 2021. The quarterly Credit Officer Survey is undertaken by the CBK to identify the potential drivers of credit risk in the banking sector. During the quarter, 38 operating commercial banks and 1 mortgage finance company participated in the Commercial Banks Credit Officer Survey. The report highlights that the banking sector’s loan book recorded an 8.3% y/y growth, with gross loans increasing to Kshs 3.25 tn in December 2021, from Kshs 3.00 tn in December 2020. On a q/q basis, the loan book increased by 1.7% from Kshs 3.19 tn in September 2021. Other key take-outs from the report include:
- Profit before Tax (PBT) for the banking sector increased by 109.2% y/y to Kshs 49.3 bn in Q4’2021, from Kshs 23.6 bn in Q4’2020. Quarterly, Profit before Tax increased by 0.4% to Kshs 49.3 bn in December 2021, from Kshs 49.1 bn in September 2021 attributable to the higher increase in operating income by 8.4%, compared to the 5.9% increase recorded by operating expenses. Additionally, Return on Assets (RoA) remained unchanged at 2.6% in December 2021, as was recorded in September 2021. This however marked a 1.0% point increase from the RoA of 1.6% recorded in December 2020,
- The aggregate balance sheet expanded by 10.8% y/y, to Kshs 6.0 tn in December 2021, from Kshs 5.4 tn in December 2020 driven by an 8.3% increase in gross loans to Kshs 3.2 tn in Q4’2021, from Kshs 3.0 tn in Q4’2020. Quarterly, the balance sheet grew by 3.2% from the Kshs 5.7 tn recorded in September 2021,
- Asset quality in the banking sector improved, with the Gross NPL ratio declining to 13.1% as at December 2021, from 14.1% recorded in December 2020 and 13.6% recorded in September 2021. The improvement in asset quality during the quarter is attributable to the improved business environment in the country which has in turn led to improved loan repayment capacity by creditors and helped reduce credit risk,
- The banks’ capital adequacy remained favorable, with the total capital to risk weighted assets ratio increasing to 19.6% in December 2021, from 19.2% recorded in December 2020. Quarterly, the total capital to risk weighted assets ratio also increased from the 18.8% in September 2021. The q/q performance was attributable to higher increase in the total capital of 6.7% compared to the 2.3% increase in total risk weighted assets during the quarter, bringing the total capital to risk weighted assets ratio to 19.6%, 5.1% points above the minimum statutory limit of 14.5%,
- IFRS 9 implementation had an adverse effect on the banking sector’s capital adequacy as a result of increased provisioning due to the challenging business environment. Commercial banks have had to provide provisions for both incurred and expected credit losses, and,
- Average liquidity in the banking sector increased to 56.2% in December 2021, from 54.6% in December 2020. The improved liquidity position was attributed to; i) increase in deposit mobilization contributing 53.0%, ii) loan recovery efforts contributing 30.0%, iii) maturity of government securities contributing 12.0%, and iv) capital injection contributing 5.0%. However, liquidity declined quarterly to 56.2% in December 2021 from 56.7% in September 2021, and 36.2% points above the minimum statutory ratio of 20.0%.
The gradual reopening of the economy on the back of the lifting of COVID-19 restrictions and increased vaccination rollout, has led to an improved business environment, and subsequently seen credit risk continue to decline as highlighted in our Q3’2021 Banking report and an improved asset quality demonstrated by banks’ NPL ratio declining to 13.1% in Q4’2021, from 14.1% in Q4’2020 and 13.6% in Q3’2021. Going forward, we expect lending to increase supported by two main factors; (i) Improving asset quality – as the Kenyan economy to recover from the COVID-19 adverse effects, the credit risk will gradually decline as borrowers will be in a better position to repay their loans and banks will extend more credit as there is relatively lower risk of defaults, and, ii) Approvals of risk based lending models. The Central Bank of Kenya having started the approvals for the banks’ risk pricing models that will enable banks to price loans according to the perceived risk and hence increase their willingness to lend to riskier borrowers they would have previously shunned out. Overall, the banking sector has remained resilient in 2021 as the aggregate balance sheet expanded by 10.8% y/y from December 2020 and profit before tax recorded by 109.2% y/y increase to Kshs 49.3 bn in December 2021, from Kshs 23.6 bn in December 2020 and recorded a quarterly increase of 0.4%, from Kshs 49.1 bn in September 2021. Despite the possible risks to the sector and overall business environment posed by the upcoming August 2022 general elections and possible discovery of new COVID-19 variants, we expect the sector to continue to exhibit resiliency and stability going forward supported by adequate liquidity and capital levels.
Cytonn Coverage:
|
Company |
Price as at 04/03/2022 |
Price as at 11/03/2022 |
w/w change |
YTD Change |
Year Open 2022 |
Target Price* |
Dividend Yield |
Upside/ Downside** |
P/TBv Multiple |
Recommendation |
|
Kenya Reinsurance |
2.3 |
2.3 |
(0.9%) |
(0.9%) |
2.3 |
3.2 |
8.8% |
48.8% |
0.2x |
Buy |
|
Jubilee Holdings |
275.0 |
275.0 |
0.0% |
(13.2%) |
316.8 |
381.7 |
3.3% |
42.1% |
0.5x |
Buy |
|
I&M Group*** |
21.1 |
20.8 |
(1.4%) |
(2.8%) |
21.4 |
24.4 |
10.8% |
28.0% |
0.6x |
Buy |
|
KCB Group*** |
45.4 |
44.7 |
(1.4%) |
(1.9%) |
45.6 |
51.4 |
2.2% |
17.1% |
0.9x |
Accumulate |
|
Stanbic Holdings |
99.8 |
100.0 |
0.3% |
14.9% |
87.0 |
105.2 |
9.0% |
14.2% |
0.9x |
Accumulate |
|
NCBA*** |
24.7 |
24.6 |
(0.6%) |
(3.5%) |
25.5 |
26.4 |
6.1% |
13.6% |
0.6x |
Accumulate |
|
Standard Chartered*** |
132.0 |
131.0 |
(0.8%) |
0.8% |
130.0 |
137.7 |
8.0% |
13.1% |
1.0x |
Accumulate |
|
Britam |
6.9 |
7.0 |
0.6% |
(7.7%) |
7.6 |
7.9 |
0.0% |
12.8% |
1.2x |
Accumulate |
|
Liberty Holdings |
6.6 |
6.9 |
3.6% |
(2.8%) |
7.1 |
7.7 |
0.0% |
11.6% |
0.5x |
Accumulate |
|
Equity Group*** |
51.8 |
51.3 |
(1.0%) |
(2.8%) |
52.8 |
56.6 |
0.0% |
10.5% |
1.3x |
Accumulate |
|
Diamond Trust Bank*** |
56.5 |
56.0 |
(0.9%) |
(5.9%) |
59.5 |
61.8 |
0.0% |
10.3% |
0.2x |
Accumulate |
|
Co-op Bank*** |
13.0 |
12.9 |
(0.8%) |
(1.2%) |
13.0 |
13.1 |
7.8% |
9.4% |
1.0x |
Hold |
|
ABSA Bank*** |
12.0 |
12.1 |
1.3% |
3.0% |
11.8 |
11.9 |
0.0% |
(1.6%) |
1.2x |
Sell |
|
Sanlam |
11.9 |
12.8 |
7.1% |
10.4% |
11.6 |
12.1 |
0.0% |
(5.4%) |
1.3x |
Sell |
|
CIC Group |
2.0 |
2.0 |
0.5% |
(6.0%) |
2.2 |
1.9 |
0.0% |
(7.7%) |
0.7x |
Sell |
|
HF Group |
3.4 |
3.5 |
2.1% |
(9.2%) |
3.8 |
3.0 |
0.0% |
(14.4%) |
0.2x |
Sell |
|
*Target Price as per Cytonn Analyst estimates **Upside/ (Downside) is adjusted for Dividend Yield ***For Disclosure, these are stocks in which Cytonn and/or its affiliates are invested in |
||||||||||
We are “Neutral” on the Equities markets in the short term. With the market currently trading at a premium to its future growth (PEG Ratio at 1.3x), we believe that investors should reposition towards value stocks with strong earnings growth and that are trading at discounts to their intrinsic value. We expect the discovery of new COVID-19 variants, the upcoming Kenyan general elections and the slow vaccine rollout to continue weighing down the economic outlook. On the upside, we believe that the relaxation of COVID-19 containment measures in the country will lead to improved investor sentiments.
I. Hospitality Sector
During the week, Cytonn Group, under the hospitality arm of the business, launched CySuites Hospitality Management Company, a serviced apartment hotel management company, whose primary focus is optimizing operational and managerial efficiency of serviced apartments on behalf of owners as well as investors. The firm’s main goals include; i) to create a stellar industry standard when it comes to serviced apartment hotels, ii) to garner a collective market share, and, ii) enhance brand visibility.
According to Nairobi Metropolitan Area (NMA) Serviced Apartments Report 2021, Westlands where Cysuites is located was the best performing node, with a rental yield of 8.3% compared to the market average of 5.5%. This is attributed to; i) Westlands leading in terms of market share of hotels at 37.9%, ii) high occupancy rates at an average of 68.8% compared to the market average 56.4%, and, iii) relatively high monthly charges per SQM at Kshs 3,568 compared to the market average of Kshs 2,549.
The table below shows a summary of the performance of the various nodes within the NMA;
|
2021 NMA Serviced Apartments Performance per Node |
||||||||||||
|
|
Average Unit Sizes (SQM) |
Monthly Charge/Unit (Kshs) |
|
|||||||||
|
Node |
Studio |
1 Bed |
2 Bed |
3 Bed |
Studio |
1 Bed |
2 Bed |
3 bed |
Occupancy |
Monthly Charge/ SQM (Kshs) |
Devt Cost/SQM (Kshs) |
Rental Yield |
|
Westlands |
37 |
57 |
87 |
114 |
175,000 |
208,410 |
262,639 |
300,000 |
68.8% |
3,568 |
209,902 |
8.3% |
|
Kileleshwa & Lavington |
38 |
91 |
128 |
166 |
120,000 |
218,500 |
296,667 |
440,000 |
57.1% |
2,571 |
206,132 |
6.4% |
|
Kilimani |
47 |
75 |
114 |
193 |
155,340 |
252,750 |
319,872 |
380,143 |
60.0% |
2,815 |
202,662 |
5.8% |
|
Limuru Road |
44 |
52 |
79 |
116 |
119,000 |
187,636 |
217,500 |
240,000 |
60.5% |
2,853 |
231,715 |
4.9% |
|
Nairobi CBD |
51 |
82 |
85 |
119 |
67,500 |
132,500 |
215,714 |
409,000 |
66.6% |
2,176 |
224,571 |
4.9% |
|
Upperhill |
- |
95 |
119 |
195 |
- |
216,667 |
290,000 |
393,333 |
61.1% |
2,109 |
209,902 |
4.5% |
|
Thika Road |
- |
70 |
101 |
145 |
- |
100,000 |
193,333 |
280,000 |
56.4% |
1,748 |
200,757 |
3.5% |
|
Average |
43 |
75 |
102 |
150 |
127,368 |
188,066 |
256,532 |
348,925 |
61.5% |
2,549 |
212,234 |
5.5% |
|
High |
51 |
95 |
128 |
195 |
175,000 |
252,750 |
319,872 |
440,000 |
68.8% |
3,568 |
231,715 |
8.3% |
|
Low |
37 |
52 |
79 |
114 |
67,500 |
100,000 |
193,333 |
240,000 |
56.4% |
1,748 |
200,757 |
3.5% |
|
· Overall, average occupancy for serviced apartments in the NMA increased by 13.5% points to 61.5% in 2021, from the 48.0% recorded in 2020 |
||||||||||||
Source: Cytonn Research
The move is commendable due to tapping into a market that offers a home away from home under the apartments hotel. Additionally, with the hospitality industry recovering from the COVID-19 pandemic effects and growing rapidly, tapping into the industry as a serviced Apartments hotel owner is a good investment opportunity in order to cash in on returns generated.
II.Listed Real Estate
In the Nairobi Stock Exchange, ILAM Fahari I-REIT closed the week trading at an average price of Kshs 5.9 per share. This represented a 9.2% and 7.8% Week-to-Date (WTD) and Year-to-Date (YTD) decline from Kshs 6.5 per share and Kshs 6.4 per share, respectively. On Inception-to-Date (ITD) basis, the REIT’s performance continues to be weighed down having realized a 70.5% decline from Kshs 20.0. The graph below shows the Fahari I-REIT’s performance from November 2015 to March 2022;
The Kenyan Real Estate market is expected to be on an upward trajectory driven by improved performance of the hospitality sector. However, the performance will be weighed down by poor performance of the REIT market attributed to; i) a general lack of knowledge on the financing instrument, ii) general lack of interest of the REIT by investors, and, iii) lengthy approval processes to get all the necessary requirements thus discouraging those interested in investing in it.
According to the ACTSERV 2021 Retirement Benefits Schemes Investments Performance Survey, segregated retirement benefits schemes recorded an 11.6% return in 2021, up from the 7.0% recorded in 2020. The increase was largely supported by the performance of equities investments made by the schemes which recorded a 16.9% gain, up from a 10.4% decline recorded in 2020 on the back of the gradual economic recovery. Additionally, the retirement benefits schemes’ Assets under Management increased by 11.8% to Kshs 1.5 tn in June 2021, from Kshs 1.3 tn in June 2020. On a q/q basis, the AUM grew by 5.7% from Kshs 1.4 tn recorded in December 2020. The growth of the assets can be attributed to the economic recovery that saw people resume contribution to the retirement benefits schemes. Despite the continued growth, the Kenya National Bureau of Statistics (KNBS) in the FinAccess Household Survey Report 2021, highlights that only 12.0% of the adult population in the labor force save for their retirement in retirement benefits schemes, pointing towards the low uptake of retirement benefits schemes’ services in Kenya.
This week, we turn our focus to the historical asset allocation and the performance of segregated retirement benefits schemes in Kenya with a key focus on 2021. We will also analyze other asset classes such as offshore investments and alternative investments that the segregated retirement benefits schemes can leverage on in order to improve their performance. As such, we will look at the topic in five different sections:
- Introduction to Retirement Benefits Schemes in Kenya,
- Historical Retirement Benefits Schemes Allocation,
- Retirement Benefits Schemes Performance in Kenya,
- Other asset classes that Retirement Schemes can leverage on,
- Factors affecting the Growth of the Retirement Benefits Industry, and,
- Conclusion;
Section 1: Introduction to Retirement Benefits Schemes in Kenya
A retirement benefits scheme is a savings platform that allows individuals to make regular contributions during their working years allowing the contributed funds to be invested in order to generate returns. Upon retirement, members access their total contributions and net returns accrued during their time in the scheme. Retirement schemes often require their members to make regular contributions in order for them to build up a large retirement pot and to take the maximum advantage of compound interest. The contribution amounts vary based on the types of schemes but for individual pension schemes, the monthly contribution may be as low as Kshs 1,000.
Retirement Benefits Schemes can be classified by mode of governance into two types namely; Segregated Funds and Guaranteed Funds. Segregated funds refer to schemes where members’ contributions are invested by the Trustees via an appointed Fund Manager. Guaranteed funds, on the other hand, are offered by insurance companies who are referred to as the approved issuers and carry out similar functions to a fund manager. This type of scheme guarantees their members a minimum rate of return (the maximum rate by law that can be guaranteed being 4.0%). In cases where the fund’s returns surpass the minimum guaranteed rate, the approved issuer at its own discretion decides to top up the minimum rate with a bonus rate of return.
Guaranteed funds, on the other hand, are offered by insurance companies who are referred to as the approved issuers and carry out similar functions to a fund manager. This type of scheme guarantees their members a minimum rate of return (the maximum rate by law that can be guaranteed being 4.0%). In cases where the fund’s returns surpass the minimum guaranteed rate, the approved issuer at its own discretion decides to top up the minimum rate with a bonus rate of return.
There are various reasons why one should save for their retirement which include;
- Compounded and Tax-free interest – Savings in a retirement benefits schemes earn compounded interest. This means that your money grows faster as even the interest earned is reinvested and grows. Additionally, investment income of retirement schemes is tax exempt meaning that the schemes have more to reinvest,
- Tax-exempt contributions – Retirement Benefits Scheme members enjoy a monthly tax relief on their contributions of up to Kshs 20,000.0 per month or 30.0% of their monthly salary, whichever is less. This lessens the total income tax deducted from one’s earnings,
- Home Ownership - Savings in a Retirement Benefits Scheme also helps members to own a home through utilization of a portion of their retirement benefits to secure a mortgage facility or to purchase a residential house. A member may assign up to 60.0% of their accrued benefits to provide a mortgage guarantee or utilize up to 40.0% or a maximum of Kshs 7.0 mn of their accrued retirement benefits to purchase a residential house. Under the option of securing a mortgage facility, the collateral may enable the member to acquire immovable property on which a house has been erected, erect a house, add, or carry out repairs to a house, secure financing or waiver for deposits, stamp duty, valuation fees and legal fees and any other transaction costs required. Key to note, the same scheme member cannot utilize both options – they must choose their preferred option,
- Post-Retirement Financial Independence - By providing an income in retirement, Retirement Benefits Schemes ensure that the scheme members do not experience old age poverty and do not rely on their family, relatives and friends for survival, and,
- Income Security - Retirement benefits schemes allow people to access some of their savings in the event of a job loss or income disruption. Furthermore, the savings ensure that your income stream continues even if you stop working, a period when one has reduced or no income at all. Retirement savings ensure that this decline in lifestyle is manageable or non-existent, allowing you to live the lifestyle you want even after retirement.
Section 2: Historical Retirement Benefits Schemes Allocation
The Retirement Benefits Authority (RBA) through the Investment Regulations and Policies, provides investment guidelines on which asset classes retirement benefits schemes can invest in and the maximum limits. In accordance with the regulator’s guidelines, trustees of retirement benefits schemes are required to formulate their own Investment Policy Statements (IPS), which provide scheme-specific guidance on;
- Investment objectives and strategic considerations,
- Asset allocation targets, benchmarks, and related parameters,
- Governance, and,
- Performance reporting and risk management.
The IPS of the various schemes differ depending on the risk-return profile and expectations, largely determined by the demographic trends of the scheme members and the scheme. For instance, during times of high uncertainties, retirement benefits schemes tend to increase their investments allocation in less risky assets such as fixed income in order to hedge the scheme members’ funds against the risk of losses. Additionally, a retirement benefits scheme with a high proportion of members approaching retirement age will be less exposed to long-term and illiquid asset classes such as immovable property, given that the scheme will be required to pay out retirement benefits to those retiring, and such illiquid assets may be difficult to liquidate.
The table below shows how Kenyan retirement benefits schemes have invested their assets since 2013:
|
Kenyan Pension Funds Asset Allocation |
|||||||||||
|
Asset Category |
Dec-13 |
Dec-14 |
Dec-15 |
Dec-16 |
Dec-17 |
Dec-18 |
Dec-19 |
FY'2020 |
H1'2021 |
Average |
RBA Maximum Limit |
|
Government Securities |
33.8% |
30.7% |
29.8% |
38.3% |
36.5% |
39.4% |
42.0% |
44.7% |
44.1% |
37.7% |
90.0% |
|
Quoted Equities |
25.5% |
25.8% |
22.9% |
17.4% |
19.5% |
17.3% |
17.6% |
15.6% |
16.9% |
19.9% |
70.0% |
|
Immovable Property |
17.2% |
16.5% |
18.5% |
19.5% |
21.0% |
19.7% |
18.5% |
18.0% |
16.7% |
18.4% |
30.0% |
|
Guaranteed Funds |
10.3% |
11.9% |
12.2% |
14.2% |
13.2% |
14.4% |
15.5% |
16.5% |
16.7% |
13.9% |
100.0% |
|
Fixed Deposits |
4.9% |
5.3% |
6.8% |
2.7% |
3.0% |
3.1% |
3.0% |
2.8% |
2.5% |
3.8% |
30.0% |
|
Listed Corporate Bonds |
4.4% |
5.9% |
5.9% |
5.1% |
3.9% |
3.5% |
1.4% |
0.4% |
0.2% |
3.4% |
20.0% |
|
Offshore |
2.2% |
1.9% |
0.9% |
0.8% |
1.2% |
1.1% |
0.5% |
0.8% |
1.1% |
1.2% |
15.0% |
|
Cash |
1.3% |
1.4% |
1.4% |
1.4% |
1.2% |
1.1% |
1.2% |
0.9% |
1.2% |
1.2% |
5.0% |
|
Unquoted Equities |
0.6% |
0.6% |
0.3% |
0.4% |
0.4% |
0.3% |
0.3% |
0.2% |
0.2% |
0.4% |
5.0% |
|
Private Equity |
0.0% |
0.0% |
0.0% |
0.0% |
0.0% |
0.1% |
0.1% |
0.1% |
0.2% |
0.1% |
10.0% |
|
REITs |
0.0% |
0.0% |
0.0% |
0.1% |
0.1% |
0.1% |
0.0% |
0.0% |
0.0% |
0.0% |
30.0% |
|
Commercial Paper, non-listed bonds by private companies* |
0.0% |
0.0% |
0.0% |
0.0% |
0.0% |
0.0% |
0.0% |
0.0% |
0.0% |
0.0% |
10.0% |
|
Others e.g. Unlisted Commercial Papers |
0.0% |
0.0% |
1.2% |
0.0% |
0.0% |
0.0% |
0.0% |
0.0% |
0.0% |
0.1% |
10.0% |
|
Total |
100.0% |
100.0% |
100.0% |
100.0% |
100.0% |
100.0% |
100.0% |
100.0% |
100.0% |
100.0% |
|
|
Commercial paper, non-listed bonds and other debt instruments issued by private companies was introduced as a new separate asset class category in 2016 through the legal notice No. 107. |
|||||||||||
Source: Retirement Benefits Authority (RBA)
Key Take-outs from the table above are:
- Historically, retirement benefits schemes in the country have allocated an average of 57.6% of their members’ funds towards Government securities and Quoted Equities over the period 2013 to H1’2021. The high allocation to government securities, which has averaged 37.7% over the last nine years and is the highest among the asset classes invested in, can be attributed to the fact that retirement benefits schemes prioritize the safety of their members' funds and prefer a high allocation to low risk investments. Notably, the allocation to government securities has been increasing over the years to 44.1% in 2021 from 36.5% 2017,
- The allocation towards quoted equities increased by 1.3% points to 16.9% in H1’2021, from 15.6% as of December 2020 highlighting the gradual economic recovery from the adverse effects of COVID-19 witnessed during the period. Consequently, allocation towards government securities declined to 44.1% in H1’2021, from 44.7% and fixed deposits to 2.8% from 2.5% recorded in December 2020, pointing towards reduced uncertainties as the economy recovered, and,
- Retirement Benefits Schemes’ investments in offshore markets increased by 0.3% points to 1.1% in H1’2021, from 0.8% recorded in December 2020 attributable to the impressive performance of the asset class as it recorded returns of 31.7% per annum in the year 2020 as global markets performed better than expected coupled with the depreciation of the Kenyan shilling.
We now shift our focus to the performance of the aforementioned asset classes, classified into three broad categories: Fixed Income, Equity, and Offshore. Below is a graph showing the performances over the period 2013 to 2021:
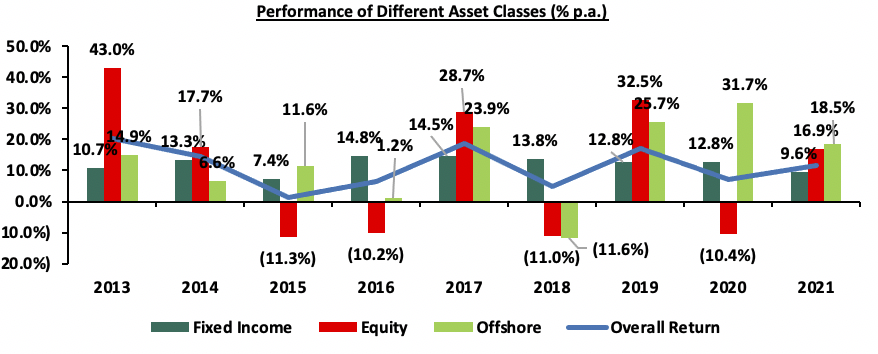
Key take-outs from the graph above are:
- Equity investments recorded the highest gain with the returns increasing by 27.3% points to 16.9%, from a 10.4% decline recorded in 2020. The gain was attributable to the gradual recovery in the stocks market following the adverse effects of the COVID-19 pandemic witnessed in 2020. The performance of the equities markets was further evidenced in the Kenyan equities market which was on an upward trajectory, with NASI, NSE 25 and NSE 20 increasing by 9.5%, 9.8% and 1.6%, respectively. Notably, the allocation towards the asset class increased to 16.9% in H1’2021, from 15.6% in 2020 as investors sought to benefit from the recovery,
- Fixed income have continued to offer stable returns with little volatility over the years but there has been a continuous decline of the returns over the last 5 years to 9.6%, from 14.5% recorded in 2017. This is mainly attributable to the Central Bank of Kenya (CBK) and other stakeholders’ efforts over the years to maintain a stable interest rate environment. Fixed income performance recorded a 3.2% points decline to 9.6% in 2021, from 12.8% in 2020 following a stable macroeconomic environment witnessed in 2021 as the economy continued to recover. This saw most investors shift to relatively riskier asset classes offering higher returns, and,
- Offshore investments recorded the highest returns in 2021 gaining by 18.5%, 8.9% points and 1.6% points higher than the 9.6% and 16.9% return recorded by the fixed income and equities asset classes, respectively. However, the performance was a 13.2% points decline from the 31.7% return recorded in 2020, partly attributable to the persistent global inflationary pressures and supply constraints. Offshore investments have also outperformed the other asset classes in the period 2013 to 2021 averaging 13.6% while investments made in fixed income and equity asset categories averaged 12.2% and 10.6%, respectively.
Section 3: Performance of Retirement Benefits Schemes
The nine-year return for segregated schemes over the period 2013 to 2021 was 11.2% with the performance fluctuating over the years to a high of 20.3% in 2013 and a low of 1.4% in 2015 reflective of the markets performance. The chart below highlights the performance of the segregated pension schemes over a 9-year period:
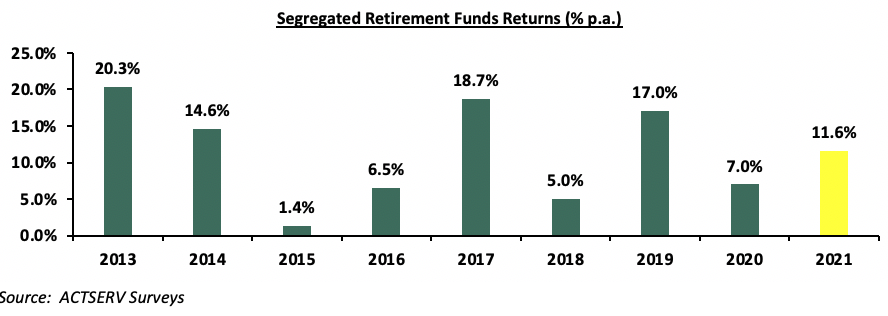
The overall return for 2021 came in at 11.6%, a 4.6% points increase from the 7.0% recorded in 2020. The increase was largely supported by the performance of equities held in the schemes which recorded a 16.9% gain, up from a 10.4% decline recorded in 2020. The gain was however weighed down by fixed income and offshore investments’ performances, which declined to 9.6% and 18.5%, from 12.8% and 31.7%, in 2020, respectively. For all the quarters of 2021, segregated pension schemes recorded gains, with the fastest gain being recorded in Q2’2021 of 5.4% largely driven by an 11.9% gain in equities held in the schemes. The chart below shows the quarterly performance of segregated pension schemes since 2020:
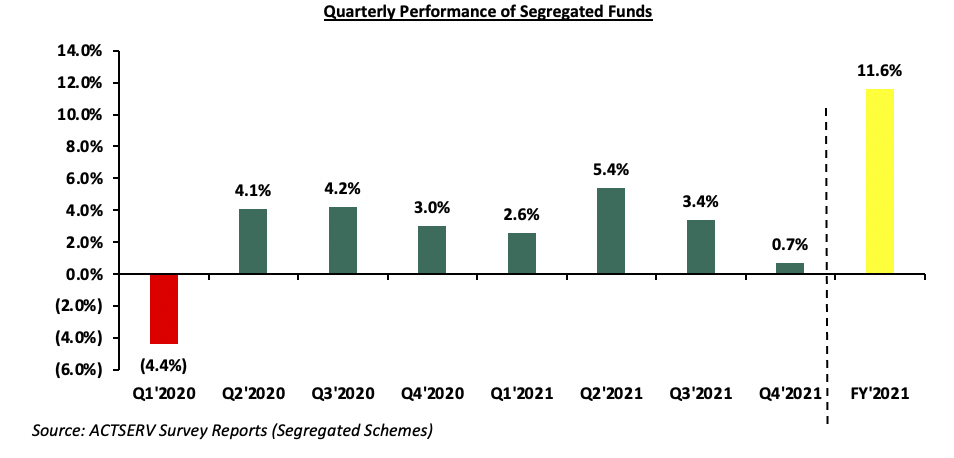
The key take-outs from the graph include:
- Schemes recorded a 5.4% gain in Q2’2021, a 1.3% increase from the 4.1% recorded in Q2’2020. The performance was largely driven by an 11.9% gain in equities in comparison to the 5.4% gain recorded in Q2’2020, largely attributable to improved investor confidence during the period on the back of gradual economic recovery as well as a rally in the banking stocks following their impressive performance in FY’2020 and Q1’2021. The gain was however weighed down by the slower growth of fixed income and offshore investments which gained by 3.3% and 10.2% in comparison to the 3.7% and 25.3% growth recorded in Q2’2020,
- Overall returns for Q3’2021 declined by 2.0% points to 3.4%, from 5.4% largely due to the poor performance of offshore investments which recorded a 1.9% gain in comparison to the 10.2% gain recorded in Q2’2021. The decline was partly due to the emergence of the Omicron variant which had a negative impact on offshore investments, and,
- In Q4’2021, schemes recorded the slowest growth gaining by 0.7% largely due to the negative returns by equities of 4.4% lower than the 5.9% gain recorded in Q4’2020 and the 5.2% recorded in Q3’2021. The performance was largely attributable to the increased economic uncertainty surrounding the persistent COVID-19 variants.
Going forward, the retirement benefits industry is poised to capitalize on gains in the face of a recovering economy and increased member contributions. As the economy reopens, we anticipate increased contributions as more people reopen their business and as companies rehire their employees. However, risks lie on the downside given the slowdown in global growth emanating from factors such as the current global inflationary pressures as well as the emergence of new COVID-19 variants.
Section 4: Other Asset Classes that Retirement Schemes can leverage on
Despite the positive and improved returns offered by segregated funds, more can be done to improve the performance and to deliver stable and sufficient income in retirement. This will ensure that the risk of scheme members retiring with insufficient income due to the misallocation or poor performance of investments is reduced. Over time, retirement benefits schemes have skewed their investments towards traditional assets, mostly, government securities and equities market, averaging 57.5% as of June 2021 leaving only 42.5% for the other asset classes. Out of all the asset classes that retirement benefits schemes are allowed to invest in, alternative investments that is immovable property, private equity as well as Real Estate Investments Trusts (REITs) account for an average of only 18.5% against the total allowable limit of 70.0%. This is despite the fact that these asset classes such as REITs offer various benefits which include low cost exposure to Real Estate and tax exemption which means there will be more funds to be reinvested and hence better returns. Additionally, the returns from alternative investments such as immovable property has been stable averaging 6.9% over the last five years for rental properties. As such, we believe that retirement benefits schemes can take advantage of the long-term stable returns while also aiding in the improvement of living standards of scheme members. Below, we focus on the asset classes which we believe would play a big role in improving the performance of retirement benefits schemes. Some of these assets include;
a. Offshore Investments
Offshore investments are investments made outside the jurisdiction or country in which the investor resides. The investor may be an individual, corporation or a fund looking to take advantage of the tax incentives offered in other countries, or to diversify their portfolio. Examples of offshore investments include (i) venture capital, (ii) mutual funds, for the risk averse investors, (iii) private equity, for the investor with a high risk appetite, and (iv) purchase of precious metals.
The Retirement Benefits Authority allows retirement benefits schemes to invest up to 15.0% of their assets in offshore investments in bank deposits, government securities, listed equities, rated corporate bonds and offshore collective investment schemes. However, over the period 2013 to 2021, the average allocation to offshore investments was 1.2% as compared to the 37.7% allocation in government securities and 19.8% in equities. This is despite the fact that offshore investments have outperformed other asset classes held by schemes such as equities and fixed income. The chart below shows the allocations against performance of offshore investments in comparison to fixed income investments since 2013:
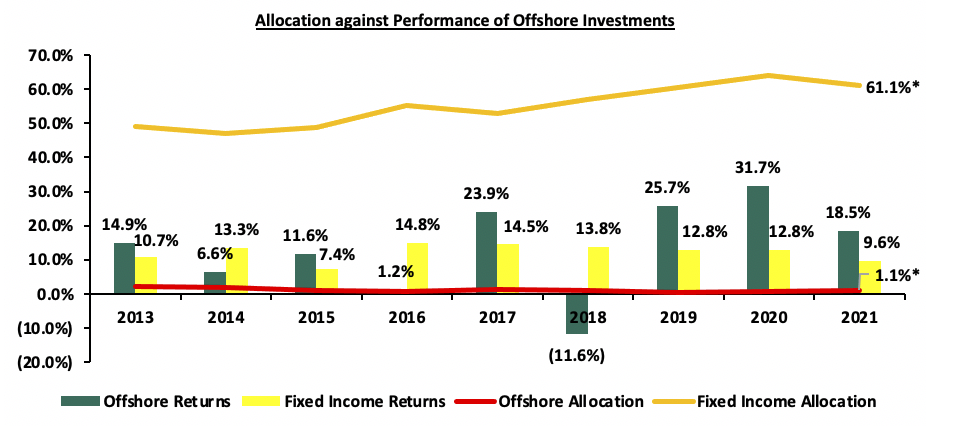
Sources: Retirement Benefits Authority (RBA), Actserv Reports
*Allocations as of June 2021
Despite the higher returns offered by offshore investments, their allocation has remained significantly low as compared to other asset classes, particularly fixed income investments. Some of the reasons for the low allocation in the offshore investments in the pensions industry include; low financial awareness among trustees, high risk associated with the asset category and to a lesser extent high bureaucracy in investments decision making. Despite these challenges, we believe diversifying into offshore investments can help schemes by:
- Improving their returns by taking advantage of performances in the global markets as these markets recover from the adverse effects of the pandemic and providing a hedge against local markets volatility. The optimal investment horizon is three to five years to fully take advantage of the returns and hence in line with long term horizon of retirement benefits schemes,
- Hedging against currency depreciation, inflation and lower returns offered by asset categories in a scheme’s locality such as fixed income returns which came in at 9.6% in 2021, in comparison to 18.5% for offshore investments, and,
- Protecting the scheme’s assets as some offshore countries have laws that prevent investors from certain legal actions such as seizure of assets and in this way, the offshore investment act as a type of “insurance” for the investments made locally and hence provide a form of protection against adverse losses of the members’ funds.
b. Alternative Investments (Immovable Property, Private Equity and REITs)
Alternative investments are supplemental strategies to traditional long-only positions in equities, bonds, and cash. They differ from the traditional investments on the basis of complexity, liquidity, and regulations. Alternative investments that schemes can invest in include immovable property, private equity and Real Estate Investment Trusts (REITs) which have been allowed a maximum allocation of 70.0%. Historically schemes have allocated an average of only 18.5% in the period 2013 to H1’2021, with the vast allocation to immovable property, an average of 18.4% during the period.
The low allocation in alternatives can be attributed to lack of expertise and experience with these asset classes as investing in them requires detailed due diligence and evaluation as well as engaging legal, financial and sector-specific expertise. Additionally, asset classes such as listed REITs have performed poorly over time with the listed Real Estate, ILAM Fahari I-REIT having declined by 7.8% Year-to-Date (YTD) to Kshs 5.9, from Kshs 6.4 per share, recorded at the beginning of the year. Despite this, we believe that there is value in the alternative markets that schemes can take advantage of. Some of the key advantages of alternatives include:
- Superior long term returns - Real Estate investments offer greater returns than traditional assets in the long term which is in line with schemes long term view. According to Cytonn Research, the 5-year average total returns for Real Estate existing properties stood at 13.2% as of 2020 with the sector being supported by the continued construction of affordable housing projects and diversified sources of finance to fund both affordable housing and mortgages. The returns also provide a hedge against the capital erosion brought about by inflationary pressures, and,
- Hedging against volatility – Immovable property has a low but positive correlation with equities and bonds such that in many instances should the traditional assets such as equities perform poorly, the performance of the Real Estate is not equally affected and this can help cushion the effects of the traditional asset’s performance. For instance, in 2020 when the equities market was adversely affected by the COVID-19 pandemic leading to a 10.4% decline, the Real Estate returns from rental yields came in at 6.1%.
Section 5: Factors affecting the growth of Retirement Benefits Schemes in Kenya
The retirement benefits industry has grown significantly over the years having grown at a CAGR of 8.9% to Kshs 1.5 tn in H1’2021, from Kshs 1.0 tn in H1’2017. The main factors that have contributed to the growth include:
- Legislation – RBA has been keen on promoting good governance by continuously updating the regulations and enforcing the same. The numerous reforms in the industry include; i) tax reliefs on contributions to a maximum of Kshs 20,000 per month or 30.0% of one’s salary, whichever is less, and, ii) house ownership structures whereby the trustee can assign up to 60.0% of the accumulated retirement savings towards securing a mortgage facility or use up to 40.0% of their savings directly to purchase a residential house. The enactment of these reforms has served as a great incentive as Kenyans continue to take advantage of the current regulatory environment,
- Trustees Certification programs which help improve the management of the schemes and better equips the Trustees in carrying out their roles which will likely lead to more innovation and better services by trustees and growth in the industry,
- Demographic factors – Demographic factors include the statistical factors that influence population growth in one way or another and include parameters such us population size and birth rate of a particular place. Kenya’s rising population has played a big role in supporting the pensions industry in Kenya. The young population has grown rapidly with the United Nations’ projecting that the corresponding population of youth in Kenya aged 15-24 years and ready to join the workforce will increase to 18.0 mn, from 9.5 mn over the period 2015 to 2065. This will support the continuous increase in people entering joining the workforce and saving for retirement. Which will consequently increase scheme membership significantly,
- Social Change – Over time, individuals are becoming less dependent on relatives and friends after retirement, as they understand better the importance of saving for retirement. Additionally, globalization has resulted in a more interconnected financial world, which has reduced geographical inequality and ensured that wealth is more evenly distributed. As a result, there is more disposable income, and authorities can benchmark against one another, resulting in more efficient systems, and,
- Technology Advancements and Increased Financial inclusion – Increase in technology advancements, mobile penetration rate and internet connectivity in Kenya have provided an important platform for the delivery of a wide range of financial services. Currently, almost all Individual Pension Plans (IPPs) allow contributions through M-PESA pay bill numbers, a simple and convenient way to make payments. As more people become financially educated particularly in the informal sector, the technological advancements make it easy for people to join schemes and contribute funds as well as track the status of their portfolios,
Challenges in the industry:
Despite the significant developments, there exists challenges that have slowed down the growth in the pensions industry which include:
- Market Volatility – Various risks associated with market movements have continued to discourage Kenyans from contributing to retirement benefits schemes for fear of losing their hard-earned money. Schemes with high allocation to the equity markets stand to lose as well due to the market volatility brought about by the uncertainty surrounding investment returns. However, given that retirement benefits schemes are long term savings and equities are best suit for long term investors, members can choose to wait long enough to benefit from the equities returns,
- Slowdown in economic growth and unemployment – Negative macroeconomic factors such as the COVID-19 pandemic have had significant effects on the economy with most people losing their source of income and using the little they have to cater for immediate needs and further increasing the already high rate of unemployment. As of March 2021, approximately 16.9% (3.0 mn) of the 17.7 million Kenyan youth not in school lacked some form of employment. This means that a larger portion of the population that should be contributing for their retirement benefits is not able to do so, which weighs on the growth of retirement benefits schemes. Additionally, the larger portion that is in the informal sector is left out since most reforms and regulations are primarily focused on the formal sector. In our view, RBA in collaboration with other stakeholders should come up with reforms and regulation to ensure that more people in the informal sector are part of the retirement benefits schemes. This can be done through increased awareness and well regulated retirement savings platforms for the people in the informal sector
- Access of savings before retirement – Employees have previously chosen to withdraw their savings immediately after leaving their jobs. While withdrawing one's savings may appear to be a rational option, especially after losing a job or experiencing financial difficulty, it is more self-defeating and short-sighted because we borrow money from our own future. This has a negative impact on the adequacy of your retirement benefits savings upon retirement and result in a lower quality of life after retirement. Withdrawing from schemes also slows the growth of the Industry because it takes money out of the schemes thus reducing the assets. Recently, in an effort to maintain the core function of retirement benefits schemes, the Retirement Benefits Authority lowered the amounts accessible by members of umbrella and occupational schemes as well as individual schemes whose funds have been transferred from an occupational or umbrella schemes before retirement age, to a maximum of 50.0% of the total accrued pension benefits and the investment income that has accrued in respect of those contributions. This is down from the previous 100.0% of their own contributions plus 50.0% of the employer's portion, and,
- Low Prioritization of Retirement Planning - Most Kenyans focus more on other immediate financial challenges and end up postponing retirement planning. This leads to low income replacement ratio as people start saving later in their working years when they have more responsibilities than they had while younger. As a result of saving a small amount of money for a shorter period of time, the retiree ends up with insufficient retirement benefits and is forced to continue working or depending on relatives. As such, the public should be educated more on the importance of saving for retirement and how to plan on the same.
Section 6: Conclusion
In general, returns for segregated retirement benefits schemes have been fluctuating over the years. As such, it is important for Fund Managers to have a well-balanced portfolio on a risk-return basis to ensure that they offer their members high returns and at the same time protecting their contributions. In 2021, retirement benefits schemes have been on a recovery path having gained by 11.6% in comparison to the 7.0% gain recorded in 2020. We expect continued growth in 2022 given the continued regulatory changes in the Retirement Benefits Industry and increased investment expertise. Additionally, we anticipate growth in returns on the back of the gradual economic recovery as the macroeconomic environment stabilizes. The growth can be further supported by:
- Trustees Professionalism: The RBA has made it compulsory for Trustees of registered Retirement Benefits Schemes to be certified through the Trustee Development Program of Kenya (TDPK) which is commendable and will improve the trustees’ capability to manage schemes. We believe further education courses especially on the alternative and offshore investments will go a long way to demystifying the asset classes and enable schemes to increase their diversification,
- Extending the limit on withdrawals to voluntary benefits in the individual schemes: The RBA has provided withdrawal limits on benefits before retirement age mostly to umbrella, occupational pension schemes and personal schemes for savings transferred from occupational or umbrella schemes. As such, members of individual pension schemes are able to withdraw their benefits for which the trustees have given approval at any time before retirement. We believe that extending the withdrawal limits to the individual schemes will go a long way in ensuring that individuals have enough money at retirement and the pensions industry continues growing as scheme managers will have more funds and enough time to make long term investments,
- Increased Competition by the Various Players in the Market: The RBA has continued to issue licenses to new players in the market and this will beef up competition in the industry keeping the Fund Manager on their toes to ensure that they offer higher returns to their members,
- Mass Education: The Retirement Benefits Authority can adopt Initiatives such as media campaigns and strategic collaborations with county governments, professional associations, religious institutions, SACCOs, as well as welfare associations that are closer to the mass to educate citizens on the importance of saving for retirement. It is also recommended that bureaucracy and other barriers be removed to encourage participation by informal sector workers who form the larger portion of the population. This will ensure availability of more funds for investment and consequently increased assets under management, and,
- Innovation and Product Development: In 2020, the RBA and the Ministry of National Treasury released amendments to the Mortgage Regulations allowing pension scheme members to be able to buy houses using a portion of their benefits, and introduced a new asset class, Public Private Partnership into the list of allowable list of asset classes to invest in. Through increased member education, we believe that schemes can leverage on these new regulations to the benefit of their members and draw more people into their schemes. Similar actions by the regulator and the continued interaction with the different service providers in the pensions industry will be key to increase the pension penetration rate in Kenya.
Despite the fluctuating returns witnessed over the years, segregated retirement schemes have delivered a 5-year average return of 11.7% p.a. for their members, which is above the 2021 average inflation rate of 6.1% and returns from other savings platforms like bank deposits of 7.7% during the same period. As such, we believe that more people in their working years should save for retirement in retirement benefits schemes in order to secure their income post retirement and enjoy the real positive returns on offer.
Disclaimer: The views expressed in this publication are those of the writers where particulars are not warranted. This publication, which is in compliance with Section 2 of the Capital Markets Authority Act Cap 485A, is meant for general information only and is not a warranty, representation, advice or solicitation of any nature. Readers are advised in all circumstances to seek the advice of a registered investment advisor.

- Talk to us
- Kenya
- P.O Box 20695 - 00200, Nairobi, Kenya
- Cell +254709101200
- Tel +254709101200
- WhatsApp +254741676635
- United States
- +254709101200
- DOWNLOAD OUR APP
-


- Kenya
- 8th Floor, Pinetree Plaza, Kaburu Drive, Ngong Road, Nairobi, Kenya
- USA
- Suite 1150, 1775 Eye Street NW, USA, Washington DC 20006, USA
- Investments
- High Yield
- Private Equity
- Real Estate
- Real Estate
- RiverRun Estates
- Cytonn Towers
- The Ridge
- Taraji Heights
- The Alma