
Kenya’s Balance of Payments Report 2026, & Cytonn Weekly #41.2026
By Research Team, Oct 18, 2026
Executive Summary
Fixed Income
During the week, T-bills were oversubscribed for the eleventh consecutive week, with the overall subscription rate coming in at 244.6% lower than the subscription rate of 269.2% recorded the previous week. Investors’ preference for the shorter 91-day paper persisted, with the paper receiving bids worth Kshs 49.8 bn against the offered Kshs 8.0 bn, translating to a subscription rate of 622.5% lower than the subscription rate of 627.6%, recorded the previous week. The subscription rate for the 182-day paper decreased to 120.6% from 155.3% recorded the previous week, while that of the 364-day paper decreased to 66.4% from 96.4% recorded the previous week, the government accepted a total of Kshs 52.3 bn worth of bids out of Kshs 68.5 bn bids received, translating to an acceptance rate of 76.4%. The yields on the government papers recorded a mixed performance with the yields on the 364-day paper increasing by 0.3 bps to remain relatively unchanged at 9.04% recorded the previous week. While the yields on the 182-day and 91-day papers decreased by 1.4 bps and 1.2 bps to 8.86% and 8.75% from 8.87% and 8.76% recorded the previous week respectively;
During the week, the Central Bank of Kenya released the auction results for the re-opened treasury bonds SDB1/2011/030 and FXD1/2026/030 with tenors to maturities of 14.4 years and 29.6 years respectively and fixed coupon rates of 12.0% and 12.5% respectively. The bonds were oversubscribed, with the overall subscription rate coming in at 167.7%, receiving bids worth Kshs 83.8 bn against the offered Kshs 50.0 bn. The government accepted bids worth Kshs 53.0 bn, translating to an acceptance rate of 63.3%. The weighted average yield for the accepted bids for the SDB1/2011/030 and FXD1/2026/030 came in at 13.65% and 14.18% respectively. Notably, the 13.65% yield on SDB1/2011/030 was marginally lower than the 13.69% recorded at the last reopening in September 2026 while the 14.18% yield on the FXD1/2026/030 was also marginally lower than the 14.24% recorded at the last reopening in September 2026.With the Inflation rate at 6.8% as of September 2026, the real returns of the SDB1/2011/030 and FXD1/2026/030 are 6.9% and 7.4% respectively. Given the 10.0% withholding tax on the bonds, the tax equivalent yields for shorter term bonds with 15.0% withholding tax are 12.7% for SDB1/2011/030 and 13.2 % for FXD1/2026/030;
During the week, The Energy and Petroleum Regulatory Authority (EPRA) released their monthly statement on the maximum retail fuel prices in Kenya, effective from 15th October 2026 to 14th November 2026. Notably, the maximum allowed prices for Kerosene, Super Petrol and Diesel increased by Kshs 28.5, Kshs 12.9 and Kshs 9.9 per litre to Kshs 219.9, Kshs 226.9 and Kshs 227.8 respectively, from Kshs 191.4, Kshs 214.0 and Kshs 217.9 set in September;
During the week, The Kenya National Bureau of Statistics (KNBS) released the Q2’2026 Quarterly Gross Domestic Product Report, highlighting that the Kenyan economy recorded a 5.1% growth in Q2’2026, higher than the 4.9% growth recorded in Q2’2025. The main contributor to Kenyan GDP remains the Agriculture, Forestry and Fishing sector, which grew by 3.5% in Q2’2026, lower than the 4.0% expansion recorded in Q2’2025, as the early cessation of the long rains weighed on crop production;
Equities
During the week, the equities market was on a downward trajectory, with the NSE 10, NSE 25, NASI, and NSE 20 declining by 2.1%, 1.9%, 1.8%, and 1.5% respectively, taking their YTD performance to gains of 35.6%, 35.3%, 33.4% and 28.4% respectively for NSE 10, NSE 25, NASI and NSE 20 respectively. The week-on-week equities market performance was mainly driven by losses recorded by large-cap stocks such as Equity, NCBA, and Safaricom of 3.8%, 3.1%, and 2.4% respectively. The performance was however supported by gains recorded by large-cap stocks such as BAT, and Stanbic of 0.2% and 0.1%, respectively;
During the week, the banking sector index decreased by 1.9% to 282.9 from the 288.3 recorded the previous week. This is attributable to losses recorded by large cap stocks such as Equity, NCBA, and DTBK of 3.8%, 3.1%, and 2.2% respectively. The performance was however supported by gains recorded by large-cap stocks such as Stanbic of 0.1%;
During the week, equities turnover Increased by 63.0% to USD 24.5 mn from USD 15.0 mn recorded the previous week, taking the YTD total turnover to USD 3,092.6 mn. Foreign investors became net sellers with a net selling position of USD 9.5 mn, from a net selling position of USD 5.7 mn recorded the previous week, taking the YTD foreign net selling position to USD 181.3 mn, compared to a net selling position of USD 92.9 mn recorded in 2025;
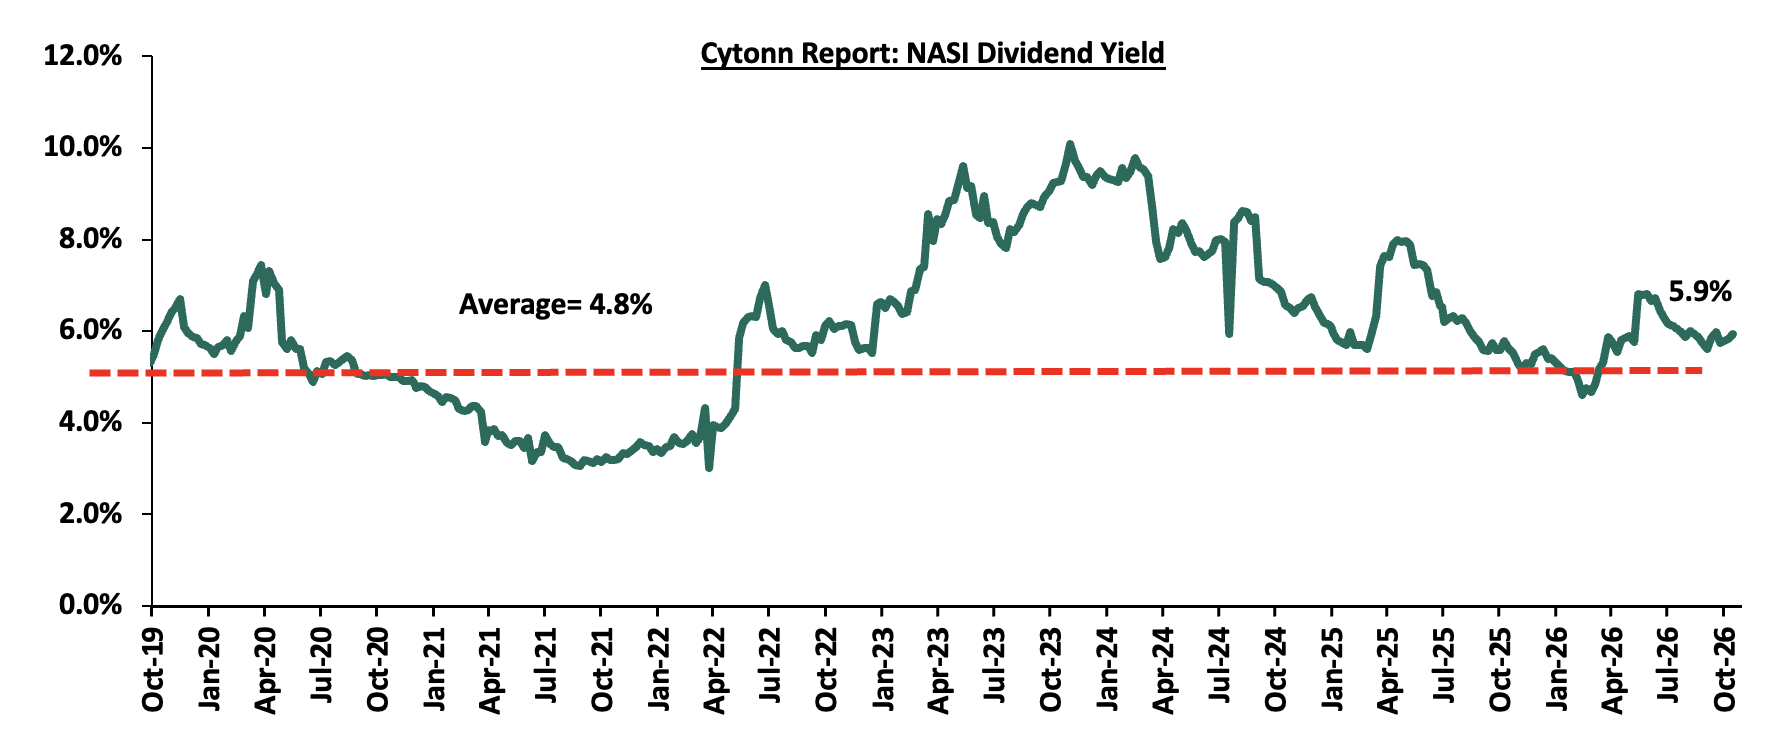
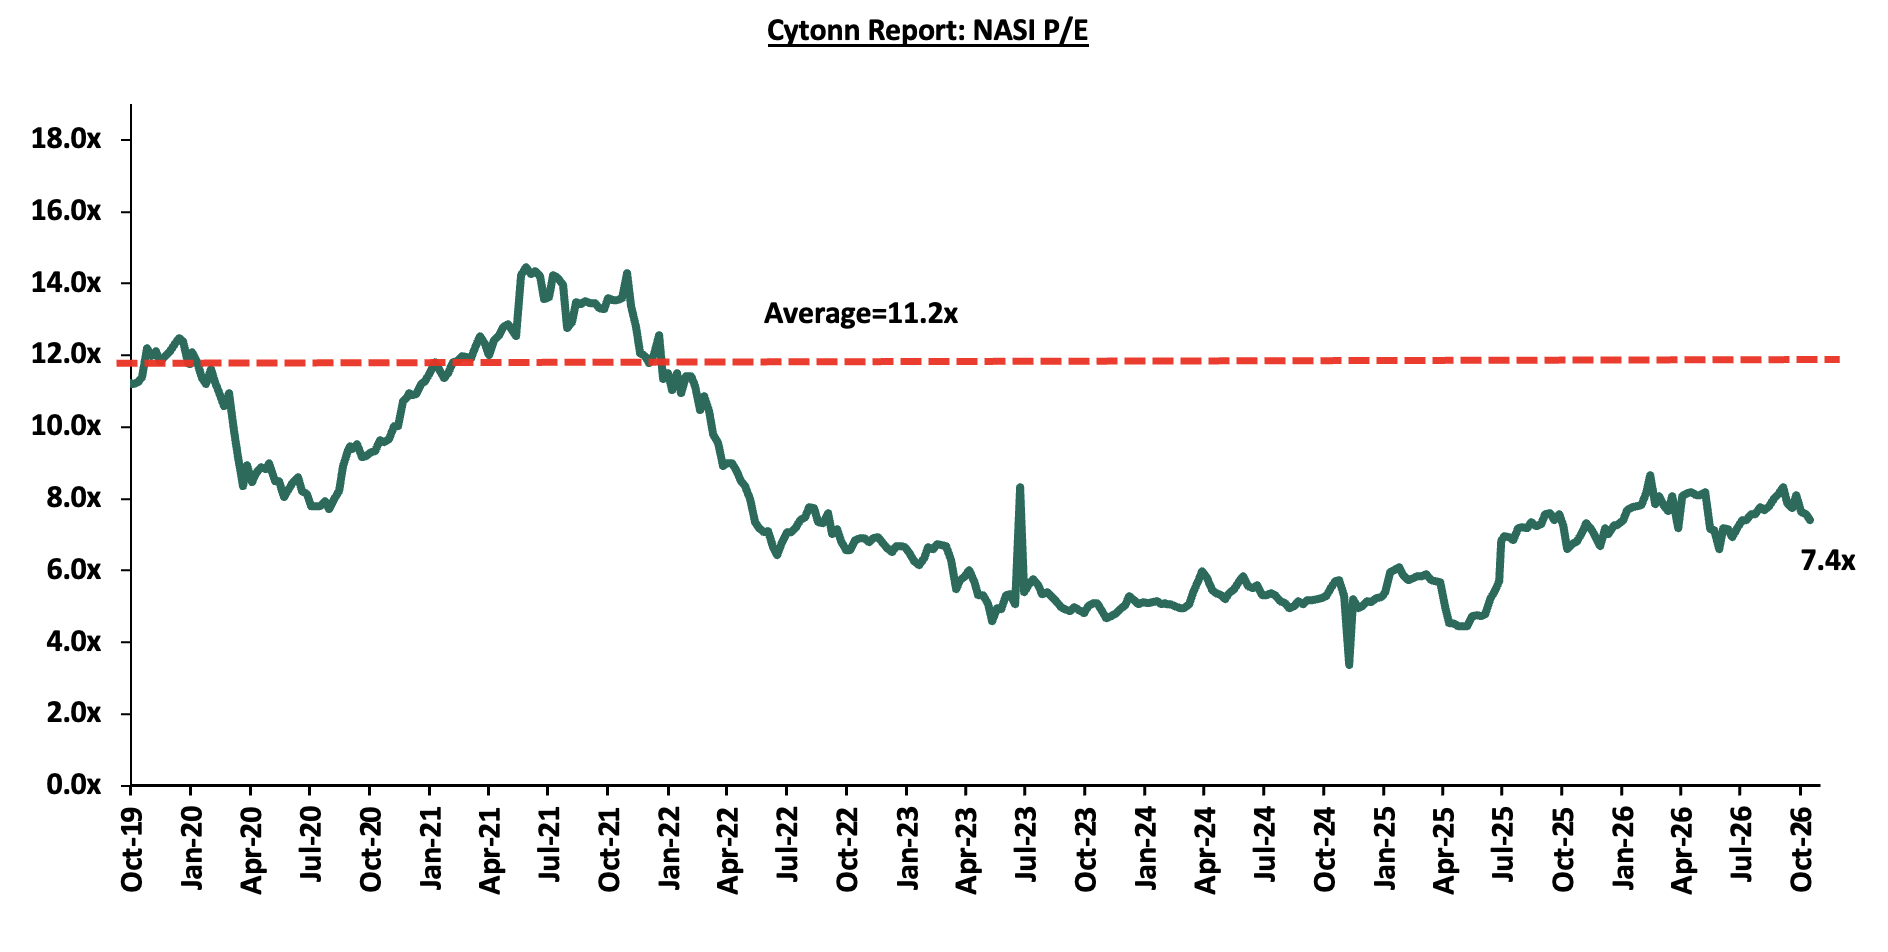
The market is currently trading at a price to earnings ratio (P/E) of 7.4x, 33.7% below the historical average of 11.2x, and a dividend yield of 5.9%, 1.2% points above the historical average of 4.8%. Key to note, NASI’s PEG ratio currently stands at 0.9x, an indication that the market is slightly undervalued relative to its future growth. A PEG ratio greater than 1.0x indicates the market may be overvalued while a PEG ratio less than 1.0x indicates that the market is undervalued;
During the week, The Kenya Pipeline Company (KPC), released its FY’2026 financial results, recording a 13.1% Increase in Profit After Tax (PAT) to Kshs 11.6 bn in FY’ 2026 from 10.2 bn in FY’ 2025. This is mainly attributable to an 8.9% increase in Net Revenue to Kshs 33.8 bn from Kshs 31.1 bn in FY’2025. The increase in PAT was, however, weighed down by a 4.1% increase in operating expenses to Kshs 8.9 bn from Kshs 8.5 bn in FY’2025, coupled with a 20.2% increase in depreciation and amortization charges to Kshs 7.7 bn from Kshs 6.4 bn in 2025;
Real Estate
During the week, the Kenya National Bureau of Statistics (KNBS) released the Quarterly Gross Domestic Product Report that outlined the performance of various sectors to the GDP;
During the week, KNBS released their Q2’2026 Kenya Residential Property Price Index (RPPI), which indicated that the overall RPPI increased by 2.2% to 120.3 in Q2'2026 from 117.7 in Q2'2025. On a quarter-on-quarter basis, the index increased by 1.6% from 118.4 in Q1'2026;
During the week, China Road and Bridge Corporation (CRBC) was awarded a Kshs 3.2 bn contract to upgrade the seven-kilometer Old Mombasa Road linking the Nairobi ICD to Syokimau, a development expected to enhance logistics connectivity along a key freight corridor and support demand for industrial and warehousing real estate in the surrounding area;
During the week, the National Treasury approved the initial pitch to convert the 243-kilometre Athi River–Namanga A2 corridor into a dual carriageway under a PPP model, a development expected to accelerate real estate demand in peri-urban nodes along the route including Kitengela, Isinya, and Kajiado;
During the week, the National Land Commission (NLC) initiated compulsory acquisition of 59 land parcels in Nyamira County for the SGR Phase 2B and 2C extension, with the Kenya Railways Corporation (KRC) having set aside Kshs 25.0 bn for land compensation across affected counties, as the project targets a cargo handling capacity of 22.0 mn tonnes annually upon completion and preliminary operations by mid-2027;
During the week, the Nairobi City County Cabinet approved a fresh land rates exemption application procedure under the National Rating Act, 2024, requiring all property owners to reapply before the January 2027 billing cycle;
During the week, title deed issuance in Kenya fell 35.3% to 282,392 in the year to June 2026, the first annual decline in five years, with the State Department attributing the underperformance to low land transactions;
On the Unquoted Securities Platform Acorn D-REIT and I-REIT traded at Kshs 29.7 and Kshs 24.4 per unit, respectively, as per the last updated data on 16th October 2026. The performance represented a 48.5% and 22.0% gain for the D-REIT and I-REIT, respectively, from the Kshs 20.0 inception price. The volumes traded for the D-REIT and I-REIT came in at 13.7 mn and 46.0 mn shares, respectively. Additionally, ILAM Fahari I-REIT traded at Kshs 13.8 per share as of 16th October 2026, representing a 31.0% loss from the Kshs 20.0 inception price. The volume traded came in at 1.2 mn shares;
Digital Payments
During the week, Visa announced that its Visa Direct stablecoin enabled prefunding capability had moved from pilot testing into commercial production, with Inyo Global becoming the first payments infrastructure provider to deploy the service for eligible clients and partners.;
During the week, Mastercard launched its Global Money Platform with BVNK, integrating traditional fiat payments and stablecoin infrastructure through a single API following Mastercard’s acquisition of BVNK in August 2026. The platform enables banks, fintechs and enterprises to embed multi-currency accounts, real-time currency conversion, stablecoin linked cards and local bank payouts through Mastercard Move.
During the week, American Express published its Intent Intelligence framework through its Agentic Commerce Experiences (ACE) Developer Kit, outlining an approach to capturing, authenticating and preserving customer purchase intent before an artificial intelligence (AI) agent executes a transaction. The framework uses a Create Intent API to record customer instructions which customers authenticate before the system generates a unique Intent ID and Proof of Intent Token;
The digital payment stocks we track (AXP, Visa, Mastercard, Circle, Block, and PayPal) are currently trading at an average forward P/E of 25.6x, implying that investors continue to price in resilient earnings growth and strong digital payment adoption, although elevated operating costs and higher client incentives across legacy card networks may moderate valuation expansion in the near term;
Focus of the Week
In pursuit of a stable and sustainable economic future, the Kenyan government prioritizes balancing its economic policies, especially regarding the Balance of Payments. Achieving this balance is essential to ensuring stable trade relations, managing capital inflows and outflows, addressing inflationary pressures, and maintaining a favourable exchange rate system. These efforts are geared towards fostering economic growth, creating employment opportunities, and implementing strategic commercial policies, all of which play pivotal roles in Kenya's pursuit of a robust and sustainable economic trajectory. In light of this, we saw it fit to focus on Kenya’s balance of payments to analyse the current state and what can be done to improve it;
Investment Updates:
-
Weekly Rates: Cytonn Money Market Fund closed the week at a yield of 11.01% p.a. To invest, dial *809# or download the Cytonn App from Google Play store here or from the Appstore here;
-
We continue to offer Wealth Management Training every Tuesday, from 7:00 pm to 8:00 pm. The training aims to grow financial literacy among the general public. To register for any of our Wealth Management Trainings, click here; If interested in our Private Wealth Management Training for your employees or investment group, please get in touch with us through wmt@cytonn.com;
-
Cytonn Asset Managers Limited (CAML) continues to offer pension products to meet the needs of both individual clients who want to save for their retirement during their working years and Institutional clients that want to contribute on behalf of their employees to help them build their retirement pot. To more about our pension schemes, kindly get in touch with us through pensions@cytonn.com;
Hospitality Updates:
-
We currently have promotions for Staycations. Visit cysuites.com/offers for details or email us at sales@cysuites.com;
Money Markets, T-Bills Primary Auction:
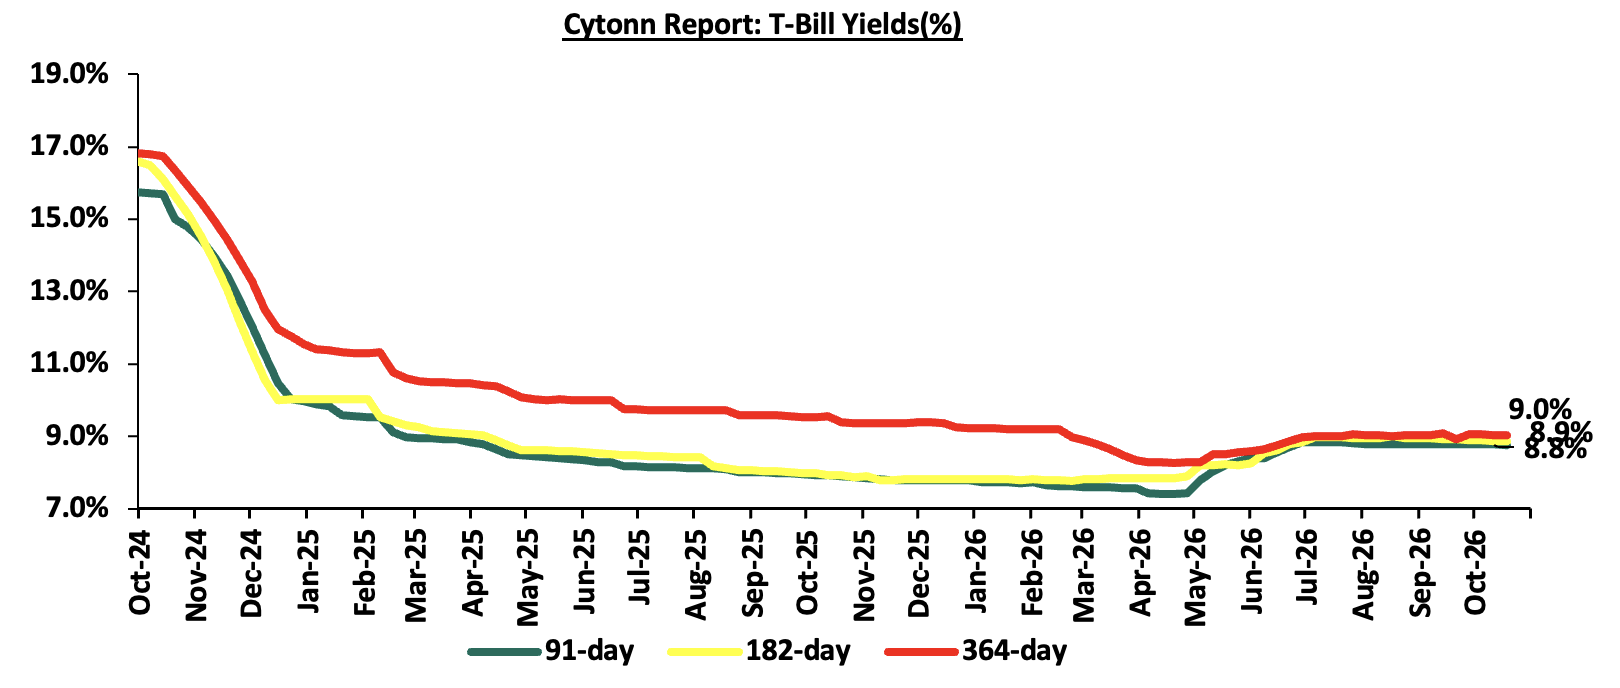
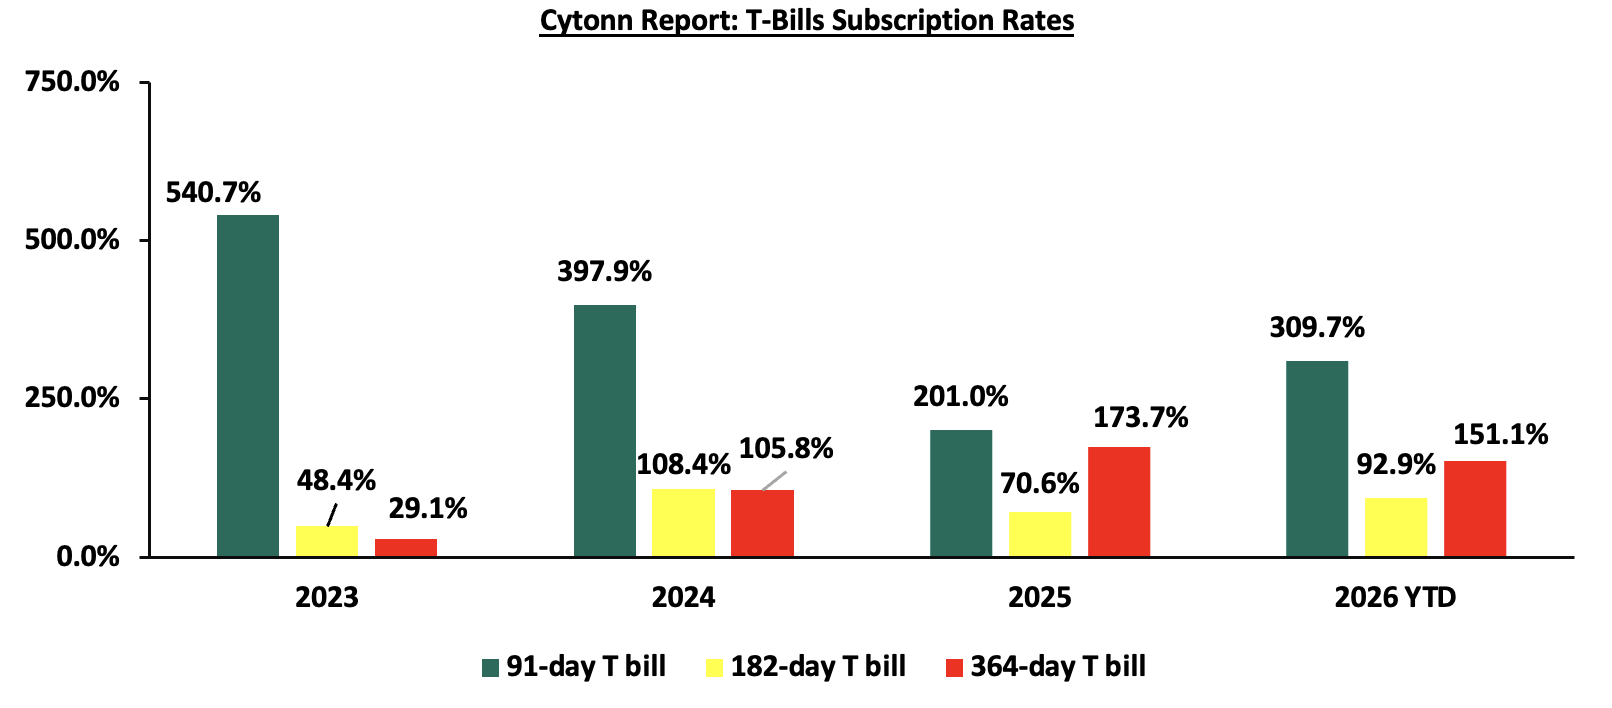
This week, were oversubscribed for the eleventh consecutive week, with the overall subscription rate coming in at 244.6% lower than the subscription rate of 269.2% recorded the previous week. Investors’ preference for the shorter 91-day paper persisted, with the paper receiving bids worth Kshs 49.8 bn against the offered Kshs 8.0 bn, translating to a subscription rate of 622.5% lower than the subscription rate of 627.6%, recorded the previous week. The subscription rate for the 182-day paper decreased to 120.6% from 155.3% recorded the previous week, while that of the 364-day paper decreased to 66.4% from 96.4% recorded the previous week, the government accepted a total of Kshs 52.3 bn worth of bids out of Kshs 68.5 bn bids received, translating to an acceptance rate of 76.4%. The yields on the government papers recorded a mixed performance with the yields on the 364-day paper increasing by 0.3 bps to remain relatively unchanged at 9.04% recorded the previous week. While the yields on the 182-day and 91-day papers decreased by 1.4 bps and 1.2 bps to 8.86% and 8.75% from 8.87% and 8.76% recorded the previous week respectively.
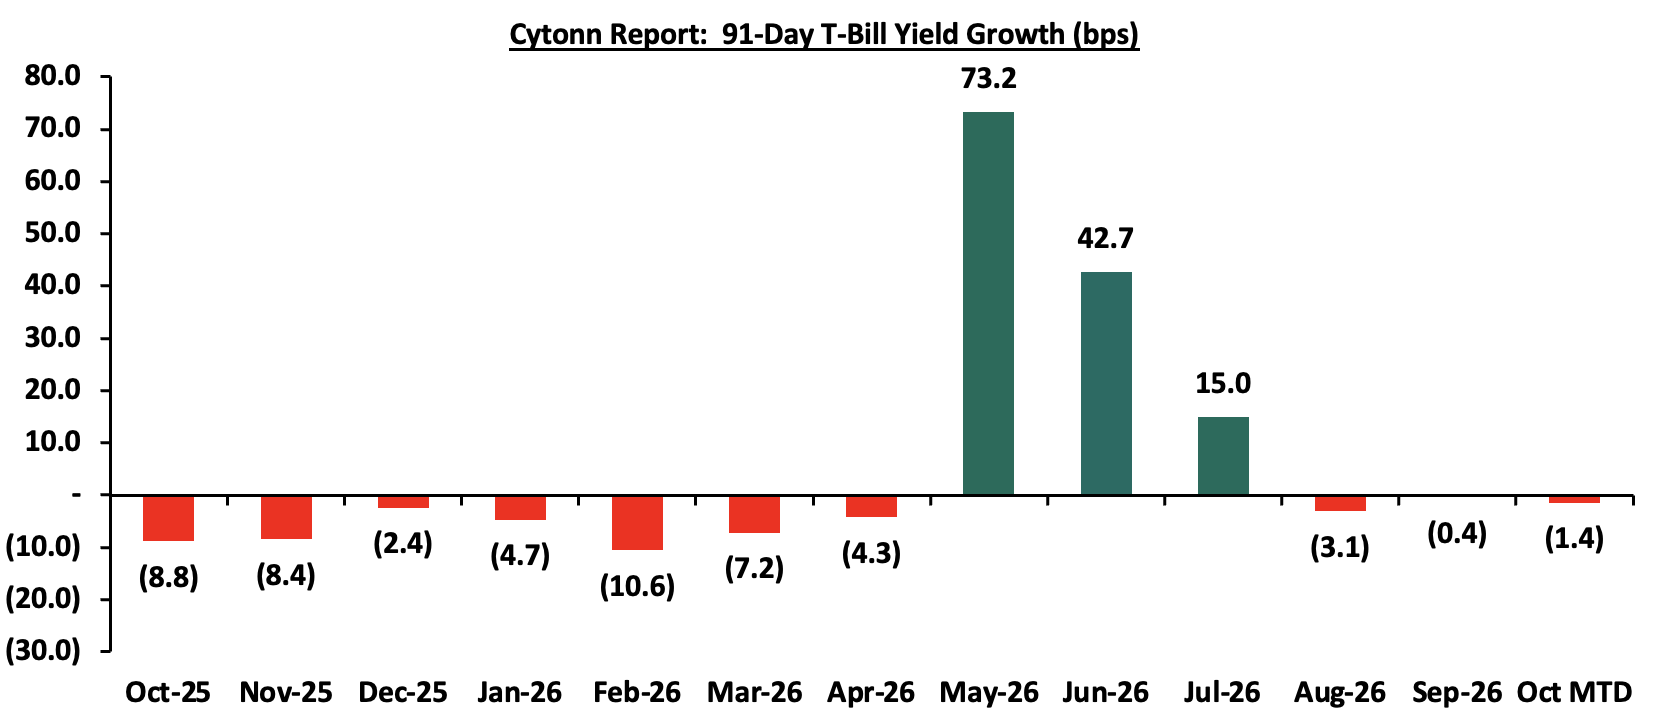
The chart below shows the yield growth rate for the 91-day paper from October 2025 to date:
The chart below shows the performance of the 91-day, 182-day and 364-day papers from October 2024 to October 2026:
The chart below compares the overall average T-bill subscription rates obtained in 2023, 2024, 2025 and 2026 Year-to-date (YTD):
T-Bonds Primary Market:
During the week, the Central Bank of Kenya released the auction results for the re-opened treasury bonds SDB1/2011/030 and FXD1/2026/030 with tenors to maturities of 14.4 years and 29.6 years respectively and fixed coupon rates of 12.0% and 12.5% respectively. The bonds were oversubscribed, with the overall subscription rate coming in at 167.7%, receiving bids worth Kshs 83.8 bn against the offered Kshs 50.0 bn.
The government accepted bids worth Kshs 53.0 bn, translating to an acceptance rate of 63.3%. The weighted average yield for the accepted bids for the SDB1/2011/030 and FXD1/2026/030 came in at 13.65% and 14.18% respectively. Notably, the 13.65% yield on SDB1/2011/030 was marginally lower than the 13.69% recorded at the last reopening in September 2026 while the 14.18% yield on the FXD1/2026/030 was also marginally lower than the 14.24% recorded at the last reopening in September 2026.
With the Inflation rate at 6.8% as of September 2026, the real returns of the SDB1/2011/030 and FXD1/2026/030 are 6.9% and 7.4% respectively. Given the 10.0% withholding tax on the bonds, the tax equivalent yields for shorter term bonds with 15.0% withholding tax are 12.7% for SDB1/2011/030 and 13.2 % for FXD1/2026/030;
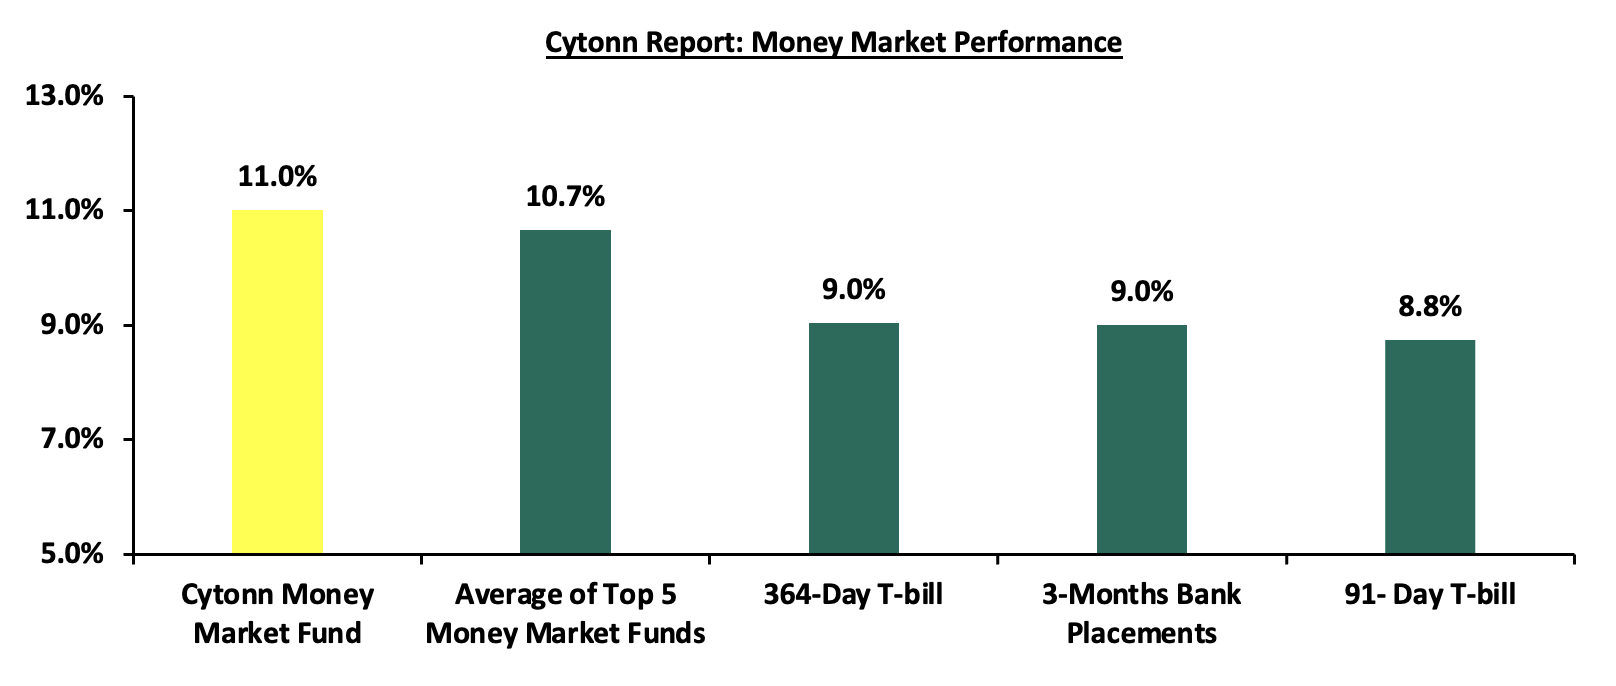
In the money markets, 3-month bank placements ended the week at 9.0% (based on rates offered by various banks). The yields on the government papers recorded a mixed performance with the yields on the 364-day paper increasing by 0.3 bps to remain relatively unchanged at 9.04% recorded the previous week. While the yields on the 91-day papers decreased by 1.2 bps to 8.75% from 8.76% recorded the previous week respectively. The yield on the Cytonn Money Market Fund decreased by 2.0 bps to 11.01% from the 11.03% recorded the previous week, while the average yields on Top 5 Money Market Funds decreased by 18.0 bps to 10.7% from 10.8% recorded the previous week.
The table below shows the Money Market Fund Yields for Kenyan Fund Managers as published on 16th October 2026
|
Money Market Fund Yield for Fund Managers as published on 16th October 2026 |
||
|
Rank |
Fund Manager |
Effective Annual Rate |
|
1 |
Cytonn Money Market Fund (Dial *809# or download Cytonn App) |
11.0% |
|
2 |
Faulu Money Market Fund |
10.8% |
|
3 |
Lofty-Corban Money Market Fund |
10.6% |
|
4 |
Ndovu Money Market Fund |
10.5% |
|
5 |
Arvocap Money Market Fund |
10.5% |
|
6 |
Madison Money Market Fund |
10.4% |
|
7 |
Enwealth Money Market Fund |
10.4% |
|
8 |
Orient Kasha Money Market Fund |
10.4% |
|
9 |
Old Mutual Money Market Fund |
10.3% |
|
10 |
Kuza Money Market fund |
10.3% |
|
11 |
Rejesha Money Market Fund |
10.3% |
|
12 |
Nabo Africa Money Market Fund |
10.2% |
|
13 |
Jubilee Money Market Fund |
10.2% |
|
14 |
GenAfrica Money Market Fund |
10.1% |
|
15 |
Gulfcap Money Market Fund |
10.1% |
|
16 |
Etica Money Market Fund |
10.0% |
|
17 |
British-American Money Market Fund |
9.7% |
|
18 |
Apollo Money Market Fund |
9.6% |
|
19 |
Globetec Money Market Fund |
9.6% |
|
20 |
SanlamAllianz Money Market Fund |
9.5% |
|
21 |
KCB Money Market Fund |
9.3% |
|
22 |
Dry Associates Money Market Fund |
9.2% |
|
23 |
Genghis Money Market Fund |
8.9% |
|
24 |
CIC Money Market Fund |
8.4% |
|
25 |
CPF Money Market Fund |
8.4% |
|
26 |
AA Kenya Shillings Fund |
8.2% |
|
27 |
Mayfair Money Market Fund |
8.2% |
|
28 |
Co-op Money Market Fund |
8.0% |
|
29 |
Mali Money Market Fund |
8.0% |
|
30 |
ICEA Lion Money Market Fund |
7.9% |
|
31 |
Absa Shilling Money Market Fund |
7.2% |
|
32 |
Ziidi Money Market Fund |
6.2% |
|
33 |
Stanbic Money Market Fund |
5.3% |
|
34 |
Equity Money Market Fund |
4.2% |
Source: Business Daily
Liquidity:
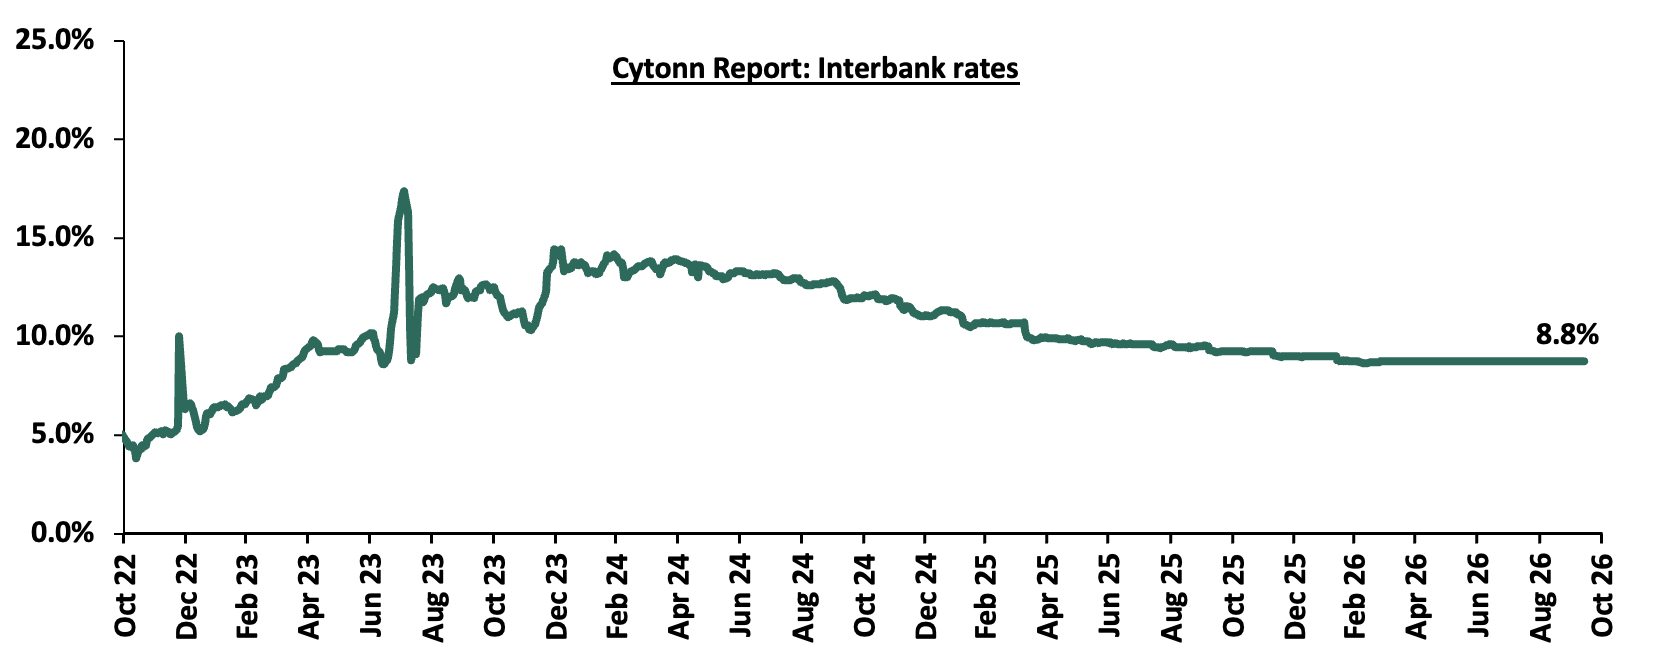
During the week, liquidity in the money markets eased with the average interbank rate decreasing marginally by 0.2 bps to remain relatively unchanged at 8.8% recorded the previous week, partly attributable government payments that offset tax remittances. The average interbank volumes traded increased by 153.1% to Kshs 14.9 bn from Kshs 5.9 bn recorded the previous week. The chart below shows the interbank rates in the market over the years:
Kenya Eurobonds:
During the week, the yields on the Eurobonds recorded a mixed performance with the yields on the 7 -year 2024 issue decreasing the most by 33.9 bps to 8.0% from 8.1% recorded the previous week. However, this was supported by the 30-year 2018 issue increasing the most by 13.2 bps to 9.9% from 9.8% recorded the previous week. The table below shows the summary performance of the Kenyan Eurobonds as of 15th October 2026:
|
Cytonn Report: Kenya Eurobonds Performance |
||||||
|
|
2018 |
2019 |
2021 |
2024 |
||
|
Tenor |
10-year issue |
30-year issue |
12-year issue |
13-year issue |
7-year issue |
|
|
Amount Issued (USD) |
1.0 bn |
1.0 bn |
1.0 bn |
1.5 bn |
1.5 bn |
|
|
Years to Maturity |
2.5 |
22.5 |
8.8 |
5.5 |
10.5 |
|
|
Yields at Issue |
7.3% |
8.3% |
6.2% |
10.4% |
9.9% |
|
|
02-Jan-26 |
6.1% |
8.8% |
7.2% |
7.8% |
7.1% |
|
|
01-Oct-26 |
7.6% |
9.8% |
8.8% |
9.2% |
8.3% |
|
|
08-Oct-26 |
7.3% |
9.8% |
8.7% |
9.3% |
8.1% |
|
|
09-Oct-26 |
7.3% |
9.9% |
8.6% |
9.2% |
7.9% |
|
|
12-Oct-26 |
7.1% |
9.8% |
8.6% |
9.1% |
7.9% |
|
|
13-Oct-26 |
7.2% |
9.8% |
8.5% |
9.0% |
7.8% |
|
|
14-Oct-26 |
7.2% |
9.9% |
8.6% |
9.1% |
7.9% |
|
|
15-Oct-26 |
7.3% |
9.9% |
8.7% |
9.2% |
8.0% |
|
|
Weekly Change |
(0.0%) |
0.1% |
(0.0%) |
(0.1%) |
(0.1%) |
|
|
MTD Change |
(0.3%) |
0.1% |
(0.1%) |
(0.0%) |
(0.3%) |
|
|
YTD Change |
1.3% |
1.1% |
1.5% |
1.4% |
0.9% |
|
Source: Central Bank of Kenya (CBK) and National Treasury
Kenya Shilling:
During the week, the Kenya Shilling appreciated marginally against the US Dollar by 1.5 bps to 129.89 from 129.91 recorded the previous week. On a year-to-date basis, the shilling has depreciated by 65.1 bps against the dollar, as compared to the 22.9 bps appreciation recorded in 2025.
We expect the shilling to be supported by:
-
Diaspora remittances standing at a cumulative USD 5,031.5 mn in the twelve months to September 2026, slightly lower than the USD 5,080.5 mn recorded over the same period in 2025. These have continued to cushion the shilling against further depreciation. In the September 2026 diaspora remittances figures, North America remained the largest source of remittances to Kenya accounting for 49.1% in the period,
-
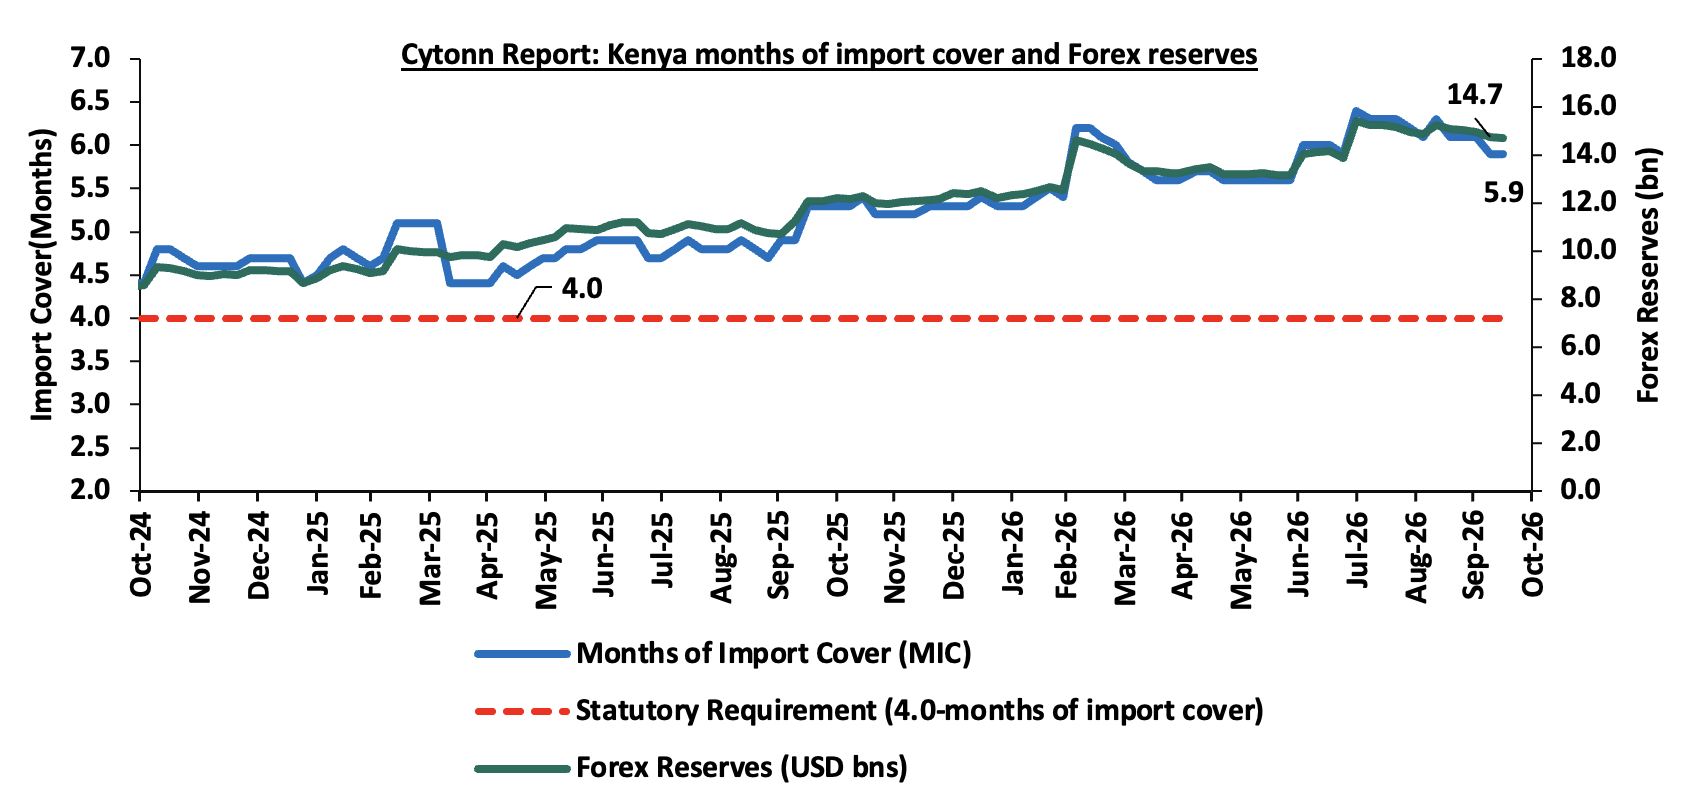
Improved forex reserves currently at USD 14.7 bn (equivalent to 5.9-months of import cover), which is above the statutory requirement of maintaining at least 4.0-months of import cover and above the EAC region’s convergence criteria of 4.5-months of import cover.
The shilling is however expected to remain under pressure in 2026 as a result of:
-
An ever-present current account deficit which widened to 3.1% of GDP in the 12 months to August 2026 compared to 2.1% of GDP in a similar period in 2025 and,
-
The need for government debt servicing, continues to put pressure on forex reserves given that 54.7% of Kenya’s external debt is US Dollar-denominated as of July 2026.
-
Rising geopolitical tensions in the Middle East, which could exert pressure on the shilling through higher global oil prices and increased uncertainty in international markets. Given that Kenya is a net importer of petroleum products, any sustained increase in oil prices would widen the import bill, increase demand for US Dollars, and consequently put depreciation pressure on the shilling
Kenya's forex reserves decreased marginally by 0.3% during the week to USD 14.69 bn, from USD 14.73 bn recorded the previous week, equivalent to 5.9 months of import cover, and above the statutory requirement of maintaining at least 4.0-months of import cover. The chart below summarizes the evolution of Kenya's months of import cover over from September 2024 to September 2026:
Weekly Highlights
-
Fuel Prices effective 15th October 2026 to 14th November 2026
During the week, The Energy and Petroleum Regulatory Authority (EPRA) released their monthly statement on the maximum retail fuel prices in Kenya, effective from 15th October 2026 to 14th November 2026. Notably, the maximum allowed prices for Kerosene, Super Petrol and Diesel increased by Kshs 28.5, Kshs 12.9 and Kshs 9.9 per litre to Kshs 219.9, Kshs 226.9 and Kshs 227.8 respectively, from Kshs 191.4, Kshs 214.0 and Kshs 217.9 set in September.
Other key take-outs from the performance include,
-
The average landed cost of imported Super Petrol, Diesel and Kerosene increased by 11.8%, 11.3% and 9.4% to USD 977.6, USD 1,065.4 and USD 1,098.3 per cubic meter, respectively, in September 2026, from USD 874.3, USD 957.1 and USD 1,003.9 in August 2026.
-
The Kenyan Shilling depreciated marginally against the US Dollar by 14.6 bps to Kshs 129.91 in September 2026 from Kshs 129.72 in August 2026.
-
The prices are inclusive of Value Added Tax (VAT) at 8.0%, in line with Government policy to cushion consumers from the negative effects of high international prices.
-
International petroleum prices increased across all three products in September 2026. Super Petrol, Kerosene and Diesel prices increased by 16.6%, 10.8% and 10.1% to USD 1,300.7, USD 1,253.5 and USD 1,215.8 per metric tonne, respectively, from USD 1,115.3, USD 1,131.2 and USD 1,103.9 in August 2026.
Going forward, domestic fuel prices are likely to remain elevated and vulnerable to fluctuations in international petroleum prices, with geopolitical tensions, particularly the US/Israel-Iran war and potential disruptions to shipments through the Strait of Hormuz, posing the main upside risk. Prolonged disruptions could increase global supply costs and landed petroleum costs, exerting further upward pressure on local pump prices. However, the relatively stable USD/Kshs exchange rate should moderate imported inflation by limiting exchange-rate-driven increases in fuel costs. Given Kenya’s reliance on imported refined petroleum, sustained increases in international prices are likely to translate directly into higher domestic pump prices, with potential spillover effects on transport costs, production expenses and overall inflation.
-
Kenya Q2’2026 GDP Highlight
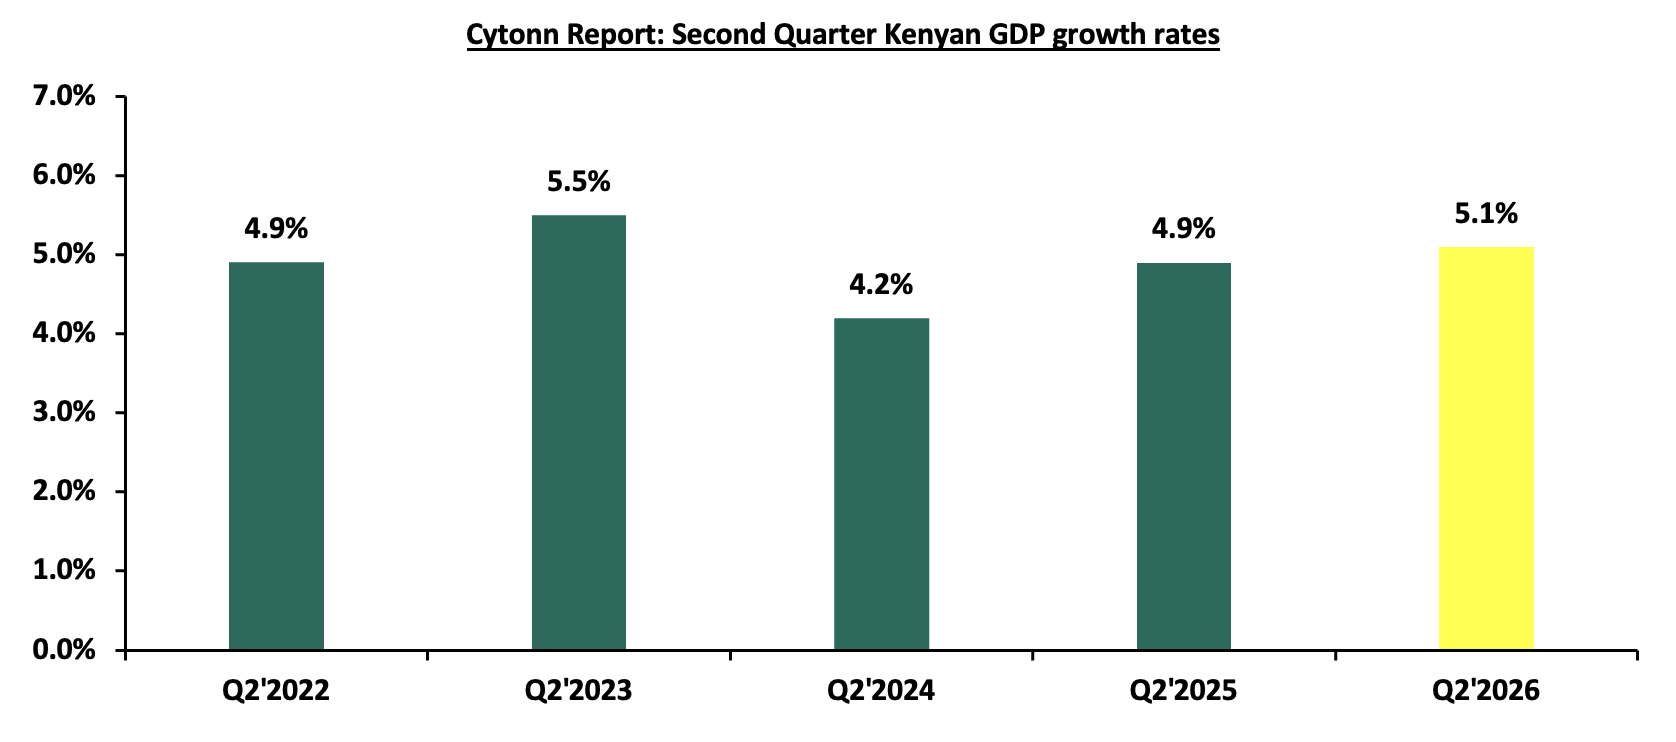
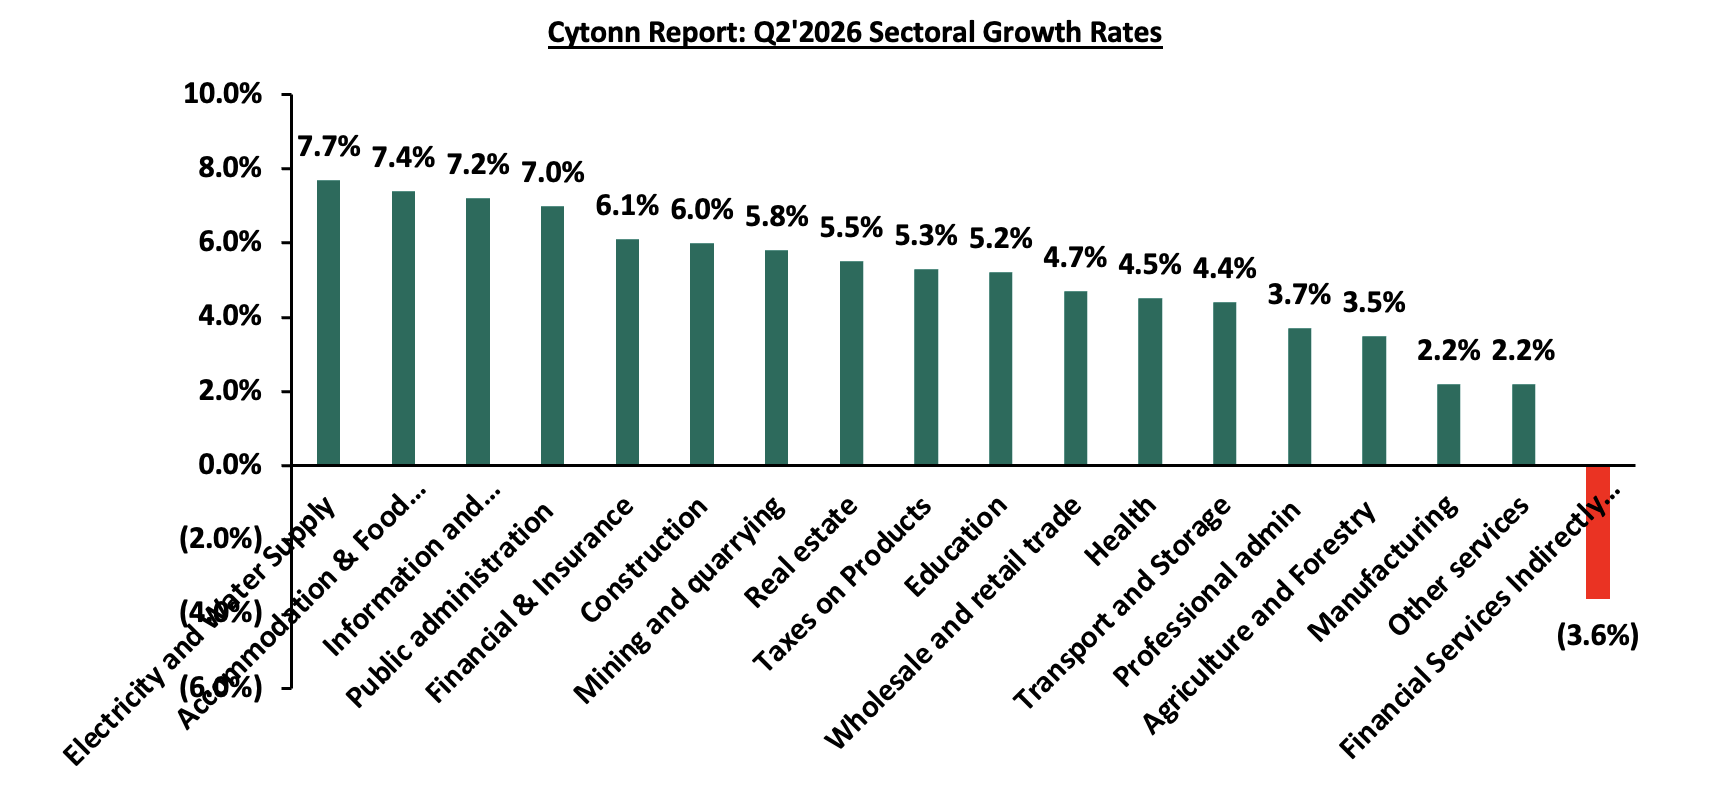
The Kenya National Bureau of Statistics (KNBS) released the Q2’2026 Quarterly Gross Domestic Product Report, highlighting that the Kenyan economy recorded a 5.1% growth in Q2’2026, higher than the 4.9% growth recorded in Q2’2025. The main contributor to Kenyan GDP remains the Agriculture, Forestry and Fishing sector, which grew by 3.5% in Q2’2026, lower than the 4.0% expansion recorded in Q2’2025, as the early cessation of the long rains weighed on crop production. Almost all sectors except Financial Services Indirectly Measured recorded positive growths in Q2’2026, with varying magnitudes across activities. Notably, Electricity and Water Supply, Accommodation and Food Services and Information and Communication recorded the highest growth rates of 7.7%, 7.4% and 7.2% respectively. The chart below shows the second Quarter Kenyan GDP growth rates;
Source: KNBS
The key take-outs from the report are:
-
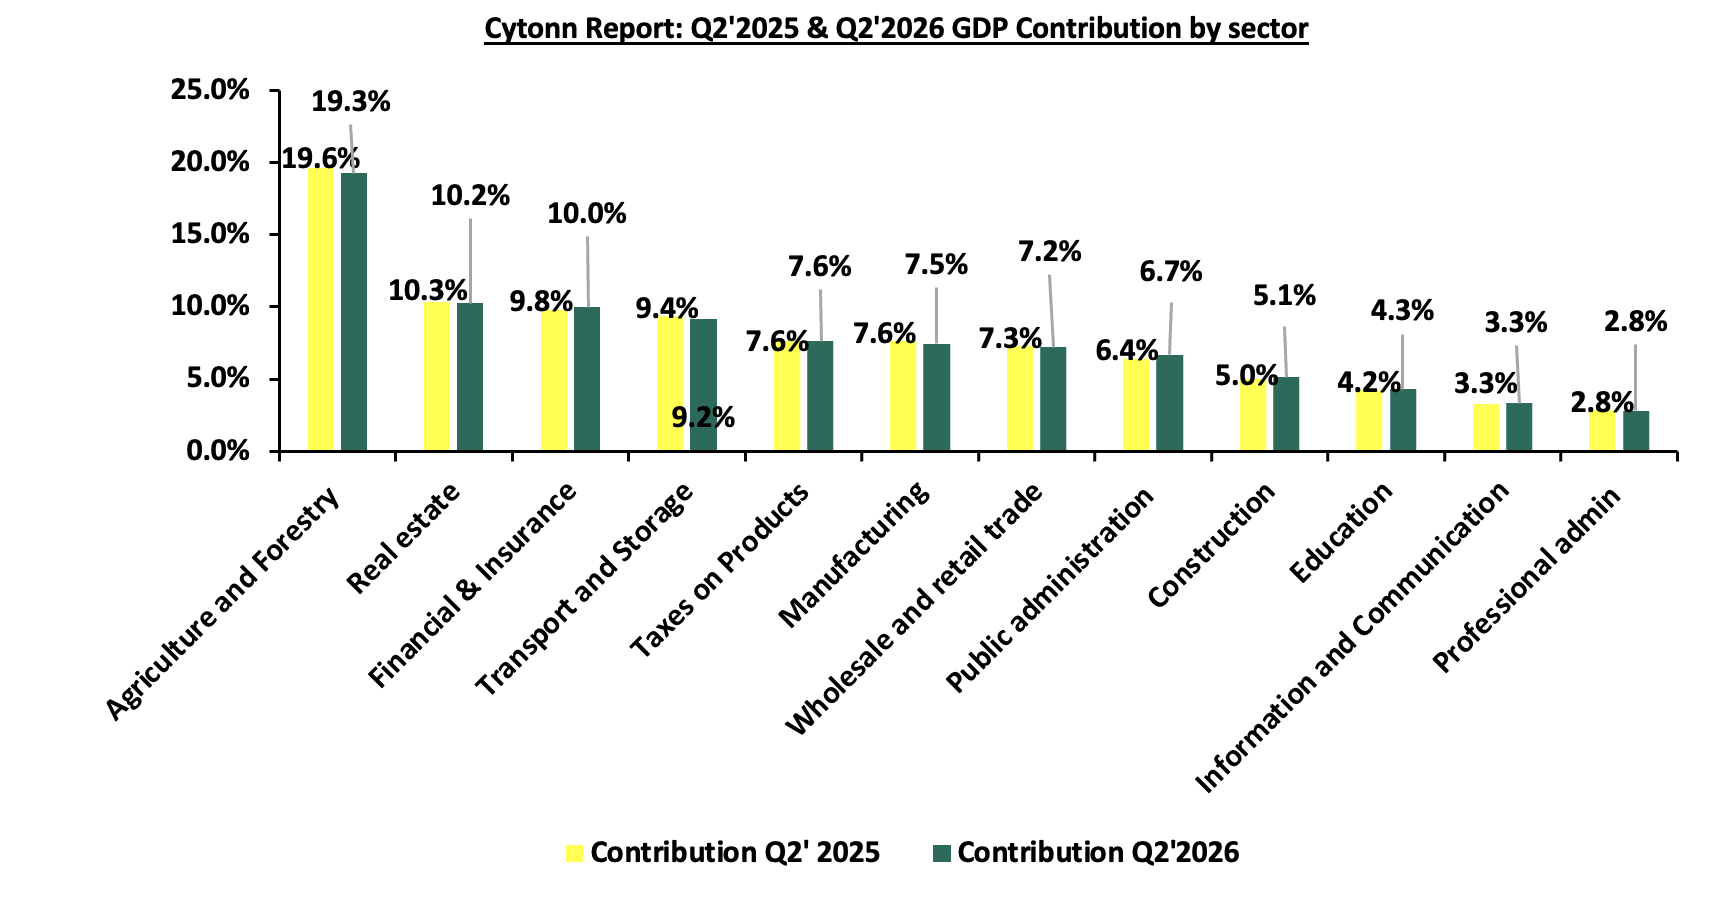
The biggest gainers in terms of sectoral contribution to GDP were Public Administration, which increased by 0.3% points to 6.7% in Q2'2026 from 6.4% in Q2'2025, and the Financial & Insurance and Accommodation & Food Services sectors, which each increased by 0.2% points to 10.0% and 1.8% respectively from 9.8% and 1.6%. Agriculture and Forestry was the biggest loser, declining by 0.3% points to 19.3% in Q2'2026 from 19.6% in Q2'2025, followed by Transport and Storage, which declined by 0.2% points to 9.2% from 9.4%. Electricity and Water Supply recorded the highest growth rate in Q2'2026 at 7.7%, from the 6.5% recorded in Q2'2025.
The chart below shows the top contributors to GDP by sector in Q2’2025 and Q2’2026:
-
Decelerated growth in the Agricultural Sector: Agriculture and Forestry recorded a growth of 3.5% in Q2’2026, a decrease of 0.5% points from the 4.0% expansion recorded in Q2’2025. The sector remains the major contributor to GDP, although its contribution eased to 19.3% in Q2’2026 from 19.6% in Q2’2025. The slowdown was partly attributed to unfavorable weather conditions, which affected crop production. The early cessation of the March–May long rains in May 2026, particularly during the critical stages of crop development, which led to downward revisions of expected crop production. The sector’s growth was, however, supported by;
-
Increased production of tea, which rose by 11.1% to 162.6 thousand metric tonnes in Q2’2026 from 146.3 thousand metric tonnes in Q2’2025, while cane deliveries almost doubled to 2,419.7 thousand metric tonnes from 1,259.4 thousand metric tonnes.
-
Increased exports of coffee, which rose by 10.0% to 22,046.4 metric tonnes from 20,041.8 metric tonnes, vegetables, which rose to 16,025.9 metric tonnes from 13,326.8 metric tonnes, and cut flowers, which edged up to 33,105.8 metric tonnes from 32,953.9 metric tonnes.
The sector’s growth was, however, slowed down by;
-
A decline in milk intake by processors, which fell by 3.1% to 263.6 mn litres in Q2’2026 from 272.0 min litres in Q2’2025.
-
Fruit exports, which contracted by 5.8% to 76,084.0 metric tonnes in the period under review
-
Accelerated growth in the electricity and water supply sector - The Electricity and Water Supply sector recorded a growth of 7.7% in Q2’2026 compared to a 6.5% growth in Q2’2025, with the sectoral contribution to GDP rising by 0.1% points to 2.4% in Q2’2026 from 2.3% in Q2’2025. Growth was supported by increased generation from renewable sources, coupled with reduced reliance on thermal generation, while total electricity sales increased by 15.0% to 3,511.6 mn kilowatt per hour (KWh) from 3,054.9 mn KWh in Q2’2025. Notably;
-
Electricity generated from geothermal sources increased by 10.1% to 1,628.7 mn KWh in Q2’2026.
-
Electricity generated from wind increased by 13.5% to 469.8 mn KWh from 413.8 mn KWh, while hydro generation increased to 956.0 mn KWh from 919.6 mn KWh in Q2’2025.
-
Electricity generated from thermal sources declined by 16.3% to 288.4 mn KWh from 344.4 mn KWh in Q2’2025, reflecting lower reliance on costlier thermal generation
-
Stable growth in the Accommodation and Food Service sector: The Accommodation and Food Services sector recorded growth of 7.4% in Q2’2026, slower than the 12.8% recorded in Q2’2025. The sector’s contribution to GDP rose by 0.2% points to 1.8% in Q2’2026 from 1.6% in Q2’2025. Some of the notable developments include:
-
International visitor arrivals through the two major airports, Jomo Kenyatta International Airport (JKIA) and Mombasa International Airport (MIA), increased marginally by 1.4% to 424,220 passengers in Q2’2026 from 418,193 passengers in Q2’2025
The chart below shows the different sectoral GDP growth rates for Q2’2026:
Kenya’s economy is projected to grow by 4.4%–5.3% in 2026, a downward revision from earlier forecasts due to heightened global uncertainty from the Middle East conflict and evolving international trade policies. The economy grew by 5.1% in Q2'2026, up from 4.9% in Q2'2025, despite disruptions in the global energy market, with the average price of crude oil rising to USD 104.45 per barrel from USD 67.44 a year earlier, and the early cessation of the long rains. Price pressures have continued to build, with annual inflation rising to 6.8% in September 2026 from 6.6% in August, its highest level since January 2024 and the sixth consecutive month above the 5.0% mid-point of the CBK’s 2.5%–7.5% target range, driven mainly by food at 9.5% and transport at 15.6%. Against this backdrop, the CBK’s Monetary Policy Committee maintained the Central Bank Rate (CBR) at 8.75% in October 2026, its fourth consecutive hold, to keep inflation expectations anchored and the exchange rate stable. While the shortened long rains, higher fuel prices and a widening current account deficit, to Kshs 252.5 bn in Q2’2026 from Kshs 69.4 bn in Q2’2025 pose downside risks, resilient domestic fundamentals, lower borrowing costs and strong private sector credit growth support a cautiously optimistic outlook for 2026
Rates in the fixed income market have declined MTD, reversing the recent upward trend. The decline comes despite the CBK's decision to pause its rate-cutting cycle at 8.75%, with inflation remaining elevated at 6.8% but within the CBK's target range of 2.5%-7.5%. The government is 227.1% ahead of its prorated net domestic borrowing target of Kshs 919.4 bn, having a net borrowing position of Kshs 631.0 bn (inclusive of T-bills). We expect investors to maintain a preference for short to medium-term papers as they monitor the pace of government issuance and the path of inflation before committing further out on the curve, with the yield curve likely to remain under upward pressure rather than stabilize, at least until the inflation trajectory becomes clearer.
Market Performance:
During the week, the equities market was on a downward trajectory, with the NSE 10, NSE 25, NASI, and NSE 20 declining by 2.1%, 1.9%, 1.8%, and 1.5% respectively, taking their YTD performance to gains of 35.6%, 35.3%, 33.4% and 28.4% respectively for NSE 10, NSE 25, NASI and NSE 20 respectively. The week-on-week equities market performance was mainly driven by losses recorded by large-cap stocks such as Equity, NCBA, and Safaricom of 3.8%, 3.1%, and 2.4% respectively. The performance was however supported by gains recorded by large-cap stocks such as BAT, and Stanbic of 0.2% and 0.1%, respectively.
During the week, the banking sector index decreased by 1.9% to 282.9 from the 288.3 recorded the previous week. This is attributable to losses recorded by large cap stocks such as Equity, NCBA, and DTBK of 3.8%, 3.1%, and 2.2% respectively. The performance was however supported by gains recorded by large-cap stocks such as Stanbic of 0.1%.
During the week, equities turnover Increased by 63.0% to USD 24.5 mn from USD 15.0 mn recorded the previous week, taking the YTD total turnover to USD 3,092.6 mn. Foreign investors became net sellers with a net selling position of USD 9.5 mn, from a net buying position of USD 5.7 mn recorded the previous week, taking the YTD foreign net selling position to USD 181.3 mn, compared to a net selling position of USD 92.9 mn recorded in 2025.
The market is currently trading at a price to earnings ratio (P/E) of 7.4x, 33.7% below the historical average of 11.2x, and a dividend yield of 5.9%, 1.2% points above the historical average of 4.8%. Key to note, NASI’s PEG ratio currently stands at 0.9x, an indication that the market is slightly undervalued relative to its future growth. A PEG ratio greater than 1.0x indicates the market may be overvalued while a PEG ratio less than 1.0x indicates that the market is undervalued.
The charts below indicate the historical P/E and dividend yields of the market:
Universe of Coverage:
|
Cytonn Report: Equities Universe of Coverage |
|||||||||||
|
Company |
Price as at 09/10/2026 |
Price as at 16/10/2027 |
w/w change |
m/m change |
YTD Change |
Year Open 2026 |
Target Price* |
Dividend Yield |
Upside/ Downside** |
P/TBv Multiple |
Recommendation |
|
NCBA |
88.8 |
86.0 |
(3.1%) |
(3.4%) |
1.2% |
85.0 |
108.9 |
8.3% |
34.9% |
1.2x |
Buy |
|
Co-op Bank |
37.0 |
36.6 |
(1.1%) |
(1.5%) |
52.9% |
23.9 |
46.1 |
6.8% |
33.0% |
1.3x |
Buy |
|
KCB Group |
89.8 |
89.5 |
(0.3%) |
(1.9%) |
36.1% |
65.8 |
104.4 |
7.8% |
24.5% |
0.9x |
Buy |
|
Family Bank |
28.0 |
27.7 |
(1.3%) |
(4.5%) |
53.6% |
18.0 |
32.5 |
4.3% |
21.9% |
1.4x |
Buy |
|
ABSA Bank |
33.1 |
32.6 |
(1.5%) |
(1.8%) |
31.0% |
24.9 |
36.8 |
6.3% |
19.5% |
1.8x |
Accumulate |
|
Equity Group |
104.0 |
100.0 |
(3.8%) |
(4.5%) |
49.3% |
67.0 |
113.5 |
5.8% |
19.3% |
1.3x |
Accumulate |
|
Standard Chartered Bank |
318.3 |
317.5 |
(0.2%) |
0.1% |
5.9% |
299.8 |
345.8 |
9.8% |
18.7% |
2.0x |
Accumulate |
|
Stanbic Holdings |
275.5 |
275.8 |
0.1% |
(2.2%) |
39.4% |
197.8 |
300.3 |
8.1% |
17.0% |
1.6x |
Accumulate |
|
Diamond Trust Bank |
191.0 |
186.8 |
(2.2%) |
(1.2%) |
62.7% |
114.8 |
199.5 |
4.8% |
11.7% |
0.5x |
Accumulate |
|
I&M Group |
87.5 |
85.0 |
(2.9%) |
3.0% |
98.6% |
42.8 |
90.4 |
4.4% |
10.8% |
1.4x |
Accumulate |
|
Jubilee Holdings |
402.8 |
393.3 |
(2.4%) |
(1.7%) |
21.9% |
322.5 |
420.5 |
3.8% |
10.7% |
0.5x |
Accumulate |
|
Britam |
18.2 |
18.4 |
0.8% |
(2.4%) |
102.5% |
9.1 |
18.5 |
0.0% |
0.5% |
1.4x |
Lighten |
|
CIC Group |
5.1 |
5.1 |
(0.4%) |
3.0% |
12.3% |
4.5 |
5.0 |
2.5% |
(0.2%) |
1.3x |
Sell |
|
*Target Price as per Cytonn Analyst estimates **Upside/ (Downside) is adjusted for Dividend Yield ***Dividend Yield is calculated using FY’2025 Dividends |
|||||||||||
Weekly highlights
-
Kenya Pipeline Company (KPC) FY’2026 Financial Results
During the week, The Kenya Pipeline Company (KPC), released its FY’2026 financial results, recording a 13.1% Increase in Profit After Tax (PAT) to Kshs 11.6 bn in FY’ 2026 from 10.2 bn in FY’ 2025. This is mainly attributable to an 8.9% increase in Net Revenue to Kshs 33.8 bn from Kshs 31.1 bn in FY’2025. The increase in PAT was, however, weighed down by a 4.1% increase in operating expenses to Kshs 8.9 bn from Kshs 8.5 bn in FY’2025, coupled with a 20.2% increase in depreciation and amortization charges to Kshs 7.7 bn from Kshs 6.4 bn in 2025.
The table below summarizes the Company’s Financial Performance:
|
Cytonn Report: Kenya Pipeline Company (KPC) FY'2026 Performance |
|
|||
|
Income Statement |
FY'2026 Kshs (bn) |
FY'2025 Kshs (bn) |
% Change |
|
|
Transport Revenue |
41.8 |
38.6 |
8.4% |
|
|
Total Revenue |
43.0 |
39.5 |
8.8% |
|
|
Direct costs |
(9.2) |
(8.4) |
8.5% |
|
|
Gross Margin |
33.8 |
31.1 |
8.9% |
|
|
Operating Expenses |
(8.9) |
(8.5) |
4.1% |
|
|
EBITDA |
25.0 |
22.5 |
10.7% |
|
|
Depreciation & Amortization |
(7.7) |
(6.4) |
20.2% |
|
|
EBIT |
17.2 |
16.1 |
6.8% |
|
|
Net Interest Income |
0.3 |
0.1 |
419.1% |
|
|
Profit Before Tax |
17.5 |
16.2 |
8.4% |
|
|
Income tax expense |
(6.0) |
(5.9) |
1.5% |
|
|
PAT |
11.6 |
10.2 |
13.1% |
|
|
Earnings Per Share (EPS) |
0.6 |
0.56 |
13.6 |
|
Source: KPC FY’2026 financial Report
|
Cytonn Report: Kenya Pipeline Company (KPC) FY'2026 Performance |
|
||
|
Balance Sheet |
FY'2026 Kshs (bn) |
FY'2025 Kshs (bn) |
% Change |
|
PPE |
94.4 |
91.4 |
3.2% |
|
Leasehold land |
21.3 |
23.2 |
(8.5%) |
|
Other non-Current Assets |
3.6 |
3.1 |
16.8% |
|
Current Assets |
30.0 |
22.9 |
31.2% |
|
Total Assets |
149.3 |
140.6 |
6.1% |
|
Borrowings |
0.4 |
2.7 |
(83.4%) |
|
Other non-current Liabilities |
23.4 |
20.5 |
14.2% |
|
Current liabilities |
6.1 |
9.6 |
(36.3%) |
|
Total Liabilities |
29.9 |
32.7 |
(8.5%) |
|
Shareholders’ Equity |
119.3 |
107.9 |
10.6% |
|
Total Equity and Liabilities |
149.3 |
140.6 |
2.1% |
Source: KPC FY’2026 financial Report
Key takeouts from the financial performance include:
-
Net Revenue increased by 8.9% to Kshs 33.8 bn from Kshs 31.1 bn in FY’2025, attributable to an 8.4% increase in Transport Revenue to Kshs 41.8 bn in FY’2026 from 38.6 bn in FY’ 2025.
-
Operating expenses rose by a 4.1% to Kshs 8.9 bn from Kshs 8.5 bn in FY’2025, while Direct costs increased by 8.5% to Kshs 9.2 bn in FY’2026 from Kshs 8.4 bn in FY’2025.
-
KPC’s balance sheet recorded an expansion with the assets increasing by 6.1% to Kshs 149.3 bn from Kshs 140.6 bn in 2025. This can be attributed to a 31.2% increase in current assets to Kshs 30.0 bn from Kshs 22.9 bn in 2025, coupled with a marginal 1.3% increase in non-current assets to Kshs 119.2 bn from Kshs 117.7 bn in 2025. The balance sheet was also supported by an 8.5% contraction in liabilities to Kshs 29.9 bn from Kshs 32.7 bn in FY’2025.
-
The Board of Directors recommended a first and final dividend per share of Kshs 0.32. This translates to a dividend yield of 6.6% and a dividend payout ratio of 50.9%.
Kenya Pipeline Company (KPC) aims to consolidate the gains from its privatization and transition into a listed public company by strengthening corporate governance, investor relations and shareholder value creation. The company plans to continue investing in the safety, capacity and resilience of its regional pipeline and storage infrastructure, pursue disciplined growth opportunities and maintain operational excellence. Its partnership with the Government of Kenya and diversified shareholder base are expected to support sustainable long-term growth.
We maintain a “cautiously optimistic” short-term outlook supported primarily earnings-led attractive
valuations, despite heightened geopolitical risks such as Iran war that may weigh on investor
sentiment, and, “neutral” in the long term as persistent foreign investor outflows continue to constrain
market liquidity and limit broad-based market re-rating. With the market currently trading at a
discount to its future growth (PEG Ratio at 0.9x), where performance will be driven by company-specific
fundamentals rather than general market direction, we believe that investors should reposition
towards value stocks exhibiting strong earnings growth, attractive dividend yields, solid balance
sheets, sustainable competitive advantages and trading at compelling discounts to their intrinsic value.
While foreign investor sell-offs are expected to continue exerting pressure in the near term, we believe
this will create selective entry opportunities for long-term investors
-
Industry reports
-
KNBS Q2’2026 GDP report
During the week, the Kenya National Bureau of Statistics (KNBS) released the Quarterly Gross Domestic Product Report for Q2'2026. Overall GDP grew by 5.1%, up from 4.9% in Q2'2025, despite higher global oil prices and the early end of the long rains. Below are the key take-outs for the Real Estate sector:
-
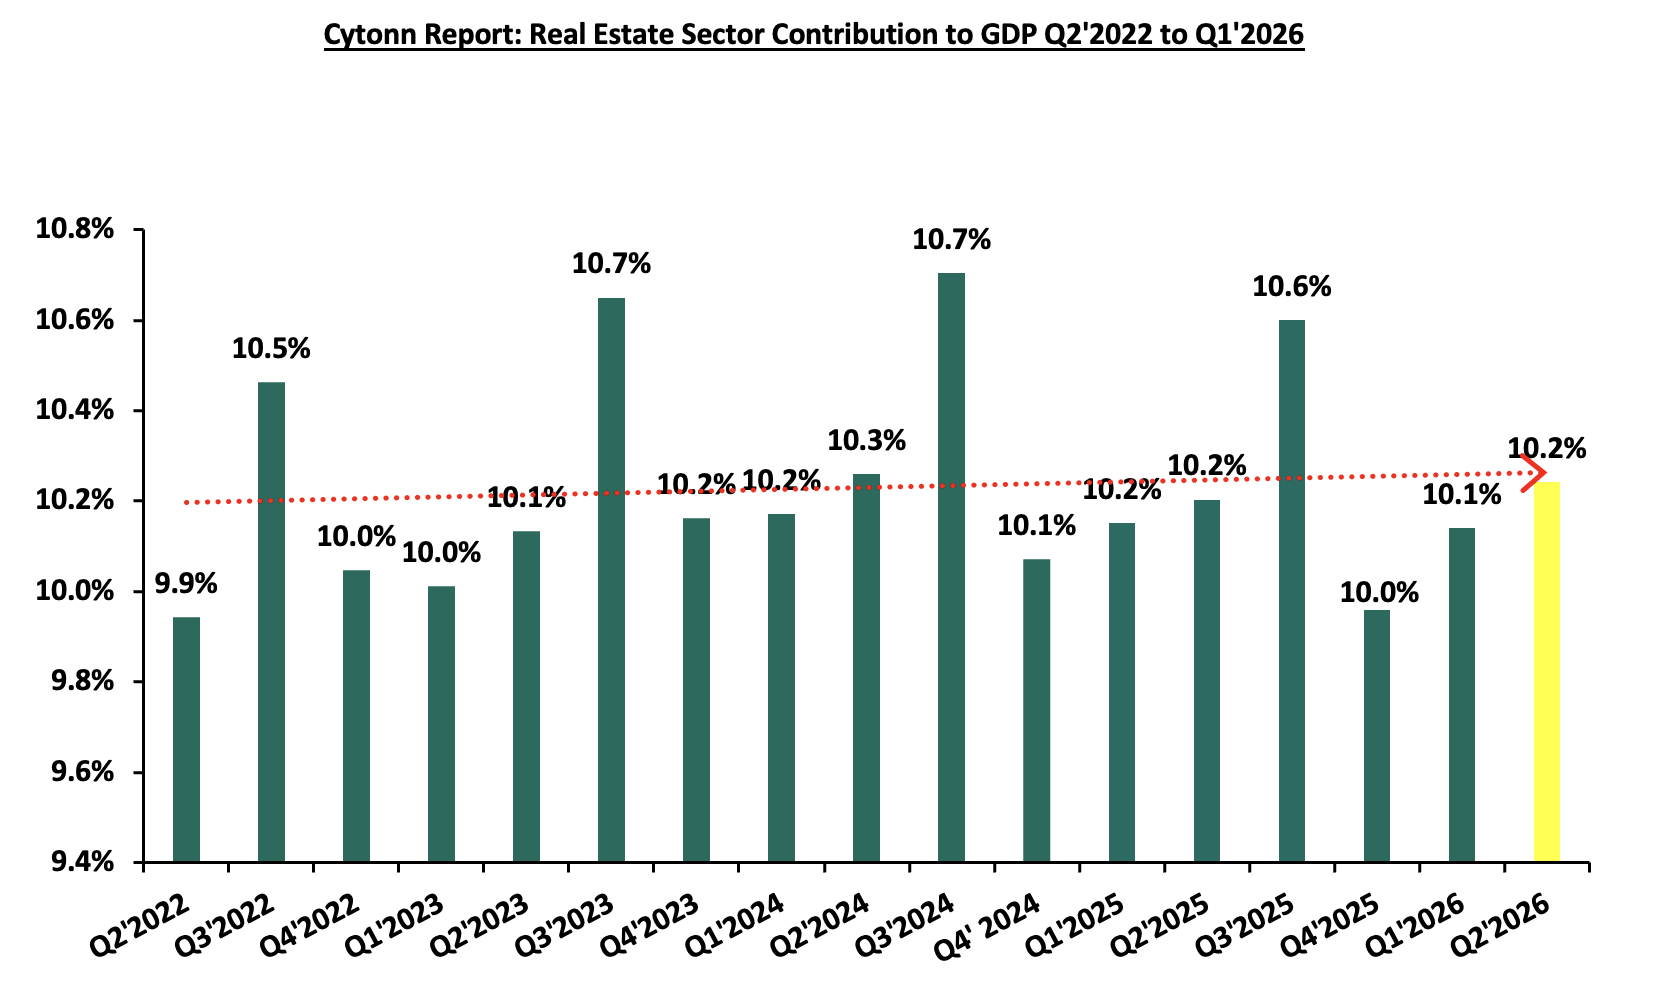
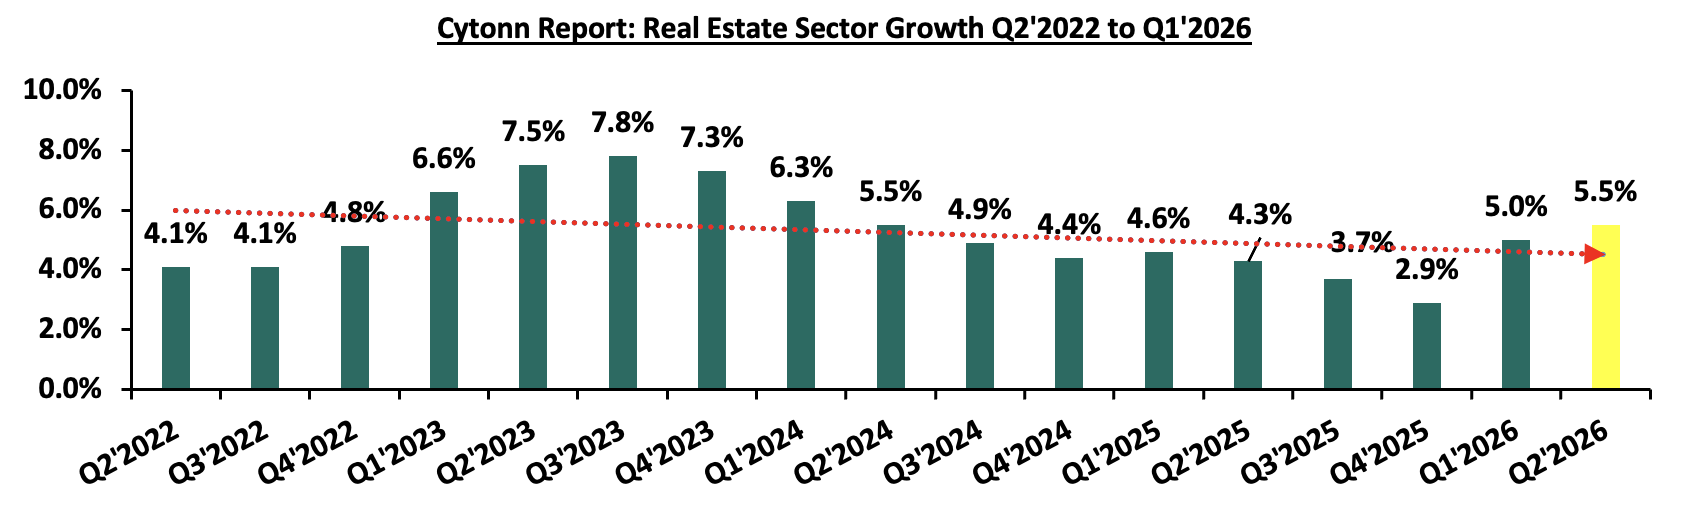
Accelerated growth in the Real Estate Sector - The Real Estate sector grew by 5.5% in Q2'2026, 1.2% points higher than the 4.3% growth in Q2'2025. On a quarter-on-quarter basis, growth accelerated by 0.5% points from the 5.0% recorded in Q1'2026, suggesting building momentum through the first half of the year. The sector’s contribution to GDP remained relatively stable at 10.2% in Q2'2026, as overall nominal GDP expanded faster than the sector. On a quarter-to-quarter basis, the contribution increased by 0.1% points from 10.1% in Q1'2026. The graph below shows the Real Estate sector contribution to GDP from Q2’2022 to Q2’2026. The graph below shows the Real Estate Sector growth rate from Q2’2022 to Q2’2026
Source: Kenya bureau of statistics (KNBS)
The graph below shows the Real Estate Sector growth rate from Q2’2022 to Q2’2026
Source: Kenya bureau of statistics (KNBS)
-
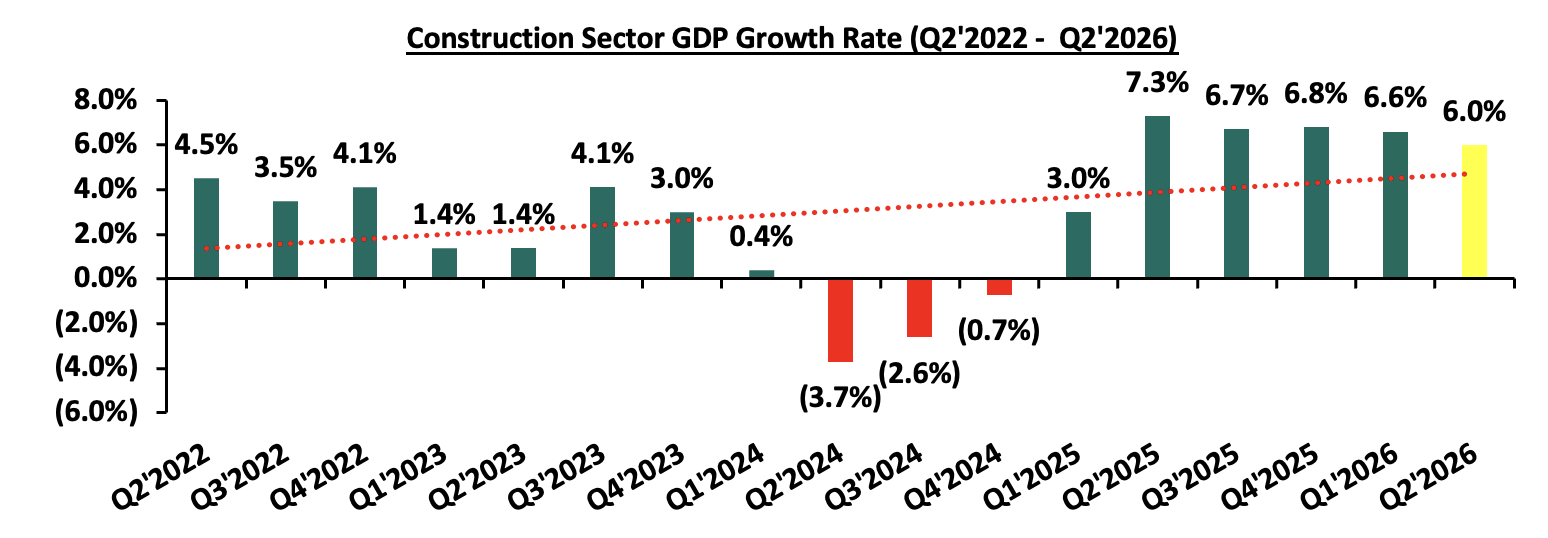
Moderated growth in the construction sector - The construction sector grew by 6.0% in Q2'2026, a 1.3%-point decrease from the 7.3% growth in Q2'2025. The slower pace partly reflects a strong comparison quarter, as Q2'2025 growth of 7.3% was well above the 4.5% recorded in Q1'2025. Higher input and operating costs may also have weighed on activity, with global crude oil prices rising to USD 104.5 per barrel from USD 67.4 a year earlier and retail diesel prices up 32.0% year-on-year to Kshs 217.8 per litre. On a quarter-on-quarter basis, growth was a 0.6%-point decrease from the 6.6% recorded in Q1'2026.The graph below shows the Construction sector growth rates from Q2’2022 to Q2’2026;
Source: Kenya bureau of statistics (KNBS)
-
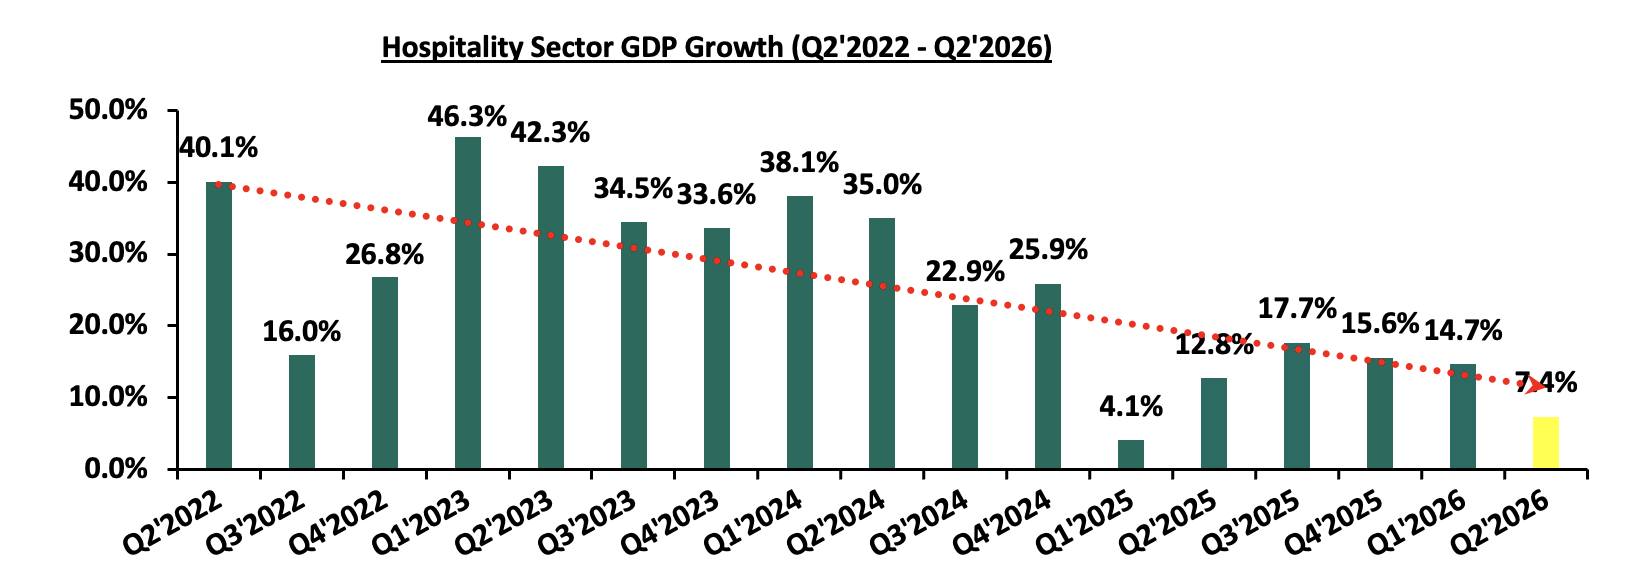
Slow growth in hospitality sector – The Accommodation and Food Services sector grew by 7.4% in Q2'2026, a 5.4%-point decline from the 12.8% growth in Q2'2025 and 7.3%-points lower than the 14.7% recorded in Q1'2026, though still above overall GDP growth of 5.1%. The slowdown can be attributed to weaker tourism inflows where total international passenger arrivals declined by 5.5%, with higher oil prices likely raising air travel costs and squeezed consumer spending and higher operating costs, as inflation rose to 6.2% from 3.9%, driven mainly by food and transport prices, and light diesel prices increased by 32.0%. The graph below shows the accommodation and restaurant sector contribution to GDP growth rates from Q2’2022 to Q2’2026;
Source: Kenya bureau of statistics (KNBS)
-
KNBS’ Q2’2026 Kenya Residential Property Price Index (RPPI) Report
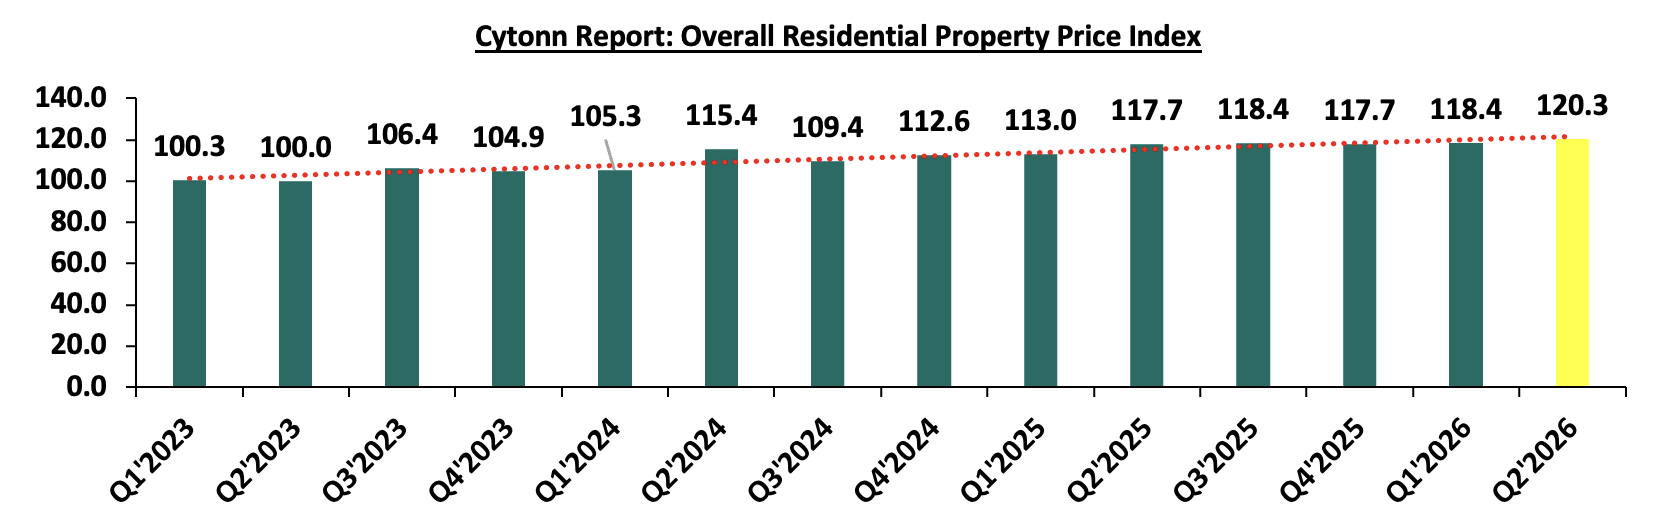
According to KNBS’ Q2'2026 Kenya Residential Property Price Index (RPPI), the overall RPPI increased by 2.2% to 120.3 in Q2'2026 from 117.7 in Q2'2025. On a quarter-on-quarter basis, the index increased by 1.6% from 118.4 in Q1'2026.
Source: Kenya bureau of statistics (KNBS)
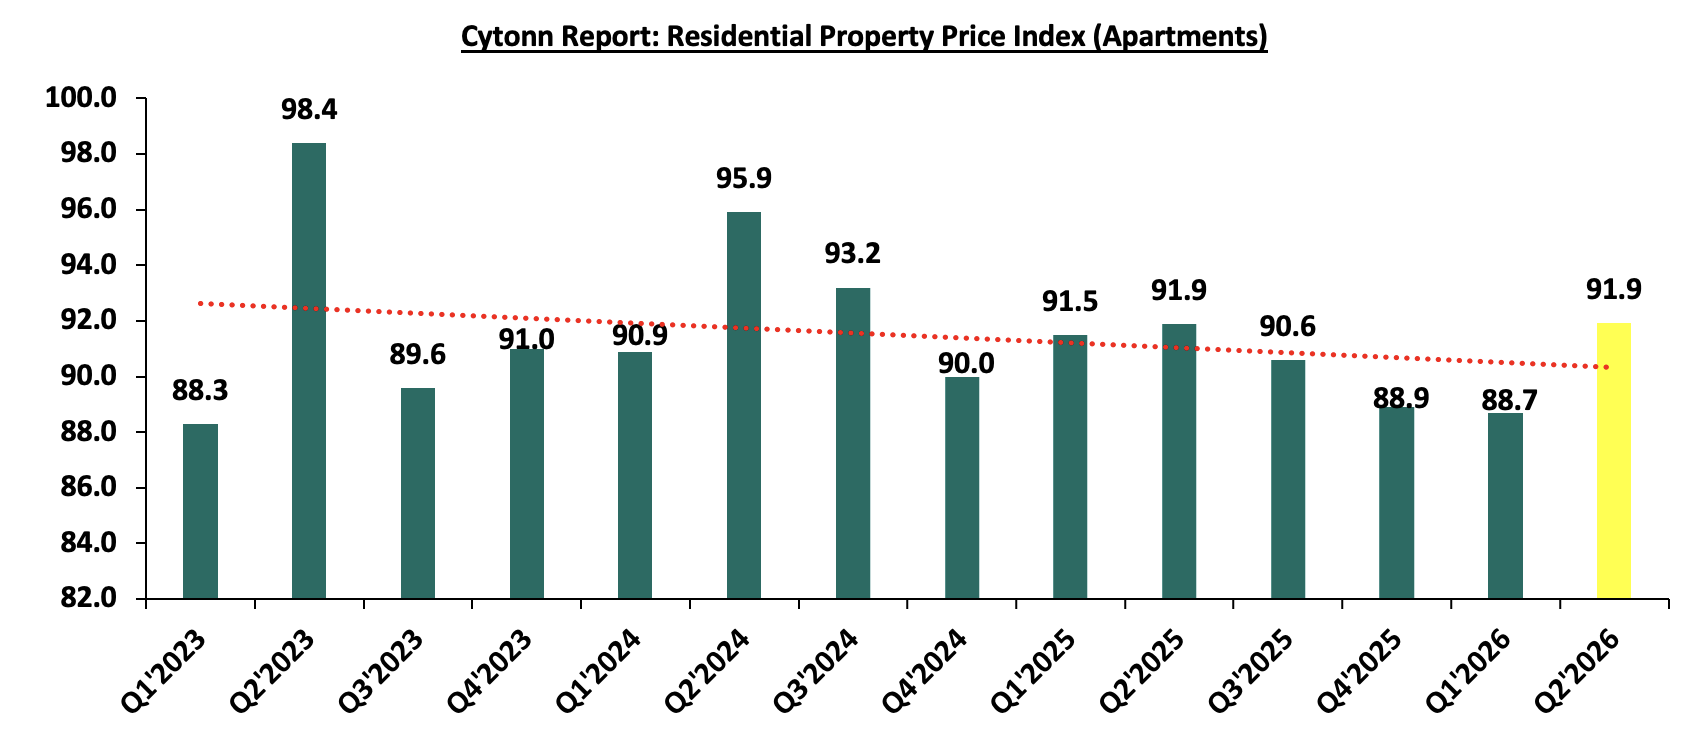
The Residential Property Price Index for apartments increased marginally by 0.1% to remain relatively unchanged at 919 as recorded in Q2’2025. On a quarter-on-quarter basis, the index rose by 3.6% to 91.9 in Q2'2026 from 88.7 in Q1'2026. This is the first positive annual reading for the segment since Q1'2025, ending a run of four consecutive annual declines. However, the recovery was uneven, with apartments in Nairobi Upper rising by 4.8% to 96.9 from 92.5 in Q2'2025, and Nairobi Other (including peri-urban areas) rising by 9.5% to 119.4 from 109.0. Nairobi Middle declined by 1.1% to 86.4 from 87.4, while Other Regions fell by 8.1% to 111.6 from 121.4. On a quarter-on-quarter basis, all four strata recorded gains, with Nairobi Upper rising to 96.9 from 90.1, Nairobi Middle to 86.4 from 85.3, Nairobi Other to 119.4 from 107.5, and Other Regions to 111.6 from 106.9. The segment therefore looks like it is stabilising from a low base rather than entering a clear recovery
Source: Kenya bureau of statistics (KNBS)
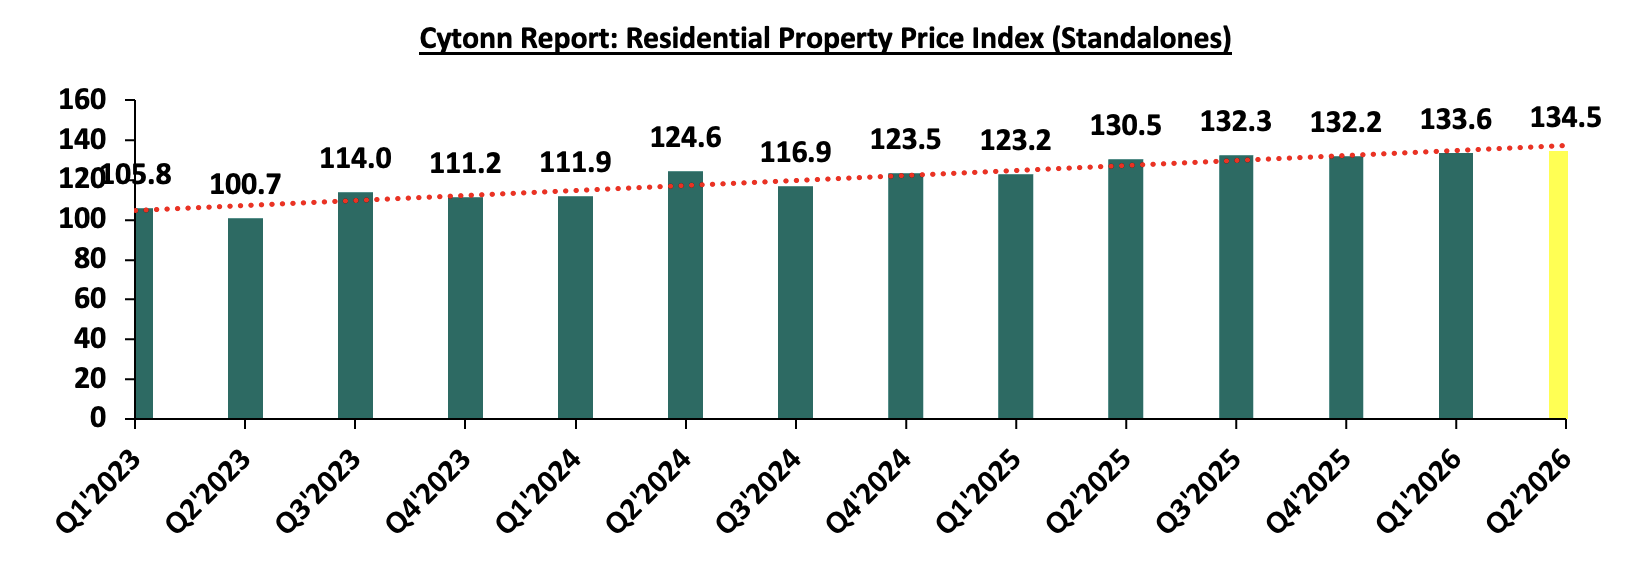
The Residential Property Price Index for standalone houses increased by 3.1% to 134.5 in Q2'2026 from 130.5 in Q2'2025. On a quarter-on-quarter basis, the index increased by 0.7% to 134.5 in Q2'2026 from 133.6 in Q1'2026. Annual growth slowed to 3.1% in Q2'2026 from 8.5% in Q1'2026, driven by Nairobi Middle and Other Regions. Nairobi Middle fell by 0.3% to 125.2 in Q2'2026 from 125.6 in Q2'2025, after rising 20.4% to 142.4 in Q1'2026 from 118.3 in Q1'2025. Other Regions fell by 16.0% to 79.7 in Q2'2026 from 94.9 in Q2'2025, after rising 12.5% to 78.5 in Q1'2026 from 69.8 in Q1'2025. Nairobi Other offset part of the slowdown, rising by 13.6% to 164.9 in Q2'2026 from 145.2 in Q2'2025. Unlike Q1'2026, when all strata appreciated, price gains are now confined to Nairobi’s upper and peri-urban markets.
Source: Kenya bureau of statistics (KNBS)
The Q2'2026 data points to a narrowing gap between the two segments. Houses still lead on annual growth but momentum has cooled while apartments have improved from a weak base. The overall picture is moderate, concentrated price growth rather than broad-based strength. Going forward, we expect standalone houses in Nairobi’s upper and peri-urban markets to remain the main driver of price growth, while the apartment segment recovers gradually and unevenly. Whether Q2’s apartment rebound holds will depend on supply absorption and financing conditions. The volatility in the middle-income and regional strata also suggests thin transaction data, so single-quarter moves there should be treated with caution.
-
Infrastructure Sector
-
CRBC awarded a Kshs 3.2 bn contract to upgrade the seven-kilometer Old Mombasa Road linking the Nairobi ICD to Syokimau
During the week, China Road and Bridge Corporation (CRBC) was awarded a Kshs 3.2 bn contract to upgrade the seven-kilometer Old Mombasa Road linking the Nairobi Inland Container Depot (ICD) to Syokimau, with construction expected to begin on 1st September, 2026 and complete by 28th April, 2029. The works to be undertaken under the contract include pavement construction, drainage and protection works, road furniture, identification and relocation of services and maintenance of traffic passage during construction. Additional works include relocating utilities, demolishing existing obstructions, maintaining traffic during construction, construction of two kilometers of temporary gravel diversions, installation of 259 double arm LED streetlights on 10-metre poles, and 20 single arm traffic lights on eight-metre poles, alongside electrical works covering substations, distribution boxes, and power cables.
The contract cements CRBC’s growing presence in Kenya’s infrastructure sector, with the firm having previously delivered the Standard Gauge Railway (SGR), the 27.1-kilometre Nairobi Expressway from Mlolongo to Westlands via JKIA at a cost of Kshs 88.8 bn, the Eastern, Southern, and Northern bypasses in Nairobi between 2012 and 2022, and the Kshs 18.0 bn Southern Bypass and Kshs 9.3 bn Eastern Bypass. CRBC is also currently completing the Kshs 46.0 bn Talanta Stadium, financed through an infrastructure bond issued by a special purpose vehicle known as Linzi Finco, and is one of the contractors undertaking the Nairobi–Nakuru–Mau Summit Highway under a public-private partnership arrangement.
Going forward, the upgrade of Old Mombasa Road is expected to improve connectivity between the Nairobi ICD and surrounding logistics zones, enhancing the efficiency of cargo movement and reducing congestion along one of Nairobi’s key freight corridors. For the Industrial and Logistics Real Estate segment, improved road infrastructure linking the ICD to Syokimau is likely to support demand for warehousing, logistics facilities, and light industrial space along the corridor, as reduced transit times and improved road reliability make the area more attractive to logistics operators. More broadly, CRBC’s continued dominance in Kenya’s infrastructure pipeline underscores the Government’s deepening reliance on Chinese state-owned contractors for large-scale road, rail, and institutional infrastructure delivery.
-
National treasury approves initial pitch to convert 243-kilometre Athi River–Namanga A2 corridor into a toll dual carriageway under ppp model
During the week, the National Treasury approved the initial pitch to convert the 243-kilometre Athi River–Namanga road, commonly known as the A2 corridor, into a dual carriageway, with the PPP Directorate confirming that the project concept note received first approval in September 2026. The A2 corridor extends from Athi River through Kitengela, Isinya, and Kajiado to the Namanga border town, serving as a strategic transport artery linking Nairobi with northern Tanzania and forming part of the Cairo–Cape Town Trans-African Highway, while also providing access to rapidly growing peri-urban settlements, the Konza Technopolis, and key economic centers in Machakos and Kajiado counties.
The planned project comprises upgrading the existing road into a four-lane, access-controlled tolled highway, expanding capacity from two lanes to four lanes, with the strategic transport route forming part of the Nairobi–Mombasa Corridor connecting western Kenya and Uganda. A pre-feasibility assessment of the planned Mau Summit–Malaba dual highway also confirmed that the proposed toll road can be developed within the existing corridor. The project is expected to increase road capacity and traffic flow, enhance road safety, support the growth of the Nairobi Metropolitan Region and Konza Technopolis, facilitate cross-border trade with Tanzania, and provide an alternative route to the Nairobi–Mombasa Highway (A8). The planned 243-kilometre Mau Summit–Malaba dual carriageway has also passed an initial viability test, with a more detailed feasibility study expected to evaluate financial viability, traffic projections, tolling potential, and structure under the PPP model, with the project financed through a Kshs 170.0 bn investment.
Going forward, the approval of the Athi River–Namanga dual carriageway pitch is expected to have significant implications for real estate development along the A2 corridor, particularly in the rapidly growing peri-urban nodes of Kitengela, Isinya, and Kajiado. Improved road infrastructure is likely to accelerate residential and mixed-use development demand in these areas as reduced commute times and enhanced connectivity make them increasingly attractive to middle-income households seeking affordable alternatives to Nairobi’s urban core. For the Industrial and Logistics Real Estate segment, the upgrade of a key cross-border trade route is expected to drive demand for logistics and warehousing facilities along the corridor, while the Konza Technopolis stands to benefit from improved accessibility supporting commercial and institutional development within the special economic zone.
-
NLC initiates compulsory acquisition of 59 land parcels in Nyamira county to advance sgr extension
During the week, the National Land Commission (NLC) initiated compulsory land acquisition proceedings targeting 59 land parcels within North Mugirango Constituency in Nyamira County, as part of the Naivasha–Kisumu–Malaba Standard Gauge Railway (SGR) Phase 2B and 2C extension project. The gazette notice, executed under Section 110 of the Land Act, 2012, forms a critical statutory step toward establishing the primary rail corridor, with affected landholders and stakeholders directed to inspect project survey plans at Ardhi House in Nairobi and at the Nyamira County Coordinator’s office, ahead of formal inquiry notices detailing compensation valuations and boundary claims. Kenya Railways Corporation (KRC) has set aside Kshs 25.0 bn, equivalent to approximately USD 192.0 mn, specifically designated for land compensation across all affected counties along the route, with initial civil works including bulk earthworks and excavation already progressing across selected stretches in Narok and neighboring counties.
Once operational, the expanded SGR network is projected to have the capacity to haul up to 22.0 mn tonnes of cargo annually, significantly alleviating freight pressure along the Northern Corridor road network and reducing transit costs between the port of Mombasa and inland trade hubs. Key corridor segments are projected to be delivered by mid-2027 to allow preliminary rail operations, with total project completion anticipated by 2028. The final rail alignment will feature major intermediate stations across Narok, Bomet, Kericho, Nyamira, Homa Bay, and Kisumu counties, directly linking regional commercial centers to the national trunk railway infrastructure.
Going forward, the progression of land acquisition along the SGR Phase 2B and 2C corridor is expected to have meaningful implications for real estate development and land values in the counties along the route. For the Industrial and Logistics Real Estate segment, the anticipated increase in freight handling capacity to 22.0 mn tonnes annually is expected to stimulate demand for warehousing and logistics facilities at key station nodes, particularly in Kisumu, which stands to become a major inland freight hub serving western Kenya and the broader East African region. For the Residential and Commercial Real Estate segments, improved rail connectivity linking Narok, Bomet, Kericho, Nyamira, and Homa Bay to Nairobi and Mombasa is likely to enhance the attractiveness of these counties as investment destinations, supporting demand for mixed-use and commercial developments around planned station areas.
-
Land sector
-
Nairobi County Introduces Fresh Land Rates Exemption Application Procedure
During the week, the Nairobi City County Cabinet approved a fresh application procedure for land rates exemptions, ordering all property owners to reapply for exemptions before the 1st January 2027 billing cycle under the criteria established by the National Rating Act, 2024, which came into effect on 24th December, 2024. The County Lands sub-sector will verify each exemption claim through site inspections, update property records, and ensure compliance ahead of the new billing cycle, with applications to be submitted to the County Executive Committee Member responsible for Lands at City Hall. Under the new framework, exemptions apply only to land used for public religious worship, cemeteries, crematoria, public health facilities, public schools, libraries, museums, outdoor sports grounds, dams, wayleaves, national monuments, freehold agricultural land, and land dedicated exclusively to public purposes such as roads, utilities, and parks.
Notably, private hospitals, clinics, schools, colleges, universities, sports clubs, charitable institutions and student hostels that previously enjoyed blanket exemptions under the repealed legislation may now be liable for land rates. Landlords leasing property to foreign embassies or diplomatic missions will also be liable for rates where properties remain registered in their names, representing a significant policy shift from the prior exemption regime. The move reflects the County Government’s broader effort to widen its rates revenue base and ensure that exemptions are aligned with the public-benefit criteria defined under the new national legislation.
Going forward, the reclassification of previously exempt property categories under the National Rating Act, 2024 is expected to have meaningful implications for real estate owners and investors across Nairobi, particularly those holding properties used for private education, healthcare, hospitality, and institutional purposes. For property owners in the affected categories, the loss of exemption status will increase the cost of land ownership, potentially being passed on to tenants through higher lease rates, which could in turn affect occupancy levels and investment returns in segments such as private schools, student hostels, and medical facilities. For the broader Real Estate sector, the tightening of exemption criteria signals an increasingly assertive approach by the County Government to optimize land-based revenues, a trend that investors and developers will need to factor into their cost modeling for new and existing assets within Nairobi.
b. Kenya’s land market records first annual decline in title deed issuance in five years
During the week, the National Treasury published the Agriculture, Rural and Urban Development (ARUD) Sector Report for the 2027/28–2029/30 MTEF period, which highlighted that title deeds issued fell by 35.3% to 282,392 in the year to June 2026, from 436,212 in the prior financial year. This was the first annual decline in five years. According to the budgetary report the underachievement against the planned target of 420,000 title deeds was attributed to low land transactions, signaling a broader slowdown in property market activity as bank lending to the sector contracted and house prices came under pressure. The decline left a shortfall of 137,608 title deeds against the government’s plan to process 420,000 documents, with the State achieving only 67.2% of its goal. The Lands Department had issued 422,313 titles in the year to June 2024 and 436,212 in FY 2024/25, the highest annual tally in decades, making the FY 2025/26 contraction a notable reversal.
Central Bank of Kenya (CBK) data shows that net domestic credit to real estate fell by Kshs 6.1 bn to Kshs 445.9 bn in the year to June 2026, from Kshs 452.0 bn a year earlier, with the 1.4% contraction in net lending coinciding with the slump in title issuance and providing another indicator of weakening momentum in the property market. Real estate credit covers financing for construction companies, builders, and developers to acquire land and build residential estates, commercial complexes, and industrial parks, as well as household loans to purchase homes or land and borrowing secured against existing property. Growth in real estate credit had slowed considerably before turning negative in the latest financial year, having risen 32.4% to Kshs 414.0 bn in June 2022, moderating to Kshs 429.2 bn in June 2023 and Kshs 444.7 bn in June 2024, before slipping to Kshs 452.0 bn in June 2025 and contracting to Kshs 445.9 bn in June 2026. Hass Consult’s quarterly property index reported that land prices in Nairobi’s satellite towns grew by a marginal 1.4% in the first two quarters of 2026, marking a slowdown in a market that had largely recorded nearly double-digit annual price growth for two decades, with satellite towns including Kiambu, Kitengela, Ngong, Limuru, Athi River, Syokimau, and Tigoni facing growing price pressure from tighter economic conditions and rising household costs.
Going forward, the contraction in title deed issuance and net real estate credit is expected to signal a period of moderated activity in Kenya’s property market, particularly in the land transaction and development finance segments. For the Residential Real Estate sector, reduced access to credit and softening land prices in satellite towns may constrain new housing supply, particularly for middle-income developments that rely on bank financing for land acquisition and construction. For the broader Real Estate sector, the slowdown in title issuance may reduce transaction velocity and dampen short-term investment appetite, though the Government’s ongoing affordable housing programme and infrastructure investments are expected to provide a partial offset by sustaining demand for land along key growth corridors.
-
Real Estate Investment Trusts (REITs)
On the Unquoted Securities Platform Acorn D-REIT and I-REIT traded at Kshs 29.7 and Kshs 24.4 per unit, respectively, as per the last updated data on 16th October 2026. The performance represented a 48.3% and 22.2% gain for the D-REIT and I-REIT, respectively, from the Kshs 20.0 inception price. The volumes traded for the D-REIT and I-REIT came in at 13.7 mn and 46.0 mn shares, respectively. Additionally, ILAM Fahari I-REIT traded at Kshs 13.8 per share as of 16th October 2026, representing a 31.0% loss from the Kshs 20.0 inception price. The volume traded came in at 1.2 mn shares. REITs offer various benefits, such as tax exemptions, diversified portfolios, and stable long-term profits. However, the ongoing decline in the performance of Kenyan REITs and the restructuring of their business portfolios are hindering significant previous investments. Additional general challenges include:
-
Insufficient understanding of the investment instrument among investors leading to a slower uptake of REIT products,
-
Lengthy approval processes for REIT creation,
-
High minimum capital requirements of Kshs 100.0 mn for REIT trustees compared to Kshs 10.0 mn for pension funds Trustees, essentially limiting the licensed REIT Trustee to banks only,
-
The rigidity of choice between either a D-REIT or I-REIT forces managers to form two REITs, rather than having one Hybrid REIT that can allocate between development and income earning properties
-
Limiting the type of legal entity that can form a REIT to only a trust company, as opposed to allowing other entities such as partnerships, and companies,
-
We need to give time before REITs are required to list – they would be allowed to stay private for a few years before the requirement to list given that not all companies may be comfortable with listing on day one, and,
-
Minimum subscription amounts or offer parcels set at Kshs 0.1 mn for D-REITs and Kshs 5.0 mn for restricted I-REITs. The significant capital requirements still make REITs relatively inaccessible to smaller retail investors compared to other investment vehicles like unit trusts or government bonds, all of which continue to limit the performance of Kenyan REITs.
We expect the performance of Kenya’s Real Estate sector to remain resilient, supported by several factors: i) the Real Estate sector recording improved growth, growing by 5.5% in Q2'2026 from 4.3% in Q2'2025 while construction sector grew by 6.0% in Q2'2026, which was 1.3% points decrease as compared to 7.3% in Q2'2025 , ii) the overall RPPI rising 2.2% to 120.3 in Q2'2026 from 117.7 in Q2'2025, and iii) ongoing infrastructure development, including CRBC’s Kshs 3.2 bn Old Mombasa Road upgrade, the Athi River–Namanga A2 dual carriageway PPP pitch and the SGR Phase 2B and 2C extension. However, challenges such as the weak investor appetite in listed REITs like ILAM Fahari I-REIT, the first annual decline in title deed issuance in five years and the higher land rates exposure in Nairobi will continue to constrain the sector’s optimal performance.
-
Visa Direct Launches Stablecoin-Powered Money Movement as Pilots Move to Production
During the week, Visa announced that its Visa Direct stablecoin enabled prefunding capability had moved from pilot testing into commercial production, with Inyo Global becoming the first payments infrastructure provider to deploy the service for eligible clients and partners. The integration allows money transmitters, fintechs, banks and payment businesses using Inyo’s platform to prefund cross border payouts with USD Coin (USDC) in near real time, rather than relying exclusively on traditional funding windows. Through a single integration, Inyo supports user onboarding, fraud and compliance management and domestic and international payouts across more than 180 countries, with the new capability building on Visa Direct’s stablecoin prefunding and payout pilots launched in 2025. Around-the-clock stablecoin prefunding could expand Visa Direct’s addressable market among fintechs and remittance operators that require faster, more flexible liquidity management, supporting incremental transaction volumes and reinforcing Visa’s role in cross border money movement. However, the financial upside will depend on adoption rates, transaction economics, stablecoin regulation and the extent to which improved funding efficiency translates into higher revenues rather than lower costs alone.
-
Mastercard and BVNK launch Global Money Platform to power a multi-money world
During the week, Mastercard launched its Global Money Platform with BVNK, integrating traditional fiat payments and stablecoin infrastructure through a single API following Mastercard’s acquisition of BVNK in August 2026. The platform enables banks, fintechs and enterprises to embed multi-currency accounts, real-time currency conversion, stablecoin linked cards and local bank payouts through Mastercard Move, which reaches more than 17 billion endpoints, with coverage expected to expand to over 40 currencies across 200 plus countries and territories in 2027. Initial adopters include Nuvei, Marqeta, Ontop, Bolt Group and Almond FinTech. The platform strengthens Mastercard’s competitive position by consolidating fiat and stablecoin services into one infrastructure layer, potentially reducing integration costs, improving liquidity management and expanding cross border transaction volumes; however, revenue growth will depend on adoption, transaction economics and regulatory clarity around stablecoins and tokenized deposits.
-
American Express Publishes Intent Intelligence Framework for Trusted Agentic Commerce
During the week, American Express published its Intent Intelligence framework through its Agentic Commerce Experiences (ACE) Developer Kit, outlining an approach to capturing, authenticating and preserving customer purchase intent before an artificial intelligence (AI) agent executes a transaction. The framework uses a Create Intent API to record customer instructions, including merchant preferences, spending limits and other purchase conditions, which customers authenticate before the system generates a unique Intent ID and Proof of Intent Token. By publishing the framework, Amex is positioning itself to influence the emerging infrastructure for AI driven commerce, with standardized intent verification potentially strengthening issuer control, reducing fraud related losses and lowering dispute management costs as autonomous purchasing scales. However, the commercial impact remains dependent on merchant and developer adoption, interoperability across competing platforms and the pace at which agentic commerce achieves mainstream usage.
-
Digital Payments Stock Performance
The table below presents a snapshot of NYSE-listed digital payments stocks, covering Visa, Mastercard, American Express (AXP), Wise Plc, Block and PayPal:
|
Cytonn Report: Digital Payments NYSE and LSE stock performance |
||||||
|
Company |
Year Open 2026 |
Price 09/10/2026 |
Price 16/10/2026 |
w/w change |
YTD change |
Forward P/E |
|
American Express |
372.7 |
308.2 |
313.6 |
1.8% |
(15.9%) |
15.6x |
|
Visa |
346.5 |
385.5 |
402.6 |
4.5% |
16.2% |
26.8x |
|
Mastercard |
563.1 |
589.1 |
617.4 |
4.8% |
9.6% |
26.8x |
|
Circle |
83.5 |
84.5 |
82.2 |
(2.7%) |
(1.5%) |
57.5x |
|
Block |
65.2 |
77.2 |
77.9 |
0.8% |
19.6% |
15.0x |
|
Paypal Holdings |
58.1 |
55.5 |
56.7 |
2.1% |
(2.5%) |
9.8x |
|
Global Payments Inc |
77.0 |
82.2 |
83.7 |
1.8% |
8.6% |
27.8x |
|
Average |
|
|
|
|
|
25.6x |
Source: Visa, AXP, Circle, Global Payments, Mastercard, Block and PayPal financials, NYSE, PE* calculated using forward estimates FY’2027 audited financials
The stocks are currently trading at an average forward P/E multiple of 25.6x, indicating that investors are pricing in strong future earnings growth and are prepared to pay a substantial premium for current earnings. This also suggests that valuations may be stretched relative to near-term fundamentals.
We expect the global digital payments sector to continue shifting toward greater payment sovereignty and reduced reliance on traditional card-based networks, as governments and financial institutions prioritize control over domestic payment ecosystems. The European Central Bank's progress toward launching the Digital Euro signals a growing move toward central bank-backed payment infrastructure, which is likely to intensify competition with established private networks such as Visa Inc. and Mastercard Incorporated. However, despite these favorable long-term tailwinds, valuations remain elevated, with the companies under coverage trading at an average forward P/E of 25.6x, suggesting that much of the expected growth may already be priced in. As such, we expect near-term performance to remain sensitive to regulatory developments, execution risk, and how quickly incumbents and new entrants adapt to the changing payments landscape.
In pursuit of a stable and sustainable economic future, the Kenyan government prioritizes balancing its economic policies, especially regarding the Balance of Payments. Achieving this balance is essential to ensuring stable trade relations, managing capital inflows and outflows, addressing inflationary pressures, and maintaining a favourable exchange rate system. These efforts are geared towards fostering economic growth, creating employment opportunities, and implementing strategic commercial policies, all of which play pivotal roles in Kenya's pursuit of a robust and sustainable economic trajectory. In light of this, we saw it fit to focus on Kenya’s balance of payments to analyse the current state and what can be done to improve it.
We have previously tacked the subject of balance of payments in our topical titled Kenya’s Balance of Payments - released in October 2025, we explored the country's balance of payments, which reflects its economic transactions with other nations. We examined the key components, including the current account and the capital account, and assessed Kenya's performance. Additionally, we analyzed the factors influencing the balance of payments and provided policy recommendations for addressing the situation.
This week, we will review Kenya’s current balance of payment by covering the following:
-
Overview of the Balance of Payments,
-
The Current State of Kenya’s Balance of Payments,
-
Evolution of Kenya’s Balance of Payments,
-
Performance Measurements of Kenya’s Balance of Payments,
-
Factors Affecting Kenya’s Balance of Payments, and,
-
Policy Recommendations and Conclusion.
Section I: Overview of the Balance of Payments
The balance of payments (BOP) is the method by which countries measure all of the international monetary transactions within a certain period. It is a crucial financial record that captures the economic interactions between Kenya and the rest of the world during a specified timeframe. It provides a systematic account of how the country engages with the global economy, encompassing a wide range of economic activities including trade of goods and services, financial investments, and various transfer payments like foreign aid and grants from other nations. The Balance of Payments (BOP) holds significant importance as a key economic metric, offering a concise representation of the movement of resources between a nation and its trade partners. This financial record categorizes transactions into three primary accounts: The Current Account, the Capital Account, and the Financial Account;
-
Current Account
The Current Account is one of the primary components of the BoP and tracks transactions related to the day-to-day economic activities of a country with other countries. The component captures transactions of exports and imports of goods and services, income receipts, and payments. It includes four main sub-accounts;
-
Balance of Trade (Trade Balance) - This sub-account records the value of Kenya's exports of goods (like tea, coffee, and flowers) and imports of goods (machinery, petroleum, etc.). If Kenya’s exports are more than its imports, it has a trade surplus in this category, otherwise, it has a trade deficit,
-
Services Trade - The services trade accounts for the export and import of services such as tourism, transportation, and financial services. Kenya's income from foreign tourists and revenue from providing services to other nations contribute to the services subsection of the current account,
-
Income - In this sub-account, Kenya records income flows from its foreign investments (like profits and dividends from foreign-owned assets in Kenya) and income paid to foreign investors holding assets in Kenya, and,
-
Current Transfers - This sub-account captures unilateral transfers of funds, including foreign aid, remittances from Kenyan expatriates working abroad, and other gifts or grants from foreign sources.
-
Capital Account
The Capital Account in the BoP records capital transfers and transactions involving non-produced, non-financial assets. It may include items like the transfer of ownership of patents, copyrights, and trademarks;
-
Capital transfers – They represent transactions involving the transfer of ownership of non-financial assets between a country and other countries which do not result in any corresponding goods, services, or financial claims, and,
-
Acquisition/disposal of non-produced, non-financial assets – These are transactions involving the transfer of ownership rights to assets that are neither produced nor considered financial assets, that is, intangible assets such as brand names and trademarks, and rights to use land resources for various economic activities.
-
Financial Account
The Financial Account is a crucial component that records financial transactions between Kenya and other countries. It includes;
-
Foreign Direct Investment (FDI) - This sub-account tracks the flow of investments where foreign entities directly invest in Kenyan businesses or assets. For example, foreign companies setting up operations in Kenya,
-
Portfolio Investment - Portfolio investment includes transactions involving financial assets like stocks and bonds. It reflects foreign investors' purchases of Kenyan securities and Kenyan investors' purchases of foreign securities,
-
Reserves Assets - The official reserves sub-account accounts for changes in Kenya's foreign exchange reserves held by the central bank. This can result from currency interventions or other actions affecting reserves, and,
-
Other reserves - This covers various financial transactions such as loans, currency, deposits, and trade credits between Kenya and foreign countries.
Other components under financial account include Financial Derivatives and Other Changes in Financial Assets and Liabilities.
Section II: The Current State of Kenya’s Balance of Payments
In this section, we will analyse the individual components of Kenya’s balance of payments.
-
Current Account Balance
Kenya’s current account deficit widened by 72.7% to Kshs 120.9 bn in Q1’2026 from the Kshs 70.0 bn deficit recorded in Q1’2025. The y/y expansion of the deficit registered was driven by;
-
The widening of the merchandise trade account deficit (the value of import goods exceeds the value of export goods, resulting in a negative net foreign investment) by 19.4% to Kshs 352.3 bn in Q1’2026, from Kshs 295.0 bn recorded in Q1’2025, driven by the 6.2% decline in merchandise exports to Kshs 385.6 bn, from Kshs 411.2 bn in Q1’2025, compared to the 4.5% increase in merchandise imports to Kshs 737.8 bn from Kshs 706.2 bn recorded in a similar period in 2025, and,
-
A 26.7% decline in the services trade balance (the difference between the imports and exports of services) to a surplus of Kshs 56.2 bn from a surplus of Kshs 76.7 bn in Q1’2025, driven by a 16.0% increase in services receipts to Kshs 291.2 bn from Kshs 251.0 bn recorded in Q1’2025, which was outpaced by the 34.8% increase in services outflows to Kshs 235.0 bn from Kshs 174.3 bn recorded in Q1’2025.
The table below shows the breakdown of the various current account components on a year-on-year basis, comparing Q1’2026 and Q1’2025:
|
Cytonn Report: Q1’2026 Current Account Balance |
|||
|
Item |
Q1'2025 |
Q1’2026 |
Y/Y % Change |
|
Merchandise Trade Balance |
(295.0) |
(352.3) |
19.4% |
|
Service Trade Balance |
76.7 |
56.2 |
(26.7%) |
|
Primary Income Balance |
(82.7) |
(66.7) |
(19.3%) |
|
Secondary Income (Transfers) Balance |
230.9 |
241.8 |
4.7% |
|
Current Account Balance |
(70.0) |
(120.9) |
72.7% |
Source: Kenya National Bureau of Statistics (KNBS), All values in Kshs bn
We observe that, over the last ten years, Kenya’s current account balance has been running deficits, implying that the country relies more on the outside world for its goods and services. The current account deficit as a percentage of GDP was at 2.1% in 2025. The current account deficit is projected to widen to 3.2% of GDP in 2026 mainly due to higher mineral fuel import costs resulting from elevated international oil prices and declining diaspora remittance inflows. The chart below shows the current account deficit over the last 10 years;
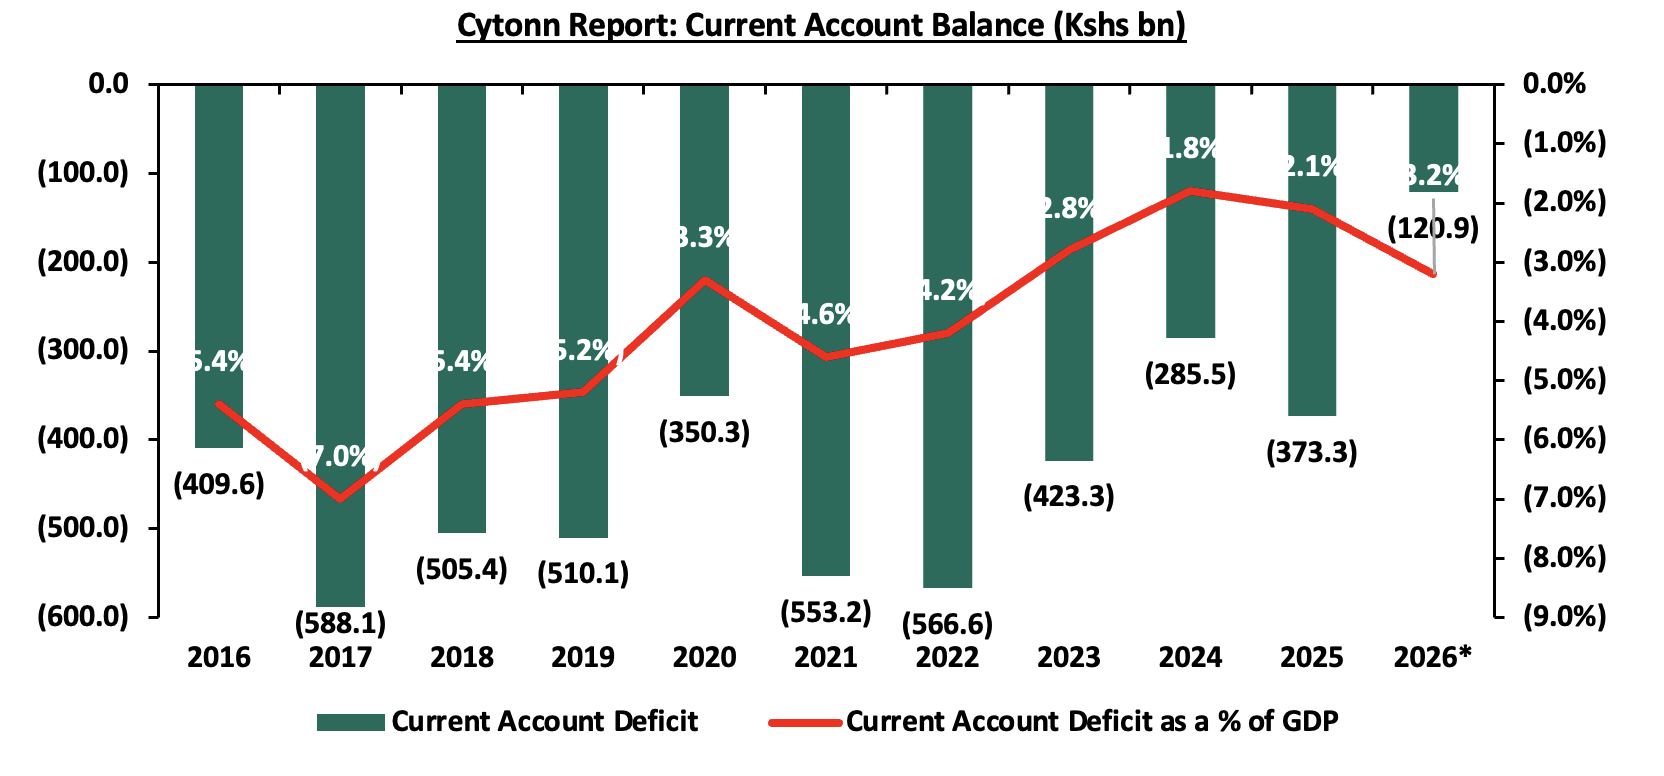
Source: KNBS Data *projected for 2026
-
Financial Account and Capital Account
The financial account balance represents the difference between domestic buyers' purchases of foreign assets and foreign buyers' acquisitions of domestic assets. A surplus contributes positively to the balance of payments, while a deficit subtracts from it. This balance reflects the claims or obligations related to financial assets involving non-residents, where an increase in domestic ownership of foreign assets is an outflow and decreases the financial account of the country, while an increase in foreign ownership of domestic assets is an inflow and increases the financial account. The financial account balance recorded a deficit of Kshs 243.5 bn in Q1’2026, a significant increase of 124.7% from the deficit of Kshs 108.4 bn recorded in Q1’2025. A key point to note is that a deficit in the financial account indicates that there are more investment funds flowing out of the country than inflows, while a surplus in the financial account means that more investment funds are flowing into the country than out, indicating that foreign investors are purchasing more domestic assets than domestic investors are acquiring foreign assets, leading to a net inflow of capital. The chart below shows the trend in the financial account in Kshs bn over the last ten years;
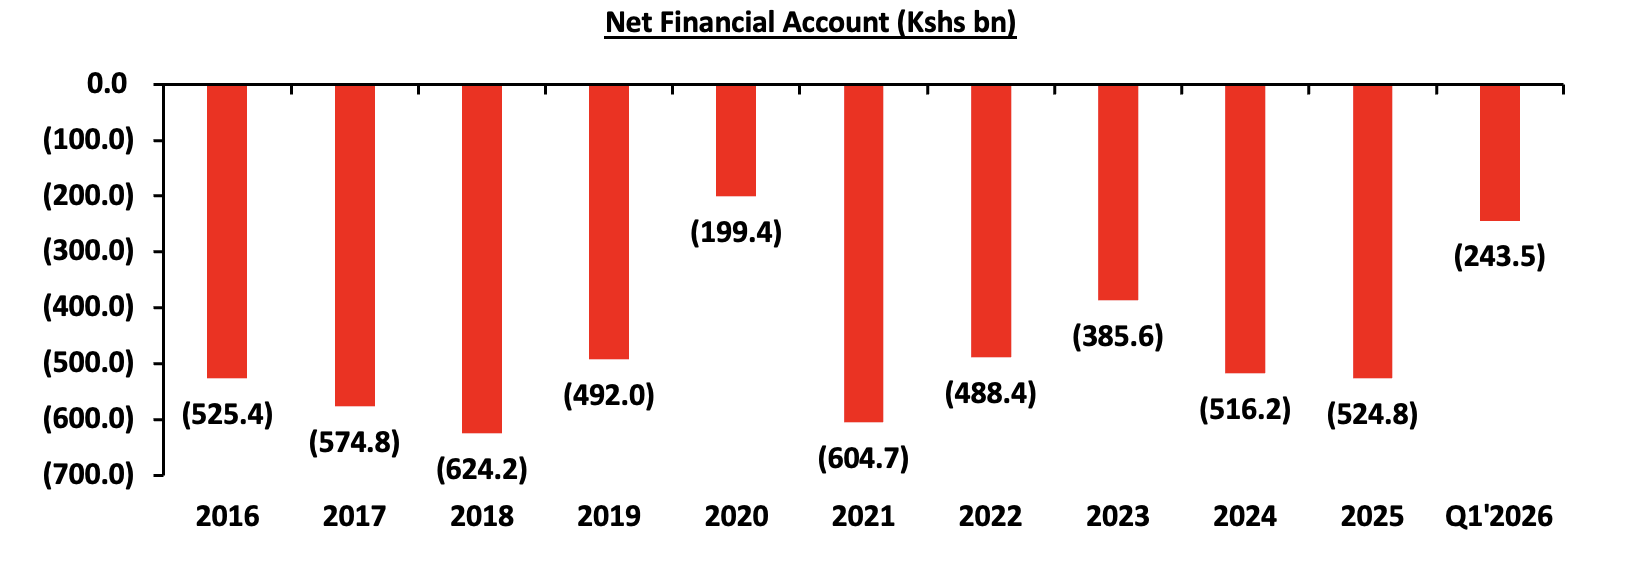
Source: KNBS Data
On the other hand, the capital account balance increased by 100.0% to a surplus of Kshs 8.9 bn in Q1’2026. Notably, the capital account has shown mixed performance over the past 10 years, with a positive 10-year compound annual growth rate (CAGR) of 1.1%, increasing to Kshs 23.4 bn in 2025 from USD 20.9 bn in 2016. This increase is partly due to an increase in foreign direct investment and capital flight, as many foreign direct investors invested in the country. Below is a chart highlighting the movement of the capital account in Kshs bn over the last 10 years;
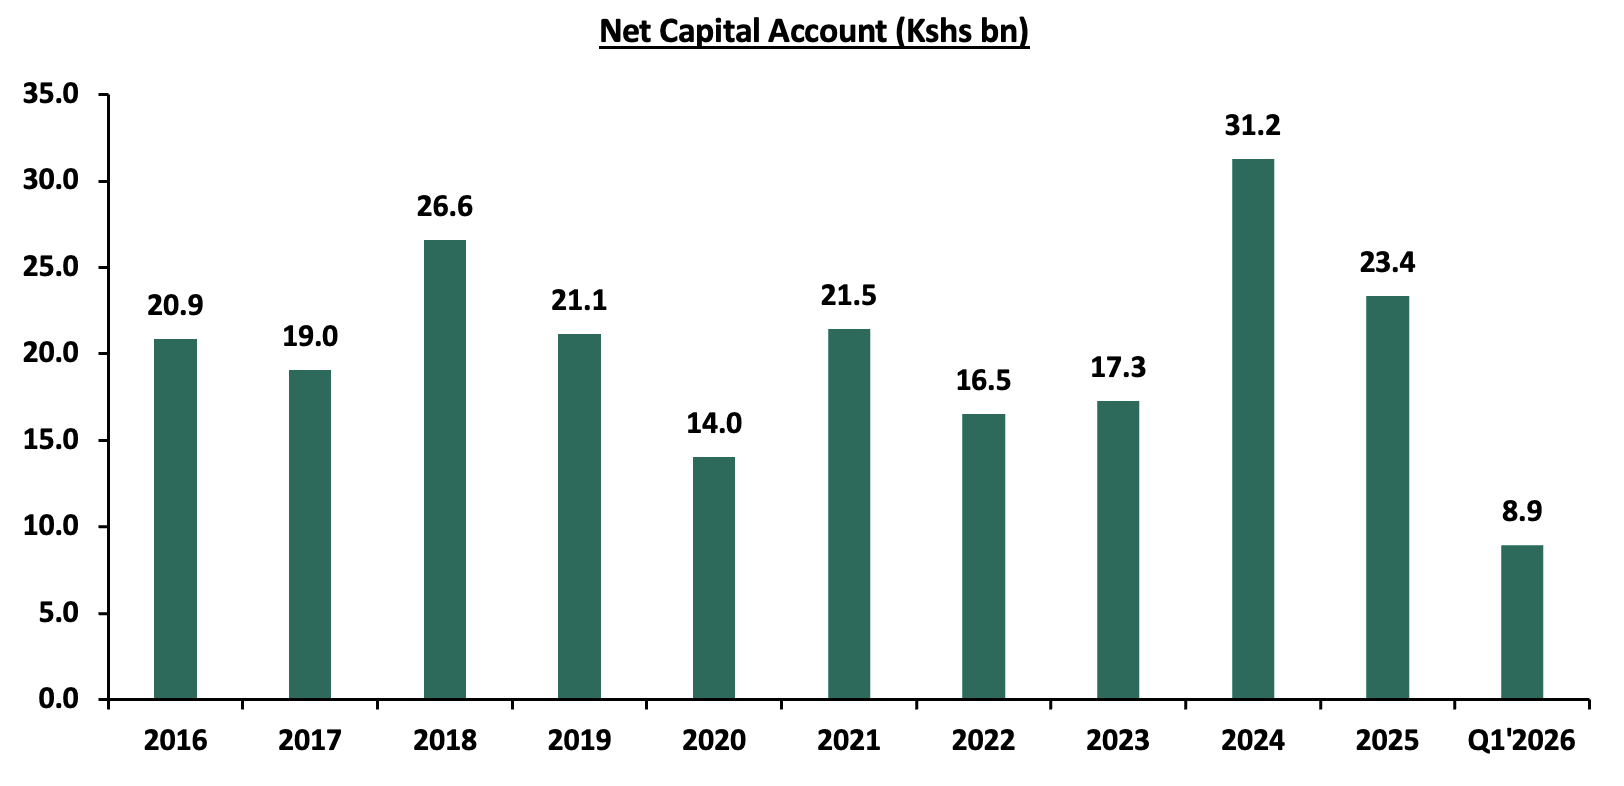
Source: KNBS Data
Section III: Evolution of Balance of Payments
Kenya’s overall balance of payments has been fluctuating over the years, with the balance of payments standing at a deficit of Kshs 176.0 bn in Q1’2026, a significant deterioration from the Kshs 77.0 bn deficit recorded in Q1’2025. The performance is attributable to the widening in the running current account deficit and the financial account deficit. However, the overall balance of payments has been mainly supported by the financial account, which has increased significantly by 124.7% on a year-on-year basis to Kshs 243.5 bn in Q1’2026 from Kshs 108.4 bn in Q1’2025. Below is a graph highlighting the trend in Kenya’s balance of payments over the last ten years;
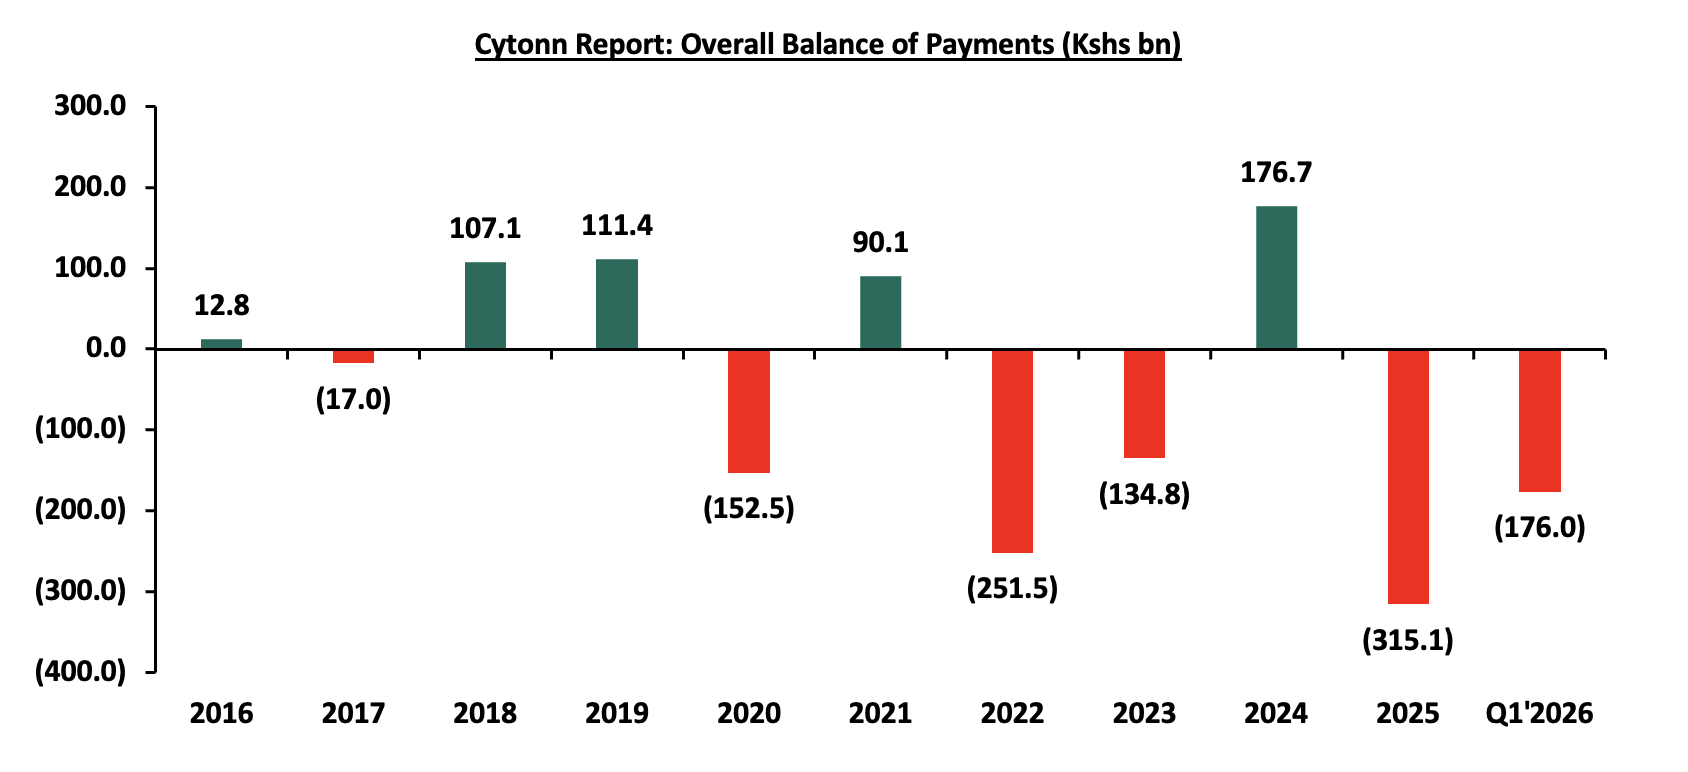
Source: Kenya National Bureau of Statistics (KNBS)
Key take-outs from the chart include;
-
In 2025 the balance of payment ended the year at a deficit of Kshs 315.1 bn, an increase from a deficit of Kshs 176.7 bn in 2024, mainly driven by a 30.8% increase in the current account balance deficit to Kshs 373.3 bn in FY’2025, from Kshs 285.5 bn in FY’2024, and the 1.7% increase in financial account to Kshs 524.8 bn in FY’2025 from Kshs 516.2 bn recorded in a similar period in 2024. The performance was however weighed down by a 25.2% decrease in the financial account balance to a surplus of Kshs 23.4 bn from a surplus of Kshs 31.2 bn in FY’2024,
-
Kenya’s balance of payment (BoP) position deteriorated by 128.6% in Q1’2026, to a deficit of Kshs 176.0 bn, from a deficit of Kshs 77.0 bn in Q1’2025. The y/y negative performance in BoP was mainly driven by a significant 124.7% increase in financial account deficit to Kshs 243.5 bn from Kshs 108.4 bn in Q1’2025.
Looking ahead, we anticipate that the balance of payments will remain in surplus, primarily supported by strong financial account inflows from Eurobond proceeds, sustained diaspora remittances, and increased investor confidence. Additional support is expected from a stable shilling, expanding trade opportunities through agreements with the EU, EAC, SADC, and COMESA, improved agricultural output driven by favorable weather and subsidy programs, and prudent fiscal and monetary policies. However, the expiration of the African Growth and Opportunity Act (AGOA) and the imposition of U.S. tariffs pose a significant risk to export earnings, which could undermine the sustainability of this surplus and exert pressure on the current account balance.
Section IV: Performance Measurements of Balance of Payments
Balance of payments is influenced by a number of factors which include;
-
Exports and Imports
Exports are goods and services that a country sells to other countries. Exports affect the balance of payment by increasing the value of goods and services sold to other countries and reducing the trade deficit. Exports also form a major source of foreign currency, which contributes to the stability of the domestic currency against other currencies. Imports on the other hand are goods and services that a country buys from other countries. Imports affect the balance of payment by offsetting the value of goods and services sold to other countries and thereby increasing the trade deficit. An increase in the value of imports also reduces the foreign currency reserves and the current account balance.
Over the last ten years, Kenya’s annual value of imports has averaged Kshs 2.1 tn, higher than the average annual value of exports of Kshs 0.7 tn, hence resulting in running trade deficits over the period. However, over the same period, exports registered a compounded annual growth rate of 6.6% to Kshs 1.0 tn in 2025 from Kshs 0.5 tn in 2016, lower than that of imports at 6.8% to Kshs 2.8 tn in 2025 from Kshs 1.4 tn in 2016, attributable to the government’s efforts to diversify the country’s export base and boost export-oriented sectors like agriculture as well as increased access to regional and international markets. The chart below shows the total imports and exports over the last ten year
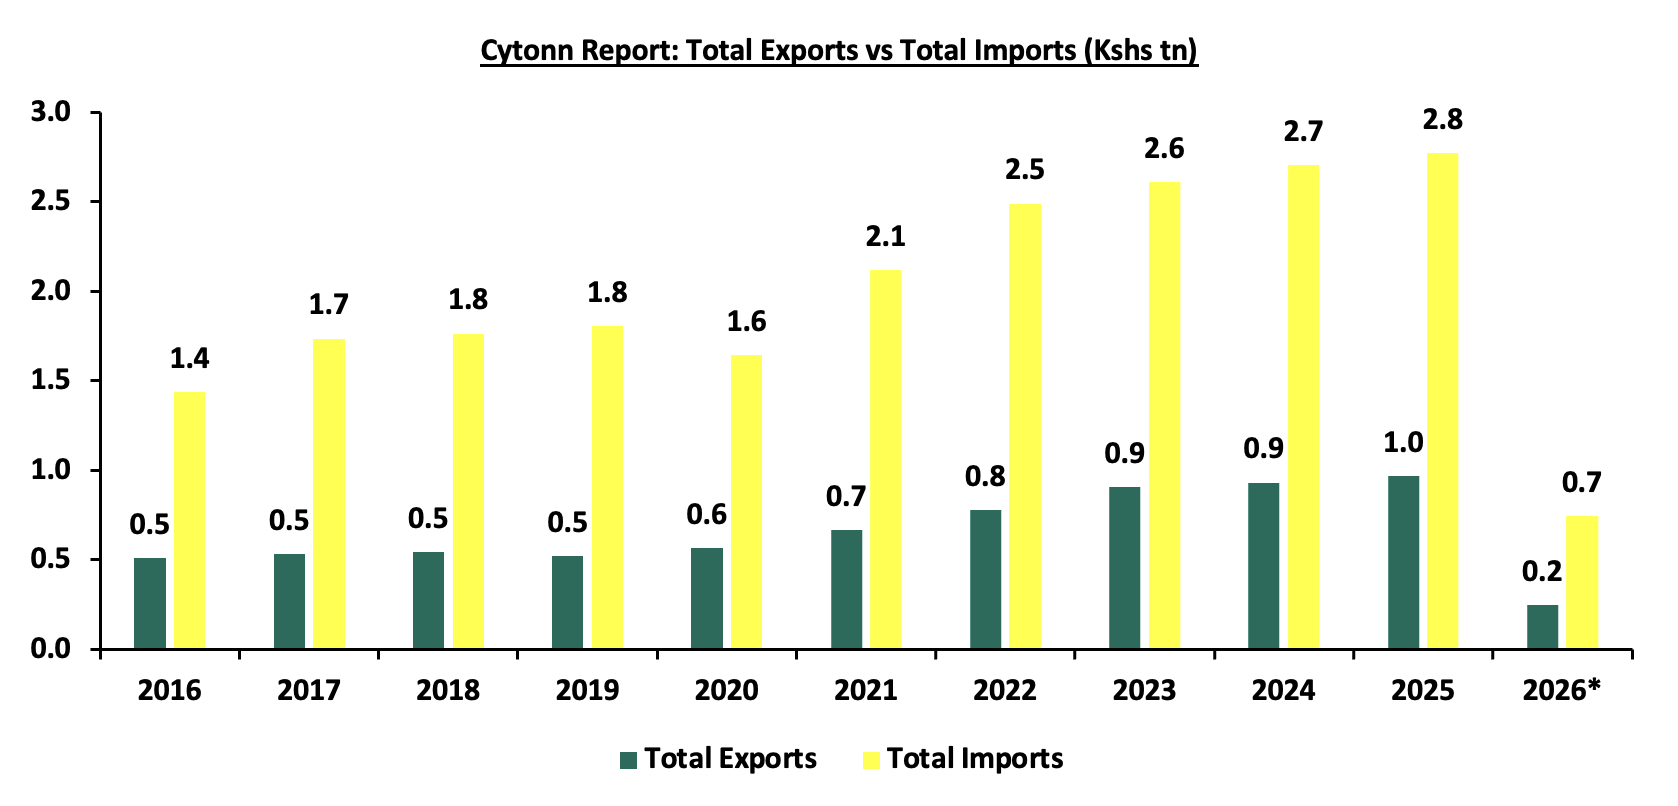
Source: KNBS, *Provisional figures (as of Q1’2026)
-
Foreign Direct Investments
A Foreign direct investment (FDI) is an investment by a business or an individual in one country in an enterprise in another country with the intention of establishing a lasting interest. In 2025, FDI netflows increased by 4.5% to remain relatively unchanged from the USD 1.9 bn recorded in 2024, attributed to Kenya’s relatively stable macroeconomic environment, investor-friendly reforms, and growing investment opportunities in sectors such as digital infrastructure, renewable energy, and financial services, which increased the country's appeal to digital investors.
FDI can improve the current account of the BOP by increasing the exports of goods and services from the host country to the foreign market. This is especially true if the FDI is in export-oriented sectors or if the foreign investor uses local inputs and suppliers. A good example is FDI in Kenya’s horticulture sector which has boosted its exports of flowers, fruits, and vegetables to Europe and other regions. FDI can also worsen the current account of the BOP by increasing the imports of goods and services from the foreign market to the host country if the FDI is in import-dependent sectors. The chart below shows Kenya’s FDI inflows over the years;
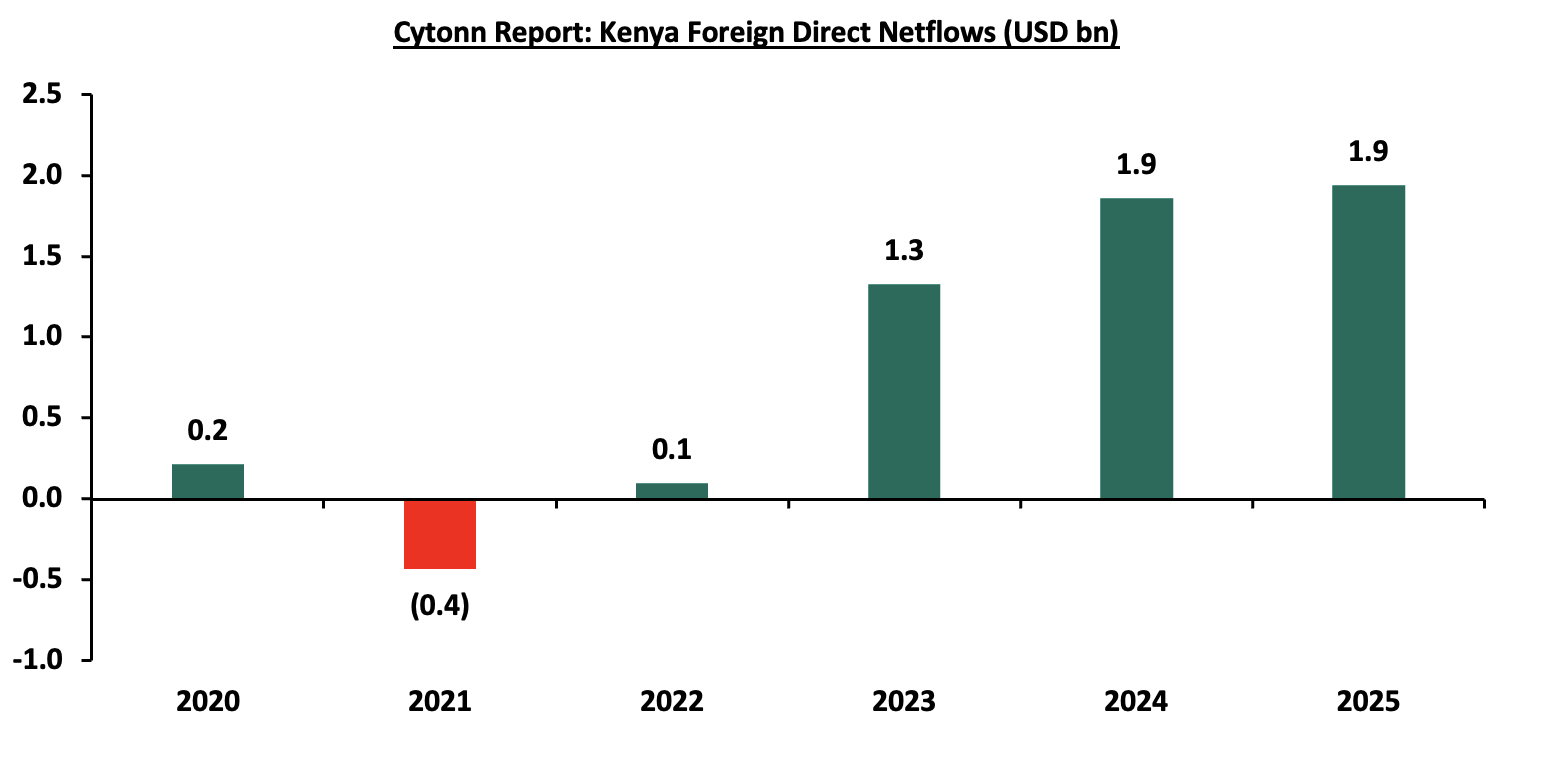
Source: UNCTAD World Investments Report
-
Debt
Kenya’s debt stock has been on the rise over the years mainly due to a widening fiscal deficit coupled with increased debt servicing costs. Key to note, the country’s debt stood at Kshs 13.2 tn as of July 2026, equivalent to 71.0% of GDP and 21.0% points above the IMF recommended threshold of 50.0% for developing nations. Despite the high public debt burden, Kenya’s foreign exchange reserves remained adequate at USD 14.7 billion as of 16th October 2026, equivalent to 5.9 months of import cover, supported by external borrowing and resilient diaspora remittance inflows. However, persistent trade imbalances and external debt obligations continue to pose risks to reserve stability. The graph below shows the debt servicing costs over the last ten fiscal years:
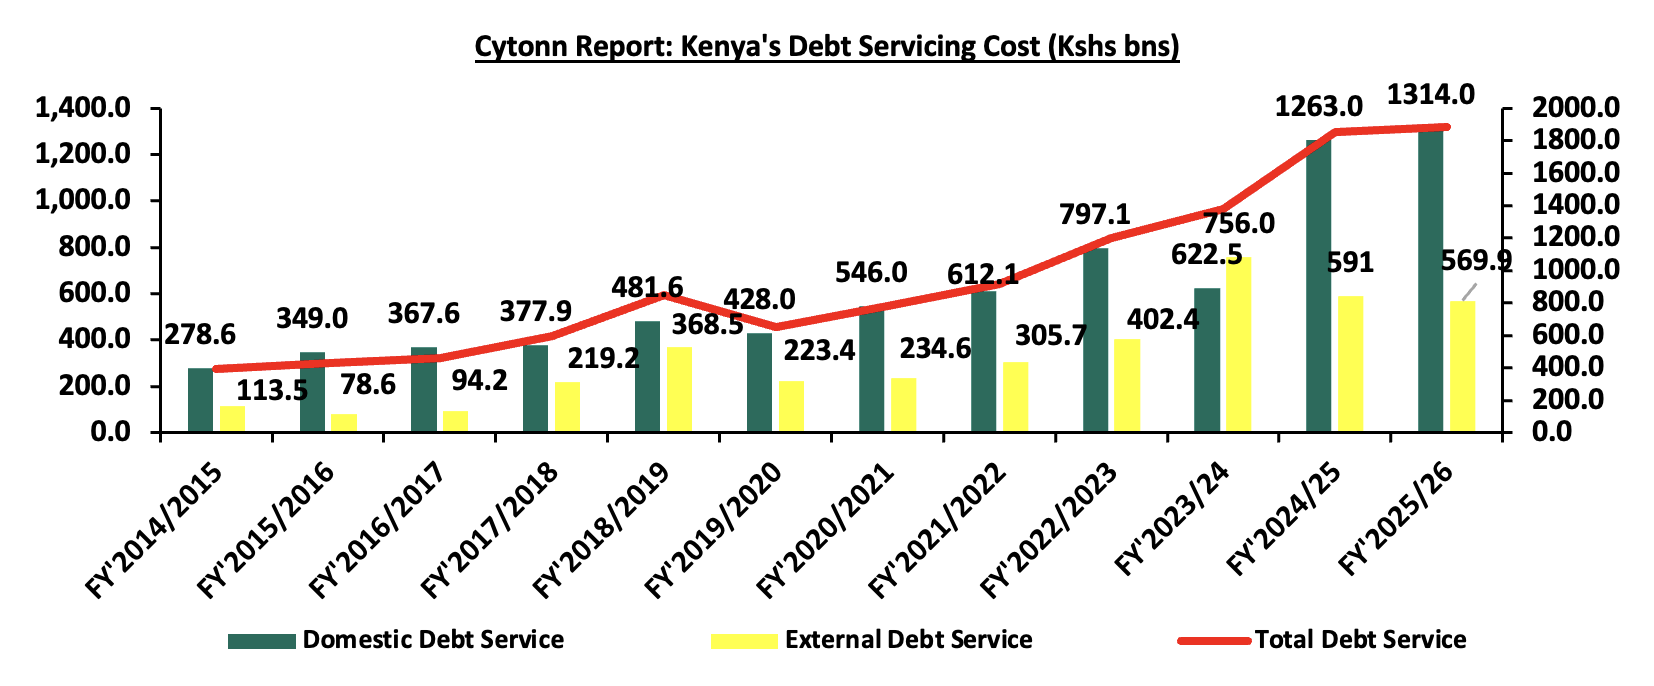
Source: National Treasury
The country’s debt service to revenue ratio increased by 5.9% points to 70.1% in the FY’2025/2026 up from 64.2% observed in FY’2024/2025 and remained a significant 40.1% points above the IMF’s recommended threshold of 30.0%. Notably, the country’s debt service to revenue ratio stood at 92.2% as at the end of August 2026. The sustained level of debt service to revenue ratio above the recommended threshold is a worrying sign but has been steadily improving following the successful buyback of Kenya’s Eurobond back in February 2026 which reduced credit risks for the country. The situation is, however, still at risk from global supply disruptions accelerated by the ongoing geo-political tensions tied to the Iran war. Below is a chart showing the debt service to revenue ratio for the last ten fiscal years;
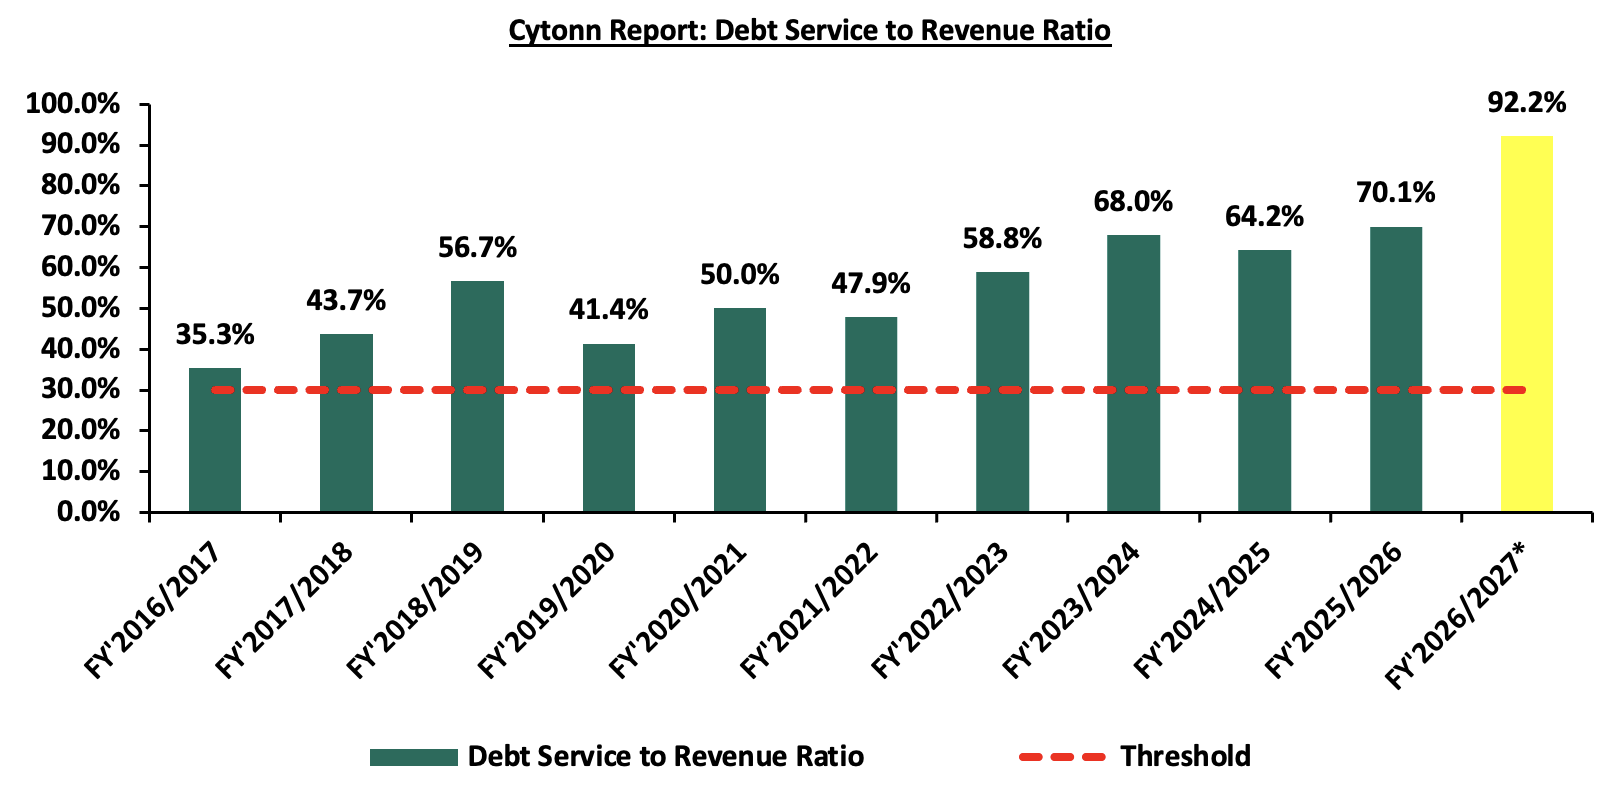
Source: National Treasury, *Provisional figures as of August 2026
Balance of payments deficit indicates that the country is spending more than it is receiving. As such, it is forced to borrow more money to pay for goods and services from the rest of the world. In the long term, a country becomes a net consumer and not a net producer of global economic output which leads to more debt requirements. Additionally, a persistent deficit may necessitate the selling of some of the resources to pay its creditors.
Section V: Factors Affecting Balance of Payments
The balance of payment reflects the economic interaction of a nation with the rest of the world over a specific period. Several factors not limited to economic, political, government policies, global economic conditions as well as currency, determine the state of balance of payment of a nation. These factors include:
-
Balance of Trade - When a country’s value of exports of goods and services is more compared to its imports, then it has a trade surplus. This in turn is a good indicator of the balance of payments as it means the inflows outrun the outflows. Further, more import value of goods and services of a country compared to the export value is called a trade deficit and is viewed as an indicator of a poor balance of payment as the nation is spending more on imports than its earnings, which negatively affects the balance of payment,
-
Foreign Direct Investment (FDI) - FDI refers to foreign investments in terms of business interests and assets into a foreign country. This in turn increases the inflow of foreign exchange, the development of new technology, increased employment opportunities as well as increased tax revenues. In turn, an increase in FDI is favourable to the balance of payment while a decrease has a negative effect on the country’s BoP,
-
Exchange rates - When market forces or deliberate government policies depreciate the currency of a nation, the prices of exports in foreign markets are cheaper compared to the imports. In turn, the export inflows increase due to an increase in demand, resulting from cheaper prices, while the imports decrease as the inflated import prices reduce consumption appetite,
-
Economic growth rate - When the differential rate of GDP growth across countries increases, the country’s attractiveness of its assets increases, which in turn leads to increased capital flows. This can be in the form of portfolio investments, loans, and other capital flows. Consequently, this will lead to an improved balance of payment account, by improving the financial account,
-
Inflation - When a country’s inflation rate increases compared to its trade partners, the home prices of goods and services increase, which reduces the demand for the country’s exports. Additionally, high inflation increases the cost of imports as they are cheaper compared to domestic products being exported to other countries. In turn, this can lead to a deficit in the BoP,
-
Government policies - The government can enact policies that are geared to encourage exports or to reduce the value of imports, which is meant to improve the trade surplus. Some of the policies can be imposing tariffs, quotas on imports, or a total import ban on a product, to reduce the value of imports. Such policies can affect the financial account of the BoP. Tighter controls may prevent foreign investment and restrict outflows, potentially causing capital flight and negatively impacting the balance of payments,
-
Global economic conditions and Policies - The balance of payments is highly sensitive to shifts in global economic trends and policy decisions. Factors such as fluctuations in commodity prices, global inflation, interest rate changes, and economic slowdowns or recessions in major economies can significantly affect a country’s trade performance, capital inflows, remittance levels, and overall financial transactions. Moreover, changes in international trade policies can have direct consequences on export competitiveness and market access. For instance, the expiration of the African Growth and Opportunity Act (AGOA) on 30th September 2025 and the imposition of a 10% U.S. tariff on Kenyan exports eliminate preferential access to the U.S. market for key goods like textiles, apparel, and agricultural products, raising their cost and reducing competitiveness. These changes are expected to lower export volumes and earnings, weaken the trade balance, and strain the current account—ultimately putting pressure on the overall balance of payments, particularly if alternative markets or trade agreements fail to fully offset the loss.
-
Excessive government borrowing - High levels of foreign debt can increase a country’s risk of financial crises, which can make investors pessimistic about the government’s ability to service debt. As a result, it can lead to the withdrawal of investments, and capital flight as well as negatively impact the financial account of the BoP, and,
-
Remittances - Money sent home by citizens working abroad significantly impacts Kenya’s balance of payments, primarily through the current account. These inflows increase foreign exchange reserves, support household consumption, and reduce the need for external borrowing. Remittances are consistently among the top sources of foreign exchange, often surpassing earnings from traditional exports like tea and horticulture. Additionally, when remittances are invested in real estate, business ventures, or financial instruments, they are recorded under the financial account as capital inflows. Therefore, a decline in remittance flows can negatively affect both the current and financial account balances, potentially widening the overall BoP deficit.
-
Interest Rates - Fluctuations in a country’s interest rates can influence capital flows, as higher interest rates often attract foreign capital, improving the financial account of the balance of payments. Conversely, low interest rates can encourage capital outflows as investors seek higher returns abroad, potentially leading to a deterioration in the balance of payments,
Section VI: Policy Recommendations and Conclusion
To establish a balance of payment surplus, every government must implement policies that benefit the BOP's health by increasing exports while decreasing imports. As a result, we propose the following specific recommendations for the government to reduce the BoP deficit and enhance the overall status of the BoP account:
-
Encourage export diversification - the government should shift from complete over-reliance on traditional exports like tea, horticulture, and coffee, through diversification in promoting value-added processing and manufacturing to increase export revenue,
-
Reducing Imports - The government should carefully cut down on imports and only import what is needed while encouraging domestic production of some of the imports. This can be achieved through the introduction of import restrictions like quotas and tariffs. Notably, this should be carefully done to strike a balance between domestic industry protection as well protecting existing trade relationships with other nations,
-
Export promotion - The government can employ different strategies to encourage more export volumes and produce. This can be done through actively engaging in trade pacts that favour Kenyan exports in new markets. Additionally, the government can provide export incentives and subsidies to increase Kenyan products’ price competition in foreign markets. For example, Kenya entered into the Early Harvest Agreement with China in 2026, securing approximately 98.2% zero-duty market access to Kenyan products to increase exports to China,
-
Encouraging Foreign Direct Investment (FDI)- The government should be strategic in creating an attractive investment environment for foreign investments through improving regulatory transparency as well as reducing hurdles in the process. The Kenyan government can target key investment sectors of global interest like the Renewable energy sector and Sustainable Energy Development Goals (SEDG), and make it favourable for foreign investors,
-
Increase agricultural produce- the government should support small-scale farmers with improved agricultural technology and quality inputs, as well as improved access to credit. This will help increase agricultural productivity, thus increasing exports, while reducing the dependence on some of the unnecessary agricultural imports like sugar and wheat, and,
-
Maintaining a sustainable debt level- The government should also strike a balance between foreign borrowing which helps increase the foreign reserves, while maintaining a good credit score with its creditors. This ensures that the country remains attractive for investors’ capital and financial flows.
Kenya’s balance of payments remains under pressure from the persistent current account deficit, driven by high debt-servicing costs, import dependency, and slower export growth. However, the outlook remains positive, supported by fiscal consolidation, growth in key export sectors, and sustained diaspora remittances. The government’s FY’2026/27 borrowing plan, comprising 21.3% external and 78.7% domestic financing, is expected to reduce reliance on external debt. Additionally, the fertilizer subsidy programme could boost agricultural production and exports, while the stability of the Kenyan Shilling may help contain import costs. Trade agreements with the EU, EAC, SADC, and COMESA are also expected to expand export markets. Nevertheless, reducing dependence on debt and imports through increased domestic production and foreign direct investment in export-oriented sectors remains crucial to strengthening the balance of payments.
Disclaimer: The views expressed in this publication are those of the writers where particulars are not warranted. This publication, which is in compliance with Section 2 of the Capital Markets Authority Act Cap 485A, is meant for general information only and is not a warranty, representation, advice, or solicitation of any nature. Readers are advised in all circumstances to seek the advice of a registered investment advisor.

- Talk to us
- Kenya
- P.O Box 20695 - 00200, Nairobi, Kenya
- Cell +254709101200
- Tel +254709101200
- WhatsApp +254741676635
- United States
- +254709101200
- DOWNLOAD OUR APP
-


- Kenya
- 8th Floor, Pinetree Plaza, Kaburu Drive, Ngong Road, Nairobi, Kenya
- USA
- Suite 1150, 1775 Eye Street NW, USA, Washington DC 20006, USA
- Investments
- High Yield
- Private Equity
- Real Estate
- Real Estate
- RiverRun Estates
- Cytonn Towers
- The Ridge
- Taraji Heights
- The Alma