Kenya’s Listed Banks FY’2022 Report, & Cytonn Weekly #16/2023
By Research Team, Apr 23, 2023
Executive Summary
Fixed Income
During the week, T-bills were oversubscribed for the third consecutive week, with the overall subscription rate coming in at 146.5%, up from an oversubscription rate of 122.6% recorded the previous week. Investor’s preference for the shorter 91-day paper persisted as they sought to avoid duration risk, with the paper receiving bids worth Kshs 32.0 bn against the offered Kshs 4.0 bn, translating to an oversubscription rate of 799.6%, higher than the 621.9% recorded the previous week. Notably, the 182-day and 364-day papers recorded continued undersubscriptions of 21.5% and 10.2%, from undersubscription rates of 24.7% and 20.7%, respectively, recorded the previous week. The government accepted bids worth Kshs 33.2 bn and rejected Kshs 2.0 bn out of the total Kshs 35.2 bn bids received, translating to an acceptance rate of 94.7%. The yields on the government papers were on upward trajectory, with the yields on the 364-day, 182-day and 91-day papers increasing by 12.7 bps, 4.9 bps and 8.7 bps to 11.1%, 10.5% and 10.2%, respectively;
In the primary market the Central Bank of Kenya released the bond auction results for the re-opened treasury bond FXD1/2022/03 with effective tenor to maturity of 2.1 years. In line with our expectations, the bond was undersubscribed, receiving bids worth Kshs 1.8 bn, against the offered Kshs 30.0 bn, translating to an undersubscription rate of 24.4%, on the back of tightened liquidity in the money market, with the average interbank rate increasing by 0.3% points to 8.7%, from 8.4% recorded the previous week. The government continued to reject expensive bids, accepting bids worth Kshs 1.8 bn out of the Kshs 7.4 bn of total bids received, translating to an acceptance rate of 24.0%;
We are projecting the y/y inflation rate for April 2023 to ease to a range of 8.7% - 9.1%;
Equities
During the week, the equities market was on a downward trajectory with NASI, NSE 20 and NSE 25 declining by 3.3%, 1.2% and 1.8%, respectively, taking the YTD performance to losses of 15.3%, 4.9% and 8.6% for NASI, NSE 20 and NSE 25, respectively. The equities market performance was mainly driven by losses recorded by large cap stocks such as Safaricom, EABL of 7.3% and 6.1%, respectively, and banking stocks such as KCB Group and ABSA Bank Kenya of 2.8% each. The losses were however mitigated by gains recorded by stocks such as NCBA Group, Equity Group, and DTB-K of 5.4%, 1.5% and 1.4%, respectively;
Real Estate
During the week, Rogers Group Limited, a Mauritanian investment group disclosed that it recorded a Kshs 113.6 mn gain in a bargain purchase acquisition deal of Rongai Workshop and Transport Limited, a renowned transport and logistics company in Kenya through its logistics subsidiary Velogic Limited. Additionally, a Turkish based manufacturing conglomerate, Turkish Industry Holdings, committed Kshs 48.0 bn towards the construction of five industries situated within the Naivasha Industrial Park, Mai Mahiu, Nakuru County. In Regulated Real Estate Funds, under the Real Estate Investment Trusts (REITs) segment, Fahari I-REIT closed the week trading at an average price of Kshs 6.04 per share in the Nairobi Securities Exchange. On the Unquoted Securities Platform as at 20 April 2023, Acorn D-REIT and I-REIT closed the week trading at Kshs 23.9 and Kshs 20.9 per unit, respectively, a 19.4% and 4.4% gain for the D-REIT and I-REIT, respectively, from the Kshs 20.0 inception price. In addition, Cytonn High Yield Fund (CHYF) closed the week with an annualized yield of 13.7%, remaining relatively unchanged from what was recorded the previous week;
Focus of the Week
Following the release of the FY’2022 results by Kenyan listed banks, the Cytonn Financial Services Research Team undertook an analysis on the financial performance of the listed banks and identified the key factors that shaped the performance of the sector;
Investment Updates:
- Weekly Rates:
- Cytonn Money Market Fund closed the week at a yield of 11.03%. To invest, dial *809# or download the Cytonn App from Google Playstore here or from the Appstore here;
- Cytonn High Yield Fund closed the week at a yield of 13.72% p.a. To invest, email us at sales@cytonn.com and to withdraw the interest, dial *809# or download the Cytonn App from Google Playstore here or from the Appstore here;
- We continue to offer Wealth Management Training every Wednesday and every third Saturday of the month, from 9:00 am to 11:00 am, through our Cytonn Foundation. The training aims to grow financial literacy among the general public. To register for any of our Wealth Management Trainings, click here;
- If interested in our Private Wealth Management Training for your employees or investment group, please get in touch with us through wmt@cytonn.com;
- Cytonn Insurance Agency acts as an intermediary for those looking to secure their assets and loved ones’ future through insurance namely; Motor, Medical, Life, Property, WIBA, Credit and Fire and Burglary insurance covers. For assistance, get in touch with us through insuranceagency@cytonn.com;
- Cytonn Asset Managers Limited (CAML) continues to offer pension products to meet the needs of both individual clients who want to save for their retirement during their working years and Institutional clients that want to contribute on behalf of their employees to help them build their retirement pot. To more about our pension schemes, kindly get in touch with us through pensions@cytonn.com;
Real Estate Updates:
- For an exclusive tour of Cytonn’s Real Estate developments, visit: Sharp Investor's Tour, and for more information, email us at sales@cytonn.com;
- Phase 3 of The Alma is now ready for occupation and the show house is open daily. To join the waiting list to rent, please email properties@cytonn.com;
- For Third Party Real Estate Consultancy Services, email us at rdo@cytonn.com;
- For recent news about the group, see our news section here;
Hospitality Updates:
- We currently have promotions for Staycations. Visit cysuites.com/offers for details or email us at sales@cysuites.com;
Money Markets, T-Bills Primary Auction:
During the week, T-bills were oversubscribed for the third consecutive week, with the overall subscription rate coming in at 146.5%, up from an oversubscription rate of 122.6% recorded the previous week. Investor’s preference for the shorter 91-day paper persisted as they sought to avoid duration risk, with the paper receiving bids worth Kshs 32.0 bn against the offered Kshs 4.0 bn, translating to an oversubscription rate of 799.6%, higher than the 621.9% recorded the previous week. Notably, the 182-day and 364-day papers recorded continued undersubscriptions of 21.5% and 10.2%, from undersubscription rates of 24.7% and 20.7%, respectively, recorded the previous week. The government accepted bids worth Kshs 33.2 bn and rejected Kshs 2.0 bn out of the total Kshs 35.2 bn bids received, translating to an acceptance rate of 94.7%. The yields on the government papers were on upward trajectory, with the yields on the 364-day, 182-day and 91-day papers increasing by 12.7 bps, 4.9 bps and 8.7 bps to 11.1%, 10.5% and 10.2%, respectively. The chart below compares the overall average T- bills subscription rates obtained in 2017, 2022 and 2023 Year to Date (YTD):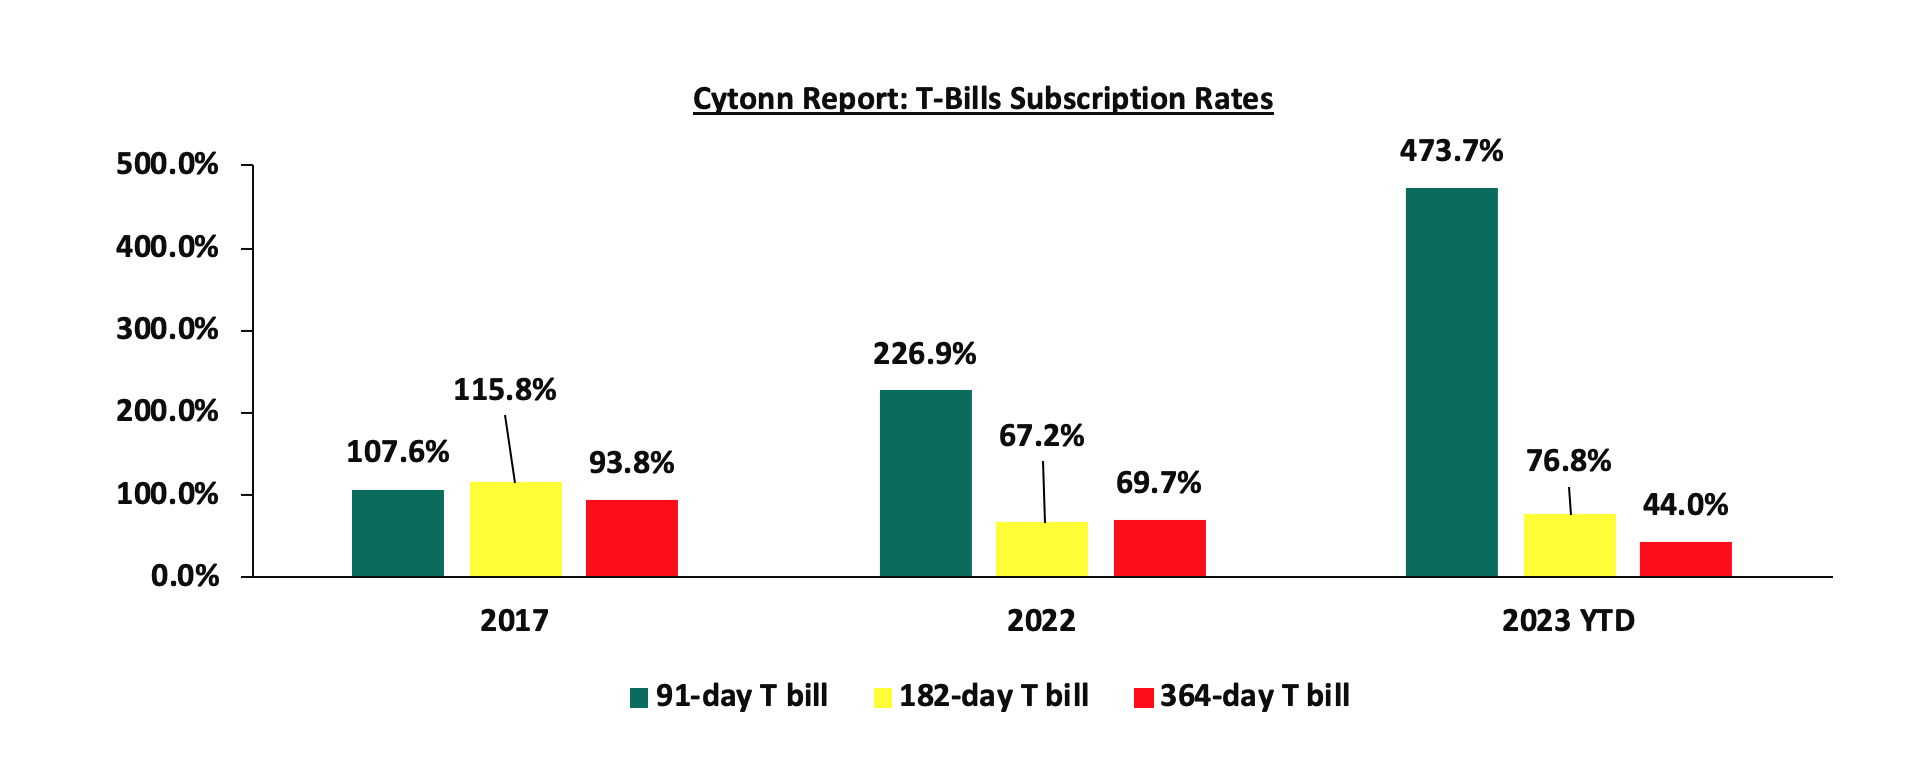
In the primary market the Central Bank of Kenya released the bond auction results for the re-opened treasury bond FXD1/2022/03 with effective tenor to maturity of 2.1 years. In line with our expectations, the bond was undersubscribed, receiving bids worth Kshs 1.8 bn, against the offered Kshs 30.0 bn, translating to an undersubscription rate of 24.4%, on the back of tightened liquidity in the money market, with the average interbank rate increasing by 0.3% points to 8.7%, from 8.4% recorded the previous week. The government continued to reject expensive bids, accepting bids worth Kshs 1.8 bn out of the Kshs 7.4 bn of total bids received, translating to an acceptance rate of 24.0%. The accepted weighted average yield for the bond came in at 13.9%, while the coupon rate was 11.8%. Key to note, the government cancelled the auction results for the FXD1/2019/15 with tenor to maturity of 10.9 years as investors continued to prefer shorter dated papers evidenced by the 799.6% oversubscription for the 91-day T-bill.
Money Market Performance: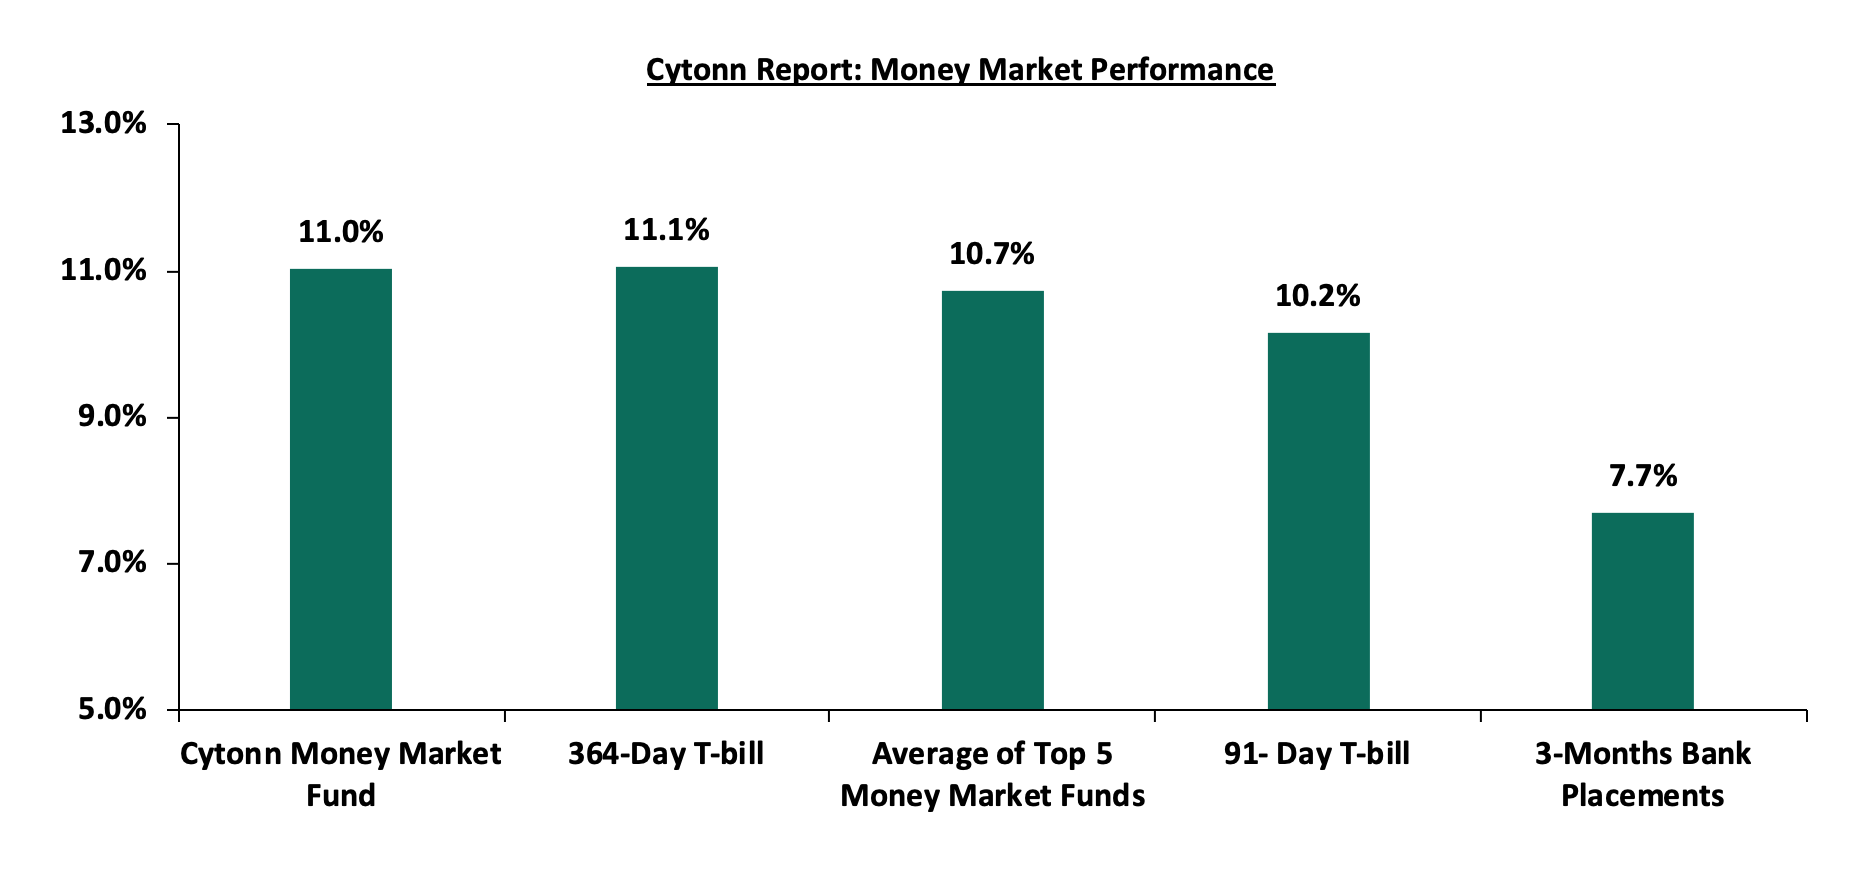
In the money market, the 3-month bank placements closed the week at 7.7%, similar to what was recorded the previous week (based on what we have been offered by various banks). The average yield on the 91-day and 364-day T-bills increased by 0.1% points and 0.2% points to 10.2% and 11.1%, from 10.1% and 10.9%, respectively, recorded the previous week. On the other hand, yields on the average Top 5 Money Market Funds and Cytonn Money Market Fund remained relatively unchanged at 10.7% and 11.0%, respectively, from what was recorded last week.
The table below shows the Money Market Fund Yields for Kenyan Fund Managers as published on 21 April 2023:
|
Cytonn Report: Money Market Fund Yield for Fund Managers as published on 21 April 2023 |
||
|
Rank |
Fund Manager |
Effective Annual Rate |
|
1 |
Cytonn Money Market Fund (dial *809# or download Cytonn App) |
11.0% |
|
2 |
Madison Money Market Fund |
10.8% |
|
3 |
Etica Money Market Fund |
10.8% |
|
4 |
Apollo Money Market Fund |
10.6% |
|
5 |
Dry Associates Money Market Fund |
10.5% |
|
6 |
Jubilee Money Market Fund |
10.3% |
|
7 |
Enwealth Money Market Fund |
10.1% |
|
8 |
Kuza Money Market fund |
10.0% |
|
9 |
AA Kenya Shillings Fund |
10.0% |
|
10 |
NCBA Money Market Fund |
9.9% |
|
11 |
Zimele Money Market Fund |
9.9% |
|
12 |
Old Mutual Money Market Fund |
9.9% |
|
13 |
Sanlam Money Market Fund |
9.8% |
|
14 |
Nabo Africa Money Market Fund |
9.8% |
|
15 |
GenAfrica Money Market Fund |
9.6% |
|
16 |
GenCap Hela Imara Money Market Fund |
9.6% |
|
17 |
CIC Money Market Fund |
9.4% |
|
18 |
KCB Money Market Fund |
9.4% |
|
19 |
Co-op Money Market Fund |
9.4% |
|
20 |
British-American Money Market Fund |
9.4% |
|
21 |
Orient Kasha Money Market Fund |
9.4% |
|
22 |
ICEA Lion Money Market Fund |
9.1% |
|
23 |
Absa Shilling Money Market Fund |
8.6% |
|
24 |
Mali Money Market Fund |
8.2% |
|
25 |
Equity Money Market Fund |
6.7% |
Source: Business Daily, M-PESA App
Liquidity:
During the week, liquidity in the money markets continued to tighten, with the average interbank rate increasing to 8.7%, from 8.4% recorded the previous week, partly attributable to tax remittances that offset government payments. However, the average interbank volume traded increased by 13.3% to Kshs 27.2 bn, from Kshs 24.0 bn recorded the previous week. The chart below shows the interbank rates in the market over the years: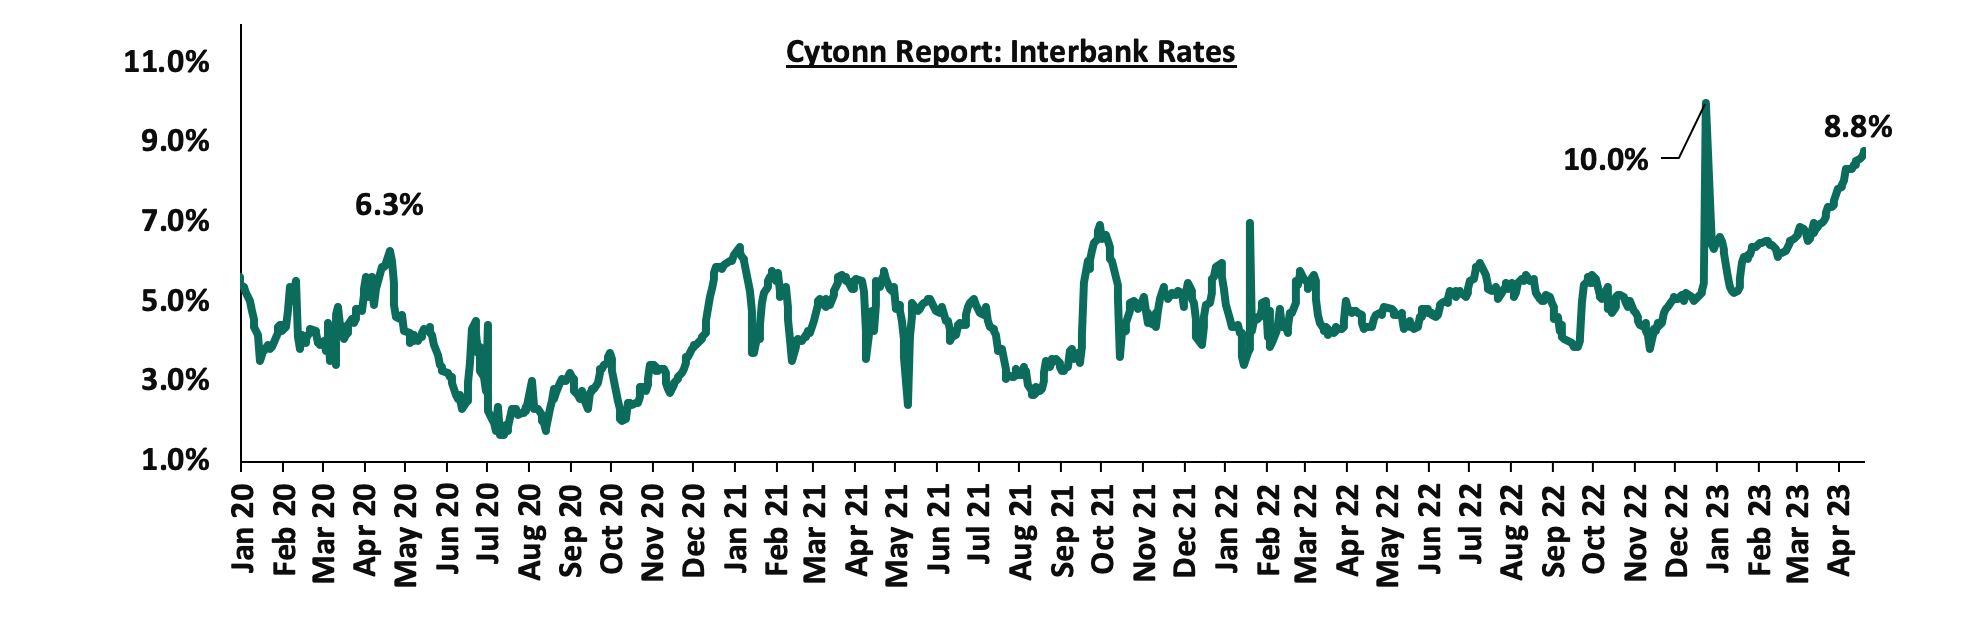
Source: CBK
Kenya Eurobonds:
During the week, the yields on Eurobonds were on an upward trajectory with the yield on the 10-year Eurobond issued in 2014, increasing the most, having increased by 0.8% points to 15.5%, from 14.7% recorded the previous week. The rise in the country’s Eurobond yields is mainly on the back of increased concerns about the continued depreciation of the Kenyan shilling, United States dollar shortages currently experienced in the economy and increased debt servicing concerns with debt service to revenue coming in at 56.4% as of March 2023, compared to 54.2% recorded in February 2023. The table below shows the summary of the performance of the Kenyan Eurobonds as of 19 April 2023;
|
Cytonn Report: Kenya Eurobonds Performance |
||||||
|
2014 |
2018 |
2019 |
2021 |
|||
|
Date |
10-year issue |
10-year issue |
30-year issue |
7-year issue |
12-year issue |
12-year issue |
|
Amount Issued (USD bn) |
2.0 |
1.0 |
1.0 |
0.9 |
1.2 |
1.0 |
|
Years to Maturity |
1.2 |
5.0 |
25.0 |
4.2 |
9.2 |
11.3 |
|
Yields at Issue |
6.6% |
7.3% |
8.3% |
7.0% |
7.9% |
6.2% |
|
02-Jan-23 |
12.9% |
10.5% |
10.9% |
10.9% |
10.8% |
9.9% |
|
03-Apr-23 |
13.7% |
12.2% |
11.4% |
13.2% |
11.6% |
11.2% |
|
13-Apr-23 |
14.7% |
12.7% |
11.7% |
13.6% |
12.1% |
11.6% |
|
14-Apr-23 |
14.8% |
12.7% |
11.7% |
13.6% |
12.1% |
11.5% |
|
17-Apr-23 |
14.8% |
12.8% |
11.8% |
13.6% |
12.2% |
11.6% |
|
18-Apr-23 |
15.0% |
12.8% |
11.9% |
13.6% |
12.2% |
11.6% |
|
19-Apr-23 |
15.5% |
13.0% |
12.0% |
13.9% |
12.4% |
11.8% |
|
Weekly Change |
0.8% |
0.3% |
0.3% |
0.3% |
0.3% |
0.2% |
|
MTD change |
1.8% |
0.8% |
0.6% |
0.7% |
0.8% |
0.7% |
|
YTD Change |
2.6% |
2.5% |
1.2% |
3.0% |
1.7% |
2.0% |
Source: Central Bank of Kenya (CBK) and National Treasury
Kenya Shilling:
During the week, the Kenya Shilling depreciated by 0.6% against the US dollar to close the week at Kshs 135.2, from Kshs 134.4 recorded the previous week, partly attributable to increased dollar demand from manufacturers and importers, especially oil and energy sectors against a slower supply of hard currency. On a year to date basis, the shilling has depreciated by 9.5% against the dollar, adding to the 9.0% depreciation recorded in 2022. We expect the shilling to remain under pressure in 2023 as a result of:
- High global crude oil prices on the back of persistent supply chain constraints coupled with high demand. The high crude oil prices have inflated Kenya’s import bill and as a result, petroleum products imports have continued to weigh heavily on the country’s import bill, and accounted for 27.6% of the total import bill in Q3’2022, up from 25.6% in Q2’2022 and much higher than 15.2% recorded in Q3’2021,
- An ever-present current account deficit estimated at 4.9% of GDP in the 12 months to January 2023, from 5.6% recorded in a similar period last year,
- The need for Government debt servicing which continues to put pressure on forex reserves given that 68.1% of Kenya’s External debt was US Dollar denominated as of December 2022, and,
- A continued interest rate hikes in the USA and the Euro Area with the Fed and European Central Bank increasing their benchmark rates to 4.75%-5.00% and 3.50% respectively in March 2023, which has strengthened the dollar and sterling pound against other currencies following capital outflows from other global emerging markets.
The shilling is however expected to be supported by:
- Diaspora remittances standing at a cumulative USD 1,015.5 mn in 2023 as of March 2023, albeit 0.8% lower than the USD 1,023.8 mn recorded over the same period in 2022, and,
- The tourism inflow receipts that came in at USD 268.1 bn in 2022, a significant 82.9% increase from USD 146.5 bn inflow receipts recorded in 2021.
Key to note, Kenya’s forex reserves increased to USD 6.5 bn as at 19 April 2023, slightly higher than USD 6.4 bn recorded the previous week. As such, the country’s months of import cover also remained unchanged at 3.6 months, similar to what was recorded the previous week, and below the statutory requirement of maintaining at least 4.0-months of import cover. The chart below summarizes the evolution of Kenya months of import cover over the last 10 years:
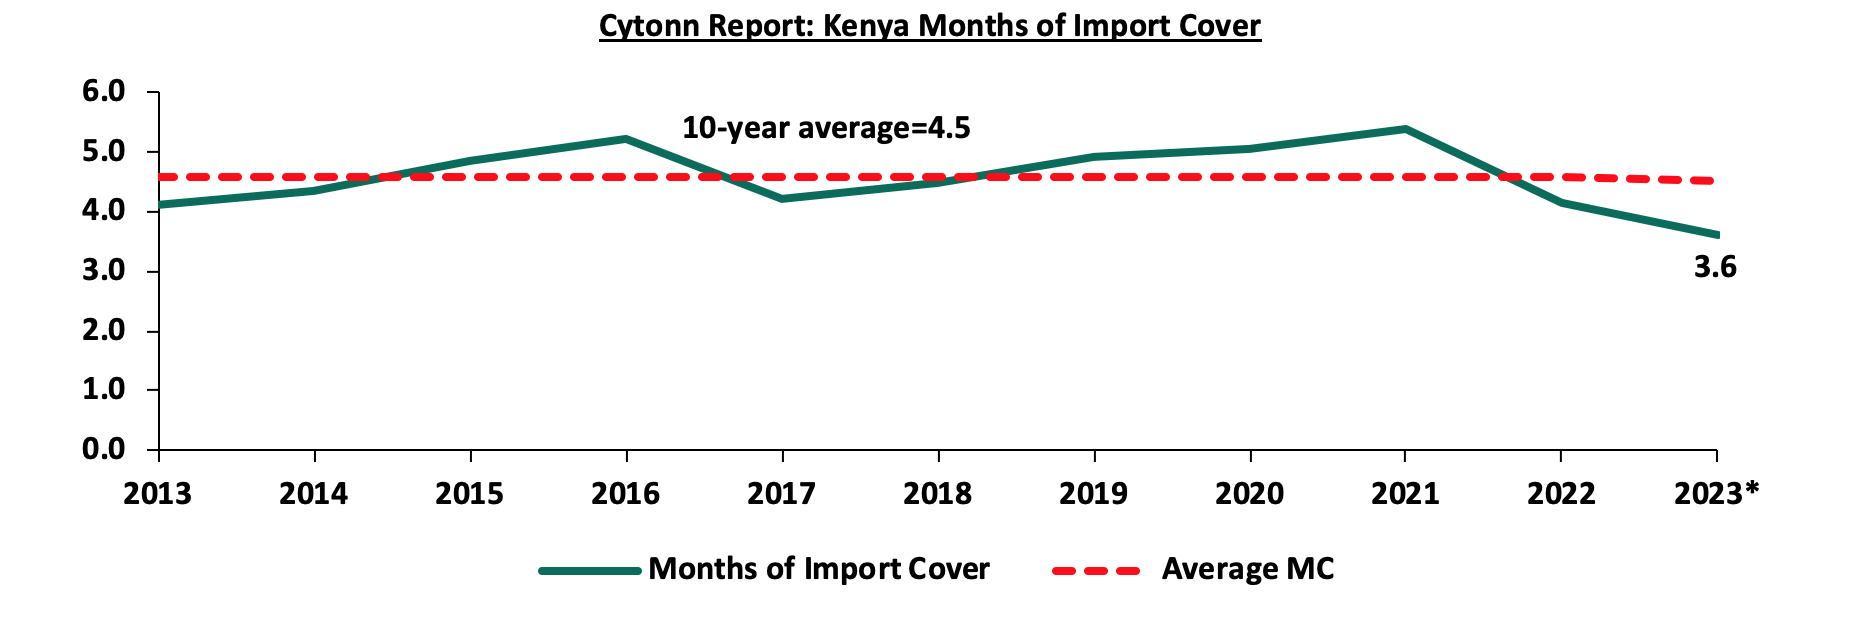
*Figure as of 19 April 2023
Weekly Highlight:
- March 2023 Inflation Projection
We are projecting the y/y inflation rate for April 2023 to decline to a range of 8.7%-9.1% mainly on the back of:
- Expected Stabilization of Food Prices- Food prices are expected to stabilize as a result of the ongoing rains in different parts of the country as well as the government's initiative to subsidize farm inputs such as fertilizers. As such, food supply in the country is expected to improve in short term to medium term and consequently lead to price stabilization and easing food inflation, the main contributor to the headline inflation. Additionally, we expect the government strategies such as importation of duty-free maize and rice to further bridge the food supply deficit, and,
- Maintained fuel prices- From the EPRA’s fuel prices release for the period 15 April to 14 May, fuel prices remained unchanged for the month at Kshs 179.3, Kshs 162.0 and Kshs 145.9 per liter of Super Petrol, Diesel and Kerosene, respectively. This comes after a Kshs 2.0 hike in the price of Super Petrol in the previous fuel price release, however, the prices of Kerosene and Diesel have remained unchanged for the fifth consecutive month. While Kenya’s fuel prices remain elevated above the historic levels, the constant fuel prices indicate price stability in the medium term.
Going forward, we expect the inflationary pressures to remain elevated and above the Government’s target range of 2.5%-7.5%, but to ease gradually in the medium to long term. Notably, we expect the ongoing government strategies such as fertilizer subsidization and importation of duty-free maize and rice to lower the cost of agricultural production and stabilizes prices of key commodities, respectively. Additionally, the currently ongoing rains in various parts of the country is expected to increase maize production. Consequently, the improved maize production coupled with additional maize importation is expected to ease food inflation with maize flour being a major inflationary factor. Notably, the government’s plan to do away with the fuel subsidies as part of its austerity measures may keep fuel prices elevated in the medium term. However, the full anchoring of the domestic inflationary pressures is largely pegged on how soon the global supply chain is restored.
Rates in the Fixed Income market have been on upward trend given the continued government’s demand for cash and the relatively tightened liquidity in the money market. The government is 11.0% ahead of its prorated borrowing target of Kshs 346.9 bn having borrowed Kshs 385.1 bn of the revised domestic borrowing target of Kshs 425.1 bn as per the March 2023 revised domestic borrowing target for FY’2022/23. We believe that the projected budget deficit of 5.7% is relatively ambitious given the downside risks and deteriorating business environment occasioned by high inflationary pressures. Further, revenue collections are lagging behind, with total revenue as at March 2023 coming in at Kshs 1.4 tn in the FY’2022/2023, equivalent to 65.9% of its revised target of Kshs 2.2 tn and 87.9% of the prorated target of Kshs 1.6 tn. Therefore, we expect a continued upward readjustment of the yield curve in the short and medium term, with the government looking to bridge the fiscal deficit through the domestic market. Owing to this, our view is that investors should be biased towards short-term fixed-income securities to reduce duration risk.
Market Performance:
During the week, the equities market was on a downward trajectory with NASI, NSE 20 and NSE 25 declining by 3.3%, 1.2% and 1.8%, respectively, taking the YTD performance to losses of 15.3%, 4.9% and 8.6% for NASI, NSE 20 and NSE 25, respectively. The equities market performance was mainly driven by losses recorded by large cap stocks such as Safaricom and EABL of 7.3% and 6.1%, respectively, and banking stocks such as KCB Group and ABSA Bank Kenya of 2.8% each. The losses were however mitigated by gains recorded by stocks such as NCBA Group, Equity Group, and DTBK of 5.4%, 1.5% and 1.4%, respectively.
During the week, equities turnover decreased by 39.2% to USD 4.7 mn from USD 7.7 mn recorded the previous week, taking the YTD turnover to USD 372.2 mn. Foreign investors turned net sellers, with a net selling position of USD 1.0 mn, from a net buying position of USD 1.5 mn recorded the previous week, taking the YTD net selling position to USD 41.9 mn.
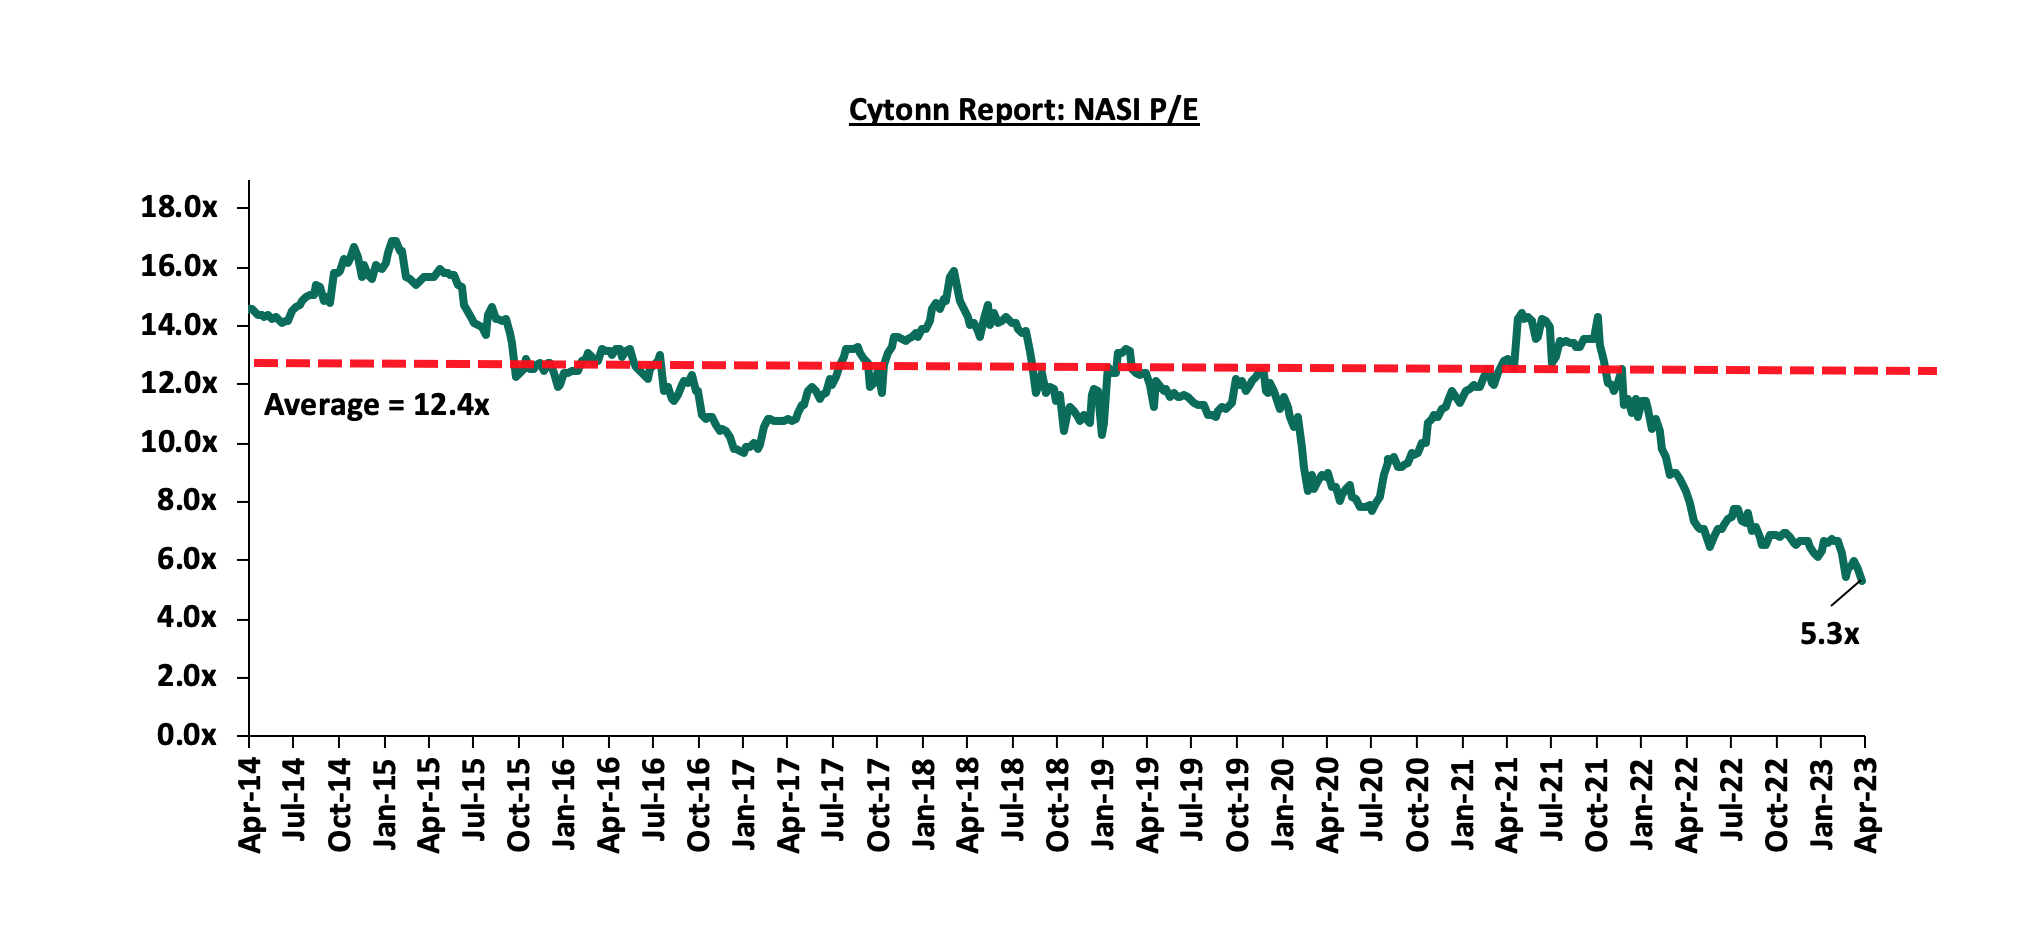
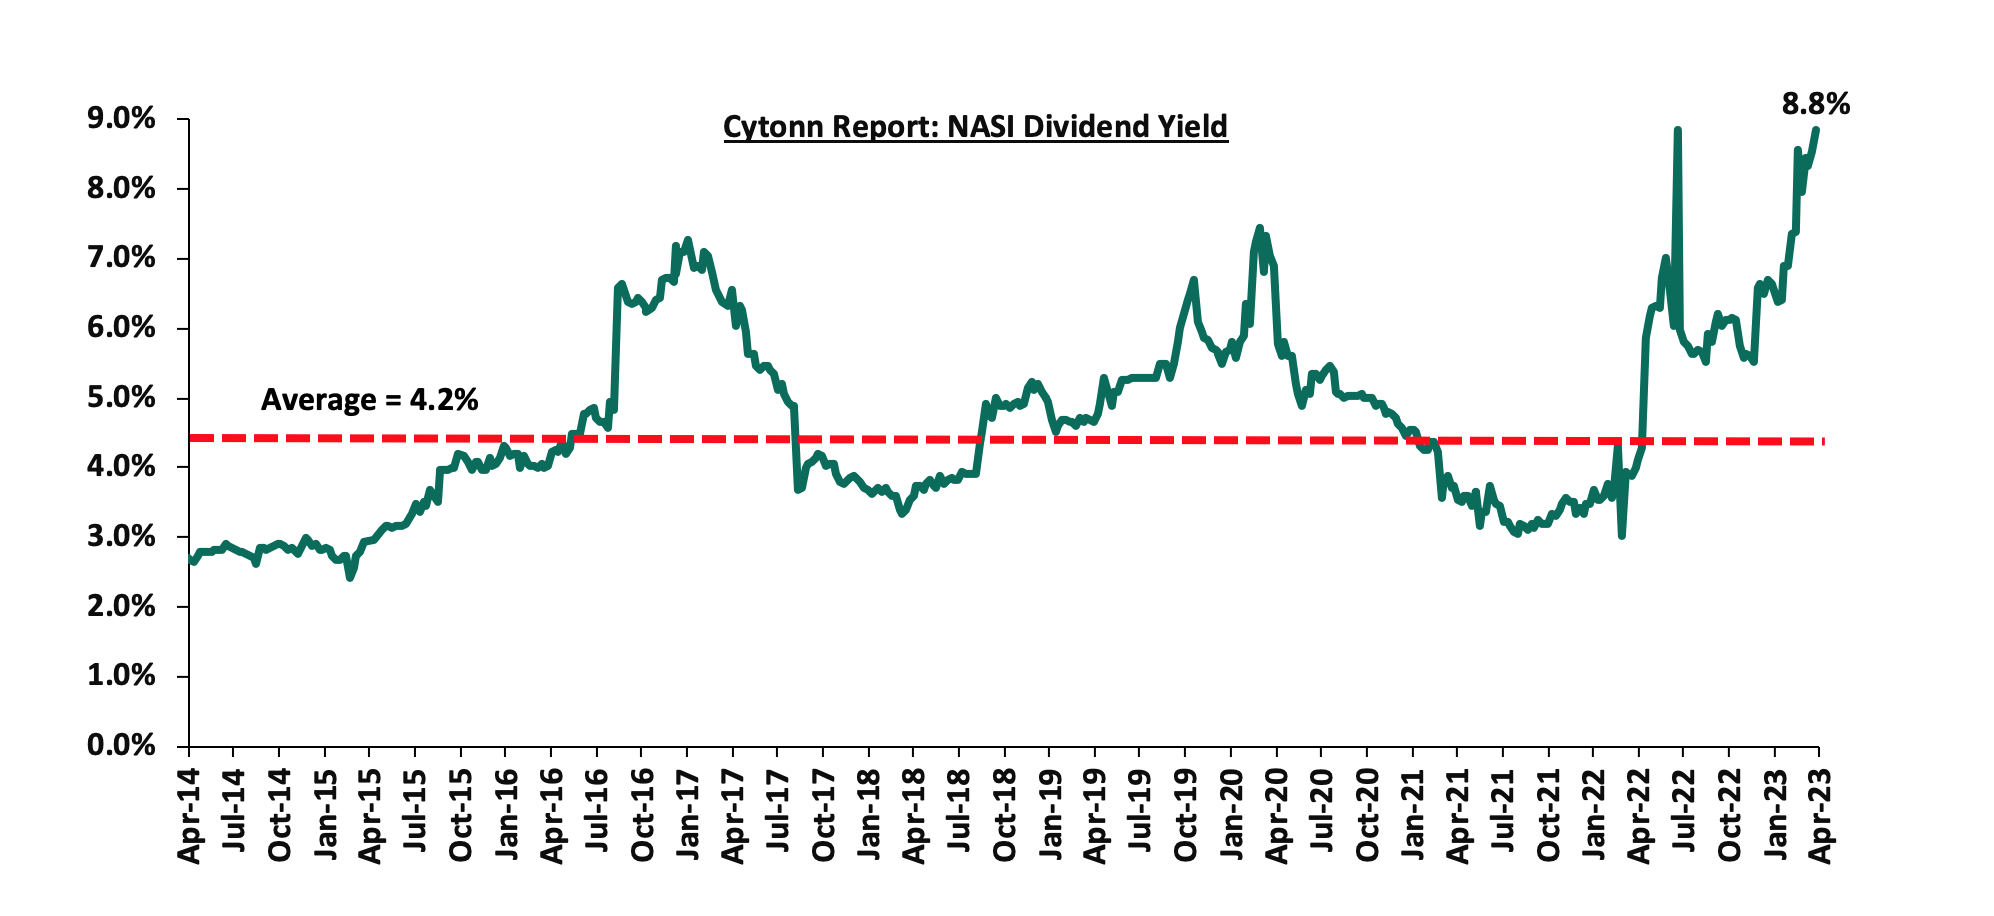
The market is currently trading at a price to earnings ratio (P/E) of 5.3x, 57.4% below the historical average of 12.4x. The dividend yield stands at 8.8%, 4.6% points above the historical average of 4.2%. Key to note, NASI’s PEG ratio currently stands at 0.7x, an indication that the market is undervalued relative to its future growth. A PEG ratio greater than 1.0x indicates the market is overvalued while a PEG ratio less than 1.0x indicates that the market is undervalued. The charts below indicate the historical P/E and dividend yields of the market;
Universe of coverage:
|
Company |
Price as at 14/04/2023 |
Price as at 20/04/2023 |
w/w change |
YTD Change |
Year Open 2023 |
Target Price* |
Dividend Yield |
Upside/ Downside** |
P/TBv Multiple |
Recommendation |
|
Liberty Holdings |
3.7 |
4.0 |
6.7% |
(21.4%) |
5.0 |
6.8 |
0.0% |
70.5% |
0.3x |
Buy |
|
Jubilee Holdings |
158.8 |
189.3 |
19.2% |
(4.8%) |
198.8 |
305.9 |
6.3% |
68.0% |
0.3x |
Buy |
|
Britam |
4.6 |
4.3 |
(5.0%) |
(16.5%) |
5.2 |
7.1 |
0.0% |
64.1% |
0.7x |
Buy |
|
Sanlam |
8.0 |
7.8 |
(2.0%) |
(18.2%) |
9.6 |
11.9 |
0.0% |
51.9% |
0.8x |
Buy |
|
Kenya Reinsurance |
1.8 |
1.8 |
0.5% |
(2.1%) |
1.9 |
2.5 |
10.9% |
48.1% |
0.1x |
Buy |
|
KCB Group*** |
33.9 |
33.0 |
(2.8%) |
(14.1%) |
38.4 |
45.5 |
6.1% |
44.2% |
0.5x |
Buy |
|
NCBA*** |
37.0 |
39.0 |
5.4% |
0.1% |
39.0 |
48.7 |
10.9% |
35.9% |
0.8x |
Buy |
|
CIC Group |
1.9 |
1.8 |
(6.7%) |
(5.2%) |
1.9 |
2.3 |
7.2% |
35.4% |
0.6x |
Buy |
|
Equity Group*** |
44.5 |
45.2 |
1.5% |
0.2% |
45.1 |
56.3 |
8.9% |
33.6% |
0.9x |
Buy |
|
ABSA Bank*** |
12.7 |
12.4 |
(2.8%) |
1.2% |
12.2 |
15.1 |
10.9% |
33.5% |
1.0x |
Buy |
|
Co-op Bank*** |
13.0 |
13.1 |
0.4% |
7.9% |
12.1 |
15.9 |
11.5% |
33.3% |
0.6x |
Buy |
|
I&M Group*** |
20.6 |
20.3 |
(1.5%) |
18.8% |
17.1 |
24.5 |
11.1% |
32.0% |
0.4x |
Buy |
|
Diamond Trust Bank*** |
53.0 |
53.8 |
1.4% |
7.8% |
49.9 |
64.6 |
9.3% |
29.5% |
0.3x |
Buy |
|
Standard Chartered*** |
170.0 |
170.0 |
0.0% |
17.2% |
145.0 |
195.4 |
12.9% |
27.9% |
1.1x |
Buy |
|
Stanbic Holdings |
110.8 |
114.5 |
3.4% |
12.3% |
102.0 |
131.8 |
11.0% |
26.1% |
0.8x |
Buy |
|
HF Group |
3.8 |
3.8 |
0.3% |
21.3% |
3.2 |
4.5 |
0.0% |
16.5% |
0.2x |
Accumulate |
|
*Target Price as per Cytonn Analyst estimates **Upside/ (Downside) is adjusted for Dividend Yield ***For Disclosure, these are stocks in which Cytonn and/or its affiliates are invested in |
||||||||||
We are “Neutral” on the Equities markets in the short term due to the current adverse operating environment and huge foreign investor outflows, and, “Bullish” in the long term due to current cheap valuations and expected global and local economic recovery.
With the market currently trading at a discount to its future growth (PEG Ratio at 0.7x), we believe that investors should reposition towards value stocks with strong earnings growth and that are trading at discounts to their intrinsic value. We expect the current high foreign investors sell-offs to continue weighing down the equities outlook in the short term.
- Industrial Sector
- Rogers Group Limited recorded a Kshs 113.6 mn gain on a bargain purchase acquisition deal
During the week, Rogers Group Limited, a Mauritanian investment group disclosed that it recorded a Kshs 113.6 mn gain in a bargain purchase acquisition deal of Rongai Workshop and Transport Limited, a renowned transport and logistics company in Kenya, through its logistics subsidiary Velogic Limited. A bargain purchase occurs when a company is bought at a price that is less than the fair market value of its net assets, and difference is then recorded as a gain. The Mauritian conglomerate announced that it had completed the acquisition of the trucking company in March 2023, but was yet to disclose the value of the transaction. However notwithstanding, the investment firm has not yet revealed the amount it paid in the transaction. The move by Rogers Group is part of its international development strategy which aims at strengthening its footprint in emerging high growth markets as it reinforces its commitment in positioning itself in buoyant African markets.
Rongai Workshop and Transport Limited is one of the largest road transport company in the country in terms of territorial destinations served, with a long-standing presence in the country tracking 75 years, and boosts of a fleet of 160 vehicles. The acquisition will enable Velogic Limited, which has been operational since 2016 to offer a broader range of logistics services, and to expand its customer base and transport network in the East African region. Additionally, the firm is planning to expand into Rwanda through Rogers Capital, its Finance and Technology segment, further reinforcing the significance of the East African region in its expansion plan and development strategy for exponential growth. Other major trucking firms in the country include; Bollore Logistics, Siginon Global Logistics, DHL, Acceler Global Logistics, Multiple Hauliers, Mitchell Cotts, and Anwaralli Limited among others.
- Turkish Industry Holding committed Kshs 48.0 bn towards construction of Turkish Industry Zone located within Naivasha Industrial Park
During the week, a Turkish based manufacturing conglomerate, Turkish Industry Holdings, committed Kshs 48.0 bn towards the construction of five industries situated within the Naivasha Industrial Park, Mai Mahiu, Nakuru County. The move by the investor comes less than a month after concerns raised by the National Assembly Trade, Industry and Cooperatives Committee over stalled construction at the park which requires Kshs 4.5 bn to become fully operational, and has contributed towards revitalizing investments within the industrial park. The project which is valued at Kshs 90.0 bn, was commissioned by President Uhuru Kenyatta in July 2022 during the official opening of the 1,000-acre Special Economic Zone (SEZ), and consists of six manufacturing industries set across 400 acres within the SEZ. The industries which will be involved in the production of construction, forestry, furniture and cleaning products are planned to be constructed in phases. The expansive complex dubbed, ‘Turkish Industry Zone (TIZ)’ is projected to become fully operational within five years.
Moreover, four other investors have been allocated an additional 60 acres namely; i) Jumbo Holding Limited specializing in motor vehicle assembly and agricultural machinery, ii) Jafrom Limited dealing in construction of cold store materials, iii) Eriksen Limited which is involved in leather and textile production, and, iv) Sino Excellence Limited, a warehousing developer. We anticipate these crucial investments will assist in boosting Foreign Direct Investments (FDIs) into the country as well as set precedence for other local and international investors to invest at the park. This we expect will be fuelled by incentives offered in the SEZ including administrative and tax exemptions, and cheaper power tariffs. However, the lack of sufficient infrastructure such as roads, water and electricity within the industrial park continues to hamper optimum development and investments by hindering investor confidence. Notably, the park has significant potential to provide employment to around 16,000 young people once it is fully operational. This makes it an important initiative in tackling the current unemployment rate, currently standing at 4.9%, as at December 2022.
We expect the project will; i) improve the living standards and quality of life of surrounding residents by creating an estimated 2,860 direct jobs, ii) boost the economy of the country by injecting an estimated USD 530.0 mn (Kshs 716.6 bn) into the Kenyan economy, iii) support the development of the manufacturing industry in Kenya, and iv) advance the government’s industrialization agenda.
- Regulated Real Estate Funds
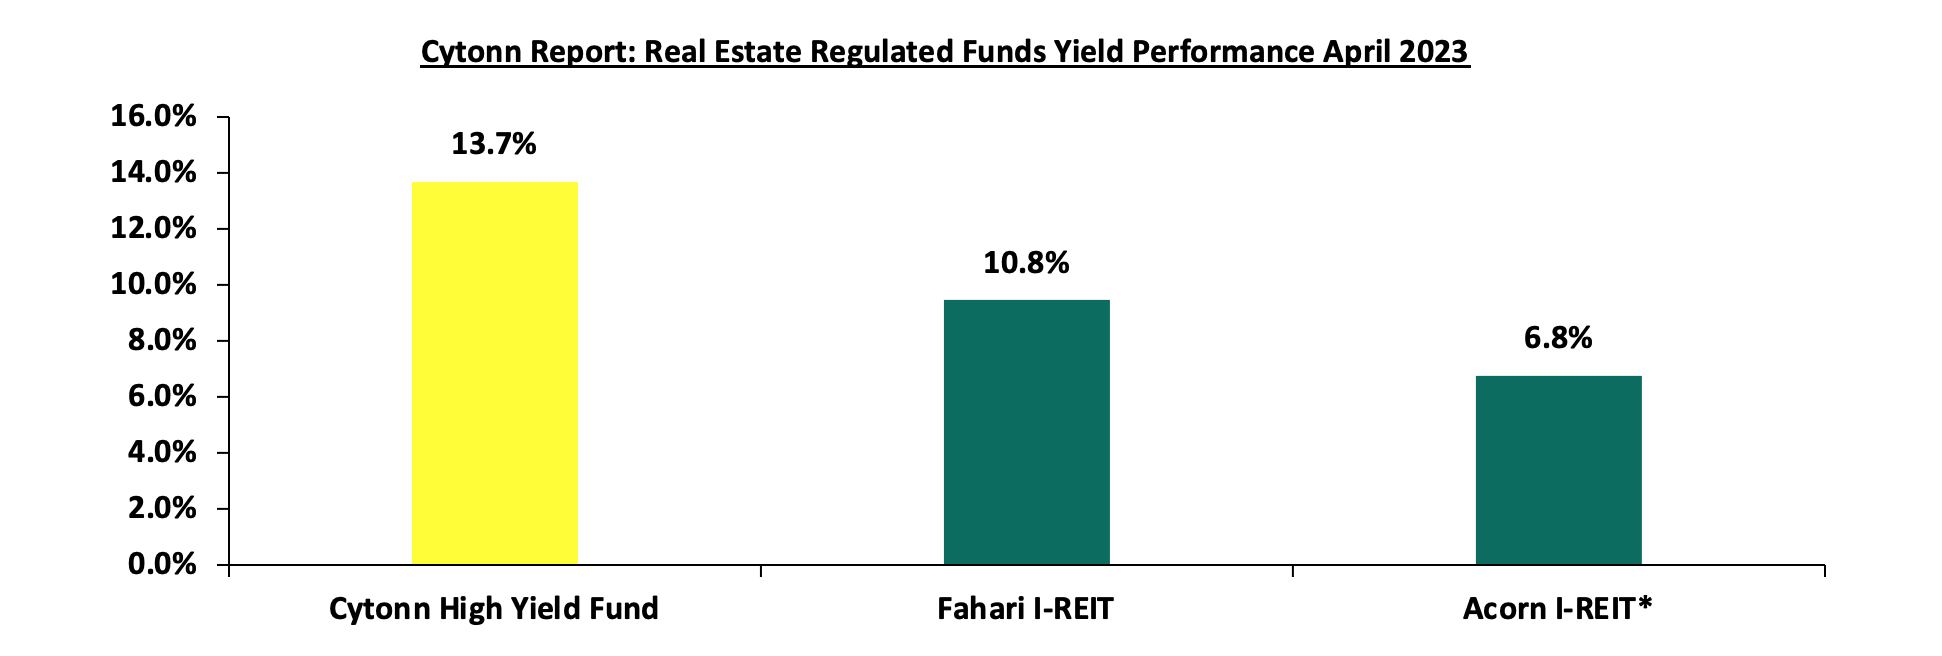
- Real Estate Investment Trusts (REITs)
In the Nairobi Securities Exchange, ILAM Fahari I-REIT closed the week trading at an average price of Kshs 6.04 per share. The performance represented a 0.3% gain from Kshs 6.02 per share recorded the previous week, taking it to a 10.9% Year-to-Date (YTD) decline from Kshs 6.8 per share recorded on 3 January 2023. In addition, the performance represented a 69.8% Inception-to-Date (ITD) loss from the Kshs 20.0 price. The dividend yield currently stands at 10.8%. The graph below shows Fahari I-REIT’s performance from November 2015 to 20 April 2023;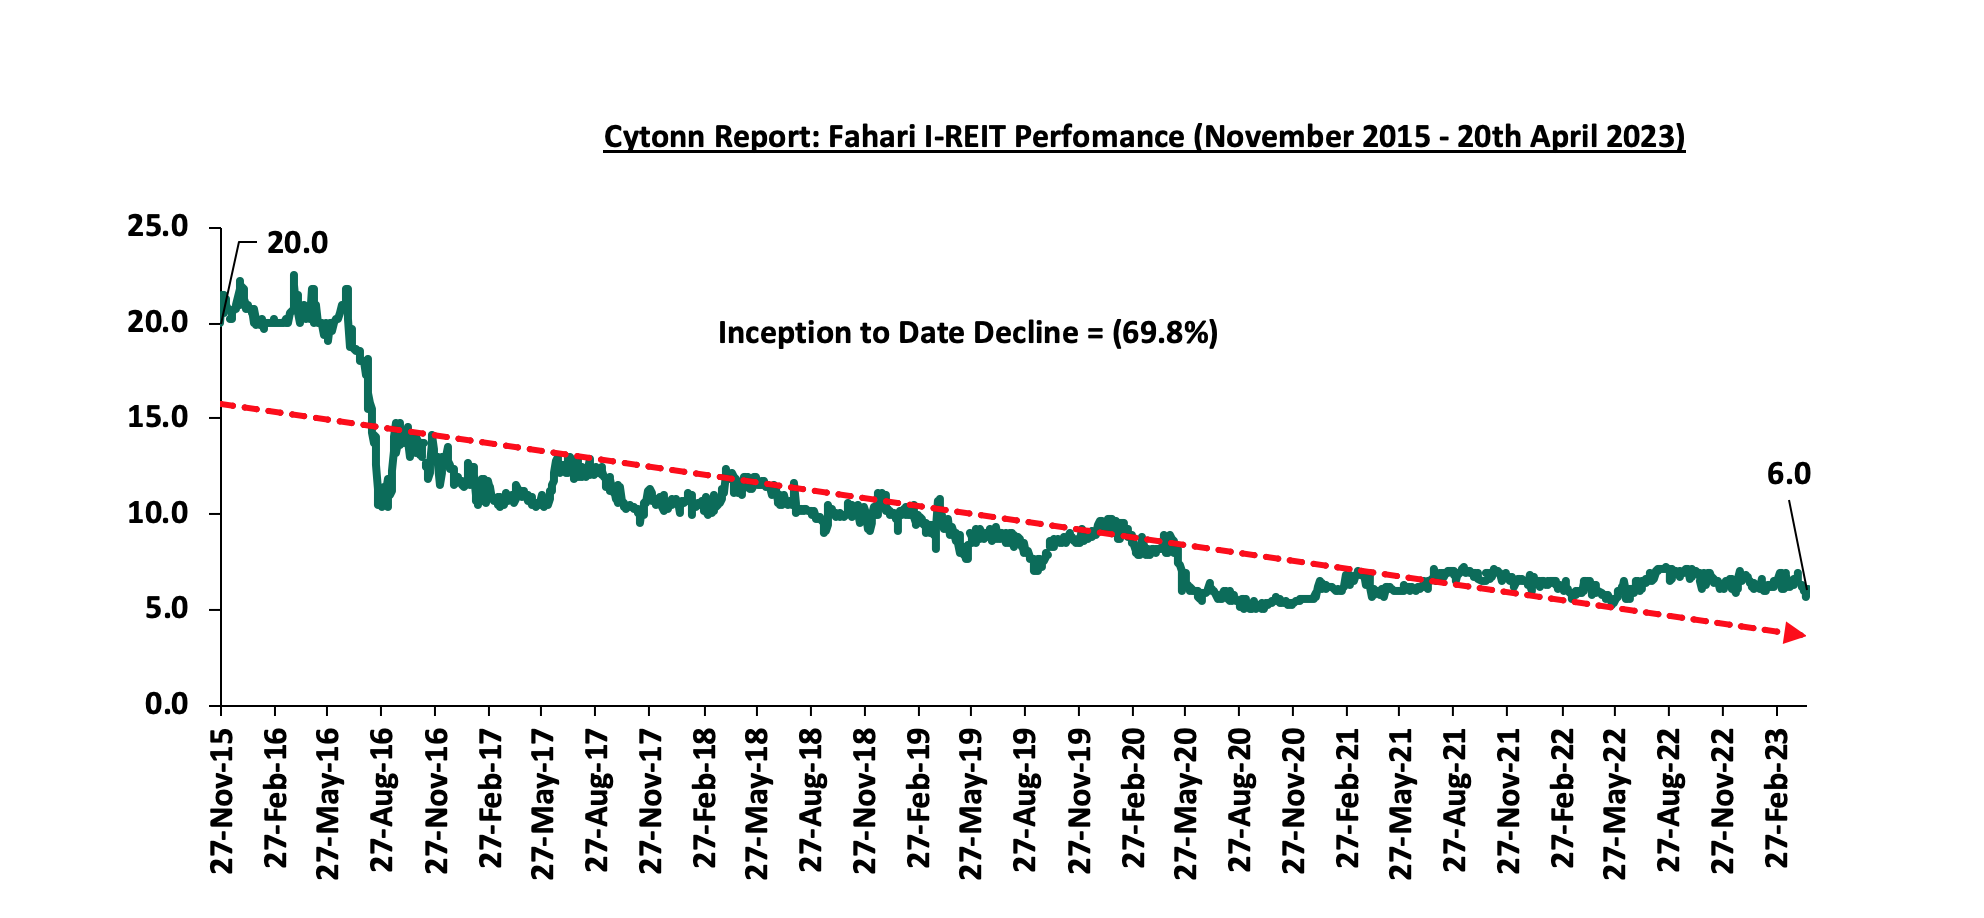
In the Unquoted Securities Platform, Acorn D-REIT and I-REIT traded at Kshs 23.9 and Kshs 20.9 per unit, respectively, as at 20 April 2023. The performance represented a 19.4% and 4.4% gain for the D-REIT and IREIT, respectively, from the Kshs 20.0 inception price. The volumes traded for the D-REIT and I-REIT came in at 12.3 mn and 29.6 mn shares, respectively, with a turnover of Kshs 257.5 mn and Kshs 603.2 mn, respectively, since inception in February 2021.
REITs provide numerous advantages, including; access to more capital pools, consistent and prolonged profits, tax exemptions, diversified portfolios, transparency, liquidity and flexibility as an asset class. Despite these benefits, the performance of the Kenyan REITs market remains limited by several factors such as; i) insufficient investor understanding of the investment instrument, ii) time-consuming approval procedures for REIT creation, iii) high minimum capital requirements of Kshs 100.0 mn for trustees, and, iv) high minimum investment amounts set at Kshs 5.0 mn discouraging investments.
- Cytonn High Yield Fund (CHYF)
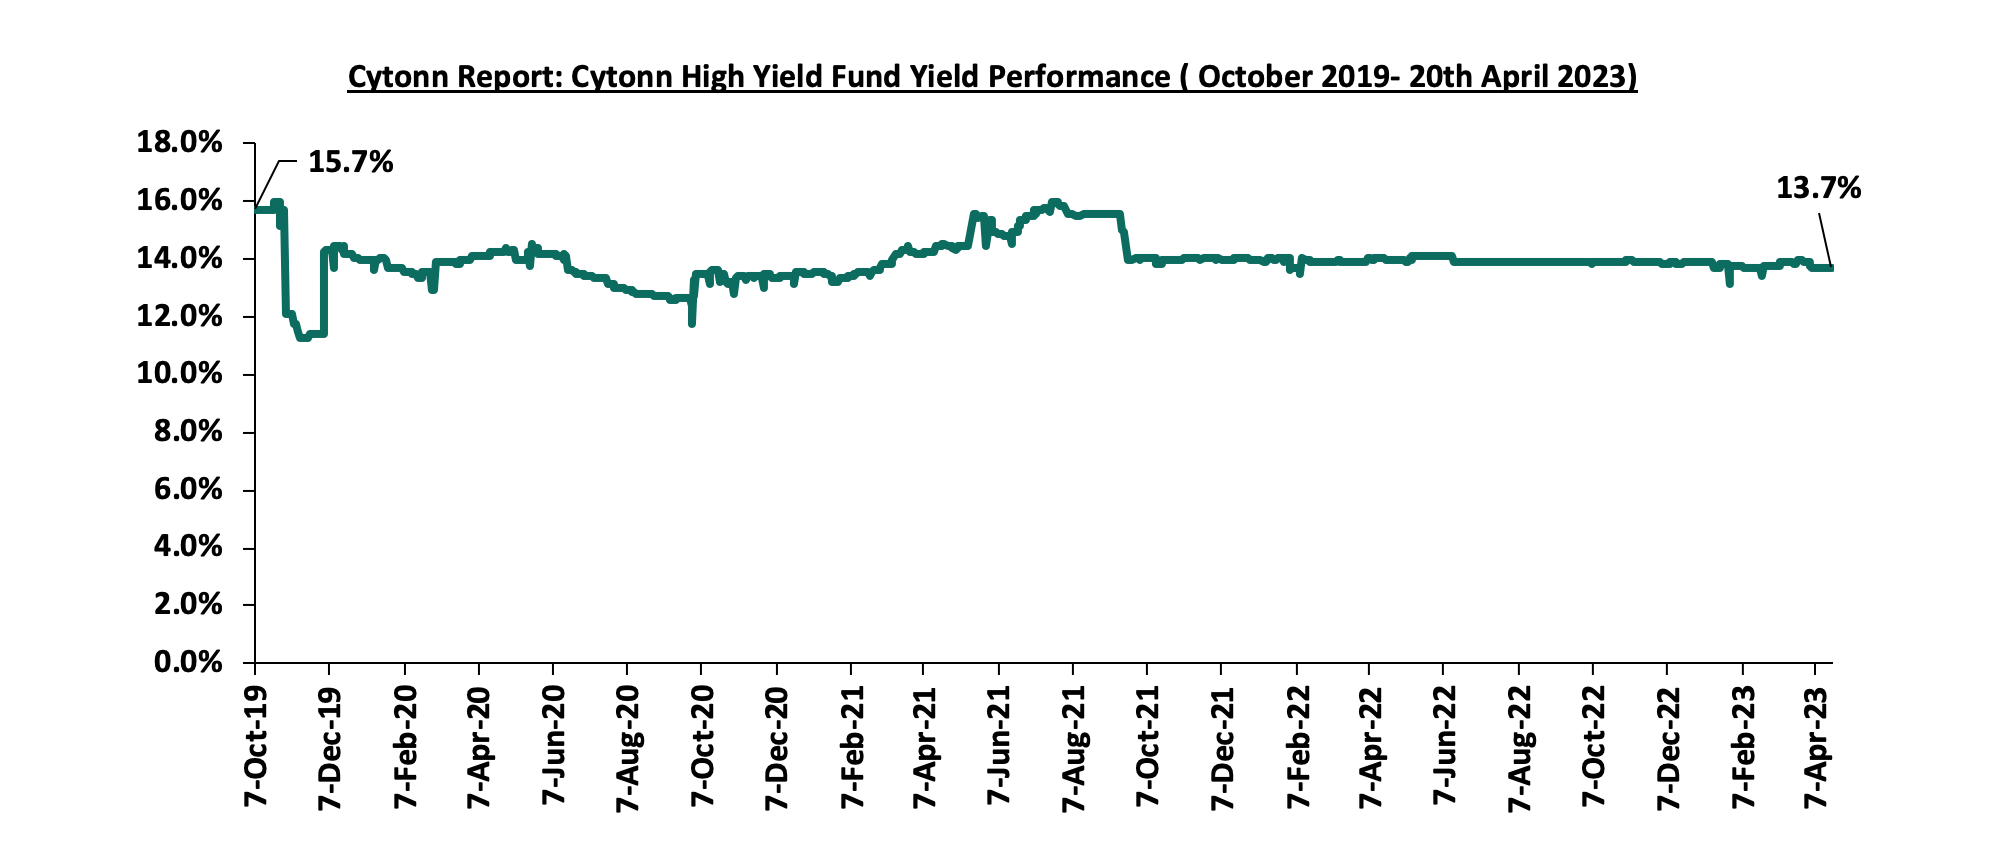
Cytonn High Yield Fund (CHYF) closed the week with an annualized yield of 13.7% remaining relatively unchanged from what was recorded the previous week. The performance also represented a 0.2% points Year-to-Date (YTD) decline from 13.9% yield recorded on 1 January 2023, and 2.0% points Inception-to-Date (ITD) loss from the 15.7% yield. The graph below shows Cytonn High Yield Fund’s performance from November 2015 to 20 April 2023;
Notably, the CHYF has outperformed other regulated Real Estate funds with an annualized yield of 13.7%, as compared to Fahari I-REIT and Acorn I-REIT with yields of 10.8%, and 6.8% respectively. As such, the higher yields offered by CHYF makes the fund one of the best alternative investment resource in the Real Estate sector. The graph below shows the yield performance of the Regulated Real Estate Funds;
*FY’2022
Source: Cytonn Research
We anticipate a sustained upward trend in Kenya's Real Estate sector performance propelled by various factors, including a heightened emphasis on the industrial sector that will broaden the scope for Real Estate opportunities. However, factors such as rising costs of construction due to inflationary pressures, a surplus of physical space in specific sectors, and low investor appetite for REITs are expected to continue subduing the optimal performance of the general Real Estate sector.
Following the release of the FY’2022 results by Kenyan listed banks, the Cytonn Financial Services Research Team undertook an analysis on the financial performance of the listed banks and identified the key factors that shaped the performance of the sector. For the earnings notes of the various banks, click the links below:
- Equity Group FY’2022 Earnings Note;
- KCB Group FY’2022 Earnings Note;
- Standard Chartered Bank Kenya FY’2022 Earnings Note;
- ABSA Bank Kenya FY’2022 Earnings Note;
- NCBA Group FY’2022 Earnings Note;
- Co-operative Bank FY’2022 Earnings Note;
- Diamond Trust Bank Kenya (DTB-K) FY’2022 Earnings Note;
- I&M Group Holdings FY’2022 Earnings Note;
- Stanbic Holdings FY’2022 Earnings Note;
- HF Group FY’2022 Earnings Note;
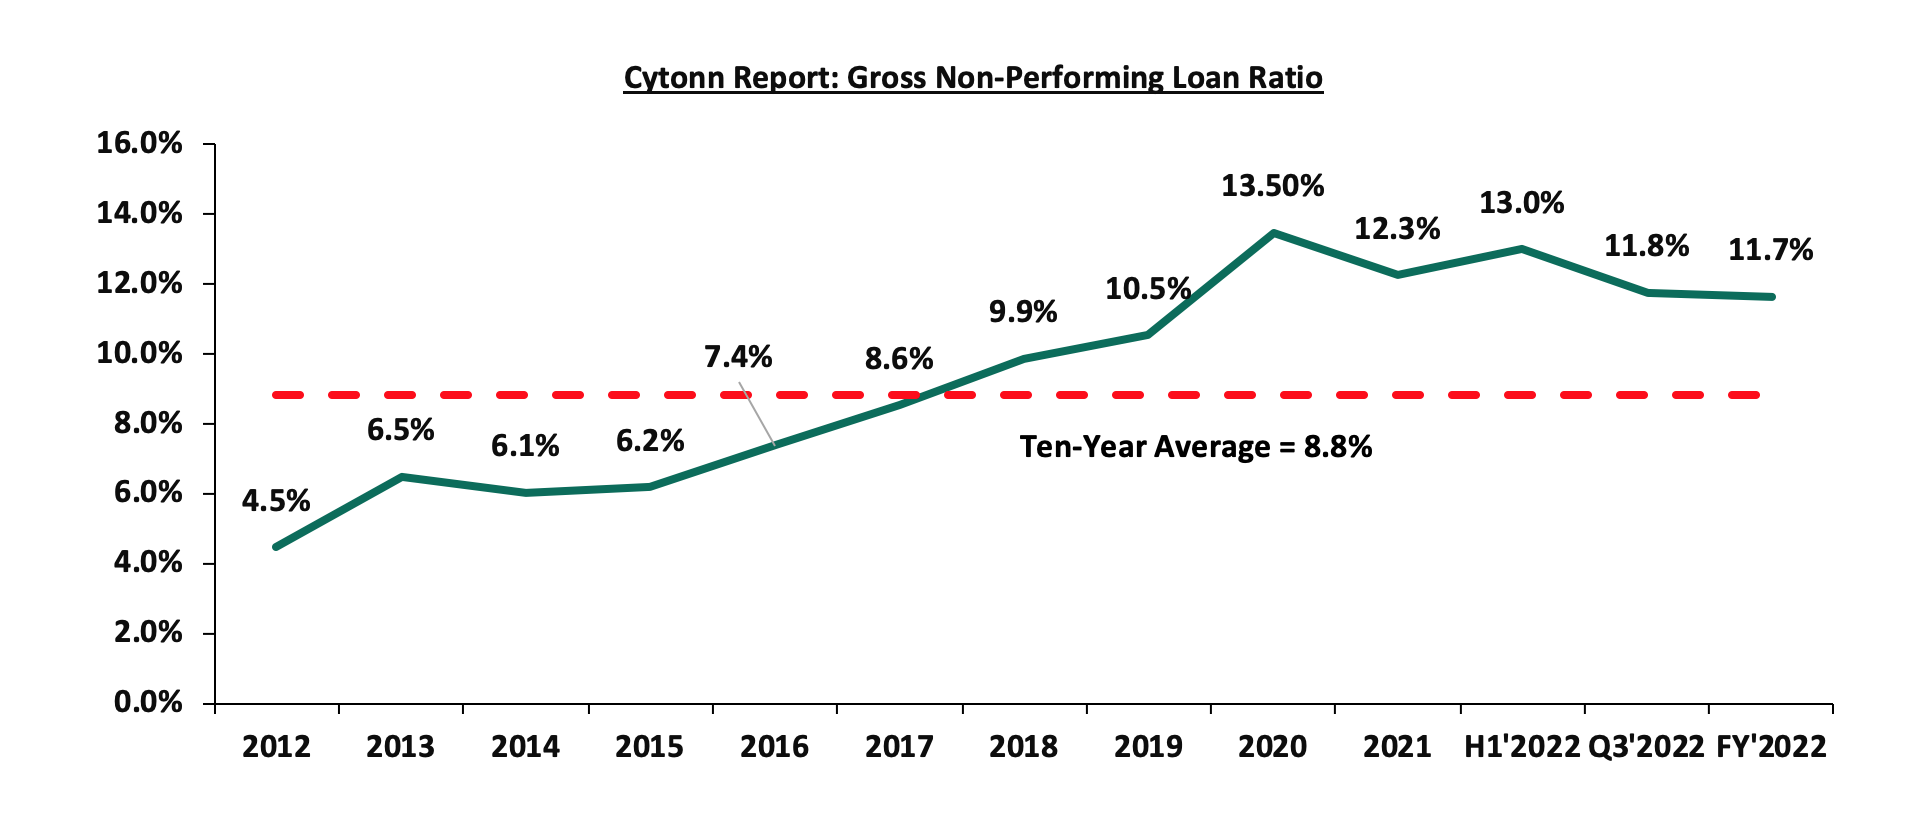
The Core Earnings per Share (EPS) for the listed banks recorded a weighted growth of 26.6% in FY’2022, compared to a weighted growth of 82.9% recorded in FY’2021, indicating the banking sector’s continued resilience despite the tough operating business environment occasioned by elevated inflationary pressures. The performance in FY’2022 was mainly attributable to a 31.6% growth in non-funded income coupled with a 19.2% growth in net interest income. Additionally, the listed banks’ Asset Quality improved with weighted average NPL ratio declining by 0.6% points to 11.7% in FY’2022, from 12.3% in FY’2021. We however note that despite this improvement in the asset quality, the NPL ratio remains higher than the 10-year average of 8.8%.
The report is themed “Banks Maintain Strong Profitability Despite Challenging Business Environment” where we assess the key factors that influenced the performance of the banking sector in FY’2022, the key trends, the challenges banks faced, and areas that will be crucial for growth and stability of the banking sector going forward. As such, we shall address the following:
- Key Themes that Shaped the Banking Sector Performance in FY’2022,
- Summary of the Performance of the Listed Banking Sector in FY’2022,
- The Focus Areas of the Banking Sector Players Going Forward, and,
- Brief Summary and Ranking of the Listed Banks based on the outcome of our analysis.
Section I: Key Themes That Shaped the Banking Sector Performance in FY’2022
Below, we highlight the key themes that shaped the banking sector in FY’2022 which include; regulation, regional expansion through mergers and acquisitions, asset quality and capital raising for onward lending:
- Regulation:
- Risk-based Lending: The Central Bank of Kenya has been working on a risk-based lending model to price loans since the Interest Cap law was repealed in 2019. The model’s main goal is to allow banks to lend in line with the estimated risks of each borrower. Additionally, this is a shift from negative listing of defaulters to a new system of credit score rating that does not deny borrowers credit on the strength of their credit bureau reference scores. The model targets borrowers who are deemed risker with majority operating in micro, small and medium enterprises that have been struggling to access formal credit. Notably, as of November 2022, at least 23 of the banks had their models approved by the CBK, with Equity Bank being the first commercial bank to roll out the risked-based lending. However, the approval rate for the models has been gradual in a bid to avoid causing distress to customers through high interest rates. Additionally, the full implementation has also been slowed down as a result of insufficient data to assess client’s risk profile, and,
- Regulation of Digital Lenders. In March 2022, the Central Bank of Kenya (CBK) gazetted the digital lenders regulationspaving way for the CBK to oversee licensing, governance and lending practices of Digital Credit Providers (DCPs). The regulations focus on addressing public concerns given the significance growth in number of digital lenders as well protecting borrowers from uncharacterized practices of unregulated digital credit providers, particularly their high costs, unethical debt collection practices, and misuse of personal information. Some of the Key take-outs from the regulations include;
-
- Digital Credit Provides (DCPs) shall not invite or collect deposits in any form, including the taking of cash collateral as security for loans, in the course of carrying out digital credit business,
- Lenders are forbidden from sharing customer information with any other person except with the customer’s consent, or seek permission under any written law,
- DCPs are not allowed to submit negative credit information of a customer or any other person to a Credit Reference Bureau where the outstanding amount relating to the credit information does not exceed Kshs 1,000.0, and,
- In a move to combat money laundering, all digital credit providers to issue evidence and sources of funds invested or proposed to be invested in the business and demonstrate that the funds are not proceeds of crime
Since the gazettement of the regulation last year, CBK has received a total of 401 applications, with only 32 DCPS having been licensed as of March 2023, while the other applicants are at different stages of approval process. The application period for licensing elapsed in September 2022 and the authority noted that all unregulated DCPs and those which did not apply for licensing will cease operations.
- Credit Repair Framework: In November 2022, the Central Bank of Kenya (CBK) announced the roll out of a Credit Repair Framework by commercial banks, microfinance banks, and mortgage finance companies. The main objective of the Framework is to improve the credit standing of mobile phones digital borrowers who had been adversely listed with Credit Reference Bureaus (CRBs) for failing to service their mobile loans. The Framework covers loans with a repayment period of 30 day or less, with the institutions expected to provide a discount of at least 50.0% of the non-performing mobile phone digital loans outstanding as at the end of October 2022. This initiative by the CBK has been welcomed by banks with NCBA Group and ABSA Bank disclosing writing off non-performing digital loans amounting to Kshs 11.5 bn and Kshs 1.8 bn, respectively. As such, this is expected to increase access to credit and other financial services by borrowers operating in personal and micro-enterprises sectors which are yet to fully recover from adverse effects the Covid-19 pandemic, and,
- Reinstatement of mobile money and bank account transactions charges: In December 2022, the central Bank of Kenya (CBK) announced the reinstatement of charges for transactions between mobile wallets and bank accounts which were waived in March 2020, as an emergency response to facilitate use of mobile money and reduce handling of hard cash during Covid-19 pandemic period. The reinstatement of the charges took effect on 1 January 2023. Notably, the reintroduced charges have the following elements;
-
- The revised maximum charges for transfers from bank accounts to mobile money wallets reduced by on average up to 61.0%, and mobile money wallet to bank account by on average up to 47.0%,
- Tariffs for pay bills that collect and disburse funds by businesses, companies and institutions were reduced by on average 50.0%, and,
- The charges levied by banks for banks to mobile money transactions were reduced by on average 45.0%.
The following are developments that happened after FY’2022:
- The Central Bank of Kenya announced the issuanceof the Foreign Exchange Code (the FX Code) on 22 March 2023 to commercial banks, in a move to regulate wholesale transactions of the foreign exchange market in Kenya. The measure was in response to the wide variation of exchange rate spread in the market, as discussed in our currency review note. The FX Code aims to promote a robust and transparent foreign currency market through the following reporting guidelines;
- Compliance with FX Code- All market participants (commercial banks and foreign exchange brokers) will be required to conduct a self-assessment and submit to the CBK a report on an institution’s level of compliance with the FX Code by 30 April 2023. Further, all market participants will be required to submit to CBK a detailed compliance implementation plan that is approved by its Board by 30 June 2023, and each participant must be fully compliant with the aforementioned code by 31 December 2023,
- Reporting Mechanism- All market participants will be required to submit a quarterly report to CBK, on the level of compliance to the FX Code within 14 days after the end of every calendar quarter, with the first report due by July 14, 2023,
- In the event of non-compliance, CBK may take appropriate enforcement and other administrative action including monetary penalties as provided for under the Banking Act against any market participant, and,
- Prohibitive Practices- The FX Code is majorly to identify practices that are geared towards market disruptions such as price quotations or manipulating price movements creating artificial delays, or false impression on market depth and liquidity by any market participants will result in heavy penalties. Additionally, market participants are not to engage in position or points parking (artificial transactions to conceal positions or transfer profits or losses).
- Regional Expansion through Mergers and Acquisitions: Kenyan banks are continuously looking at having an extensive regional reach and in FY’2022, there was one completed acquisition done by KCB Group as follows:
On 14 December 2022, KCB Group announcedthat it had completed acquisition of the 85.0% stake in Trust Merchant Bank (TMB), after receiving all the regulatory approvals. This came after KCB Group entered into a definitive agreement with the shareholders of TMB in August 2022 to acquire 85.0% of the shares in the Democratic Republic of Congo (DRC)- based lender, with an option to acquire the remaining stake after two years. This acquisition made KCB Group the second Kenyan banking group to enter the DRC banking market after Equity Group Holdings, with KCB Group now having its presence in seven countries. For this acquisition, KCB Group had not disclosed the actual value of the deal but as highlighted in our Cytonn Weekly 31/2022, KCB Group had cited that they would pay a cash consideration based on the net asset value of TMB at completion of the proposed transaction using a Price to Book (P/B) multiple of 1.5x.
The following are Mergers and Acquisitions that happened after FY’2022:
- On 30 January 2023, the Central Bank of Kenya (CBK) announcedthat Commercial International Bank (Egypt) S.A.E (CIB) had completed acquisition of additional 49.0% shareholding of Mayfair CIB Bank Limited (MBL) at Kshs 5.0 bn following the earlier acquisition of 51.0% stake in MBL announced in April 2020. As such, MBL is now a fully owned subsidiary of CIB,
- On 31 January 2023, Equity Group Holdings PLc, through Equity Bank Kenya Limited (EBKL) announced that it had completed the acquisition of certain assets and liabilities of the troubled local Bank, Spire Bank Limited after obtaining all the required regulatory approvals. The completion of the acquisition followed the Assets and Liabilities Purchase Agreement, which was announced in September 2022, as highlighted in our Cytonn Weekly #37/2022. As such, Equity Bank Kenya Limited took over Spire Banks’s 12 branches as well as all existing depositors in Spire Bank, other than remaining deposits from its largest shareholder, Mwalimu Sacco. For more information, please see our Unit Trust Funds (UTFs) Performance, Q3’2022, &Cytonn Monthly-January 2023, and,
- On 17 March 2023 the Central Bank of Kenya (CBK) announced that Premier Bank Limited Somalia (PBLS) had completed acquisition of 62.5% shareholding of First Community Bank Limited (FCB) effective 27 March 2023. This came after receiving regulatory approvals from the CBK and the Cabinet Secretary for the National Treasury. FCB, which has been in operation since June 2008, is classified as a tier 3 bank in Kenya with 18 branches and a market share of 0.3% as at December 2022. The acquisition by Premier Bank Limited Somalia (PBLS), came at a time when FCB has been struggling to meet regulatory Capital adequacy requirements. For more information, please see our Cytonn Weekly #11/2023, and,
Below is a summary of the deals in the last 9 years that have either happened, been announced or expected to be concluded:
|
Cytonn Report: Summary of Acquisition Deals |
||||||
|
Acquirer |
Bank Acquired |
Book Value at Acquisition (Kshs bn) |
Transaction Stake |
Transaction Value (Kshs bn) |
P/Bv Multiple |
Date |
|
Equity Group |
Spire Bank |
0.01 |
Undisclosed |
Undisclosed |
N/A |
Sep-22* |
|
KCB Group PLC |
Trust Merchant Bank (TMB) |
12.4 |
85.0% |
15.7 |
1.5x |
August-22 |
|
Access Bank PLC (Nigeria) |
Sidian Bank |
4.9 |
83.4% |
4.3 |
1.1x |
June-22* |
|
KCB Group |
Banque Populaire du Rwanda |
5.3 |
100.0% |
5.6 |
1.1x |
August-21 |
|
I&M Holdings PLC |
Orient Bank Limited Uganda |
3.3 |
90.0% |
3.6 |
1.1x |
April-21 |
|
KCB Group** |
ABC Tanzania |
Unknown |
100% |
0.8 |
0.4x |
Nov-20* |
|
Co-operative Bank |
Jamii Bora Bank |
3.4 |
90.0% |
1 |
0.3x |
Aug-20 |
|
Commercial International Bank |
Mayfair Bank Limited |
1.0 |
100.0% |
Undisclosed |
N/D |
May-20* |
|
Access Bank PLC (Nigeria) |
Transnational Bank PLC. |
1.9 |
100.0% |
1.4 |
0.7x |
Feb-20* |
|
Equity Group ** |
Banque Commerciale Du Congo |
8.9 |
66.5% |
10.3 |
1.2x |
Nov-19* |
|
KCB Group |
National Bank of Kenya |
7.0 |
100.0% |
6.6 |
0.9x |
Sep-19 |
|
CBA Group |
NIC Group |
33.5 |
53%:47% |
23.0 |
0.7x |
Sep-19 |
|
Oiko Credit |
Credit Bank |
3.0 |
22.8% |
1 |
1.5x |
Aug-19 |
|
CBA Group** |
Jamii Bora Bank |
3.4 |
100.0% |
1.4 |
0.4x |
Jan-19 |
|
AfricInvest Azure |
Prime Bank |
21.2 |
24.2% |
5.1 |
1.0x |
Jan-18 |
|
KCB Group |
Imperial Bank |
Unknown |
Undisclosed |
Undisclosed |
N/A |
Dec-18 |
|
SBM Bank Kenya |
Chase Bank Ltd |
Unknown |
75.0% |
Undisclosed |
N/A |
Aug-18 |
|
DTBK |
Habib Bank Kenya |
2.4 |
100.0% |
1.8 |
0.8x |
Mar-17 |
|
SBM Holdings |
Fidelity Commercial Bank |
1.8 |
100.0% |
2.8 |
1.6x |
Nov-16 |
|
M Bank |
Oriental Commercial Bank |
1.8 |
51.0% |
1.3 |
1.4x |
Jun-16 |
|
I&M Holdings |
Giro Commercial Bank |
3.0 |
100.0% |
5.0 |
1.7x |
Jun-16 |
|
Mwalimu SACCO |
Equatorial Commercial Bank |
1.2 |
75.0% |
2.6 |
2.3x |
Mar-15 |
|
Centum |
K-Rep Bank |
2.1 |
66.0% |
2.5 |
1.8x |
Jul-14 |
|
GT Bank |
Fina Bank Group |
3.9 |
70.0% |
8.6 |
3.2x |
Nov-13 |
|
Average |
78.9% |
1.2x |
||||
|
* Announcement Date ** Deals that were dropped |
||||||
In 2022 the acquisition valuations for banks dropped to 1.2x from 1.3x recorded in 2021. As such, the valuations still remain low compared to historical prices paid as highlighted in the chart below;
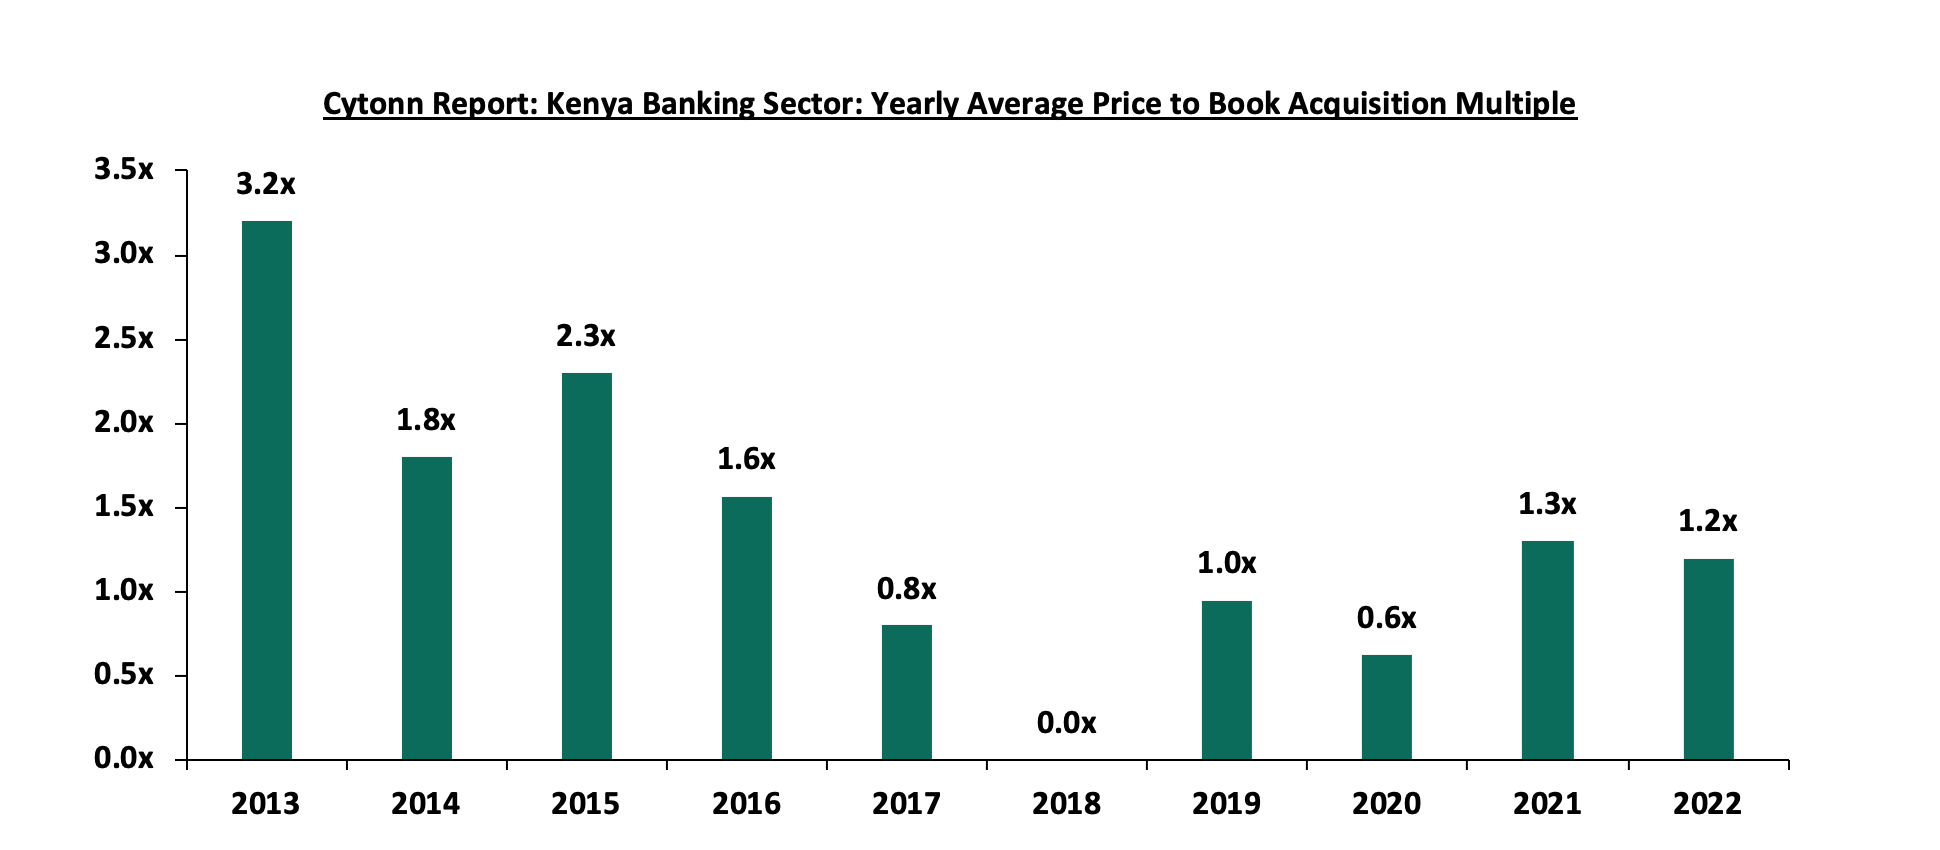
As at the end of FY’2022, the number of commercial banks in Kenya stood at 38, same as in FY’2021 but lower than 43 licensed banks in FY’2015, respectively. The ratio of the number of banks per 10 million populations in Kenya now stands at 6.7x, which is a reduction from 9.0x in FY’2015 demonstrating continued consolidation in the banking sector. However, despite the ratio improving, Kenya still remains overbanked as the number of banks remains relatively high compared to the African major economies. To bring the ratio to 5.5x, we ought to reduce the number of banks from the current 38 banks to 32 banks. For more on this see our topical.
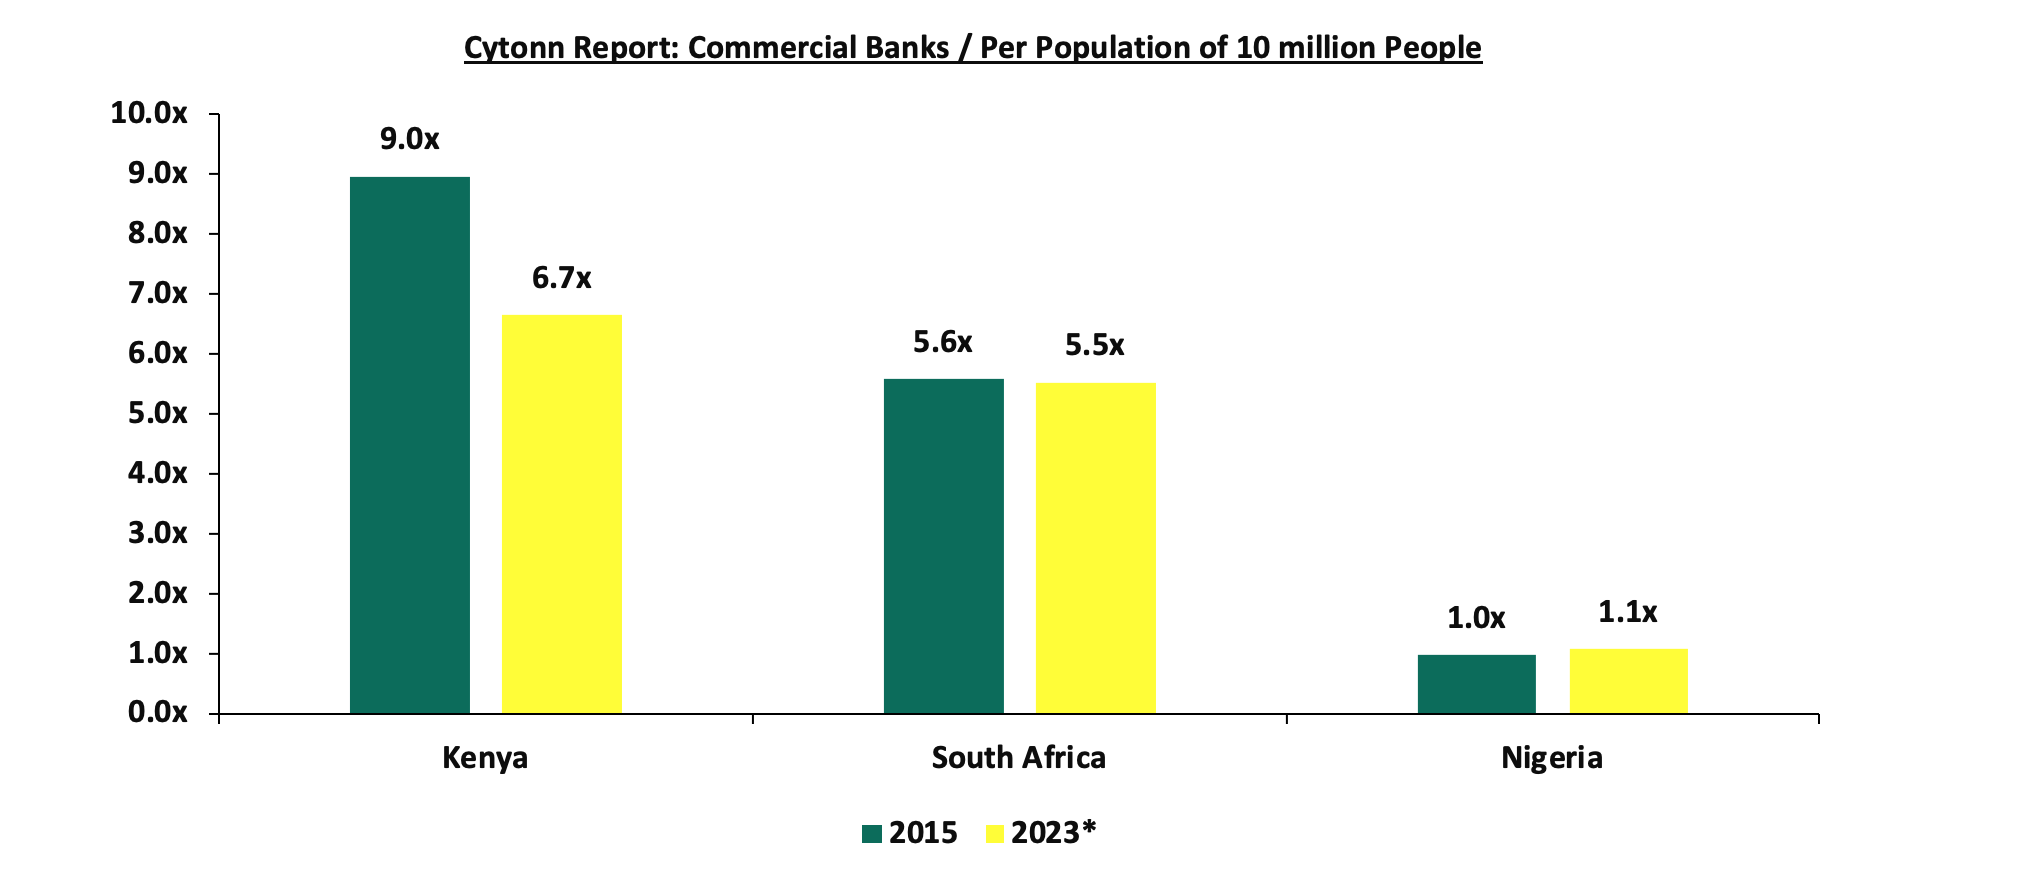
Source: World Bank, Central Bank of Kenya, South Africa Reserve Bank, Central Bank of Nigeria; * Data as of March 2023
- Asset Quality: Asset quality for listed banks improved in FY’2022, with the weighted average Gross Non-Performing Loan ratio (NPL) declining by 0.6% points to 11.7%, from 12.3% recorded in FY’2021. However, the performance remained 2.9% points above the ten-year average of 8.8%. The improvement in asset quality in FY’2022 was mainly driven by 3.0% points decline in NCBA Group’s NPL ratio to 13.0% in FY’2022, from 16.0% in FY’2021 coupled with 1.8% points decline in Standard Chartered Bank- Kenya NPL ratio to 14.2% from 16.0% in FY’2022. The significant improvement in NCBA Group’s asset quality was mainly attributable to an 11.7% decline in gross non-performing loans to Kshs 39.1 bn in FY’2022 from Kshs 44.3 bn in FY’2021 coupled with a 9.1% increase in gross loans to Kshs 301.8 bn in FY’2022 from 276.7 bn in FY’2021. However, the improvement in asset quality was weighed down by 0.7% points increase in Stanbic bank’s NPL ratio to 10.0% from 9.3% in FY’2021, attributable to 26.4% increase in Gross non-performing loans to Kshs 28.4 bn, from Kshs 22.5 bn in FY’2021. A total of seven out of the ten listed Kenyan banks recorded improvement in asset quality, despite the deterioration of the general business environment which was evidenced by the average Purchasing Managers Index coming at 49.2 in FY’2022, 1.6 points lower than the average of 50.8 recorded in 2021. However, according to the March 2023 MPC Press Release, the NPL ratio for the entire banking sector stood at 13.3% in December 2022, a 0.2% points increase from 13.1% recorded in December 2021, signifying a deterioration in asset quality of the sector FY’2022. Going forward, we expect credit risk to remain elevated in the short term mainly as a result of the sustained inflationary pressures reflected in deterioration of general business environment in Q1’2023, with the average Purchasing Manager’s Index in the quarter coming in at 49.3, compared to 50.3 recorded in a similar period in 2022, on the back of elevated commodity prices, which have resulted in reduced consumer spending. The chart below highlights the asset quality trend for the listed banks:
The table below highlights the asset quality for the listed banking sector:
|
Cytonn Report: Listed Banks Asset Quality |
||||||
|
|
FY'2022 NPL Ratio* |
FY'2021 NPL Ratio** |
% point change in NPL Ratio |
FY'2022 NPL Coverage* |
FY'2021 NPL Coverage** |
% point change in NPL Coverage |
|
ABSA |
7.5% |
7.9% |
(0.4%) |
80.5% |
77.7% |
2.8% |
|
Equity |
8.4% |
8.6% |
(0.2%) |
70.5% |
68.7% |
1.8% |
|
I&M |
9.7% |
9.5% |
0.2% |
71.9% |
71.4% |
0.5% |
|
Stanbic |
10.0% |
9.3% |
0.7% |
63.1% |
58.1% |
5.0% |
|
DTB-K |
12.0% |
12.9% |
(0.9%) |
46.3% |
41.8% |
4.5% |
|
NCBA |
13.0% |
16.0% |
(3.0%) |
58.5% |
73.6% |
(15.1%) |
|
Co-op |
14.0% |
14.6% |
(0.6%) |
65.1% |
62.6% |
2.5% |
|
SCB-K |
14.2% |
16.0% |
(1.8%) |
87.1% |
84.4% |
2.7% |
|
KCB |
17.0% |
16.6% |
0.4% |
52.4% |
52.9% |
(0.5%) |
|
HF |
19.7% |
21.1% |
(1.4%) |
78.8% |
73.6% |
5.2% |
|
Mkt Weighted Average |
11.7% |
12.3% |
(0.6%) |
67.4% |
65.5% |
1.9% |
|
*Market cap weighted as at 20/04/2022 |
||||||
|
**Market cap weighted as at 14/04/2021 |
||||||
Key take-outs from the table include;
- Asset quality for the listed banks improved during the year, with market weighted average NPL ratio declining by 0.6% points to 11.7%, from 12.3% in FY’2021. The improvement was largely driven by an improvement in NCBA Group’s, Standard Chartered Bank Kenya’s and HF Group’s asset quality with their NPL ratios declining by 3.0%, 1.8% and 1.4%% points to 13.0%, 14.2% and 19.7% respectively in FY’2022, from 16.0%, 16.0%, and 21.1%, respectively in FY’2021,
- Stanbic Bank had the highest NPL Ratio jump by 0.7% to 10.0% in FY’2022 from 9.3% in FY’2021, attributable to 26.4% increase in Gross non-performing loans to Kshs 28.4 bn, from Kshs 22.5 bn in FY’2021, which outpaced the 17.5% increase in gross loans to Kshs 284.8 bn, from Kshs 242.4 bn recorded in FY’2021,
- NCBA Group recorded the highest improvement in its asset quality with the NPL ratio declining by 3.0% points to 13.0% from 16.0% recoded in FY’2021. The improvement in asset quality was mainly attributable to an 11.7% decline in gross non-performing loans to Kshs 39.1 bn in FY’2022 from Kshs 44.3 bn in FY’2021 coupled with a 9.1% increase in gross loans to Kshs 301.8 bn in FY’2022 from 276.7 bn in FY’2021, and,
- Market weighted average NPL Coverage for the listed banks increased by 1.9% points to 67.4% in FY’2022, from 65.5% recorded in FY’2021, majorly on the back of increased NPL coverage recorded Co-operative Bank of Kenya, HF Group and Stanbic Holdings of 6.7%, 5.2% and 5.0% respectively. However, NCBA Group’s NPL coverage declined by 15.1% points to 58.5% in FY’2022 from 73.6% in FY’2021, owing to a decline of 36.1% in General Loan Loss Provisions to Kshs 15.6 bn, from Kshs 24.4 bn in FY’2021, an indication of reducing credit risk in the bank loan portfolio.
- Capital Raising: In FY’2022, listed banks continued to borrow from international institutions to not only strengthen their capital positions but also boost their ability to lend to the perceived riskier Micro Small and Medium Sized Enterprises (MSMEs) segment. In the period under review;
-
- Equity Group received USD 165.0 mn (Kshs 18.6 bn) facility from the International Finance Corporation (IFC) to Equity Bank Kenya in January 2022. For more information see our Weekly #19/2022,
- The International Finance Corporation (IFC) disclosed a USD 150.0 mn (Kshs 18.0 bn) credit facility to KCB Group in form of a senior unsecured loan with a maturity of 7-years and a grace period of 2-years. The credit facility was aimed at supporting the growth of the bank’s climate finance portfolio which entails clients in sectors such as manufacturing, real estate and agriculture. For more information please see our Cytonn Monthly-August 2022, and,
- The International Finance Corporation (IFC) disclosedthat it would extend USD 100.0 mn (Kshs 12.2 bn) to Diamond Trust Bank (DTB) under the WCS COVID-19 FIGE response facility in form of a senior debt investment with 24-month maturity and renewable once on an aggregate of up to 36 months. For more information, please see our Cytonn Weekly #46/2022.
Section II: Summary of the Performance of the Listed Banking Sector in FY’2022:
The table below highlights the performance of the banking sector, showing the performance using several metrics, and the key take-outs of the performance;
|
Cytonn Report: Listed Banks Performance in FY’2022 |
|||||||||||||
|
Bank |
Core EPS Growth |
Interest Income Growth |
Interest Expense Growth |
Net Interest Income Growth |
Net Interest Margin |
Non-Funded Income Growth |
NFI to Total Operating Income |
Growth in Total Fees & Commissions |
Deposit Growth |
Growth in Government Securities |
Loan to Deposit Ratio |
Loan Growth |
Return on Average Equity |
|
HF Group |
138.9% |
8.8% |
0.7% |
18.2% |
5.0% |
63.5% |
28.9% |
(1.9%) |
5.5% |
30.4% |
91.2% |
4.6% |
3.1% |
|
DTB-K |
53.9% |
18.2% |
23.5% |
14.5% |
5.3% |
43.5% |
28.3% |
19.9% |
16.9% |
5.8% |
66.5% |
15.1% |
10.0% |
|
NCBA |
34.8% |
12.7% |
11.5% |
13.5% |
5.9% |
36.8% |
49.7% |
5.0% |
7.0% |
4.8% |
55.5% |
14.3% |
17.2% |
|
I&M |
34.3% |
12.9% |
18.0% |
9.9% |
6.3% |
45.7% |
35.7% |
20.7% |
5.3% |
(9.9%) |
76.4% |
13.3% |
15.3% |
|
ABSA |
34.2% |
27.5% |
25.9% |
27.9% |
8.2% |
17.2% |
29.7% |
0.3% |
13.0% |
0.7% |
93.4% |
21.1% |
24.3% |
|
SCB-K |
34.0% |
14.3% |
(6.5%) |
18.1% |
7.0% |
13.5% |
34.6% |
(17.7%) |
5.1% |
10.6% |
50.0% |
10.7% |
22.1% |
|
CO-OP |
33.2% |
10.9% |
11.0% |
10.9% |
8.9% |
32.7% |
36.1% |
32.7% |
3.9% |
(5.9%) |
80.1% |
9.4% |
21.2% |
|
Stanbic |
25.7% |
27.3% |
15.2% |
31.8% |
5.9% |
23.7% |
40.9% |
(0.5%) |
19.5% |
42.9% |
87.8% |
16.4% |
15.3% |
|
KCB |
19.5% |
15.3% |
27.1% |
11.5% |
7.5% |
39.8% |
33.3% |
18.6% |
35.6% |
2.7% |
76.0% |
27.8% |
22.0% |
|
Equity |
15.1% |
26.8% |
31.7% |
25.0% |
7.2% |
34.5% |
41.1% |
26.2% |
9.7% |
(4.1%) |
67.2% |
20.2% |
26.7% |
|
FY'22 Mkt Weighted Average* |
26.6% |
19.7% |
20.1% |
19.2% |
7.2% |
31.6% |
37.7% |
13.8% |
13.7% |
3.1% |
71.8% |
18.1% |
21.8% |
|
FY'21 Mkt Weighted Average** |
82.9% |
13.8% |
11.5% |
15.2% |
7.1% |
10.9% |
34.7% |
16.6% |
13.5% |
18.1% |
69.7% |
13.5% |
20.2% |
|
*Market cap weighted as at 20/04/2023 |
|||||||||||||
|
**Market cap weighted as at 14/04/2021 |
|||||||||||||
Key takeaways from the table include:
- The listed banks recorded a 26.6% growth in core Earnings per Share (EPS) in FY’2022, compared to the weighted average growth of 82.9% in FY’2021, an indication of sustained performance despite the tough operating environment experienced in FY’2022. The performance during the period was mainly driven by a 31.6% weighted average growth in non-funded income coupled with a 19.2% weighted average growth in net interest income,
- The listed banks continued to implement their revenue diversification strategies as evidenced by non-funded income weighted average growth of 31.6% in FY’2022 compared to a weighted average growth of 10.9% recoded in FY’2021. The performance was largely supported by increase in foreign exchange income recorded by the banks during the year as a result of increased dollar demand in the country,
- Listed banks investments in government securities slowed down in FY’2022 having recorded a market weighted average growth of 3.1% compared to a 18.1% growth recorded in FY’2021. The slowed growth of investment in Kenya government securities was partly attributable to the increased perceived risk of default by the government coupled with high debt sustainability concerns given the current high public debt stock as well as the upcoming Eurobond maturity in the next fiscal year,
- The listed banks Net loans and advances to customers recorded a weighted average growth of 18.1% in FY’2022 compared to 13.5% in FY’2021, an indication of increased lending despite the elevated credit risk,
- Interest income recorded a weighted average growth of 19.7% in FY’2022, compared to 13.8% in FY’2021. Similarly, interest expenses recorded a market weighted average growth of 20.1% in FY’2022 compared to a growth of 11.5% in FY’2022. As such, the net interest income recorded a weighted average growth of 19.2% in FY’2022 compared to 15.2% in FY’2022,
The listed banks recorded a 21.8% weighted average Return on average Equity (RoaE), 1.6% points higher than the 20.2% weighted average recorded in FY’2021. Additionally, the entire banking sector’s Return On Equity (ROE) recorded6% points increase to 25.2% in FY’2022, from 21.6% recorded in FY’2021. As such, the Kenyan banking sector continues to record high profitability compared to other economies in the world as highlighted in the chart below: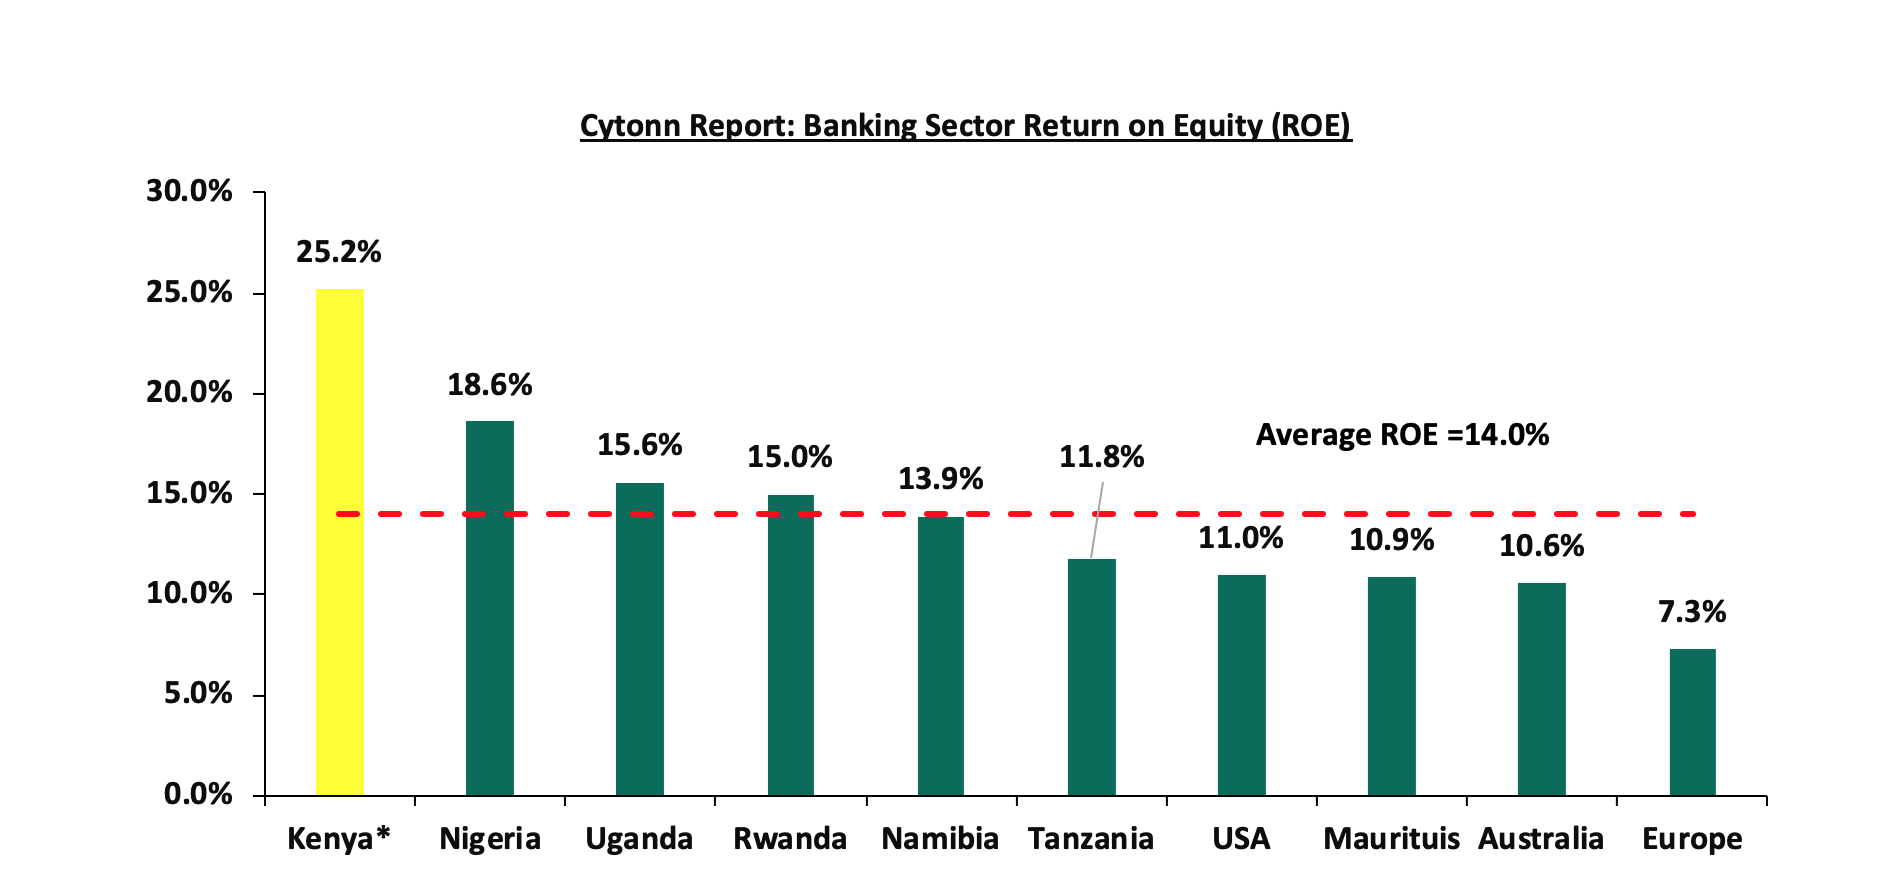
Source: Online research, * Figure as of FY’2022
Section III: Outlook of the banking sector:
The banking sector continue to remain resilient despite the tough operating environment occasioned by elevated inflationary pressures, as evidenced by the increase in their profitability, with the Core Earnings Per Share (EPS) growing by 26.6%, majorly supported by the continued diversification of revenue by banks. However, we expect profitability to be weighed down in the short to medium term as a result of expected increase in provisioning aimed at cushioning banks from the elevated credit risk arising from persistent inflationary pressures. As such, we expect the future performance of the banking sector to be mainly supported by the following key factors:
- Growth in Interest income: Going forward, we expect interest income growth to remain a key driver in the banking industry, evidenced by the weighted average growth of 19.7% in FY’2022, compared to 13.8% recorded in FY’2021. Additionally, the continued approval of banks risk-based lending models, will be enable banks to effectively price their risk, expand loan books and consequently increase the interest income,
- Revenue Diversification: In FY’2022, Non-Funded Income (NFI) recorded a 31.6% weighted average growth compared to a 10.9% weighted growth in FY’2021, with many banks diversifying their revenue sources. Consequentially, weighted average contribution of NFI contribution to total operating income came at 37.7% in FY’2022, 3.0% points higher than 34.7% weighted average growth contribution recorded in FY’2021. As such, there exists an opportunity for the sector to further increase NFI contribution to revenue given the continuous adoption of digitization. Additionally, the reinstatement of charges for transactions between bank accounts and mobile money wallets is also expected to continue spurring NFI growth due to the increased adoption of digital channels, and,
- Regional Expansion and Further Consolidation: Consolidation remains a key theme going forward with the current environment offering opportunities for well capitalized banks to expand and take advantage of the market's low valuations, as well as further consolidate out smaller and less capitalized banks. Notably, majority of the bigger banks have continued to cushion over unsystematic risks specific to the local market by expanding their operations into other African nations. Banks such as KCB and Equity Group have been leveraging on expansion and consolidation which has largely contributed to their increased asset base as well as earnings growth. As such, we expect to see continued expansion trend aimed at revenue optimization. Additionally, Ethiopian government opened up the financial sector to foreign investors which provide a great opportunity for Kenyan banks to expand their operations into the untapped market.
Section IV: Brief Summary and Ranking of the Listed Banks:
As per our analysis on the banking sector from a franchise value and a future growth opportunity perspective, we carried out a comprehensive ranking of the listed banks. For the franchise value ranking, we included the earnings and growth metrics as well as the operating metrics shown in the table below in order to carry out a comprehensive review of the banks:
|
Cytonn Report: Listed Banks Earnings, Growth and Operating Metrics |
||||||||
|
Bank |
Loan to Deposit Ratio |
Cost to Income (With LLP) |
Return on Average Capital Employed |
Deposits/ Branch (bn) |
Gross NPL Ratio |
NPL Coverage |
Tangible Common Ratio |
Non Funded Income/Revenue |
|
ABSA Bank |
93.4% |
54.7% |
34.7% |
3.7 |
7.5% |
80.5% |
13.2% |
29.7% |
|
NCBA Group |
55.5% |
62.2% |
28.1% |
5.0 |
13.0% |
58.5% |
12.5% |
49.7% |
|
Equity Bank |
67.2% |
59.0% |
34.7% |
3.0 |
8.4% |
70.5% |
11.4% |
41.1% |
|
KCB Group |
76.0% |
55.9% |
30.8% |
2.3 |
17.0% |
52.4% |
11.7% |
33.3% |
|
SCBK |
50.0% |
49.7% |
31.3% |
8.7 |
14.2% |
87.1% |
13.8% |
34.6% |
|
Coop Bank |
80.1% |
59.3% |
28.3% |
2.3 |
14.0% |
65.1% |
16.9% |
36.1% |
|
Stanbic Bank |
87.7% |
62.1% |
20.5% |
10.1 |
10.0% |
63.1% |
13.3% |
40.9% |
|
DTBK |
65.5% |
69.1% |
14.0% |
3.0 |
12.0% |
46.3% |
12.9% |
28.3% |
|
I&M Holdings |
76.4% |
59.8% |
20.5% |
3.8 |
9.7% |
71.9% |
16.2% |
35.7% |
|
HF Group |
91.2% |
91.6% |
2.2% |
1.8 |
19.7% |
78.8% |
14.9% |
28.9% |
|
Weighted Average FY’2022 |
71.8% |
58.0% |
30.0% |
4.2 |
11.7% |
67.4% |
13.1% |
37.7% |
|
Market cap weighted as at 20/04/2022 |
||||||||
The overall ranking was based on a weighted average ranking of Franchise value (accounting for 60.0%) and intrinsic value (accounting for 40.0%). The Intrinsic Valuation is computed through a combination of valuation techniques, with a weighting of 40.0% on Discounted Cash-flow Methods, 35.0% on Residual Income and 25.0% on Relative Valuation, while the Franchise ranking is based on banks operating metrics, meant to assess efficiency, asset quality, diversification, and profitability, among other metrics. The overall FY’2022 ranking is as shown in the table below:
|
Cytonn Report: Listed Banks FY’2022 Rankings |
|||||
|
Bank |
Franchise Value Rank |
Intrinsic Value Rank |
Weighted Rank |
FY'2021 |
FY’2022 |
|
ABSA |
1 |
4 |
2.8 |
4 |
1 |
|
Equity Group Holdings Ltd |
4 |
3 |
3.4 |
4 |
2 |
|
KCB Group Plc |
7 |
1 |
3.4 |
3 |
3 |
|
Co-operative Bank of Kenya Ltd |
3 |
5 |
4.2 |
2 |
4 |
|
I&M Holdings |
2 |
6 |
4.4 |
1 |
5 |
|
NCBA Group Plc |
8 |
2 |
4.4 |
8 |
6 |
|
SCBK |
5 |
8 |
6.8 |
6 |
7 |
|
Stanbic Bank/Holdings |
6 |
9 |
7.8 |
7 |
8 |
|
DTBK |
9 |
7 |
7.8 |
9 |
9 |
|
HF Group Plc |
10 |
10 |
10 |
10 |
10 |
Major Changes from the FY’2022 Ranking are:
- ABSA Bank’s rank improved to position 1 in FY’2022 from position 4 in FY’2021, majorly driven by a strong franchise score driven by improvement in the Bank’s management quality with Cost to income ratio with LLPs declining by 3.2% to 54.7% in FY'2022, from 57.9% in FY'2021 while Cost to income ratio without LLPs declined by 4.5% points to 40.6% in FY’2022, from 45.1% in FY’2021. Additionally, the Bank’s Asset quality improved with the NPL ratio declining to 7.5%, from 7.9% in FY’2021,
- NCBA Group’s rank improved to position 6 in FY’2022, from position 8 H1’2022, mainly attributable to 3.0% points decline in the Group’s NPL ratio to 13.0%, from 16.0% recorded in FY’2021 as well as an increase in the Group’s Return on Average Equity to 17.2%, from 13.6% in FY’2021. Additionally, the Group’s Net Interest Margin increased to 5.9%, from the 5.7% recorded in FY’2021, and,
- I&M Group’s rank declined to position 5 in FY’2022, from position 1 in FY’2021, mainly due to a deterioration in the Group’s asset quality, as the Gross NPL ratio rose to 9.7%, from the 9.5% recorded in FY’2021.
For more information, see our Cytonn FY’2022 Listed Banking Sector Review
Disclaimer: The views expressed in this publication are those of the writers where particulars are not warranted. This publication, which is in compliance with Section 2 of the Capital Markets Authority Act Cap 485A, is meant for general information only and is not a warranty, representation, advice or solicitation of any nature. Readers are advised in all circumstances to seek the advice of a registered investment advisor.

- Talk to us
- Kenya
- P.O Box 20695 - 00200, Nairobi, Kenya
- Cell +254709101200
- Tel +254709101200
- WhatsApp +254741676635
- United States
- +254709101200
- DOWNLOAD OUR APP
-


- Kenya
- 8th Floor, Pinetree Plaza, Kaburu Drive, Ngong Road, Nairobi, Kenya
- USA
- Suite 1150, 1775 Eye Street NW, USA, Washington DC 20006, USA
- Investments
- High Yield
- Private Equity
- Real Estate
- Real Estate
- RiverRun Estates
- Cytonn Towers
- The Ridge
- Taraji Heights
- The Alma