Kenya’s Listed Banks H1’2023 Report, & Cytonn Weekly #38/2023
By Research Team, Sep 24, 2023
Executive Summary
Fixed Income
During the week, T-bills were undersubscribed for the second consecutive week, with the overall subscription rate coming in at 84.1%, from the undersubscription rate of 92.1% recorded the previous week. Investors’ preference for the shorter 91-day paper persisted, with the paper receiving bids worth Kshs 16.1 bn against the offered Kshs 4.0 bn, translating to an oversubscription rate of 401.7%, albeit lower than the subscription rate of 450.0% recorded the previous week. The subscription rate for the 364-day paper decreased to 25.3% from 34.1% recorded the previous week, while that of the 182-day paper increased to 15.8% from 7.0% recorded the previous week. The government accepted a total of Kshs 18.8 bn worth of bids out of Kshs 20.2 bn of bids received, translating to an acceptance rate of 93.1%. The yields on the government papers were on an upward trajectory, with the yields on the 364-day, 182-day and 91-day papers increasing by 43.9 bps, 52.5 bps and 27.2 bps to 15.2%, 14.9% and 14.8%, respectively;
Equities
During the week, the equities market was on a downward trajectory, with NASI declining the most by 2.2%, while NSE 25, NSE 10 and NSE 20 declined by 1.5%, 1.4% and 0.8% respectively, taking the YTD performance to losses of 24.0%, 9.3%, and 20.2% for NASI, NSE 20, and NSE 25, respectively. The equities market performance was mainly driven by losses recorded by large-cap stocks such as Safaricom, DTB-K and Bamburi of 4.8%, 3.5% and 3.3% respectively. The losses were however mitigated by gains recorded by stocks such as Standard Chartered Bank-Kenya, ABSA Bank and EABL of 2.2%, 0.9% and 0.8% respectively;
Real Estate
During the week, the Kenya National Bureau of Statistics (KNBS) released the Leading Economic Indicators (LEI) June and July 2023 Reports which highlighted that overall international arrivals through Jomo Kenyatta International Airport (JKIA) and Moi International Airport (MIA) increased y/y by 13.3% to 317,196 in Q2’2023, from the 279,981 recorded in Q2'2022;
In regulated Real Estate Funds, under the Real Estate Investment Trusts (REITs) segment, Fahari I-REIT closed the week trading at an average price of Kshs 7.1 per share on the Nairobi Securities Exchange, representing an 8.5% decline from the Kshs 7.8 recorded the previous week. On the Unquoted Securities Platform as at 15 September 2023, Acorn D-REIT and I-REIT closed the week trading at Kshs 25.3 and Kshs 21.7 per unit, a 26.6% and 8.3% gain for the D-REIT and I-REIT, respectively, from the Kshs 20.0 inception price. In addition, Cytonn High Yield Fund (CHYF) closed the week with an annualized yield of 14.0%, a 0.2% points increase from 13.8% recorded the previous week;
Focus of the Week
Following the release of the H1’2023 results by Kenyan banks, the Cytonn Financial Services Research Team undertook an analysis on the financial performance of the listed banks and identified the key factors that shaped the performance of the sector;
Investment Updates:
- Weekly Rates:
- Cytonn Money Market Fund closed the week at a yield of 13.67% p.a To invest, dial *809# or download the Cytonn App from Google Playstore here or from the Appstore here;
- Cytonn High Yield Fund closed the week at a yield of 14.01% p.a. To invest, email us at sales@cytonn.com and to withdraw the interest, dial *809# or download the Cytonn App from Google Playstore here or from the Appstore here;
- We continue to offer Wealth Management Training every Wednesday, from 9:00 am to 11:00 am. The training aims to grow financial literacy among the general public. To register for any of our Wealth Management Trainings, click here;
- If interested in our Private Wealth Management Training for your employees or investment group, please get in touch with us through wmt@cytonn.com;
- Cytonn Insurance Agency acts as an intermediary for those looking to secure their assets and loved ones’ future through insurance namely; Motor, Medical, Life, Property, WIBA, Credit and Fire and Burglary insurance covers. For assistance, get in touch with us through insuranceagency@cytonn.com;
- Cytonn Asset Managers Limited (CAML) continues to offer pension products to meet the needs of both individual clients who want to save for their retirement during their working years and Institutional clients that want to contribute on behalf of their employees to help them build their retirement pot. To more about our pension schemes, kindly get in touch with us through pensions@cytonn.com;
Real Estate Updates:
- For more information on Cytonn’s real estate developments, email us at sales@cytonn.com;
- Phase 3 of The Alma is now ready for occupation and the show house is open daily. To join the waiting list to rent, please email properties@cytonn.com;
- For Third Party Real Estate Consultancy Services, email us at rdo@cytonn.com;
- For recent news about the group, see our news section here;
Hospitality Updates:
- We currently have promotions for Staycations. Visit cysuites.com/offers for details or email us at sales@cysuites.com;
Money Markets, T-Bills Primary Auction:
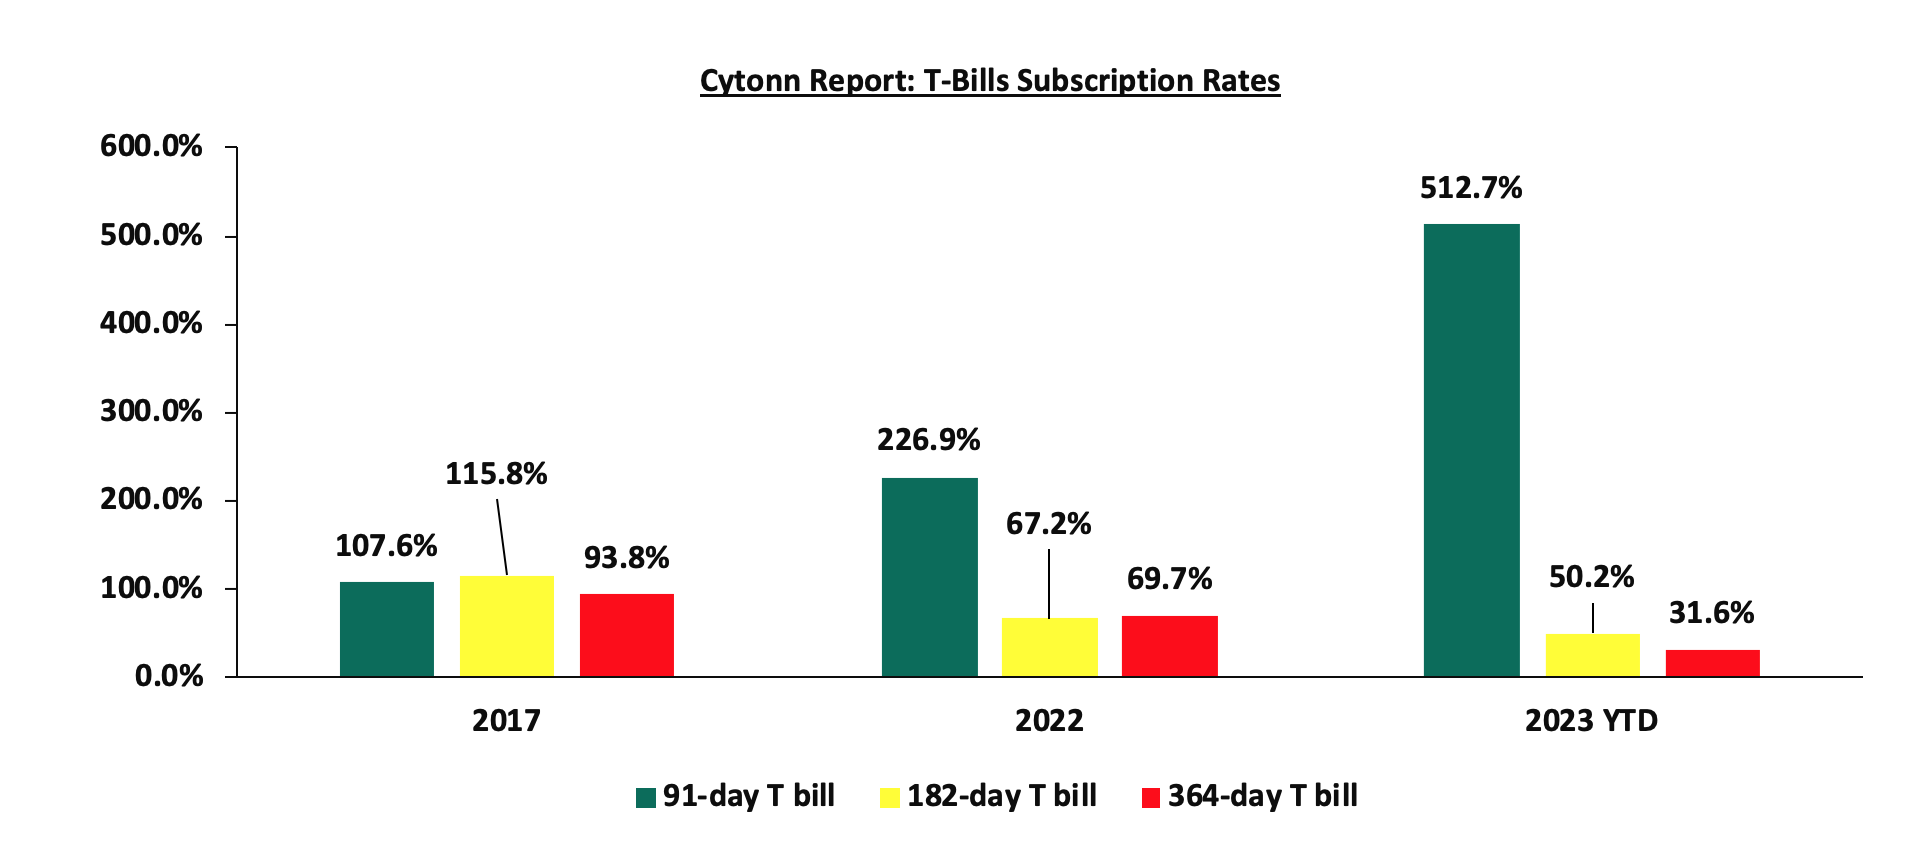
During the week, T-bills were undersubscribed for the second consecutive week, with the overall subscription rate coming in at 84.1%, from the undersubscription rate of 92.1% recorded the previous week. Investors’ preference for the shorter 91-day paper persisted, with the paper receiving bids worth Kshs 16.1 bn against the offered Kshs 4.0 bn, translating to an oversubscription rate of 401.7%, albeit lower than the subscription rate of 450.0% recorded the previous week. The subscription rate for the 364-day paper decreased to 25.3% from 34.1% recorded the previous week, while that of the 182-day paper increased to 15.8% from 7.0% recorded the previous week. The government accepted a total of Kshs 18.8 bn worth of bids out of Kshs 20.2 bn of bids received, translating to an acceptance rate of 93.1%. The yields on the government papers were on an upward trajectory, with the yields on the 364-day, 182-day and 91-day papers increasing by 43.9 bps, 52.5 bps and 27.2 bps to 15.2%, 14.9% and 14.8%, respectively. The chart below compares the overall average T- bills subscription rates obtained in 2017, 2022 and 2023 Year to Date (YTD):
Money Market Performance:
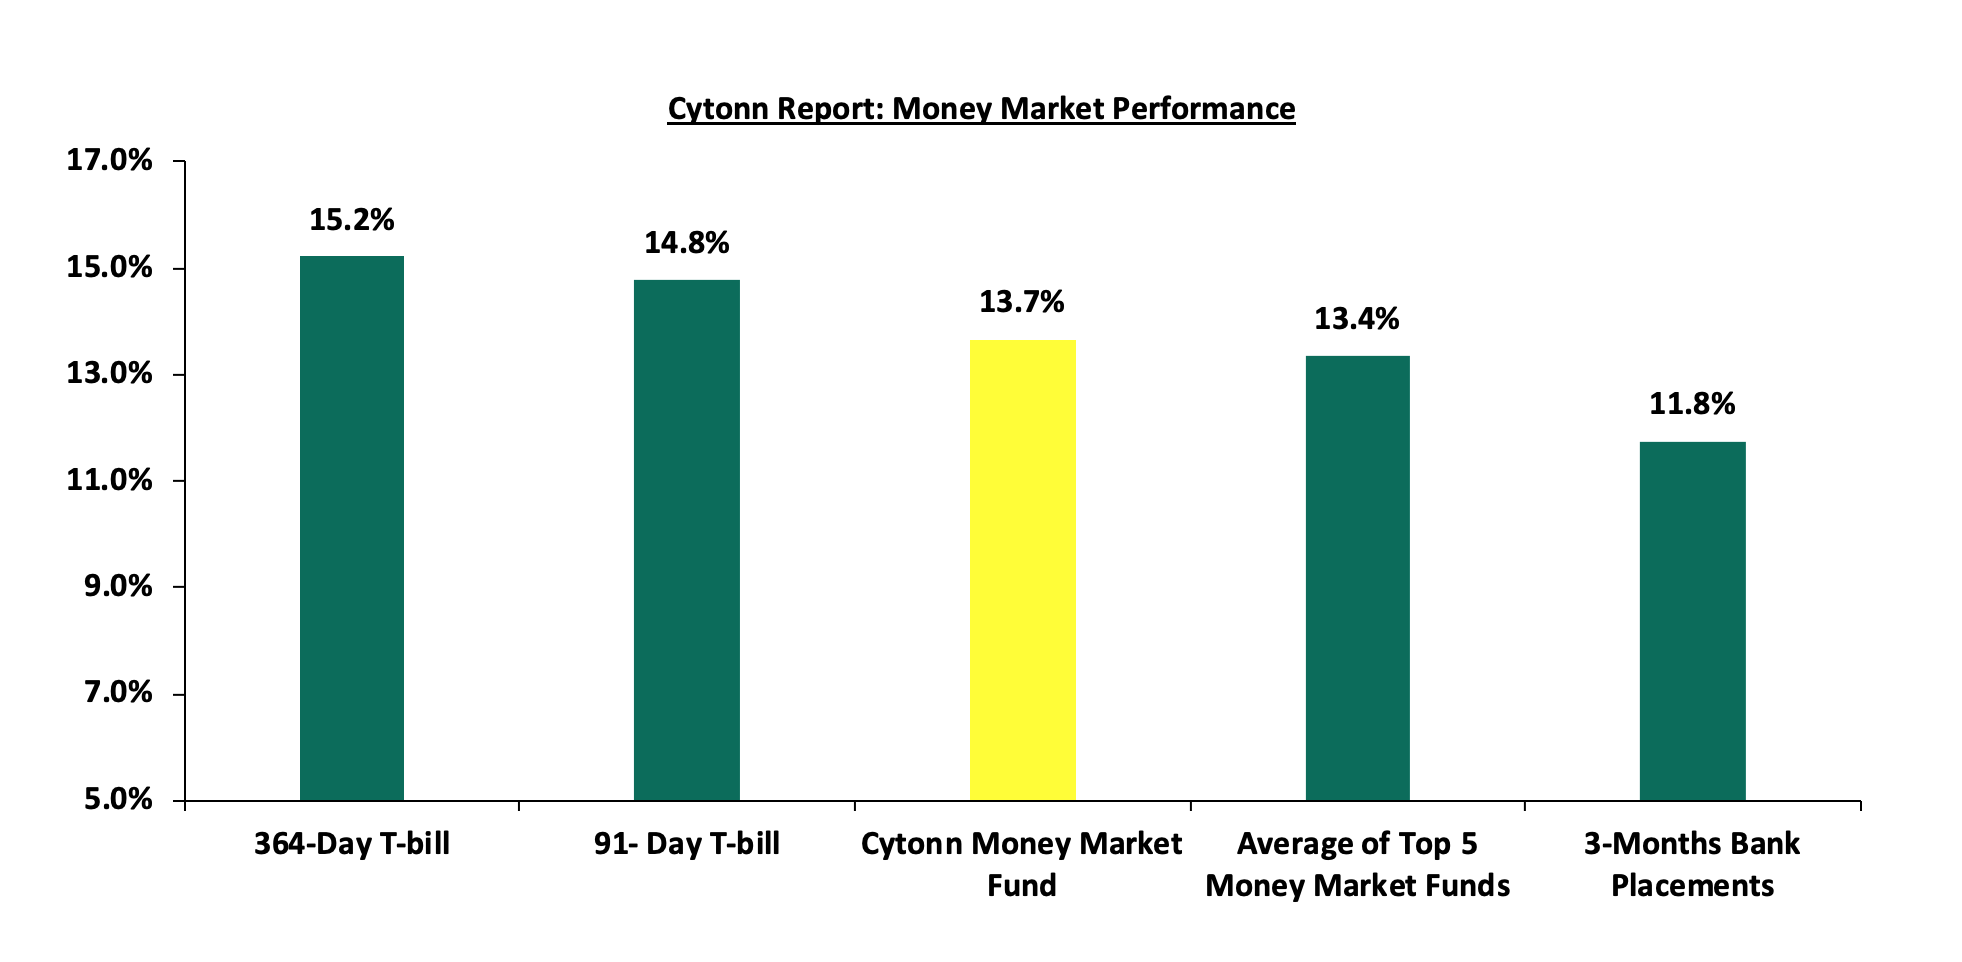
In the money markets, 3-month bank placements ended the week at 11.8% (based on what we have been offered by various banks), the yield on the 364-day paper increased by 43.9 bps to 15.2%, while that of 91-day paper increased by 27.2 bps to 14.8%. The yield of Cytonn Money Market Fund increased by 23.0 bps, to 13.7%, from 13.4% and the average yields on the Top 5 Money Market Funds increased by 16.0 bps to 13.4% from 13.2% recorded the previous week.
The table below shows the Money Market Fund Yields for Kenyan Fund Managers as published on 22nd Sep 2023:
|
Cytonn Report: Money Market Fund Yield for Fund Managers as published on 22nd September 2023 |
||
|
Rank |
Fund Manager |
Effective Annual |
|
1 |
GenAfrica Money Market Fund |
13.8% |
|
2 |
Cytonn Money Market Fund |
13.7% |
|
3 |
Enwealth Money Market Fund |
13.7% |
|
4 |
Lofty-Corban Money Market Fund |
12.9% |
|
5 |
Apollo Money Market Fund |
12.8% |
|
6 |
Etica Money Market Fund |
12.8% |
|
7 |
Jubilee Money Market Fund |
12.7% |
|
8 |
Madison Money Market Fund |
12.5% |
|
9 |
Co-op Money Market Fund |
12.5% |
|
10 |
Kuza Money Market fund |
12.2% |
|
11 |
GenCap Hela Imara Money Market Fund |
12.2% |
|
12 |
Sanlam Money Market Fund |
11.9% |
|
13 |
Old Mutual Money Market Fund |
11.9% |
|
14 |
Absa Shilling Money Market Fund |
11.7% |
|
15 |
ICEA Lion Money Market Fund |
11.6% |
|
16 |
KCB Money Market Fund |
11.5% |
|
17 |
Dry Associates Money Market Fund |
11.3% |
|
18 |
Nabo Africa Money Market Fund |
10.6% |
|
19 |
CIC Money Market Fund |
10.5% |
|
20 |
AA Kenya Shillings Fund |
10.2% |
|
21 |
Mali Money Market Fund |
10.1% |
|
22 |
Orient Kasha Money Market Fund |
10.0% |
|
23 |
Equity Money Market Fund |
9.8% |
|
24 |
British-American Money Market Fund |
9.2% |
Source: Business Daily
Liquidity:
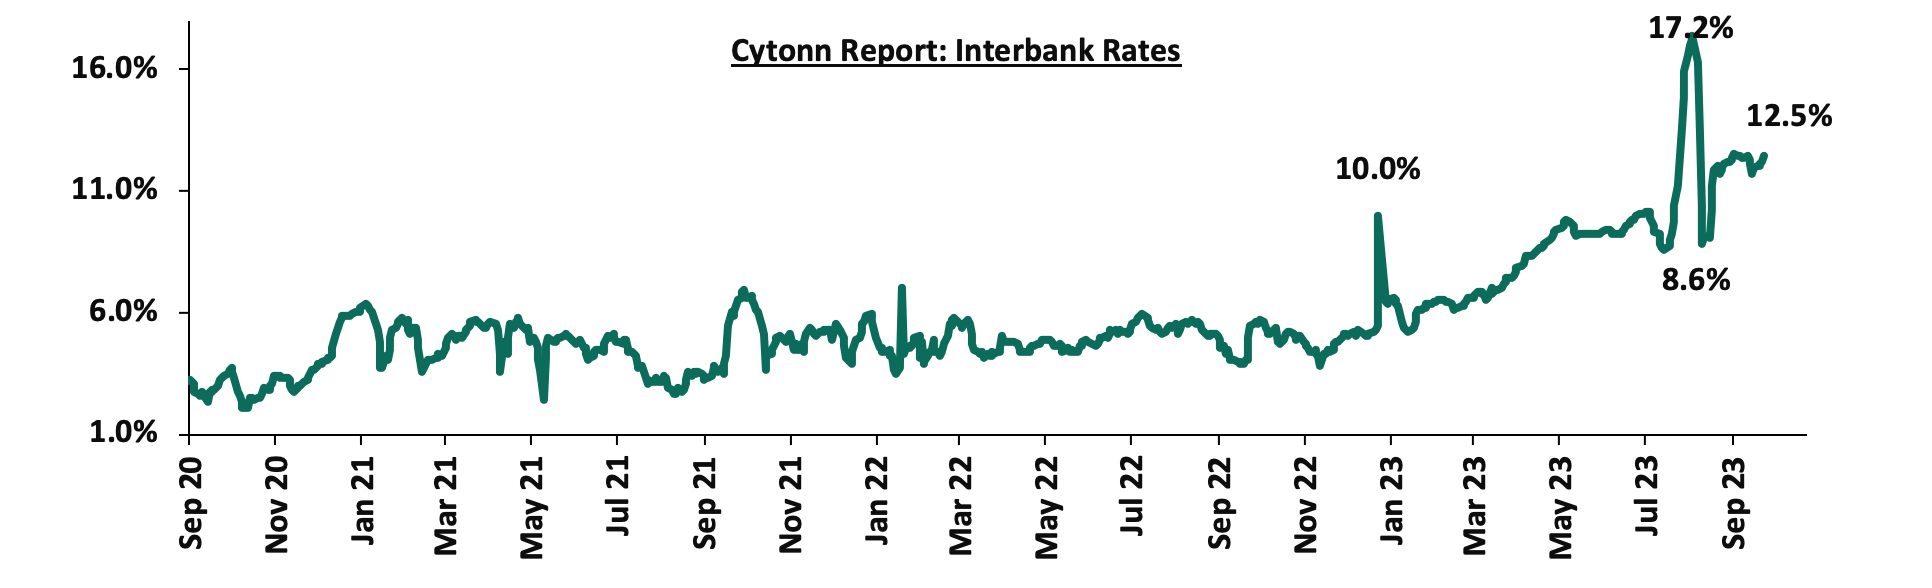
During the week, liquidity in the money markets tightened, with the average interbank rate increasing to 12.2%, from 12.1% recorded the previous week, partly attributable to tax remittances that offset government payments. The average interbank volumes traded decreased by 16.9% to Kshs 21.8 bn, from Kshs 26.3 bn recorded the previous week. The chart below shows the interbank rates in the market over the years:
Kenya Eurobonds:
During the week, the yields on Eurobonds were on an upward trajectory, with the yield on the 10-year Eurobond issued in 2014 increasing the most by 3.2% points to 16.8%, from 13.6%, recorded the previous week. The table below shows the summary of the performance of the Kenyan Eurobonds as of 21st Sep 2023;
|
Cytonn Report: Kenya Eurobonds Performance |
||||||
|
|
2014 |
2018 |
2019 |
2021 |
||
|
Tenor |
10-year issue |
10-year issue |
30-year issue |
7-year issue |
12-year issue |
12-year issue |
|
Amount Issued (USD) |
2.0 bn |
1.0 bn |
1.0 bn |
0.9 bn |
1.2 bn |
1.0 bn |
|
Years to Maturity |
0.8 |
4.5 |
24.5 |
3.7 |
8.7 |
10.8 |
|
Yields at Issue |
6.6% |
7.3% |
8.3% |
7.0% |
7.9% |
6.2% |
|
02-Jan-23 |
12.9% |
10.5% |
10.9% |
10.9% |
10.8% |
9.9% |
|
01-Sep-23 |
13.8% |
11.7% |
11.4% |
12.0% |
11.5% |
11.0% |
|
14-Sep-23 |
13.6% |
11.8% |
11.5% |
12.3% |
11.5% |
11.1% |
|
15-Sep-23 |
14.0% |
11.8% |
11.5% |
12.3% |
11.5% |
11.1% |
|
18-Sep-23 |
14.7% |
12.3% |
11.6% |
12.9% |
11.8% |
11.3% |
|
19-Sep-23 |
15.9% |
12.7% |
11.8% |
13.5% |
12.1% |
11.6% |
|
20-Sep-23 |
15.7% |
12.6% |
11.9% |
13.5% |
12.0% |
11.6% |
|
21-Sep-23 |
16.8% |
13.0% |
12.1% |
14.0% |
12.3% |
11.9% |
|
Weekly Change |
3.2% |
1.2% |
0.6% |
1.7% |
0.8% |
0.8% |
|
MTD Change |
3.0% |
1.3% |
0.7% |
2.0% |
0.8% |
0.9% |
|
YTD Change |
3.9% |
2.5% |
1.2% |
3.1% |
1.5% |
2.1% |
Source: Central Bank of Kenya (CBK) and National Treasury
Kenya Shilling:
During the week, the Kenya Shilling depreciated by 0.4% against the US dollar to close the week at Kshs 147.4, from Kshs 146.8 recorded the previous week. On a year to date basis, the shilling has depreciated by 19.4% against the dollar, adding to the 9.0% depreciation recorded in 2022. We expect the shilling to remain under pressure in 2023 as a result of:
- An ever-present current account deficit, which came at 2.3% of GDP in Q1’2023 from 4.2% recorded in a similar period last year, and,
- The need for government debt servicing, continues to put pressure on forex reserves given that 66.8% of Kenya’s external debt is US Dollar denominated as of April 2023, and,
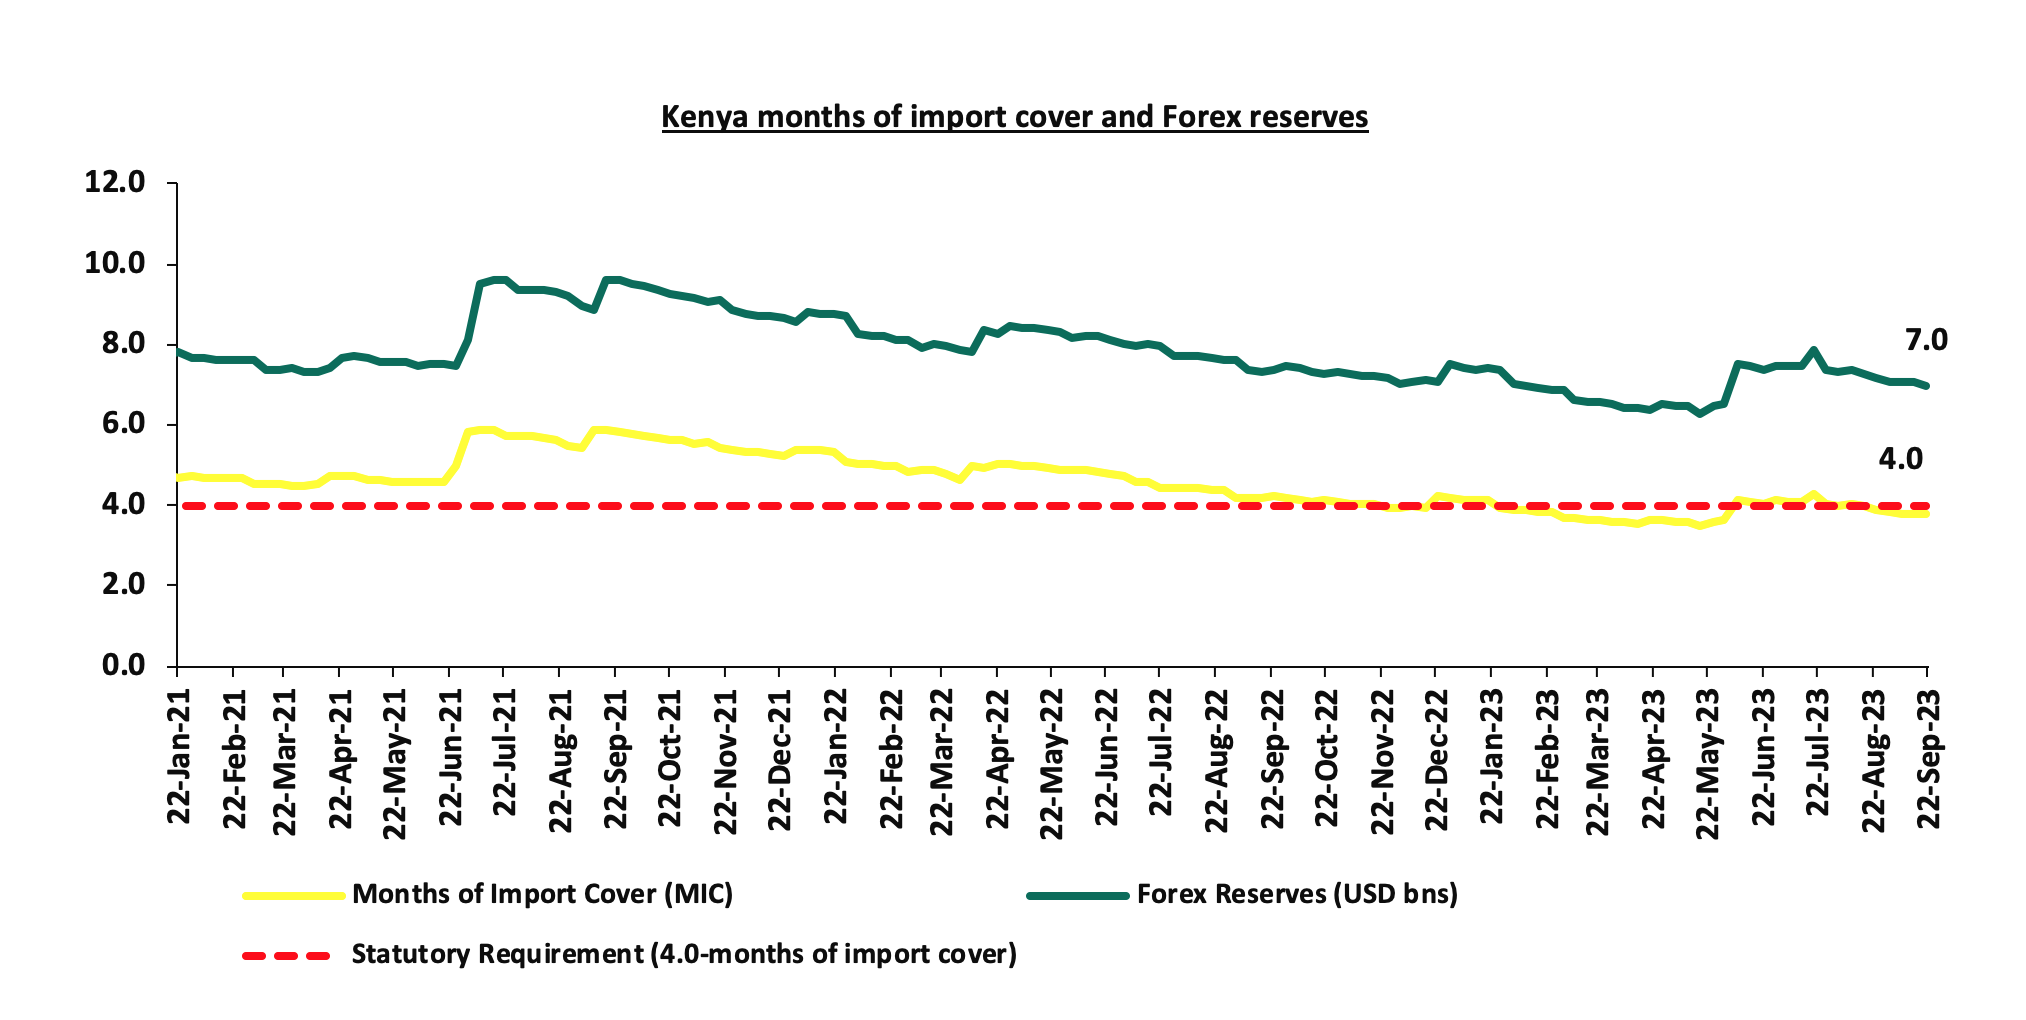
- Dwindling forex reserves currently at USD 7.0 bn (equivalent to 3.8-months of import cover), which is below the statutory requirement of maintaining at least 4.0-months of import cover.
The shilling is however expected to be supported by:
- Diaspora remittances standing at a cumulative USD 2,766.3 mn in 2023 as of August 2023, 3.4% higher than the USD 2,674.5 mn recorded over the same period in 2022, and,
- The tourism inflow receipts which came in at Kshs 268.1 bn in 2022, a significant 82.9% increase from Kshs 146.5 bn inflow receipts recorded in 2021.
The chart below summarizes the evolution of Kenya months of import cover over the years:
Rates in the Fixed Income market have been on an upward trend given the continued high demand for cash by the government and the occasional liquidity tightness in the money market. The government is 2.2% ahead of its prorated net domestic borrowing target of Kshs 68.1 bn, having a net borrowing position of Kshs 69.6 bn of the domestic net borrowing target of Kshs 313.6 bn for the FY’2023/2024. Therefore, we expect a continued upward readjustment of the yield curve in the short and medium term, with the government looking to bridge the fiscal deficit through the domestic market. Owing to this, our view is that investors should be biased towards short-term fixed-income securities to reduce duration risk.
Market Performance:
During the week, the equities market was on a downward trajectory, with NASI declining the most by 2.2%, while NSE 25, NSE 10 and NSE 20 declined by 1.5%, 1.4% and 0.8% respectively, taking the YTD performance to losses of 24.0%, 9.3%, and 20.2% for NASI, NSE 20, and NSE 25, respectively. The equities market performance was mainly driven by losses recorded by large-cap stocks such as Safaricom, Bamburi and DTB-K of 4.8%, 3.5% and 3.3% respectively. The losses were however mitigated by gains recorded by stocks such as Standard Chartered Bank-Kenya, ABSA Bank and EABL of 2.2%, 0.9% and 0.8% respectively.
During the week, equities turnover increased by 17.2% to USD 8.9 mn from USD 7.6 mn recorded the previous week, taking the YTD total turnover to USD 569.2 mn. Foreign investors remained net sellers for the fourth consecutive week with a net selling position of USD 3.9 mn, from a net selling position of USD 0.8 mn recorded the previous week, taking the YTD foreign net selling position to USD 281.5 mn.
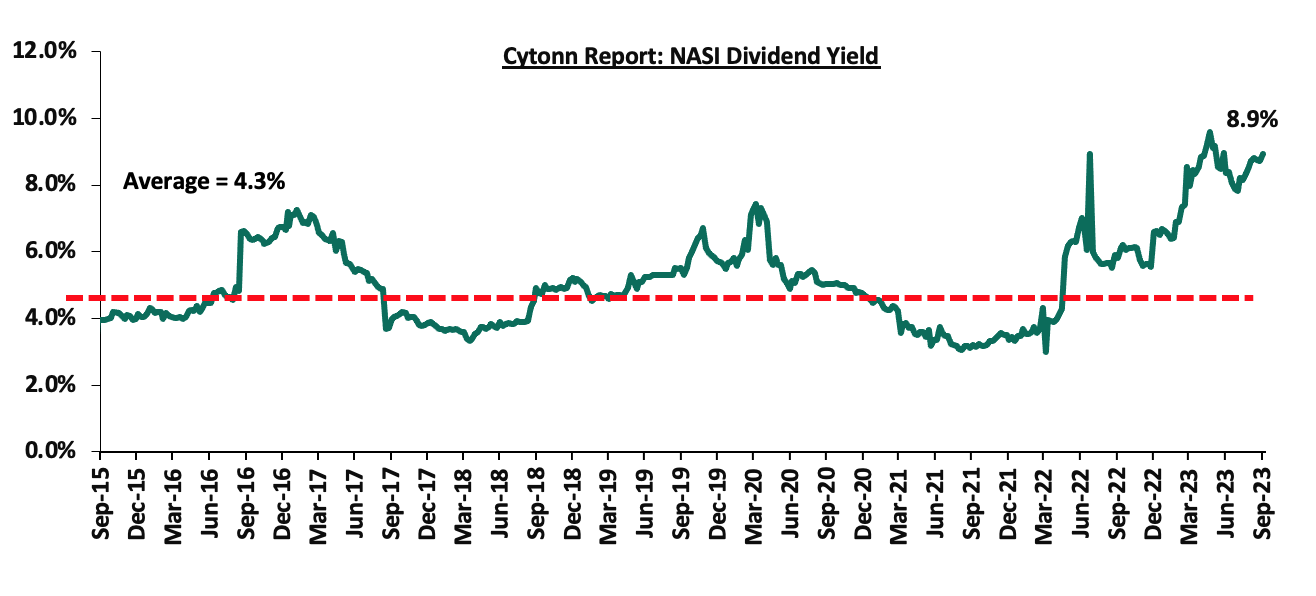
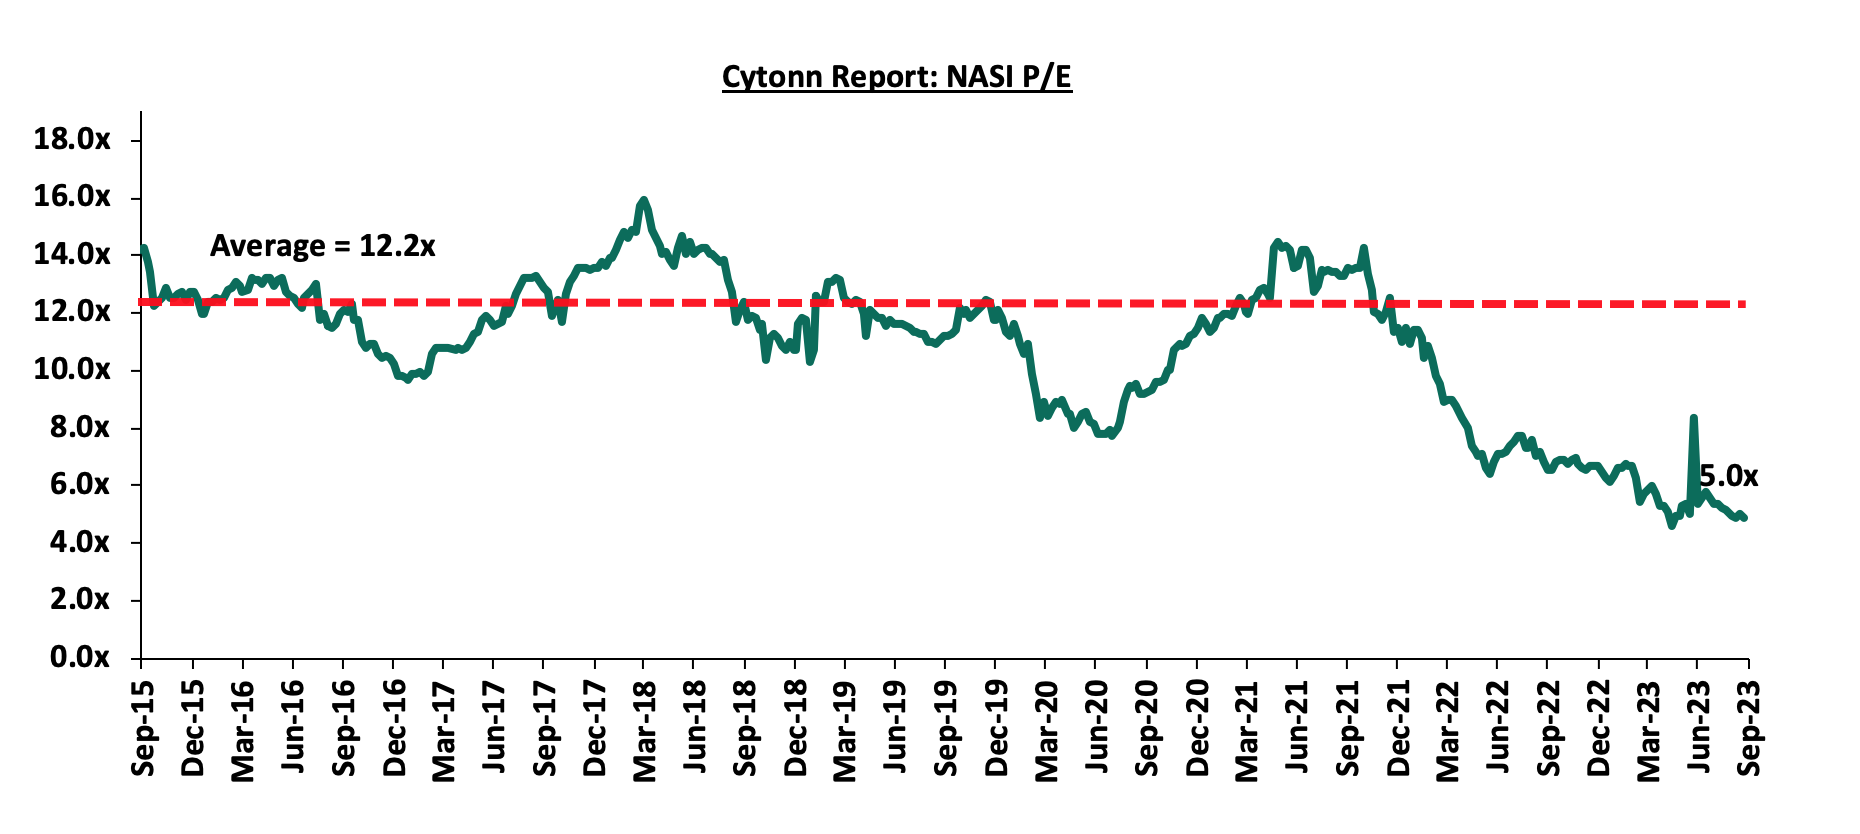
The market is currently trading at a price to earnings ratio (P/E) of 4.9x, 60.0% below the historical average of 12.2x. The dividend yield stands at 8.9%, 4.6% points above the historical average of 4.3%. Key to note, NASI’s PEG ratio currently stands at 0.6x, an indication that the market is undervalued relative to its future growth. A PEG ratio greater than 1.0x indicates the market is overvalued while a PEG ratio less than 1.0x indicates that the market is undervalued. The charts below indicate the historical P/E and dividend yields of the market;
Universe of coverage:
|
Company |
Price as at 15/09/2023 |
Price as at 22/09/2023 |
w/w change |
YTD Change |
Target Price* |
Dividend Yield |
Upside/ Downside** |
P/TBv Multiple |
Recommendation |
|
KCB Group*** |
22.3 |
22.4 |
0.2% |
(41.7%) |
41.3 |
8.9% |
93.6% |
0.4x |
Buy |
|
Liberty Holdings |
3.7 |
3.8 |
1.3% |
(25.4%) |
5.9 |
0.0% |
57.4% |
0.3x |
Buy |
|
Jubilee Holdings |
199.5 |
180.8 |
(9.4%) |
(9.1%) |
260.7 |
6.6% |
50.8% |
0.3x |
Buy |
|
Equity Group*** |
37.4 |
36.9 |
(1.3%) |
(18.1%) |
51.2 |
10.8% |
49.5% |
0.8x |
Buy |
|
Kenya Reinsurance |
1.8 |
1.8 |
0.0% |
(2.1%) |
2.5 |
10.9% |
48.1% |
0.1x |
Buy |
|
Sanlam |
7.2 |
7.2 |
(0.6%) |
(25.1%) |
10.3 |
0.0% |
43.3% |
2.0x |
Buy |
|
NCBA*** |
37.4 |
37.3 |
(0.4%) |
(4.4%) |
48.9 |
11.4% |
42.6% |
0.7x |
Buy |
|
Co-op Bank*** |
12.0 |
11.8 |
(1.3%) |
(2.5%) |
15.0 |
12.7% |
39.4% |
0.6x |
Buy |
|
ABSA Bank*** |
11.8 |
11.9 |
0.9% |
(2.9%) |
14.7 |
11.4% |
35.2% |
1.0x |
Buy |
|
HF Group |
4.6 |
4.5 |
(2.8%) |
41.6% |
5.8 |
0.0% |
30.3% |
0.2x |
Buy |
|
Stanbic Holdings |
110.5 |
111.0 |
0.5% |
8.8% |
127.9 |
11.4% |
26.5% |
0.8x |
Buy |
|
Standard Chartered*** |
159.5 |
163.0 |
2.2% |
12.4% |
183.9 |
13.5% |
26.3% |
1.1x |
Buy |
|
Diamond Trust Bank*** |
49.8 |
48.0 |
(3.5%) |
(3.7%) |
54.6 |
10.4% |
24.1% |
0.2x |
Buy |
|
I&M Group*** |
18.1 |
17.5 |
(3.0%) |
2.6% |
19.5 |
12.9% |
24.1% |
0.4x |
Buy |
|
CIC Group |
2.2 |
2.1 |
(1.8%) |
11.5% |
2.5 |
6.1% |
23.5% |
0.7x |
Buy |
|
Britam |
5.2 |
4.9 |
(6.4%) |
(6.7%) |
6.0 |
0.0% |
23.1% |
0.7x |
Buy |
We are “Neutral” on the Equities markets in the short term due to the current tough operating environment and huge foreign investor outflows, and, “Bullish” in the long term due to current cheap valuations and expected global and local economic recovery.
With the market currently being undervalued to its future growth (PEG Ratio at 0.6x), we believe that investors should reposition towards value stocks with strong earnings growth and that are trading at discounts to their intrinsic value. We expect the current high foreign investors sell-offs to continue weighing down the equities outlook in the short term.
- Industry Reports
The Kenya National Bureau of Statistics (KNBS) released the Leading Economic Indicators (LEI) June and July 2023 Reports which highlighted the performance of major economic indicators. The key highlights related to the Real Estate sector include;
- Overall international arrivals through Jomo Kenyatta International Airport (JKIA) and Moi International Airport (MIA) increased year-to-year (y/y) basis by 13.3% to 317,196 in Q2’2023, from the 279,981 recorded in Q2'2022. Additionally, for the month of July 2023, the total number of arrivals increased by 26.6% to 158,100 from 124,927 recorded in July 2022. The improvement in performance was attributed to; i) continued intensive marketing of Kenya’s tourism market by the Ministry of Tourism through platforms such as the Magical Kenya platform, ii) the Tourism Board’s alignment of its marketing initiatives towards strategies targeting emerging and established source markets, and, iii) an upsurge in corporate and business meetings, events, and conferences from both the public and private sectors with the new government regime. However, on a quarter-to-quarter (q/q) basis, the performance was a 6.1% increase from 337,937 recorded in Q1’2023, owing to easing of the holiday season within the sector. The chart below shows the number of international arrivals in Kenya between Q1’2021 and Q2’2023;
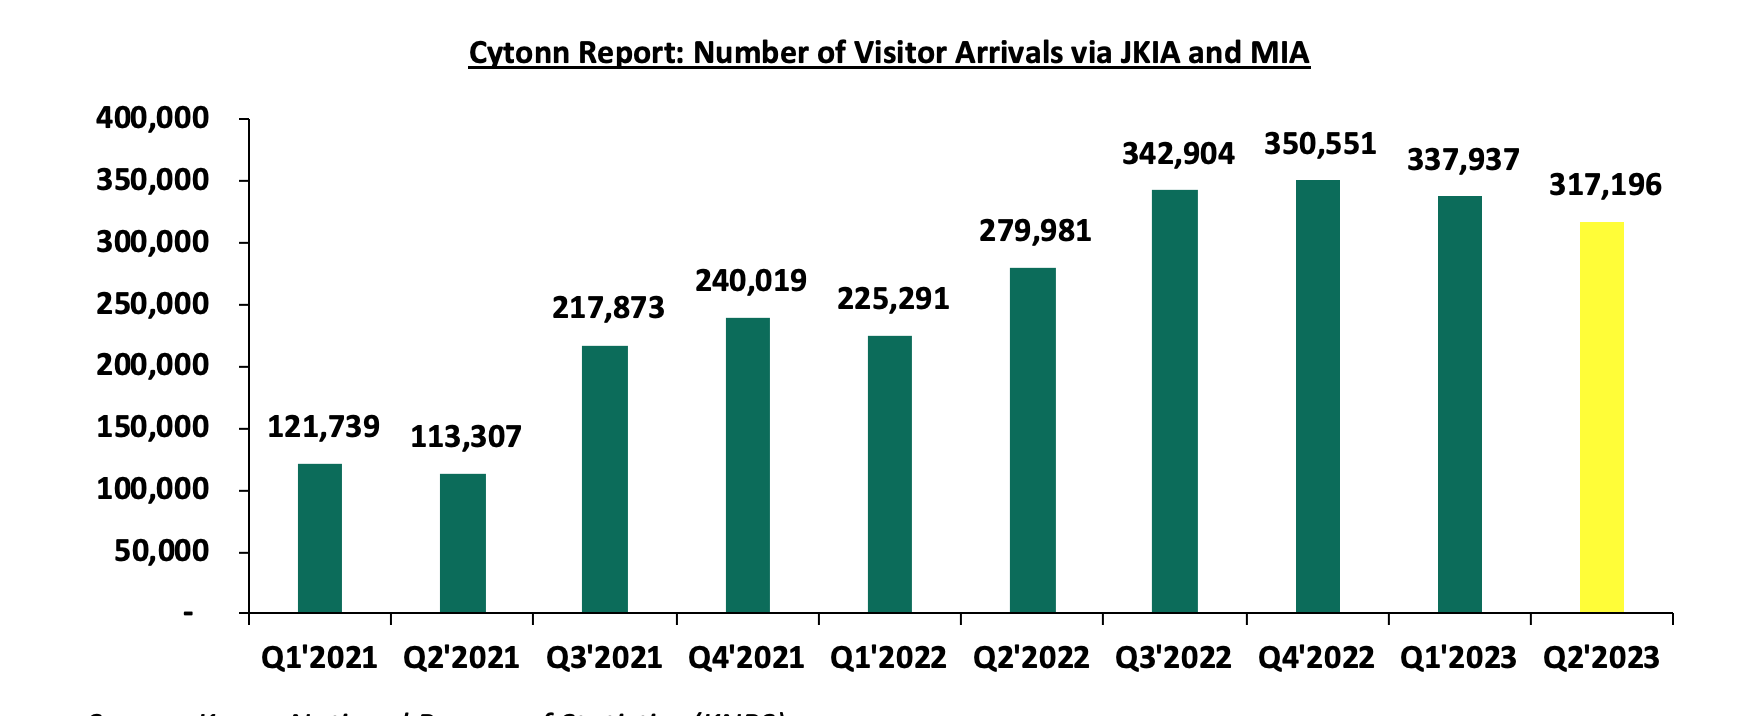
Source: Kenya National Bureau of Statistics (KNBS)
- The total value of building plans approved in the Nairobi Metropolitan Area (NMA) decreased y/y basis by 23.3% to Kshs 25.3 bn in Q2’2023, from Kshs 33.0 bn recorded in Q2’2022. In addition, on a q/q basis, the performance represented a 55.4% decline from Kshs 56.7 bn recorded in Q1’2023. The decline in performance was attributable to; i) high development costs on the back of rising prices of construction materials such as cement, paint, steel and Poly Vinyl Chloride (PVC) driven by inflationary pressure, and ii) pending of approvals amid delays in processing construction permits enhanced by backlogs in registry systems. However, for the month of July 2023, the total value of building plans approved increased by 29.3% to Kshs 23.2 bn from Kshs 18.0 bn recorded in July 2022, on the back of increased construction of residential and other buildings in the Real Estate sector within the year. The chart below shows the value of building plans approved in the Nairobi Metropolitan Area (NMA) between Q1’2021 and Q2’2023;
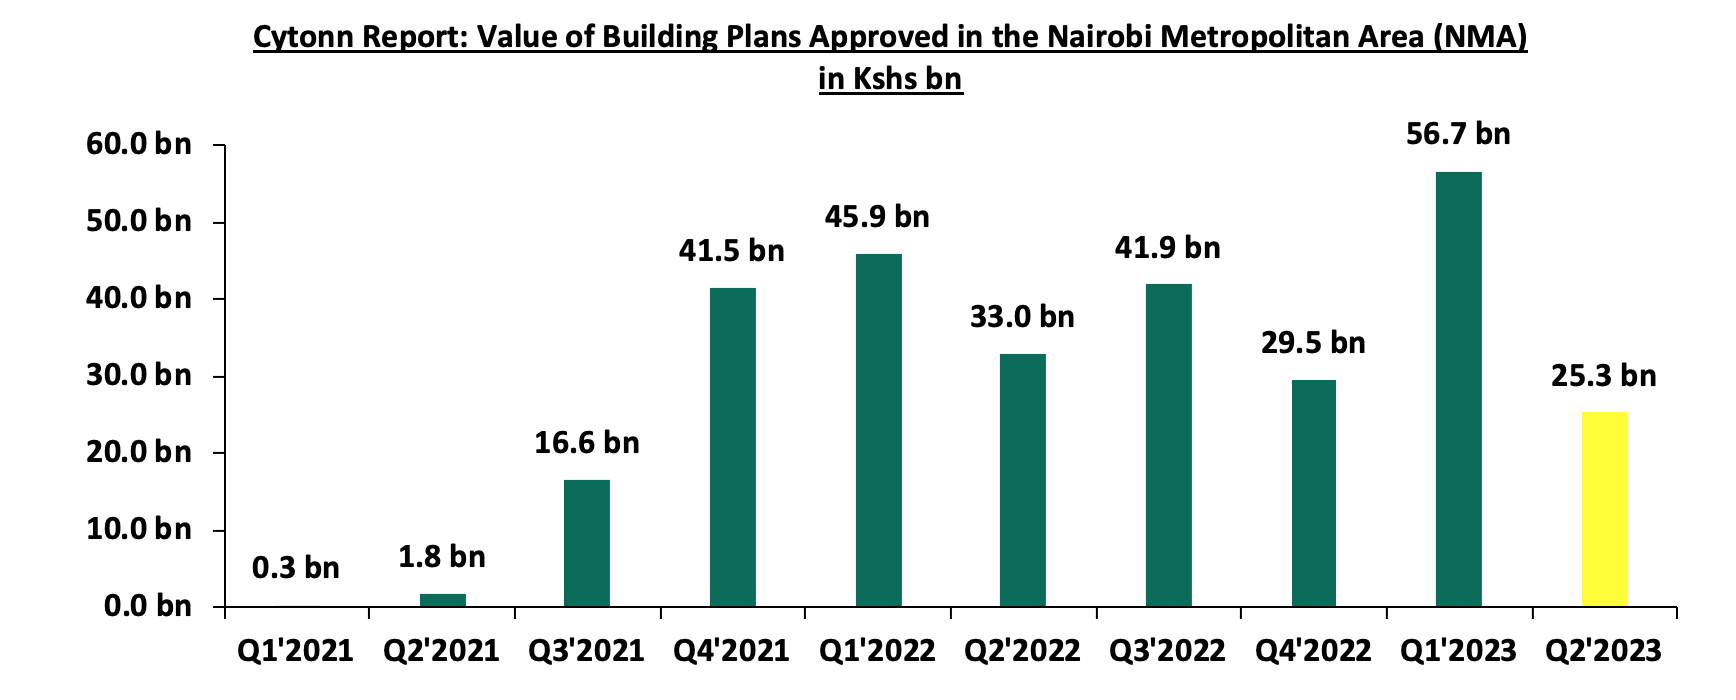
Source: Kenya National Bureau of Statistics (KNBS)
- The consumption of cement came in at 2.28 mn metric tonnes in Q2’2023, remaining relatively unchanged on a y/y basis. However, on a q/q basis, performance represented a 2.0% decrease from 2.33 mn metric tonnes recorded in Q1’2023. The decline in performance was attributable to; i) increased costs of the commodity driven by prevailing inflationary pressures on the back of local and external shocks, ii) an increase in pending approvals amid delays in processing construction permits owing to backlogs in registry systems, which led to an overall decrease in the consumption of construction materials, and, iii) reduced infrastructural developments by the government owing to the political transitions, policy shifts, budget constraints, and regulatory changes in the incoming government after the August 2022 general elections. The chart below shows cement consumption in metric tonnes in Kenya between Q1’2021 and Q2’2023;
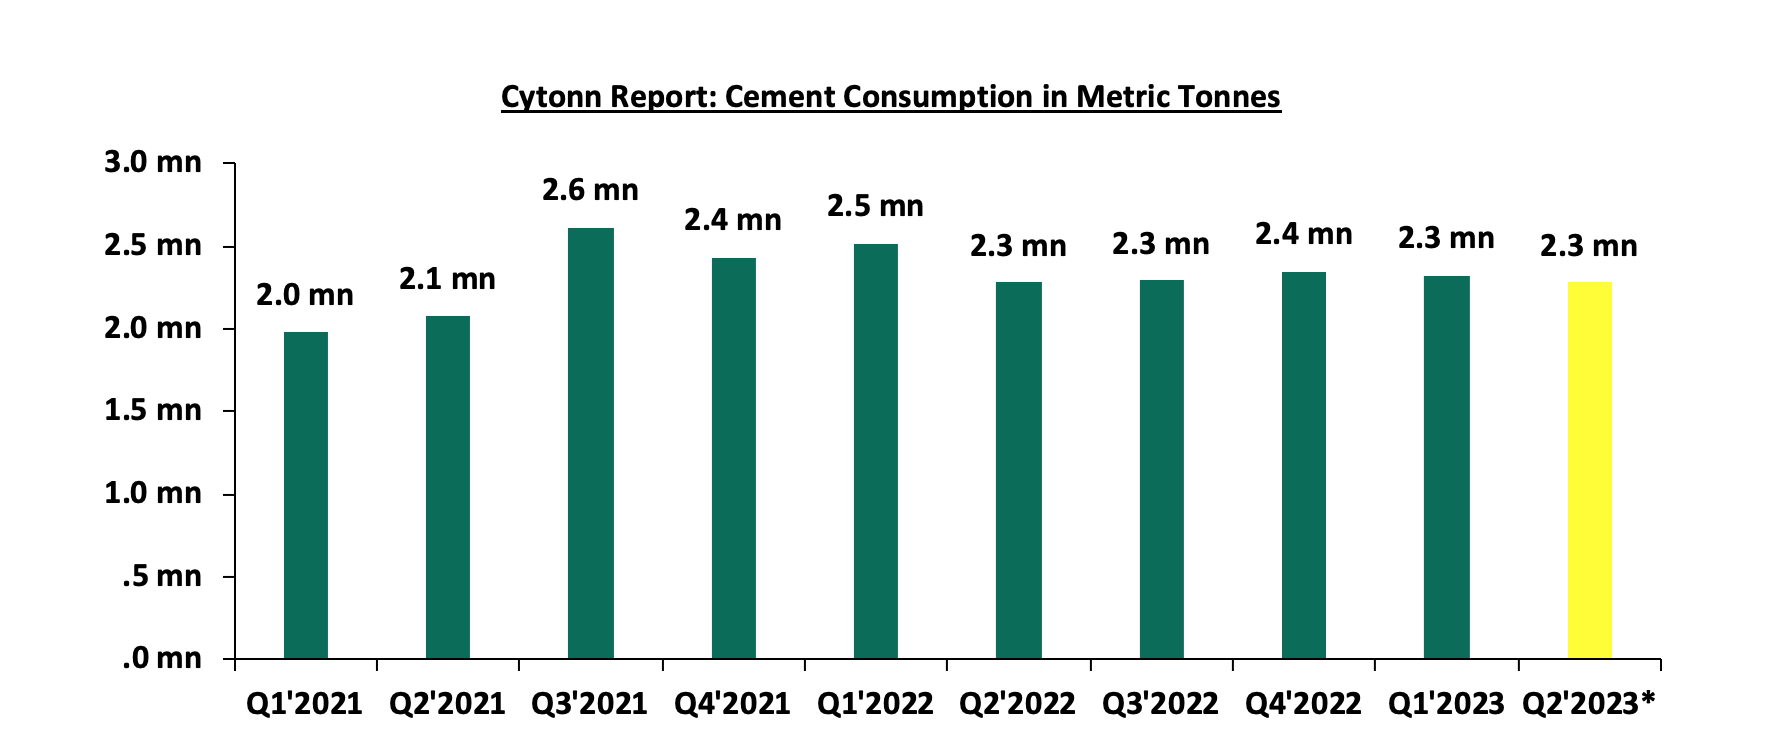
* Averaged using April & May 2023 figures
Source: Kenya National Bureau of Statistics (KNBS)
We expect the general Real Estate sector to continue growing in terms of performance mainly driven by the increasing number of visitor arrivals into the country which will enhance the performance of serviced apartments and hotel accommodations by boosting room and bed occupancies, restaurant activities and the generally the hospitality sector. However, the decline in construction activities evidenced by the reduction in the consumption of cement owing to rising construction costs on the back of inflationary pressures is expected to continue subduing the optimal performance of the sector.
- Regulated Real Estate Funds
- Real Estate Investment Trusts (REITs)
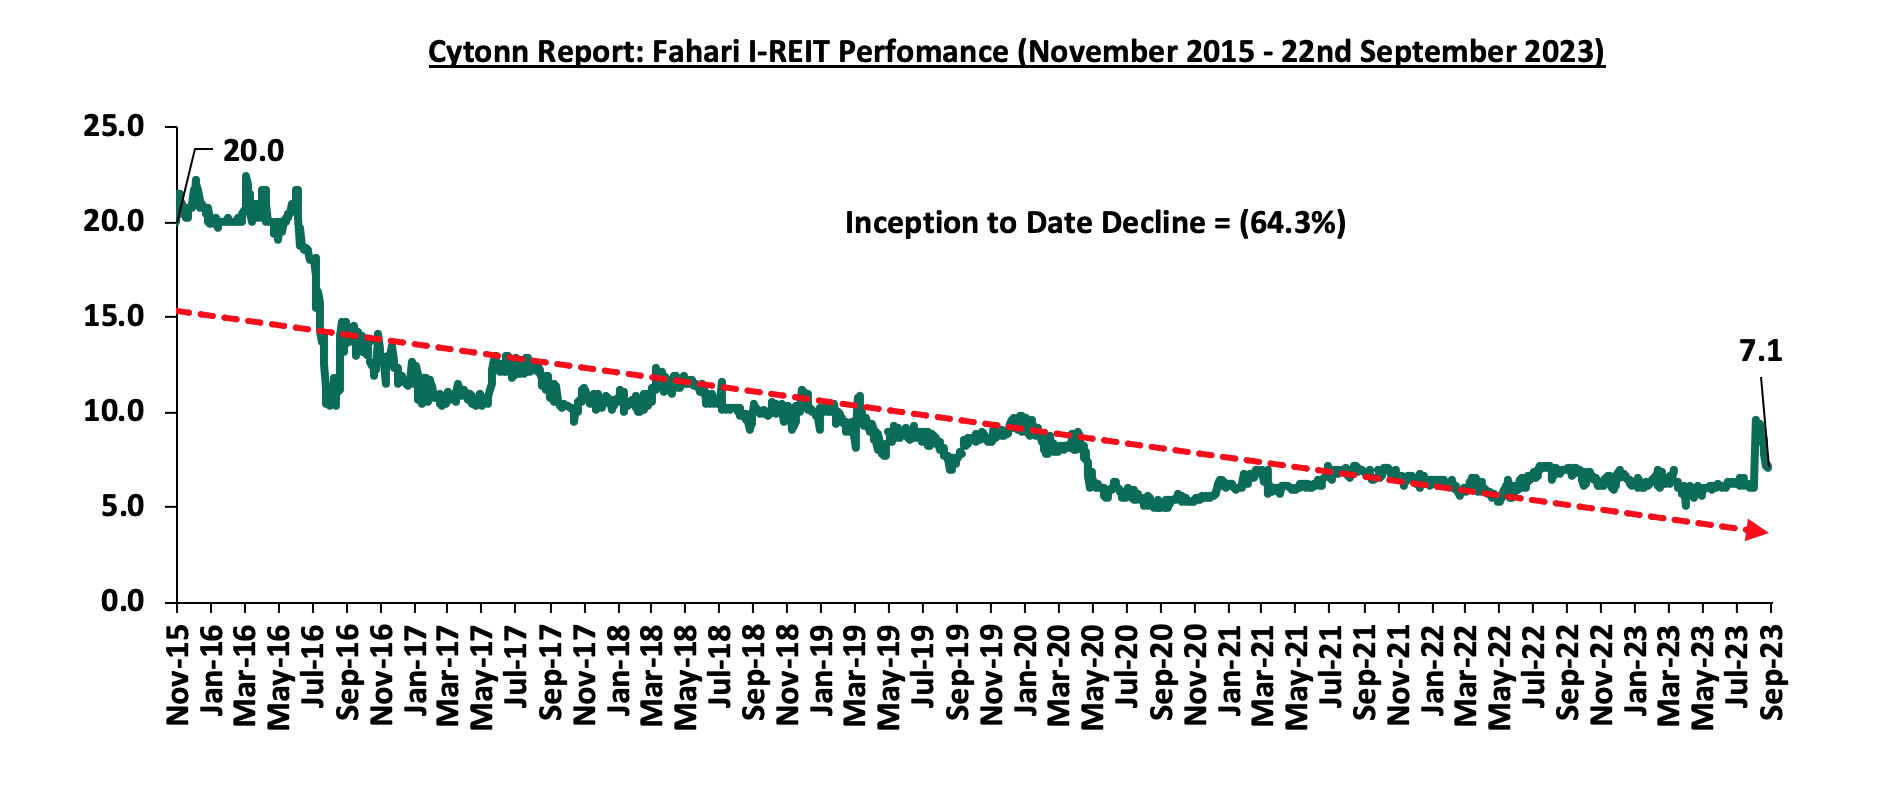
In the Nairobi Securities Exchange, ILAM Fahari I-REIT closed the week trading at an average price of Kshs 7.1 per share. The performance represented an 8.5% decline from Kshs 7.8 per share recorded the previous week, taking it to a 5.3% Year-to-Date (YTD) growth from Kshs 6.8 per share recorded on 3 January 2023. However, the performance represented a 64.3% Inception-to-Date (ITD) loss from the Kshs 20.0 price. The dividend yield currently stands at 9.1%. The graph below shows Fahari I-REIT’s performance from November 2015 to 22 September 2023;
In the Unquoted Securities Platform, Acorn D-REIT and I-REIT traded at Kshs 25.3 and Kshs 21.7 per unit, respectively, as at 15 September 2023. The performance represented a 26.6% and 8.3% gain for the D-REIT and I-REIT, respectively, from the Kshs 20.0 inception price. The volumes traded for the D-REIT and I-REIT came in at 12.3 mn and 30.6 mn shares, respectively, with a turnover of Kshs 257.5 mn and Kshs 632.1 mn, respectively, since inception in February 2021.
REITs provide various benefits like tax exemptions, diversified portfolios, and stable long-term profits. However the continuous deterioration in performance of the Kenyan REITs and restructuring of their business portfolio hampering major investment they had previously made are on top of other general challenges such as; i) inadequate comprehension of the investment instrument among investors, ii) prolonged approval processes for REITs creation, iii) high minimum capital requirements of Kshs 100.0 mn for trustees, and, iv) minimum investment amounts set at Kshs 5.0 mn, continue to limit the performance of the Kenyan REITs market.
- Cytonn High Yield Fund (CHYF)
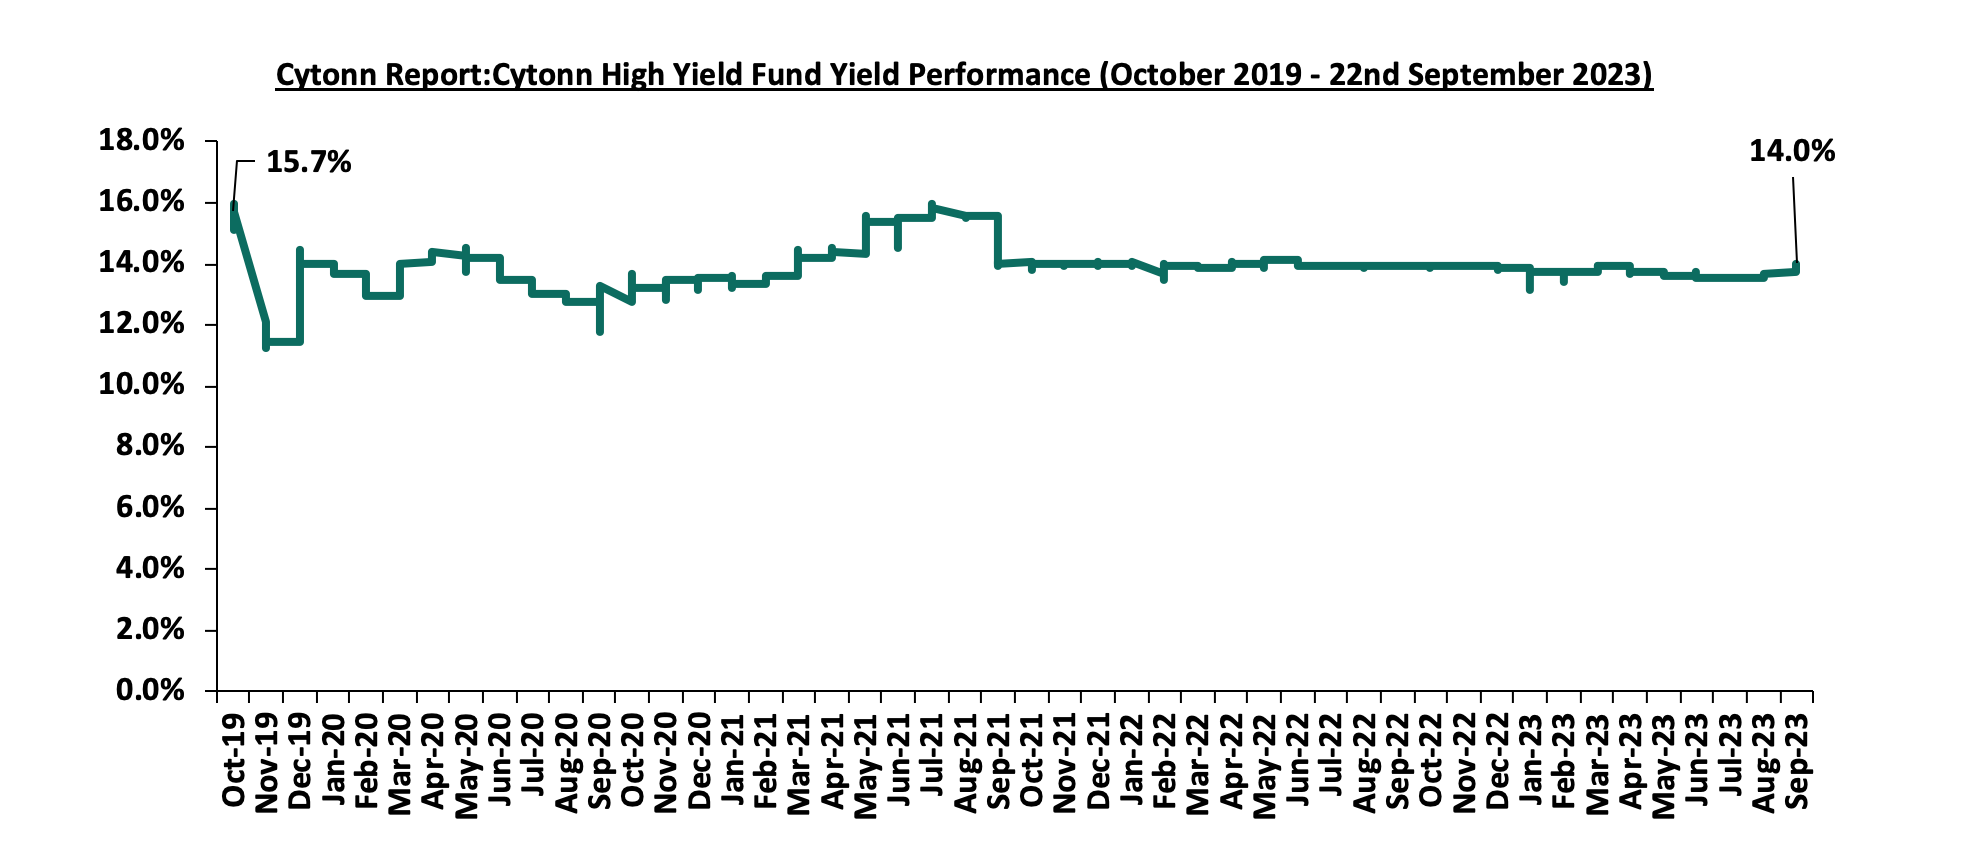
Cytonn High Yield Fund (CHYF) closed the week with an annualized yield of 14.0%. The performance represented a 0.2% points increase from 13.8% recorded the previous week, taking it to a 0.1% points Year-to-Date (YTD) growth from 13.9% yield recorded on 1 January 2023. However, the performance represented a 1.7% points Inception-to-Date (ITD) decline from the 15.7% yield. The graph below shows Cytonn High Yield Fund’s performance from October 2019 to 22 September 2023;
Notably, the CHYF has outperformed other regulated Real Estate funds with an annualized yield of 14.0%, as compared to Fahari I-REIT, and Acorn I-REIT with yields of 9.1% and 2.8% respectively. As such, the higher yields offered by CHYF makes the fund one of the best alternative investment resource in the Real Estate sector. The graph below shows the yield performance of the Regulated Real Estate Funds:
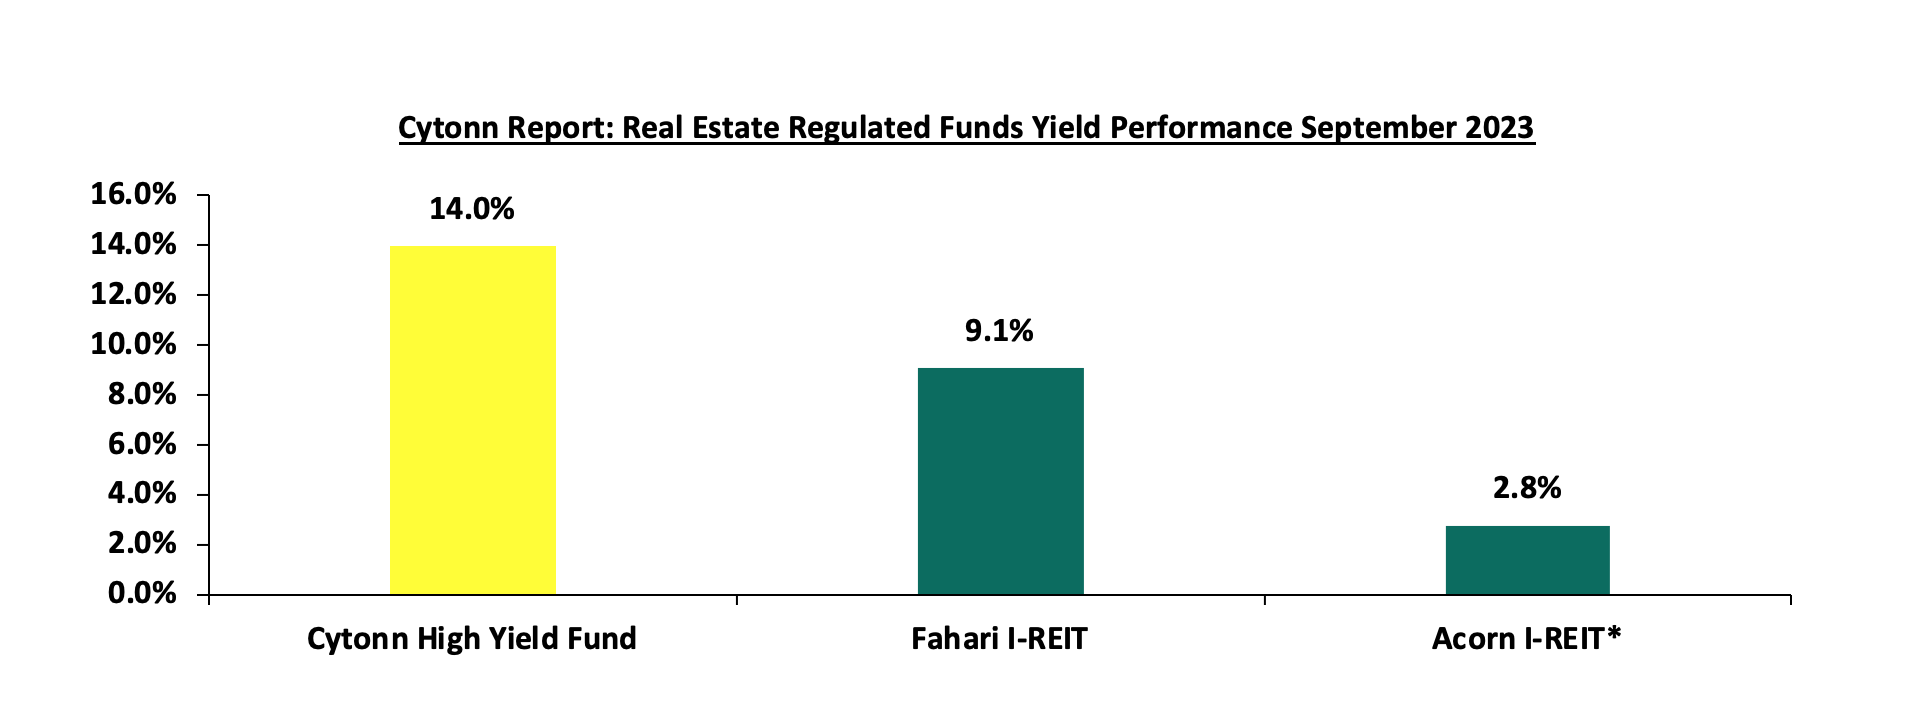
* H1’2023
Source: Cytonn Research
We expect the performance of Kenya’s Real Estate sector to remain on an upward trajectory, supported by factors such as; i) positive demographic trends driving housing demand which poised to further increase construction activities, ii) boosted tourist arrivals that is supporting the hospitality sector, and iv) rapid expansion of investors to serve the retail sector. However, the sector's optimal performance is expected to be subdued by the rising construction costs on the back of inflationary pressure, oversupply of physical space in the commercial office and retail sectors leading to slower uptake of new spaces, and limited investor knowledge in REITs coupled with high minimum investment amounts that are stymying the asset class.
Following the release of the H1’2023 results by Kenyan banks, the Cytonn Financial Services Research Team undertook an analysis on the financial performance of the listed banks and identified the key factors that shaped the performance of the sector. For the earnings notes of the various banks, click the links below:
- Equity Group H1’2023 Earnings Note
- KCB Group H1’2023 Earnings Note
- Standard Chartered Bank Kenya H1’2023 Earnings Note
- ABSA Bank Kenya H1’2023 Earnings Note
- NCBA Group H1’2023 Earnings Note
- Co-operative Bank H1’2023 Earnings Note
- Diamond Trust Bank Kenya (DTB-K) H1’2023 Earnings Note
- I&M Group Holdings H1’2023 Earnings Note
- Stanbic Holdings H1’2023 Earnings Note
- HF Group H1’2023 Earnings Note
The core earnings per share (EPS) for the listed banks recorded a weighted growth of 14.3% in H1’2023, compared to a weighted growth of 34.0% recorded in H1’2022, an indication of sustained performance despite the tough operating environment occasioned by elevated inflationary pressures experienced during the period. The performance in H1’2023 was supported by a 27.9% growth in non-funded income coupled with a 21.0% growth in net interest income. The growth in NFI was largely driven by the increase in foreign exchange income recorded by the banks during the period as a result of increased dollar demand in the country. However, the listed banks’ asset quality improved, with the weighted average Gross Non-Performing Loan ratio (NPL) decreasing by 0.3% points to 12.7%, from 13.0% recorded in H1’2022. The performance remained 3.0% points above the ten-year average of 9.8%.
The report is themed “Sustained Profitability Despite Challenging Business Environment” where we assess the key factors that influenced the performance of the banking sector in H1’2023, the key trends, the challenges banks faced, and areas that will be crucial for growth and stability of the banking sector going forward. As such, we shall address the following:
- Key Themes that Shaped the Banking Sector Performance in H1’2023,
- Summary of the Performance of the Listed Banking Sector in H1’2023,
- The Focus Areas of the Banking Sector Players Going Forward, and,
- Brief Summary and Ranking of the Listed Banks based on the outcome of our analysis.
Section I: Key Themes That Shaped the Banking Sector Performance in H1’2023
Below, we highlight the key themes that shaped the banking sector in H1’2023 which include; regulation, regional expansion through mergers and acquisitions, and asset quality:
- Regulation:
- Risk based Lending: Since the repeal of the Interest Cap Law in 2019, the Central Bank of Kenya has been developing a risk-based lending model aimed at pricing loans. The model's primary purpose is to enable banks to lend based on the anticipated risks of each borrower. Furthermore, this represents a shift away from the negative listing of defaulters and toward a new credit score rating system that does not deny borrowers credit based on the quality of their credit bureau reference ratings. The approach targets riskier borrowers, with the majority operating in micro, small, and medium-sized businesses that have struggled to obtain conventional credit. Notably, as of May 2023, 33 of the banks in the country had their models approved by the CBK, with Equity Bank being the first commercial bank to implement risk-based lending. However, the approval process of the models has been gradual in a bid to avoid causing distress to customers through high interest rates. Further, the full deployment has been slowed due to a lack of data to analyse the client's risk profile, and,
- Foreign Exchange Code: The Central Bank of Kenya announced the issuanceof the Foreign Exchange Code (the FX Code) on 22 March 2023 to commercial banks, in a move to regulate wholesale transactions of the foreign exchange market in Kenya. The measure was in response to the wide variation of exchange rate spread in the market, as discussed in our currency review note. The FX Code aims to promote a robust and transparent foreign currency market through the following reporting guidelines;
- Compliance with FX Code- All market participants (commercial banks and foreign exchange brokers) will be required to conduct a self-assessment and submit to the CBK a report on an institution’s level of compliance with the FX Code by 30 April 2023. Further, all market participants will be required to submit to CBK a detailed compliance implementation plan that is approved by its Board by 30 June 2023, and each participant must be fully compliant with the aforementioned code by 31 December 2023,
- Reporting Mechanism- All market participants will be required to submit a quarterly report to CBK, on the level of compliance to the FX Code within 14 days after the end of every calendar quarter,
- In the event of non-compliance, CBK may take appropriate enforcement and other administrative action including monetary penalties as provided for under the Banking Act against any market participant, and,
- Prohibitive Practices- The FX Code is majorly to identify practices that are geared towards market disruptions such as price quotations or manipulating price movements creating artificial delays, or false impression on market depth and liquidity by any market participants will result in heavy penalties. Additionally, market participants are not to engage in position or points parking (artificial transactions to conceal positions or transfer profits or losses).
- Regional Expansion through Mergers and Acquisitions: Kenyan banks are continuously looking at having an extensive regional reach and in H1’2023, there were three completed acquisition done by Commercial International Bank (Egypt) S.A.E (CIB), Equity Group Holdings Plc and Premier Bank Limited Somalia as follows:
-
- On 30 January 2023, the Central Bank of Kenya (CBK) announcedthat Commercial International Bank (Egypt) S.A.E (CIB) had completed acquisition of additional 49.0% shareholding of Mayfair CIB Bank Limited (MBL) at Kshs 5.0 bn following the earlier acquisition of 51.0% stake in MBL announced in April 2020. As such, MBL is now a fully owned subsidiary of CIB,
- On 31 January 2023, Equity Group Holdings Plc, through Equity Bank Kenya Limited (EBKL) announced that it had completed the acquisition of certain assets and liabilities of the local bank, Spire Bank Limited after obtaining all the required regulatory approvals. The completion of the acquisition followed the Assets and Liabilities Purchase Agreement, which was announced in September 2022, as highlighted in our Cytonn Weekly #37/2022. As such, Equity Bank Kenya Limited took over Spire Banks’s 12 branches as well as all existing depositors in Spire Bank, other than remaining deposits from its largest shareholder, Mwalimu Sacco. For more information, please see our Cytonn Monthly-January 2023, and,
- On 17 March 2023, the Central Bank of Kenya (CBK) announced that Premier Bank Limited Somalia (PBLS) had completed acquisition of 62.5% shareholding of First Community Bank Limited (FCB) effective 27 March 2023. This came after receiving regulatory approvals from the CBK and the Cabinet Secretary for the National Treasury. FCB, which has been in operation since June 2008, is classified as a tier 3 bank in Kenya with 18 branches and a market share of 0.3% as at December 2022. The acquisition by Premier Bank Limited Somalia (PBLS), came at a time when FCB has been struggling to meet regulatory Capital adequacy requirements. For more information, please see our Cytonn Weekly #11/2023.
- On 22 May 2023, the Central Bank of Kenya (CBK) announced the acquisition of 20.0% stake of Credit Bank Plc by Shorecap III, LP, a Private Equity fund registered under the laws of Mauritius, with Equator Capital Partners LLC as the managers of the fund. The value of the deal was not disclosed by the CBK, however, Shorecap III, LP will take over 7,289,928 ordinary shares which constitute of 20.0% of the ordinary shares of the Bank. The acquisition came after Oikocredit acquired 22.8% stake of the lender in August 2019, after paying a cash consideration of Kshs 1.0 bn, with the transaction trading at price to book (P/B) multiple of 1.5x. For more information, please see our Cytonn Weekly #21/2023, and,
- On 14 June 2023, Equity Group Holdings Plc (EGH) announced that it had entered into a binding agreement with Government of Rwanda, Rwanda Social Security Board and other investors of Compagnie Generale De Banque (Cogebanque) Plc Limited to acquire a 91.9% stake in the Rwanda based lender. Upon the completion of the acquisition, EGH plans to eventually merge the business of the Cogebanque with its Rwandan Subsidiary, Equity Bank Rwanda Plc. Additionally, EGH intends to make an offer to the remaining shareholders to acquire all the shares in Cogebanque in a move that will make EGH take over 100.0% of the issued shares of Cogebanque.
Below is a summary of the deals in the last 10 years that have either happened, been announced or expected to be concluded:
|
Cytonn Report: Banking sector Deals and Acquisitions |
||||||
|
Acquirer |
Bank Acquired |
Book Value at Acquisition (Kshs bn) |
Transaction Stake |
Transaction Value (Kshs bn) |
P/Bv Multiple |
Date |
|
Equity Group |
Cogebanque PLC ltd |
5.7 |
91.90% |
6.7 |
1.3x |
Jun-23 |
|
Shorecap III |
Credit Bank Plc |
3 |
20.00% |
Undisclosed |
N/A |
Jun-23 |
|
Premier Bank Limited |
First Community Bank |
2.8 |
62.50% |
Undisclosed |
N/A |
Mar-23 |
|
KCB Group PLC |
Trust Merchant Bank (TMB) |
12.4 |
85.00% |
15.7 |
1.5x |
Dec-22 |
|
Equity Group |
Spire Bank |
Unknown |
Undisclosed |
Undisclosed |
N/A |
Sep-22* |
|
Access Bank PLC (Nigeria)* |
Sidian Bank |
4.9 |
83.40% |
4.3 |
1.1x |
June-22* |
|
KCB Group |
Banque Populaire du Rwanda |
5.3 |
100.00% |
5.6 |
1.1x |
Aug-21 |
|
I&M Holdings PLC |
Orient Bank Limited Uganda |
3.3 |
90.00% |
3.6 |
1.1x |
Apr-21 |
|
KCB Group** |
ABC Tanzania |
Unknown |
100% |
0.8 |
0.4x |
Nov-20* |
|
Co-operative Bank |
Jamii Bora Bank |
3.4 |
90.00% |
1 |
0.3x |
Aug-20 |
|
Commercial International Bank |
Mayfair Bank Limited |
1 |
51.00% |
Undisclosed |
N/D |
May-20* |
|
Access Bank PLC (Nigeria) |
Transnational Bank PLC. |
1.9 |
100.00% |
1.4 |
0.7x |
Feb-20* |
|
Equity Group ** |
Banque Commerciale Du Congo |
8.9 |
66.50% |
10.3 |
1.2x |
Nov-19* |
|
KCB Group |
National Bank of Kenya |
7 |
100.00% |
6.6 |
0.9x |
Sep-19 |
|
CBA Group |
NIC Group |
33.5 |
53%:47% |
23 |
0.7x |
Sep-19 |
|
Oiko Credit |
Credit Bank |
3 |
22.80% |
1 |
1.5x |
Aug-19 |
|
CBA Group** |
Jamii Bora Bank |
3.4 |
100.00% |
1.4 |
0.4x |
Jan-19 |
|
AfricInvest Azure |
Prime Bank |
21.2 |
24.20% |
5.1 |
1.0x |
Jan-18 |
|
KCB Group |
Imperial Bank |
Unknown |
Undisclosed |
Undisclosed |
N/A |
Dec-18 |
|
SBM Bank Kenya |
Chase Bank Ltd |
Unknown |
75.00% |
Undisclosed |
N/A |
Aug-18 |
|
DTBK |
Habib Bank Kenya |
2.4 |
100.00% |
1.8 |
0.8x |
Mar-17 |
|
SBM Holdings |
Fidelity Commercial Bank |
1.8 |
100.00% |
2.8 |
1.6x |
Nov-16 |
|
M Bank |
Oriental Commercial Bank |
1.8 |
51.00% |
1.3 |
1.4x |
Jun-16 |
|
I&M Holdings |
Giro Commercial Bank |
3 |
100.00% |
5 |
1.7x |
Jun-16 |
|
Mwalimu SACCO |
Equatorial Commercial Bank |
1.2 |
75.00% |
2.6 |
2.3x |
Mar-15 |
|
Centum |
K-Rep Bank |
2.1 |
66.00% |
2.5 |
1.8x |
Jul-14 |
|
GT Bank |
Fina Bank Group |
3.9 |
70.00% |
8.6 |
3.2x |
Nov-13 |
|
Average |
|
|
75.0% |
|
1.3x |
|
|
Average: 2013 to 2018 |
|
|
73.5% |
|
1.7x |
|
|
Average: 2019 to 2023 |
|
|
75.8% |
|
0.9x |
|
|
* Announcement Date ** Deals that were dropped |
||||||
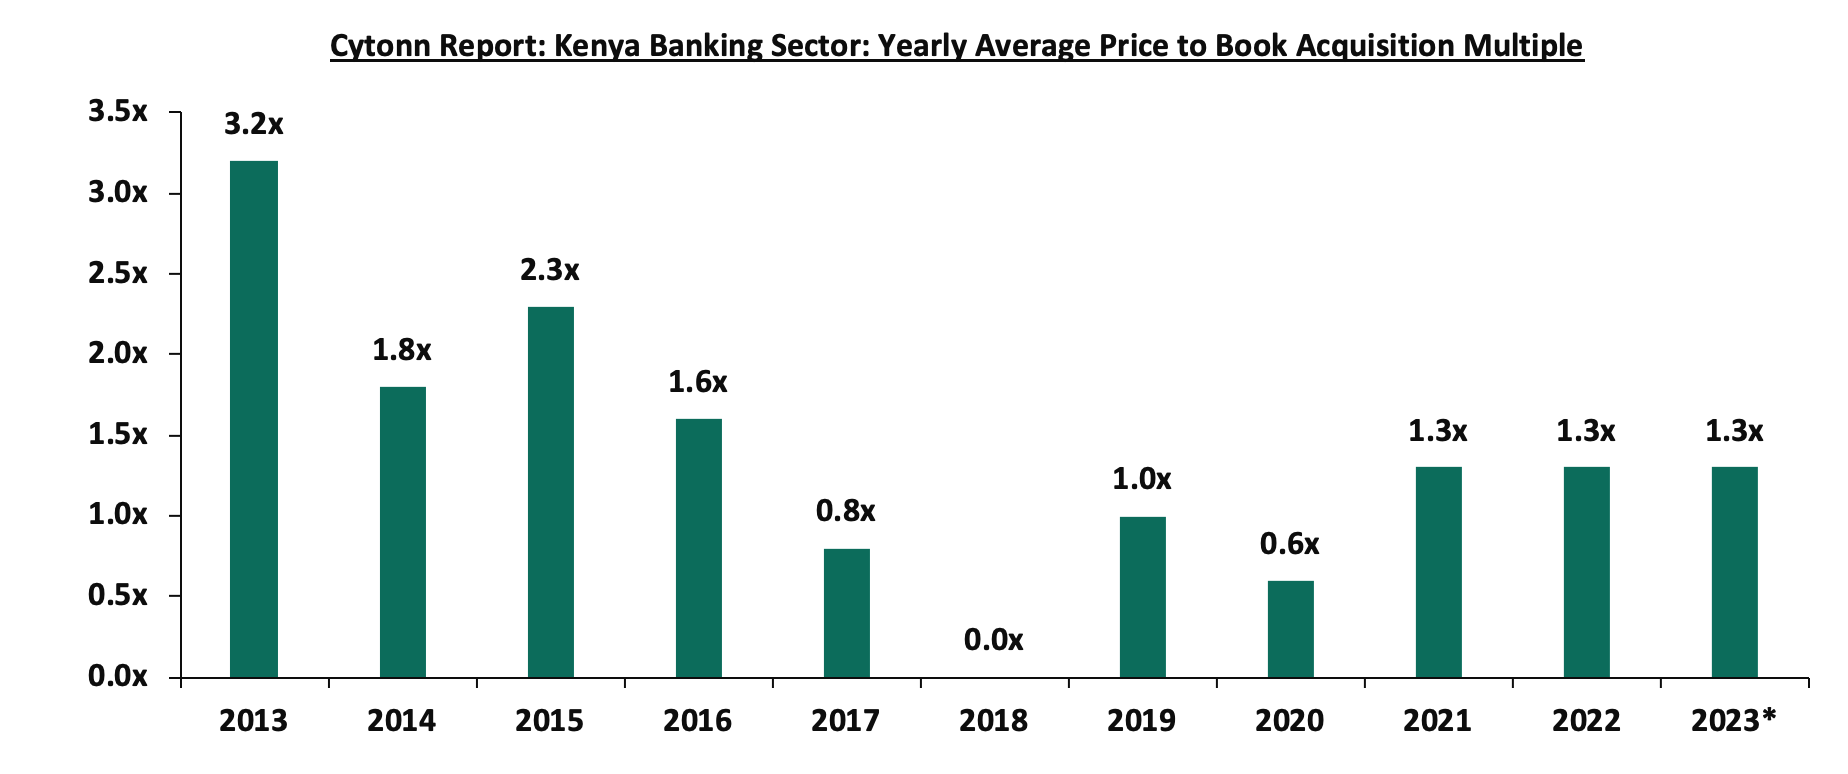
So far in 2023, the average acquisition valuations for banks have remained unchanged at 1.3x, similar to what was recorded in 2022. As such, the valuations still remain low compared to historical prices paid, as highlighted in the chart below;
*Data as of June 2023
As at the end of H1’2023, the number of commercial banks in Kenya stood at 38, same as in H1’2022 but lower than 43 licensed banks in FY’2015. The ratio of the number of banks per 10 million populations in Kenya now stands at 6.9x, which is a reduction from 9.0x in FY’2015 demonstrating continued consolidation in the banking sector. However, despite the ratio improving, Kenya still remains overbanked as the number of banks remains relatively high compared to the African major economies. To bring the ratio to 5.5x, we ought to reduce the number of banks from the current 38 banks to about 30 banks. For more on this see our topical.
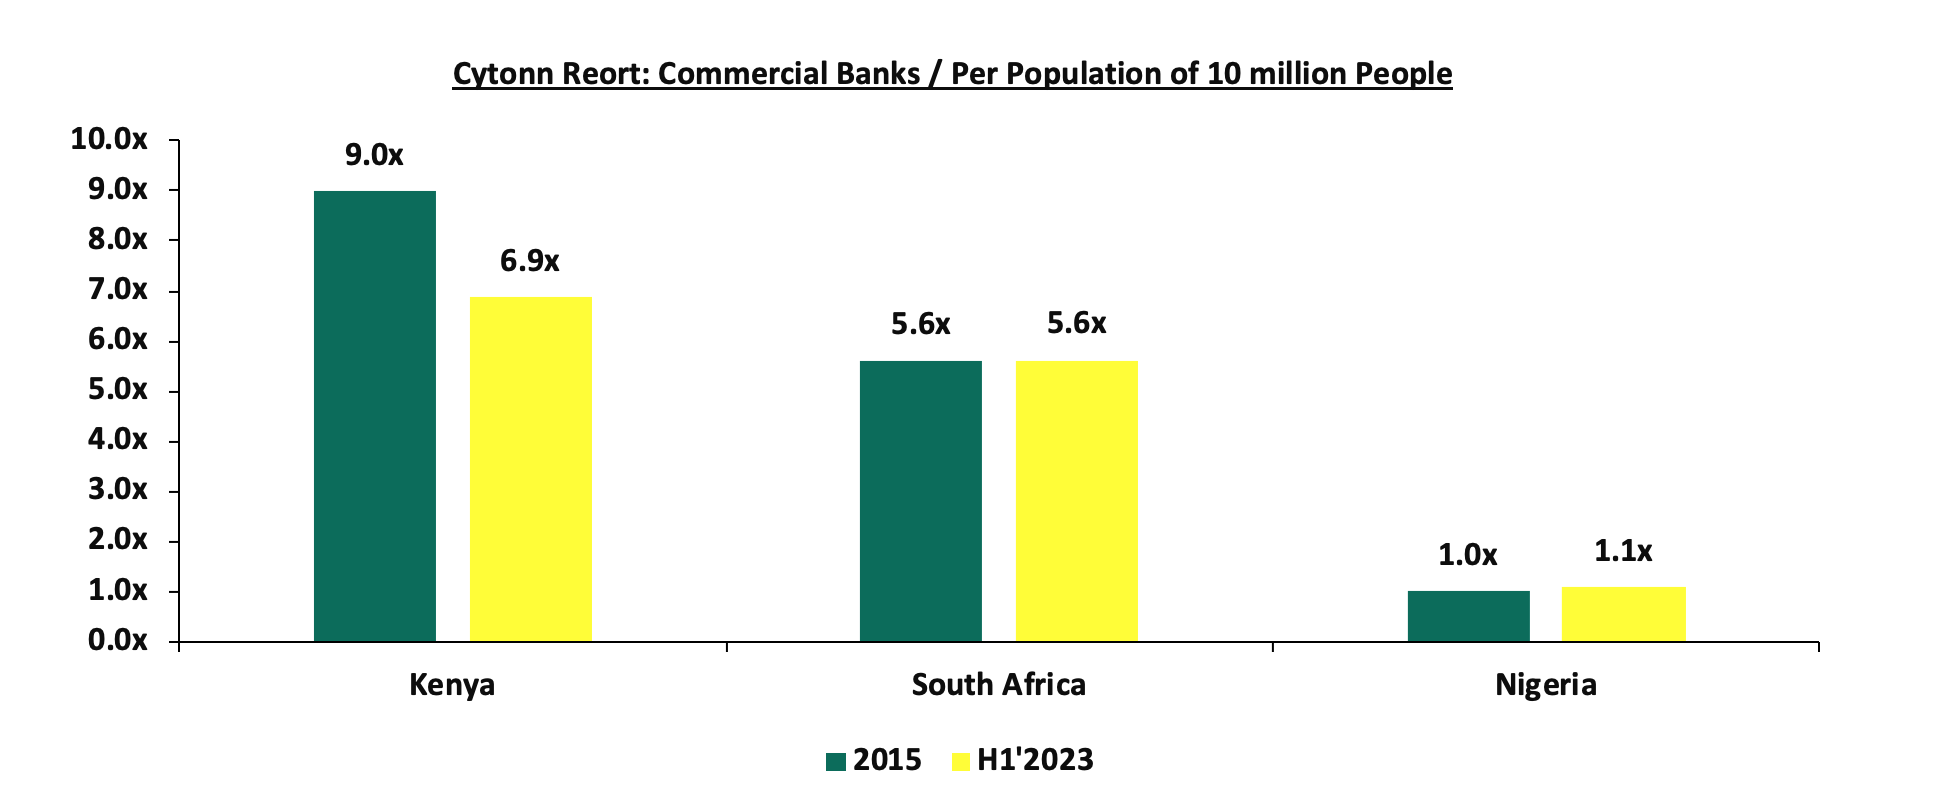
Source: World Bank, Central Bank of Kenya, South Africa Reserve Bank, Central Bank of Nigeria; * Data as of June 2023
- Asset Quality: Asset quality for listed banks improved in H1’2023, with the weighted average Gross Non-Performing Loan ratio (NPL) decreasing by 0.3% points to 12.7%, from 13.0% recorded in H1’2022. The performance remained 3.0% points above the ten-year average of 9.8%. The deterioration in asset quality in H1’2023 was mainly driven by 3.4% points increase in I&M Bank NPL ratio to 12.7%, from 9.3% in H1’2022. The chart below highlights the asset quality trend for the listed banks:
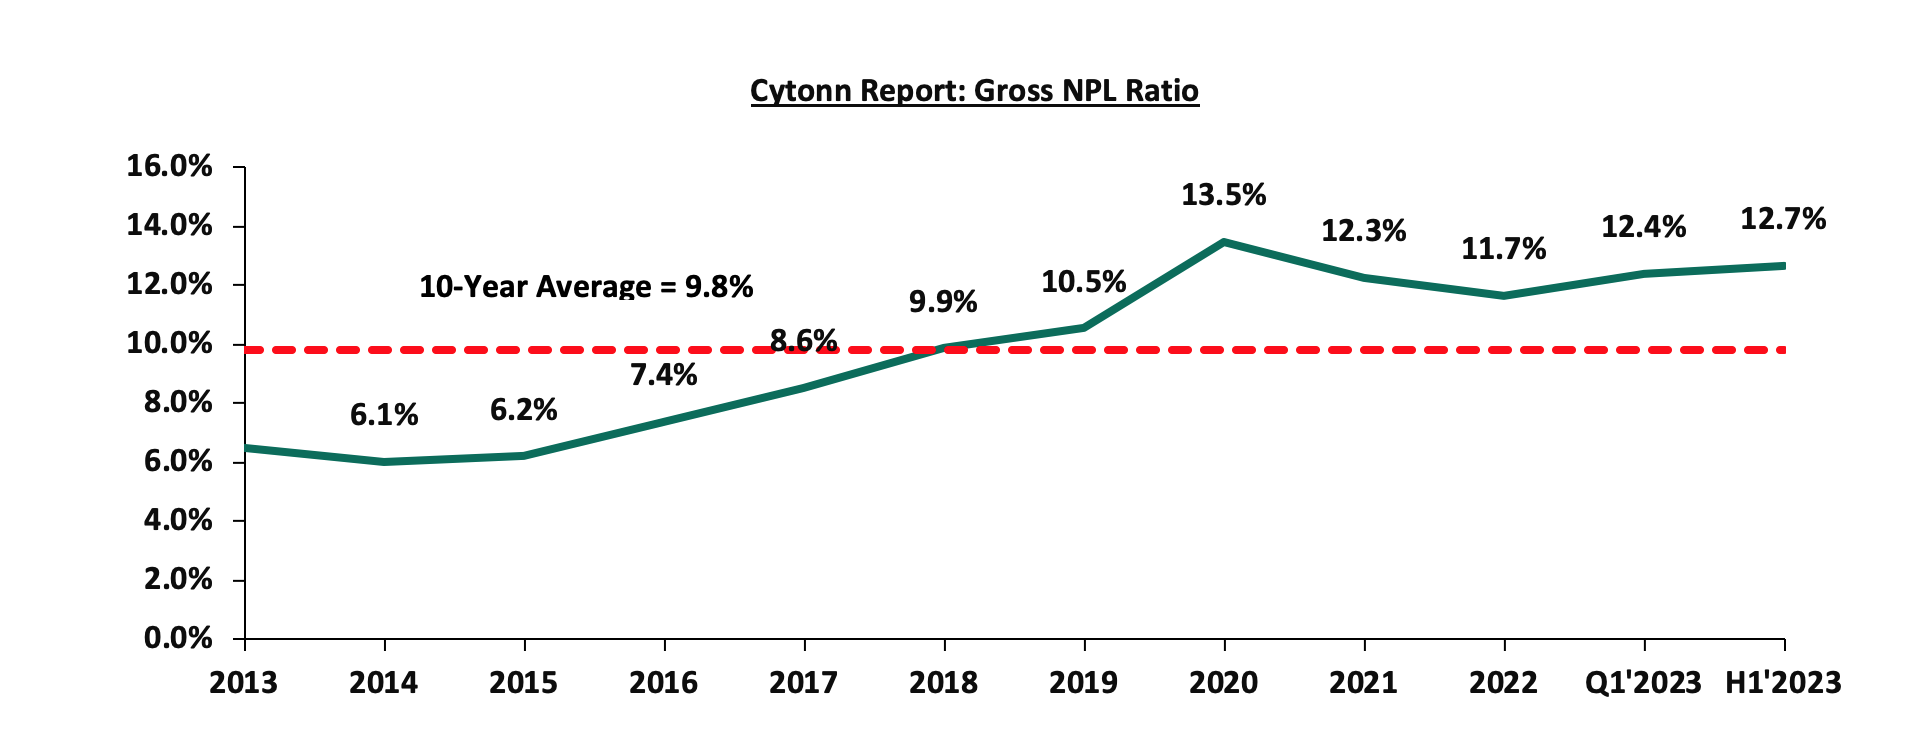
The deterioration in I&M Bank asset quality was mainly attributable to 57.5% increase in Gross non-performing loans to Kshs 36.6 bn in H1’2023 from Kshs 23.3 bn in H1’2022, which outpaced the 15.6% increase in gross loans to Kshs 288.0 bn from Kshs 249.1 bn recorded in H1’2022. However, the deterioration in listed banks asset quality was mitigated by an improvement in KCB Group’s Asset quality, with Gross NPL ratio decreasing to 17.2% in H1’2023 from 21.4% in H1’2022, attributable to 30.6% increase in Gross loans to Kshs 1057.9 bn, from Kshs 809.8 bn in H1’2022, which outpaced the 4.9% increase in gross non-performing loans to Kshs 182.0 bn, from Kshs 173.4 bn recorded in H1’2022. A total of 5 out of the ten listed Kenyan banks recorded improvement in asset quality, despite the deteriorated general business environment which was evidenced by the average Purchasing Managers Index coming at 48.7 in H1’2023, lower than the average of 49.3 recorded in the same period in 2022. Going forward, we expect credit risk to remain elevated in the short to medium term mainly on the back of tough operating environment occasioned by elevated inflationary pressures as well as sustained depreciation of the Kenya shilling.
The table below highlights the asset quality for the listed banking sector:
|
Cytonn Report: Listed Banks Asset Quality |
||||||
|
|
H1'2023 NPL Ratio* |
H1'2022 NPL Ratio** |
% point change in NPL Ratio |
H1'2023 NPL Coverage* |
H1'2022 NPL Coverage** |
% point change in NPL Coverage |
|
Stanbic Bank |
8.1% |
9.4% |
(1.3%) |
57.4% |
56.0% |
1.4% |
|
ABSA Bank Kenya |
9.5% |
7.1% |
2.4% |
69.4% |
78.5% |
(9.1%) |
|
Equity Group |
11.2% |
8.8% |
2.4% |
54.5% |
64.1% |
(9.6%) |
|
Diamond Trust Bank |
12.3% |
12.8% |
(0.5%) |
46.4% |
44.2% |
2.2% |
|
I&M Holdings |
12.7% |
9.3% |
3.4% |
49.8% |
77.5% |
(27.7%) |
|
NCBA Group |
13.4% |
13.6% |
(0.2%) |
57.8% |
62.0% |
(4.2%) |
|
Standard Chartered Bank Kenya |
14.4% |
15.4% |
(1.0%) |
84.8% |
83.9% |
0.9% |
|
Co-operative Bank of Kenya |
14.6% |
14.1% |
0.5% |
60.7% |
65.8% |
(5.1%) |
|
KCB |
17.2% |
21.4% |
(4.2%) |
51.1% |
45.8% |
5.3% |
|
HF Group |
23.1% |
20.1% |
3.0% |
72.0% |
77.6% |
(5.6%) |
|
Mkt Weighted Average |
12.7% |
13.0% |
(0.3%) |
60.0% |
62.3% |
(2.3%) |
|
*Market cap weighted as at 22/09/2023 |
||||||
|
**Market cap weighted as at 09/09/2022 |
||||||
Key take-outs from the table include;
- Asset quality for the listed banks improved during the H1’2023, with market weighted average NPL decreasing by 0.3% points to 12.7% from a 13.0% in H1’2022. The improvement in asset quality was mainly driven by improvement in KCB bank, Stanbic bank, Stanchart Bank, DTB-K and NCBA Group asset quality with their NPL ratio decreasing by 4.2%, 1.3%, 1.0%, 0.5% and 0.2% respectively,
- I&M Holdings had the highest NPL ratio jump by 3.4% points to 12.7% from 9.3% points in H1’2022, attributable to 57.5% increase in Gross non-performing loans to Kshs 36.6 bn in H1’2023 from Kshs 23.3 bn in H1’2022, which outpaced the 15.6% increase in gross loans to Kshs 288.0 bn from Kshs 249.1 bn recorded in H1’2022, and,
- Market weighted average NPL Coverage for the listed banks decreased by 2.3% points to 60.0% in H1’2023, from 62.3% recorded in H1’2022, majorly on the back of decreased NPL coverage recorded by I&M Holdings, Equity Group, ABSA Bank, HF Group and Co-operative Bank of Kenya by 27.7%, 9.6%, 9.1%, 5.6% and 5.1% respectively in H1’2022. However, KCB Group, Diamond Trust Bank and Stanbic bank NPL coverage increased by 5.3% points, 2.2% points and 1.4% points to 51.1%, 46.4% and 57.4% respectively in H1’2023.
Section II: Summary of the Performance of the Listed Banking Sector in H1’2023
The table below highlights the performance of the banking sector, showing the performance using several metrics, and the key take-outs of the performance;
|
Cytonn Report: Listed Banks Performance in H1’2023 |
|||||||||||||
|
Bank |
Core EPS Growth |
Interest Income Growth |
Interest Expense Growth |
Net Interest Income Growth |
Net Interest Margin |
Non-Funded Income Growth |
NFI to Total Operating Income |
Growth in Total Fees & Commissions |
Deposit Growth |
Growth in Government Securities |
Loan to Deposit Ratio |
Loan Growth |
Return on Average Equity |
|
HF Group |
264.8% |
18.5% |
13.0% |
24.2% |
5.2% |
10.1% |
30.1% |
51.1% |
4.0% |
6.3% |
93.5% |
9.1% |
4.7% |
|
Stanbic Bank |
47.0% |
46.3% |
51.5% |
44.4% |
7.1% |
29.7% |
42.5% |
22.5% |
10.5% |
10.1% |
98.6% |
15.3% |
18.5% |
|
ABSA Bank |
32.0% |
36.9% |
50.3% |
33.2% |
9.0% |
25.7% |
29.7% |
21.1% |
18.1% |
(3.9%) |
95.6% |
21.6% |
27.7% |
|
SCBK |
27.7% |
33.4% |
0.9% |
38.3% |
8.0% |
26.8% |
33.7% |
11.7% |
(1.1%) |
(31.7%) |
51.3% |
13.2% |
23.9% |
|
NCBA Group |
20.3% |
21.7% |
29.7% |
16.3% |
6.0% |
(2.6%) |
44.5% |
10.0% |
10.3% |
(0.5%) |
56.6% |
16.7% |
18.2% |
|
DTBK |
10.6% |
32.4% |
53.7% |
17.8% |
5.3% |
42.2% |
29.7% |
36.7% |
20.6% |
4.2% |
67.3% |
20.4% |
10.2% |
|
Equity Group |
7.8% |
27.0% |
54.3% |
16.5% |
7.2% |
41.2% |
44.0% |
38.3% |
21.0% |
17.6% |
69.5% |
25.6% |
29.1% |
|
Co-op Bank |
5.9% |
12.0% |
38.9% |
2.3% |
8.2% |
4.0% |
39.1% |
8.4% |
22.7% |
2.9% |
78.8% |
10.7% |
22.2% |
|
I&M Holdings |
2.2% |
22.1% |
31.2% |
16.1% |
6.2% |
36.7% |
36.1% |
12.1% |
13.9% |
(7.6%) |
75.6% |
16.7% |
15.0% |
|
KCB |
(18.3%) |
28.6% |
76.6% |
12.1% |
6.7% |
43.4% |
37.7% |
56.1% |
61.9% |
30.1% |
65.6% |
32.1% |
19.1% |
|
H1'23 Mkt Weighted Average* |
14.3% |
28.2% |
44.8% |
21.0% |
7.3% |
27.9% |
38.9% |
26.6% |
21.3% |
5.3% |
72.3% |
20.5% |
22.9% |
|
H1'22 Mkt Weighted Average** |
34.0% |
18.0% |
18.6% |
17.7% |
7.3% |
24.4% |
37.1% |
17.9% |
11.3% |
11.6% |
72.7% |
17.7% |
21.9% |
|
*Market cap weighted as at 22/09/2023 |
|||||||||||||
|
**Market cap weighted as at 09/09/2022 |
|||||||||||||
Key takeaways from the table include:
- Listed banks recorded a 14.3% growth in core Earnings per Share (EPS) in H1’2023, compared to the weighted average growth of 34.0% in H1’2022, an indication of sustained performance despite the tough operating environment experienced in H1’2023 on the back of elevated inflationary pressures. The performance during the period was mainly supported by a 27.9% weighted average growth in non-funded income, coupled with a 21.0% weighted average growth in net interest income,
- Listed banks investments in government securities slowed down in H1’2023, having recorded a market weighted average growth of 5.3% compared to a 11.6% growth recorded in H1’2022. The slowed growth of investment in Kenya government securities is partly attributable to the increased perceived risk of default by the government, mainly on the back of high debt sustainability concerns given the current high public debt stock as well as the upcoming Eurobond maturity in June 2024,
- The listed banks Net loans and advances to customers recorded a weighted average growth of 20.5% in H1’2023 compared to 17.7% in H1’2023, an indication of increased lending despite the elevated credit risk,
- Interest income recorded a weighted average growth of 28.2% in H1’2023, compared to 18.0% in H1’2022. Similarly, interest expenses recorded a market weighted average growth of 44.8% in H1’2023 compared to a growth of 18.6% in H1’2022. As such, net interest income recorded a weighted average growth of 21.0% in H1’2022 compared to 17.7% in H1’2022,
- The listed banks recorded a 22.9% weighted average growth on return on average equity (RoaE), 1.0% point higher than the 21.9% growth recorded in H1’2022. Additionally, the entire banking sector’s Return On Equity (ROE) recorded 3.2% points increase to 33.0% in H1’2023, from 26.8% recorded in H1’2022. As such, the Kenyan banking sector continues to record high profitability compared to other economies in the world, as highlighted in the chart below
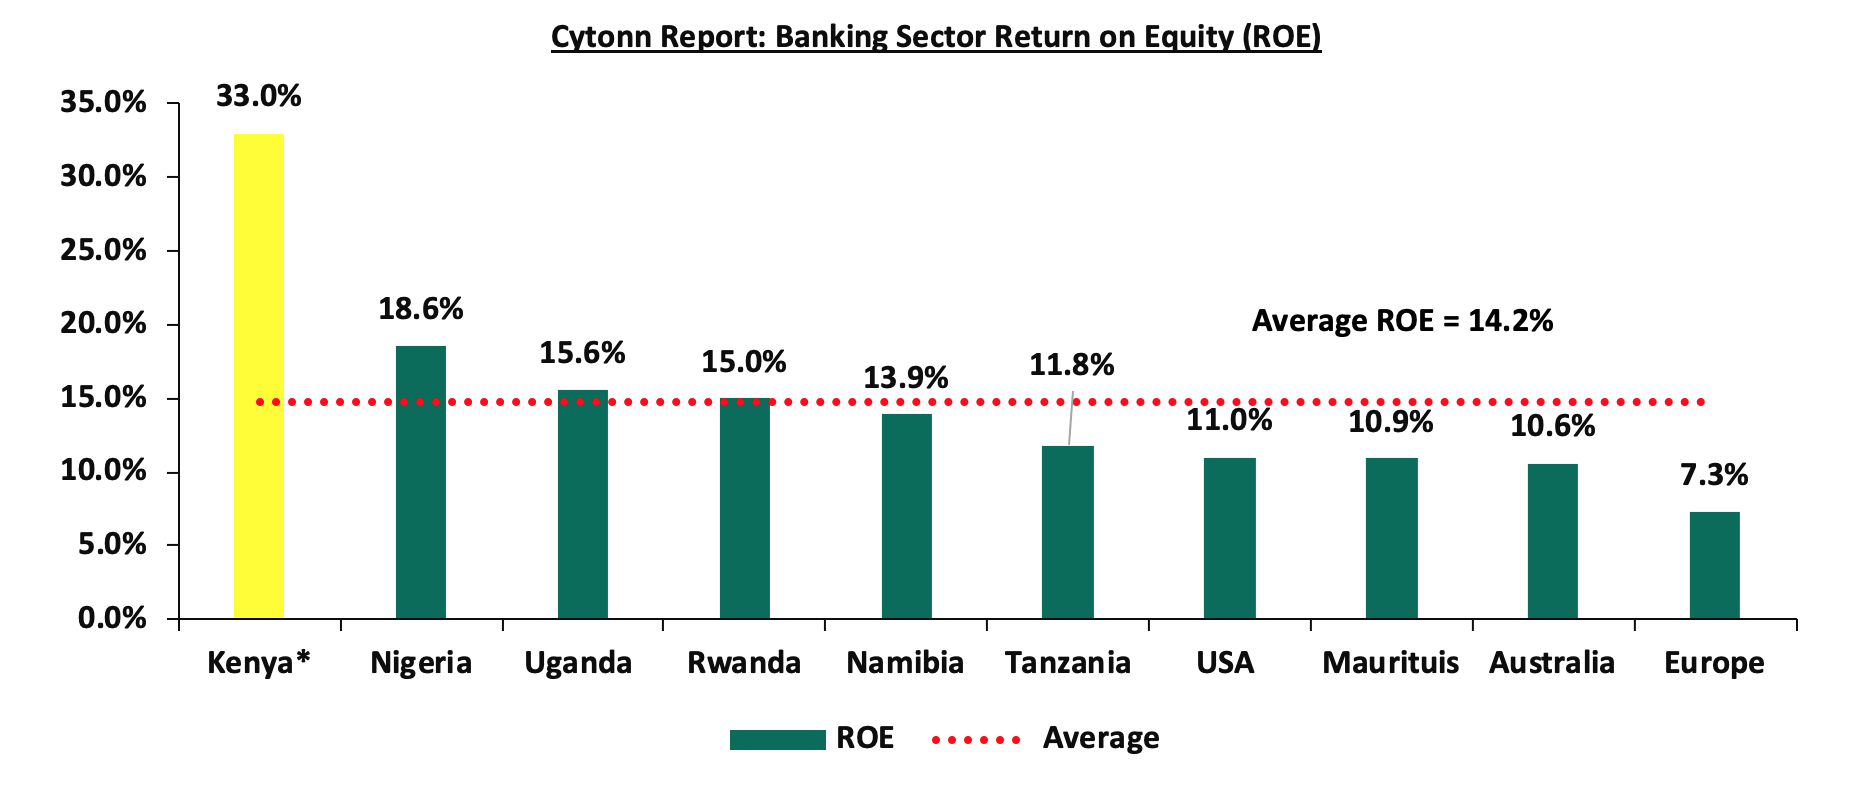
Source: Online research, * Figure as of H1’2023
Section III: Outlook of the banking sector
The banking sector continued to showcase sustained performance despite the tough operating environment occasioned by elevated inflationary pressures, as evidenced by the increase in their profitability, with the Core Earnings Per Share (EPS) growing by 14.3%, majorly supported by the Non-Funded income as banks continued to implement their revenue diversification strategies. However, in the short to medium term, we expect profitability to be weighed down by the expected increase in provisioning aimed at cushioning banks from the elevated credit risk arising from the deteriorated business environment. As such, we expect the future performance of the banking sector to be mainly supported by the following key factors:
- Regional Expansion and Further Consolidation: Consolidation remains a key theme going forward, with the current environment offering opportunities for well-capitalized banks to expand and take advantage of the market's low valuations, as well as further consolidate out smaller and less-capitalized banks. Notably, the majority of the bigger banks have continued to cushion unsystematic risks specific to the local market by expanding their operations into other African nations. Banks such as KCB and Equity Group have been leveraging expansion and consolidation, which has largely contributed to their increased asset base as well as earnings growth. As such, we expect to see a continued expansion trend aimed at revenue optimization,
- Revenue Diversification: In H1’2023, non-funded income (NFI) recorded a 27.9% weighted average growth compared to a 24.4% weighted growth in H1’2022, with many banks diversifying their revenue sources. Consequentially, the weighted average contribution of NFI to total operating income came in at 38.9% in H1’2023, 1.8% points higher than the 37.1% weighted average growth contribution recorded in H1’2022. As such, there exists an opportunity for the sector to further increase NFI contributions to revenue given the continuous adoption of digitization, and,
- Growth in Interest income: Going forward, we expect interest income growth to remain a key driver in the banking industry, as evidenced by the weighted average growth of 28.2% in H1’2023, compared to 18.0% recorded in H1’2022. Additionally, the continued approval of banks risk-based lending models will enable banks to effectively price their risk, expand loan books, and consequently increase their interest income.
Section IV: Brief Summary and Ranking of the Listed Banks
As per our analysis of the banking sector from a franchise value and a future growth opportunity perspective, we carried out a comprehensive ranking of the listed banks. For the franchise value ranking, we included the earnings and growth metrics as well as the operating metrics shown in the table below in order to carry out a comprehensive review of the banks:
|
Cytonn Report: Listed Banks Earnings, Growth and Operating Metrics |
||||||||
|
Bank |
Loan to Deposit Ratio |
Cost to Income (With LLP) |
Return on Average Capital Employed |
Deposits/ Branch (bn) |
Gross NPL Ratio |
NPL Coverage |
Tangible Common Ratio |
Non-Funded Income/Revenue |
|
Absa Bank |
95.6% |
55.9% |
27.7% |
3.9 |
9.5% |
69.4% |
12.6% |
29.7% |
|
NCBA Group |
56.6% |
60.2% |
18.2% |
4.8 |
13.4% |
57.8% |
12.5% |
46.0% |
|
Equity Bank |
69.5% |
57.6% |
29.1% |
3.3 |
11.2% |
54.5% |
10.5% |
44.0% |
|
KCB Group |
65.6% |
69.3% |
19.1% |
2.4 |
17.2% |
45.8% |
10.4% |
37.7% |
|
SCBK |
51.3% |
53.8% |
23.9% |
8.9 |
14.4% |
84.8% |
14.7% |
33.7% |
|
Coop Bank |
78.8% |
54.1% |
22.2% |
2.4 |
14.6% |
60.7% |
15.5% |
39.1% |
|
Stanbic Bank |
98.6% |
53.5% |
18.5% |
9.5 |
11.3% |
77.0% |
14.4% |
42.5% |
|
DTBK |
67.3% |
68.1% |
10.2% |
3.1 |
12.3% |
46.4% |
12.4% |
29.7% |
|
I&M Holdings |
75.6% |
65.6% |
15.0% |
6.1 |
12.7% |
49.8% |
14.3% |
36.1% |
|
HF Group |
93.5% |
89.0% |
4.7% |
1.6 |
23.1% |
72.0% |
14.2% |
30.4% |
|
H1'2023 Weighted Average |
72.4% |
58.8% |
22.9% |
4.6 |
12.9% |
60.9% |
12.6% |
39.1% |
|
Market cap weighted as at 21/09/2023 |
||||||||
The overall ranking was based on a weighted average ranking of Franchise value (accounting for 60.0%) and intrinsic value (accounting for 40.0%). The Intrinsic Valuation is computed through a combination of valuation techniques, with a weighting of 40.0% on Discounted Cash-flow Methods, 35.0% on Residual Income and 25.0% on Relative Valuation, while the Franchise ranking is based on banks operating metrics, meant to assess efficiency, asset quality, diversification, and profitability, among other metrics. The overall Q1’2023 ranking is as shown in the table below:
|
Cytonn Report: Listed Banks H1’2023 Rankings |
|||||
|
Bank |
Franchise Value Rank |
Intrinsic Value Rank |
Weighted Rank Score |
H1’2022 Rank |
H1’2023 Rank |
|
Absa Bank |
3 |
3 |
3.0 |
3 |
1 |
|
I&M Holdings |
6 |
2 |
3.6 |
5 |
2 |
|
KCB Group |
8 |
1 |
3.8 |
4 |
3 |
|
Coop Bank |
2 |
6 |
4.4 |
2 |
4 |
|
Stanbic Bank |
1 |
9 |
5.8 |
6 |
5 |
|
Equity Bank |
4 |
7 |
5.8 |
1 |
6 |
|
NCBA Group |
7 |
5 |
5.8 |
9 |
7 |
|
DTBK |
9 |
4 |
6.0 |
8 |
8 |
|
SCBK |
5 |
8 |
6.8 |
7 |
9 |
|
HF Group |
10 |
10 |
10.0 |
10 |
10 |
Major Changes from the H1’2023 Ranking are:
- ABSA Bank’s rank improved to position 1 in H1’2023 from position 3 in H1’2022, majorly due to strong franchise and intrinsic value score, attributable to improvement in the bank’s management quality, with the cost to income ratio with LLPs declining to 55.9% in H1’2023, from 56.4% in H1’2022. Similarly, the cost to income ratio without LLPs declined by 5.2% points to 37.0% in H1’2023, from 42.3% in H1'2022. Additionally, the bank’s Net Interest Margin increased by 1.4% points to 9.0% in H1’2023 from 7.6% in H1’2022, and,
- Equity Group’s rank declined to position 6 in H1’2023, from position 1 in H1’2022, mainly due to a deterioration in the group’s asset quality as the gross NPL ratio rose to 11.2%, from the 8.8% recorded in H1’2022. Additionally, there was a deterioration in operating efficiency, with the cost-to income ratio with LLPs increasing by 4.7% points to 57.6% from 52.9% recorded in H1’2022, while the cost-to ratio without LLPs also increased by 2.3% to 49.0% from 46.7% in H1’2022.
For more information, see our Cytonn H1’2023 Listed Banking Sector Review
Disclaimer: The views expressed in this publication are those of the writers where particulars are not warranted. This publication is meant for general information only and is not a warranty, representation, advice or solicitation of any nature. Readers are advised in all circumstances to seek the advice of a registered investment advisor.

- Talk to us
- Kenya
- P.O Box 20695 - 00200, Nairobi, Kenya
- Cell +254709101200
- Tel +254709101200
- WhatsApp +254741676635
- United States
- +254709101200
- DOWNLOAD OUR APP
-


- Kenya
- 8th Floor, Pinetree Plaza, Kaburu Drive, Ngong Road, Nairobi, Kenya
- USA
- Suite 1150, 1775 Eye Street NW, USA, Washington DC 20006, USA
- Investments
- High Yield
- Private Equity
- Real Estate
- Real Estate
- RiverRun Estates
- Cytonn Towers
- The Ridge
- Taraji Heights
- The Alma