Kenya’s Listed Banks Q3’2022 Report & Cytonn Weekly #49/2022
By Cytonn Research, Dec 11, 2022
Executive Summary
Fixed Income
During the week, T-bills were undersubscribed for the second successive week, with the overall subscription rate coming in at to 97.1%, up from the 82.4% recorded the previous week. The continued low subscription is partly attributable to tightened liquidity in the money market with the average interbank rate increasing to 5.2% from 5.1% recorded the previous week. Investor’s preference for the shorter 91-day paper persisted, with the paper receiving bids worth Kshs 16.7 bn against the offered Kshs 4.0 bn, translating to a subscription rate of 416.3%, up from 330.7% recorded the previous week. The subscription rate for the 364-day declined to 21.5% from 26.4% recorded the previous week, while the subscription rate for the 182-day paper increased to 44.9% from 39.2% recorded the previous week. The yields on the government papers were on an upward trajectory, with the yields on the 364-day, 182-day and 91-day papers increasing by 2.0 bps, 4.4 bps and 5.2 bps to 10.2%, 9.8% and 9.3%, respectively;
In the Primary Bond Market, the Central Bank of Kenya released results for the recently re-opened bonds; FXD1/2018/25 and FXD1/2022/25 with effective tenors to maturity of 5.6 years and 24.9 years respectively. The bonds recorded an undersubscription of 76.4%, partly attributable to investors’ preference for the shorter dated papers as they sought to avoid duration risk, coupled with the tightened liquidity in the money market. The government issued the bonds seeking to raise Kshs 40.0 bn for budgetary support, received bids worth Kshs 30.6 bn and accepted bids worth Kshs 24.3 bn, translating to a 79.6% acceptance rate. The weighted average yield for the bonds came in at 13.8% and 14.5% for FXD1/2008/20 and FXD1/2022/25, respectively, while the coupon rates came in at 13.8% and 14.2% for FXD1/2008/20 and FXD1/2022/25, respectively;
Additionally, Stanbic Bank released its monthly Purchasing Manager’s Index (PMI), highlighting that the index for the month of November improved marginally to 50.9 from 50.2 recorded in October 2022, attributable to improvement of new order inflows;
Equities
During the week, the equities recorded mixed performance, with NSE 25 gaining by 0.2%, while NSE 20 declined by 0.2%. NASI remained relatively unchanged, taking YTD performance to losses of 24.3%, 14.0% and 17.8% for NASI, NSE 20 and NSE 25, respectively. The equities market performance was mainly driven by gains recorded by large cap stocks such as NCBA Group of 6.4% while both ABSA Bank and EABL both gained by 1.7%. The gains were however weighed down by losses recorded by large cap stocks such as KCB Group of 2.3%, while Safaricom and Bamburi both declined by 0.2%;
Real Estate
During the week, the Kenyan national government in partnership with the United Nations Habitat, and, Epco Builders, a local private developer, broke ground for the construction of Mavoko Affordable Housing Project in Syokimau, Machakos County. In the retail sector, local retailer Naivas Supermarket opened two new outlets at Boardwalk Mall located in Parklands along Ojijo Road and at Nairobi West Shopping Centre in Nairobi West, bringing the number of its operating outlets countrywide to 90. In the hospitality sector, hotel group Hemingways Collection took over management of the exclusive nine-bedroom boutique Eden hotel, located in Karen. In the infrastructure sector, the government of Kenya in conjunction with the United Kingdom (UK), initiated the launch of Nairobi Railways City project, a Kshs 30.0 bn transit-oriented and multi-modal urban Development within the Central Business District of Nairobi City. In the Real Estate Investment Trusts (REITs) segment, Fahari I-REIT closed the week trading at an average price of Kshs 6.6 per share on the Nairobi Stock Exchange, a 2.5% increase from Kshs 6.5 per share recorded the previous week, while Acorn D-REIT and I-REIT closed the week trading at Kshs 23.8 and Kshs 20.9 per unit, respectively, on the Unquoted Securities Platform as at 2nd December 2022, a 19.2% and 4.4% gain for the D-REIT and I-REIT, respectively, from the Kshs 20.0 inception price;
Focus of the Week
Following the release of the Q3’2022 results by Kenyan listed banks, the Cytonn Financial Services Research Team undertook an analysis on the financial performance of the listed banks and identified the key factors that shaped the performance of the sector;
Investment Updates:
- Weekly Rates:
- Cytonn Money Market Fund closed the week at a yield of 10.73%. To invest, dial *809# or download the Cytonn App from Google Playstore here or from the Appstore here;
- Cytonn High Yield Fund closed the week at a yield of 13.89% p.a. To invest, email us at sales@cytonn.com and to withdraw the interest, dial *809# or download the Cytonn App from Google Playstore here or from the Appstore here;
- We continue to offer Wealth Management Training every Wednesday and every third Saturday of the month, from 9:00 am to 11:00 am, through our Cytonn Foundation. The training aims to grow financial literacy among the general public. To register for any of our Wealth Management Trainings, click here;
- If interested in our Private Wealth Management Training for your employees or investment group, please get in touch with us through wmt@cytonn.com;
- Any CHYS and CPN investors still looking to convert are welcome to consider one of the five projects currently available for assignment, click here for the latest term sheet;
- Cytonn Insurance Agency acts as an intermediary for those looking to secure their assets and loved ones’ future through insurance namely; Motor, Medical, Life, Property, WIBA, Credit and Fire and Burglary insurance covers. For assistance, get in touch with us through insuranceagency@cytonn.com;
- Cytonnaire Savings and Credit Co-operative Society Limited (SACCO) provides a savings and investments avenue to help you in your financial planning journey. To enjoy competitive investment returns, kindly get in touch with us through clientservices@cytonn.com;
Real Estate Updates:
- For an exclusive tour of Cytonn’s real estate developments, visit: Sharp Investor's Tour, and for more information, email us at sales@cytonn.com;
- Phase 3 of The Alma is now ready for occupation and the show house is open daily. To rent please email properties@cytonn.com;
- We have 8 investment-ready projects, offering attractive development and buyer targeted returns; See further details here: Summary of Investment-ready Projects;
- For Third Party Real Estate Consultancy Services, email us at rdo@cytonn.com;
- For recent news about the group, see our news section here;
Hospitality Updates:
- We currently have promotions for Staycations. Visit cysuites.com/offers for details or email us at sales@cysuites.com;
Money Markets, T-Bills Primary Auction:
During the week, T-bills were undersubscribed for the second successive week, with the overall subscription rate coming in at to 97.1%, up from the 82.4% recorded the previous week. The continued low subscription is partly attributable to tightened liquidity in the money market with the average interbank rate increasing to 5.2% from 5.1% recorded the previous week. Investor’s preference for the shorter 91-day paper persisted, with the paper receiving bids worth Kshs 16.7 bn against the offered Kshs 4.0 bn, translating to a subscription rate of 416.3%, up from 330.7% recorded the previous week. The subscription rate for the 364-day declined to 21.5% from 26.4% recorded the previous week, while the subscription rate for the 182-day paper increased to 44.9% from 39.2% recorded the previous week. The yields on the government papers were on an upward trajectory, with the yields on the 364-day, 182-day and 91-day papers increasing by 2.0 bps, 4.4 bps and 5.2 bps to 10.2%, 9.8% and 9.3%, respectively.
In the Primary Bond Market, the Central Bank of Kenya released results for the recently re-opened bonds; FXD1/2018/25 and FXD1/2022/25 with effective tenors to maturity of 5.6 years and 24.9 years, respectively. The bonds recorded an undersubscription of 76.4%, partly attributable to investors’ preference for the shorter dated papers as they sought to avoid duration risk, coupled with the tightened liquidity in the money market as the interbank rate increased to 5.2% from 5.1% recorded the previous week. The government issued the bonds seeking to raise Kshs 40.0 bn for budgetary support, received bids worth Kshs 30.6 bn and accepted bids worth Kshs 24.3 bn, translating to a 79.6% acceptance rate. The weighted average yield for the bonds came in at 13.8% and 14.5% for FXD1/2008/20 and FXD1/2022/25, respectively, while the coupon rates came in at 13.8% and 14.2% for FXD1/2008/20 and FXD1/2022/25, respectively.
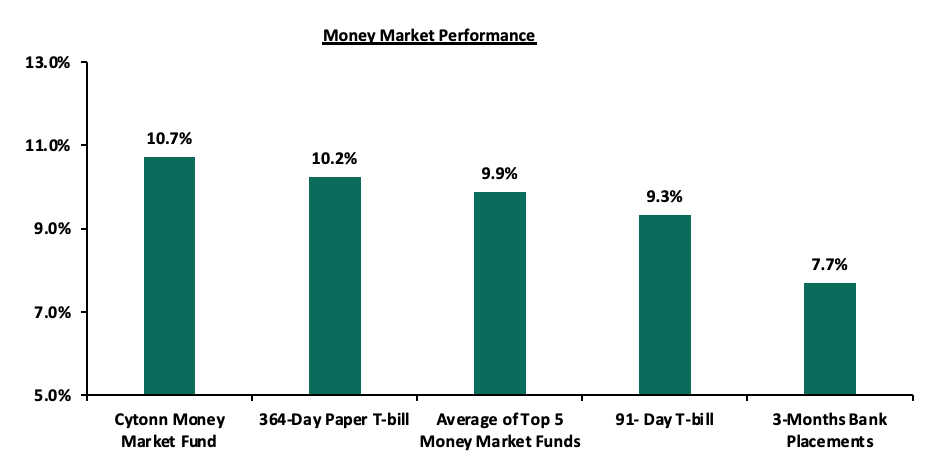
In the money markets, 3-month bank placements ended the week at 7.7% (based on what we have been offered by various banks), while the yield on the 91-day T-bill increased by 5.2 bps to 9.3%. The average yield of the Top 5 Money Market Funds declined by 0.2% points to 9.9% from 10.1% recorded the previous week, while the 364-day T-bill and the Cytonn Money Market Fund remained unchanged at 10.2% and 10.7%, respectively.
The table below shows the Money Market Fund Yields for Kenyan Fund Managers as published on 9th December 2022:
|
Cytonn Report: Money Market Fund Yield for Fund Managers as published on 9th December 2022 |
||
|
Rank |
Fund Manager |
Effective Annual Rate |
|
1 |
Cytonn Money Market Fund |
10.7% |
|
2 |
Zimele Money Market Fund |
9.9% |
|
3 |
NCBA Money Market Fund |
9.8% |
|
4 |
Apollo Money Market Fund |
9.5% |
|
5 |
Dry Associates Money Market Fund |
9.5% |
|
6 |
Sanlam Money Market Fund |
9.5% |
|
7 |
Nabo Africa Money Market Fund |
9.4% |
|
8 |
GenCap Hela Imara Money Market Fund |
9.4% |
|
9 |
Madison Money Market Fund |
9.4% |
|
10 |
Co-op Money Market Fund |
9.2% |
|
11 |
Old Mutual Money Market Fund |
9.2% |
|
12 |
CIC Money Market Fund |
9.1% |
|
13 |
British-American Money Market Fund |
9.0% |
|
14 |
AA Kenya Shillings Fund |
8.9% |
|
15 |
ICEA Lion Money Market Fund |
8.7% |
|
16 |
Orient Kasha Money Market Fund |
8.6% |
|
17 |
Absa Shilling Money Market Fund |
7.9% |
|
18 |
Equity Money Market Fund |
5.4% |
Source: Business Daily
Liquidity:
During the week, liquidity in the money markets tightened, with the average interbank rate increasing to 5.2% from 5.1% recorded the previous week, partly attributable to tax remittances that offset government payments. The average interbank volumes traded decreased by 17.0% to Kshs 18.0 bn from Kshs 21.7 bn recorded the previous week.
Kenya Eurobonds:
During the week, the yields on Eurobonds recorded mixed performance with the yield on the 10-year Eurobond issued in 2014 recording the largest increase having gained by 0.7% points to 12.3% from 11.6%, recorded the previous week. The table below shows the summary of the performance of the Kenyan Eurobonds as of 8th December 2022;
|
Cytonn Report: Kenya Eurobonds Performance |
||||||
|
|
2014 |
2018 |
2019 |
2021 |
||
|
Date |
10-year issue |
10-year issue |
30-year issue |
7-year issue |
12-year issue |
12-year issue |
|
3-Jan-22 |
4.4% |
8.1% |
8.1% |
5.6% |
6.7% |
6.6% |
|
30-Nov-22 |
12.0% |
10.1% |
10.8% |
10.7% |
10.4% |
9.6% |
|
1-Dec-22 |
11.6% |
9.9% |
10.6% |
10.3% |
10.2% |
9.3% |
|
2-Dec-22 |
11.6% |
9.8% |
10.5% |
10.3% |
10.1% |
9.3% |
|
5-Dec-22 |
11.8% |
9.8% |
10.5% |
10.2% |
10.1% |
9.3% |
|
6-Dec-22 |
12.0% |
9.8% |
10.6% |
10.3% |
10.2% |
9.3% |
|
7-Dec-22 |
12.2% |
9.9% |
10.6% |
10.6% |
10.2% |
9.5% |
|
8-Dec-22 |
12.3% |
9.9% |
10.6% |
10.3% |
10.2% |
9.4% |
|
Weekly Change |
0.7% |
0.0% |
0.0% |
0.0% |
0.0% |
0.1% |
|
MTD Change |
0.3% |
(0.2%) |
(0.2%) |
(0.4%) |
(0.2%) |
(0.2%) |
|
YTD Change |
7.9% |
1.8% |
2.5% |
4.7% |
3.5% |
2.8% |
Source: Central Bank of Kenya (CBK)
Kenya Shilling:
During the week, the Kenyan shilling depreciated by 0.2% against the US dollar to close the week at Kshs 122.8, from Kshs 122.5 recorded the previous week, partly attributable to increased dollar demand from importers, especially oil and energy sectors against a slower supply of hard currency. On a year to date basis, the shilling has depreciated by 8.5% against the dollar, higher than the 3.6% depreciation recorded in 2021. We expect the shilling to remain under pressure in 2022 as a result of:
- High global crude oil prices on the back of persistent supply chain bottlenecks coupled with high demand,
- An ever-present current account deficit estimated at 5.5% of GDP in the 12 months to October 2022, same as what was recorded in a similar period in 2021,
- The need for Government debt servicing which continues to put pressure on forex reserves given that 69.7% of Kenya’s External debt was US Dollar denominated as of September 2022, and,
- A continued hike in the USA Fed interest rates in 2022 to a range of 3.75%-4.00% in November 2022 has strengthened the dollar against other currencies by causing capital outflows from other global emerging markets.
The shilling is however expected to be supported by:
- Improved diaspora remittances standing at a cumulative USD 4.0 bn as of November 2022, representing a 9.7% y/y increase from USD 3.7 bn recorded over the same period in 2021, and,
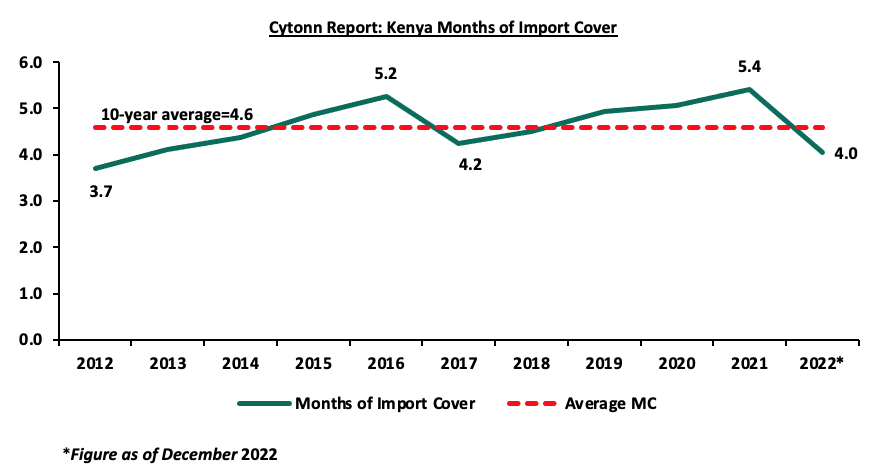
- Sufficient Forex reserves currently at USD 7.1 bn (equivalent to 4.0 months of import cover), which is at par with the statutory requirement of maintaining at least 4.0-months of import cover. However, it’s important to note that Forex reserves have dropped by 19.8% YTD from USD 8.8 bn. The chart below summarizes the evolution of Kenya months of import cover over the last 10 years;
Weekly Highlight:
Stanbic Bank’s November 2022 Purchasing Manager’s Index (PMI)
During the week, Stanbic Bank released its monthly Purchasing Manager’s Index (PMI), highlighting that the index for the month of November increased marginally to 50.9 from 50.2 recorded in October 2022 pointing towards an improvement in the business environment for the third consecutive month. The increase was partly attributable to improvement of new order inflows, on the back of moderate uptick in demand, slight decline in inflationary pressures, and favorable weather patterns which consequently led to expansion in sales and increased output in production. The chart below summarizes the evolution of PMI over the last 24 months.
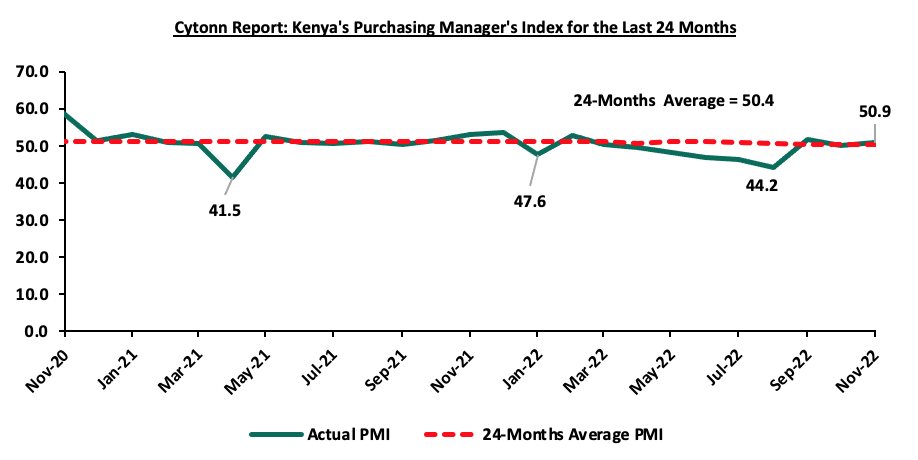
*** Key to note, a reading above 50.0 signals an improvement in business conditions, while readings below 50.0 indicate a deterioration.
Despite the slight reduction in inflation to 9.5% in November 2022, from 9.6% in October 2022, we expect the general business environment to remain subdued given the high cost of living as inflationary pressures still remain elevated driven by the high fuel and food prices. With fuel as a vital input in the majority of the sectors, we expect the high fuel prices globally to hike production costs and consequently stifle consumers demand in the short term.
Rates in the Fixed Income market have remained relatively stable due to the relatively ample liquidity in the money market. The government is 16.6% ahead of its prorated borrowing target of Kshs 257.3 bn having borrowed Kshs 300.1 bn of the Kshs 581.7 bn borrowing target for the FY’2022/2023. We expect sustained gradual economic recovery as evidenced by the revenue collections of Kshs 636.4 bn in the FY’2022/2023 as at the end of October, equivalent to a 29.7% of its target of 2.1 tn. Despite the performance, we believe that the projected budget deficit of 6.2% is relatively ambitious given the downside risks and deteriorating business environment occasioned by high inflationary pressures. We however expect the support from the IMF and World Bank to finance some of the government projects and thus help maintain a stable interest rate environment since the government is not desperate for cash. Owing to this, our view is that investors should be biased towards short-term fixed-income securities to reduce duration risk.
Market Performance:
During the week, the equities recorded mixed performance, with NSE 25 gaining by 0.2%, while NSE 20 declined by 0.2%. NASI remained relatively unchanged, taking YTD performance to losses of 24.3%, 14.0% and 17.8% for NASI, NSE 20 and NSE 25, respectively. The equities market performance was mainly driven by gains recorded by large cap stocks such as NCBA Group of 6.4% while both ABSA Bank and EABL both gained by 1.7%. The gains were however weighed down by losses recorded by large cap stocks such as KCB Group of 2.3%, while Safaricom and Bamburi both declined by 0.2%.
During the week, equities turnover declined by 13.5% to USD 9.1 mn from USD 10.5 mn recorded the previous week, taking the YTD turnover to USD 770.1 mn. Additionally, foreign investors turned net sellers, with a net selling position of USD 3.5 mn, from a net buying position of USD 0.1 mn recorded the previous week, taking the YTD net selling position to USD 191.4 mn.
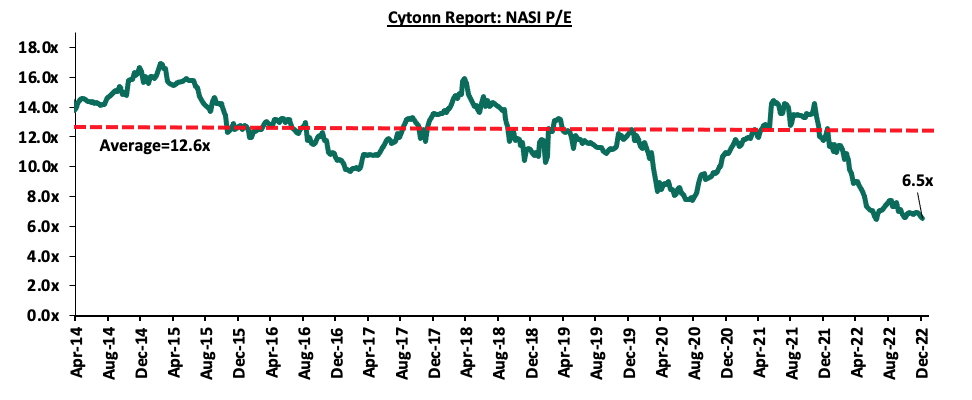
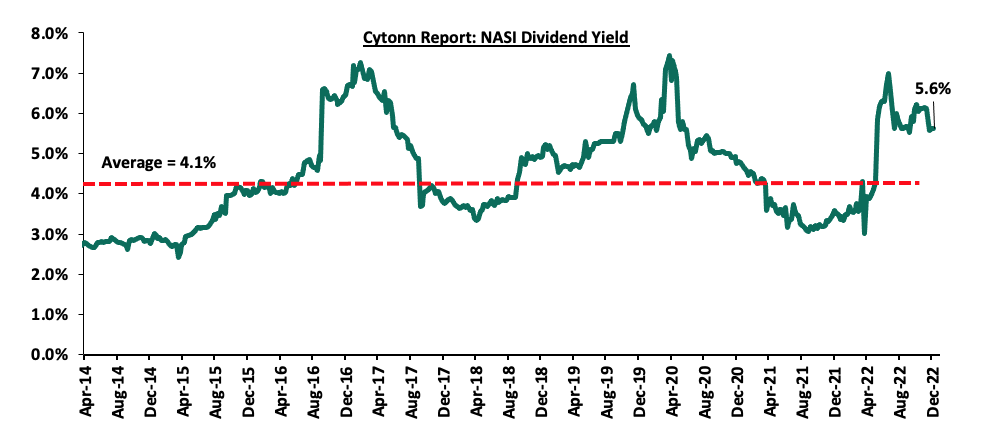
The market is currently trading at a price to earnings ratio (P/E) of 6.5x, 48.3% below the historical average of 12.6x, and a dividend yield of 5.6%, 1.5% points above the historical average of 4.1%. Key to note, NASI’s PEG ratio currently stands at 0.8x, an indication that the market is undervalued relative to its future growth. A PEG ratio greater than 1.0x indicates the market may be overvalued while a PEG ratio less than 1.0x indicates that the market is undervalued. The charts below indicate the historical P/E and dividend yields of the market;
Universe of coverage:
|
Company |
Price as at 02/12/2022 |
Price as at 09/12/2022 |
w/w change |
YTD Change |
Target Price* |
Dividend Yield |
Upside/ Downside** |
P/TBv Multiple |
Recommendation |
|
Jubilee Holdings |
197.5 |
200.0 |
1.3% |
(36.9%) |
305.9 |
0.5% |
53.5% |
0.4x |
Buy |
|
Liberty Holdings |
4.7 |
4.5 |
(4.9%) |
(36.7%) |
6.8 |
0.0% |
51.0% |
0.3x |
Buy |
|
KCB Group*** |
37.8 |
36.9 |
(2.3%) |
(19.0%) |
52.5 |
2.7% |
45.0% |
0.6x |
Buy |
|
Britam |
5.3 |
5.0 |
(5.7%) |
(33.9%) |
7.1 |
0.0% |
42.4% |
0.8x |
Buy |
|
Kenya Reinsurance |
1.9 |
1.9 |
0.5% |
(17.5%) |
2.5 |
5.3% |
38.1% |
0.2x |
Buy |
|
Equity Group*** |
45.1 |
45.0 |
(0.1%) |
(14.7%) |
58.4 |
6.7% |
36.3% |
1.1x |
Buy |
|
Co-op Bank*** |
12.1 |
12.1 |
0.4% |
(6.9%) |
15.5 |
8.3% |
36.1% |
0.7x |
Buy |
|
Sanlam |
9.0 |
8.9 |
(1.1%) |
(22.9%) |
11.9 |
0.0% |
33.8% |
0.9x |
Buy |
|
I&M Group*** |
16.8 |
16.8 |
0.0% |
(21.7%) |
20.8 |
9.0% |
33.3% |
0.4x |
Buy |
|
ABSA Bank*** |
11.8 |
12.0 |
1.7% |
2.1% |
15.5 |
1.7% |
30.4% |
1.0x |
Buy |
|
NCBA*** |
33.0 |
35.1 |
6.4% |
37.9% |
43.4 |
5.7% |
29.3% |
0.8x |
Buy |
|
Stanbic Holdings |
98.0 |
92.0 |
(6.1%) |
5.7% |
108.6 |
9.8% |
27.9% |
0.8x |
Buy |
|
Diamond Trust Bank*** |
48.0 |
48.3 |
0.6% |
(18.8%) |
57.1 |
6.2% |
24.5% |
0.2x |
Buy |
|
CIC Group |
1.8 |
1.9 |
6.6% |
(10.6%) |
2.3 |
0.0% |
19.6% |
0.7x |
Accumulate |
|
Standard Chartered*** |
146.3 |
146.0 |
(0.2%) |
12.3% |
164.8 |
4.1% |
17.0% |
1.0x |
Accumulate |
|
HF Group |
3.4 |
3.1 |
(6.8%) |
(17.4%) |
3.5 |
0.0% |
12.7% |
0.2x |
Accumulate |
|
*Target Price as per Cytonn Analyst estimates **Upside/ (Downside) is adjusted for Dividend Yield ***For Disclosure, these are stocks in which Cytonn and/or its affiliates are invested in |
|||||||||
We are “Neutral” on the Equities markets in the short term due to the current adverse operating environment and huge foreign investor outflows, and, “Bullish” in the long term due to current cheap valuations and expected global and local economic recovery.
With the market currently trading at a discount to its future growth (PEG Ratio at 0.8x), we believe that investors should reposition towards value stocks with strong earnings growth and that are trading at discounts to their intrinsic value. We expect the current high foreign investors sell-offs to continue weighing down the economic outlook in the short term.
- Residential Sector
During the week, the Kenyan national government in partnership with the United Nations Habitat, and, Epco Builders, a local private developer, broke ground for the construction of Mavoko Affordable Housing Project in Syokimau, Machakos County. This comes two weeks after the government announced plans to commence the construction of 42,000 affordable housing units within the next two months, in Makongeni, Starehe, Shauri Moyo, Ruiru, and the aforementioned Mavoko. The Kshs 20.0 bn project will sit on a 22.0-hectare piece of land, and will comprise of; 5,360 affordable housing units, a market, a school and a hospital. Notably, the project, which is part of the government’s aggressive efforts to boost access to affordable housing, will be constructed in 3 clusters, with the number of housing units whose prices are yet to be disclosed by the government distributed as follows;
|
Cytonn Research: Distribution of Housing Units For The Mavoko Affordable Housing Project in Syokimau |
|
|
House Typology |
Number of Units |
|
Studios |
560 |
|
1 Bedroom |
960 |
|
2 Bedrooms |
2400 |
|
3 Bedrooms |
1440 |
|
Total |
5,360 |
Source: Cytonn Research
Upon completion, the project which is adjacent to the Mavoko Sustainable Development housing project which was completed in May 2021, is expected to; i) boost homeownership rates which have remained significantly low at 21.3% in urban areas as at 2022, ii) mitigate the existing housing deficit which stands at 2.0 mn units, iii) develop sustainable neighborhoods among the informal and the low income communities, and, iv) improving the living standards of the residents in Mavoko through provision of descent housing.
Kenya’s Affordable Housing Initiative continues to gain traction with some of the projects in the pipeline outlined in the table below;
|
Cytonn Report: Summary of Notable Ongoing Affordable Housing Projects in The Nairobi Metropolitan Area |
|||
|
Name |
Developer |
Location |
Number of Units |
|
Pangani Affordable Housing Program |
National Government and Tecnofin Kenya Limited |
Pangani |
1,562 |
|
River Estate Affordable Housing Program |
National Government and Edderman Property Limited |
Ngara |
2,720 |
|
Park Road Affordable Housing Program |
National Housing Corporation |
Ngara |
1,370 |
|
Mukuru Affordable Housing Program |
National Housing Corporation |
Mukuru kwa Njenga, Enterprise Road |
15,000 |
|
Mavoko Affordable Housing Project |
National Government and Epco Builders |
Syokimau, Machakos County |
5,360 |
|
NHC Stoni Athi View (Economy Block-Rental) |
National Housing Corporation |
Athi River, Machakos County |
50 |
|
NHC Stoni Athi View |
National Housing Corporation |
Athi River, Machakos County |
120 |
|
Mariguini Informal Settlement |
National Government |
Starehe, Nairobi County |
2600 |
|
Kibera Soweto East Zone B |
National Government |
Kibera, Nairobi County |
3,000 |
|
Starehe Affordable Housing Project |
National Government and Tecnofin Kenya Limited |
Starehe, Nairobi County |
3,000 |
|
Total |
|
|
34,782 |
Source: Boma Yangu Portal
In addition to the above, there also exist several projects initiated by private developers to hasten the program such as;
|
Cytonn Report: Summary of Notable Ongoing Affordable Housing Projects in The Nairobi Metropolitan Area |
|||
|
Name |
Developer |
Location |
Number of Units |
|
Samara Estate |
Skymore Pine Limited |
Ruiru |
1,824 |
|
Moke Gardens |
Moke Gardens Real Estate |
Athi River |
30,000 |
|
Habitat Heights |
Afra Holding Limited |
Mavoko |
8,888 |
|
Tsavo Apartments |
Tsavo Real Estate |
Embakasi, Riruta, Thindigua, Roysambu, and, Rongai |
3,200 |
|
Unity West |
Unity Homes |
Tatu City |
3,000 |
|
RiverView |
Karibu Homes |
Athi River |
561 |
|
Kings Serenity |
|
Ongata Rongai, Kajiado County |
734 |
|
Joinven Estate |
Joinven Investments Limited |
Syokimau, Machakos County |
440 |
|
Total |
|
|
48,647 |
Source: Boma Yangu Portal
We maintain our view that the pattern will persist in sculpting the performance of the residential sector by enhancing the living standards of the majority of people in the nation with the goal of providing affordable living spaces. Nonetheless, the initiative despite gaining momentum is still exposed to a couple of setbacks which has caused various projects to stall, with the key one being the funding of the projects, thus preventing it from achieving its full potential. As such, government's push to upgrade the sector's performance still needs comprehensive plans on financing, organization and construction, with increased collaboration with the private sector, as well as providing precise and adequate data to renters and investors, as discussed in our Affordable Housing in Kenya topical.
- Retail Sector
During the week, local retailer Naivas Supermarket opened two new outlets at Boardwalk Mall located in Parklands along Ojijo Road on 9th December 2022 and at Nairobi West Shopping Centre in Nairobi West on 10th December 2022. The two additional outlets bring the retailer’s number of operating outlets countrywide to 90. This also comes a month after the retailer opened three new outlets at Meru’s Greenwood City Mall, at Kahawa Sukari Junction, and at Ruai town. Additionally, Naivas plans to open one more outlet by the end of 2022. The outlet will be located at Express Uthiru and is expected to be launched on 15th December 2022, indicating its rapid expansion drive. The opening of the two new outlets in Parklands and Nairobi West can be attributed to:
- Urge to increase its presence in new regions where the retailer had not tapped into hence offering convenient shopping experience to customers,
- Strategic locations of the outlets along Ojijo Road and within the expanse of Parklands residential area and within Nairobi West Shopping Centre hence enhancing the footfall and accessibility to the store,
- Increased financial strength following the sale of 40.0% stake worth Kshs 18.3 bn to a consortium comprising of IBL Group and other firms such as DEG Group and Proparco, and,
- The essential aim to stay ahead of the competition and retain a superior position in the market compared to other retailers like Carrefour and QuickMart.
The table below shows the number of stores operated by key local and international retail supermarket chains in Kenya;
|
Cytonn Report: Main Local and International Retail Supermarket Chains |
|||||||||||
|
Name of retailer |
Category |
Branches as at FY’ 2018 |
Branches as at FY’ 2019 |
Branches as at FY’ 2020 |
Branches as at FY’ 2021 |
Branches opened in 2022 |
Closed branches |
Current branches |
Branches expected to be opened |
Projected branches FY’2022 |
|
|
Naivas |
Local |
46 |
61 |
69 |
79 |
12 |
0 |
90 |
1 |
91 |
|
|
QuickMart |
Local |
10 |
29 |
37 |
48 |
3 |
0 |
51 |
0 |
51 |
|
|
Chandarana |
Local |
14 |
19 |
20 |
23 |
1 |
1 |
24 |
4 |
28 |
|
|
Carrefour |
International |
6 |
7 |
9 |
16 |
0 |
0 |
16 |
0 |
16 |
|
|
Cleanshelf |
Local |
9 |
10 |
11 |
12 |
0 |
0 |
12 |
0 |
12 |
|
|
Tuskys |
Local |
53 |
64 |
64 |
2 |
0 |
62 |
2 |
0 |
2 |
|
|
Game Stores |
International |
2 |
2 |
3 |
3 |
0 |
0 |
3 |
0 |
3 |
|
|
Uchumi |
Local |
37 |
37 |
37 |
2 |
0 |
35 |
2 |
0 |
2 |
|
|
Choppies |
International |
13 |
15 |
15 |
0 |
0 |
13 |
0 |
0 |
0 |
|
|
Shoprite |
International |
2 |
4 |
4 |
0 |
0 |
4 |
0 |
0 |
0 |
|
|
Nakumatt |
Local |
65 |
65 |
65 |
0 |
0 |
65 |
0 |
0 |
0 |
|
|
Total |
|
257 |
313 |
334 |
185 |
16 |
180 |
200 |
5 |
205 |
|
Source: Cytonn Research
Kenya's retail industry continues to see significant growth movements by various retailers as they strive for market supremacy, which improves the sector's performance. However, the retail sector's performance is hampered by rapid advancements in the e-commerce sector and an existing oversupply of retail spaces in Kenya of 1.7 million SQFT, which affects occupancy rates and total return to property investors.
- Hospitality Sector
During the week, hotel group Hemingways Collection took over management of Eden Hotel, which featured as the only Kenyan hotel in the Fodor Finest Hotels List, Africa 2023. The hotel set to be renamed Hemingways Eden is located in Karen, Nairobi and will take the number of operating hotels by the group to four. Other hotels managed by the group include; Hemingways Nairobi, Ol Seki Hemingways located at Naboisho conservancy in Narok county, and, Hemingways Watamu. We attribute the opening decision by the hotel group to be; i) need to diversify and increase the group's hotel portfolio, ii) broaden its product line, and, iii) accord the group a chance to manage a distinctive and iconic property in one of Nairobi's prime locations.
Additionally, the decision by Hemingways Collection comes at a time when the Kenyan hospitality industry is witnessing increased hotel expansions with both local and global brands opening new facilities following the continued recovery of the sector. In support of this, Hotel Chain Development Pipelines in Africa Report 2022 by W Hospitality Group highlights that 24 global hotel brands are considering opening new facilities in Kenya as of 2022. This translates to an additional 3,155 new hotel rooms ranking Kenya at position seven and among the top ten hotspots for upcoming luxury hotels in Africa as shown below;
|
Cytonn Report: Hotel Chain Development Pipelines in Africa 2022 |
|||
|
|
|
Number of Hotels Brands |
Number of Rooms |
|
1 |
Egypt |
85 |
21,281 |
|
2 |
Morocco |
50 |
7,209 |
|
3 |
Nigeria |
33 |
5,619 |
|
4 |
Ethiopia |
29 |
5,206 |
|
5 |
Cape Verde |
17 |
4,639 |
|
6 |
Algeria |
15 |
3,202 |
|
7 |
Kenya |
24 |
3,155 |
|
8 |
South Africa |
21 |
3,133 |
|
9 |
Tunisia |
14 |
2,918 |
|
10 |
Senegal |
13 |
2,693 |
|
|
Total |
301 |
59,055 |
Source: Hotel Chain Development Pipelines in Africa Report 2022
In our view, the continued recognition of Kenya’s hospitality industry, and Kenya’s ranking in the aforementioned survey positions the country as a vibrant tourism market and will have a positive trickle effect to the number of international arrivals into the country. Other factors expected to drive the upward performance of the hospitality sector include; i) intensive marketing of Kenya’s tourism market through platforms such as the Magical Kenya, ii) promotion of local tourism, iii) improved security, iv) increased sporting and leisure events in the country, and, v) the oncoming festive season which will further boost bookings and leisure activities for short term period.
- Infrastructure
During the week, the government of Kenya in conjunction with the United Kingdom (UK), initiated the launch of Nairobi Railways City project, a multibillion transit-oriented and multi-modal urban Development within the Central Business District of Nairobi City. The Kshs 30.0 bn project is an integration of the Nairobi Integrated Urban Master Plan, Nairobi Transport Master Plan, and Nairobi Commuter Rail Master Plan. Notably, the project will be developed in two phases on the 425.0 acres of government land bordering Uhuru Highway, Ladhies Road, Bunyala Road and Haile Selassie Avenue. Additionally, the British government has also pledged Kshs 11.9 bn to construct office blocks, malls, and light industries within the project, in a bid to decongest the city and create new job opportunities. With regard to funding, the railways city project is part of the larger Kshs 225.0 bn climate oriented funding by the UK, with the repayment of the loan anchored on the developments around climatic changes in the region. The main objectives of the project are;
- Maximize focus on Affordable Housing Initiative (AHI) by providing space for construction of 10,000 affordable housing units in the first phase,
- Create a Transit Oriented Development (ToD) to support Ridership for the Nairobi Commuter Rail,
- Provide a livable and Sustainable Urban Space through creation of green public spaces and efficient railway system,
- Minimize urban congestion and traffic delays by integrating non-motorized transport system and modern matatus terminus linked to Bus Rapid Transit Network (BRTN). This is expected to accommodate up to 30,000 passengers per hour,
- Regenerate the Central Nairobi City into an eco-friendly environment through incorporation of latest technology in green building technology, keeping of track Kenya’s ambitions on sustainable climatic strategies,
- Foster activity in the region’s retail sector by establishing affordable spaces for small and medium enterprises which will provide increased market opportunities for retailers, and,
- Establish an iconic economic development to position Nairobi as a thriving continental metropolis and serve as a template for other projects that UK seeks to further implement in Africa.
Upon completion of the ambitious project, we expect positive performance in the Real Estate sector which will be shaped by; i) increased developments in the industrial, residential, commercial and retail sectors, ii) growth of urban developments in areas surrounding the Railway city, iii) positive growth in property values of regions around the project, iv) increased investors’ confidence and attraction of more foreign investors into the project hence accelerating performance of the economy, and, v) creation of regional metropolises with the project linking to other upcoming smart cities like the Northlands City and Tatu City in Kiambu County, and Konza City in Machakos County.
Conversely, in as much as the funding of the project has been achieved, the crucial challenge will be on the implementation of the project to the end and management of the project to be a sustainable initiative for the country. Such projects have proved to incur high operating costs and inadequate economic benefits due to mismanagement of public investments and lack of reasonable planning control of the land uses. We therefore recommend the government to;
- Establish a dedicated government agency to oversee the development and management of the railway city, including the recruitment of seasoned and proficient personnel to assist in the planning and budgeting process,
- Provide financial incentives and grants to local developers to encourage the construction of the city and to help create jobs,
- Develop a comprehensive transportation plan to ensure efficient movement of goods and people in the city,
- Establish a clear regulatory framework to ensure proper enforcement of building codes, safety standards, and quality of life standards in the city,
- Optimize on management of areas around the project in the preliminary stages of the project through guaranteeing reasonable, economic, and efficient use of land, and,
- Formulate strategies on sourcing for more funds early enough for managing and operating the project before it is completed.
- Real Estate Investment Trust (REITs)
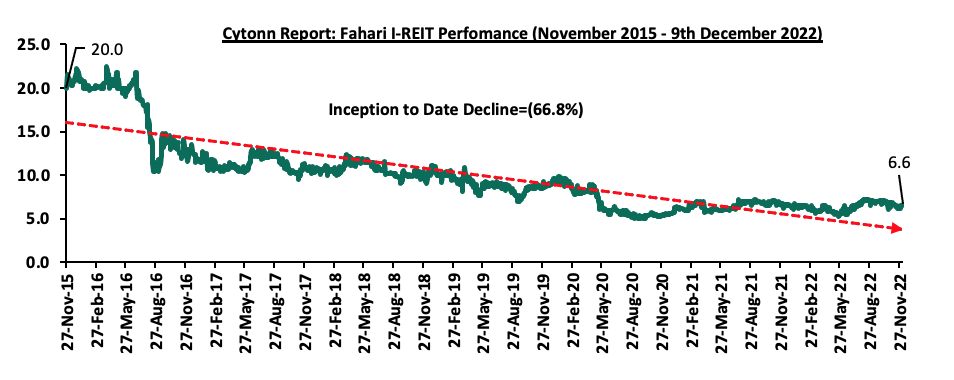
In the Nairobi Stock Exchange, ILAM Fahari I-REIT closed the week trading at an average price of Kshs 6.6 per share. The performance represented a 2.5% gain from Kshs 6.5 per share recorded the previous week, taking it to a 3.4% Year-to-Date (YTD) gain from Kshs 6.4 per share. However, the performance represented a 66.8% Inception-to-Date (ITD) decline from Kshs 20.0. The Kshs. 6.6 price given the last annual dividend of Kshs 0.5 represents an annual yield of 7.53%. The graph below shows Fahari I-REIT’s performance from November 2015 to 9th December 2022;
In the Unquoted Securities Platform, Acorn D-REIT and I-REIT closed the week trading at Kshs 23.8 and Kshs 20.9 per unit, respectively, as at 2nd December 2022. The performance represented a 19.2% and 4.4% gain for the D-REIT and I-REIT, respectively, from the Kshs 20.0 inception price. The volumes traded for the D-REIT and I-REIT came in at 5.5 mn and 15.1 mn shares, respectively, with total turnovers of Kshs 117.0 mn and Kshs 313.1 mn, respectively, since inception in February 2021.
Kenya’s positive property market performance continues to be shaped by; i) continued aggressive focus and support on the residential sector through Affordable Housing Program, ii) continuous expansion drive by local and international retailers, and, iii) continued growth and resilience of the hospitality sector. However, the performance is expected to be weighed down by; i) increasing construction costs amid inflationary pressures in the economy, ii) existing oversupply of retail spaces currently at 1.7 mn SQFT in Kenya, and, iii) low investor confidence in the listed Real Estate Investment Trusts.
Following the release of the Q3’2022 results by Kenyan listed banks, the Cytonn Financial Services Research Team undertook an analysis on the financial performance of the listed banks and identified the key factors that shaped the performance of the sector. For the earnings notes of the various banks, click the links below:
- Equity Group Q3’2022 Earnings Note;
- KCB Group Q3’2022 Earnings Note;
- Standard Chartered Bank Kenya Q3’2022 Earnings Note;
- ABSA Bank Kenya Q3’2022 Earnings Note;
- NCBA Group Q3’2022 Earnings Note;
- Co-operative Bank Q3’2022 Earnings Note;
- Diamond Trust Bank Kenya (DTB-K) Earnings Note;
- I&M Group Holdings Q3’2022 Earnings Note;
- Stanbic Holdings Q3’2022 Earnings Note;
- HF Group Q3’2022 Earnings Note;
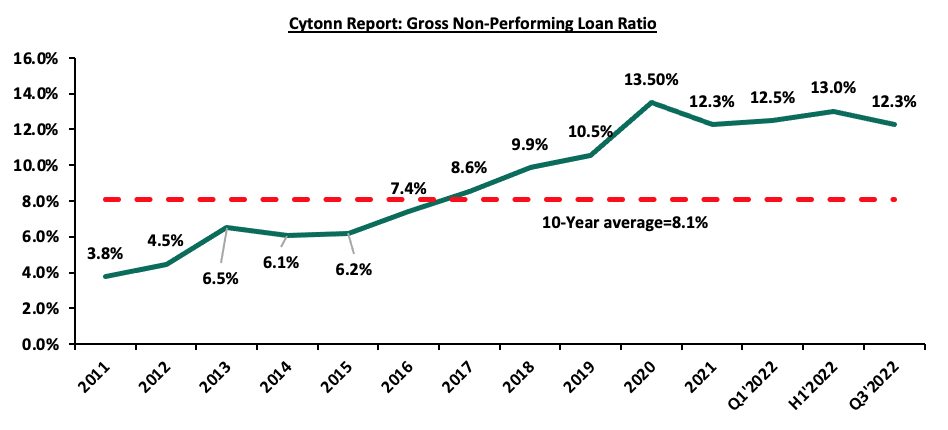
The Core Earnings per Share (EPS) for the listed banks recorded a weighted growth of 36.7% in Q3’2022, compared to a weighted growth of 102.0% recorded in Q3’2021, indicating the banking sector’s continued resilience despite the tough operating business environment occasioned by elevated inflationary pressures. The performance in Q3’2022 was mainly attributable to a 30.1% growth in non-funded income coupled with a 17.6% growth in net interest income. Additionally, the listed banks’ operational efficiency improved, with the Cost to Income without LLP ratio declining by 3.9% points to 45.1%, from 49.0% recorded in Q3’2021, mainly as a result of continuous adoption of alternative distribution channels that have seen banks to reduce their operating expenses. However, the sector’s Asset Quality remains a high concern with average NPL ratio at 12.3% in Q3’2022, remaining 4.2% points higher than the 10-year average of 8.1%. Notably, the Asset Quality for the listed banks deteriorated in Q3’2022, with the gross NPL ratio increasing marginally by 0.1% points to 12.3%, from 12.2% in Q3’2021.
The report is themed “Revenue Diversification Spurs Earnings Growth” where we assess the key factors that influenced the performance of the banking sector in Q3’2022, the key trends, the challenges banks faced, and areas that will be crucial for growth and stability of the banking sector going forward. As such, we shall address the following:
- Key Themes that Shaped the Banking Sector Performance in Q3’2022,
- Summary of the Performance of the Listed Banking Sector in Q3’2022,
- The Focus Areas of the Banking Sector Players Going Forward, and,
- Brief Summary and Ranking of the Listed Banks based on the outcome of our analysis.
Section I: Key Themes That Shaped the Banking Sector Performance in Q3’2022
Below, we highlight the key themes that shaped the banking sector in Q3’2022 which include; regulation, regional expansion through mergers and acquisitions, asset quality and capital raising for onward lending:
- Regulation:
- Risk-based Lending: The Central Bank of Kenya has been working on a risk-based lending model to price loans since the Interest Cap law was repealed in 2019. The model’s main goal is to allow banks to lend in line with the estimated risks of each borrower. Additionally, this is a shift from negative listing of defaulters to a new system of credit score rating that does not deny borrowers credit on the strength of their credit bureau reference scores. The model targets borrowers who are deemed risker with majority operating in micro, small and medium enterprises that have been struggling to access formal credit. Notably, as of November 2022, at least 23 of the banks had their models approved by the CBK, with Equity Bank being the first commercial bank to roll out the risked-based lending. However, the approval rate for the models has been gradual in a bid to avoid causing distress to customers through high interest rates. Additionally, the full implementation has also been slowed down as a result of insufficient data to assess client’s risk profile, and,
- Regulation of Digital Lenders: The Central Bank of Kenya (CBK) enacted the law to regulate digital lenders, granting the bank the authority to license and oversee previously unregulated digital credit providers. The regulations were published on 18th March 2022, and allowed digital lenders a period of six months to acquire licences from CBK and are aimed at protecting borrowers from uncharacterized practices of unregulated digital credit providers, particularly their high costs, unethical debt collection practices, and misuse of personal information. The application period for licencing by all operating unregulated digital credit providers elapsed on 17th September 2022, with the CBK announcing approval of only 10 digital credit providers out of the 288 which had applied to be licenced. Additionally, the CBK cited that the other applicants were at difference stages of the approval process while those that did not apply for licencing as per the regulations will cease operations.
The following are developments that happened after Q3’2022:
- Credit Repair Framework: In November 2022, the Central Bank of Kenya (CBK) announced the roll out of a Credit Repair Framework by commercial banks, microfinance banks, and mortgage finance companies. The main objective of the Framework is to improve the credit standing of mobile phones digital borrowers who had been adversely listed with Credit Reference Bureaus (CRBs) for failing to service their mobile loans. The Framework will cover loans with a repayment period of 30 day or less, with the institutions expected to provide a discount of at least 50.0% of the non-performing mobile phone digital loans outstanding as at the end of October 2022. This initiative by the CBK has been welcomed by banks with NCBA Group and ABSA Bank already disclosed to have written off non-performing digital loans amounting to Kshs 11.5 bn and Kshs 1.8 bn, respectively. As such, this is expected to increase access to credit and other financial services by borrowers operating in personal and micro-enterprises sectors which were largely affected by the Covid-19 pandemic, and,
- Reintroduction of charges for mobile money and bank account transactions: In December 2022, the central Bank of Kenya (CBK) announced the reintroduction of charges for transactions between mobile wallets and bank accounts which were waived in March 2020, as an emergency response to facilitate use of mobile money and reduce handling of hard cash during Covid-19 pandemic period. The reintroduction of the charges will take effect as from 1st January 2023, with the CBK citing that the new charges will be significantly lower than the charges that applied before the pandemic. Notably, the reintroduced charges will have the following elements;
- The revised maximum charges for transfers from bank accounts to mobile money wallets will be reduced by on average up to 61.0%, and mobile money wallet to bank account by on average up to 47.0%,
- Tariffs for paybills that collect and disburse funds by businesses, companies and institutions will be reduced by on average 50.0%, and,
- The charges levied by banks for banks to mobile money transactions will be reduced by on average 45.0%.
- Regional Expansion through Mergers and Acquisitions: Kenyan banks are continuously looking at having an extensive regional reach and in Q3’2022, there were two acquisitions by KCB Group and Equity Group Holdings Plc as follows:
- On 2nd August 2022, KCB Group Plc, announced that it had entered into a final agreement with shareholders of Trust Merchant Bank (TMB) to acquire an 85.0% stake in the Democratic Republic of Congo (DRC)- based lender, with an option to acquire the remaining stake after two years. With the shareholder’s approval in September, the deal is nearly complete pending approvals from COMESA Competition Commission and the Central Bank of DRC. This will mark the second Kenyan banking group to enter the DRC banking market after Equity Group Holdings. For this acquisition, KCB will pay a cash consideration based on the net asset value of TMB at completion of the proposed transaction using a Price to Book (P/B) multiple of 1.5x, subject to regulatory, shareholders and other approvals. We estimate a payment of Kshs 15.7 bn by KCB at the trading multiple of 1.5x given TMB’s book valueof FC 208.4 bn (Kshs 12.4 bn) as of 2020. For more information, please see our Cytonn Weekly #31/2022 ,and,
- On 12th September 2022, Equity Group Holdings Plc through Equity Bank (Kenya) Limited, announced that it had entered into an Assets and Liabilities purchase agreement with Spire Bank Limited for purchase of certain assets and liabilities. In the deal which was anchored in Equity’s plan to support economic recovery post COVID-19, Equity Bank Kenya Limited would acquire approximately 20,000 deposit customers with deposits totaling Kshs 1.3 bn, and 3,700 loan customers. For more information, please see our Cytonn Weekly #37/2022. However, the was frozen by the Employment and Labor Relations Court following dispute over the fate of employees in Spire bank.
Below is a summary of the deals in the last 9 years that have either happened, been announced or expected to be concluded:
|
Acquirer |
Bank Acquired |
Book Value at Acquisition (Kshs bn) |
Transaction Stake |
Transaction Value (Kshs bn) |
P/Bv Multiple |
Date |
|
Equity Group |
Spire Bank |
Unknown |
Undisclosed |
Undisclosed |
N/A |
Sep-22* |
|
KCB Group PLC |
Trust Merchant Bank (TMB) |
12.4 |
85.0% |
15.7 |
1.5x |
August-22 |
|
Access Bank PLC (Nigeria) |
Sidian Bank |
4.9 |
83.4% |
4.3 |
1.1x |
June-22* |
|
KCB Group |
Banque Populaire du Rwanda |
5.3 |
100.0% |
5.6 |
1.1x |
August-21 |
|
I&M Holdings PLC |
Orient Bank Limited Uganda |
3.3 |
90.0% |
3.6 |
1.1x |
April-21 |
|
KCB Group** |
ABC Tanzania |
Unknown |
100% |
0.8 |
0.4x |
Nov-20* |
|
Co-operative Bank |
Jamii Bora Bank |
3.4 |
90.0% |
1 |
0.3x |
Aug-20 |
|
Commercial International Bank |
Mayfair Bank Limited |
1.0 |
51.0% |
Undisclosed |
N/D |
May-20* |
|
Access Bank PLC (Nigeria) |
Transnational Bank PLC. |
1.9 |
100.0% |
1.4 |
0.7x |
Feb-20* |
|
Equity Group ** |
Banque Commerciale Du Congo |
8.9 |
66.5% |
10.3 |
1.2x |
Nov-19* |
|
KCB Group |
National Bank of Kenya |
7.0 |
100.0% |
6.6 |
0.9x |
Sep-19 |
|
CBA Group |
NIC Group |
33.5 |
53%:47% |
23.0 |
0.7x |
Sep-19 |
|
Oiko Credit |
Credit Bank |
3.0 |
22.8% |
1 |
1.5x |
Aug-19 |
|
CBA Group** |
Jamii Bora Bank |
3.4 |
100.0% |
1.4 |
0.4x |
Jan-19 |
|
AfricInvest Azure |
Prime Bank |
21.2 |
24.2% |
5.1 |
1.0x |
Jan-18 |
|
KCB Group |
Imperial Bank |
Unknown |
Undisclosed |
Undisclosed |
N/A |
Dec-18 |
|
SBM Bank Kenya |
Chase Bank Ltd |
Unknown |
75.0% |
Undisclosed |
N/A |
Aug-18 |
|
DTBK |
Habib Bank Kenya |
2.4 |
100.0% |
1.8 |
0.8x |
Mar-17 |
|
SBM Holdings |
Fidelity Commercial Bank |
1.8 |
100.0% |
2.8 |
1.6x |
Nov-16 |
|
M Bank |
Oriental Commercial Bank |
1.8 |
51.0% |
1.3 |
1.4x |
Jun-16 |
|
I&M Holdings |
Giro Commercial Bank |
3.0 |
100.0% |
5.0 |
1.7x |
Jun-16 |
|
Mwalimu SACCO |
Equatorial Commercial Bank |
1.2 |
75.0% |
2.6 |
2.3x |
Mar-15 |
|
Centum |
K-Rep Bank |
2.1 |
66.0% |
2.5 |
1.8x |
Jul-14 |
|
GT Bank |
Fina Bank Group |
3.9 |
70.0% |
8.6 |
3.2x |
Nov-13 |
|
Average |
74.5% |
1.3x |
||||
|
* Announcement Date ** Deals that were dropped |
||||||
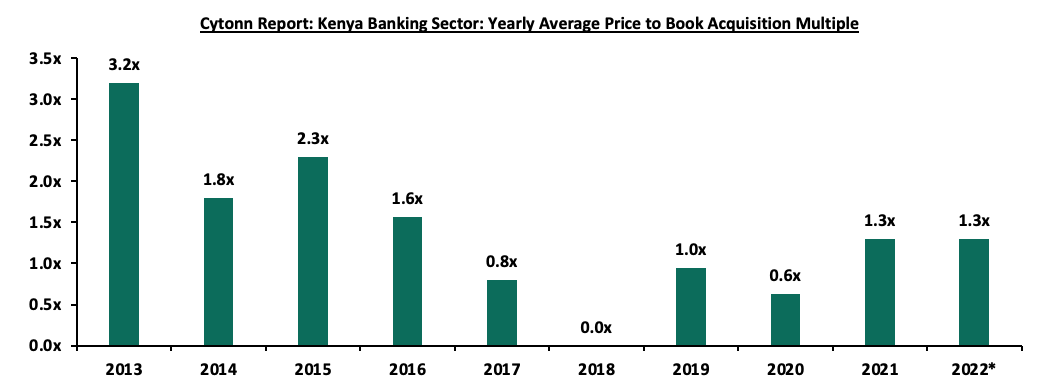
The acquisition valuations for banks have been recovering, with the valuations increasing from the average of 0.6x in 2020 to 1.3x in 2021 and 2022 each. This however still remains low compared to historical prices paid as highlighted in the chart below;
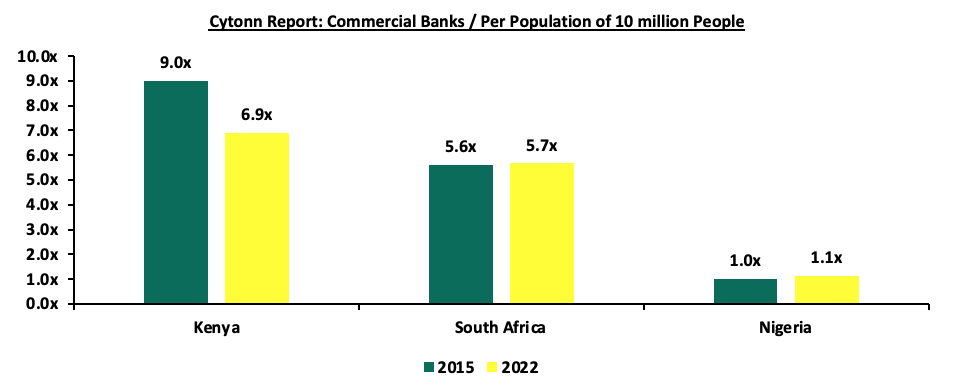
The number of commercial banks in Kenya currently stands at 38, same as in H1’2022 but lower than the 43 licensed banks in FY’2015. The ratio of the number of banks per 10 million populations in Kenya now stands at 6.9x, which is a reduction from 9.0x in FY’2015 demonstrating continued consolidation of the banking sector. However, despite the ratio improving, Kenya still remains overbanked as the number of banks remains relatively high compared to the population. To bring the ratio to 5.5x, we ought to reduce the number of banks from the current 38 banks to 30 banks. For more on this see our topical.
Source: World Bank, Central Bank of Kenya, South Africa Reserve Bank, Central Bank of Nigeria,
- Asset Quality: Asset quality for listed banks deteriorated in Q3’2022, with the Gross Non-Performing Loan ratio (NPL) increasing marginally by 0.1% points to 12.3%, from 12.2% in Q3’2021. The deterioration of the Assets quality was mainly skewed by an increase in KCB Group’s NPL ratio to 8% in Q3’2022, from 13.7% in Q3’2021, attributable to the continued high exposure to corporate loans at 47.8% in Q3’2022, which have been impacted by delayed recovery from COVID-19, increased inflationary pressures and pending government bills. However, according the Quarterly Economic Review Q3’2022 released by the Central Bank of Kenya, the asset quality for the entire banking sector improved, with Gross NPL ratio declining by 1.0% points to 13.7% in Q3’2022, from 14.7% recorded at the end of Q2’2022. The improvement in asset quality was mainly driven by 4.4% decline in gross Non-Performing Loans (NPLs), coupled with a 2.5% increase in gross loans in the period under review. Building and Construction, Tourism, Manufacturing, Real Estate, Financial Services, Transport and Communication and Trade sectors cumulatively registered declines in NPLs by 51.4%, translating to Kshs 24.6 bn as a result of increased repayments. Going forward, we expect credit risk to remain elevated in the short term given the soaring inflationary pressures which are expected to continue to weigh on the business environment. The chart below highlights the asset quality trend for the listed banks:
The table below highlights the asset quality for the listed banking sector:
|
|
Q3’2021 NPL Ratio** |
Q3’2022 NPL Ratio* |
% point change in NPL Ratio |
Q3’2021 NPL Coverage** |
Q3’2022 NPL Coverage* |
% point change in NPL Coverage |
|
ABSA Bank Kenya |
8.1% |
6.6% |
(1.5%) |
74.5% |
80.0% |
5.5% |
|
Equity Group |
9.5% |
9.5% |
- |
60.6% |
63.0% |
2.4% |
|
I&M Holdings |
10.2% |
9.5% |
(0.7%) |
70.6% |
75.4% |
4.8% |
|
Stanbic Bank |
11.5% |
10.1% |
(1.4%) |
54.9% |
63.4% |
8.5% |
|
NCBA Group |
17.0% |
12.6% |
(4.4%) |
70.2% |
65.3% |
(4.9%) |
|
Diamond Trust Bank |
11.9% |
12.7% |
0.8% |
40.0% |
45.2% |
5.2% |
|
Co-operative Bank of Kenya |
14.6% |
14.0% |
(0.6%) |
65.5% |
69.3% |
3.8% |
|
Standard Chartered Bank Kenya |
15.3% |
15.4% |
0.1% |
82.8% |
82.4% |
(0.4%) |
|
KCB |
13.7% |
17.8% |
4.1% |
63.4% |
52.8% |
(10.6%) |
|
HF Group |
22.0% |
20.3% |
(1.7%) |
68.9% |
77.2% |
8.3% |
|
Mkt Weighted Average |
12.2% |
12.3% |
0.1% |
65.7% |
65.7% |
(0.0%) |
|
*Market cap weighted as at 08/12/2022 |
||||||
|
**Market cap weighted as at 10/12/2021 |
||||||
Key take-outs from the table include;
- Asset quality for the listed banks deteriorated during the period, with the weighted average NPL ratio increasing by 0.1% points to a market cap weighted average of 12.3%, from an average of 12.2% in Q3’2021. The asset quality was however skewed by deterioration in KCB’s NPL ratio which increased by 4.1% points to 17.8% from 13.7% in Q3’2021,
- KCB Group had the highest NPL Ratio jump by 4.1% to 17.8% in Q3’2022 from 13.7% in Q3’2021, which was 4.3% points higher than industry average of 0.1% points, mainly attributable to the continued high exposure to corporate loans at 47.8% in Q3’2022, which have been impacted by delayed recovery from COVID-19, increased inflationary pressures and pending government bills. Additionally, the group’s asset quality was further weighed down by KCB Kenya’s NPL ratio which recorded a significant increase of 8.0% points to 19.8%, from 11.9% recorded in Q3’2021, partly attributable to loan stock by corporates due to delayed payments from government contracts. Further, despite being a y/y improvement to 24.5%, from 35.1% in Q3’2021, NBK’s NPL ratio continues to be adverse,
- NCBA Group recorded the highest improvement in its asset quality with the NPL ratio declining by 4.4% to 12.6% from 17.0% recoded in Q3’2021. The improvement in asset quality was mainly attributed to increase loan repayments during the period under review with gross non-performing loans declining by 20.9% to Kshs 36.4 bn from Kshs 46.0 bn recorded in Q3’2021, and,
- The NPL Coverage for the listed banks remained unchanged at a market cap weighted average of 65.6% in Q3’2022, similar to what was recorded in Q3’2021, mainly attributable to increased NPL coverage of Stanbic Bank, ABSA and Diamond Trust Bank (DTB-K) offsetting the reduced NPL coverage by KCB Group and NCBA Group.
- Capital Raising: In Q3’2022, listed banks continued to borrow from international institutions to not only strengthen their capital positions but also boost their ability to lend to the perceived riskier Micro Small and Medium Sized Enterprises (MSMEs) segment. In the period under review, the International Finance Corporation (IFC) disclosed that it would extend USD 150.0 mn (Kshs 18.0 bn) to KCB Group in form of a senior unsecured loan with a maturity of 7-years and a grace period of 2-years. The credit facility was aimed at supporting the growth of the bank’s climate finance portfolio which entails clients in sectors such as manufacturing, real estate and agriculture. For more information please see our Cytonn Monthly-August 2022. Additionally, the International Finance Corporation (IFC) disclosed that it would extend USD 100.0 mn (Kshs 12.2 bn) to Diamond Trust Bank (DTB) under the WCS COVID-19 FIGE response facility in form of a senior debt investment with 24-month maturity and renewable once on an aggregate of up to 36 months. For more information, please see our Cytonn Weekly #46/2022.
Section II: Summary of the Performance of the Listed Banking Sector in Q3’2022:
The table below highlights the performance of the banking sector, showing the performance using several metrics, and the key take-outs of the performance;
|
Bank |
Core EPS Growth |
Interest Income Growth |
Interest Expense Growth |
Net Interest Income Growth |
Net Interest Margin |
Non-Funded Income Growth |
NFI to Total Operating Income |
Growth in Total Fees & Commissions |
Deposit Growth |
Growth in Government Securities |
Loan to Deposit Ratio |
Loan Growth |
Return on Average Equity |
|
HF |
110.8% |
6.8% |
0.7% |
13.9% |
4.7% |
66.1% |
32.4% |
(3.6%) |
3.5% |
51.2% |
90.7% |
1.7% |
0.5% |
|
NCBA |
96.2% |
13.3% |
10.8% |
15.1% |
6.0% |
40.1% |
49.2% |
5.2% |
3.2% |
9.1% |
57.6% |
11.7% |
21.2% |
|
Co-op |
47.0% |
10.5% |
7.2% |
11.7% |
8.5% |
28.3% |
38.6% |
31.7% |
2.8% |
(5.7%) |
77.6% |
9.4% |
22.5% |
|
SCBK |
37.1% |
4.1% |
(12.6%) |
7.3% |
6.3% |
16.1% |
35.7% |
(13.4%) |
10.7% |
13.2% |
47.6% |
3.3% |
21.0% |
|
Stanbic |
36.8% |
3.1% |
19.2% |
26.8% |
6.2% |
37.5% |
44.6% |
8.1% |
25.6% |
38.3% |
88.6% |
34.1% |
25.1% |
|
ABSA |
30.1% |
24.7% |
22.4% |
25.3% |
7.6% |
16.4% |
30.4% |
(1.2%) |
4.6% |
10.5% |
103.0% |
26.4% |
23.2% |
|
Equity |
27.9% |
25.6% |
31.3% |
23.6% |
7.3% |
32.0% |
41.4% |
28.6% |
15.1% |
(0.1%) |
66.9% |
20.6% |
31.3% |
|
I&M |
25.1% |
17.3% |
20.0% |
15.6% |
6.6% |
43.0% |
35.4% |
26.0% |
6.7% |
(2.6%) |
75.1% |
11.4% |
13.9% |
|
KCB |
21.4% |
13.6% |
28.4% |
9.1% |
8.1% |
30.2% |
33.2% |
17.3% |
7.4% |
6.9% |
80.1% |
16.4% |
22.6% |
|
DTB-K |
21.1% |
15.4% |
17.2% |
43.5% |
5.7% |
43.5% |
29.0% |
24.5% |
11.1% |
17.4% |
67.7% |
18.5% |
8.0% |
|
Q3'22 Mkt Weighted Average* |
36.7% |
16.4% |
19.6% |
17.6% |
7.3% |
30.1% |
38.1% |
16.2% |
9.7% |
6.5% |
73.7% |
17.1% |
24.2% |
|
Q3'21 Mkt Weighted Average** |
102.0% |
15.9% |
14.9% |
16.9% |
7.3% |
14.3% |
35.2% |
11.4% |
14.3% |
11.7% |
69.7% |
12.4% |
18.7% |
|
*Market cap weighted as at 08/12/2022 |
|||||||||||||
|
**Market cap weighted as at 10/12/2021 |
|||||||||||||
Key takeaways from the table include:
- The listed banks recorded a 36.7% weighted average growth in core Earnings per Share (EPS), compared to a weighted growth of 102.0% recorded in Q3’2021 when the sector was recovering from a lower base. The performance during the period was mainly attributed to a 30.1% growth in non-funded income coupled with a 17.6% growth in net interest,
- The listed banks continued to implement their revenue diversification strategies as evidenced by non-funded income growth of 30.1% in Q3’2022 compared to 14.3% growth recoded in Q3’2021. The performance was mainly driven by 16.2% growth in total fees and commissions, which was an increase from 11.4% growth recorded during the same period last year,
- The Banks recorded a weighted average deposit growth of 9.7%, slower than the 14.3% growth recorded in Q3’2021, an indication of reduced investment risk in the business environment, and,
- Interest income grew by 16.4% in Q3’2022, compared to a growth of 15.9% recorded in Q3’2021 while the weighted average Yield on Interest Earning Assets (YIEA) remained relatively unchanged at 9.9%, similar to what was recorded in in Q3’2021 for the listed banking sector. Additionally, the Net Interest Margin (NIM) also remained unchanged at 7.3%, as was recorded in Q3’2021 for the whole listed banking sector
- The listed banks recorded a 24.2% weighted average Return on average Equity (RoaE), 5.5% points higher than the 18.7% weighted average recorded in Q3’2021. Additionally, the entire banking sector’s Return on Equity (ROE) recorded 5.2% points increase to 27.2% in Q3’2022, from 22.0% recorded in Q3’2021. As such, the Kenyan banking sector continues to record high profitability with ROE of 22.3% as of 2021 compared to other economies in the world where the average ROE stood at 13.7% as highlighted in the chart below:
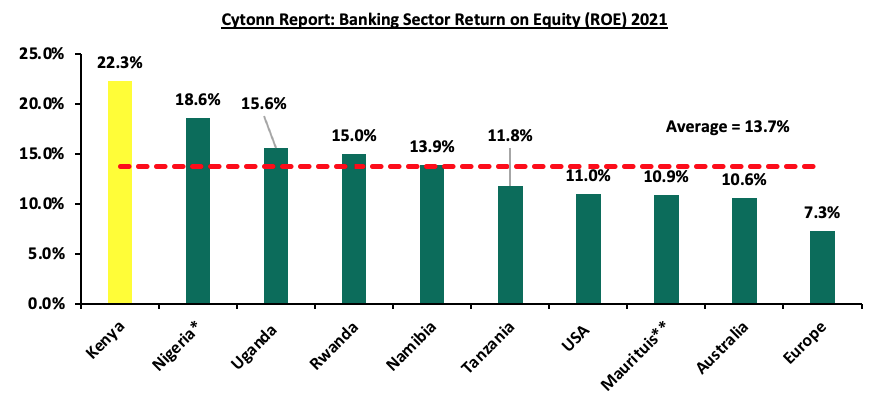
Source: Online research, *figures as of H1’2021, **figures as of Q3’2021
Section III: Outlook of the banking sector:
The banking sector continue to remain resilient despite the tough operating environment as evidenced by the increase in their profitability, with the Core Earnings Per Share (EPS) growing by 36.7%, with the increased revenue diversification continuing to bear fruit. However, we expect profitability to be weighed down in medium term as a result of expected increase in provisioning aimed at cushioning banks from the elevated credit risk arising from increased inflationary pressures. Based on the current operating environment, we believe the future performance of the banking sector will be mainly shaped by the following key factors:
- Revenue Diversification: In Q3’2022, Non-Funded Income (NFI) recorded a 30.1% weighted average growth, an increase from the 14.3% growth recorded in Q3’2021, with many banks diversifying their revenue sources. Additionally, weighted average contribution of NFI contribution to total operating income increased to 38.1% in Q3’2022, from the 35.2% weighted average contribution recorded in Q3’2021. We therefore believe that there exists an opportunity for the sector to further increase NFI contribution to revenue given the continuous adoption of digital channels by banks and their clients after the pandemic has created more revenue opportunities for the sector. Additionally, the reintroduction of charges for transactions between bank accounts and mobile money wallets as from January 2023, is expected to continue spurring NFI growth in the medium-long term due to the increased adoption of digital channels, which present an avenue for an increase in fees on transactions,
- Growth in Interest income: Going forward, we expect interest income growth to remain a key driver in the banking industry, evidenced by the 16.4% growth recorded in Q3’2022, higher than the 15.9% growth recorded in Q3’2021. Additionally, the government securities continue to witness increases in yields, as such we believe the continued allocation to government securities will lead to an increase in overall interest income. Further, we believe that as more banks continue to get approvals for their risk-based lending models, the banks will be able to effectively price their risk, expand loan books and consequently increase the interest income,
- Regional Expansion and Further Consolidation: Consolidation remains a key theme going forward with the current environment offering opportunities for larger banks with a sufficient capital base to expand and take advantage of the market's low valuations, as well as further consolidate out smaller and weaker banks. Notably, majority of the bigger banks have continued to cushion over unsystematic risks specific to the local market by expanding their operations into other African nations. Banks such as KCB and Equity Group have been leveraging on expansion and consolidation which has largely contributed to their increased asset base as well as earnings growth. As aforementioned, KCB Group recently announced the acquisition of Trust Merchant Bank (TMB) in DRC, while Equity Group is in the process of completing acquisition of Spire Bank. As such, we expect to see continued expansion trend aimed at revenue optimization. Additionally, Ethiopian government recently announced opening up of the financial sector to foreign investors, which provides a great opportunity for Kenyan banks to expand their operations into the Ethiopian market, and,
- Integration of Climate-Related Risk Management: The release of Guidance on Climate-Related Risk Management report by the Central Bank of Kenya (CBK) is driving banks to channel their long term financing into environmental-friendly assets that are more sustainable and have lower risk of damage loss as a result of climate change. Banks will also lend to clients whose activities do not pose an environmental risk and will ultimately lead to improvement of collateral quality. Key to note, Equity Group and KCB Group have sourced for loans from International Finance Corporation (IFC) aimed at supporting the growth of the bank’s climate finance portfolio.
Section IV: Brief Summary and Ranking of the Listed Banks:
As per our analysis on the banking sector from a franchise value and a future growth opportunity perspective, we carried out a comprehensive ranking of the listed banks. For the franchise value ranking, we included the earnings and growth metrics as well as the operating metrics shown in the table below in order to carry out a comprehensive review of the banks:
|
Bank |
Loan to Deposit Ratio |
Cost to Income (With LLP) |
Return on Average Capital Employed |
Deposits/ Branch (bn) |
Gross NPL Ratio |
NPL Coverage |
Tangible Common Ratio |
Non Funded Income/Revenue |
|
ABSA Bank |
103.0% |
54.7% |
26.4% |
3.4 |
6.6% |
80.0% |
12.4% |
30.4% |
|
NCBA Group |
57.6% |
58.7% |
23.4% |
4.4 |
12.6% |
65.3% |
12.8% |
49.2% |
|
Equity Bank |
66.9% |
56.6% |
29.2% |
2.8 |
9.5% |
63.0% |
10.0% |
41.4% |
|
KCB Group |
80.1% |
53.0% |
24.7% |
1.9 |
17.8% |
52.8% |
14.3% |
33.2% |
|
SCBK |
47.6% |
49.9% |
22.7% |
13.0 |
15.4% |
82.4% |
14.2% |
35.7% |
|
Coop Bank |
77.6% |
56.8% |
23.2% |
2.4 |
14.0% |
69.3% |
15.2% |
38.6% |
|
Stanbic Bank |
88.6% |
57.9% |
20.4% |
10.7 |
10.1% |
63.4% |
13.4% |
44.6% |
|
DTBK |
67.7% |
62.1% |
13.0% |
2.7 |
12.7% |
45.2% |
13.7% |
29.0% |
|
I&M Holdings |
75.1% |
59.7% |
15.3% |
3.7 |
9.5% |
75.4% |
14.6% |
35.4% |
|
HF Group |
90.7% |
96.7% |
0.9% |
1.8 |
20.3% |
77.2% |
13.8% |
32.4% |
|
Weighted Average Q3’2022 |
73.7% |
55.7% |
24.6% |
4.2 |
12.3% |
65.7% |
12.8% |
38.1% |
|
Market cap weighted as at 08/12/2022 |
||||||||
The overall ranking was based on a weighted average ranking of Franchise value (accounting for 60.0%) and intrinsic value (accounting for 40.0%). The Intrinsic Valuation is computed through a combination of valuation techniques, with a weighting of 40.0% on Discounted Cash-flow Methods, 35.0% on Residual Income and 25.0% on Relative Valuation, while the Franchise ranking is based on banks operating metrics, meant to assess efficiency, asset quality, diversification, and profitability, among other metrics. The overall Q3’2022 ranking is as shown in the table below:
|
Bank |
Franchise Value Rank |
Intrinsic Value Rank |
Weighted Rank |
H1'2022 |
Q3’2022 |
|
KCB Group Plc |
3 |
1 |
1.8 |
4 |
1 |
|
Equity Group Holdings Ltd |
4 |
2 |
2.8 |
1 |
2 |
|
Co-operative Bank of Kenya Ltd |
1 |
5 |
3.4 |
2 |
3 |
|
ABSA |
4 |
3 |
3.4 |
3 |
3 |
|
I&M Holdings |
2 |
6 |
4.4 |
5 |
5 |
|
NCBA Group Plc |
8 |
4 |
5.6 |
9 |
6 |
|
SCBK |
6 |
8 |
7.2 |
7 |
7 |
|
DTBK |
9 |
7 |
7.8 |
8 |
8 |
|
Stanbic Bank/Holdings |
7 |
9 |
8.2 |
6 |
9 |
|
HF Group Plc |
10 |
10 |
10 |
10 |
10 |
Major Changes from the Q3’2022 Ranking are:
- KCB Group’s rank improved to position 1 in Q3’2022 from position 4 in H1’2022, majorly driven by a strong intrinsic score as well as an improvement in the group’s management quality with the Cost to income ratio without LLPs declining to 45.1% from 45.7%, coupled with an improvement in the Group’s NPL ratio to 17.8%, from 21.4% in Q1’2022,
- Equity Group’s rank declined to position 2 in Q3’2022 from position 1 in H1’2022 attributable to a deterioration in Cost to Income without LLPs to 47.1%, from 46.7% recorded in H1’2022, coupled with an increase the Gross NPL ratio to 9.5% in Q3’2022 from 8.8% in H1’2022. Additionally, the Group’s performance was weighed down by the reduction in the Gross NPL Coverage to 63.0%, from 64.1% recorded in H1’2022 which led to a decline in the bank’s franchise value score, and,
- NCBA Group’s rank improved to position 6 in Q3’2022, from position 9 H1’2022, mainly attributable to 1.0% points decline in the Group’s NPL ratio to 12.6%, from 13.6% recorded in H1’2022 as well as an increase in the Group’s Return on Average Equity to 21.2% from 17.3% in H1’2022. Additionally, the Group’s Net Interest Margin increased to 6.0%, from the 5.9% recorded in H1’2022.
For more information, see our Cytonn Q3’2022 Listed Banking Sector Review
Disclaimer: The views expressed in this publication are those of the writers where particulars are not warranted. This publication, which is in compliance with Section 2 of the Capital Markets Authority Act Cap 485A, is meant for general information only and is not a warranty, representation, advice or solicitation of any nature. Readers are advised in all circumstances to seek the advice of a registered investment advisor.

- Talk to us
- Kenya
- P.O Box 20695 - 00200, Nairobi, Kenya
- Cell +254709101200
- Tel +254709101200
- WhatsApp +254741676635
- United States
- +254709101200
- DOWNLOAD OUR APP
-


- Kenya
- 8th Floor, Pinetree Plaza, Kaburu Drive, Ngong Road, Nairobi, Kenya
- USA
- Suite 1150, 1775 Eye Street NW, USA, Washington DC 20006, USA
- Investments
- High Yield
- Private Equity
- Real Estate
- Real Estate
- RiverRun Estates
- Cytonn Towers
- The Ridge
- Taraji Heights
- The Alma