
Kenya’s Listed Banks H1’2026 Report, & Cytonn Weekly #37.2026
By Research Team, Sep 20, 2026
Executive Summary
Fixed Income
During the week, T-bills were oversubscribed for the seventh consecutive week, with the overall subscription rate coming in at 152.6% lower than the subscription rate of 198.2% recorded the previous week. Investors’ preference for the shorter 91-day paper persisted, with the paper receiving bids worth Kshs 23.2 bn against the offered Kshs 8.0 bn, translating to a subscription rate of 290.6%, lower than the subscription rate of 369.8%, recorded the previous week. The subscription rate for the 182-day paper decreased to 100.5% from 129.7% recorded the previous week, while that of the 364-day paper decreased to 94.3% from 129.6% recorded the previous week. The government accepted a total of Kshs 42.69 bn worth of bids out of Kshs 42.71 bn bids received, translating to an acceptance rate of 99.9%. The yields on the government papers recorded a mixed performance with the yields on the 91-day paper increasing by 1.6 bps to 8.78% from 8.77% recorded the previous week. The yields on the 182-day paper decreased the most by 2.0 bps to 8.91% from 8.93% recorded the previous week while that of the 364-day paper decreased by 1.0 bps to 9.06% from 9.07 % recorded the previous week;
During the week, the Central Bank of Kenya released the auction results for the re-opened treasury bonds FXD1/2019/020 and FXD1/2026/030 with tenors to maturities of 12.6 years and 29.6 years respectively and fixed coupon rates of 12.9% and 12.5% respectively. The bonds were oversubscribed, with the overall subscription rate coming in at 135.7%, receiving bids worth Kshs 81.4 bn against the offered Kshs 60.0 bn.
The government accepted bids worth Kshs 50.2 bn, translating to an acceptance rate of 61.6%. The weighted average yield for the accepted bids for the FXD1/2019/020 and FXD1/2026/030 came in at 13.6% and 14.2% respectively. Notably, the 13.6% yield on FXD1/2019/020 was lower than the 13.9% recorded at the last reopening in July 2026. While the 14.2% yield on the FXD1/2026/030 was higher than the 13.8% recorded at the last reopening in April 2026. With the Inflation rate at 6.6% as of August 2026, the real returns of the FXD1/2019/020 and FXD1/2026/030 are 7.0% and 7.6% respectively. Given the 10.0% withholding tax on the bonds, the tax equivalent yields for shorter term bonds with 15.0% withholding tax are 13.6% for the FXD1/2019/020 and 14.0% for the FXD1/2026/030;
During the week, the Energy and Petroleum Regulatory Authority (EPRA) released its monthly statement on the maximum retail fuel prices in Kenya, effective from 15th September 2026 to 14th October 2026;
During the week, the National Treasury gazetted the revenue and net expenditures for the second month of FY’2026/2027, ending 31st August 2026, highlighting that the total revenue collected as at the end of August 2026 amounted to Kshs 413.2 bn, equivalent to 13.8 % of the original estimates of Kshs 2,985.7 bn for FY’2026/2027 and is 83.0% of the prorated estimates of Kshs 497.6 bn.
Equities
During the week, the equities market was on a downward trajectory, with NSE 20, NSE 25, NSE 10 and NASI declining by 4.1%, 3.4%, 3.3% and 2.5% respectively taking the YTD performance to gains of 32.8%, 32.6%, 31.3% and 27.4% respectively for NSE 10, NSE 20, NSE 25 and NASI respectively. The week-on-week equities market performance was mainly driven by losses recorded by large cap stocks such as KCB, Absa Bank, and Cooperative bank of 7.4%, 7.2% and 6.3% respectively. However, the performance was supported by gains recorded by large cap stocks such as Safaricom of 0.3%;
During the week, the banking sector index decreased by 4.5% to 276.7 from the 289.7 recorded the previous week. This is attributable to losses recorded by large cap stocks such as KCB, Absa Bank and Cooperative bank of 7.4%, 7.2% and 6.3% respectively.
During the week, Kenya Power & Lighting Company Plc (KPLC) released its FY’2026 audited financial results, recording a 2.1% increase in profitability to Kshs 25.0 bn, up from Kshs 24.5 bn in FY’2025. The performance was mainly attributable to a 14.7% increase in gross profit to Kshs 85.6 bn, up from Kshs 74.6 bn in FY’2025, coupled with a 34.7% decrease in finance costs to Kshs 3.1 bn from the Kshs 4.7 bn in FY’2025. The performance was however weighed down by the 5.5% increase in cost of sales to Kshs 152.6 bn from Kshs 144.7 bn recorded in FY’2025, and a 15.5% decrease in interest income to Kshs 0.5 bn from Kshs 0.6 bn in FY’2025;
Real Estate
During the week, attention was drawn to the shortfall in Kenya’s tourism levy collections, highlighting the challenges faced by authorities in regulating the country’s growing short-term rental market. The Tourism Fund collected Kshs 5.6 bn in the 2025/26 financial year, against a target of Kshs 6.7 bn, resulting in a shortfall of about Kshs 1.0 bn. The underperformance was partly attributed to difficulties in capturing revenue from Airbnb units, homestays and villas, which are more difficult to identify and regulate than conventional hotels;
On the Unquoted Securities Platform Acorn D-REIT and I-REIT traded at Kshs 29.7 and Kshs 24.4 per unit, respectively, as per the last updated data on 11th September 2026. The performance represented a 48.5% and 22.0% gain for the D-REIT and I-REIT, respectively, from the Kshs 20.0 inception price. Additionally, ILAM Fahari I-REIT traded at Kshs 20.5 per share as of 11th September 2026, representing a 2.5% gain from the Kshs 20.0 inception price;
Digital Payments
During the week, Visa Inc. released new Business and Economic Insights research highlighting the rise of the couch economy, showing that consumers are increasingly shopping, streaming, dining, and managing daily life from home, with online and in-app domestic payment volumes expanding significantly across markets such as the U.S. (rising to 58.0 in 2026 from 48.0% in 2019), Poland, and the UAE, while streaming subscriptions capture a broader share of consumer cards than traditional cinema and concert spending; the trend rewards businesses that deliver digital engagement, subscription models, and delivery capabilities, shifting consumer spending toward home-centered convenience;
During the week, Mastercard partnered with the startup Alchemy to unveil an agentic payment option utilizing one-time-use Mastercard virtual payment credentials and stablecoin wallets via a single Command Line Interface (CLI), enabling AI agents to autonomously discover, compare, and buy products on behalf of users within predefined parameters; this development addresses the critical challenge of modernizing risk frameworks and risk rules to allow bots to transact safely, while also raising broader industry questions regarding anti-fraud systems and autonomous agent capabilities;
During the week, Block introduced a new illustrative macro sensitivity tool for Cash App Borrow, providing visibility into how the lending portfolio could respond under different macroeconomic scenarios using foundational data from Cash App Score an alternative credit scoring model built on customer platform activity that approves 38.0% more customers at the same loss rate compared to traditional credit scores; this tool gives stakeholders a transparent window into how tightening economic conditions could impact originations and risk losses, reinforcing Block's strategy of leveraging alternative data to expand credit access safely;
During the week, the PayPal Debit Card was named Best in Class in Javelin Strategy & Research’s 2026 General-Purpose Reloadable (GPR) Card Scorecard, standing out alongside Overall Leaders Cash App Card and Wisely Direct; the recognition highlights how peer-to-peer (P2P) linked cards are gaining momentum by combining low costs, broad acceptance, and added benefits to turn stored digital wallet balances into practical, low-cost tools for everyday spending;
The digital payment stocks we track (AXP, Visa, Mastercard, Circle, Block, and PayPal) are currently trading at an average forward P/E of 23.3x, implying that investors continue to price in resilient earnings growth and strong digital payment adoption, although elevated operating costs and higher client incentives across legacy card networks may moderate valuation expansion in the near term
Focus of the Week
Following the release of the H1’2026 results by Kenyan listed banks, the Cytonn Financial Services Research Team undertook an analysis on the financial performance of the listed banks and identified the key factors that shaped the performance of the sector.
Investment Updates:
-
Weekly Rates: Cytonn Money Market Fund closed the week at a yield of 11.0% p.a. To invest, dial *809# or download the Cytonn App from Google Play store here or from the Appstore here;
-
We continue to offer Wealth Management Training every Tuesday, from 7:00 pm to 8:00 pm. The training aims to grow financial literacy among the general public. To register for any of our Wealth Management Trainings, click here. If interested in our Private Wealth Management Training for your employees or investment group, please get in touch with us through wmt@cytonn.com;
-
Cytonn Asset Managers Limited (CAML) continues to offer pension products to meet the needs of both individual clients who want to save for their retirement during their working years and Institutional clients that want to contribute on behalf of their employees to help them build their retirement pot. To more about our pension schemes, kindly get in touch with us through pensions@cytonn.com;
Hospitality Updates:
-
We currently have promotions for Staycations. Visit cysuites.com/offers for details or email us at sales@cysuites.com;
Money Markets, T-Bills Primary Auction:
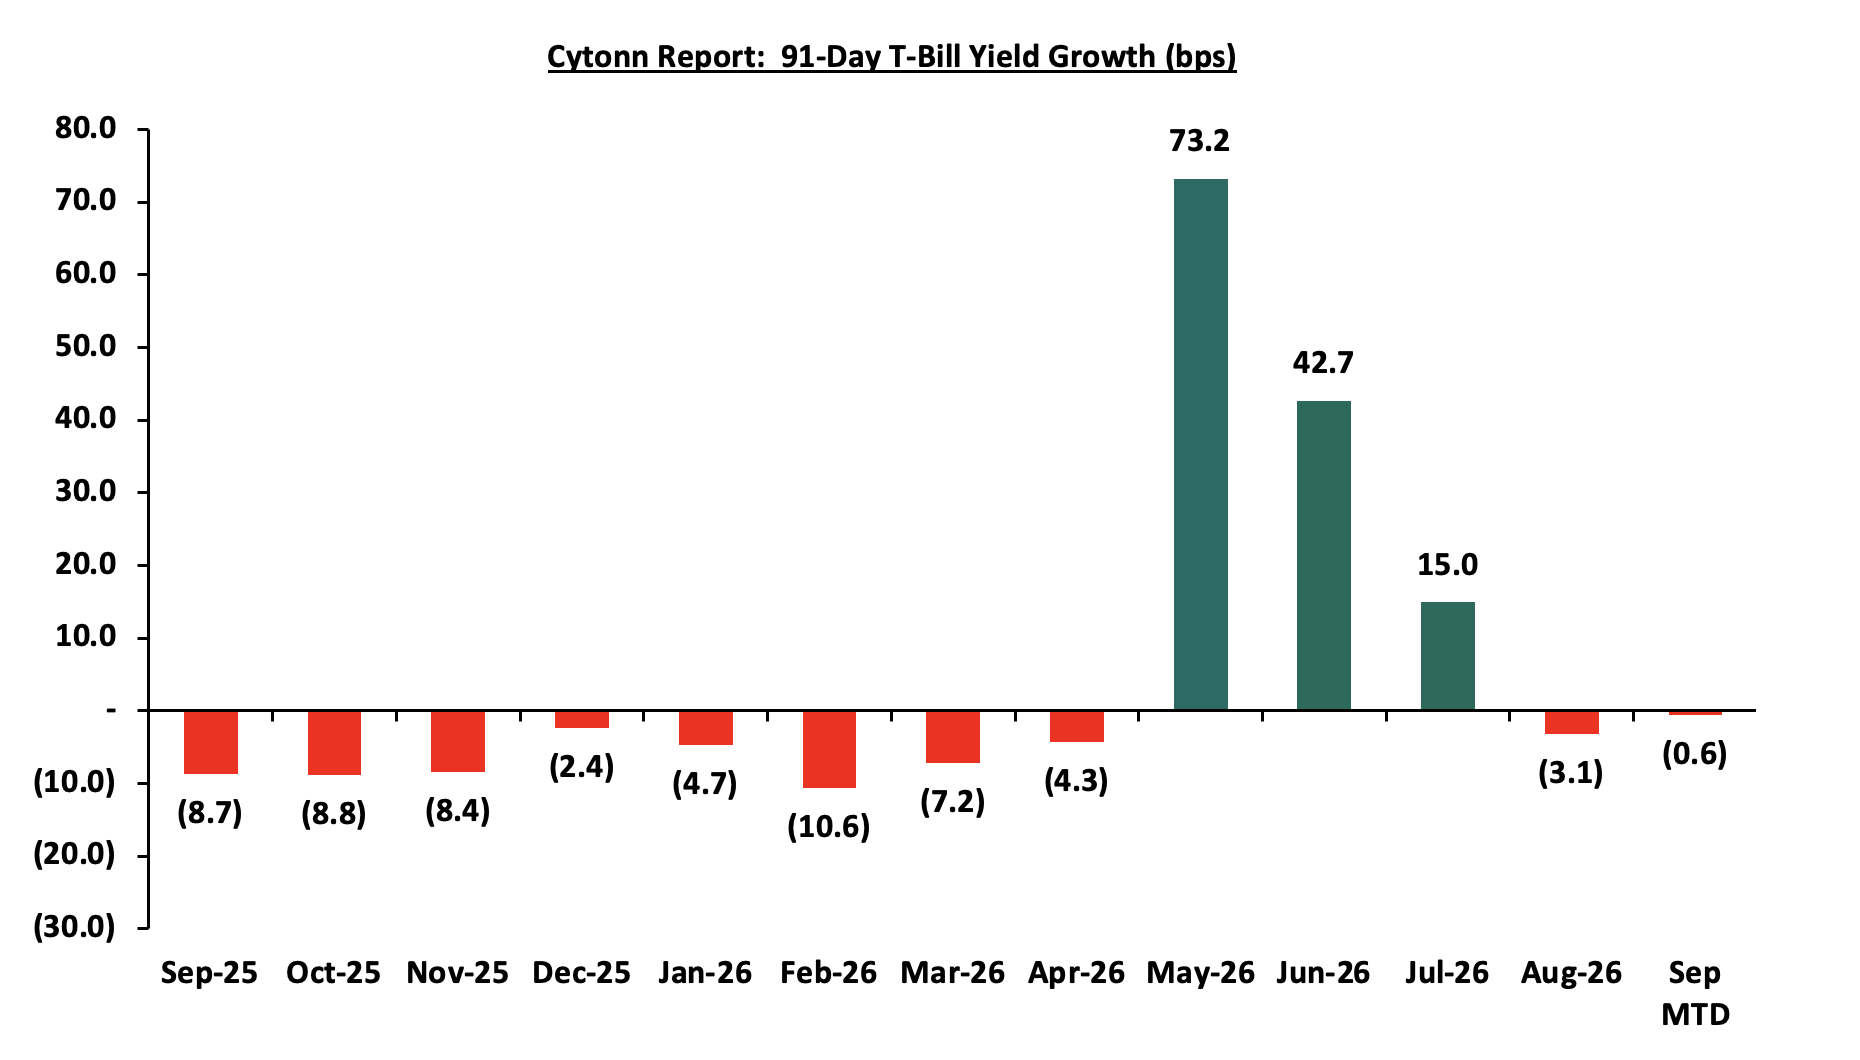
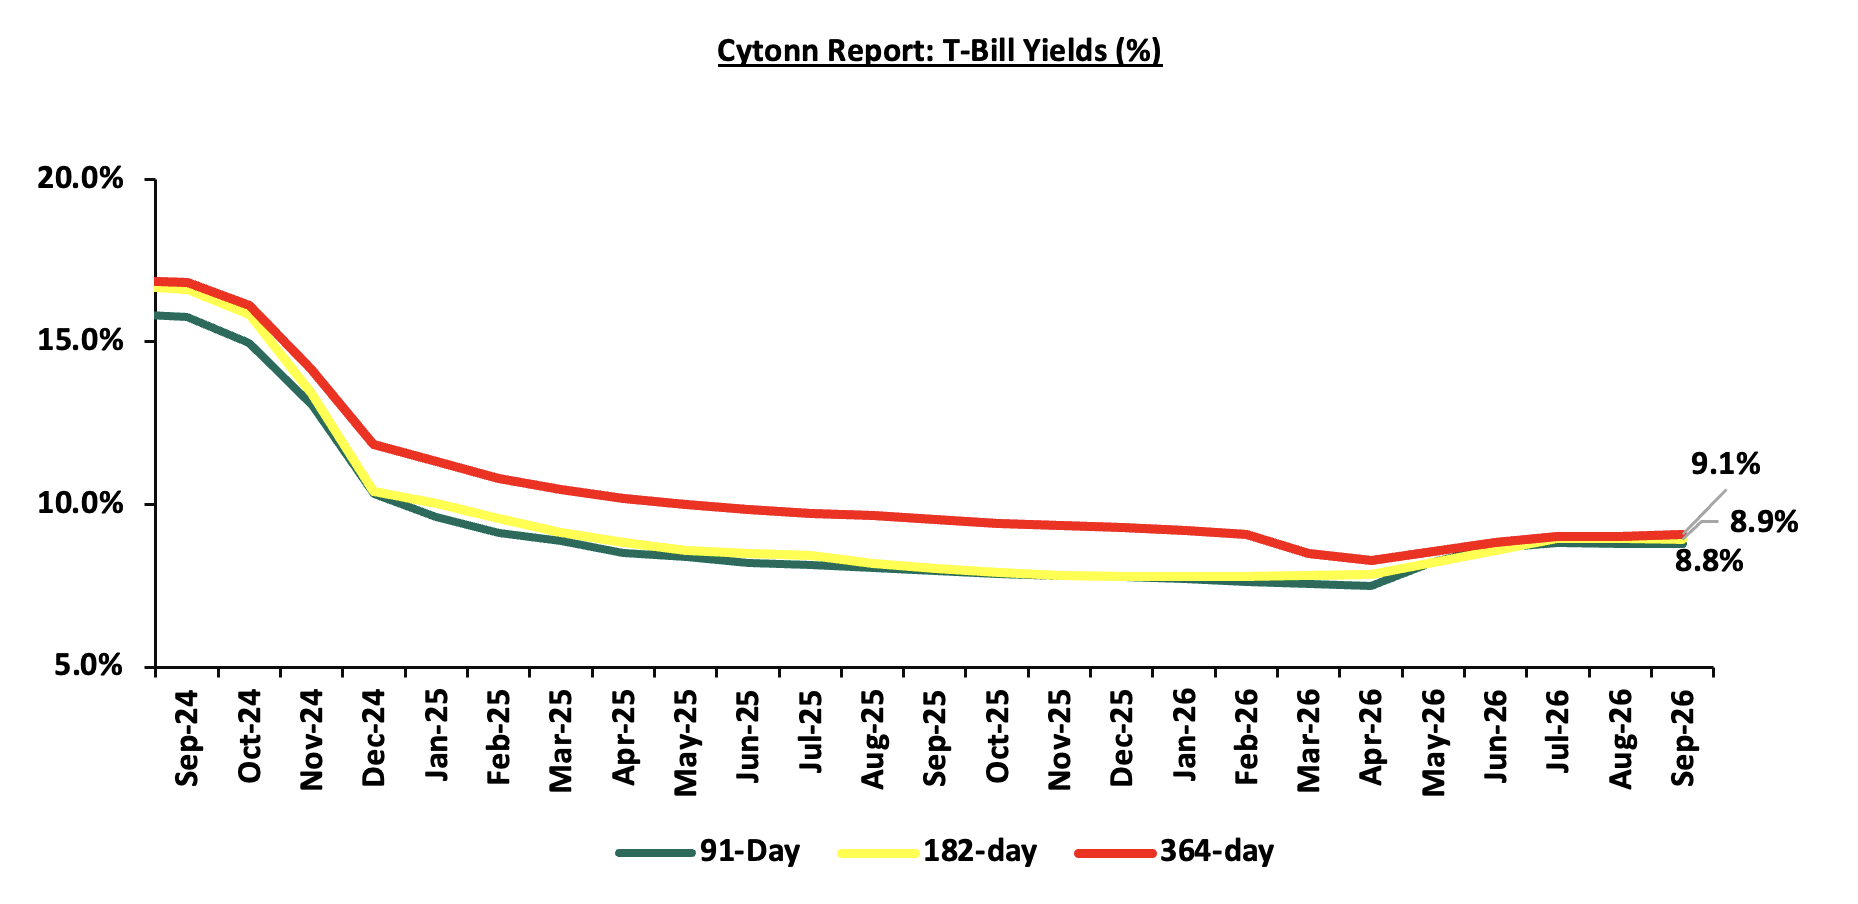
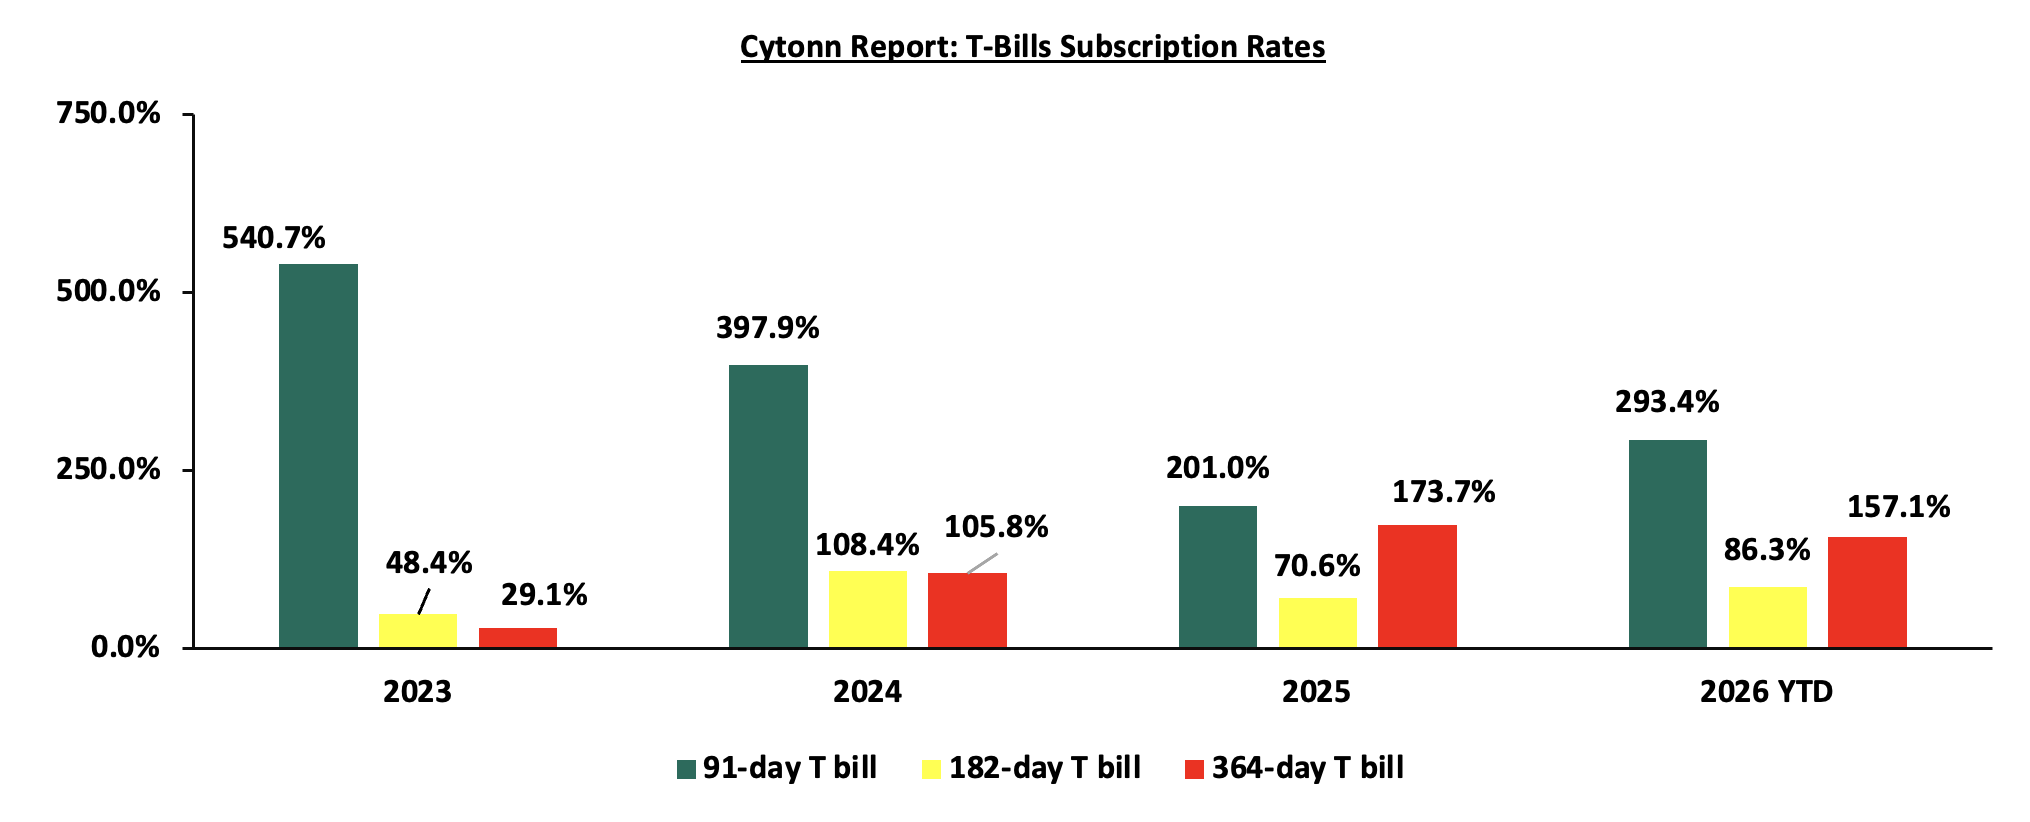
This week, T-bills were oversubscribed for the seventh consecutive week, with the overall subscription rate coming in at 152.6% lower than the subscription rate of 198.2% recorded the previous week. Investors’ preference for the shorter 91-day paper persisted, with the paper receiving bids worth Kshs 23.2 bn against the offered Kshs 8.0 bn, translating to a subscription rate of 290.6%, lower than the subscription rate of 369.8%, recorded the previous week. The subscription rate for the 182-day paper decreased to 100.5% from 129.7% recorded the previous week, while that of the 364-day paper decreased to 94.3% from 129.6% recorded the previous week. The government accepted a total of Kshs 42.69 bn worth of bids out of Kshs 42.71 bn bids received, translating to an acceptance rate of 99.9%. The yields on the government papers recorded a mixed performance with the yields on the 91-day paper increasing by 1.6 bps to 8.78% from 8.77% recorded the previous week. The yields on the 182-day paper decreased the most by 2.0 bps to 8.91% from 8.93% recorded the previous week while that of the 364-day paper decreased by 1.0 bps to 9.06% from 9.07% recorded the previous week.
The chart below shows the yield growth rate for the 91-day paper from September 2025 to date:
The chart below shows the performance of the 91-day, 182-day and 364-day papers from September 2024 to September 2026:
The chart below compares the overall average T-bill subscription rates obtained in 2023, 2024, 2025 and 2026 Year-to-date (YTD):
T-Bonds Primary Auction:
During the week, the Central Bank of Kenya released the auction results for the re-opened treasury bonds FXD1/2019/020 and FXD1/2026/030 with tenors to maturities of 12.6 years and 29.6 years respectively and fixed coupon rates of 12.9% and 12.5% respectively. The bonds were oversubscribed, with the overall subscription rate coming in at 135.7%, receiving bids worth Kshs 81.4 bn against the offered Kshs 60.0 bn.
The government accepted bids worth Kshs 50.2 bn, translating to an acceptance rate of 61.6%. The weighted average yield for the accepted bids for the FXD1/2019/020 and FXD1/2026/030 came in at 13.6% and 14.2% respectively. Notably, the 13.6% yield on FXD1/2019/020 was lower than the 13.9% recorded at the last reopening in July 2026. While the 14.2% yield on the FXD1/2026/030 was higher than the 13.8% recorded at the last reopening in April 2026. With the Inflation rate at 6.6% as of August 2026, the real returns of the FXD1/2019/020 and FXD1/2026/030 are 7.0% and 7.6% respectively. Given the 10.0% withholding tax on the bonds, the tax equivalent yields for shorter term bonds with 15.0% withholding tax are 13.6% for the FXD1/2019/020 and 14.0% for the FXD1/2026/030
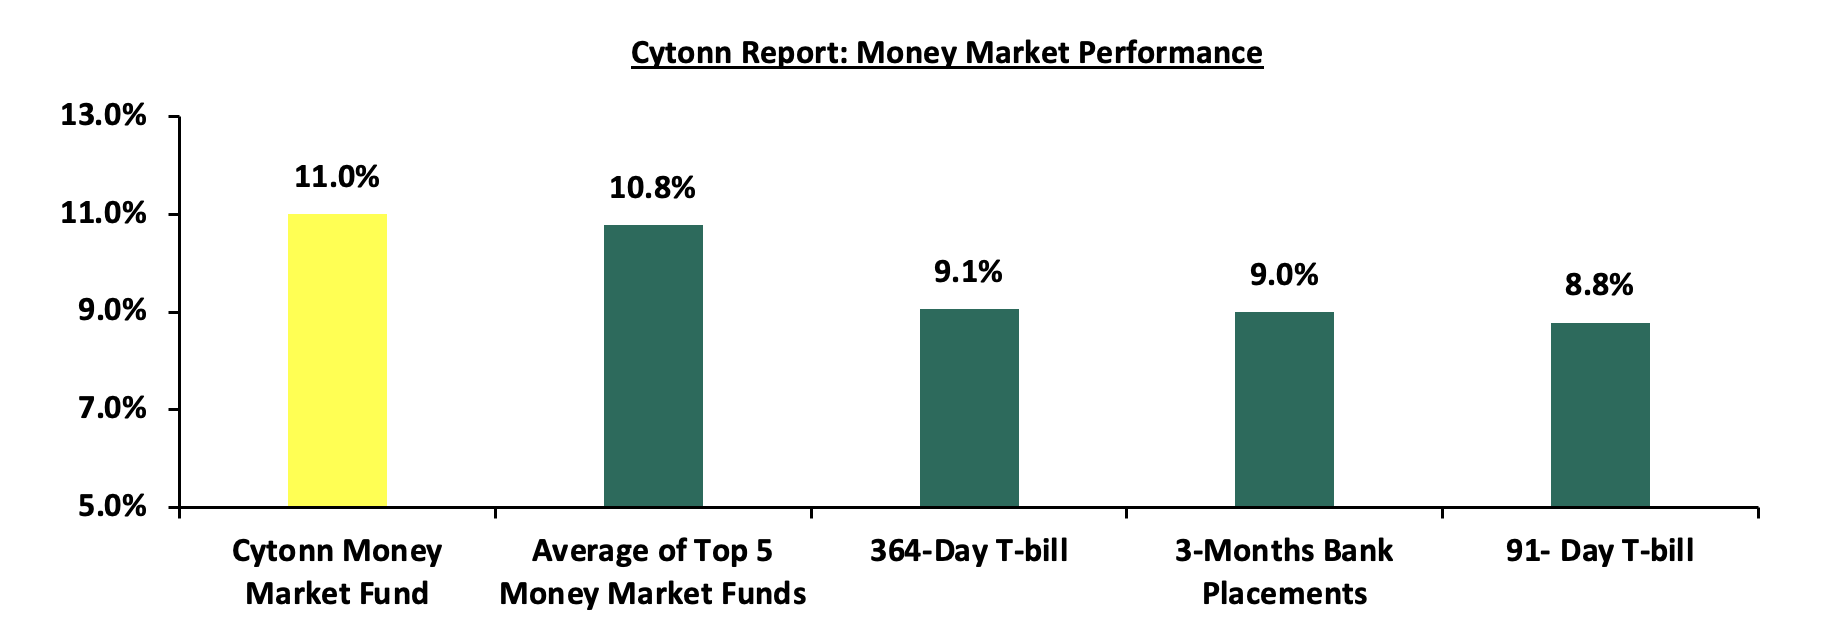
In the money markets, 3-month bank placements ended the week at 9.0% (based on rates offered by various banks). The yields on the government papers recorded a mixed performance with the yields on the 91-day paper increasing by 1.6 bps to 8.78% from 8.77% recorded the previous week, while that of the 364-day paper decreased by 1.0 bps to 9.06% from 9.07 % recorded the previous week. The yield on the Cytonn Money Market Fund decreased by 8.0 bps to 11.0% from 11.08% recorded the previous week, while the average yields on Top 5 Money Market Funds decreased by 2.8 bps to remain unchanged at 10.8% recorded the previous week
The table below shows the Money Market Fund Yields for Kenyan Fund Managers as published on 18th September 2026
|
Money Market Fund Yield for Fund Managers as published on 18th September 2026 |
||
|
Rank |
Fund Manager |
Effective Annual Rate |
|
1 |
Cytonn Money Market Fund (Dial *809# or download Cytonn App) |
11.0% |
|
2 |
Faulu Money Market Fund |
11.0% |
|
3 |
Lofty-Corban Money Market Fund |
10.7% |
|
4 |
Enwealth Money Market Fund |
10.7% |
|
5 |
Madison Money Market Fund |
10.6% |
|
6 |
Ndovu Money Market Fund |
10.5% |
|
7 |
Kuza Money Market fund |
10.4% |
|
8 |
Globetec Money Market Fund |
10.4% |
|
9 |
Orient Kasha Money Market Fund |
10.4% |
|
10 |
Jubilee Money Market Fund |
10.4% |
|
11 |
Old Mutual Money Market Fund |
10.4% |
|
12 |
Rejesha Money Market Fund |
10.3% |
|
13 |
Nabo Africa Money Market Fund |
10.3% |
|
14 |
Arvocap Money Market Fund |
10.2% |
|
15 |
GenAfrica Money Market Fund |
10.2% |
|
16 |
Etica Money Market Fund |
10.2% |
|
17 |
Gulfcap Money Market Fund |
10.1% |
|
18 |
SanlamAllianz Money Market Fund |
9.9% |
|
19 |
British-American Money Market Fund |
9.8% |
|
20 |
Apollo Money Market Fund |
9.6% |
|
21 |
Dry Associates Money Market Fund |
9.2% |
|
22 |
Genghis Money Market Fund |
9.1% |
|
23 |
KCB Money Market Fund |
8.9% |
|
24 |
CPF Money Market Fund |
8.6% |
|
25 |
CIC Money Market Fund |
8.4% |
|
26 |
Mayfair Money Market Fund |
8.2% |
|
27 |
AA Kenya Shillings Fund |
8.1% |
|
28 |
Co-op Money Market Fund |
8.0% |
|
29 |
Mali Money Market Fund |
8.0% |
|
30 |
ICEA Lion Money Market Fund |
7.8% |
|
31 |
Absa Shilling Money Market Fund |
7.5% |
|
32 |
Ziidi Money Market Fund |
6.0% |
|
33 |
Equity Money Market Fund |
5.6% |
|
34 |
Stanbic Money Market Fund |
|
Source: Business Daily
Liquidity:
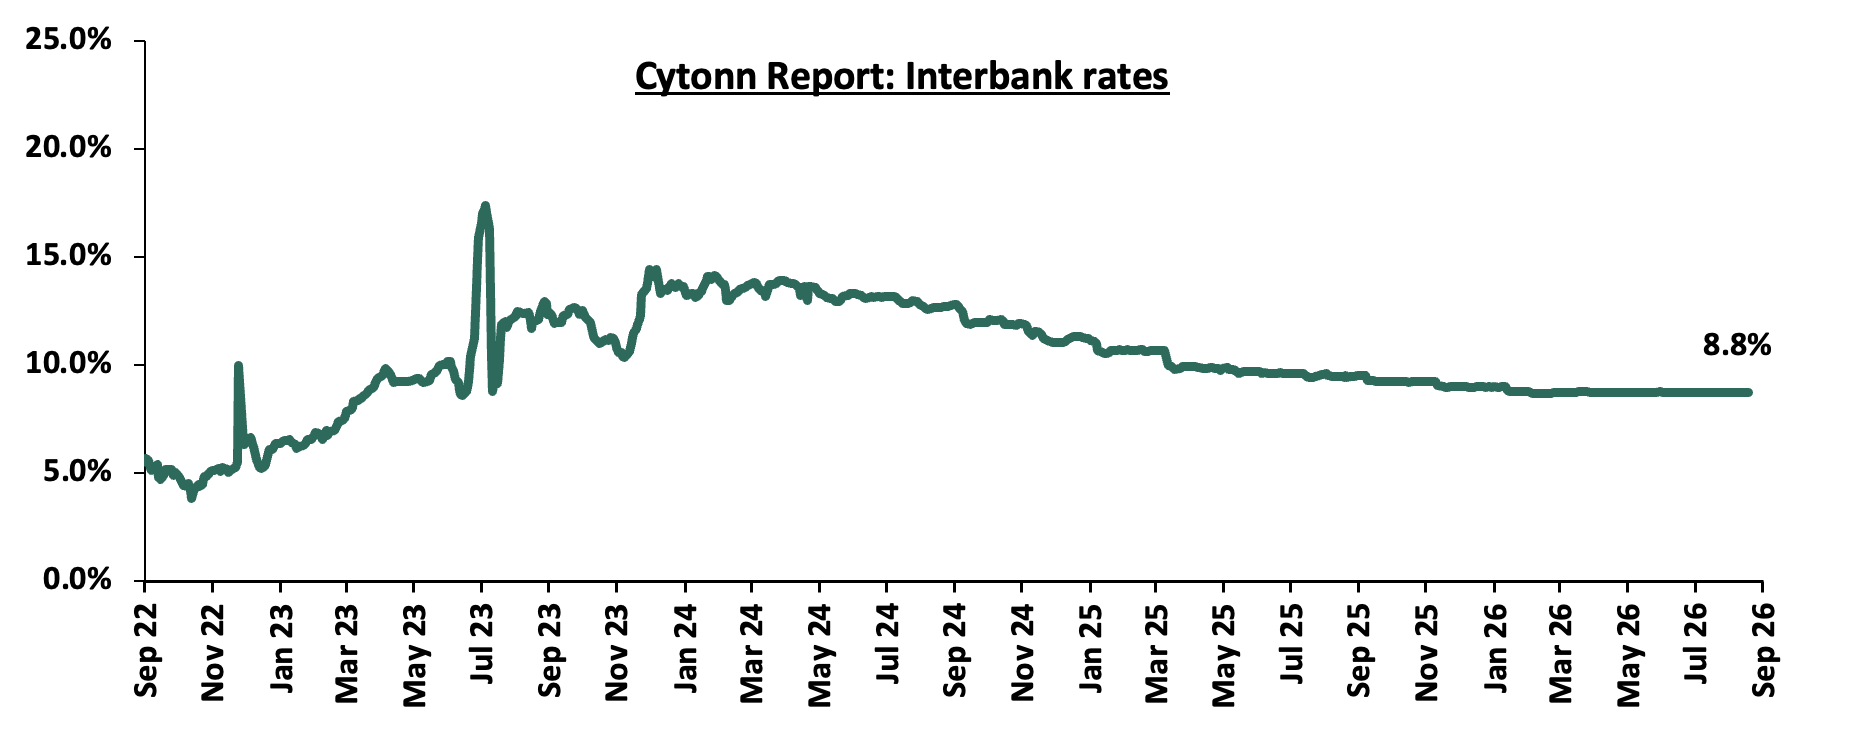
During the week, liquidity in the money markets eased with the average interbank rate decreasing marginally by 0.2 bps to remain relatively unchanged at 8.8% recorded the previous week, partly attributable to tax remittances that offset government payments. The average interbank volumes traded increased by 15.5% to Kshs 13.1 bn from Kshs 11.3 bn recorded the previous week. The chart below shows the interbank rates in the market over the years:
Kenya Eurobonds:
During the week, the yields on the Eurobonds were on an upward trajectory with the yield on the 12-year Eurobond issued in 2019, increasing the most by 12.0 bps to 7.8% from 7.7% recorded the previous week. The table below shows the summary performance of the Kenyan Eurobonds as of 17th September 2026:
|
Cytonn Report: Kenya Eurobonds Performance |
|||||
|
|
2018 |
2019 |
2021 |
2024 |
|
|
Tenor |
10-year issue |
30-year issue |
12-year issue |
13-year issue |
7-year issue |
|
Amount Issued (USD) |
1.0 bn |
1.0 bn |
1.0 bn |
1.5 bn |
1.5 bn |
|
Years to Maturity |
2.5 |
22.5 |
8.8 |
5.5 |
10.5 |
|
Yields at Issue |
7.3% |
8.3% |
6.2% |
10.4% |
9.9% |
|
02-Jan-26 |
6.1% |
8.8% |
7.2% |
7.8% |
7.1% |
|
01-Sep-26 |
6.6% |
7.3% |
7.6% |
9.5% |
9.0% |
|
10-Sep-26 |
6.7% |
9.2% |
7.7% |
8.3% |
7.5% |
|
11-Sep-26 |
6.6% |
9.2% |
7.7% |
8.3% |
7.5% |
|
14-Sep-26 |
6.8% |
9.4% |
7.9% |
8.5% |
7.7% |
|
15-Sep-26 |
6.9% |
9.4% |
8.0% |
8.6% |
7.8% |
|
16-Sep-26 |
6.8% |
9.4% |
7.9% |
8.5% |
7.7% |
|
17-Sep-26 |
6.8% |
9.2% |
7.8% |
8.3% |
7.6% |
|
Weekly Change |
0.1% |
0.0% |
0.1% |
0.0% |
0.1% |
|
MTD Change |
0.2% |
2.0% |
0.2% |
(1.2%) |
(1.4%) |
|
YTD Change |
0.8% |
0.4% |
0.6% |
0.5% |
0.5% |
Source: Central Bank of Kenya (CBK) and National Treasury
Kenya Shilling:
During the week, the Kenya Shilling depreciated against the US Dollar by 12.4 bps to Kshs 129.6 from 129.4 recorded the previous week. On a year-to-date basis, the shilling has depreciated by 43.4 bps against the dollar, as compared to the 22.9 bps appreciation recorded in 2025.
We expect the shilling to be supported by:
-
Diaspora remittances standing at a cumulative USD 5,012.7 mn in the twelve months to August 2026, slightly lower than the USD 5,078.8 mn recorded over the same period in 2025. These have continued to cushion the shilling against further depreciation. In the August 2026 diaspora remittances figures, North America remained the largest source of remittances to Kenya accounting for 50.3% in the period,
-
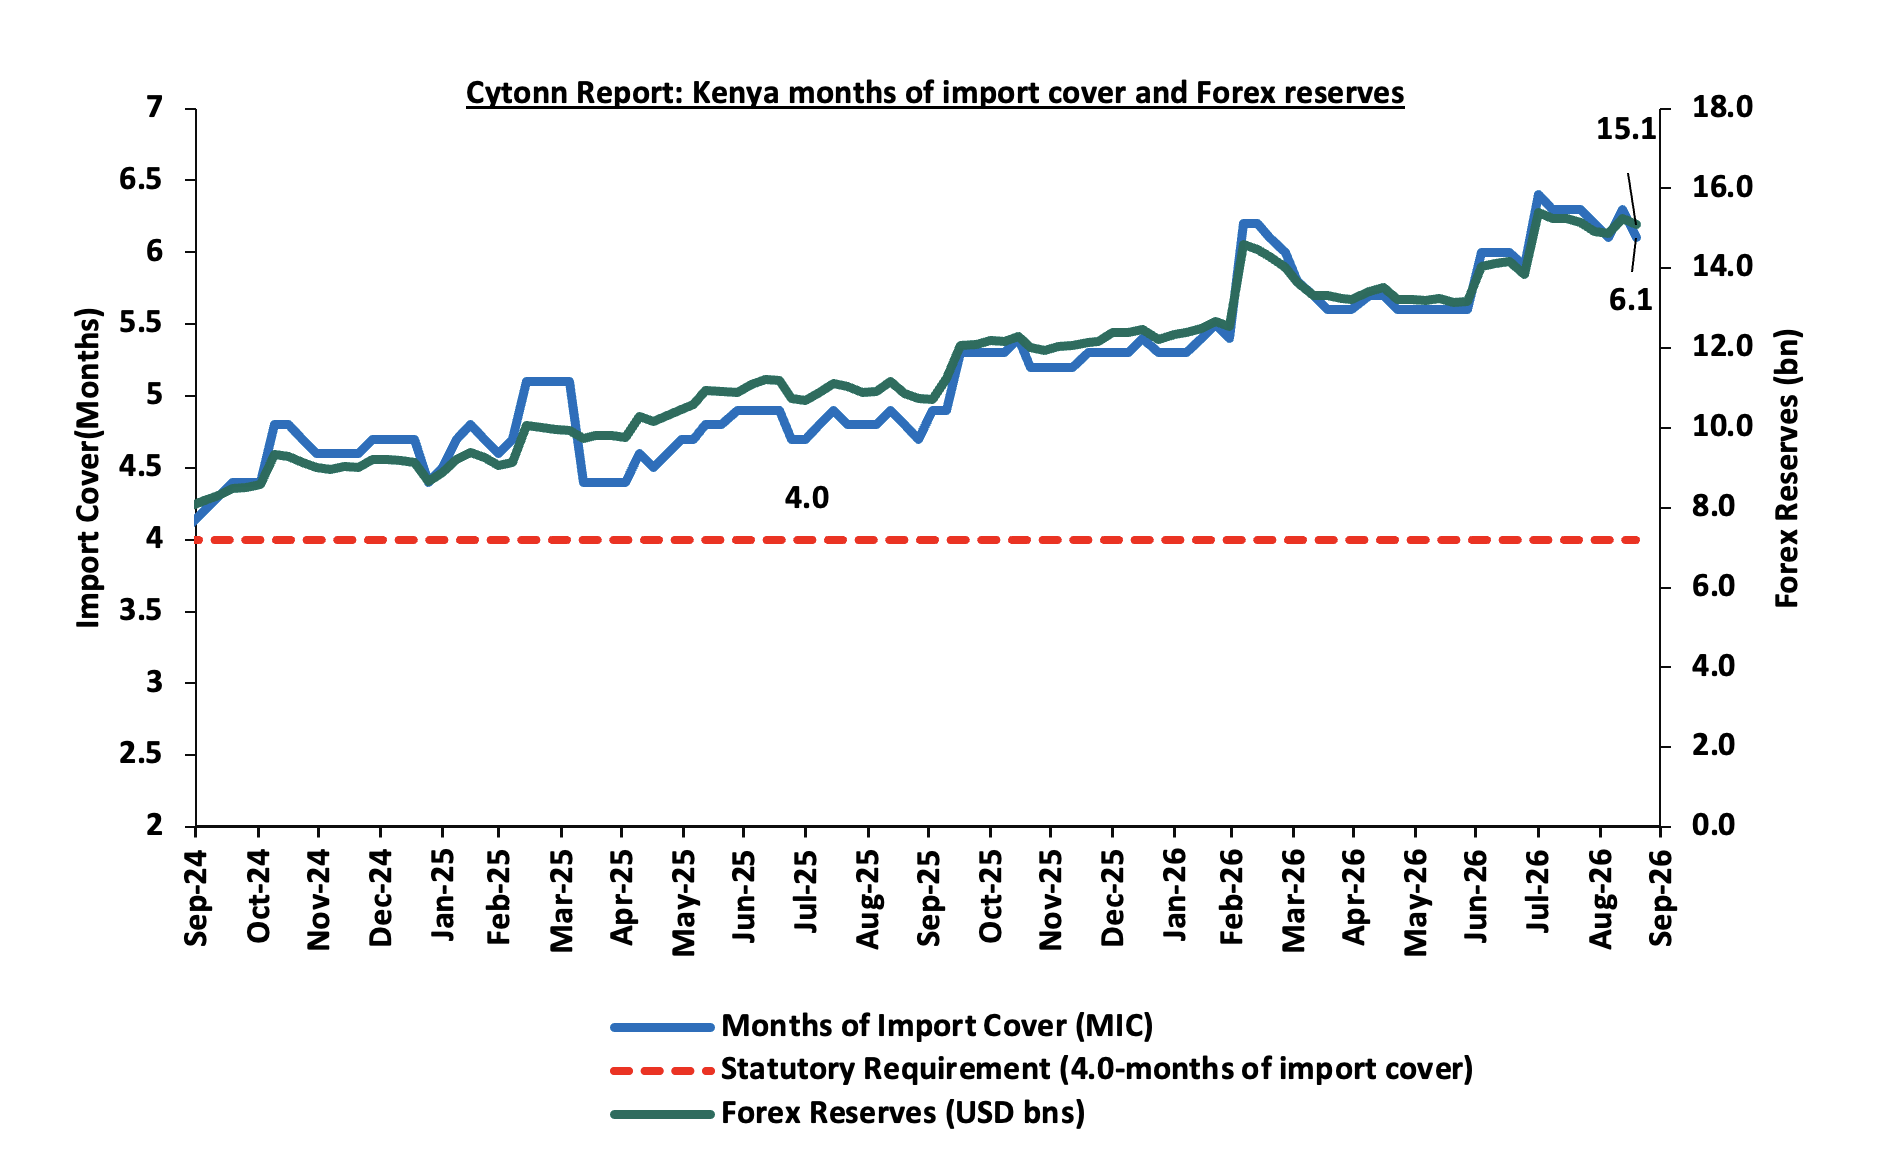
Improved forex reserves currently at USD 15.1 bn (equivalent to 6.1-months of import cover), which is above the statutory requirement of maintaining at least 4.0-months of import cover and above the EAC region’s convergence criteria of 4.5-months of import cover.
The shilling is however expected to remain under pressure in 2026 as a result of:
-
An ever-present current account deficit which widened to 3.0% of GDP in the 12 months to June 2026 compared to 1.9% of GDP in a similar period in 2025 and,
-
The need for government debt servicing, continues to put pressure on forex reserves given that 54.8% of Kenya’s external debt is US Dollar-denominated as of June 2026.
-
Rising geopolitical tensions in the Middle East, which could exert pressure on the shilling through higher global oil prices and increased uncertainty in international markets. Given that Kenya is a net importer of petroleum products, any sustained increase in oil prices would widen the import bill, increase demand for US Dollars, and consequently put depreciation pressure on the shilling
Kenya's forex reserves decreased by 1.1% during the week to USD 15.1bn, from USD 15.3 bn recorded the previous week, equivalent to 6.1 months of import cover, and above the statutory requirement of maintaining at least 4.0-months of import cover. The chart below summarizes the evolution of Kenya's months of import cover over from September 2024 to September 2026:
Weekly Highlights
-
Fuel Prices effective 15th September 2026 to 14thOctober 2026
During the week, the Energy and Petroleum Regulatory Authority (EPRA) released its monthly statement on the maximum retail fuel prices in Kenya, effective from 15th September 2026 to 14th October 2026. Notably, the maximum allowed prices for Diesel, Super Petrol and Kerosene remained unchanged at Kshs 217.9, Kshs 214.0, and Kshs 191.4 per litre, respectively set in August, despite divergent movements in landed costs across the three products.
Other key take-outs from the performance include;
-
The average landed cost per cubic metre of Super Petrol decreased by 7.9% to USD 874.3 in August 2026 from USD 948.9 in July 2026, while the landed costs of Diesel and Kerosene increased by 11.9% and 9.7% to USD 957.1 and USD 1,003.9, respectively, from USD 855.6 and USD 915.0 in July 2026.
-
The Kenyan Shilling appreciated marginally by 1.5 bps against the US Dollar to Kshs 129.72 in August 2026 from Kshs 129.74 in July 2026.
-
The Authority's calculations incorporated Value Added Tax and other applicable taxes and levies, with the price stabilization mechanism offsetting Kshs 1.3 per litre on Super Petrol and Kshs 5.8 per litre on Diesel, while providing a Kshs 13.1 per litre drawdown on Kerosene, cushioning consumers from the divergent cost pressures across the three products.
-
International petroleum prices increased across all three products in August 2026. The prices of Super Petrol, Diesel and Kerosene increased by 8.0%, 9.7% and 6.4% to USD 1,115.3, USD 1,103.9 and USD 1,131.2 per cubic metre, respectively, from USD 1,032.8, USD 1,006.6 and USD 1,063.7 in July 2026.
Going forward, the outlook for fuel prices remains mixed. While the decline in Super Petrol's landed cost offers some relief on that front, the sustained rise in Diesel and Kerosene landed costs presents an upside risk to pump prices in subsequent review cycles, particularly given Diesel's importance as an input in transportation, manufacturing, agriculture and logistics. The marginal appreciation of the Shilling provided modest cushioning against imported inflation this cycle, although continued strength in international petroleum prices could pressure the import bill and, by extension, the exchange rate. Consequently, the fuel price stabilization mechanism will remain a key lever in absorbing global oil price volatility, while developments in international petroleum prices and the exchange rate will continue to be the primary determinants of the domestic fuel price and inflation outlook
- Exchequer Highlight August 2026
The National Treasury gazetted the revenue and net expenditures for the second month of FY’2026/2027, ending 31st August 2026, highlighting that the total revenue collected as at the end of August 2026 amounted to Kshs 413.2 bn, equivalent to 13.8 % of the original estimates of Kshs 2,985.7 bn for FY’2026/2027 and is 83.0% of the prorated estimates of Kshs 497.6 bn. Below is a summary of the performance:
|
FY'2026/2027 Budget Outturn - As at 31st August 2026 |
|||||
|
Amounts in Kshs billions unless stated otherwise |
|||||
|
Item |
12-months Original Estimates |
Actual Receipts/Release |
Percentage Achieved |
Prorated |
% achieved of the Prorated |
|
Opening Balance |
|
29.2 |
|
|
|
|
Tax Revenue |
2,858.7 |
373.5 |
13.1% |
476.4 |
78.4% |
|
Non-Tax Revenue |
127.1 |
10.5 |
8.2% |
21.2 |
49.4% |
|
Total Revenue |
2,985.7 |
413.2 |
13.8% |
497.6 |
83.0% |
|
External Loans & Grants |
612.3 |
3.9 |
0.6% |
102.1 |
3.9% |
|
Domestic Borrowings |
1,568.1 |
463.8 |
29.6% |
261.4 |
177.5% |
|
Other Domestic Financing |
11.3 |
1.3 |
11.1% |
1.9 |
66.8% |
|
Total Financing |
2,191.7 |
469.0 |
21.4% |
365.3 |
128.4% |
|
Recurrent Exchequer issues |
1,713.6 |
284.0 |
16.6% |
285.6 |
99.4% |
|
CFS Exchequer Issues |
2,563.0 |
396.7 |
15.5% |
427.2 |
92.9% |
|
Development Expenditure & Net Lending |
473.0 |
44.3 |
9.4% |
78.8 |
56.2% |
|
County Governments + Contingencies |
428.0 |
55.6 |
13.0% |
71.3 |
78.0% |
|
Total Expenditure |
5,177.5 |
780.6 |
15.1% |
862.9 |
90.5% |
|
Fiscal Deficit excluding Grants |
2,191.7 |
367.4 |
16.8% |
365.3 |
100.6% |
|
Total Borrowing |
2,180.5 |
467.8 |
21.5% |
363.4 |
128.7% |
The key take-outs from the release include;
- Total revenue collected as at the end of August 2026 amounted to Kshs 413.2 bn, equivalent to 13.8% of the original estimates of Kshs 2,985.7 bn for FY’2026/2027 and is 83.0% of the prorated estimates of Kshs 497.6 bn. Cumulatively, tax revenues amounted to Kshs 373.5 bn, equivalent to 13.1% of the original estimates of Kshs 2,858.7 bn and 78.4% of the prorated estimates of Kshs 476.4 bn,
- Total financing amounted to Kshs 469.0 bn, equivalent to 21.4% of the original estimates of Kshs 2,191.7 bn and is equivalent to 128.4% of the prorated estimates of Kshs 365.3 bn. Additionally, domestic borrowing amounted to Kshs 463.8 bn, equivalent to 29.6% of the original estimates of Kshs 1,568.1 bn and is 177.5% of the prorated estimates of Kshs 261.4 bn.
- The total expenditure amounted to Kshs 780.6 bn, equivalent to 15.1% of the original estimates of Kshs 5,177.5 bn, and is 90.5% of the prorated target expenditure estimates of Kshs 862.9 bn. Additionally, the net disbursements to recurrent expenditures came in at Kshs 284.0 bn, equivalent to 16.6%% of the original estimates of Kshs 1,713.6 bn and are equivalent to 99.4% of the prorated estimates of Kshs 285.6 bn,
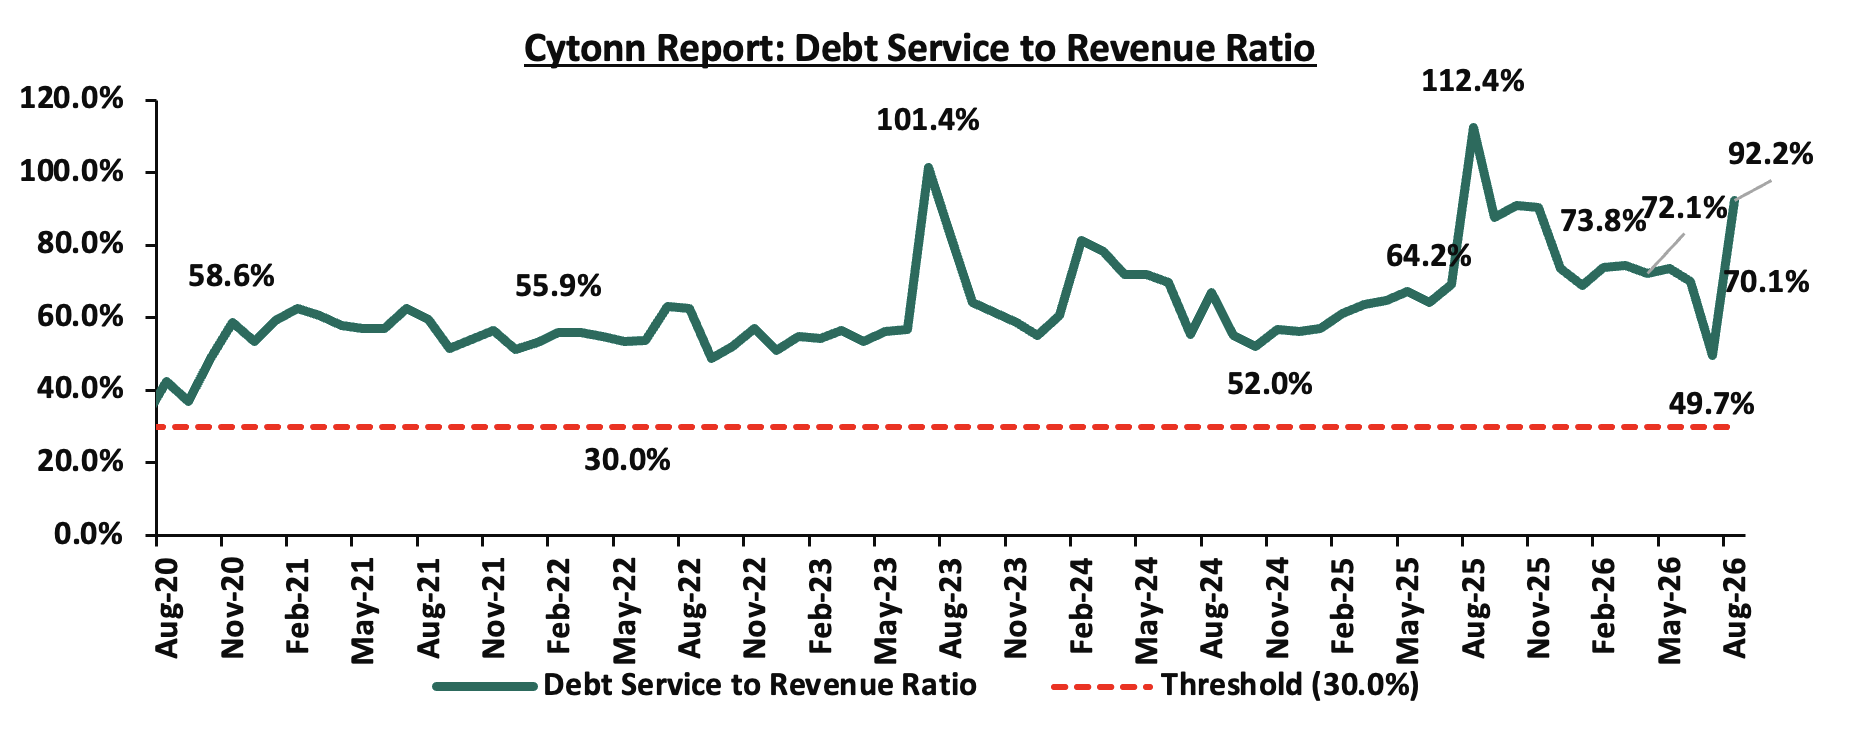
- Consolidated Fund Services (CFS) Exchequer issues came in at Kshs 396.7 bn, equivalent to 15.5% of the original estimates of Kshs 2,563.0 bn, and are 92.9% of the prorated amount of Kshs 427.2 bn. The cumulative public debt servicing cost amounted to Kshs 380.8 bn which is 16.4% of the original estimates of Kshs 2,315.9 bn and is 98.7% of the prorated estimates of Kshs 386.0 bn. Additionally, the Kshs 380.8 bn debt servicing cost is equivalent to 92.2% of the actual cumulative revenues collected as at the end of August 2026. The chart below shows the debt servicing cost to revenue ratio over the period;
- Total borrowings as at the end of August 2026 amounted to Kshs 467.8 bn, equivalent to 21.5% of the original estimates of Kshs 2,180.5 bn for FY’2026/2027 and are 128.7% of the prorated estimates of Kshs 363.4 bn. The cumulative Domestic Borrowing of KShs. 1,568.1 comprises of Net Domestic Borrowing KShs. 919.4 and Internal Debt Redemptions (Roll-overs) KShs. 648.8.
The government underachieved its prorated revenue targets for the second month of the FY’2026/2027, achieving 83.0% of the prorated revenue targets in August 2026, lower than 92.1% achieved in July 2026. This was driven by shortfall in tax revenues and non-tax revenues, which stood at 78.4% and 49.4% of prorated levels respectively, with collections amounting to Kshs 373.5 bn in tax revenue and Kshs 10.5 bn in non-tax revenue. External loans and grants were significantly behind target at 3.9%, increasing reliance on domestic borrowing, which came in at 177.5% of the prorated target of Kshs 261.4 bn. Expenditure absorption stood at 90.5% of prorated levels, with development spending still lagging at 56.2%, reflecting slow implementation of capital projects. Future revenue performance will depend on how quickly private sector activity strengthens,, easing credit conditions following the decision to maintain the Central Bank Rate at 8.75% in August 2026, and continued efforts to broaden the tax base, curb evasion, and stimulate economic growth. However, the outlook remains vulnerable to external shocks, with inflation still elevated at 6.6% and Iranian threats to disrupt oil supplies continuing to pose upside risks to inflation and production costs, potentially constraining private sector expansion and revenue mobilization.
Rates in the fixed income market have declined MTD, reversing the recent upward trend. The decline comes despite the CBK's decision to pause its rate-cutting cycle at 8.75%, with inflation remaining elevated at 6.6% but within the CBK's target range of 2.5%-7.5%. The government is 257.2% ahead of its prorated net domestic borrowing target of Kshs 207.1 bn, having a net borrowing position of Kshs 532.7mn (inclusive of T-bills). We expect investors to maintain a preference for short to medium-term papers as they monitor the pace of government issuance and the path of inflation before committing further out on the curve, with the yield curve likely to remain under upward pressure rather than stabilize, at least until the inflation trajectory becomes clearer.
Market Performance:
During the week, the equities market was on a downward trajectory, with NSE 20, NSE 25, NSE 10 and NASI declining by 4.1%, 3.4%, 3.3% and 2.5% respectively taking the YTD performance to gains of 32.8%, 32.6%, 31.3% and 27.4% respectively for NSE 10, NSE 20, NSE 25 and NASI respectively. The week-on-week equities market performance was mainly driven by losses recorded by large cap stocks such as KCB, Absa Bank, and Cooperative bank of 7.4%, 7.2% and 6.3% respectively. However, the performance was supported by gains recorded by large cap stocks such as Safaricom of 0.3%;
During the week, the banking sector index decreased by 4.5% to 276.7 from the 289.7 recorded the previous week. This is attributable to losses recorded by large cap stocks such as KCB, Absa Bank and Cooperative bank of 7.4%, 7.2% and 6.3% respectively.
During the week, equities turnover increased by 41.2% to USD 72.3 mn from USD 51.2mn recorded the previous week, taking the YTD total turnover to USD 2,999.8 mn. Foreign investors remained net sellers for the tenth consecutive week with a net selling position of USD 19.0 mn, from a net selling position of USD 1.0 mn recorded the previous week, taking the YTD foreign net selling position to USD 167.9 mn, compared to a net selling position of USD 92.9 mn recorded in 2025.
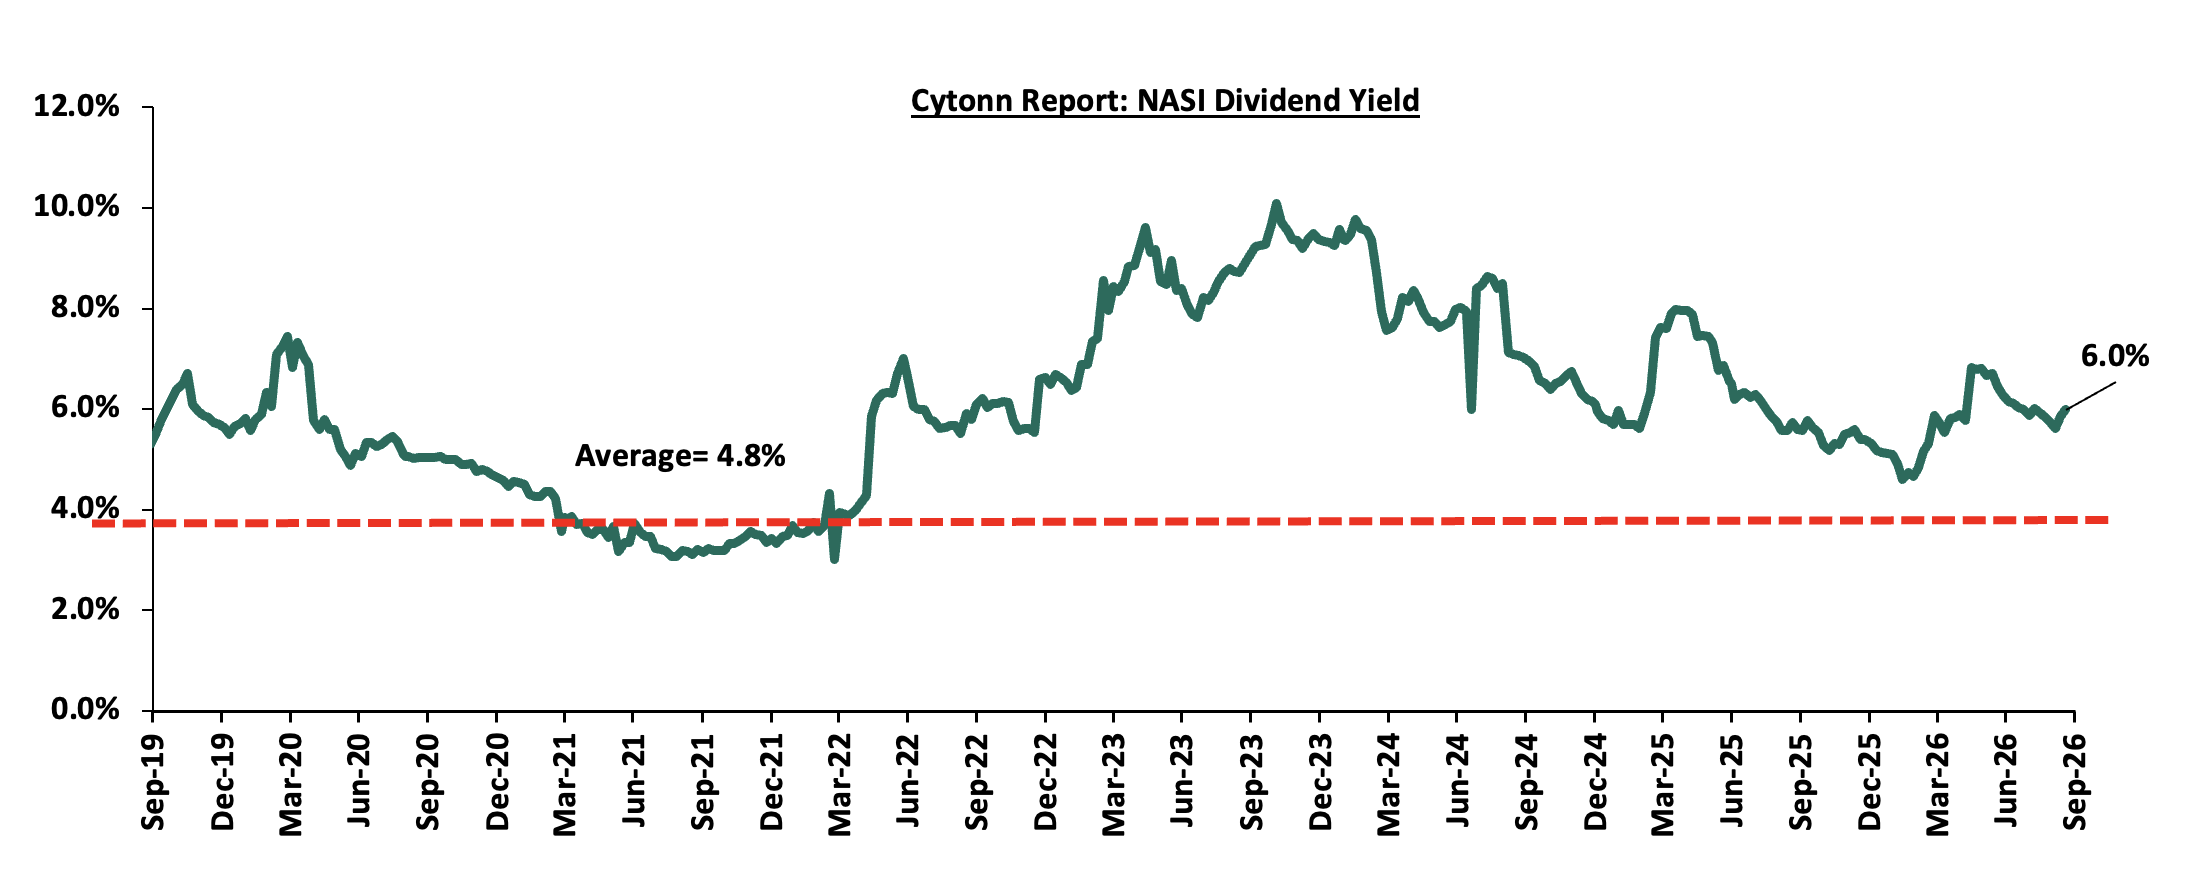
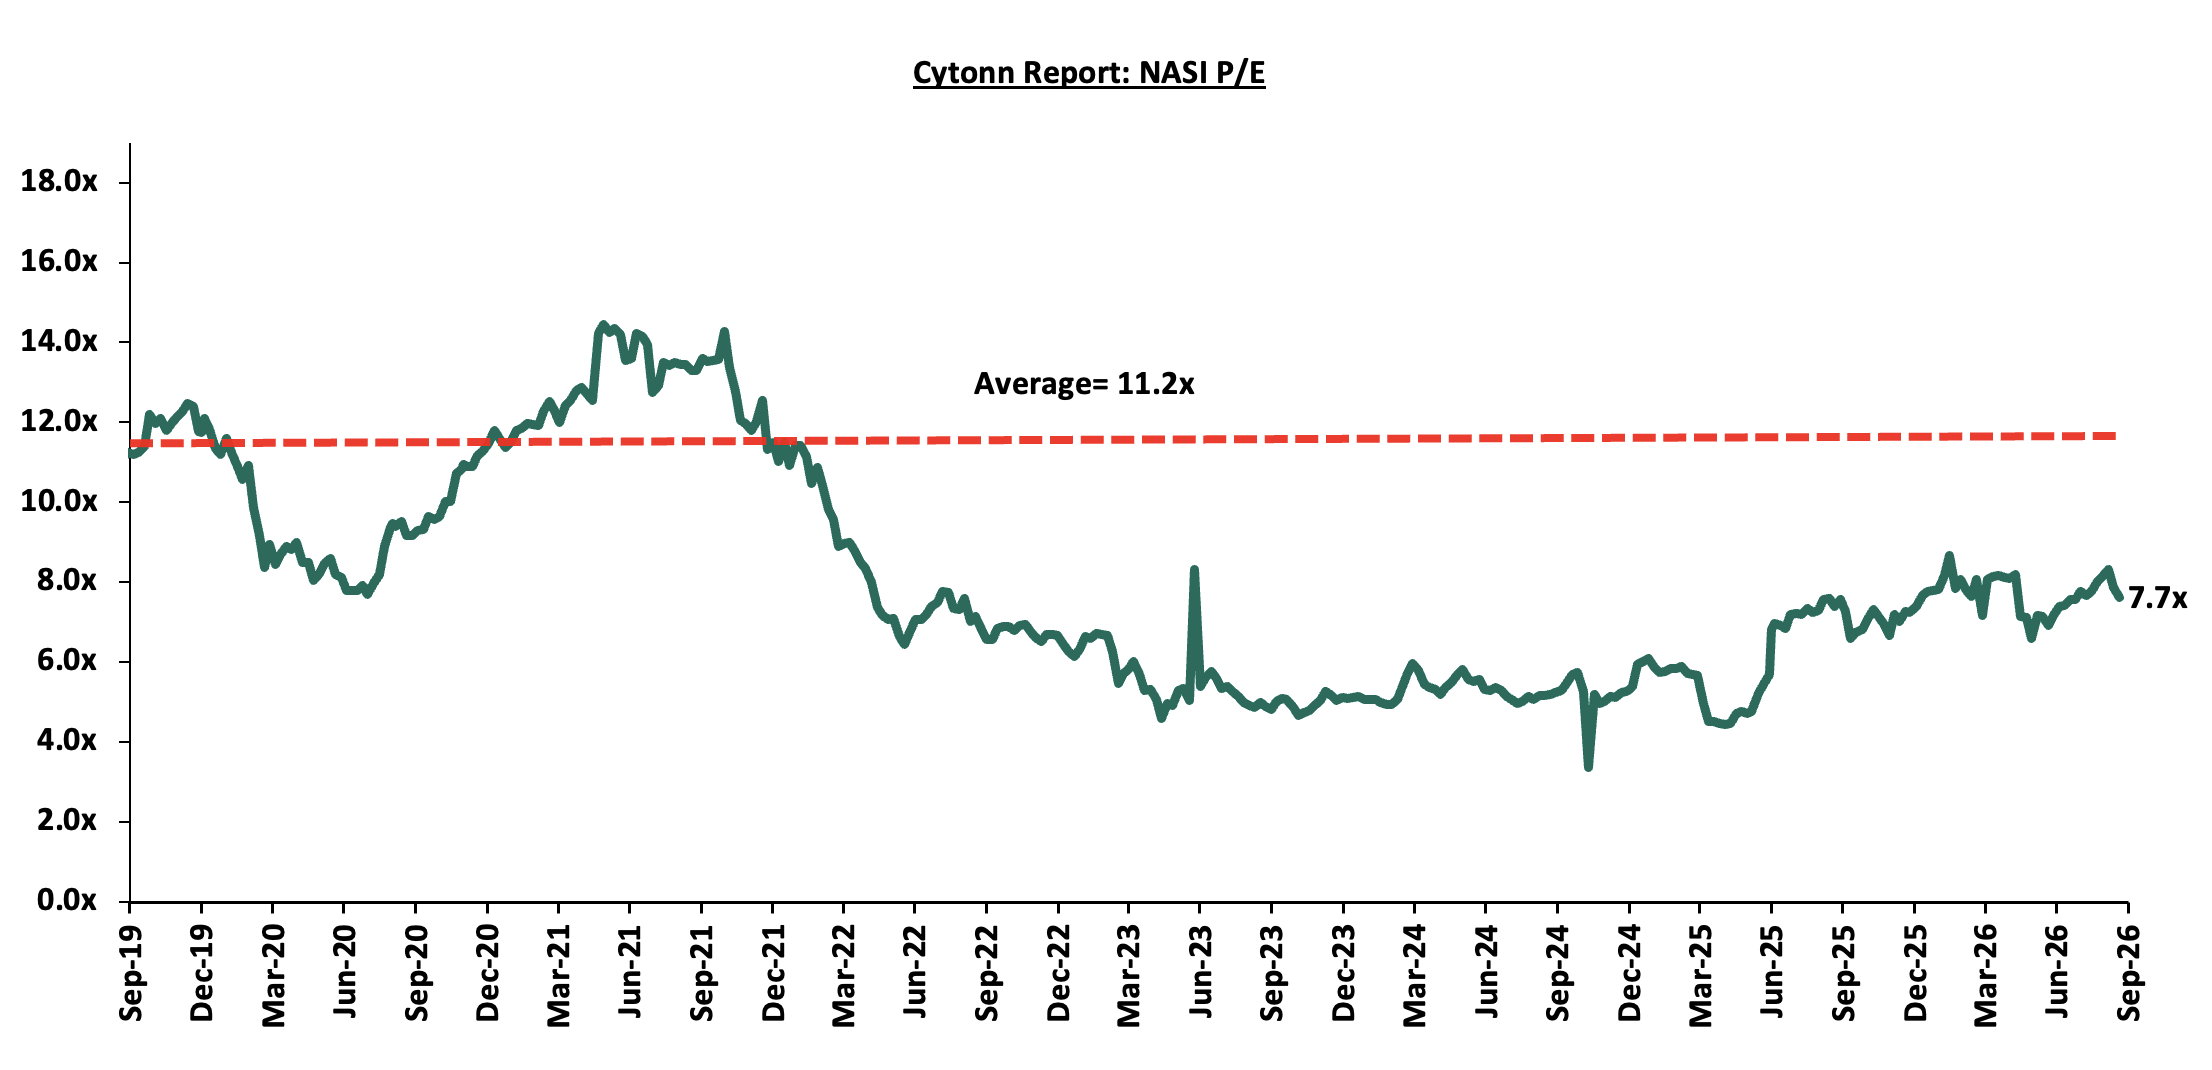
The market is currently trading at a price to earnings ratio (P/E) of 7.7x, 30.9% below the historical average of 11.2x, and a dividend yield of 6.0%, 1.3% points above the historical average of 4.8%. Key to note, NASI’s PEG ratio currently stands at 1.0x, an indication that the market is fairly valued relative to its future growth. A PEG ratio greater than 1.0x indicates the market may be overvalued while a PEG ratio less than 1.0x indicates that the market is undervalued.
The charts below indicate the historical P/E and dividend yields of the market:
Universe of Coverage:
|
Cytonn Report: Equities Universe of Coverage |
|||||||||||
|
Company |
Price as at 11/09/2026 |
Price as at 18/09/2026 |
w/w change |
m/m change |
YTD Change |
Year Open 2026 |
Target Price* |
Dividend Yield |
Upside/ Downside** |
P/TBv Multiple |
Recommendation |
|
Co-op Bank |
37.2 |
34.8 |
(6.3%) |
(5.8%) |
45.6% |
23.9 |
46.1 |
7.2% |
39.7% |
1.3x |
Buy |
|
NCBA |
90.3 |
86.3 |
(4.4%) |
(3.4%) |
1.5% |
85.0 |
108.9 |
8.2% |
34.5% |
1.2x |
Buy |
|
KCB Group |
94.0 |
87.0 |
(7.4%) |
(7.4%) |
32.3% |
65.8 |
104.4 |
8.0% |
28.0% |
0.9x |
Buy |
|
Family Bank |
28.9 |
28.0 |
(3.1%) |
(11.1%) |
55.3% |
18.0 |
34.0 |
4.3% |
25.9% |
1.5x |
Buy |
|
ABSA Bank |
33.5 |
31.1 |
(7.2%) |
(9.9%) |
25.2% |
24.9 |
36.8 |
6.6% |
25.1% |
1.7x |
Buy |
|
Equity Group |
102.0 |
98.5 |
(3.4%) |
4.8% |
47.0% |
67.0 |
108.8 |
5.8% |
16.3% |
1.3x |
Accumulate |
|
Stanbic Holdings |
282.3 |
278.0 |
(1.5%) |
(0.9%) |
40.6% |
197.8 |
300.3 |
8.0% |
16.1% |
1.6x |
Accumulate |
|
Standard Chartered Bank |
341.5 |
330.8 |
(3.1%) |
(0.4%) |
10.3% |
299.8 |
345.8 |
9.4% |
13.9% |
2.0x |
Accumulate |
|
Diamond Trust Bank |
185.3 |
179.5 |
(3.1%) |
(7.9%) |
56.4% |
114.8 |
190.2 |
5.0% |
11.0% |
0.5x |
Accumulate |
|
Jubilee Holdings |
412.8 |
400.3 |
(3.0%) |
(2.3%) |
24.1% |
322.5 |
420.5 |
3.7% |
8.8% |
0.6x |
Hold |
|
CIC Group |
4.6 |
4.7 |
2.4% |
(2.1%) |
3.3% |
4.5 |
5.0 |
2.8% |
8.5% |
1.2x |
Hold |
|
I&M Group |
79.3 |
80.3 |
1.3% |
0.9% |
87.5% |
42.8 |
81.1 |
4.7% |
5.7% |
1.3x |
Hold |
|
Britam |
20.9 |
17.5 |
(16.3%) |
(5.4%) |
93.2% |
9.1 |
18.5 |
0.0% |
5.4% |
1.3x |
Hold |
|
*Target Price as per Cytonn Analyst estimates **Upside/ (Downside) is adjusted for Dividend Yield ***Dividend Yield is calculated using FY’2025 Dividends |
|||||||||||
Weekly highlights
Kenya Power & Lighting Company Plc (KPLC) FY’2026 Financial Performance
Executive Summary
During the week, Kenya Power & Lighting Company Plc (KPLC) released its FY’2026 audited financial results, recording a 2.1% increase in profitability to Kshs 25.0 bn, up from Kshs 24.5 bn in FY’2025. The performance was mainly attributable to a 14.7% increase in gross profit to Kshs 85.6 bn, up from Kshs 74.6 bn in FY’2025, coupled with a 34.7% decrease in finance costs to Kshs 3.1 bn from the Kshs 4.7 bn in FY’2025. The performance was however weighed down by the 5.5% increase in cost of sales to Kshs 152.6 bn from Kshs 144.7 bn recorded in FY’2025, and a 15.5% decrease in interest income to Kshs 0.5 bn from Kshs 0.6 bn in FY’2025.
The tables below summarize the company’s financial performance:
|
Cytonn Report: Kenya Power and Lighting Company (KPLC) Summarized Income Statement |
|||
|
Income Statement |
FY'2025 |
FY'2026 |
Y/Y Change |
|
Kshs (bn) |
Kshs (bn) |
||
|
Revenue from contracts with customers |
219.3 |
238.2 |
8.6% |
|
Cost of Sales |
(144.7) |
(152.6) |
5.5% |
|
Gross Profit |
74.6 |
85.6 |
14.7% |
|
Other Income |
7.3 |
6.7 |
(7.5%) |
|
Operating Costs |
(42.4) |
(53.8) |
26.7% |
|
Operating Profit |
39.5 |
38.6 |
(2.3%) |
|
Interest income |
0.6 |
0.5 |
(15.5%) |
|
Finance Costs |
(4.7) |
(3.1) |
(34.7%) |
|
Profit Before Income Tax |
35.4 |
36.0 |
1.8% |
|
Income Tax Expenses |
(10.9) |
(11.0) |
1.1% |
|
Profit After Tax |
24.5 |
25.0 |
2.1% |
|
Earnings Per Share |
12.5 |
12.8 |
2.1% |
|
Dividend Per share |
1.0 |
1.5 |
50.0% |
|
Dividend Yield |
8.7% |
6.6% |
(2.1%) |
|
Dividend Payout Ratio |
8.0% |
11.7% |
3.7% |
Source: Kenya Power and Lighting Company (KPLC) FY’2026 financial statements
|
Cytonn Report: Kenya Power and Lighting Company (KPLC) Summarized Balance sheet |
|||
|
Balance Sheet |
FY'2025 |
FY'2026 |
Y/Y Change |
|
Kshs (bn) |
Kshs (bn) |
||
|
Property and equipment |
287.5 |
295.5 |
2.8% |
|
Current Assets |
98.2 |
121.9 |
24.1% |
|
Other Non-Current Assets |
3.3 |
4.0 |
20.6% |
|
Total Assets |
389.0 |
421.5 |
8.3% |
|
Current Liabilities |
117.4 |
120.0 |
2.2% |
|
Non-Current Liabilities |
162.3 |
169.7 |
4.6% |
|
Total Liabilities |
279.7 |
289.7 |
3.6% |
|
Total Equity |
109.3 |
131.8 |
20.5% |
|
Total Equity and liabilities |
389.0 |
421.5 |
8.3% |
Source: Kenya Power and Lighting Company (KPLC) FY’2026 financial statements
Key take outs from the financial performance include;
-
Revenue from contracts with customers rose by 8.6% to Kshs 238.2 bn in FY’2026, from Kshs 219.3 bn in FY’2025, mainly attributable to higher electricity sales.
-
Operating expenses rose by 26.7% to Kshs 53.8 bn, from Kshs 42.4 bn in FY’2025, mainly attributed to higher provisions for expected credit losses following growth in customer debt levels, increased depreciation arising from the capitalization of completed network projects, and staff-related cost movements.
-
Finance costs decreased by 34.7% to Kshs 3.1 bn in FY’2026, from Kshs 4.7 bn in FY’2025, mainly driven by lower interest expenses following scheduled loan repayments and reduced debt levels.
-
The company’s balance sheet continued to improve with total assets increasing by 8.3% to Kshs 421.5 bn in FY’2026 from Kshs 389.0 bn registered in FY’2025 mainly attributable to the 24.1% increase in current assets to Kshs 121.9 bn from Kshs 98.2 bn in FY’2025. Total liabilities increased by 3.6% to Kshs 289.7bn form Kshs 279.7 bn recorded in FY’2025
-
The Board of Directors recommended a final dividend of Kshs 1.2 per share for the year ended 30th June 2026, bringing the total dividend for FY'2026 to Kshs 1.5 per share, inclusive of the Kshs 0.3 interim dividend already paid during the year. This translates to a dividend yield of 6.6% and a dividend payout ratio of 11.7%, up from 8.0% in FY'2025, when the Board had recommended a final dividend of Kshs 0.8 per share in addition to the Kshs 0.2 interim dividend paid that year.
KPLC has maintained a resilient financial performance, through a stronger balance sheet. The continued growth in electricity sales, supported by rising demand, improving distribution efficiency, combined with lower finance cost, lay out a solid foundation for improved profitability, enhanced service delivery, and financial sustainability into the future. Going forward, Kenya Power aims to safeguard supply adequacy as demand grows and accelerate their loss reduction programme. They are also advancing their grid modernization and digitization projects to improve service reliability and efficiency, enhance customer experience, and support sustainable growth.
We maintain a “cautiously optimistic” short-term outlook supported primarily earnings-led attractive valuations, despite heightened geopolitical risks such as Iran war that may weigh on investor sentiment, and, “neutral” in the long term as persistent foreign investor outflows continue to constrain market liquidity and limit broad-based market re-rating. With the market currently trading at a discount to its future growth (PEG Ratio at 1.0x), where performance will be driven by company-specific fundamentals rather than general market direction, we believe that investors should reposition towards value stocks exhibiting strong earnings growth, attractive dividend yields, solid balance sheets, sustainable competitive advantages and trading at compelling discounts to their intrinsic value. While foreign investor sell-offs are expected to continue exerting pressure in the near term, we believe this will create selective entry opportunities for long-term investors
-
Hospitality Sector
During the week, attention was drawn to the shortfall in Kenya’s tourism levy collections, highlighting the challenges faced by authorities in regulating the country’s growing short-term rental market. The Tourism Fund collected Kshs 5.6 bn in the 2025/26 financial year, against a target of Kshs 6.7 bn, resulting in a shortfall of about Kshs 1.0 bn. The underperformance was partly attributed to difficulties in capturing revenue from Airbnb units, homestays and villas, which are more difficult to identify and regulate than conventional hotels.
To address the challenge, the Tourism Fund has proposed greater use of digital platforms and booking transactions in collecting the levy. Under the proposed system, the levy could be deducted when a guest makes a booking and remitted directly to the authorities. This would reduce reliance on physical inspections while helping authorities identify short-term rental operators and improve compliance across the growing accommodation sector.
The increased regulation of short-term rentals could have a notable effect on Kenya’s Real Estate sector particularly by influencing property demand, rental income and investment returns. The popularity of platforms such as Airbnb has encouraged some property owners and investors to convert residential units into short-term accommodation, creating an alternative source of rental income and supporting demand for properties in tourist and business centers. However, additional levies and compliance requirements could increase operating costs for property owners and influence the returns from short-term rental investments.
-
Real Estate Investments Trusts
-
REITs Weekly Performance
On the Unquoted Securities Platform Acorn D-REIT and I-REIT traded at Kshs 29.7 and Kshs 24.4 per unit, respectively, as per the last updated data on 11th September 2026. The performance represented a 48.5% and 22.0% gain for the D-REIT and I-REIT, respectively, from the Kshs 20.0 inception price. The volumes traded for the D-REIT and I-REIT came in at 13.7 mn and 46.0 mn shares, respectively. Additionally, ILAM Fahari I-REIT traded at Kshs 20.5 per share as of 11th September 2026, representing a 2.5% gain from the Kshs 20.0 inception price, the volume traded came in at 1.2 mn shares. REITs offer various benefits, such as tax exemptions, diversified portfolios, and stable long-term profits. However, the ongoing decline in the performance of Kenyan REITs and the restructuring of their business portfolios are hindering significant previous investments. Additional general challenges include:
-
Insufficient understanding of the investment instrument among investors leading to a slower uptake of REIT products,
-
Lengthy approval processes for REIT creation,
-
High minimum capital requirements of Kshs 100.0 mn for REIT trustees compared to Kshs 10.0 mn for pension funds Trustees, essentially limiting the licensed REIT Trustee to banks only
-
The rigidity of choice between either a D-REIT or and I-REIT forces managers to form two REITs, rather than having one Hybrid REIT that can allocate between development and income earning properties
-
Limiting the type of legal entity that can form a REIT to only a trust company, as opposed to allowing other entities such as partnerships, and companies,
-
We need to give time before REITS are required to list – they would be allowed to stay private for a few years before the requirement to list given that not all companies maybe comfortable with listing on day one, and,
-
Minimum subscription amounts or offer parcels set at Kshs 0.1 mn for D-REITs and Kshs 5.0 mn for restricted I-REITs. The significant capital requirements still make REITs relatively inaccessible to smaller retail investors compared to other investment vehicles like unit trusts or government bonds, all of which continue to limit the performance of Kenyan REITs.
We expect the performance of Kenya’s Real Estate sector to remain resilient however, shortfall in Kenya’s tourism levy collections, weak investor appetite for listed REITs such as ILAM Fahari I-REIT, oversupply in select Real Estate segments, and high capital requirements will continue to constrain the sector’s optimal performance
Digital Payments Weekly Highlights
-
Visa Research Highlights the Rise of the Couch Economy and Home-Centered Consumption
During the week, Visa Inc. released new research from Visa Business and Economic Insights (VBEI) examining the couch economy, which reveals that consumers are increasingly shopping, streaming, dining, and managing everyday activities from home, driving domestic digital commerce volumes up to 58.0% in the U.S. (from 48.0% in 2019) and driving streaming subscriptions onto a larger share of cards than traditional cinema and concert spending across all markets studied; This structural shift toward convenience reflects changing consumer expectations where digital channels, subscription models, and delivery platforms dominate everyday spending habits. The expansion of home-centered consumption provides new avenues for merchants and financial institutions to capture recurring customer relationships, particularly as services like food delivery transition from early adopters to mainstream consumer staples.
-
Mastercard Partners with Alchemy to Introduce Agentic Payments for AI Shopping Assistants
During the week, Mastercard announced a partnership with startup Alchemy to roll out an agentic payment option equipped with one-time-use virtual card credentials and stablecoin wallets, allowing AI agents to independently discover, compare, and purchase goods on behalf of users within set parameters; This capability addresses the evolving need to adapt traditional risk rules and anti-fraud frameworks to safely permit bots to transact online, marking a significant departure from legacy risk models built solely to block unauthorized automated traffic. While this innovation promises to streamline e-commerce and checkout experiences by letting users authorize agents ahead of time, it also brings industry-wide scrutiny regarding security safeguards, risk management standards, and the broader implications of autonomous agent capabilities across the financial ecosystem.
-
Block Introduces Macro Sensitivity Tool for Cash App Borrow Backed by Cash App Score
During the week, Block released an illustrative macro sensitivity tool for Cash App Borrow that models how its lending portfolio and risk loss profiles respond to shifting economic scenarios, underpinned by the proprietary Cash App Score which evaluates everyday platform activity to approve 38.0% more customers at equivalent loss rates compared to traditional credit scores; This macro tool provides transparency into how alternative data models dynamically adjust as macroeconomic conditions constrict and customer risk distributions shift toward higher-risk bands. By offering a clear window into potential origination changes and risk management responses, Block demonstrates the resilience and scalability of its alternative credit infrastructure for underserved or credit-invisible segments, where roughly 70.0% of active Borrow customers hold FICO scores below 580.
-
PayPal Debit Card Earns Best in Class Honors in Javelin’s 2026 GPR Card Scorecard
During the week, the PayPal Debit Card secured Best in Class recognition in Javelin Strategy & Research’s 2026 General-Purpose Reloadable (GPR) Card Scorecard, while Cash App Card and Wisely Direct were named Overall Leaders; The scorecard underscores how peer-to-peer (P2P) linked cards are leading market momentum by successfully pairing low costs and broad acceptance with added benefits and consumer rewards. This evolution highlights a broader market trend where digital wallets are deeply embedding prepaid functionality into consumers' everyday financial lives, turning stored balances into practical, low-cost tools for daily spending.
-
Digital Payments Stock Performance
The table below presents a snapshot of NYSE-listed digital payments stocks, covering Visa, Mastercard, American Express (AXP), Wise Plc, Block and PayPal:
|
Cytonn Report: Digital Payments NYSE and LSE Stock Perfomance |
|
|||||
|
Company |
Year Open 2026 |
Price 9/11/2026 |
Price 9/18/2026 |
w/w change |
YTD change |
Forward P/E |
|
American Express |
372.7 |
324.7 |
311.6 |
(4.0%) |
(16.4%) |
15.5x |
|
Visa |
346.5 |
370.5 |
368.3 |
(0.6%) |
6.3% |
24.6x |
|
Mastercard |
563.1 |
569.2 |
565.2 |
(0.7%) |
0.4% |
24.5x |
|
Circle |
83.5 |
90.6 |
91.8 |
1.3% |
10.0% |
69.0x |
|
Block |
65.2 |
79.2 |
76.3 |
(3.7%) |
17.1% |
14.8x |
|
Paypal Holdings |
58.1 |
53.7 |
52.4 |
(2.4%) |
(9.9%) |
9.1x |
|
Global Payments Inc |
77.0 |
88.3 |
85.1 |
(3.7%) |
10.4% |
5.3x |
|
Average |
|
|
|
|
|
23.3x |
Source: Visa, AXP, Circle, Mastercard, Block and PayPal financials, NYSE, PE* calculated using FY’2025 audited financials
The stocks are currently trading at an average forward P/E multiple of 23.3x, indicating that investors are pricing in strong future earnings growth and are prepared to pay a substantial premium for current earnings. This also suggests that valuations may be stretched relative to near-term fundamentals.
We expect the global digital payments sector to continue evolving toward greater payment sovereignty, digital infrastructure modernization, and reduced reliance on traditional card-based payment networks as governments and financial institutions increasingly prioritize control over domestic payment ecosystems. Recent developments, particularly the European Central Bank’s progress toward launching the Digital Euro, signal a growing global shift toward central bank-backed digital payment infrastructure aimed at enhancing financial resilience, improving transaction efficiency, and strengthening monetary independence in an increasingly digital economy. This trend is likely to accelerate competition between public-sector digital currencies and established private payment networks such as Visa Inc. and Mastercard Incorporated, while driving broader innovation across digital finance infrastructure. However, despite these favorable long-term structural tailwinds, valuations within the sector remain relatively elevated, with the companies under coverage currently trading at an average forward P/E of 23.3x, suggesting that a significant portion of future growth expectations may already be priced in. As such, we expect near-term performance to remain sensitive to regulatory developments, execution risk, and the pace at which both incumbents and emerging digital payment infrastructure providers adapt to the rapidly changing payments landscape.
Following the release of the H1’2026 results by Kenyan listed banks, the Cytonn Financial Services Research Team undertook an analysis on the financial performance of the listed banks and identified the key factors that shaped the performance of the sector. For the earnings notes of the various banks, click the links below:
The core earnings per share (EPS) for the listed banks recorded a weighted growth of 16.3% in H1’2026, compared to a weighted growth of 8.4% recorded in H1’2025, an indication of an improved performance mainly on the back of a 14.6% growth in non-funded income in H1’2026, compared to a decline of 5.8% in H1’2025. The improvement reflects growth across key NFI components, notably fees and commissions on loans in an easing interest rate environment following stable CBK rates, highlighting banks’ reduced reliance on interest income. Notably, the inflation rate in H1’2026 averaged 5.3%, 1.6% points higher than the 3.7% average in H1’2025, with the Kenyan Shilling remained stable against the US Dollar in H1’2026, with the average exchange rate remaining relatively unchanged at Kshs 129.3 recorded in H1’2025. Similarly, credit risk decreased with the asset quality of listed banks improving slightly in H1’2026 with the weighted average Gross Non-Performing Loan ratio (NPL) decreasing by 2.7% points to 11.1%, from 13.8% recorded in H1’2025. The NPL performance was 0.4% points below the ten-year average of 11.5%.
The report is themed “Digital Momentum and Improving Asset Quality” where we assess the key factors that influenced the performance of the banking sector in H1’2026, the key trends, the challenges banks faced, and areas that will be crucial for growth and stability of the banking sector going forward. As such, we shall address the following:
-
Key Themes that Shaped the Banking Sector Performance in H1’2026,
-
Summary of the Performance of the Listed Banking Sector in H1’2026,
-
The Focus Areas of the Banking Sector Players Going Forward, and,
-
Brief Summary and Ranking of the Listed Banks based on the outcome of our analysis
Section I: Key Themes That Shaped the Banking Sector Performance in H1’2026
In this section, we will highlight the main factors influencing the banking sector in H1’2026. These include regulation, digitization, interest rates, regional expansion through mergers and acquisitions, and asset quality:
-
Regulation:
-
Review of Banking Fees: The Central Bank of Kenya (CBK) introduced the Banking (Fees) Regulations, 2026, through Legal Notice No. 81 of 2026, on 8th May 2026, replacing the Banking (Fees) Regulations of 1994. The new framework represents a shift from the previous branch-based fee structure to a revenue-based model, with the annual fee for institutions licensed under the Banking Act calculated as a percentage of gross annual revenue. Under the new framework, the annual fee is set at 0.13% of gross annual revenue in 2026, increasing to 0.14% in 2027 and 0.15% from 2028 onwards. Gross annual revenue includes income from loans and advances, government securities and placements, fees and commissions on loans and advances, dividend income, foreign-exchange trading income and other income. Newly licensed institutions are required to pay the annual fee based on their average projected gross annual revenue for their first three years of operation, while an institution applying for a banking licence is required to pay a Kshs 5,000.0 application fee. The review is significant given that the previous framework had remained in place since 1994 and was largely based on fixed fees linked to factors such as the number of branches. The revised revenue-based approach seeks to better align supervisory fees with the size, complexity and risk profile of individual institutions, as well as the resources required for effective domestic and cross-border supervision. The review also recognises the transformation of the banking sector, including the increasing use of digital and alternative distribution channels. CBK's Regulatory Impact Assessment noted that banking-sector assets had increased from Kshs 202.0 bn in 1994 to Kshs 8.4 tn by December 2025, underscoring the need to modernise the fee framework.
-
Strengthening of Financial Consumer Protection: During H1’2026, Kenya advanced efforts to establish a harmonised financial consumer protection framework across the financial sector. In April 2026, the Consumer Protection Framework Technical Working Group, comprising the Central Bank of Kenya (CBK), Capital Markets Authority (CMA), Insurance Regulatory Authority (IRA), Retirement Benefits Authority (RBA), Sacco Societies Regulatory Authority (SASRA), Communications Authority of Kenya (CA), Competition Authority of Kenya (CAK), and the National Treasury, invited public comments on the draft Financial Consumer Protection Framework for Kenya. The framework seeks to establish common standards for fair treatment, transparency, product suitability, protection of consumer assets, complaints handling and data privacy, while strengthening coordination among financial-sector regulators. The consultation closed on 28 April 2026, with the framework remaining subject to the regulatory process before full implementation.
-
Risk-based Lending: Following the CBK's rollout of the revised Risk-Based Credit Pricing Model (RBCPM), the sector reached its full implementation milestone by the February 28, 2026, deadline for existing variable-rate loans. However, the framework's flexibility led to a clear structural split in reference rate selection. While the CBK introduced the Kenya Shilling Overnight Interbank Average (KESONIA) as a dynamic, transaction-based market index, it preserved the Central Bank Rate (CBR) as an allowable alternative base rate. Co-operative Bank of Kenya fully embraced KESONIA, linking its facilities directly to daily market liquidity conditions. While, tier-1 peers like KCB Bank, Equity Bank, and DTB legally opted to anchor their formulas to the CBR plus a customer risk premium. This market fragmentation means that while the core goal of risk-based transparency has been met, monetary policy transmission velocity varies widely across the banking system depending on whether a borrower’s facility is policy-tied or market-tied.
-
Higher capital requirements: Following the enactment of the Business Laws (Amendment) Act, 2024, the Central Bank of Kenya (CBK) increased the minimum core capital requirement for commercial banks to Kshs 10.0 bn from the previous Kshs 1.0 bn, which had been in effect since 2012. The new framework requires lenders to comply gradually, Kshs 5.0 bn by 2026, Kshs 6.0 bn by 2027, Kshs 8.0 bn by 2028, and full compliance at Kshs 10.0 bn by 2029. However, Following the 2026/27 Budget Statement, the Government proposed amendments to the minimum core capital transition requirements for commercial banks. The Finance Act, 2026 subsequently extended the deadline for banks to meet the Kshs 10.0 bn minimum core capital requirement from December 2029 to December 2032 and removed the interim annual capital milestones, giving banks until 31st December 2032 to achieve the full requirement. This legislative relaxation provides critical immediate relief to the sector, significantly reducing near-term recapitalization stress for smaller tier-3 lenders.
-
Lifting of moratorium on licensing of new commercial banks: In a significant policy shift, the Central Bank of Kenya (CBK) lifted the moratorium on licensing new commercial banks on July 1, 2025, ending a restriction that had been in place since November 2015. The moratorium had been introduced to address governance, risk management, and operational weaknesses in the sector, providing space for reforms. Over the past decade, the industry has undergone substantial strengthening, with improvements in legal and regulatory frameworks, a wave of mergers and acquisitions, and the entry of new strategic investors. With the moratorium now lifted, early indications point to renewed investor interest, particularly from regional financial groups and non-bank financial institutions seeking to upgrade to full banking licenses. While no large-scale greenfield entries have yet materialized, the policy shift is expected to stimulate competition, product innovation, and capital inflows over the coming year, especially as potential entrants assess compliance with the revised minimum core capital requirement of Kshs 10.0 bn. In the near term, the move is likely to deepen financial sector resilience and broaden consumer choice, although the pace of new licensing is expected to remain measured as CBK maintains a cautious, risk-based approval approach.
-
Subsequent Regulatory Development: In September 2026, the Central Bank of Kenya (CBK) issued a draft Framework for Identification, Regulation and Supervision of Domestic Systemically Important Banks (D-SIBs), alongside draft revised Prudential and Risk Management Guidelines, for public consultation. The proposed framework will assess banks based on five indicators, namely size, interconnectedness, substitutability, complexity, and importance to the domestic economy, weighted at 40.0%, 30.0%, 15.0%, 5.0% and 10.0%, respectively. CBK will designate a bank as systemically important where its total score exceeds 0.25 and/or any individual category score exceeds 0.05. Designated D-SIBs would subsequently be classified into three systemic-importance buckets and subject to an additional Common Equity Tier 1 (CET1) capital buffer of 0.5%-2.5% of risk-weighted assets, depending on their systemic-importance bucket. The proposed framework is aimed at strengthening the resilience of systemically important institutions through enhanced supervision, higher loss-absorbing capacity and stronger recovery and resolution planning.
-
Digitization: In H1’2026, digitization continued to reshape Kenya’s banking sector, with increasing adoption of mobile, internet, agency and other alternative channels reducing reliance on physical branches for routine banking transactions. The trend was evident among listed banks, with Equity Group reporting that 89.7% of transactions were processed through digital platforms, while 98.3% of transactions occurred outside physical branches during H1’2026. Similarly, KCB Group reported that 98.0% of transactions by number were performed outside branches, supported by continued growth in the use of mobile and internet banking channels. The digitization of payments was further supported by developments in PesaLink, Kenya’s instant account-to-account payment infrastructure. In February 2026, PesaLink partnered with the Pan-African Payment and Settlement System (PAPSS) to facilitate instant, 24/7 cross-border payments in local currencies, with more than 80 PesaLink network participants linked to over 160 PAPSS participating banks. The development is expected to enhance the efficiency of cross-border payments by reducing reliance on correspondent banking arrangements and foreign reserve currencies. On 27th April 2026, DTB introduced a Kshs 20 flat fee for PesaLink transfers above Kshs 1,000.0, while transfers of up to Kshs 1,000.0 were made free. KCB subsequently adopted the same pricing structure on 20th May 2026, with other participating banks also implementing the revised tariff during H1’2026,
-
Interest Rates: Interest rates were on a downward trajectory during the period under review. Notably, the yields on Kenyan government securities declined during the period under review, with the yield on the 91-day paper averaging 7.9% during the period, 0.9% points lower than the average of 8.8% in H1’2025. Despite the marginal declines in rates in H1’2026 the listed bank’s interest income grew, with a weighted average increase of 5.0% in H1’2026, from a weighted average decline of 2.0% in H1’2025. Additionally, the lower interest rate environment led to a marginal reduction in interest expense which declined by a weighted average of 5.6% in H1’2026, albeit higher than the 20.7% decline in H1’2025. This decline in funding cost helped support overall profitability contributing to a 10.9% growth in net interest income in H1’2026,
-
Structural Consolidation: The banking sector witnessed notable structural consolidation activity in H1’2026, highlighted by Absa Group’s tender offer to increase its ownership in Absa Bank Kenya. On 19th June 2026, Absa Group announced an offer to acquire up to 896.0 mn shares at Kshs 34.5 per share, representing a maximum consideration of approximately Kshs 30.9 bn and potentially increasing its stake from 68.5% to 85.0%. The offer opened on 30th June 2026 and closed on 11th August 2026. It was ultimately undersubscribed, with a 21.1% subscription rate, as Absa Group received valid tenders for 190.0 mn shares and accepted 189.4 mn shares. Consequently, Absa Group’s stake increased by approximately 3.5% points to 72.0%, below the targeted 85.0% ownership level, reflecting limited uptake by minority shareholders as Absa Bank Kenya’s share price moved closer to the Kshs 34.5 offer price during the offer period.
-
Regional Expansion through Mergers and Acquisitions: Kenyan banks continued to deepen their regional footprint in H1’2026, with regional subsidiaries remaining an important contributor to Group performance and cross-border mergers and acquisitions supporting further expansion. Equity Group reported that its regional subsidiaries contributed 42.0% of Group banking profitability and 52.0% of Group banking assets. Similarly, KCB Group’s operations outside KCB Bank Kenya contributed 27.7% of Group Profit Before Tax (PBT) and accounted for 31.1% of the Group’s total balance sheet during the period, highlighting the growing importance of regional operations to the performance of Kenya’s leading banking groups. On the expansion front, KCB Group is targeting entry into Ethiopia before end of 2026, having narrowed down to a target entity it believes offers the right cultural and strategic fit, with the acquisition expected to be partly financed from proceeds of the National Bank of Kenya sale, while Equity Group targets entry into eight additional African markets by 2030 through acquisitions.
-
On February 19, 2026, the Capital Markets Authority (CMA) granted Nedbank an exemption from the mandatory offer requirement, allowing it to proceed with its proposed acquisition of approximately 66.0% of NCBA Group. The tender offer opened on 28th May 2026 and closed on 10 July 2026, attracting valid tenders equivalent to 79.9% of NCBA’s issued shares, representing a 121.0% oversubscription relative to Nedbank’s targeted 66.0% stake. The Central Bank of Kenya subsequently approved the acquisition on 28th August 2026, with completion expected in Q3’2026, subject to the remaining regulatory approvals and transaction conditions.
-
On March 19, 2026, the Central Bank of Kenya announced the acquisition of 100.0% shareholding of Paramount Bank Ltd by Zenith Bank Plc. The deal was first announced in November 2025, however, the transaction values and details were not disclosed. The acquisition is a strategic entry point into Kenya’s established banking ecosystem, enhancing its geographic diversification and positioning it to tap into Kenya’s relatively mature and dynamic banking sector as a gateway to the broader region. Zenith bank joins other Nigerian banks in the Kenyan market including Access Bank, UBA and GTBank.
-
On November 4, 2025 KCB Group Plc revealed its acquisition of an undisclosed minority stake in Pesapal Limited, one of the region’s leading digital payment providers, as part of its strategic initiative to bolster digital capabilities and reinforce its footprint in banking, agency solutions, and business services across Kenya, Uganda, and Rwanda. This move proves to be strategic as KCB strives to capture the biggest market share of the fast-growing fintech market.
-
On March 24, 2025, KCB Group Plc disclosed its acquisition of a 75.0% controlling interest in Riverbank Solutions Limited, a fintech entity focused on payment systems, as part of its strategic initiative to bolster digital capabilities and reinforce its footprint in banking, agency solutions, and business services across Kenya, Uganda, and Rwanda. Riverbank, a collaborator with KCB since 2013 in agency banking, brings expertise in digital payments, payroll management, and financial reporting, which KCB aims to harness to enhance its offerings tailored for small and medium enterprises (SMEs) and micro, small, and medium enterprises (MSMEs). The integration of Riverbank’s capabilities is expected to facilitate the unification of KCB’s agent banking channels into a single platform, optimizing operational efficiency.
-
On April 14, 2025, the Central Bank of Kenya announced the acquisition of 100.0% shareholding of National Bank of Kenya Limited (NBK) by Access Bank Plc from KCB Group Plc, following CBK’s approval on April 4, 2025 under Section 13 (4) of the Banking Act, and approval by the Cabinet Secretary for the National Treasury and Economic Planning on April 10, 2025, pursuant to Section 9 of the Banking Act. As part of the transaction, CBK, on April 4, 2025, further approved the transfer of certain assets and liabilities of National Bank of Kenya Limited to KCB Bank Kenya Limited pursuant to Section 9 of the Banking Act. The acquisition and completion of the transaction was finalised on 30th May 2025 in accordance with the terms of the Agreement between the parties.
The following are Mergers and Acquisitions that were completed in 2024:
-
In April 2024, Sidian Bank disclosed that the founders of the bank and other nine individual shareholders relinquished a combined stake of 728,525 shares representing 16.6% stake to Pioneer General Insurance Limited, pioneer Life Investments Limited, Wizro Enterprises Limited, Afrah Limited, and Telesec Africa Limited. The transaction amounted to Kshs 0.8 bn translating to a price to book multiple (p/bv) of 1.0x. This follows an earlier transaction executed on October 2023 when Pioneer General Insurance, Wizpro Enterprise and Afram Limited bought 38.9% stake in the lender following a shareholders’ resolution passed on 20th September 2023 approving the sale,
Below is a summary of the deals in the last 13 years that have either happened, been announced or expected to be concluded:
|
Cytonn Report: Banking Sector Deals and Acquisitions |
||||||
|
Acquirer |
Bank Acquired |
Book Value at Acquisition (Kshs bn) |
Transaction Stake |
Transaction Value (Kshs bn) |
P/Bv Multiple |
Date |
|
Zenith Bank |
Paramount Bank |
Unknown |
100.0% |
Undisclosed |
N/A |
Apr-26 |
|
Nedbank |
NCBA |
6.0 |
66.0% |
5.4 |
1.4x |
Jan-26 |
|
KCB |
Pesapal |
Unknown |
Undisclosed |
Undisclosed |
N/A |
Nov-25 |
|
KCB |
Riverbank |
Unknown |
75.0% |
2.0 |
N/A |
Mar-25 |
|
Access Bank PLC (Nigeria) |
National Bank of Kenya |
10.6 |
100.00% |
13.3 |
1.3x |
Apr-25 |
|
Pioneer General Insurance and four other companies |
Sidian Bank |
5.0 |
16.57% |
0.8 |
1.0x |
Apr-24 |
|
Pioneer General Insurance and two other companies |
Sidian Bank |
5.0 |
38.91% |
2.0 |
1.0x |
Oct-23 |
|
Equity Group |
Cogebanque PLC ltd |
5.7 |
91.13% |
6.7 |
1.3x |
Dec-23 |
|
Shorecap III |
Credit Bank Plc |
3.6 |
20.00% |
0.7 |
1.0x |
Jun-23 |
|
Premier Bank Limited |
First Community Bank |
2.8 |
62.50% |
Undisclosed |
N/A |
Mar-23 |
|
KCB Group PLC |
Trust Merchant Bank (TMB) |
12.4 |
85.00% |
15.7 |
1.5x |
Dec-22 |
|
Equity Group |
Spire Bank |
Unknown |
Undisclosed |
Undisclosed |
N/A |
Sep-22* |
|
Access Bank PLC (Nigeria)* |
Sidian Bank |
4.9 |
83.40% |
4.3 |
1.1x |
June-22* |
|
KCB Group |
Banque Populaire du Rwanda |
5.3 |
100.00% |
5.6 |
1.1x |
Aug-21 |
|
I&M Holdings PLC |
Orient Bank Limited Uganda |
3.3 |
90.00% |
3.6 |
1.1x |
Apr-21 |
|
KCB Group** |
ABC Tanzania |
Unknown |
100.00% |
0.8 |
0.4x |
Nov-20* |
|
Co-operative Bank |
Jamii Bora Bank |
3.4 |
90.00% |
1 |
0.3x |
Aug-20 |
|
Commercial International Bank |
Mayfair Bank Limited |
1.0 |
51.00% |
Undisclosed |
N/A |
May-20* |
|
Access Bank PLC (Nigeria) |
Transnational Bank PLC. |
1.9 |
100.00% |
1.4 |
0.7x |
Feb-20* |
|
Equity Group ** |
Banque Commerciale Du Congo |
8.9 |
66.50% |
10.3 |
1.2x |
Nov-19* |
|
KCB Group |
National Bank of Kenya |
7.0 |
100.00% |
6.6 |
0.9x |
Sep-19 |
|
CBA Group |
NIC Group |
33.5 |
53%.47% |
23 |
0.7x |
Sep-19 |
|
Oiko Credit** |
Credit Bank |
3.0 |
22.80% |
1 |
1.5x |
Aug-19 |
|
CBA Group** |
Jamii Bora Bank |
3.4 |
100.00% |
1.4 |
0.4x |
Jan-19 |
|
AfricInvest Azure |
Prime Bank |
21.2 |
24.20% |
5.1 |
1.0x |
Jan-18 |
|
KCB Group |
Imperial Bank |
Unknown |
Undisclosed |
Undisclosed |
N/A |
Dec-18 |
|
SBM Bank Kenya |
Chase Bank Ltd |
Unknown |
75.00% |
Undisclosed |
N/A |
Aug-18 |
|
DTBK |
Habib Bank Kenya |
2.4 |
100.00% |
1.8 |
0.8x |
Mar-17 |
|
SBM Holdings |
Fidelity Commercial Bank |
1.8 |
100.00% |
2.8 |
1.6x |
Nov-16 |
|
M Bank |
Oriental Commercial Bank |
1.8 |
51.00% |
1.3 |
1.4x |
Jun-16 |
|
I&M Holdings |
Giro Commercial Bank |
3.0 |
100.00% |
5 |
1.7x |
Jun-16 |
|
Mwalimu SACCO |
Equatorial Commercial Bank |
1.2 |
75.00% |
2.6 |
2.3x |
Mar-15 |
|
Centum |
K-Rep Bank |
2.1 |
66.00% |
2.5 |
1.8x |
Jul-14 |
|
GT Bank |
Fina Bank Group |
3.9 |
70.00% |
8.6 |
3.2x |
Nov-13 |
|
Average |
|
|
74.5% |
|
1.3x |
|
|
Average: 2013 to 2018 |
|
|
73.5% |
|
1.7x |
|
|
Average: 2019 to 2026 |
|
|
73.2% |
|
1.0x |
|
|
* Announcement Date ** Deals that were dropped |
||||||
As of H1’2026, the average acquisition valuations for banks have remained unchanged at 1.3x, similar to what was recorded in a similar period in 2025. As such, the valuations still remain low compared to historical prices paid, as highlighted in the chart below;
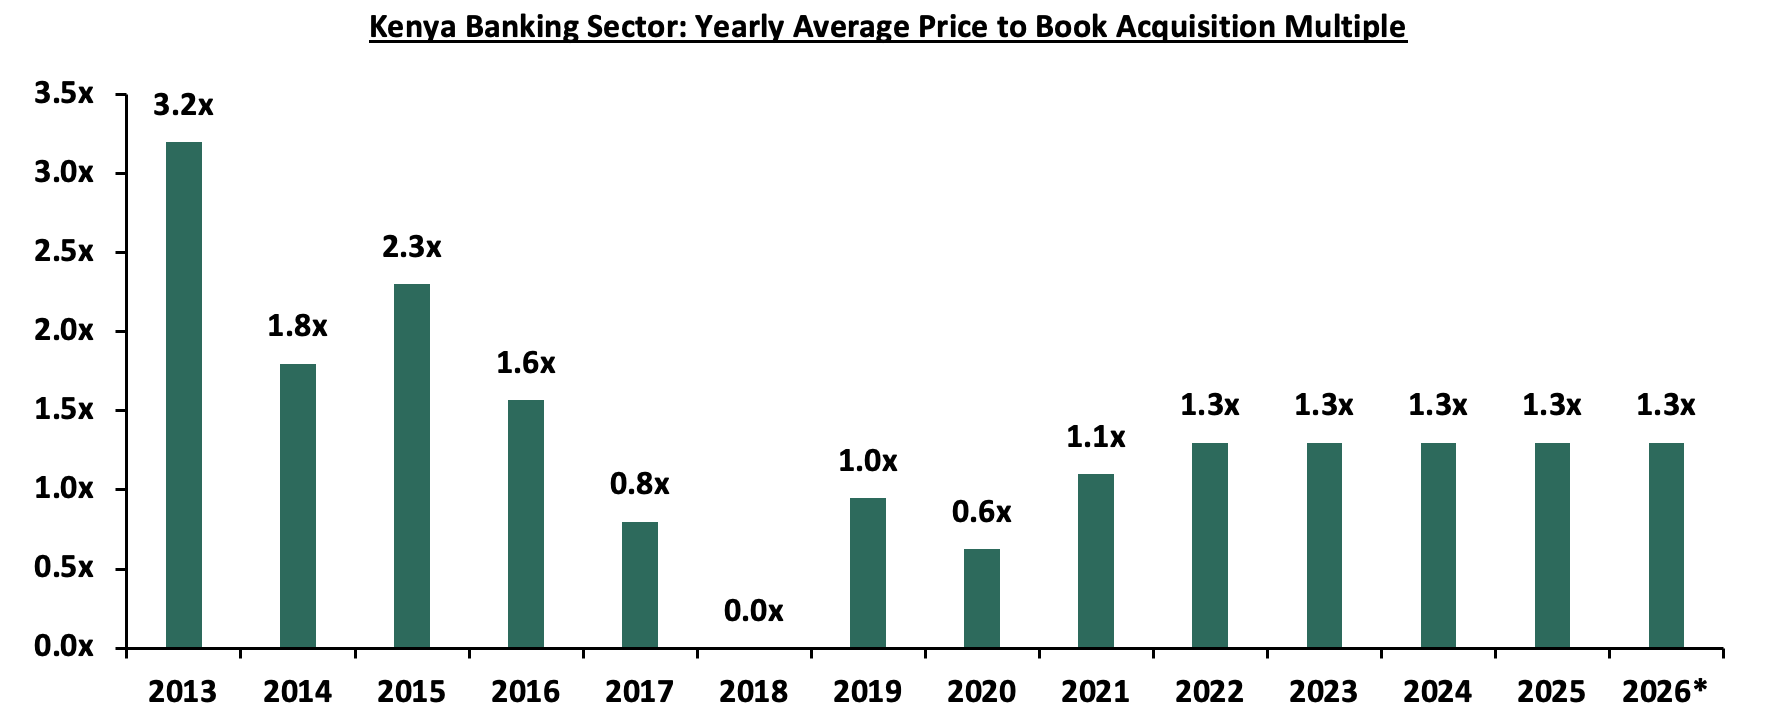
2026* data as of end of H1’2026
As at the end of H1’2026, the number of commercial banks in Kenya stood at 38, same as in H1’2025, but lower than the 43 licensed banks in FY’2015. The ratio of the number of banks per 10 million population in Kenya now stands at 6.5x, which is a reduction from 9.0x in FY’2015, demonstrating continued consolidation in the banking sector. However, despite the ratio improving, Kenya still remains overbanked as the number of banks remains relatively high compared to the African major economies. To bring the ratio to 5.6x, we ought to reduce the number of banks from the current 38 banks to about 33 banks. This is partly expected to be supported by the enactment of The Business Laws (Amendment) Act 2024 that mandated a significant increase in the minimum core capital for banks to Kshs 10.0 bn from the previous Kshs 1.0 bn that had been in effect since 2012. To facilitate compliance, lenders below this threshold were directed to incrementally grow their figure to Kshs 10.0 bn in 2032, with the phased milestones being cancelled. The new capital requirement is likely to trigger further mergers and acquisitions (M&As), especially for smaller lenders that may struggle to meet the threshold, potentially reducing the number of banks even further. However, the effect could be muted by the lifting of the moratorium which ended on 1st July 2025. The chart below shows the commercial bank ratio per 10 million people across select African nations in comparison to Kenya;
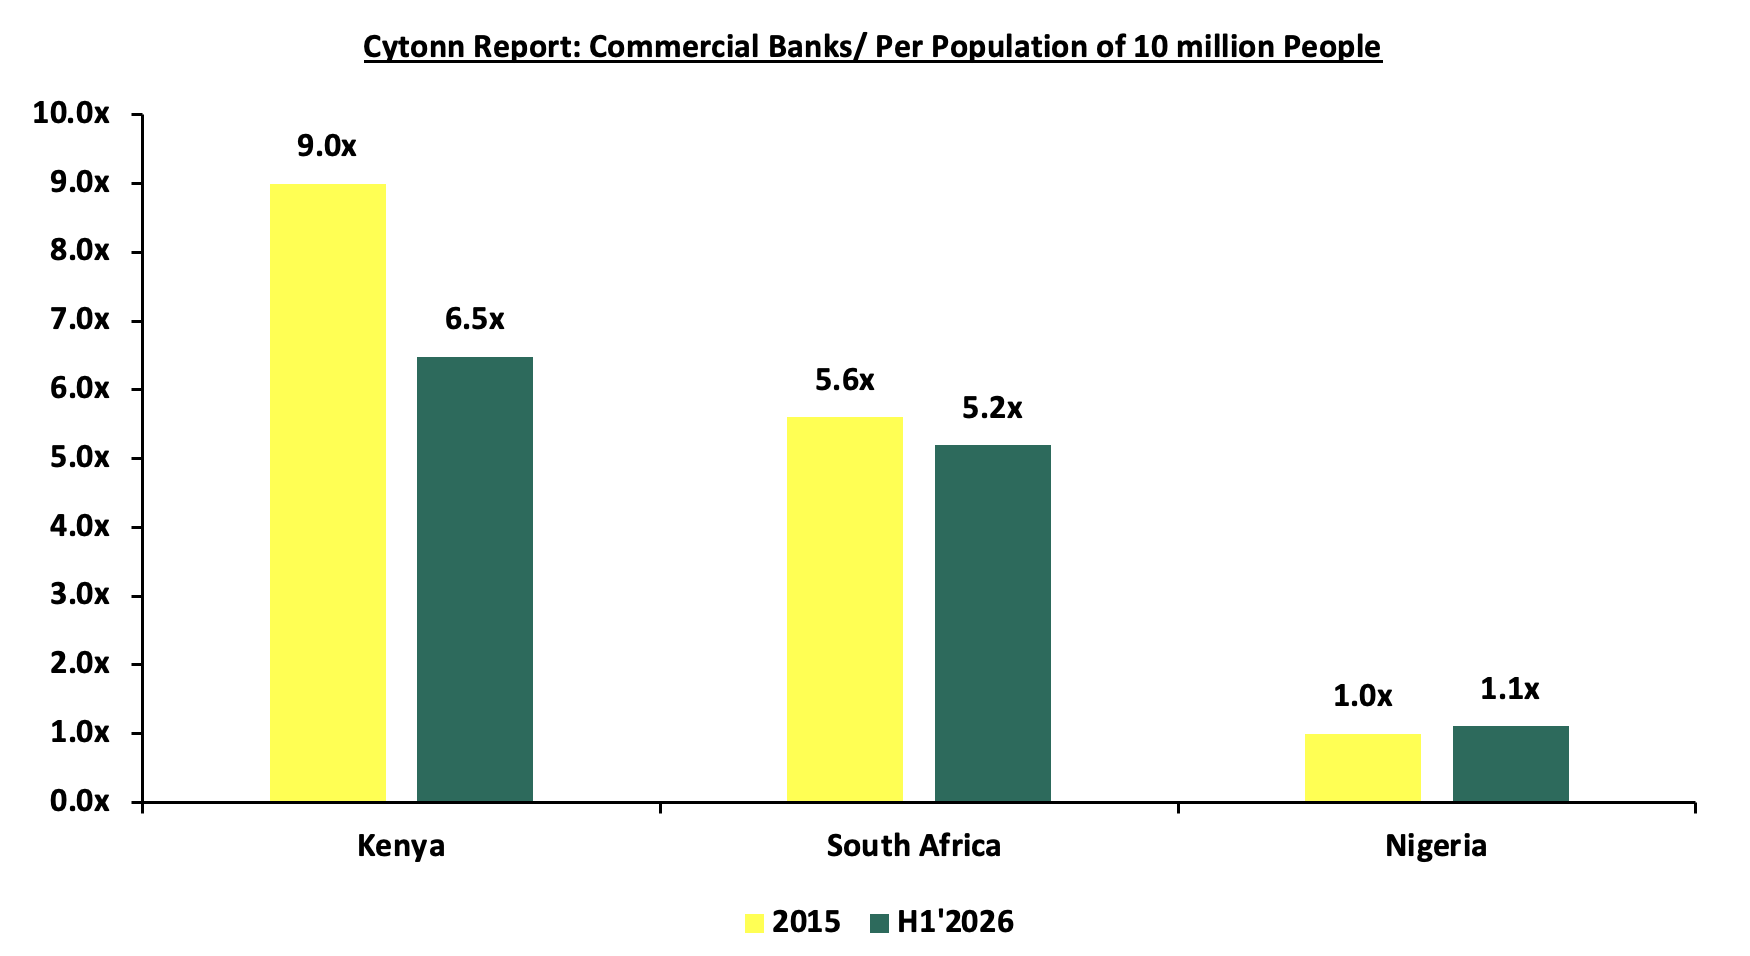
Source: World Bank, Central Bank of Kenya, South Africa Reserve Bank, Central Bank of Nigeria
The Central Bank of Kenya (CBK) ended its moratorium on licensing new commercial banks, effective July 1, 2025, a restriction that had been in place since November 2015 to support sector reforms. During the moratorium period, the banking sector strengthened through improved regulatory frameworks, greater consolidation, and the entry of strategic investors, with the number of banks declining to 38 from 43 in 2015. With the restriction lifted, new entrants can now apply for greenfield banking licenses, provided they meet the revised minimum core capital requirement of Kshs 10.0 billion. This shift reduces dependence on mergers and acquisitions as the main entry route and opens up direct market entry under stricter capital requirements.
-
Asset Quality: Asset quality for listed banks improved in H1’2026, with the weighted average Gross Non-Performing Loan ratio (NPL) decreasing by 2.7% points to 11.1%, from 13.8% recorded in H1’2025. The performance was 0.4% points below the ten-year average of 11.5%. Notably, all 11 listed banks except Family Bank recorded a decline in their NPL ratios, pointing to an improvement in asset quality, although credit risk remains a key concern as banks continue to manage elevated levels of non-performing loans. The improvement occurred amid a relatively stable monetary policy and improving lending conditions, which may support further asset quality recovery. The overall gross non-performing loans (NPL) ratio in the banking industry also decreased by 0.8% points, to 14.8% in June 2026 from 15.6% in March 2026 as a result of a 1.3% decrease in gross NPLs coupled with the 4.3% increase in gross loans during the period under review. Equity Group’s NPL ratio declined the most by 5.0% points to 10.2%, from 15.3% in H1’2025, while KCB Group’s NPL ratio decreased by 3.3% points to 14.5%, from 17.9% in H1’2025. Equity’s asset quality improved due to a 22.2% decrease in Gross non-performing loans to Kshs 108.4 bn, from Kshs 139.4 bn in H1’2025, as compared to the 16.1% increase in gross loans to Kshs 1,058.6 bn, from Kshs 912.0 bn recorded in H1’2025. Similarly, KCB Group’s asset quality improved due to a 13.2% increase in gross loans to Kshs 1,401.3 bn, from Kshs 1,237.6 bn recorded in H1’2025 and the 7.8% decrease in Gross non-performing loans to Kshs 203.8 bn, from Kshs 221.1 bn in H1’2025. The chart below highlights the asset quality trend for the listed banks:
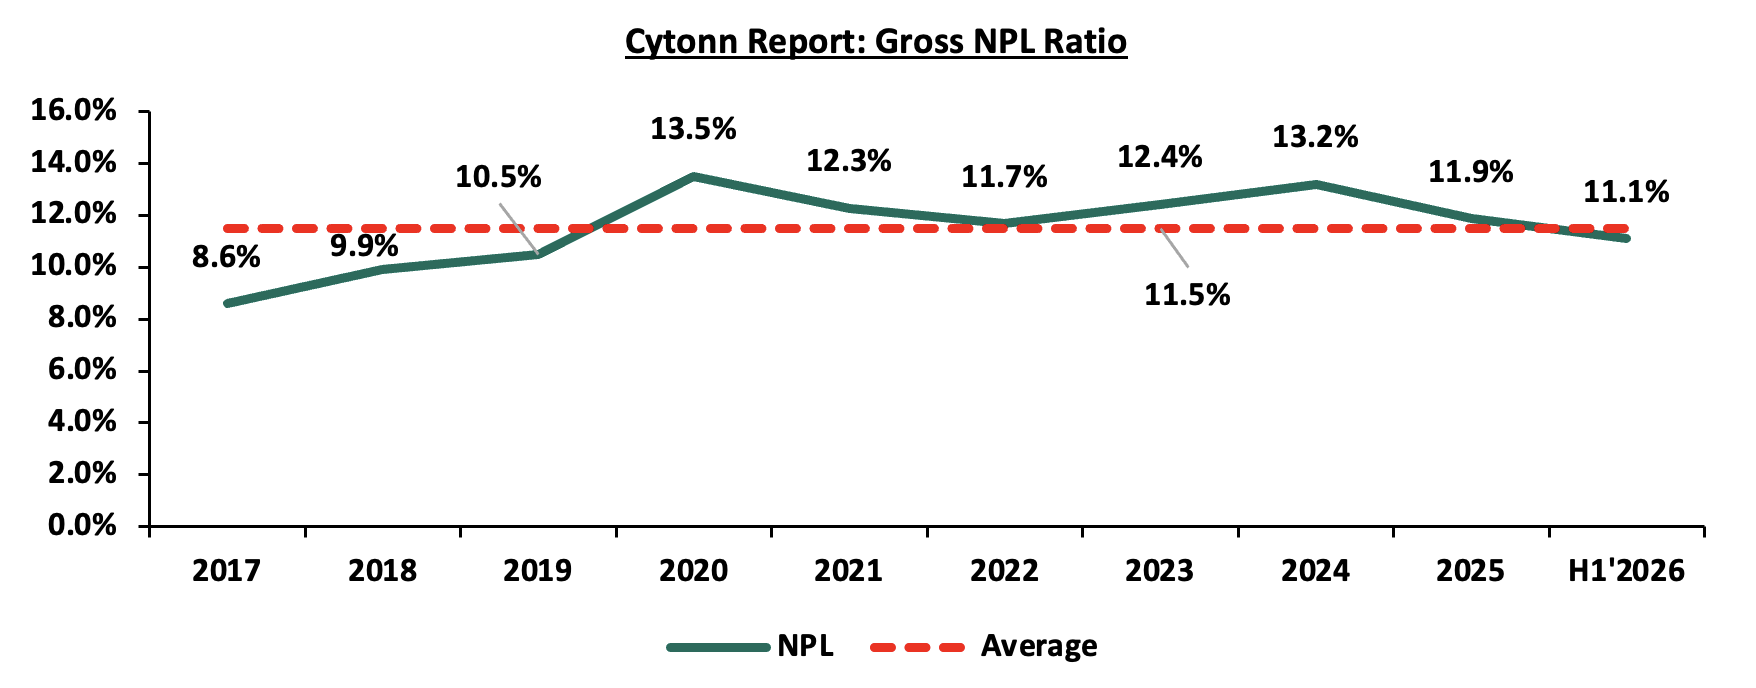
All the eleven listed Kenyan banks except Family Bank recorded an improvement in asset quality, supported by enhanced credit risk management and early signs of economic recovery as the recent Central Bank Rate (CBR) cuts began to filter through the economy. In a bid to curb inflation and support the Shilling the Monetary Policy Committee (MPC) had adopted an accommodative monetary policy stance, maintaining the Central Bank Rate (CBR) at 8.75% in June 2026 compared to 9.75% in June 2025. With commercial banks required to reflect these lower rates in their loan pricing, the banks weighted average lending rates therefore declined by 0.9% points to 14.4% in June 2026 from 15.3% in June 2025. As a result of the low interest rates, the private sector credit growth improved recording expansions of 10.6% in June 2026 and to 10.2% in July 2026, up from an expansion of 2.2% in June 2025. The chart below shows the private sector credit growth:
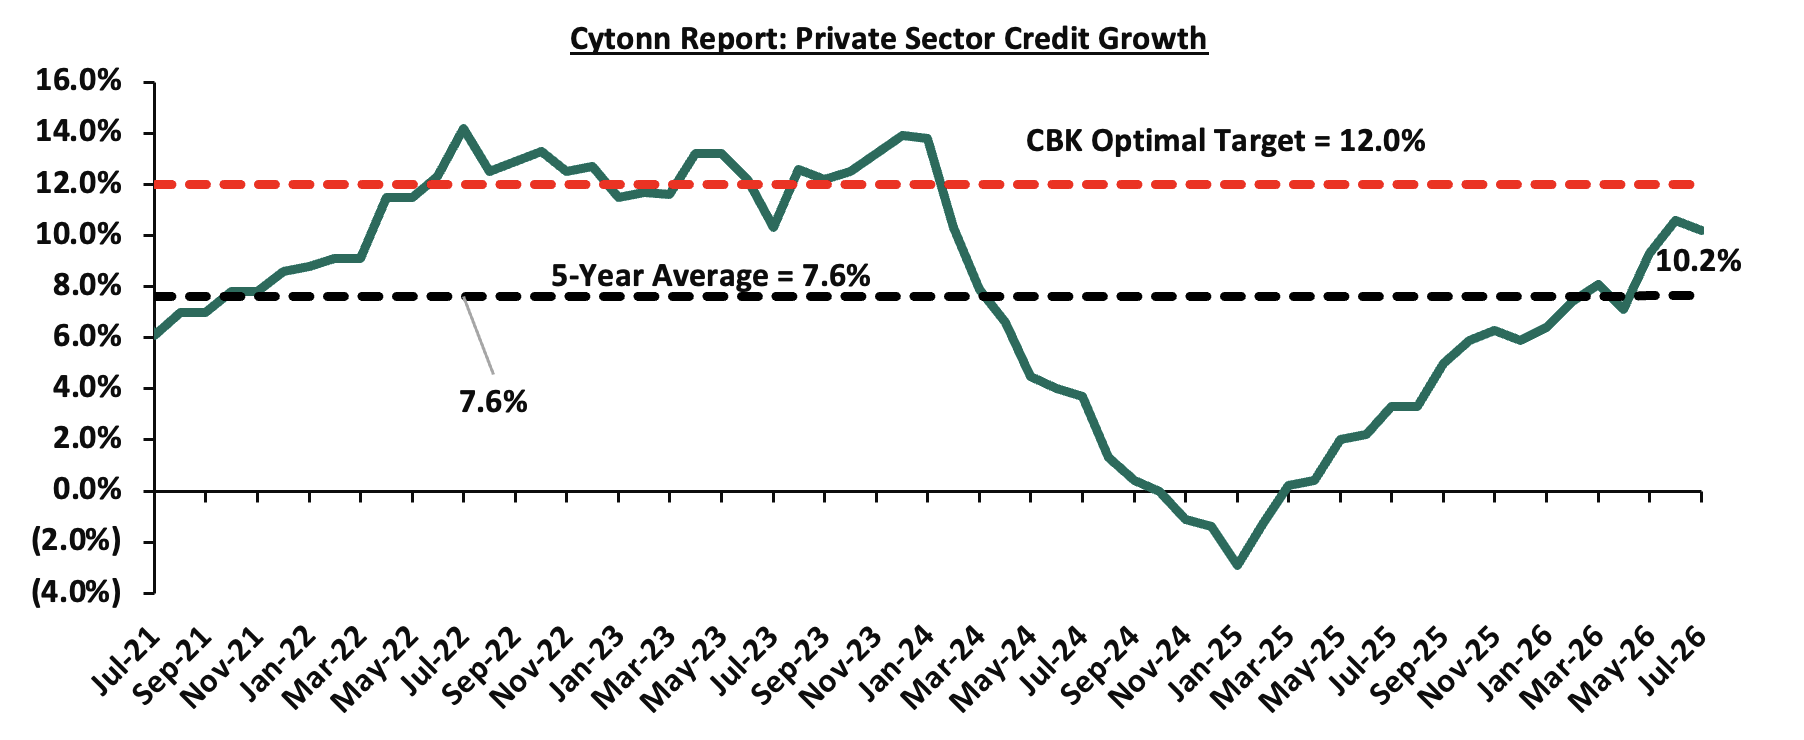
The Central Bank of Kenya had lowered the Central Bank Rate (CBR) by a cumulative 425 basis points, from 13.0% in July 2024 to 8.75% in February 2026, signalling a gradual easing of monetary policy following the successful stabilization of the currency and anchoring of inflation. However, in the April, June and August 2026 meeting, the MPC maintained the CBR rate at 8.75% pausing the easing cycle, to anchor inflation expectations within the 2.5%–7.5% target range, while also supporting exchange rate stability. The Committee further highlighted that rising global oil prices, driven largely by geopolitical tensions in the Middle East, present upside inflation risks through potential second-round effects.
The earlier easing cycle, with the CBR cut to 8.75% from 13.00% in July 2024, had supported stronger credit demand and improved loan growth prospects as borrowing costs declined. The decision to pause now is likely to keep lending conditions steady, sustaining the recovery in credit uptake without further accelerating it, as banks continue benefiting from the prior rate cuts already transmitted into the market. Notably, growth in private sector credit grew by 10.2% in July 2026 a slight moderation from 10.6% in June 2026, reflecting improved demand for credit in line with the declining lending interest rates. Going forward, we expect credit risk to decline gradually as earlier interest rate easing supports stronger repayment capacity and improving credit growth. However, persistent geopolitical tensions in the Middle East and the fragility of ceasefire arrangements pose an upside risk to credit risk through potential oil price shocks. A sustained rise in oil prices could reignite inflationary pressures, weaken household and corporate disposable incomes, increase debt-servicing burdens and, consequently, slow the pace of improvement in asset quality.
The table below highlights the asset quality for the listed banking sector:
|
Cytonn Report: Listed Banks Asset Quality |
||||||
|
Bank |
H1'2026 NPL Ratio* |
H1'2025 NPL Ratio** |
% point change in NPL Ratio |
H1'2026 NPL Coverage* |
H1'2025 NPL Coverage** |
% point change in NPL Coverage |
|
Equity Group |
10.2% |
15.3% |
(5.0%) |
71.6% |
62.4% |
9.2% |
|
KCB Group |
14.5% |
17.9% |
(3.3%) |
78.8% |
64.3% |
14.4% |
|
Co-operative Bank |
14.2% |
17.3% |
(3.1%) |
68.9% |
65.8% |
3.1% |
|
Absa Bank Kenya |
10.2% |
13.2% |
(3.0%) |
69.1% |
66.6% |
2.5% |
|
HFCB Group |
21.4% |
24.0% |
(2.7%) |
80.5% |
75.4% |
5.1% |
|
I&M Group |
8.4% |
11.0% |
(2.5%) |
74.8% |
65.4% |
9.4% |
|
Stanbic Holdings |
7.3% |
9.5% |
(2.1%) |
86.6% |
82.7% |
3.9% |
|
NCBA Group |
10.8% |
12.2% |
(1.4%) |
67.4% |
65.5% |
1.8% |
|
Standard Chartered Bank |
5.1% |
6.0% |
(0.9%) |
84.3% |
81.4% |
2.9% |
|
Diamond Trust Bank |
12.2% |
12.9% |
(0.7%) |
58.2% |
45.9% |
12.2% |
|
Family Bank |
14.7% |
13.5% |
1.2% |
124.0% |
77.4% |
46.6% |
|
Mkt Weighted Average* |
11.1% |
13.8% |
(2.7%) |
75.3% |
67.8% |
7.5% |
|
*Market cap weighted as at 18/09/2026 |
||||||
|
**Market cap weighted as at 16/09/2025 |
||||||
Key take-outs from the table include;
-
Asset quality for the listed banks improved in H1’2026, with market weighted average NPL decreasing by 2.7% points to 11.1% from 13.8% in H1’2025. The improvement in the asset quality was mainly driven by an Improvement in Equity Group, KCB Group, Co-operative Bank, Absa Bank Kenya and HFCB with their NPL ratio decreasing by 5.0%, 3.3%, 3.1%, 3.0% and 2.7% points respectively,
-
Equity Group and KCB Group had the highest NPL ratio declines of 5.0% and 3.3% points respectively to 10.2% and 14.5%, from 15.3% and 17.9% respectively in H1’2025. Equity’s asset quality improved due to a 22.2% decrease in Gross non-performing loans to Kshs 108.4 bn, from Kshs 139.4 bn in H1’2025, as compared to the 16.1% increase in gross loans to Kshs 1,058.6 bn, from Kshs 912.0 bn recorded in H1’2025. Similarly, KCB Group’s asset quality improved due to a 13.2% increase in gross loans to Kshs 1,401.3 bn, from Kshs 1,237.6 bn recorded in H1’2025 and the 7.8% decrease in Gross non-performing loans to Kshs 203.8 bn, from Kshs 221.1 bn in H1’2025, and,
-
Market weighted average NPL Coverage for the listed banks increased by 7.5% points to 75.3% in H1’2026, from 67.8% recorded in H1’2025, majorly on the back of increased NPL coverage recorded by Family Bank, KCB Group, Diamond Trust Bank Kenya, I&M Group, Equity Group, HFCB Group, Stanbic Holdings, Co-operative Bank, Standard Chartered Group, ABSA Kenya, and, NCBA Group and by 46.6%, 14.4%, 12.2%, 9.4%, 9.2%, 5.1%, 3.9%, 3.1%, 2.9%, 2.5% and 1.8% points respectively in H1’2026.
Section II: Summary of the Performance of the Listed Banking Sector in H1’2026:
The table below highlights the performance of the banking sector, showing the performance using several metrics, and the key take-outs of the performance;
|
Cytonn Report: Kenyan Listed Banks Performance H1’2026 |
|||||||||||||||
|
Bank |
Core EPS Growth |
Interest Income Growth |
Interest Expense Growth |
Net Interest Income Growth |
Net Interest Margin |
Non-Funded Income Growth |
NFI to Total Operating Income |
Growth in Total Fees & Commissions |
Deposit Growth |
Growth in Government Securities |
Loan to Deposit Ratio |
Loan Growth |
Return on Average Equity |
COF |
YIEA |
|
HFCB Group |
59.9% |
16.9% |
0.9% |
29.4% |
7.0% |
37.4% |
30.5% |
(10.4%) |
29.7% |
41.0% |
63.8% |
11.5% |
10.3% |
5.0% |
11.5% |
|
Diamond Trust Bank |
35.8% |
9.9% |
(9.5%) |
26.4% |
7.1% |
6.6% |
24.4% |
2.8% |
10.6% |
14.1% |
61.4% |
13.7% |
13.1% |
4.8% |
11.6% |
|
Equity Group |
31.5% |
8.2% |
(12.2%) |
16.8% |
6.7% |
35.9% |
44.5% |
29.7% |
21.4% |
6.7% |
61.7% |
18.9% |
29.1% |
2.8% |
10.3% |
|
Co-operative Bank |
28.0% |
6.3% |
(6.5%) |
13.0% |
9.0% |
11.6% |
32.2% |
10.9% |
13.4% |
7.0% |
74.4% |
18.1% |
20.6% |
4.5% |
12.9% |
|
Family Bank |
27.0% |
25.9% |
2.6% |
40.7% |
9.7% |
(14.2%) |
19.0% |
0.4% |
20.3% |
55.3% |
61.6% |
10.1% |
23.3% |
4.5% |
14.4% |
|
I&M Group |
22.4% |
18.9% |
12.5% |
22.5% |
8.7% |
24.5% |
25.7% |
(1.0%) |
17.7% |
53.4% |
66.1% |
15.0% |
18.0% |
4.6% |
13.0% |
|
KCB Group |
14.5% |
4.0% |
(2.9%) |
7.0% |
8.2% |
15.4% |
31.5% |
17.7% |
15.1% |
31.5% |
72.5% |
13.27% |
22.0% |
3.5% |
11.5% |
|
NCBA Group |
12.2% |
7.6% |
(12.8%) |
20.4% |
7.9% |
7.6% |
38% |
9.1% |
11.0% |
22.5% |
62.7% |
20.1% |
19.8% |
4.2% |
11.6% |
|
Stanbic Group |
1.3% |
5.9% |
6.6% |
5.5% |
6.2% |
(9.0%) |
23.8% |
1.9% |
23.0% |
57.0% |
68.1% |
24.7% |
20.7% |
2.0% |
11.1% |
|
Absa Bank Kenya |
(9.8%) |
(8.5%) |
(17.7%) |
(5.4%) |
8.4% |
(10.2%) |
27.9% |
9.4% |
6.8% |
(3.2%) |
86.7% |
8.2% |
23.3% |
3.1% |
11.0% |
|
Standard Chartered Bank |
(16.8%) |
(17.5%) |
0.7% |
(19.8%) |
7.4% |
15.9% |
39.1% |
23.1% |
6.4% |
(19.9%) |
54.7% |
11.1% |
17.1% |
1.3% |
8.7% |
|
H1'2026 Mkt Weighted Average* |
16.3% |
5.0% |
(5.6%) |
10.8% |
7.8% |
14.6% |
33.7% |
14.4% |
15.4% |
18.6% |
68.0% |
15.8% |
22.2% |
3.4% |
11.3% |
|
H1'2025 Mkt Weighted Average* |
8.4% |
(2.0%) |
(20.7%) |
10.4% |
8.0% |
(5.8%) |
33.9% |
4.2% |
1.7% |
28.3% |
67.2% |
1.5% |
22.3% |
4.6% |
12.3% |
|
*Market cap weighted as at 18/09/2026 |
|||||||||||||||
|
**Market cap weighted as at 16/09/2025 |
|||||||||||||||
Key takeaways from the table include:
-
The listed banks recorded a 16.3% growth in core Earnings per Share (EPS) in H1’2026, compared to the weighted average increase of 8.4% in H1’2025, an indication of a strong performance on the back of a 14.6% growth in non-funded income in H1’2026, compared to a decline of 5.8% in H1’2025. This was majorly attributable to an increase in the fees and commissions income which increased by 10.1% points to 14.4% in H1’2026 from 4.2% in H1’2025. The performance during the period highlights banks’ reduced reliance on interest income as reflected in the faster increase in the non-funded income weighted average growth to 14.6% from a decline of 5.8% in H1’2025 compared to a marginal increase in net interest income weighted average growth to 10.8% from 10.4% in H1’2025 that resulted in a recovery in earnings growth,
-
Investments in government securities by listed banks continued to increase in H1’2026, although the pace of growth moderated, with the market-weighted average growth slowing down to 18.6% from 28.3% in H1’2025. All listed banks except Absa Bank Kenya and Standard Chartered Bank recorded increases in government securities investments, with Family Bank and I&M Group recording the largest growth of 55.3% and 53.4%, respectively. The moderation in growth was partly attributable to the decline in yields on government securities during the period, which reduced the incremental returns available from additional investments, particularly in short-term Treasury bills. Nevertheless, government securities remained attractive for liquidity management and their relatively low credit risk, while the decline in yields supported valuation gains on existing bond holdings,
-
The listed banks’ Net loans and advances to customers recorded a weighted average growth of 15.8% in H1’2026, an increase from the 1.5% increase recorded in H1’2025, indicating increased lending activity supported by easing borrowing costs, as a result of declining lending interest rates,
-
Interest income recorded a weighted average increase of 5.0% in H1’2026, compared to a decline of 2.0% in H1’2025. Similarly, interest expenses recorded a market-weighted average decline of 5.6% in H1’2026 compared to a decline of 20.7% in H1’2025. Consequently, net interest income recorded a weighted average growth of 10.8% in H1’2026, slightly higher than the 10.4% growth recorded in H1’2025, on the back of accommodative monetary policy leading to lower lending and deposit rates,
-
Notably, non-funded income growth improved during the year, as evidenced by non-funded income weighted average growth of 14.6% in H1’2026 compared to a weighted average decline of 5.8% in H1’2025. Additionally, listed banks recorded a weighted average growth of 14.4% in total fees and commissions income in H1’2026 compared to a weighted growth of 4.2% in H1’2025, and,
-
The listed banks recorded a 22.2% weighted average growth on return on average equity (RoaE), 0.1% points lower than the 22.3% growth registered in H1’2025. Similarly, the entire banking sector’s Return On Equity (ROE) stood at 24.1% as of June 2026, 1.1% points increase from 23.0% in March 2026 and a 1.1% points increase from the 23.0% recorded in June 2025 . On a global level, the Kenyan banking sector continues to record high profitability compared to other economies in the world, as highlighted in the chart below:
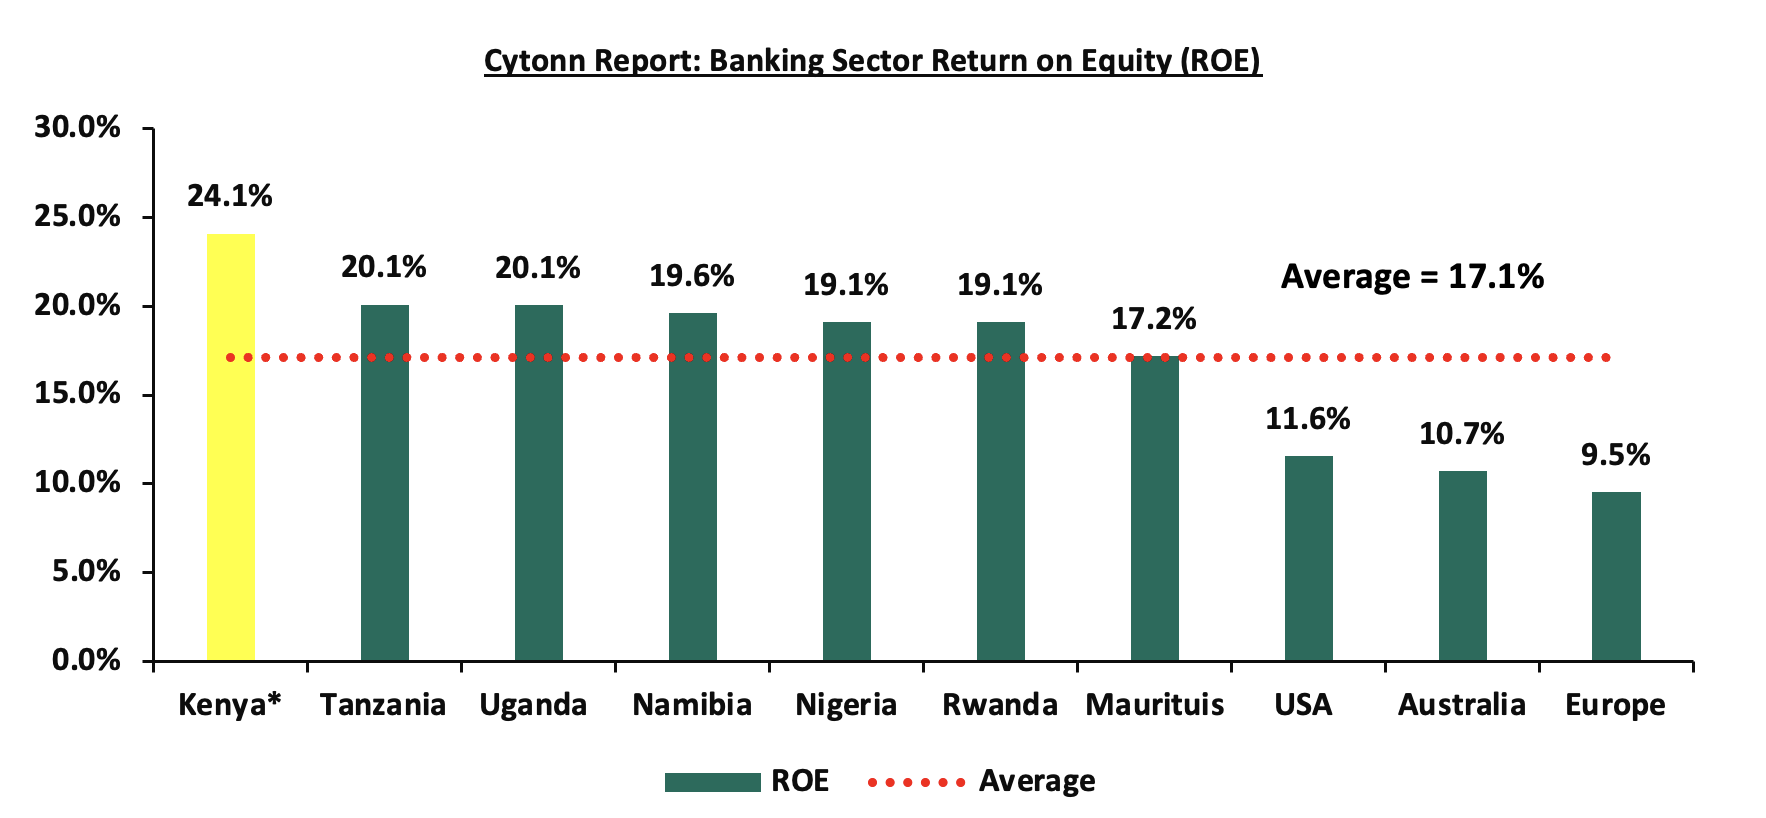
Source: Cytonn Research
* Figure as June 2026
Figure as of December 2025
Section III: The Focus Areas of the Banking Sector Players Going Forward:
The banking sector witnessed an upturn in profitability during the period under review, with the Core Earnings Per Share (EPS) increasing by 16.3% compared to the 8.4% increase registered last year in a similar period, this is primarily due to an increase in non-funded income growth to 14.6% in H1’2026, compared to a decline of 5.8% in H1’2025. This was majorly attributable to higher transaction volumes which supported fees and commissions income. Notably, two of the eleven listed banks recorded a decline in non-funded income in H1’2026. This concentration has exposed banks to earnings pressure in an increasingly interest-rate-sensitive environment. While there were expectations of an improved operating environment following continued monetary policy easing, evidenced by a lower Central Bank Rate (CBR) of 9.0% as of December 2025 and 8.75% as of June 2026, and a relatively volatile Shilling, the broader economic performance has yet to translate into meaningful revenue diversification or asset quality improvement.
Consequently, profitability remains partly constrained by elevated credit risk, while any moderation in provisioning levels will largely depend on a sustained improvement in economic conditions and asset quality. Notably, NPL coverage among listed banks increased by a weighted average of 7.5% in H1’2026, compared to 2.9% in H1’2025, indicating that banks continued to strengthen their provisioning buffers against potential credit losses. The improvement in asset quality and easing lending conditions could support a gradual moderation in provisioning requirements going forward. However, persistent geopolitical tensions in the Middle East and the uncertainty around ceasefire arrangements could reverse this trend through renewed oil price shocks, which may reignite inflationary pressures, weaken borrowers’ repayment capacity and increase the need for precautionary provisioning. Based on the current operating environment, we believe the future performance of the banking sector will be shaped by the following key factors:
-
Growth in Interest income: Going forward, interest income growth is expected to remain an important driver of banking sector performance, supported by continued expansion in loan books as lower borrowing costs encourage credit uptake. Following the cumulative easing of monetary policy, which reduced the Central Bank Rate (CBR) to 8.75% in February 2026, the Monetary Policy Committee (MPC) subsequently maintained the rate at 8.75% in its April, June and August 2026 meetings. While the pause in rate cuts is likely to limit further declines in lending rates, the continued transmission of earlier easing should support credit demand and loan growth. In addition, risk-based lending models should enable banks to better align lending rates with borrower risk, supporting the sustainability of interest income.
-
Revenue Diversification: Non-funded income (NFI) recorded a 14.6% weighted average growth in H1’2026, compared to a 5.8% decline in H1’2025, supported by a 14.3% increase in fees and commissions income. Although the weighted average contribution of NFI to total operating income declined slightly to 33.7% from 33.9% in H1’2025, the strong growth in absolute NFI highlights the continued potential for banks to diversify their revenue streams through transaction-based services, digital channels and other non-interest income opportunities.
-
Growth in Loans and Advances: All 11 listed banks recorded growth in loans and advances to customers, resulting in a 15.8% weighted average increase in H1’2026, compared to 1.5% in H1’2025. Credit growth is expected to remain supported by improved affordability, declining lending rates and stronger private sector demand, although the pace of growth may moderate following the MPC’s decision to pause further CBR reductions. Banks can support sustained loan growth through improved customer segmentation, risk-based lending and greater access to underserved sectors, particularly small and medium-sized enterprises and retail borrowers.
-
Regional Expansion and Further Consolidation: Regional expansion and consolidation are expected to remain key themes, as well-capitalized banks seek to diversify earnings and strengthen their competitive positions. Equity Group and KCB Group continue to derive a significant share of Group performance from their regional operations, while both institutions are pursuing further expansion across Africa. At the same time, higher capital requirements are likely to encourage consolidation as smaller institutions face greater pressure to strengthen their capital positions. We therefore expect continued opportunities for stronger banks to expand through acquisitions and increase scale, both domestically and across the region.
-
Regulation: Regulatory developments will remain an important consideration for the banking sector, particularly following the Central Bank of Kenya’s release of draft revised Prudential Guidelines, Risk Management Guidelines, Guidance Notes and the Domestic Systemically Important Banks (D-SIBs) Framework in September 2026. The proposed frameworks seek to strengthen the resilience of the banking sector and align Kenya’s supervisory framework with international standards and emerging risks. The D-SIB framework would introduce enhanced regulatory oversight and higher loss-absorbing capacity requirements for banks designated as systemically important. We expect the proposed reforms to have implications for banks’ capital planning, risk management and compliance requirements, while potentially supporting further consolidation as smaller institutions seek to strengthen their capital positions.
-
Geopolitical Tensions: Persistent geopolitical tensions in the Middle East and the fragility of ceasefire arrangements could continue to pose risks to the banking sector through higher oil prices and broader external shocks. A sustained increase in energy costs could reignite inflationary pressures, weaken household and corporate disposable incomes, increase debt-servicing burdens and consequently elevate credit risk. Prolonged geopolitical uncertainty could also weigh on economic activity and investor sentiment, resulting in more cautious lending and slower credit growth. In addition, renewed pressure on the Kenya Shilling could increase the cost of servicing foreign currency liabilities and heighten foreign exchange-related risks for unhedged borrowers, potentially slowing the improvement in asset quality.
Section IV: Brief Summary and Ranking of the Listed Banks:
As per our analysis of the banking sector from a franchise value and a future growth opportunity perspective, we carried out a comprehensive ranking of the listed banks. For the franchise value ranking, we included the earnings and growth metrics as well as the operating metrics shown in the table below in order to carry out a comprehensive review of the banks:
|
Cytonn Report: Listed Banks Earnings, Growth and Operating Metrics H1’2026 |
||||||||
|
Bank |
Loan to Deposit Ratio |
Cost to Income (With LLP) |
Return on Average Capital Employed |
Deposits/ Branch (bn) |
Gross NPL Ratio |
NPL Coverage |
Tangible Common Ratio |
Non-Funded Income/Revenue |
|
Absa Bank |
86.7% |
51.7% |
23.3% |
4.3 |
10.2% |
69.1% |
17.3% |
27.9% |
|
Coop Bank |
74.4% |
53.7% |
20.6% |
2.8 |
14.2% |
68.9% |
19.2% |
32.2% |
|
KCB Group |
72.5% |
54.4% |
22.0% |
3.7 |
14.5% |
78.8% |
14.9% |
31.5% |
|
Stanbic Bank |
68.1% |
53.1% |
20.7% |
14.2 |
7.3% |
86.6% |
11.5% |
23.8% |
|
I&M Holdings |
66.1% |
61.0% |
18.0% |
4.2 |
8.4% |
74.8% |
15.2% |
25.7% |
|
HFCB Group |
63.8% |
67.8% |
10.3% |
3.1 |
21.4% |
80.5% |
19.0% |
30.5% |
|
NCBA Group |
62.7% |
60.7% |
19.8% |
4.5 |
10.8% |
67.4% |
17.0% |
38.3% |
|
Equity Bank |
61.7% |
53.8% |
29.1% |
3.9 |
10.2% |
71.6% |
14.6% |
44.5% |
|
Family Bank |
61.6% |
61.4% |
23.3% |
1.9 |
14.7% |
124.0% |
13.9% |
19.0% |
|
DTBK |
61.4% |
62.7% |
13.1% |
3.4 |
12.2% |
58.2% |
14.9% |
24.4% |
|
SCBK |
54.7% |
52.4% |
17.1% |
16.3 |
5.1% |
84.3% |
14.1% |
39.1% |
|
Weighted Average H1'2026 |
68.0% |
55.4% |
22.2% |
5.4 |
11.1% |
75.3% |
15.5% |
33.7% |
|
Market cap weighted as at 18/09/2026 |
||||||||
The overall ranking was based on a weighted average ranking of Franchise value (accounting for 60.0%) and intrinsic value (accounting for 40.0%). The Intrinsic Valuation is computed through a combination of valuation techniques, with a weighting of 40.0% on Discounted Cash-flow Methods, 35.0% on Residual Income, and 25.0% on Relative Valuation, while the Franchise ranking is based on a bank’s operating metrics, meant to assess efficiency, asset quality, diversification, and profitability, among other metrics. The overall H1’2026 ranking is as shown in the table below:
|
Cytonn Report: Listed Banks H1’2026 Rankings |
|||||
|
Bank |
Franchise Value Rank |
Intrinsic Value Rank |
Weighted Rank Score |
H1'2025 Rank |
H1'2026 Rank |
|
KCB Group |
2 |
1 |
1.6 |
3 |
1 |
|
Coop Bank |
3 |
2 |
2.6 |
6 |
2 |
|
Equity Bank |
1 |
8 |
3.8 |
9 |
3 |
|
Absa Bank |
4 |
6 |
4.8 |
2 |
4 |
|
NCBA Group |
5 |
7 |
5.8 |
5 |
5 |
|
Family Bank |
9 |
3 |
6.6 |
- |
6 |
|
I&M Holdings |
6 |
9 |
7.2 |
4 |
7 |
|
HFCB Group |
10 |
4 |
7.6 |
10 |
8 |
|
SCBK |
6 |
11 |
8.0 |
1 |
9 |
|
DTBK |
11 |
5 |
8.6 |
6 |
10 |
|
Stanbic Bank |
8 |
10 |
8.8 |
8 |
11 |
Major Take-outs from the H1’2026 Ranking are:
-
KCB Group climbed up to position 1 in H1’2026 from position 3 in H1’2025, mainly supported by strong franchise value score and intrinsic value score, attributable to decrease in the cost to income ratio by 4.2% points to 54.4% from 58.6% in H1’2025, coupled with the 3.3% points decrease in gross NPL ratio to 14.5% in H1’2026 from 17.9% in H1’2025.
-
Equity was the most improved as it climbed up 6 places to position 3 from position 9 in H1’2025, mainly supported by improved franchise value score and intrinsic value score. This was mainly supported by 3.7% points increase in non-funded income to operating income ratio to 44.5% from 40.8% in H1’2025, 4.8% points decrease in cost to income ratio to 53.8% to 58.5% in H1’2025 coupled with 6.3% points increase in return on average equity to 29.1% from 22.8% in H1’2025
-
Standard Chartered Bank Kenya dropped 8 places to rank at position 9, down from position 1 in H1’2025, attributable a decline in intrinsic value score and the franchise value score mainly on the back of 1.8% points increase in cost to income (with LLP) to 52.4% from 50.6% in H1’2025 and 10.4% points decrease in return on average equity to 17.1% from 27.5% in H1’2025.
For more information, see our Cytonn H1’2026 Listed Banking Sector Review full report.
Disclaimer: The views expressed in this publication are those of the writers where particulars are not warranted. This publication, which is in compliance with Section 2 of the Capital Markets Authority Act Cap 485A, is meant for general information only and is not a warranty, representation, advice, or solicitation of any nature. Readers are advised in all circumstances to seek the advice of a registered investment advisor.

- Talk to us
- Kenya
- P.O Box 20695 - 00200, Nairobi, Kenya
- Cell +254709101200
- Tel +254709101200
- WhatsApp +254741676635
- United States
- +254709101200
- DOWNLOAD OUR APP
-


- Kenya
- 8th Floor, Pinetree Plaza, Kaburu Drive, Ngong Road, Nairobi, Kenya
- USA
- Suite 1150, 1775 Eye Street NW, USA, Washington DC 20006, USA
- Investments
- High Yield
- Private Equity
- Real Estate
- Real Estate
- RiverRun Estates
- Cytonn Towers
- The Ridge
- Taraji Heights
- The Alma