
Kenya’s Real Estate Investment Trusts (REITs) H1’2026 Performance Report, & Cytonn Weekly #33.2026
By Research Team, Aug 23, 2026
Executive Summary
Fixed Income
This week, T-bills were oversubscribed for the third consecutive week, with the overall subscription rate coming in at 255.9% higher than the subscription rate of 145.7%, recorded the previous week. Investors’ preference for the shorter 91-day paper persisted, with the paper receiving bids worth Kshs 37.7 bn against the offered Kshs 18.2 bn, translating to a subscription rate of 470.9%, higher than the subscription rate of 228.0%, recorded the previous week. The subscription rate for the 182-day paper increased significantly to 185.7% from 89.9% recorded the previous week, while that of the 364-day paper increased to 154.1% from 135.6% recorded the previous week. The government accepted a total of Kshs 57.6 bn worth of bids out of Kshs 71.7 bn bids received, translating to an acceptance rate of 80.4%. The yields on the government papers were on a downward trajectory with the yields on the 91-day paper decreasing the most by 0.03 bps to 8.77% from 8.78 % recorded the previous week. The yields on the 182-day paper decreased by 0.01 bps to 8.99 % from 9.00% while that of the 364-day paper decreased marginally by 0.09 bps to remain relatively unchanged at 9.04% recorded the previous week;
The National Treasury gazetted the revenue and net expenditures for the first month of FY’2026/2027, ending 31st July 2026, highlighting that the total revenue collected as at the end of July 2026 amounted to Kshs 229.1 bn, equivalent to 7.7% of the original estimates of Kshs 2,985.7 bn for FY’2026/2027 and is 92.1% of the prorated estimates of Kshs 248.8 bn;
We are projecting the y/y inflation rate for August 2026 will remain within the range of 6.3% - 6.5%;
Equities
During the week, the equities market was on an upward trajectory, with NSE 10, NSE 25, NASI and NSE 20 gaining by 3.2%, 3.0%, 2.8% and 2.4% respectively taking the YTD performance to gains of 35.2%, 34.8%, 33.6% and 30.6% respectively for NSE 10, NSE 20, NSE 25 and NASI respectively. The week-on-week equities market performance was mainly driven by gains recorded by large cap stocks such as DTB-K, BAT, and KCB of 12.5%, 7.8% and 7.2% respectively. However, the performance was weighed down by losses recorded by large cap stocks such as Co-operative, Standard Chartered and Stanbic Bank of 5.1%, 2.4% and 1.3% respectively;
During the week, the banking sector index increased by 2.9% to 284.5 from the 276.6 recorded the previous week. This is attributable to gains recorded by large cap stocks such as DTB-K, KCB, and Equity of 12.5%, 7.2% and 4.5% respectively. However, the performance was weighed down by losses recorded by large cap stocks such as Co-operative, Standard Chartered and Stanbic of 5.1%, 2.4% and 1.3% respectively;
During the week, Family Bank released their H1’2026 financial results, recording a 61.8% increase in profit after tax to Kshs 3.7 bn in H1’2026, from Kshs 2.3 bn in H1’2025;
During the week, DTB-K Bank released their H1’2026 financial results, recording a 35.8% increase in profit after tax to Kshs 7.3 bn in H1’2026, from Kshs 5.4 bn in H1’2025;
During the week, Equity Group released their H1’2026 financial results, recording a 31.5% increase in profit after tax to Kshs 45.5 bn in H1’2026, from Kshs 34.6 bn in H1’2025;
During the week, Absa Bank Kenya released their H1’2026 financial results, recording a 9.8% decrease in profit after tax to Kshs 10.5 bn in H1’2026, from Kshs 11.7 bn in H1’2025;
During the week, Standard Chartered Bank released their H1’2026 financial results, recording a 16.8% decrease in profit after tax to Kshs 6.7 bn in H1’2026, from Kshs 8.1 bn in H1’2025;
During the week, Liberty Kenya Holdings released their H1’2026 results, highlighting that the Profit After Tax decreased by 46.0% to Kshs 0.2 bn, from the Kshs 0.4 bn recorded in H1’2025;
During the week, Absa Group Limited announced the results of its tender offer to buy up to 895,989,600 additional shares in Absa Bank Kenya PLC, which closed on 11th August 2026. Out of the shares offered for sale by shareholders, Absa Group accepted 189,380,644 shares, at a price of Kshs 34.50 per share;
Real Estate
During the week, , the Kenya National Bureau of Statistics (KNBS) released the Leading Economic Indicators (LEI) June 2026 Report, which highlighted the performance of major economic indicators;
During the week, the Kenya Revenue Authority (KRA) moved to strengthen enforcement of the Affordable Housing Levy following amendments introduced under the Finance Act 2026. The changes give KRA clearer powers to recover unpaid or unremitted housing levy, including through measures such as bank account recovery, asset seizures and PIN deactivation;
During the week, the National Social Security Fund (NSSF) announced plans to unlock its approximately 1,000-acre landholding in Katani, Mavoko, Machakos County through the development of a mixed-use city. The fund is seeking a development partner to undertake feasibility studies, prepare a master plan and implement an initial phase of the project. Unlike its earlier proposals that largely centered on housing, the current concept brings together residential, commercial, industrial, institutional, warehousing and hospitality uses, creating a broader development model for the property;
On the Unquoted Securities Platform Acorn D-REIT and I-REIT traded at Kshs 29.7 and Kshs 24.4 per unit, respectively, as per the last updated data on 14th August 2026. The performance represented a 48.5% and 22.0% gain for the D-REIT and I-REIT, respectively, from the Kshs 20.0 inception price. Additionally, ILAM Fahari I-REIT traded at Kshs 13.8 per share as of 14th August 2026, representing a 31.0% loss from the Kshs 20.0 inception price;
Digital Payments Weekly Highlights
During the week, the Central Bank of Kenya (CBK) highlighted the operational capability for retail investors to settle successful government securities bids of up to Kshs 250,000.0 directly via M-Pesa through its DhowCSD mobile application and online portal;
During the week, American Express Company declared a quarterly dividend on its 6.5% Fixed Rate Reset Noncumulative Preferred Shares, Series E, of USD 5,912.5 per share (equivalent to USD 5.9 per Depositary Share), payable on September 15, 2026, to shareholders of record as of September 1, 2026;
During the week, Mastercard Incorporated, in collaboration with SNB Group, launched the SNB World Legend Mastercard in Saudi Arabia, becoming the first financial institution in the Middle East and North Africa (MENA) region to introduce Mastercard’s most prestigious tier for Private Banking clients;
During the week, PayPal Holdings, Inc. announced new system integrations with higher education platforms Illumia, Nelnet Campus Commerce, and TouchNet, enabling students and families to pay tuition and fees directly via PayPal and Venmo;
The digital payment companies we track (AXP, Visa, Mastercard, Circle, Block, PayPal, Coinbase, Global Payments, Wise and JPMorgan Chase) are currently trading at an average P/E of 25.1x, implying that investors are pricing in strong future earnings growth expectations and are willing to pay a significant premium for current earnings, which may also suggest that valuations may be stretched relative to near-term fundamentals;Bottom of FormBottom of Form
Focus of the Week
Following the release of the H1’2026 results by all five authorized Real Estate Investment Trusts (REITs) in Kenya, Cytonn Real Estate Research Team undertook an analysis of the financial performance of the REITs and identified the key factors that shaped the performance of the sector. The report will discuss the background and structure of REITs in Kenya, and assess the financial performance of the current REITs in the market during H1’2026 in terms of operational metrics, profitability metrics, leverage ratios, liquidity ratios and valuation metrics;
Investment Updates:
- Weekly Rates: Cytonn Money Market Fund closed the week at a yield of 11.08% p.a. To invest, dial *809# or download the Cytonn App from Google Play store here or from the Appstore here;
- We continue to offer Wealth Management Training every Tuesday, from 7:00 pm to 8:00 pm. The training aims to grow financial literacy among the general public. To register for any of our Wealth Management Trainings, click here. If interested in our Private Wealth Management Training for your employees or investment group, please get in touch with us through wmt@cytonn.com;
- Cytonn Asset Managers Limited (CAML) continues to offer pension products to meet the needs of both individual clients who want to save for their retirement during their working years and Institutional clients that want to contribute on behalf of their employees to help them build their retirement pot. To more about our pension schemes, kindly get in touch with us through pensions@cytonn.com;
Hospitality Updates:
- We currently have promotions for Staycations. Visit com/offers for details or email us at sales@cysuites.com;
Money Markets, T-Bills Primary Auction:
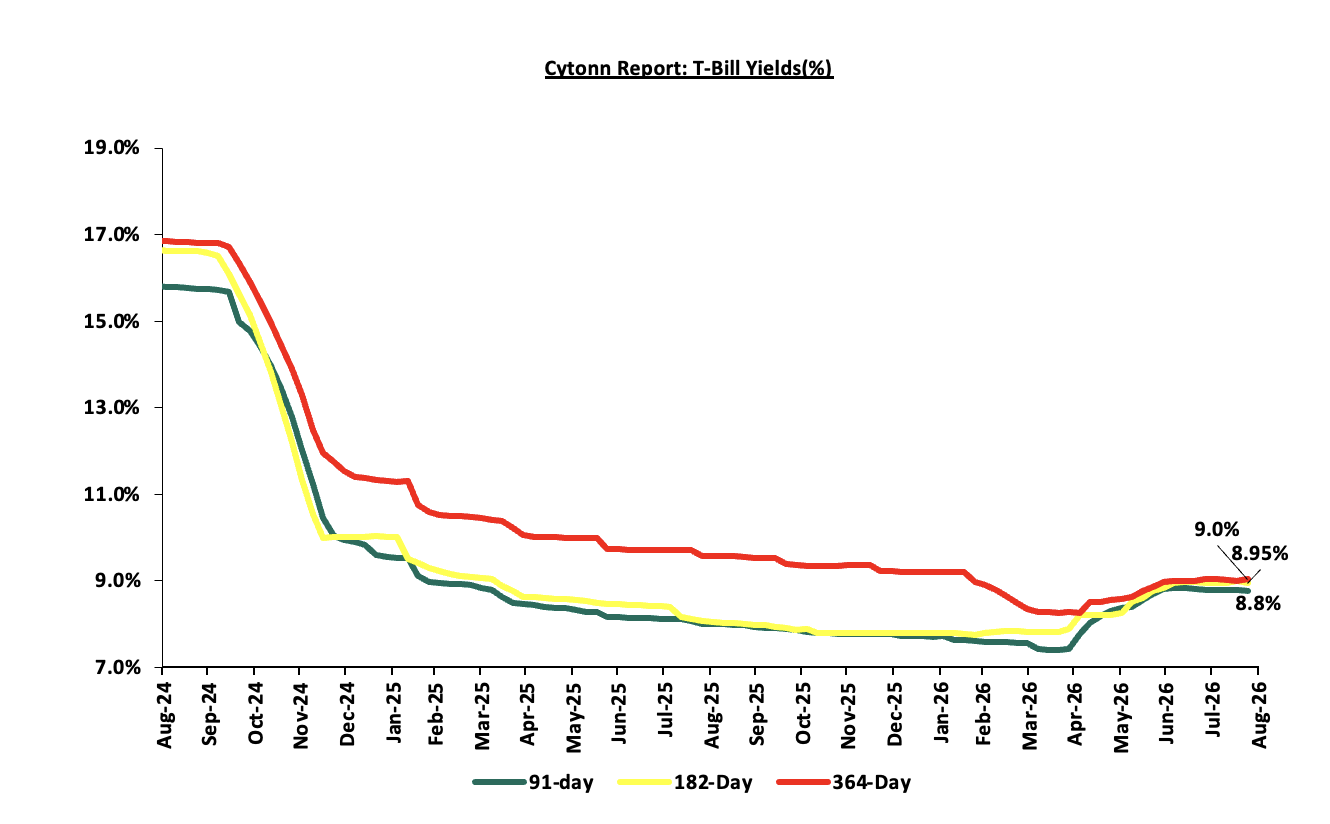
This week, T-bills were oversubscribed for the third consecutive week, with the overall subscription rate coming in at 255.9% higher than the subscription rate of 145.7%, recorded the previous week. Investors’ preference for the shorter 91-day paper persisted, with the paper receiving bids worth Kshs 37.7 bn against the offered Kshs 18.2 bn, translating to a subscription rate of 470.9%, higher than the subscription rate of 228.0%, recorded the previous week. The subscription rate for the 182-day paper Increased significantly to 185.7% from 89.9% recorded the previous week, while that of the 364-day paper increased to 154.1% from 135.6% recorded the previous week. The government accepted a total of Kshs 57.6 bn worth of bids out of Kshs 71.7 bn bids received, translating to an acceptance rate of 80.4%. The yields on the government papers were on a downward trajectory with the yields on the 91-day paper decreasing the most by 0.03 bps to 8.77% from 8.78 % recorded the previous week. The yields on the 182-day paper decreased by 0.02 bps to 8.99 % from 9.00% while that of the 364-day paper decreased marginally by 0.09 bps to remain relatively unchanged at 9.04% recorded the previous week.
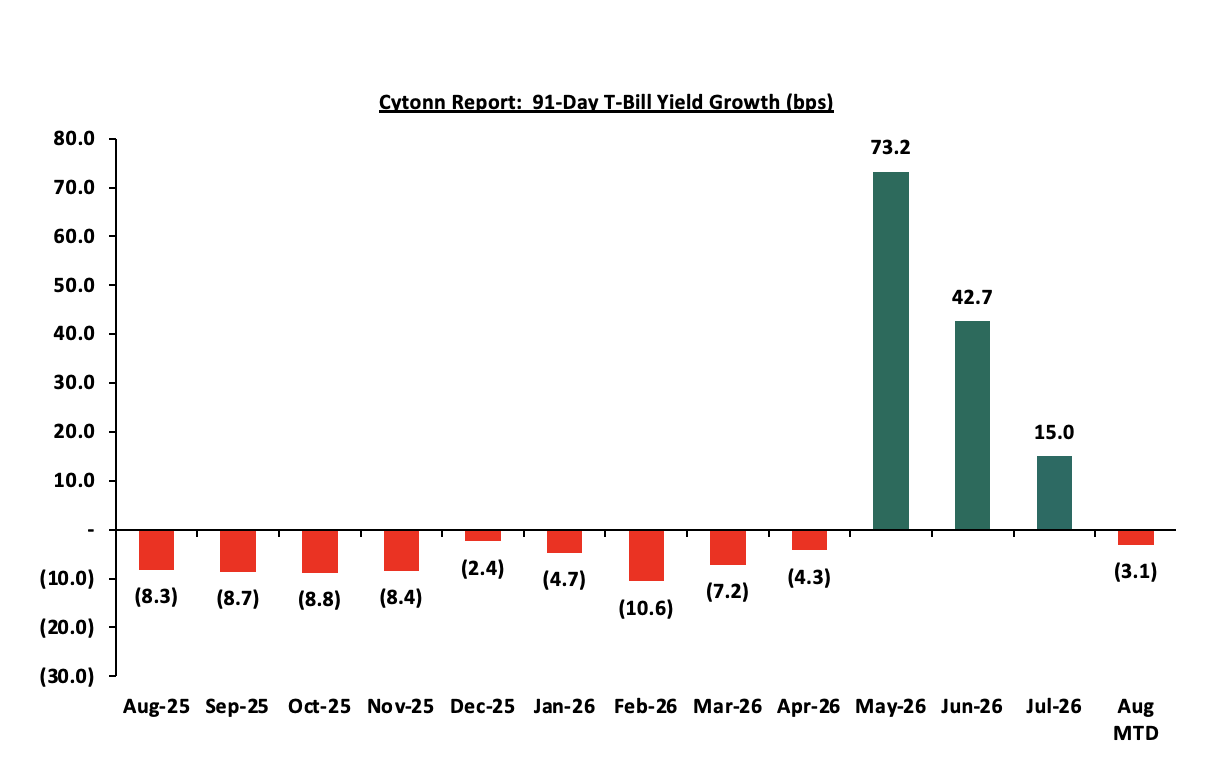
The chart below shows the yield growth rate for the 91-day paper from August 2025 to date:
The chart below shows the performance of the 91-day, 182-day and 364-day papers from August 2024 to August 2026:
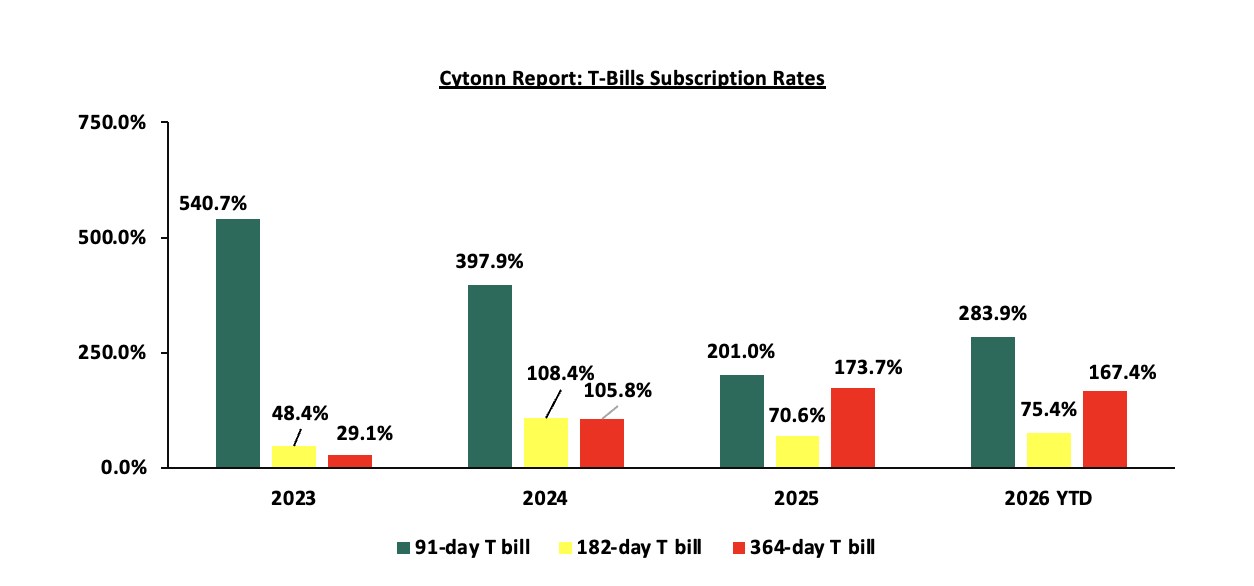
The chart below compares the overall average T-bill subscription rates obtained in 2023, 2024, 2025 and 2026 Year-to-date (YTD):
Money Market Performance:
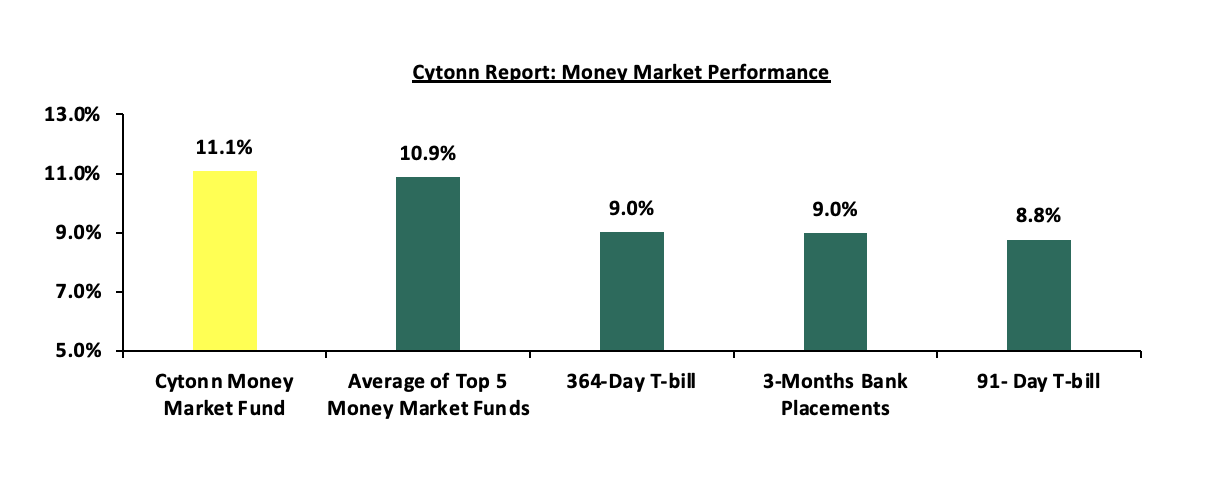
In the money markets, 3-month bank placements ended the week at 9.0% (based on rates offered by various banks). The yields on the government papers were on a downward trajectory with the yields on the 91-day paper decreasing the most by 0.3 bps to 8.77% from 8.78% recorded the previous week, while that of the 364-day paper decreased marginally by 0.09 bps to remain relatively unchanged at 9.04% recorded the previous week. The yield on the Cytonn Money Market Fund remain unchanged at 11.08% recorded the previous week, while the average yields on Top 5 Money Market Funds increased by 6.2 bps to 10.9% from 10.8% recorded the previous week.
The table below shows the Money Market Fund Yields for Kenyan Fund Managers as published on 21st August 2026:
|
Money Market Fund Yield for Fund Managers as published on 21st August 2026 |
||
|
Rank |
Fund Manager |
Effective Annual Rate |
|
1 |
Cytonn Money Market Fund (Dial *809# or download Cytonn App) |
11.1% |
|
2 |
Faulu Money Market Fund |
11.0% |
|
3 |
Nabo Africa Money Market Fund |
10.9% |
|
4 |
Etica Money Market Fund |
10.8% |
|
5 |
Lofty-Corban Money Market Fund |
10.7% |
|
6 |
Enwealth Money Market Fund |
10.6% |
|
7 |
Arvocap Money Market Fund |
10.6% |
|
8 |
Madison Money Market Fund |
10.6% |
|
9 |
Kuza Money Market Fund |
10.6% |
|
10 |
Ndovu Money Market Fund |
10.5% |
|
11 |
Globetec Money Market Fund |
10.4% |
|
12 |
Old Mutual Money Market Fund |
10.3% |
|
13 |
Rejesha Money Market Fund |
10.3% |
|
14 |
Jubilee Money Market Fund |
10.2% |
|
15 |
Gulfcap Money Market Fund |
10.1% |
|
16 |
British-American Money Market Fund |
9.8% |
|
17 |
Orient Kasha Money Market Fund |
9.8% |
|
18 |
SanlamAllianz Money Market Fund |
9.6% |
|
19 |
GenAfrica Money Market Fund |
9.4% |
|
20 |
Apollo Money Market Fund |
9.3% |
|
21 |
CPF Money Market Fund |
9.2% |
|
22 |
Dry Associates Money Market Fund |
8.9% |
|
23 |
KCB Money Market Fund |
8.7% |
|
24 |
Genghis Money Market Fund |
8.5% |
|
25 |
CIC Money Market Fund |
8.3% |
|
26 |
Mayfair Money Market Fund |
8.1% |
|
27 |
AA Kenya Shillings Fund |
8.1% |
|
28 |
ICEA Lion Money Market Fund |
8.0% |
|
29 |
Mali Money Market Fund |
8.0% |
|
30 |
Co-op Money Market Fund |
8.0% |
|
31 |
Absa Shilling Money Market Fund |
7.3% |
|
32 |
Ziidi Money Market Fund |
6.0% |
|
33 |
Stanbic Money Market Fund |
5.3% |
|
34 |
Equity Money Market Fund |
|
Source: Business Daily
Liquidity:
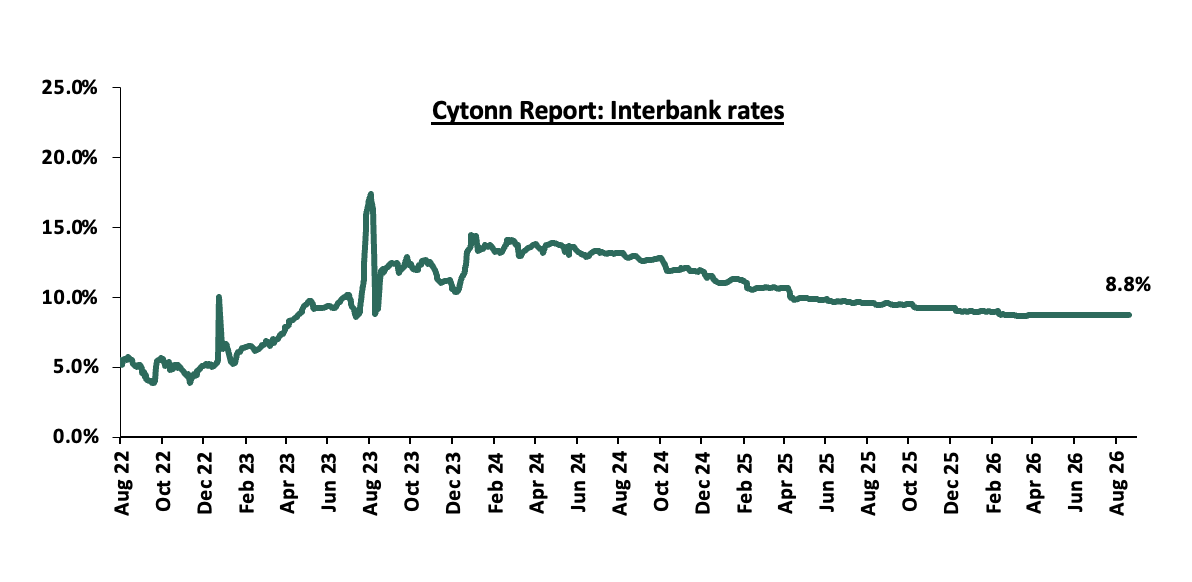
During the week, liquidity in the money markets tightened with the average interbank rate increasing by 0.1 bps relatively unchanged at 8.8% recorded last week, partly attributable to government payments that offset tax remittances. The average interbank volumes traded decreased by 6.2% to Kshs 17.6 bn from Kshs 18.8 bn recorded the previous week. The chart below shows the interbank rates in the market over the years:
Kenya Eurobonds:
During the week, the yields on the Eurobonds were on an upward trajectory with the yield on the 13-year Eurobond issued in 2021, increasing the most by 16.9 bps to 8.1% from 7.9% recorded the previous week. The table below shows the summary performance of the Kenyan Eurobonds as of 20th August 2026:
-
Cytonn Report: Kenya Eurobonds Performance
2018
2019
2021
2024
Date
10-year issue
30-year issue
12-year issue
13-year issue
7-year issue
02-Jan-26
6.1%
8.8%
7.2%
7.8%
7.1%
03-Aug-26
7.0%
9.0%
8.0%
8.5%
7.7%
13-Aug-26
6.6%
8.9%
7.5%
7.9%
7.3%
14-Aug-26
6.6%
8.9%
7.5%
8.0%
7.3%
17-Aug-26
6.6%
9.0%
7.6%
8.0%
7.4%
18-Aug-26
6.7%
9.0%
7.6%
8.1%
7.4%
19-Aug-26
6.6%
9.0%
7.5%
8.0%
7.4%
20-Aug-26
6.6%
9.0%
7.6%
8.1%
7.4%
Weekly Change
0.0%
0.2%
0.1%
0.2%
0.1%
MTD Change
(0.4%)
0.0%
(0.4%)
(0.4%)
(0.4%)
YTD Change
0.5%
0.2%
0.4%
0.3%
0.3%
Source: Central Bank of Kenya (CBK) and National Treasury
Kenya Shilling:
During the week, the Kenya Shilling depreciated against the US Dollar by 18.6 bps to Kshs 129.5 from Kshs 129.2 recorded the previous week. On a year-to-date basis, the shilling has depreciated by 32.5 bps against the dollar, as compared to the 22.9 bps appreciation recorded in 2025.
We expect the shilling to be supported by:
-
Diaspora remittances standing at a cumulative USD 4,986.9 mn in the twelve months to July 2026, slightly lower than the USD 5,079.9 mn recorded over the same period in 2025. These have continued to cushion the shilling against further depreciation. In the July 2026 diaspora remittances figures, North America remained the largest source of remittances to Kenya accounting for 51.6% in the period,
-
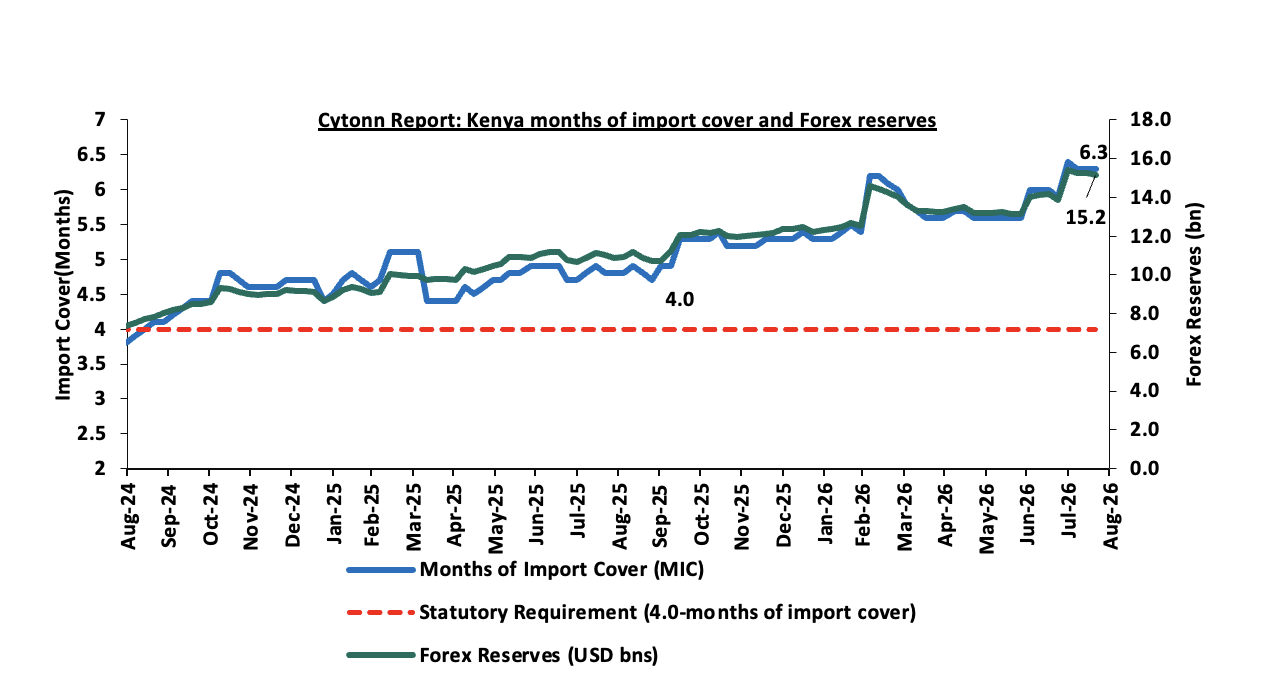
Improved forex reserves currently at USD 15.2 bn (equivalent to 6.3-months of import cover), which is above the statutory requirement of maintaining at least 4.0-months of import cover and above the EAC region’s convergence criteria of 4.5-months of import cover.
The shilling is however expected to remain under pressure in 2026 as a result of:
-
An ever-present current account deficit which widened to 3.0% of GDP in the 12 months to June 2026 compared to 1.9% of GDP in a similar period in 2025 and,
-
The need for government debt servicing, continues to put pressure on forex reserves given that 54.8% of Kenya’s external debt is US Dollar-denominated as of June 2026.
-
Rising geopolitical tensions in the Middle East, which could exert pressure on the shilling through higher global oil prices and increased uncertainty in international markets. Given that Kenya is a net importer of petroleum products, any sustained increase in oil prices would widen the import bill, increase demand for US Dollars, and consequently put depreciation pressure on the shilling
Kenya’s forex reserves decreased marginally by 0.1% during the week to remain relatively unchanged from USD 15.2 bn recorded the previous week, equivalent to 6.3 months of import cover, and above the statutory requirement of maintaining at least 4.0-months of import cover.
The chart below summarizes the evolution of Kenya's months of import cover over from August 2024 to August 2026:
Weekly Highlights
-
Exchequer Highlight July 2026
The National Treasury gazetted the revenue and net expenditures for the first month of FY’2026/2027, ending 31st July 2026, highlighting that the total revenue collected as at the end of July 2026 amounted to Kshs 229.1 bn, equivalent to 7.7% of the original estimates of Kshs 2,985.7 bn for FY’2026/2027 and is 92.1% of the prorated estimates of Kshs 248.8 bn. Below is a summary of the performance:
|
FY'2026/2027 Budget Outturn - As at 31st July 2026 |
|||||
|
Amounts in Kshs billions unless stated otherwise |
|||||
|
Item |
12-months Original Estimates |
Actual Receipts/Release |
Percentage Achieved |
Prorated |
% achieved of the Prorated |
|
Opening Balance |
29.2 |
||||
|
Tax Revenue |
2,858.7 |
195.3 |
6.8% |
238.2 |
82.0% |
|
Non-Tax Revenue |
127.1 |
4.6 |
3.6% |
10.6 |
43.2% |
|
Total Revenue |
2,985.7 |
229.1 |
7.7% |
248.8 |
92.1% |
|
External Loans & Grants |
612.3 |
0.0 |
0.0% |
51.0 |
0.0% |
|
Domestic Borrowings |
1,568.1 |
138.2 |
8.8% |
130.7 |
105.8% |
|
Other Domestic Financing |
11.3 |
0.0 |
0.2% |
0.9 |
2.5% |
|
Total Financing |
2,191.7 |
138.3 |
6.3% |
182.6 |
75.7% |
|
Recurrent Exchequer issues |
1,713.6 |
142.8 |
8.3% |
142.8 |
100.0% |
|
CFS Exchequer Issues |
2,563.0 |
121.6 |
4.7% |
213.6 |
56.9% |
|
Development Expenditure & Net Lending |
473.0 |
29.3 |
6.2% |
39.4 |
74.4% |
|
County Governments + Contingencies |
428.0 |
21.4 |
5.0% |
35.7 |
60.0% |
|
Total Expenditure |
5,177.5 |
315.1 |
6.1% |
431.5 |
73.0% |
|
Fiscal Deficit excluding Grants |
2,191.7 |
86.0 |
3.9% |
182.6 |
47.1% |
|
Total Borrowing |
2,180.5 |
138.2 |
6.3% |
181.7 |
76.1% |
The key take-outs from the release include;
-
Total revenue collected as at the end of July 2026 amounted to Kshs 229.1 bn, equivalent to 7.7% of the original estimates of Kshs 2,985.7 bn for FY’2026/2027 and is 92.1% of the prorated estimates of Kshs 248.8 bn. Cumulatively, tax revenues amounted to Kshs 195.3 bn, equivalent to 6.8% of the original estimates of Kshs 2,858.7 bn and 82.0% of the prorated estimates of Kshs 238.2 bn,
-
Total financing amounted to Kshs 138.3 bn, equivalent to 6.3% of the original estimates of Kshs 2,191.7 bn and is equivalent to 75.7% of the prorated estimates of Kshs 182.6 bn. Additionally, domestic borrowing amounted to Kshs 138.3 bn, equivalent to 8.8% of the original estimates of Kshs 1,568.1 bn and is 105.8% of the prorated estimates of Kshs 130.7 bn.
-
The total expenditure amounted to Kshs 315.1 bn, equivalent to 6.1% of the original estimates of Kshs 5,177.5 bn, and is 73.0% of the prorated target expenditure estimates of Kshs 431.5 bn. Additionally, the net disbursements to recurrent expenditures came in at Kshs 142.8 bn, equivalent to 8.3% of the original estimates of Kshs 1,713.6 bn and are equivalent to 100.0% of the prorated estimates of Kshs 142.8 bn,
-
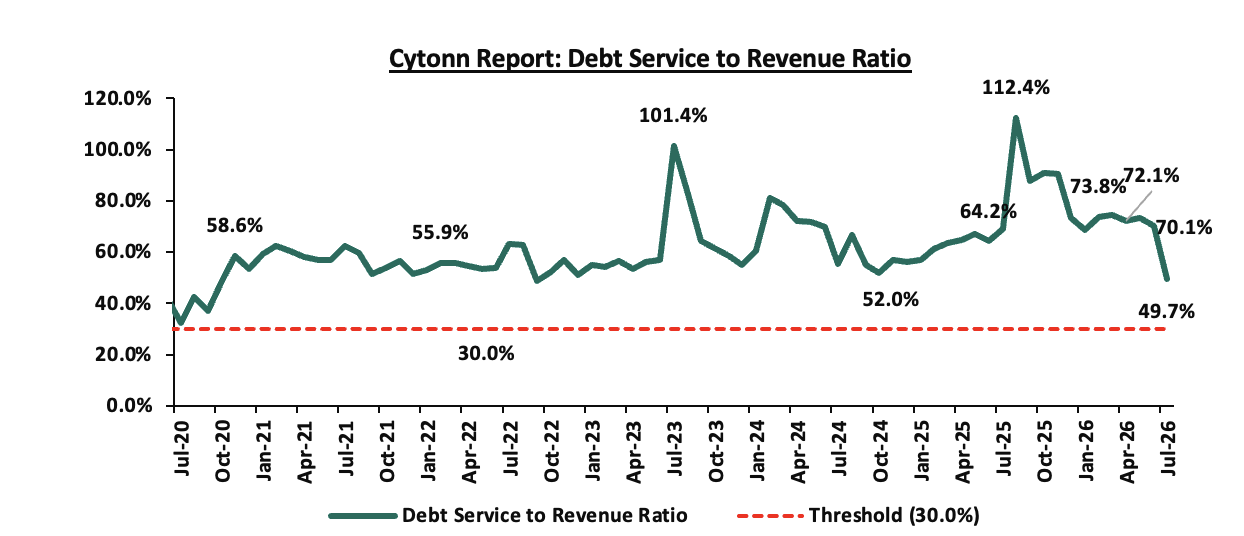
Consolidated Fund Services (CFS) Exchequer issues came in at Kshs 121.6 bn, equivalent to 4.7% of the original estimates of Kshs 2,563.0 bn, and are 56.9% of the prorated amount of Kshs 213.6 bn. The cumulative public debt servicing cost amounted to Kshs 113.8 bn which is 4.9% of the original estimates of Kshs 2,315.9 bn and is 58.9% of the prorated estimates of Kshs 193.0 bn. Additionally, the Kshs 113.8 bn debt servicing cost is equivalent to 49.7% of the actual cumulative revenues collected as at the end of July 2026. The chart below shows the debt servicing cost to revenue ratio over the period;
-
Total borrowings as at the end of July 2026 amounted to Kshs 138.2 bn, equivalent to 6.3% of the original estimates of Kshs 2,180.5 bn for FY’2026/2027 and are 76.1% of the prorated estimates of Kshs 181.7 bn. The cumulative Domestic Borrowing of KShs. 1,568.1 comprises of Net Domestic Borrowing KShs. 919.4 and Internal Debt Redemptions (Roll-overs) KShs. 648.8.
-
August 2026 Inflation Projection
We are projecting the y/y inflation rate for August 2026 will remain within the range of 6.3%-6.5%, mainly on the back of:
-
Declining Diesel Prices in August 2026 - The Energy and Petroleum Regulatory Authority (EPRA) reduced the maximum retail price of diesel by Kshs 5.0 per litre, from Kshs 222.9 to Kshs 217.9 in Nairobi, effective from 15 August to 14 September 2026. Super Petrol and Kerosene prices remained unchanged at Kshs 214.0 and Kshs 191.4 per litre, respectively, following Kshs 938.0 mn in Government stabilization support. The reduction in diesel prices likely provides some relief to transport, agriculture, manufacturing and logistics costs, although the impact on the August inflation print is likely to be gradual given that the lower prices only took effect midway through the month.
-
Stable Exchange Rate Conditions - The Kenya Shilling remained broadly stable against the US Dollar during August. The stability of the shilling should help contain the domestic cost of imported fuel, food and other intermediate goods, particularly against a backdrop of elevated global commodity prices.
-
Continued Pause in Rate Cuts -The Monetary Policy Committee maintained the Central Bank Rate (CBR) at 8.75% at its August 2026 meeting. The continued pause in the rate-cutting cycle should help contain demand-side inflationary pressures and anchor inflation expectations. This provides a supportive backdrop for a gradual moderation in inflation, although monetary policy is less effective against the current supply-side pressures arising from food and energy prices.
We, however, expect inflation to face upward pressure from :
-
Rising Super Petrol Landed Costs and Broad-Based International Price Increases - The average landed cost per cubic metre of Super Petrol increased by 7.0% to USD 948.9 in July 2026 from USD 886.9 in June 2026, even as Diesel and Kerosene landed costs declined. Separately, EPRA's international price benchmarks rose across all three products in July 2026, with Super Petrol, Diesel and Kerosene increasing by 8.9%, 13.2% and 11.8%, respectively, from June levels. While these two series are not directly comparable, the broad-based rise in the international benchmark points to building cost pressure in the pipeline that presents an upside risk to fuel prices in subsequent pricing cycles.
-
Rising Electricity Costs in August 2026 - Electricity costs increased in August following EPRA's latest tariff adjustments, with the Fuel Energy Cost Charge rising to Kshs 3.5 per kWh, while the Foreign Exchange Fluctuation Adjustment stood at Kshs1.2 per kWh and the WRMA levy at Kshs 0.015 per kWh. The three adjustments amount to Kshs 4.7 per kWh for August meter readings. This increase adds some pressure to household and business operating costs.
-
Geopolitical Risk to Global Oil Prices - International crude prices climbed to a two-month high above USD 86.1 per barrel this week, rising by 5.7% w/w from USD 82.0, as the unresolved US-Iran standoff over the Strait of Hormuz continues to threaten global supply, adding near-term upside risk on top of the broad-based rise already recorded in international petroleum benchmarks in July. Separately, US-brokered talks with Russian and Ukrainian negotiators opened in Saudi Arabia this week aimed at ending the Russia-Ukraine war; a resolution could ease sanctions on Russian energy exports and pull oil prices lower, but no agreement on territorial terms has been reached, leaving the near-term risk skewed to the upside.
Going forward, we expect inflationary pressures to remain within the CBK's target range of 2.5%-7.5%, with headline inflation projected to range between 6.3%-6.5% in August 2026. This is supported by the CBR holding at 8.75% during the August meeting and a Diesel price cut that eases transport and production costs. This is offset by rising electricity costs following EPRA's August tariff adjustments, a broad-based rise in international petroleum prices in July, and near-term geopolitical risk to global oil prices from the ongoing US-Iran standoff over the Strait of Hormuz. On balance, our August inflation projection stands at 6.3%-6.5%.
Rates in the fixed income market have declined MTD, reversing the recent upward trend. The decline comes despite the CBK's decision to pause its rate-cutting cycle at 8.75%, with inflation remaining elevated at 6.5% but within the CBK's target range. The government is 289.1% ahead of its prorated net domestic borrowing target of Kshs 136.4 bn, having a net borrowing position of Kshs 394.3 bn (inclusive of T-bills). We expect investors to maintain a preference for short to medium-term papers as they monitor the pace of government issuance and the path of inflation before committing further out on the curve, with the yield curve likely to remain under upward pressure rather than stabilize, at least until the inflation trajectory becomes clearer.
Market Performance:
During the week, the equities market was on an upward trajectory, with NSE 10, NSE 25, NASI and NSE 20 gaining by 3.2%, 3.0%, 2.8% and 2.4% respectively taking the YTD performance to gains of 35.2%, 34.8%, 33.6% and 30.6% respectively for NSE 10, NSE 20, NSE 25 and NASI respectively. The week-on-week equities market performance was mainly driven by gains recorded by large cap stocks such as DTB-K, BAT, and KCB of 12.5%, 7.8% and 7.2% respectively. However, the performance was weighed down by losses recorded by large cap stocks such as Co-operative, Standard Chartered and Stanbic Bank of 5.1%, 2.4% and 1.3% respectively;
During the week, the banking sector index increased by 2.9% to 284.5 from the 276.6 recorded the previous week. This is attributable to gains recorded by large cap stocks such as DTB-K, KCB, and Equity of 12.5%, 7.2% and 4.5% respectively. However, the performance was weighed down by losses recorded by large cap stocks such as Co-operative, Standard Chartered and Stanbic of 5.1%, 2.4% and 1.3% respectively;
During the week, equities turnover increased by 219.0% to USD 96.1 mn from USD 30.1 mn recorded the previous week, taking the YTD total turnover to USD 2,767.0 mn. Foreign investors remained net sellers for the sixth consecutive week with a net selling position of USD 12.5 mn, from a net selling position of USD 9.1 mn recorded the previous week, taking the YTD foreign net selling position to USD 129.3 mn, compared to a net selling position of USD 92.9 mn recorded in 2025.
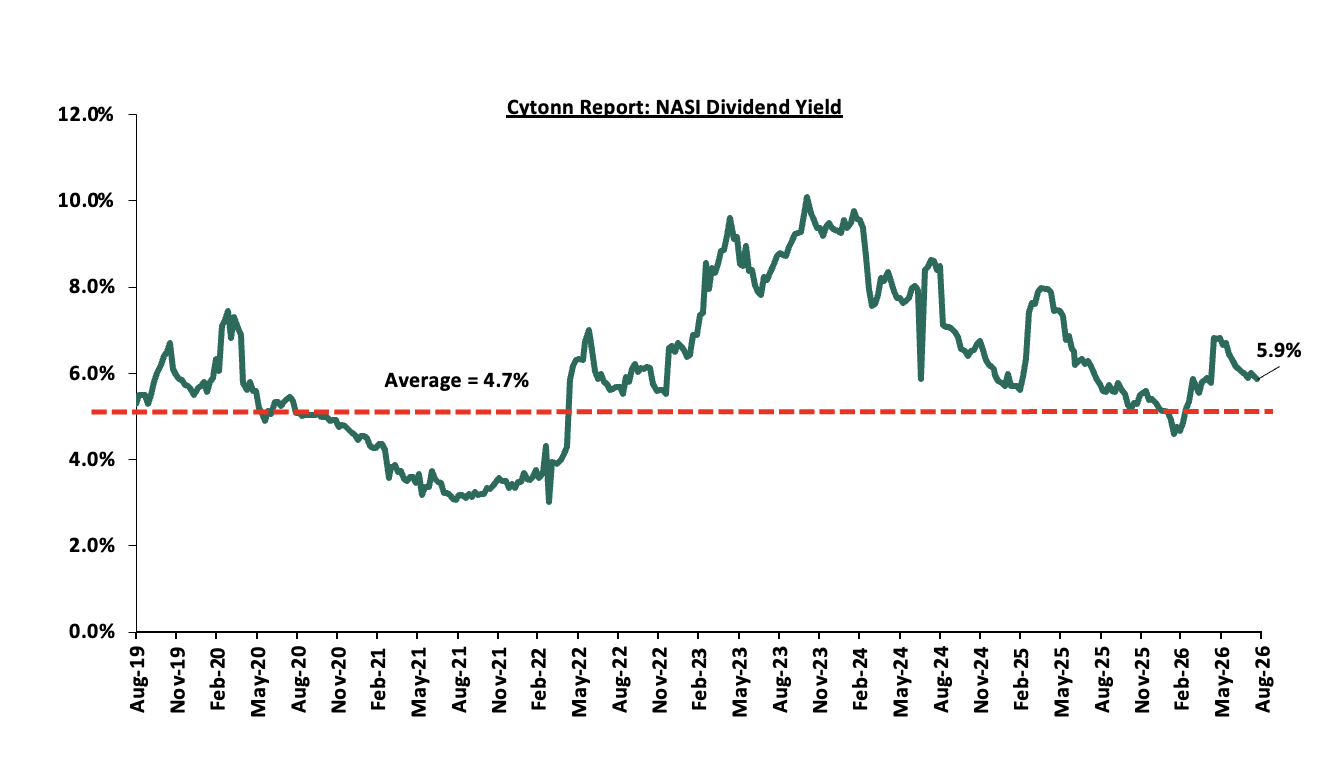
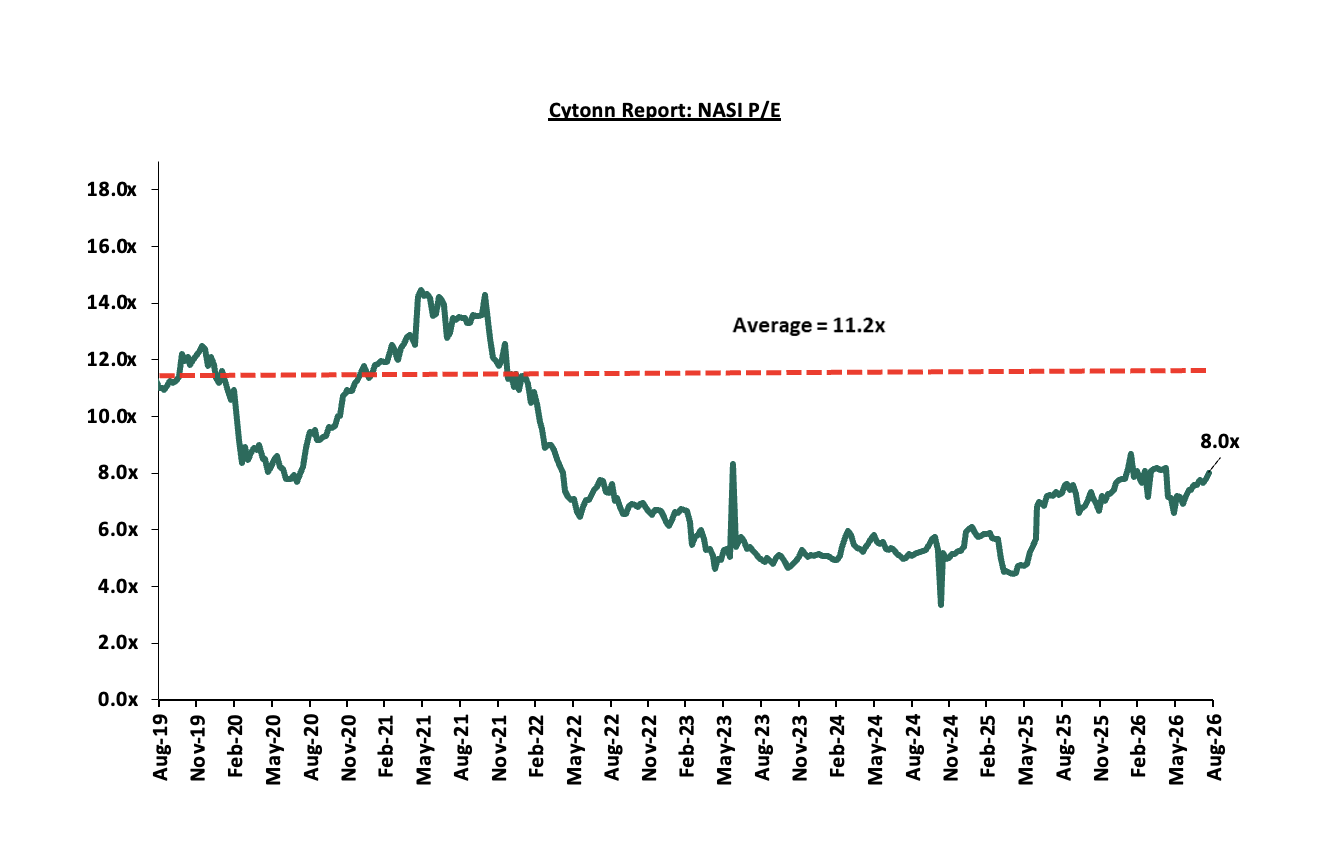
The market is currently trading at a price to earnings ratio (P/E) of 8.0x, 28.4% below the historical average of 11.2x, and a dividend yield of 5.9%, 1.2% points above the historical average of 4.7%. Key to note, NASI’s PEG ratio currently stands at 1.0x, an indication that the market is fairly valued relative to its future growth. A PEG ratio greater than 1.0x indicates the market may be overvalued while a PEG ratio less than 1.0x indicates that the market is undervalued.
The charts below indicate the historical P/E and dividend yields of the market:
Universe of Coverage:
|
Cytonn Report: Equities Universe of Coverage |
|||||||||||
|
Company |
Price as at 14/08/2026 |
Price as at 21/08/2026 |
w/w change |
m/m change |
YTD Change |
Year Open 2026 |
Target Price* |
Dividend Yield |
Upside/ Downside** |
P/TBv Multiple |
Recommendation |
|
Co-op Bank |
38.3 |
36.4 |
(5.1%) |
4.3% |
52.1% |
23.9 |
46.1 |
6.9% |
33.7% |
1.3x |
Buy |
|
NCBA |
91.5 |
90.5 |
(1.1%) |
0.6% |
6.5% |
85.0 |
108.9 |
7.8% |
28.2% |
1.2x |
Buy |
|
KCB Group |
87.3 |
93.5 |
7.2% |
8.7% |
42.2% |
65.8 |
104.4 |
7.5% |
19.1% |
1.0x |
Accumulate |
|
Stanbic Holdings |
278.5 |
275.0 |
(1.3%) |
(5.7%) |
39.1% |
197.8 |
300.3 |
8.1% |
17.3% |
1.6x |
Accumulate |
|
Standard Chartered Bank |
343.8 |
335.5 |
(2.4%) |
(0.7%) |
11.9% |
299.8 |
345.8 |
9.2% |
12.3% |
2.1x |
Accumulate |
|
Equity Group |
89.5 |
93.5 |
4.5% |
7.8% |
39.6% |
67.0 |
98.8 |
6.1% |
11.8% |
1.2x |
Accumulate |
|
ABSA Bank |
34.0 |
35.3 |
3.7% |
5.9% |
41.9% |
24.9 |
36.8 |
5.8% |
10.3% |
1.9x |
Accumulate |
|
Diamond Trust Bank |
154.0 |
173.3 |
12.5% |
13.6% |
51.0% |
114.8 |
180.2 |
5.2% |
9.2% |
0.5x |
Hold |
|
Family Bank |
31.9 |
32.3 |
1.3% |
2.7% |
79.4% |
18.0 |
34.0 |
3.7% |
9.0% |
1.7x |
Hold |
|
CIC Group |
4.7 |
4.7 |
0.6% |
(0.4%) |
4.0% |
4.5 |
5.0 |
2.8% |
7.8% |
1.2x |
Hold |
|
Jubilee Holdings |
399.8 |
411.8 |
3.0% |
9.3% |
27.7% |
322.5 |
407.5 |
3.6% |
2.6% |
0.6x |
Lighten |
|
Britam |
17.7 |
18.2 |
2.8% |
4.6% |
100.9% |
9.1 |
18.5 |
0.0% |
1.4% |
1.4x |
Lighten |
|
I&M Group |
69.8 |
79.0 |
13.3% |
16.6% |
84.6% |
42.8 |
76.0 |
4.7% |
0.9 |
1.3x |
Lighten |
|
*Target Price as per Cytonn Analyst estimates **Upside/ (Downside) is adjusted for Dividend Yield ***Dividend Yield is calculated using FY’2025 Dividends |
|||||||||||
Weekly Highlights
-
Family Bank H1’2026 Financial Performance
During the week, Family Bank released their H1’2026 financial results, recording a 61.8% increase in profit after tax to Kshs 3.7 bn in H1’2026, from Kshs 2.3 bn in H1’2025;
|
Balance Sheet Items |
H1'2025 |
H1'2026 |
y/y change |
|
Government Securities |
60.6 |
94.1 |
55.3% |
|
Net Loans and Advances |
100.9 |
111.1 |
10.1% |
|
Total Assets |
192.9 |
238.9 |
23.9% |
|
Customer Deposits |
149.8 |
180.2 |
20.3% |
|
Deposits/ Branch |
1.5 |
1.9 |
20.3% |
|
Total Liabilities |
167.7 |
205.7 |
22.6% |
|
Shareholders’ Funds |
25.1 |
33.2 |
32.2% |
|
Balance Sheet Ratios |
H1'2025 |
H1'2026 |
% Points change |
|
Loan to Deposit Ratio |
67.4% |
61.6% |
(5.7%) |
|
Government Securities to Deposit ratio |
40.5% |
52.2% |
11.8% |
|
Return on average equity |
18.6% |
23.3% |
4.7% |
|
Return on average assets |
2.3% |
3.1% |
0.8% |
|
Income Statement |
H1'2025 |
H1'2026 |
y/y change |
|
Net Interest Income |
7.0 |
9.8 |
40.7% |
|
Net non-Interest Income |
2.7 |
2.3 |
(14.2%) |
|
Total Operating income |
9.6 |
12.1 |
25.4% |
|
Loan Loss provision |
(0.7) |
(1.0) |
50.4% |
|
Other Operating expenses |
(3.9) |
(3.3) |
(14.9%) |
|
Total Operating expenses |
(6.7) |
(7.4) |
10.7% |
|
Profit before tax |
2.9 |
4.7 |
59.3% |
|
Profit after tax |
2.3 |
3.7 |
61.8% |
|
Core EPS |
1.8 |
2.2 |
27.0% |
|
Income Statement Ratios |
H1'2025 |
H1'2026 |
% points change |
|
Yield from interest-earning assets |
14.5% |
14.4% |
(0.2%) |
|
Cost of funding |
6.6% |
5.0% |
(1.6%) |
|
Net Interest Spread |
7.9% |
9.3% |
1.4% |
|
Net Interest Income as % of operating income |
72.2% |
81.0% |
8.8% |
|
Non-Funded Income as a % of operating income |
27.8% |
19.0% |
(8.8%) |
|
Cost to Income Ratio (CIR) |
69.6% |
61.4% |
(8.2%) |
|
CIR without provisions |
62.7% |
53.1% |
(9.6%) |
|
Cost to Assets |
3.1% |
2.7% |
(0.4%) |
|
Net Interest Margin |
8.2% |
9.7% |
1.5% |
|
Capital Adequacy Ratios |
H1'2025 |
H1'2026 |
% Points Change |
|
Core Capital/Total Liabilities |
11.0% |
14.3% |
3.3% |
|
Minimum Statutory ratio |
8.0% |
8.0% |
|
|
Excess |
3.0% |
6.3% |
3.3% |
|
Core Capital/Total Risk Weighted Assets |
13.3% |
15.7% |
2.4% |
|
Minimum Statutory ratio |
10.5% |
10.5% |
|
|
Excess |
2.8% |
5.2% |
2.4% |
|
Total Capital/Total Risk Weighted Assets |
15.9% |
18.2% |
2.3% |
|
Minimum Statutory ratio |
14.5% |
14.5% |
|
|
Excess |
1.4% |
3.7% |
2.3% |
|
Liquidity Ratio |
66.7% |
60.0% |
(6.7%) |
|
Minimum Statutory ratio |
20.0% |
20.0% |
|
|
Excess |
46.7% |
40.0% |
(6.7%) |
-
Increased earnings - Core earnings per share (EPS) increased by 27.0% to Kshs 2.2 in H1’2026 from Kshs 1.8 in H1’2025, driven by the 25.4% growth in total operating income to Kshs 12.1 bn from Kshs 9.6 bn in H1’2025, but was however weighed down by the 10.7% increase in total operating expenses to Kshs 7.4 bn from Kshs 6.7 bn.
-
Decline in asset quality – The bank’s asset quality declined, with the gross NPL ratio increasing by 1.2% points to 14.7% in H1’2026 from 13.5% in H1’2025, as gross loans increased by 9.2% to Kshs 123.1 bn in H1’2026 from Kshs 112.7 bn in H1’2025, outpaced by the 19.2% increase in gross non-performing loans to Kshs 18.1 bn in H1’2026 from Kshs 15.2 bn in H1’2025.
-
Expanded Balanced sheet - The balance sheet recorded an expansion, with total assets increasing by 23.9% to Kshs 238.9 bn in H1’2026 from Kshs 192.9 bn in H1’2025, driven by a 10.1% increase in net loans and advances to Kshs 111.1 bn in H1’2026 from Kshs 100.9 bn in H1’2025, coupled with a 55.3% growth in government securities holdings to Kshs 94.1 bn in H1’2026 from Kshs 60.6 bn in H1’2025.
-
Increased lending- Customer net loans and advances increased by 10.1% to Kshs 111.1 bn in H1’2026 from Kshs 100.9 bn in H1’2025, reflecting the bank’s continued appetite to expand customer lending.
For a more detailed analysis, please see our Family Bank H1’2026 Earnings Note.
-
DTB-K Bank H1’2026 Financial Performance
During the week, DTB-K Bank released their H1’2026 financial results, recording a 35.8% increase in profit after tax to Kshs 7.3 bn in H1’2026, from Kshs 5.4 bn in H1’2025;
|
Balance Sheet Items |
H1'2025 |
H1'2026 |
y/y change |
|
Government Securities |
148.2 |
169.2 |
14.1% |
|
Net Loans and Advances |
288.5 |
328.0 |
13.7% |
|
Total Assets |
611.5 |
675.1 |
10.4% |
|
Customer Deposits |
483.2 |
534.2 |
10.6% |
|
Deposits/ Branch |
3.1 |
3.4 |
12.0% |
|
Total Liabilities |
510.7 |
560.3 |
9.7% |
|
Shareholders’ Funds |
90.3 |
102.4 |
13.4% |
|
Balance Sheet Ratios |
H1'2025 |
H1'2026 |
% Points change |
|
Loan to Deposit Ratio |
59.7% |
61.4% |
1.7% |
|
Government Securities to Deposit ratio |
30.7% |
31.7% |
1.0% |
|
Return on average equity |
11.3% |
13.1% |
1.8% |
|
Return on average assets |
1.6% |
2.0% |
0.4% |
|
Income Statement |
H1'2025 |
H1'2026 |
y/y change |
|
Net Interest Income |
15.9 |
20.0 |
26.4% |
|
Net non-Interest Income |
6.1 |
6.5 |
6.6% |
|
Total Operating income |
21.9 |
26.5 |
20.9% |
|
Loan Loss provision |
3.2 |
4.4 |
36.5% |
|
Other Operating expenses |
6.3 |
6.5 |
2.3% |
|
Total Operating expenses |
14.8 |
16.6 |
12.6% |
|
Profit before tax |
7.2 |
9.8 |
37.0% |
|
Profit after tax |
5.4 |
7.3 |
35.8% |
|
Core EPS |
19.2 |
26.1 |
35.8% |
|
Income Statement Ratios |
H1'2025 |
H1'2026 |
% points change |
|
Yield from interest-earning assets |
11.7% |
11.6% |
(0.1%) |
|
Cost of funding |
6.1% |
4.8% |
(1.4%) |
|
Net Interest Spread |
5.6% |
6.9% |
1.3% |
|
Net Interest Income as % of operating income |
72.3% |
75.6% |
3.3% |
|
Non-Funded Income as a % of operating income |
27.7% |
24.4% |
(3.3%) |
|
Cost to Income Ratio (CIR) |
67.3% |
62.7% |
(4.6%) |
|
CIR without provisions |
52.5% |
46.0% |
(6.5%) |
|
Cost to Assets |
5.1% |
5.4% |
0.3% |
|
Net Interest Margin |
5.9% |
7.1% |
1.2% |
|
Capital Adequacy Ratios |
H1'2025 |
H1'2026 |
% Points Change |
|
Core Capital/Total Liabilities |
16.3% |
16.4% |
0.1% |
|
Minimum Statutory ratio |
8.0% |
8.0% |
|
|
Excess |
8.3% |
8.4% |
0.1% |
|
Core Capital/Total Risk Weighted Assets |
15.8% |
15.6% |
(0.2%) |
|
Minimum Statutory ratio |
10.5% |
10.5% |
|
|
Excess |
5.3% |
5.1% |
(0.2%) |
|
Total Capital/Total Risk Weighted Assets |
17.3% |
16.6% |
(0.7%) |
|
Minimum Statutory ratio |
14.5% |
14.5% |
|
|
Excess |
2.8% |
2.1% |
(0.7%) |
|
Liquidity Ratio |
56.6% |
56.6% |
0.0% |
|
Minimum Statutory ratio |
20.0% |
20.0% |
|
|
Excess |
36.6% |
36.6% |
0.0% |
Key Take-Outs:
-
Increased earnings - Core earnings per share (EPS) increased by 35.8% to Kshs 26.1 in H1’2026 from Kshs 19.2 in H1’2025, driven by the 20.9% growth in total operating income to Kshs 26.5 bn from Kshs 21.9 bn in H1’2025, but was however weighed down by the 12.6% increase in total operating expenses to Kshs 16.6 bn from Kshs 14.8 bn.
-
Improved asset quality – The bank’s asset quality improved, with the gross NPL ratio declining by 0.7% points to 12.2% in H1’2026 from 12.9% in H1’2025, as gross loans increased by 15.1% to Kshs 353.0 bn in H1’2026 from Kshs 306.7 bn in H1’2025, outpacing the 8.7% increase in gross non-performing loans to Kshs 43.1 bn in H1’2026 from Kshs 39.6 bn in H1’2025.
-
Expanded Balanced sheet - The balance sheet recorded an expansion, with total assets increasing by 10.4% to Kshs 675.1 bn in H1’2026 from Kshs 611.5 bn in H1’2025, driven by a 13.7% increase in net loans and advances to Kshs 328.0 bn in H1’2026 from Kshs 288.5 bn in H1’2025, coupled with a 14.1% growth in government securities holdings to Kshs 169.2 bn in H1’2026 from Kshs 148.2 bn in H1’2025.
-
Increased lending- Customer net loans and advances increased by 13.7% to Kshs 328.0 bn in H1’2026 from Kshs 288.5 bn in H1’2025, reflecting the bank’s continued appetite to expand customer lending.
For a more detailed analysis, please see our DTB-K Bank H1’2026 Earnings Note
-
Equity Group H1’2026 Financial Performance
During the week, Equity Group released their H1’2026 financial results, recording a 31.5% increase in profit after tax to Kshs 45.5 bn in H1’2026, from Kshs 34.6 bn in H1’2025;
|
Balance Sheet Items |
H1’2025 |
H1’2026 |
y/y change |
|
Government Securities |
321.2 |
342.7 |
6.7% |
|
Net Loans and Advances |
825.1 |
981.0 |
18.9% |
|
Total Assets |
1,798.9 |
2,155.5 |
19.8% |
|
Customer Deposits |
1309.3 |
1589.4 |
21.4% |
|
Deposits per branch |
3.3 |
3.9 |
18.4% |
|
Total Liabilities |
1,522.9 |
1,805.2 |
18.5% |
|
Shareholders’ Funds |
261.9 |
332.0 |
26.8% |
|
Balance Sheet Ratios |
H1’2025 |
H1’2026 |
% points change |
|
Loan to Deposit Ratio |
63.0% |
61.7% |
(1.3%) |
|
Government Securities to Deposits |
24.5% |
21.6% |
(3.0%) |
|
Return on average equity |
22.8% |
29.1% |
6.3% |
|
Return on average assets |
3.0% |
4.4% |
1.3% |
|
Income Statement |
H1’2025 |
H1’2026 |
y/y change |
|
Net Interest Income |
59.3 |
69.3 |
16.8% |
|
Net non-Interest Income |
40.9 |
55.6 |
35.9% |
|
Total Operating income |
100.2 |
124.9 |
24.6% |
|
Loan Loss provision |
(6.9) |
(6.5) |
(6.1%) |
|
Total Operating expenses |
(58.7) |
(67.1) |
14.4% |
|
Profit before tax |
41.5 |
57.8 |
39.0% |
|
Profit after tax |
34.6 |
45.5 |
31.5% |
|
Core EPS |
8.8 |
11.6 |
31.5% |
|
Income Statement Ratios |
H1'2025 |
H1'2026 |
% points change |
|
Yield from interest-earning assets |
11.1% |
10.3% |
(0.8%) |
|
Cost of funding |
4.0% |
2.8% |
(1.1%) |
|
Cost of risk |
6.9% |
5.2% |
(1.7%) |
|
Net Interest Margin |
7.5% |
6.7% |
(0.8%) |
|
Net Interest Income as % of operating income |
59.2% |
55.5% |
(3.7%) |
|
Non-Funded Income as a % of operating income |
40.8% |
44.5% |
3.7% |
|
Cost to Income Ratio |
58.5% |
53.8% |
(4.8%) |
|
CIR without LLP |
51.7% |
48.6% |
(3.1%) |
|
Cost to Assets |
2.9% |
2.8% |
(0.1%) |
|
Capital Adequacy Ratios |
H1'2025 |
H1'2026 |
% Points Change |
|
Core Capital/Total Liabilities |
18.9% |
19.0% |
0.1% |
|
Minimum Statutory ratio |
8.0% |
8.0% |
0.0% |
|
Excess |
10.9% |
11.0% |
0.1% |
|
Core Capital/Total Risk Weighted Assets |
16.5% |
17.3% |
0.8% |
|
Minimum Statutory ratio |
10.5% |
10.5% |
0.0% |
|
Excess |
6.0% |
6.8% |
0.8% |
|
Total Capital/Total Risk Weighted Assets |
18.1% |
18.7% |
0.6% |
|
Minimum Statutory ratio |
14.5% |
14.5% |
0.0% |
|
Excess |
3.6% |
4.2% |
0.6% |
|
Liquidity Ratio |
58.5% |
60.9% |
2.4% |
|
Minimum Statutory ratio |
20.0% |
20.0% |
0.0% |
|
Excess |
38.5% |
40.9% |
2.4% |
For a more detailed analysis, please see our Equity Group H1’2026 Earnings Note
-
Absa Bank Kenya H1’2026 Financial Performance
During the week, Absa Bank Kenya released their H1’2026 financial results, recording a 9.8% decrease in profit after tax to Kshs 10.5 bn in H1’2026, from Kshs 11.7 bn in H1’2025;
|
Balance Sheet |
H1'2025 (Kshs bn) |
H1'2026 (Kshs bn) |
y/y change |
|
Government Securities |
162.4 |
157.2 |
(3.2%) |
|
Net Loans and Advances |
304.9 |
329.9 |
8.2% |
|
Total Assets |
531.6 |
558.1 |
5.0% |
|
Customer Deposits |
356.3 |
380.7 |
6.8% |
|
Deposit per Branch |
4.7 |
4.3 |
(8.8%) |
|
Total Liabilities |
442.6 |
460.1 |
4.0% |
|
Shareholder's Funds |
89.0 |
98.0 |
10.1% |
|
Balance sheet ratios |
H1'2025 |
H1'2026 |
% points change |
|
Loan to Deposit Ratio |
85.6% |
86.7% |
1.1% |
|
Govt Securities to Deposit ratio |
45.6% |
41.3% |
(4.3%) |
|
Return on average equity |
27.0% |
23.3% |
(3.7%) |
|
Return on average assets |
4.3% |
4.0% |
(0.3%) |
|
Income Statement |
H1'2025 (Kshs bn) |
H1'2026 (Kshs bn) |
y/y change |
|
Net Interest Income |
22.3 |
21.1 |
(5.4%) |
|
Net non-Interest Income |
9.1 |
8.2 |
(10.2%) |
|
Total Operating income |
31.5 |
29.3 |
(6.8%) |
|
Loan Loss provision |
(3.2) |
(3.1) |
(4.1%) |
|
Total Operating expenses |
(14.7) |
(15.2) |
3.5% |
|
Profit before tax |
16.8 |
14.2 |
(15.8%) |
|
Profit after tax |
11.7 |
10.5 |
(9.8%) |
|
Core EPS |
2.2 |
1.9 |
(9.8%) |
|
Dividend per share |
0.2 |
0.5 |
150.0% |
|
Annualized Dividend Yield |
7.8% |
6.1% |
(1.7%) |
|
Dividend Payout Ratio |
9.3% |
25.8% |
16.5% |
|
Income statement ratios |
H1'2025 |
H1'2026 |
% points change |
|
Yield from interest-earning assets |
13.4% |
11.0% |
(2.4%) |
|
Cost of funding |
4.1% |
3.1% |
(1.0%) |
|
Net Interest Spread |
1.9% |
1.4% |
(0.4%) |
|
Net Interest Margin |
9.8% |
8.4% |
(1.4%) |
|
Cost of Risk |
10.2% |
10.5% |
0.3% |
|
Net Interest Income as % of operating income |
71.0% |
72.1% |
1.1% |
|
Non-Funded Income as a % of operating income |
29.0% |
27.9% |
(1.1%) |
|
Cost to Income |
46.6% |
51.7% |
5.2% |
|
Cost to Income (Without LLPs) |
36.4% |
41.2% |
4.9% |
|
Cost to Assets |
2.2% |
2.2% |
0.0% |
|
Capital Adequacy Ratios |
H1'2025 |
H1'2026 |
% points change |
|
Core Capital/Total Liabilities |
21.4% |
22.3% |
0.9% |
|
Minimum Statutory ratio |
8.0% |
8.0% |
0.0% |
|
Excess |
13.4% |
14.3% |
0.9% |
|
Core Capital/Total Risk Weighted Assets |
17.6% |
17.4% |
(0.2%) |
|
Minimum Statutory ratio |
10.5% |
10.5% |
0.0% |
|
Excess |
7.1% |
6.9% |
(0.2%) |
|
Total Capital/Total Risk Weighted Assets |
20.5% |
19.4% |
(1.1%) |
|
Minimum Statutory ratio |
14.5% |
14.5% |
0.0% |
|
Excess |
6.0% |
4.9% |
(1.1%) |
|
Liquidity Ratio |
45.5% |
42.7% |
(2.8%) |
|
Minimum Statutory ratio |
20.0% |
20.0% |
0.0% |
|
Excess |
25.5% |
22.7% |
(2.8%) |
Key Take-Outs:
-
Decreased earnings - Core earnings per share declined by 9.8% to Kshs 1.9, from Kshs 2.2 in H1’2026, driven by the 6.8% decrease in total operating income to Kshs 29.3 bn, from Kshs 31.5 bn in H1’2025, coupled with 3.5% increase in total operating expense to Kshs 15.2 bn from Kshs 14.7 bn in H1’2025,
-
Improved asset quality – The bank’s Asset Quality improved, with Gross NPL ratio decreasing to 10.2% in H1’2026, from 13.2% in H1’2025, attributable to a 17.8% decrease in Gross non-performing loans to Kshs 36.4 bn, from Kshs 44.2 bn in H1’2025, compared to the 6.2% increase in gross loans to Kshs 355.0 bn, from Kshs 334.4 bn recorded in H1’2025.
-
Expanded Balanced sheet - The balance sheet recorded an expansion as total assets increased by 5.0% to Kshs 558.1 bn, from Kshs 531.6 bn in H1’2026, mainly driven by 8.2% increase Net loans and advances to Kshs 329.9 bn, from 304.9 bn in H1’2025.
-
Decreased Government Holdings – Government Securities decreased by 3.2% to Kshs 157.2 bn, from Kshs 162.4 bn in H1’2025, owing to a 9.2% decrease in government securities interest income to Kshs 6.0 bn from Kshs 6.6 bn recorded in H1’2025.
For a more detailed analysis, please see our Absa Bank Kenya H1’2026 Earnings Note
-
Standard Chartered Bank H1’2026 Financial Performance
During the week, Standard Chartered Bank released their H1’2026 financial results, recording a 16.8% decrease in profit after tax to Kshs 6.7 bn in H1’2026, from Kshs 8.1 bn in H1’2025;
|
Balance Sheet Items |
H1'2025 |
H1'2026 |
y/y change |
|
Net loans |
152.2 |
169.2 |
11.1% |
|
Government Securities |
103.1 |
82.6 |
(19.9%) |
|
Total Assets |
372.1 |
418.1 |
12.4% |
|
Customer Deposits |
290.6 |
309.1 |
6.4% |
|
Deposits per Branch |
11.6 |
14.1 |
20.9% |
|
Total Liabilities |
306.5 |
354.3 |
15.6% |
|
Shareholder's Funds |
65.6 |
63.8 |
(2.7%) |
|
Balance Sheet Ratios |
H1'2025 |
H1'2026 |
% points change |
|
Loan to deposit ratio |
52.4% |
54.7% |
2.3% |
|
Government securities to deposit ratio |
35.5% |
26.7% |
(8.8%) |
|
Return on Average Equity |
27.5% |
17.1% |
(10.4%) |
|
Return on Average Assets |
4.8% |
2.8% |
(2.0%) |
|
Income Statement |
H1'2025 |
H1'2026 |
y/y change |
|
Net Interest Income |
15.3 |
12.3 |
(19.8%) |
|
Net non-Interest Income |
6.8 |
7.9 |
15.9% |
|
Total Operating income |
22.1 |
20.1 |
(8.8%) |
|
Loan Loss provision |
1.2 |
0.5 |
(56.9%) |
|
Total Operating expenses |
11.2 |
10.6 |
(5.6%) |
|
Profit before tax |
10.9 |
9.6 |
(12.1%) |
|
Profit after tax |
8.1 |
6.7 |
(16.8%) |
|
Core EPS |
21.4 |
17.8 |
(16.8%) |
|
Dividend Per Share |
8.0 |
8.5 |
6.3% |
|
Dividend Yield |
13.4% |
9.4% |
(4.0%) |
|
Dividend Payout Ratio |
37.4% |
47.7% |
10.4% |
|
Income Statement Ratios |
H1'2025 |
H1'2026 |
% points change |
|
Yield from interest-earning assets |
10.8% |
8.7% |
(2.2%) |
|
Cost of funding |
1.7% |
1.3% |
(0.4%) |
|
Net Interest Spread |
9.2% |
7.4% |
(1.8%) |
|
Net Interest Margin |
9.4% |
7.5% |
(1.9%) |
|
Cost of Risk |
5.3% |
2.5% |
(2.8%) |
|
Net Interest Income as % of operating income |
69.3% |
60.9% |
(8.3%) |
|
Non-Funded Income as a % of operating income |
30.7% |
39.1% |
8.3% |
|
Cost to Income Ratio |
50.6% |
52.4% |
1.8% |
|
Cost to Income Ratio without LLP |
45.3% |
49.9% |
4.6% |
|
Cost to Assets |
2.7% |
2.5% |
(0.1%) |
|
Capital Adequacy Ratios |
H1'2025 |
H1'2026 |
% Points Change |
|
Core Capital/Total Liabilities |
19.4% |
18.4% |
(1.0%) |
|
Minimum Statutory ratio |
8.0% |
8.0% |
0.0% |
|
Excess |
11.4% |
10.4% |
(1.0%) |
|
Core Capital/Total Risk Weighted Assets |
19.5% |
18.2% |
(1.3%) |
|
Minimum Statutory ratio |
10.5% |
10.5% |
0.0% |
|
Excess |
9.0% |
7.7% |
(1.3%) |
|
Total Capital/Total Risk Weighted Assets |
19.6% |
18.2% |
(1.4%) |
|
Minimum Statutory ratio |
14.5% |
14.5% |
0.0% |
|
Excess |
5.1% |
3.7% |
(1.4%) |
|
Liquidity Ratio |
64.5% |
67.3% |
2.9% |
|
Minimum Statutory ratio |
20.0% |
20.0% |
0.0% |
|
Excess |
44.5% |
47.3% |
2.9% |
-
Decreased earnings growth – Core earnings per share decreased by 16.8% to Kshs 17.8 in H1’2026, from Kshs 21.4 in H1’2025, driven by the 8.8% decrease in Total Operating income to Kshs 20.1 bn in H1’2026, from Kshs22.1 bn in H1’2025 which outpaced the 5.6% decrease in total operating expense to Kshs 10.6 bn in H1’2026 from Kshs 11.2 bn in H1’2025,
-
Improved asset quality – The bank’s Asset improved, with Gross NPL ratio decreasing marginally to 5.1% in H1’2026, from 6.0% in H1’2025, attributable to the 6.5% decrease in gross non-performing loans to Kshs 9.0 bn, from Kshs 9.6 bn in H1’2025, and a 10.4% increase in gross loans to Kshs 176.7 bn, from Kshs 160.0 bn recorded in H1’2025, and,
-
Declaration of dividends- The Board of Directors recommended an interim dividend of Kshs 8.5 per share translating to an annualized dividend yield of 9.4% and a dividend payout ratio of 47.7% compared to an annualized dividend yield of 13.4% and dividend payout ratio of 37.4% recorded in H1’2025.
For a more detailed analysis, please see our Standard Chartered Bank H1’2026 Earnings Note
Summary Performance
The table below shows the performance of listed banks that have released their H1’2026 results using several metrics;
|
Cytonn Report: Listed Banks Performance in H1’2026 |
||||||||||||||
|
Bank |
Core EPS Growth |
Interest Income Growth |
Interest Expense Growth |
Net Interest Income Growth |
Net Interest Margin |
Non-Funded Income Growth |
NFI to Total Operating Income |
Growth in Total Fees & Commissions |
Deposit Growth |
Growth in Government Securities |
Loan to Deposit Ratio |
Loan Growth |
Return on Average Equity |
|
|
Diamond Trust Bank |
35.8% |
9.9% |
(9.5%) |
26.4% |
7.1% |
6.6% |
24.4% |
2.8% |
10.6% |
14.1% |
61.4% |
13.7% |
13.1% |
|
|
Equity Group |
31.5% |
8.2% |
(12.2%) |
16.8% |
6.7% |
35.9% |
44.5% |
29.7% |
21.4% |
6.7% |
61.7% |
18.9% |
29.1% |
|
|
Co-operative Bank |
28.0% |
6.3% |
(6.5%) |
13.0% |
9.0% |
11.6% |
32.2% |
10.9% |
13.4% |
7.0% |
74.4% |
18.1% |
20.6% |
|
|
Family Bank |
27.0% |
25.9% |
2.6% |
40.7% |
9.7% |
(14.2%) |
19.0% |
0.4% |
20.3% |
55.3% |
61.6% |
10.1% |
23.3% |
|
|
KCB Group |
14.5% |
4.0% |
(2.9%) |
7.0% |
8.2% |
15.4% |
31.5% |
17.7% |
15.1% |
31.5% |
72.5% |
13.27% |
22.0% |
|
|
NCBA Group |
12.2% |
7.6% |
(12.8%) |
20.4% |
7.9% |
7.6% |
38.3% |
9.1% |
(11.3%) |
12.3% |
62.7% |
2.0% |
19.8% |
|
|
Stanbic Group |
1.3% |
5.9% |
6.6% |
5.5% |
6.2% |
(9.0%) |
23.8% |
1.9% |
9.4% |
14.5% |
68.1% |
24.7% |
20.7% |
|
|
Absa Bank Kenya |
(9.8%) |
(8.5%) |
(17.7%) |
(5.4%) |
8.4% |
(10.2%) |
(1.1%) |
9.4% |
6.8% |
(3.2%) |
86.7% |
8.2% |
23.3% |
|
|
Standard Chartered Bank |
(16.8%) |
(17.5%) |
0.7% |
(19.8%) |
7.5% |
15.9% |
39.1% |
23.1% |
6.4% |
(19.9%) |
54.7% |
11.1% |
17.1% |
|
|
H1'2026 Mkt Weighted Average* |
14.3% |
5.5% |
(5.4%) |
13.2% |
8.1% |
4.8% |
29.0% |
9.8% |
7.9% |
12.8% |
66.7% |
12.4% |
20.3% |
|
|
H1'2025 Mkt Weighted Average* |
8.4% |
(2.0%) |
(20.7%) |
10.4% |
8.0% |
(5.8%) |
33.9% |
4.2% |
1.7% |
28.3% |
67.2% |
1.5% |
22.3% |
|
|
*Market cap weighted as at 21/08/2026 |
||||||||||||||
|
**Market cap weighted as at 16/09/2025 |
||||||||||||||
Key take-outs from the table include:
-
The listed banks that have released results recorded a 14.3% weighted average growth in core Earnings per Share (EPS) in H1’2026, compared to the weighted average growth of 8.4% in H1’2025.
-
Interest income recorded a weighted average increase of 5.5% in H1’2026, compared to the 2.0% decline recorded in H1’2025. Interest expenses recorded a market-weighted average decline of 5.4% in H1’2026, compared to the 20.7% decline in H1’2025.
-
The Banks’ net interest income recorded a weighted average growth of 13.2% in H1’2026, from the 10.4% growth recorded over a similar period in 2025, while non-funded income increased by 4.8% in H1’2026 compared to the 5.8% decline recorded in H1’2025, and,
-
The Banks recorded a weighted average deposit growth of 7.9% in H1’2026, compared to the market-weighted average deposit growth of 1.7% in H1’2025.
Asset Quality
The table below shows the asset quality of listed banks that have released their H1’2026 results using NPL ratio and NPL coverage:
|
Bank |
H1'2026 NPL Ratio* |
H1'2025 NPL Ratio** |
% point change in NPL Ratio |
H1'2026 NPL Coverage* |
H1'2025 NPL Coverage** |
% point change in NPL Coverage |
|
Family Bank |
14.7% |
13.5% |
1.2% |
66.2% |
77.4% |
(11.3%) |
|
Diamond Trust Bank |
12.2% |
12.9% |
(0.7%) |
58.2% |
45.9% |
12.2% |
|
Standard Chartered Bank |
5.1% |
6.0% |
(0.9%) |
84.3% |
81.4% |
2.9% |
|
NCBA Group |
10.8% |
12.2% |
(1.4%) |
67.4% |
65.5% |
1.8% |
|
Stanbic Holdings |
7.3% |
9.5% |
(2.1%) |
86.6% |
82.7% |
3.9% |
|
Absa Bank Kenya |
10.2% |
13.2% |
(3.0%) |
69.1% |
66.6% |
2.5% |
|
Co-operative Bank |
14.2% |
17.3% |
(3.1%) |
68.9% |
65.8% |
3.1% |
|
KCB Group |
14.5% |
17.9% |
(3.3%) |
78.8% |
64.3% |
14.4% |
|
Equity Group |
10.2% |
15.3% |
(5.0%) |
71.6% |
62.4% |
9.2% |
|
Mkt Weighted Average* |
11.3% |
13.8% |
(2.5%) |
73.4% |
67.8% |
5.6% |
|
*Market Cap weighted as at 21/08/2026 |
||||||
Key take-outs from the table include;
-
Asset quality for the listed banks that have released results improved during H1’2026, with the market-weighted average NPL ratio decreasing by 2.5% points to 11.3%, from 13.8% in H1’2025. The improvement was supported by reduced NPL ratios from DTB-K and Standard Chartered Bank. The performance was however weighed down by an increase in NPL ratio from Family Bank.
-
Market-weighted average NPL coverage increased by 5.6% points to 73.4% in H1’2026 from 67.8% recorded in H1’2025. The performance was supported by increases in coverage by individual banks such as KCB Group by 14.4% points, DTB-K by 12.2% points, Equity Bank by 9.2% points, Stanbic 3.9% points and Co-operative by 3.1% points. The performance was however weighed down by decrease in coverage by Family Bank by 11.3% points.
-
Liberty Kenya Holdings H1’2026 Financial Performance
During the week, Liberty Kenya Holdings released their H1’2026 results, highlighting that the Profit After Tax decreased by 46.0% to Kshs 0.2 bn, from the Kshs 0.4 bn recorded in H1’2025. The performance was mainly driven by 7.1% decrease in insurance and investments results to Kshs 1.06 bn from Kshs 1.14 bn in H1’2025, coupled with a 58.1% increase in other operating results to Kshs 0.6 bn from Kshs 0.4 bn in H1’2025.
Liberty Kenya Holdings Plc’s H1’2026 Results
|
Cytonn Report: Liberty Kenya Holdings PLC Income Statement |
|||
|
Item (All figures in Bns) |
H1'2025 |
H1'2026 |
y/y change |
|
Net Insurance Service Revenue |
0.2 |
0.4 |
99.1% |
|
Net Investment Revenue |
0.9 |
0.6 |
(33.2%) |
|
Total Insurance and Investment Result |
1.14 |
1.06 |
(7.1%) |
|
Other Operating Result |
(0.4) |
(0.6) |
58.1% |
|
Profit Before Tax |
0.8 |
0.5 |
(37.0%) |
|
Profit after tax |
0.4 |
0.2 |
(46.0%) |
|
Core EPS |
0.8 |
0.4 |
(46.0%) |
|
Cytonn Report: Liberty Kenya Holdings PLC Balance Sheet |
|||
|
Item (All figures in Bns) |
H1'2025 |
H1'2026 |
y/y change |
|
Financial Investments |
29.7 |
34.9 |
17.5% |
|
Reinsurance contract assets |
1.5 |
1.3 |
(13.7%) |
|
Total Assets |
45.3 |
48.9 |
7.8% |
|
Insurance contract Liabilities |
20.7 |
22.5 |
9.0% |
|
Total Liabilities |
35.5 |
38.8 |
9.5% |
|
Shareholders’ Funds |
9.9 |
10.0 |
1.9% |
Key take outs from the results include:
-
Core Earnings Per share decreased by 46.0% to Kshs 0.4, from Kshs 0.8 in H1’2025, driven by the 46.0% decrease in Profit after tax to Kshs 0.2 bn from Kshs 0.4 bn in H1’2025, which was in turn due to the 7.1% decrease in insurance and investments results to Kshs 1.06 bn from Kshs 1.14 bn in H1’2025,
-
Net insurance revenue before reinsurance contracts held increased by 25.6% to Kshs 1.1 bn in H1’2026 from of Kshs 0.9 bn in H1’2025, while net expense from reinsurance contracts held decreased by 0.8% to remain relatively unchanged from the Kshs 0.6 bn recorded in H1’2025, this translated to an insurance service result increase of 99.1% to Kshs 0.4 bn from Kshs 0.2 bn in H1’2025,
-
Net Financial Result decreased by 7.1% to Kshs 1.06 bn from Kshs 1.14 bn in H1’2025. This was majorly attributable 22.6% decrease investment income to Kshs 1.7 bn from Kshs 2.2 bn in H1’2025. However, this was supported by a 14.9% decrease in net insurance finance expense to Kshs 1.1 bn from Kshs 1.3 bn in H1’2025.
-
The balance sheet recorded an expansion as total assets increased by 7.8% to Kshs 48.9 bn in H1’2026, from Kshs 45.3 bn in H1’2025 mainly driven by 17.5% increase in financial investments to Kshs 34.9 bn from Kshs 29.7 bn in H1’2025, which was however weighed down by 13.7% decrease in reinsurance contract assets to Kshs 1.3 bn from Kshs 1.5 bn recorded in H1’2025.
-
Total liabilities increased by 9.5% to Kshs 38.8 bn, from Kshs 35.5 bn in H1’2025 attributable to the increase in insurance contract liabilities by 9.0% to Kshs 22.5 bn from Kshs 20.7 bn in H1’2025.
-
The Board of Directors did not recommend an interim dividend, which was consistent with H1’2025.
Going forward, the factors that would drive the company’s growth would be:
-
Growth in Financial Investments – The company’s financial investments increased by 17.5% to Kshs 34.9 bn in H1’2026, driving total assets up by 7.8% to Kshs 48.9 bn. The continued expansion of the investment portfolio provides Liberty Kenya Holdings with a larger asset base from which to generate future investment income, while offering capacity to capitalize on favourable market conditions and support long-term balance sheet growth. This is particularly important given the company's investment-led business model, although the ability to translate the larger portfolio into improved investment returns will remain key to future profitability.
-
Absa Group Completes Tender Offer for Additional Stake in Absa Bank Kenya PLC
During the week, Absa Group Limited announced the results of its tender offer to buy up to 895,989,600 additional shares in Absa Bank Kenya PLC, which closed on 11th August 2026. Out of the shares offered for sale by shareholders, Absa Group accepted 189,380,644 shares, at a price of Kshs 34.50 per share. This purchase raises Absa Group's total shareholding in Absa Bank Kenya from approximately 68.5% to approximately 72.0% of the bank's issued shares. The shares bought will be transferred to Absa Group through block trades on the Nairobi Securities Exchange, after which the selling shareholders will be paid according to the payment method each of them chose. Below shows the shareholding structure before and after the Tender Offer:
|
Absa Kenya Shareholding |
|||
|
Before Tender Offer |
After Tender Offer |
||
|
Name of Shareholder |
% Shareholding |
Name of Shareholder |
% Shareholding |
|
Absa Group Limited |
3,720,816,000 (68.5%) |
Absa Group Limited |
3,910,196,644 (72.0%) |
|
Other Shareholders |
1,709,424,000 (31.5%) |
Other Shareholding |
1,520,043,356 (28.0%) |
|
Total |
5,430,240,000 |
Total |
5,430,240,000 |
This move reflects Absa’s Group’s continued confidence in the Kenyan banking sector and strengthens its control over it’s local subsidiary, while the transaction itself does not change how Absa Bank Kenya is run day to day, since it is simply a shift of ownership between shareholders.
We maintain a “cautiously optimistic” short-term outlook supported primarily earnings-led attractive valuations but with some of the risks being expected due to the heightened political and geopolitical risks such as Iran war that may weigh on investor sentiment, and, “neutral” in the long term as persistent foreign investor outflows continue to constrain market liquidity and limit broad-based market re-rating. With the market currently trading at par to its future growth (PEG Ratio at 1.0x), the performance will be driven by company-specific fundamentals rather than general market direction, we believe that investors should reposition towards value stocks exhibiting strong earnings growth, attractive dividend yields, solid balance sheets, sustainable competitive advantages and trading at compelling discounts to their intrinsic value. While foreign investor sell-offs are expected to continue exerting pressure in the near term, we believe this will create selective entry opportunities for long-term investors
-
Industry Report
-
June Leading Economic Indicators (LEI)
During the week, the Kenya National Bureau of Statistics (KNBS) released the Leading Economic Indicators (LEI) June 2026 Report, which highlighted the performance of major economic indicators. The key highlights related to the Real Estate sector include:
-
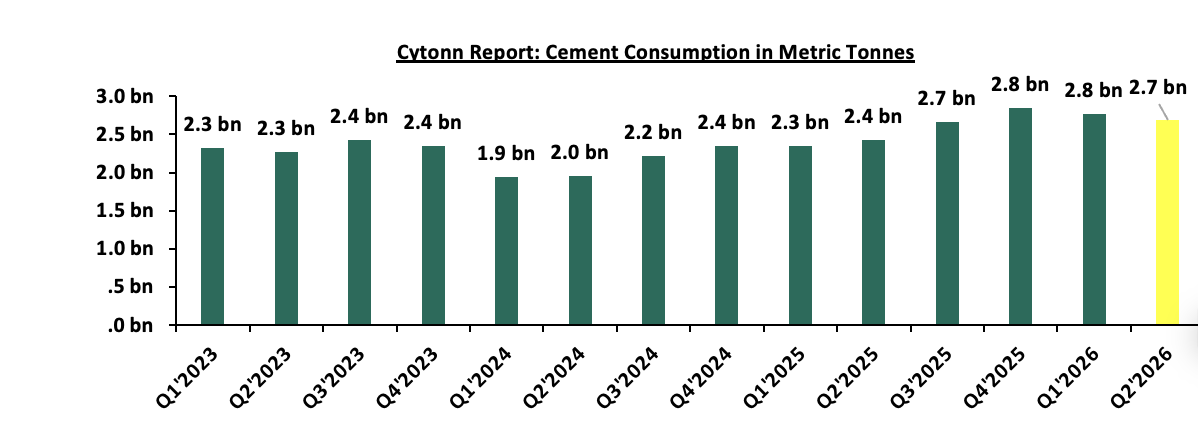
Cement consumption: In June 2026, cement consumption reached 0.9 metric tonnes, representing an 11.2% y/y increase from 0.8 metric tonnes in June 2025. In Q2’2026, cement consumption increased by 11.1% reaching 2.7 metric tonnes, from 2.4 metric tonnes recorded in Q2’2025. Quarter-on quarter basis, the consumption decreased by 2.6% from 2.8 recorded in Q1’2026. Month-on-month, consumption decreased by 3.9%, to 893,447 from 929,328 in May attributable to increased construction input cost during the period, such as transport and fuel. The y/y performance was anchored by (i) continued private sector construction activity in urban hubs such as Nairobi, Mombasa, and Kisumu, (ii) government-led infrastructure investments under the Bottom-Up Economic Transformation Agenda (BETA), including roads, affordable housing, water, and sanitation projects, and (iii) public works initiatives in rural and semi-urban areas, which both support livelihoods and expand critical infrastructure.
The chart below shows cement consumption in metric tonnes in Kenya between Q1’2023 and Q2’2026.
Source: Kenya Bureau of Statistics (KNBS)
-
Residential Sector
-
Housing Levy Defaulters Face Tougher KRA Enforcement
During the week, the Kenya Revenue Authority (KRA) moved to strengthen enforcement of the Affordable Housing Levy following amendments introduced under the Finance Act 2026. The changes give KRA clearer powers to recover unpaid or unremitted housing levy, including through measures such as bank account recovery, asset seizures and PIN deactivation. The move follows concerns over widespread noncompliance, with an audit of the Affordable Housing Fund indicating that thousands of taxpayers were paying other taxes but not the housing levy. Housing levy collections stood at Kshs 79.9 bn in the year to June 2026.
The development comes after the housing levy framework underwent changes following its introduction, with KRA collecting the current 1.5% levy on gross pay or income from July 2024. However, despite KRA being responsible for collection, the authority previously lacked explicit legal powers to pursue unpaid or unremitted amounts, creating a gap between the requirement to pay and the ability to enforce compliance. This appears to have contributed to the compliance challenges, particularly among informal sector businesses and employers, with an audit finding that 6,390 companies were remitting PAYE but not the housing levy. The Finance Act 2026 has now addressed this gap by giving KRA stronger recovery powers, allowing it to assess and pursue outstanding levy in a similar manner to other tax liabilities.
Going forward, we expect the enhanced enforcement measures to improve housing levy compliance and strengthen revenue mobilization for the Affordable Housing Fund. This could provide greater visibility and consistency around funding for affordable housing projects, although the pace at which this translates into additional housing supply will also depend on the government's ability to effectively deploy the funds towards ongoing and planned developments.
-
Mixed Use Sector
-
NSSF Revives 1,000 Acre Mavoko Development Plan
During the week, the National Social Security Fund (NSSF) announced plans to revive its approximately 1,000-acre landholding in Katani, Mavoko, Machakos County through the development of a mixed-use city. The fund is seeking a development partner to undertake feasibility studies, prepare a master plan and implement an initial phase of the project. Unlike its earlier proposals that largely centered on housing, the current concept brings together residential, commercial, industrial, institutional, warehousing and hospitality uses, creating a broader development model for the property. The land has remained largely undeveloped despite previous proposals dating back to 2012, including plans for 30,000 housing units and a later proposal for 60,000 low cost houses.
The renewed interest comes as both the property and the surrounding market have evolved. Land values in the neighboring Syokimau area have increased from about Kshs 17.2 mn per acre in 2015 to Kshs 39.4 mn currently, highlighting the significant appreciation of land within the wider Mavoko and Nairobi metropolitan growth corridor. At the same time, NSSF's assets under management have expanded to Kshs 623.8 bn as at December 2025, providing a stronger financial base than during its earlier attempts to develop the site. The move towards a mixed-use model also reflects the need for developments of this scale to incorporate multiple property segments and supporting amenities rather than rely on housing alone.
Going forward, if implemented successfully, the project is expected to accelerate the transformation of Mavoko into a more established residential and commercial destination within the Nairobi metropolitan area. A development combining housing, businesses, industrial facilities and supporting services could stimulate demand for surrounding land and property while attracting additional private sector development into Machakos County. The scale of the project could also improve the area's infrastructure and create a more integrated urban environment, although the extent of its impact will ultimately depend on the project's execution, infrastructure provision and ability to attract sustained demand.
-
Real Estate Investments Trusts
-
REITs Weekly Performance
On the Unquoted Securities Platform Acorn D-REIT and I-REIT traded at Kshs 29.7 and Kshs 24.4 per unit, respectively, as per the last updated data on 14th August 2026. The performance represented a 48.5% and 22.0% gain for the D-REIT and I-REIT, respectively, from the Kshs 20.0 inception price. The volumes traded for the D-REIT and I-REIT came in at 13.6 mn and 44.5 mn shares, respectively. Additionally, ILAM Fahari I-REIT traded at Kshs 13.8 per share as of 14th August 2026, representing a 31.0% loss from the Kshs 20.0 inception price. The volume traded to date came in at 1.2 mn shares for the I-REIT, REITs offer various benefits, such as tax exemptions, diversified portfolios, and stable long-term profits. However, the ongoing decline in the performance of Kenyan REITs and the restructuring of their business portfolios are hindering significant previous investments. Additional general challenges include:
-
Insufficient understanding of the investment instrument among investors leading to a slower uptake of REIT products,
-
Lengthy approval processes for REIT creation,
-
High minimum capital requirements of Kshs 100.0 mn for REIT trustees compared to Kshs 10.0 mn for pension funds Trustees, essentially limiting the licensed REIT Trustee to banks only
-
The rigidity of choice between either a D-REIT or and I-REIT forces managers to form two REITs, rather than having one Hybrid REIT that can allocate between development and income earning properties
-
Limiting the type of legal entity that can form a REIT to only a trust company, as opposed to allowing other entities such as partnerships, and companies,
-
We need to give time before REITS are required to list – they would be allowed to stay private for a few years before the requirement to list given that not all companies maybe comfortable with listing on day one, and,
-
Minimum subscription amounts or offer parcels set at Kshs 0.1 mn for D-REITs and Kshs 5.0 mn for restricted I-REITs. The significant capital requirements still make REITs relatively inaccessible to smaller retail investors compared to other investment vehicles like unit trusts or government bonds, all of which continue to limit the performance of Kenyan REITs
We expect the performance of Kenya's Real Estate sector to remain resilient, supported by several factors, including: i) increase in cement consumption to 0.9 metric tonnes, representing an 11.2% y/y increase from 0.8 metric tonnes in June 2025 , ii) KRA’s plan to strengthen enforcement of the Affordable Housing Levy, and iii) NSSF’s plans to revive its 1,000-acre landholding in Katani, Machakos County through the development of a mixed-use city. However, challenges such as weak investor appetite in listed REITs and high capital requirements will continue to constrain the sector's optimal performance
-
Central Bank of Kenya Streamlines Retail Securities Settlement via DhowCSD M-Pesa Integration
During the week, the Central Bank of Kenya (CBK) highlighted the mobile payment integration within its DhowCSD platform, enabling retail investors to settle accepted Treasury bill and Treasury bond bids of up to Kshs 250,000.0 directly using M-Pesa. Under the facility, investors initiate post-auction payments from the Transactions tab of the DhowCSD app or web portal rather than navigating external payment gateways. The initiative represents a key milestone in Kenya’s digital sovereign debt infrastructure, removing operational friction for small-scale domestic investors while complementing broader market upgrades, such as the international debt market link established with Clear stream in June 2026. By automating micro-settlements over mobile rail channels, the CBK deepens domestic financial inclusion, reduces retail settlement drop-offs, and lowers administrative costs associated with government paper issuance.
-
American Express Declares Dividend on Series E Preferred Shares
During the week, American Express Company announced that its Board of Directors declared a regular dividend on the company’s 6.5% Fixed Rate Reset Noncumulative Preferred Shares, Series E. The declared dividend stands at USD 5,912.5 per share or USD 5.9 per related Depositary Share, scheduled for payment on September 15, 2026, to shareholders of record as of September 1, 2026. The announcement reflects American Express’s ongoing capital allocation framework and commitment to maintaining consistent capital returns to preferred security holders while sustaining strong capital ratios across its commercial and consumer payment operations.
-
Mastercard Partners with SNB Group to Launch First World Legend Card in MENA Region
During the week, Mastercard Incorporated partnered with SNB Group to launch the SNB World Legend Mastercard in Riyadh, Saudi Arabia, marking the first deployment of Mastercard’s highest-tier product offering in the Middle East and North Africa (MENA) region. Targeted specifically at SNB’s Private Banking clientele, the card introduces a curated luxury ecosystem featuring 24/7 concierge services, bespoke travel perks, global economic forum access via Bloomberg partnerships, and airport lounge access. The launch aligns with Mastercard’s strategic push to deepen its penetration in high-net-worth market segments across high-growth emerging economies, capture premium cross-border transaction volumes, and support economic digitization goals aligned with Saudi Vision 2030.
-
PayPal and Venmo Expand Higher Education Footprint via Major Tuition Integrations
During the week, PayPal Holdings, Inc. announced major integrations with leading higher education payment management platforms Illumia, Nelnet Campus Commerce, and TouchNet (a Global Payments company). The partnership allows students and families across participating institutions including Michigan State University, Texas Tech University, and Butler University to pay tuition and campus fees directly using PayPal or Venmo balances, bank transfers, or linked cards. The strategic expansion builds upon PayPal's broader collegiate engagement strategy following its major revenue-sharing agreements with the Big Ten and Big 12 conferences. By embedding its wallet infrastructure directly into core institutional billing software, PayPal expands its everyday addressable payment volume, lowers payment friction for high-value family expenditures, and enhances platform lock-in among younger demographics.
-
Digital Payments Stock Performance
The table below presents a snapshot of NYSE-listed digital payments stocks, covering Visa, Mastercard, American Express (AXP), Wise Plc, Block and PayPal:
|
Cytonn Report: Digital Payments NYSE and LSE Stock Performance |
||||||
|
Company |
Year Open 2026 |
Price 8/14/2026 |
Price 8/21/2026 |
w/w change |
YTD change |
P/E |
|
American Express |
372.7 |
342.5 |
336.0 |
(1.9%) |
(9.9%) |
26.1 x |
|
Visa |
346.5 |
364.2 |
371.0 |
1.9% |
7.1% |
17.6 x |
|
Mastercard |
563.1 |
569.3 |
580.6 |
2.0% |
3.1% |
33.7 x |
|
Block |
65.2 |
82.9 |
82.2 |
(0.9%) |
26.1% |
34.8 x |
|
Paypal Holdings |
58.1 |
61.7 |
61.5 |
(0.3%) |
5.8% |
12.3 x |
|
Wise PLC |
11.8 |
13.0 |
12.9 |
(0.8%) |
9.5% |
26.1 x |
|
Average |
|
|
|
|
|
25.1x |
Source: AXP, Visa, Mastercard, Circle, Block, PayPal, Coinbase, Global Payments, and Wise. NYSE
The stocks are currently trading at an average P/E multiple of 25.1x, indicating that investors are pricing in strong future earnings growth and are prepared to pay a substantial premium for current earnings. This also suggests that valuations may be stretched relative to near-term fundamentals.
We expect the global digital payments sector to continue evolving toward greater payment sovereignty, digital infrastructure modernization, and reduced reliance on traditional card-based payment networks as governments and financial institutions increasingly prioritize control over domestic payment ecosystems. Recent developments, particularly the European Central Bank’s progress toward launching the Digital Euro, signal a growing global shift toward central bank-backed digital payment infrastructure aimed at enhancing financial resilience, improving transaction efficiency, and strengthening monetary independence in an increasingly digital economy. This trend is likely to accelerate competition between public-sector digital currencies and established private payment networks such as Visa Inc. and Mastercard Incorporated, while driving broader innovation across digital finance infrastructure. However, despite these favorable long-term structural tailwinds, valuations within the sector remain relatively elevated, with the companies under coverage currently trading at an average P/E of 25.1x, suggesting that a significant portion of future growth expectations may already be priced in. As such, we expect near-term performance to remain sensitive to regulatory developments, execution risk, and the pace at which both incumbents and emerging digital payment infrastructure providers adapt to the rapidly changing payments landscape.
Following the release of the H1’2026 results by all four authorized Real Estate Investment Trusts (REITs) in Kenya, the Cytonn Real Estate Research Team undertook an analysis of the financial performance of the REITs and identified the key factors that shaped the performance of the sector. For the earnings notes of the various REITs, click the links below:
In the report we will assess the financial performance of the current REITs in the market during H1’2026 in terms of operational metrics, profitability metrics, leverage ratios, liquidity ratios, and valuation metrics. In addition, we highlight the outlook regarding our expectations for the REITs sector going forward. This we will cover as follows;
-
Overview of the REITs Sector in Kenya,
-
Themes that shaped the Real Estate Sector in H1’2026,
-
Summary Performance of the REITS in H1’2026, and,
-
Conclusion and Outlook for the REITs sector.
Section I: Overview of the REITs Sector in Kenya
In H1’2026, the general Real Estate sector continued to witness considerable growth in activity in terms of property transactions and development activities. The Real Estate sector grew by 5.0% , 0.4% point increase from 4.6% recorded in Q1’2025 signifying continued recovery in the sector. Consequently, the sector’s activity contribution to Gross Domestic Product (GDP) was at 10.1% in Q1'2026, a slight decrease from the 10.2% expansion registered in the corresponding quarter of 2025. The performance reflects relatively lower demand across the property market, particularly within the residential segment, due to the prevailing affordability constraints and a cautious investment environment. Cumulatively, the Real Estate and construction sectors contributed 15.5% to the GDP in Q1’2026, a slight increase from 15.4% Q1’2025,
The graph below highlights the Real Estate and Construction sectors’ contribution to GDP from 2020 to Q1’2026;
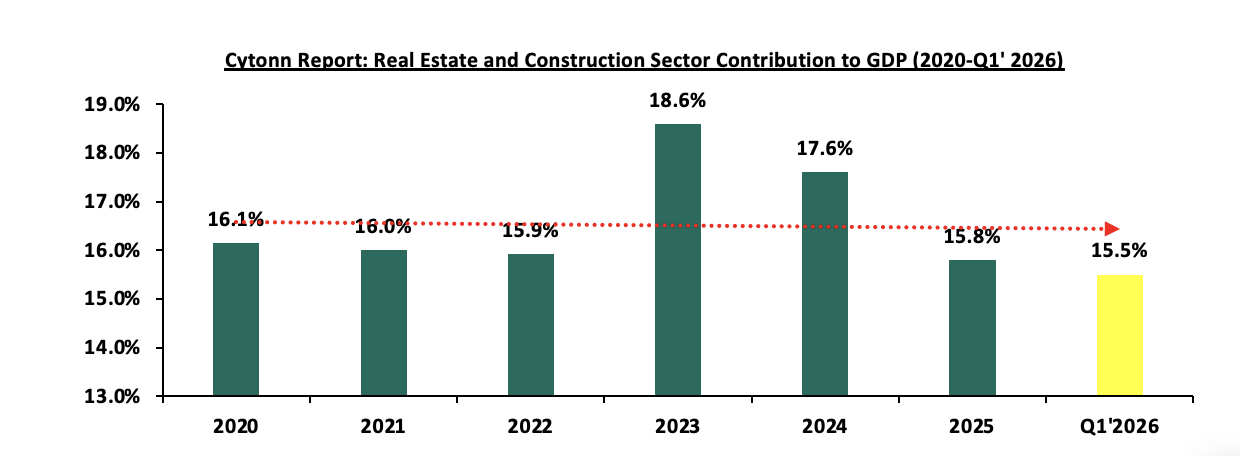
Source: Kenya National Bureau of Statistics (KNBS)
As the REITs continue to gain popularity in Kenya, we set to explore and review the REITs environment in 2026 building to the previous reports we did, which include: Review of Real Estate Investments Trusts (REITs) in Kenya 2025, Review of Real Estate Investments Trusts (REITs) in Kenya 2026 and REITs Performance report FY’2025
Section I: Overview of the REITs Sector in Kenya
Real Estate Investment Trusts are crucial to the development given the limited funding available to the developers. Real Estate Investment Trusts (REITs) represent an innovative financing avenue for real estate development in Kenya. REITs provide a structured mechanism for pooling resources from multiple investors to finance or acquire income-generating real estate assets. The Capital Markets Authority (CMA) regulates REITs in Kenya, ensuring transparency and investor protection. Despite being relatively new in the Kenyan financial market, REITs have shown potential as a transformative tool for real estate financing.
In Kenya, REITs are classified into two main types:
-
Development REITs (D-REITs): These focus on financing the construction of new real estate projects. Developers utilize D-REITs to raise capital for large-scale projects, such as residential complexes, commercial buildings, or mixed-use developments. Investors in D-REITs anticipate returns from the eventual sale or lease of the completed properties. Example of this REIT include Acorn D-REIT.
-
Income REITs (I-REITs): These are designed for properties that generate consistent rental income. I-REITs appeal to investors seeking steady cash flow from established properties such as office buildings, shopping malls, or industrial parks. In Kenya examples of I-REITs include Acorn I-REIT, Africa logistics properties (ALP) Industrial I-REIT, Laptrust Imara I-REIT and Trific Green USD I-REIT.
REITs in Kenya are governed by strict regulations aimed at safeguarding investors. They operate as collective investment schemes where a REIT manager oversees the fund's operations. Investors purchase units of the REIT, similar to shares in a company, granting them proportional ownership of the underlying real estate assets. These units are typically traded on the Nairobi Securities Exchange (NSE), providing liquidity and enabling investors to buy or sell their stakes easily.
REITs must allocate a significant portion of their income, often up to 80.0% to investors as dividends, making them attractive to those seeking regular income. Additionally, REITs benefit from tax incentives, such as exemptions on corporate tax, which enhance their appeal to both developers and investors.
Kenya's Real Estate sector has been expanding due to ongoing construction activities driven by strong demand for real estate developments. The residential market is significantly under-supplied, with a 2.0 mn housing deficit; only 50,000 units are delivered annually against an estimated need for 250,000 units per year. Despite the high demand, developers in Kenya encounter limited financing options, with local banks providing nearly 95.0% of construction financing, in stark contrast to the 40.0% typically seen in developed countries. The graph below illustrates the comparison of construction financing in Kenya versus developed economies;
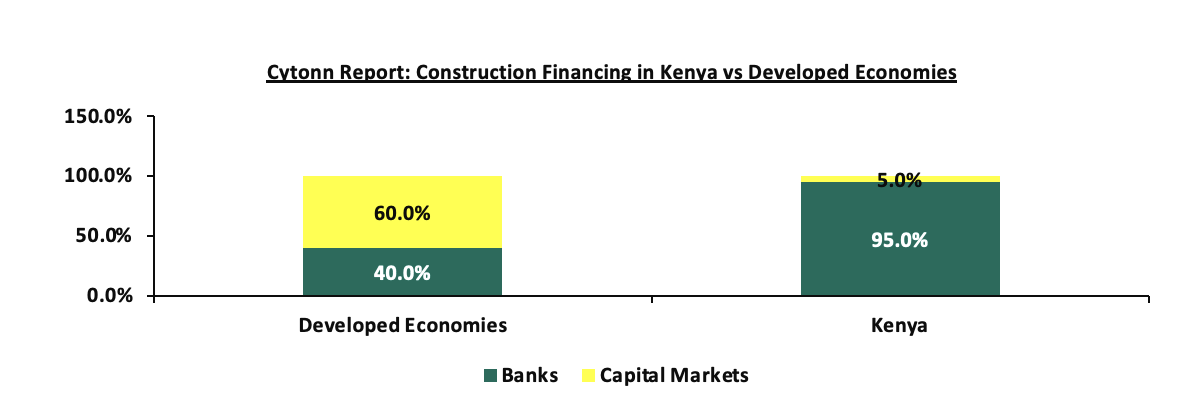
Source: World Bank
To bridge the funding gap, developers are increasingly turning to alternative financing methods. In 2013, the Capital Markets Authority (CMA) introduced a regulatory framework for Real Estate Investment Trusts (REITs) in Kenya. REITs are collective investment vehicles that pool funds from investors, who then acquire rights or interests in a trust divided into units. Investors benefit from profits or income generated by the real estate assets held within the trust. To ensure transparency, accountability, and the protection of investors' interests, four essential entities play key roles in the REIT structure in Kenya. Click here to read more on the key entities and how the REIT structure operates.
Since its introduction in 2013, the REIT market in Kenya has faced several hurdles that have hindered its growth. Key challenges include the hefty capital requirement of Kshs 100.0 mn for trustees, limiting this role largely to banks, and a protracted approval process for setting up REITs. Additionally, the high minimum investment threshold of Kshs 5.0 mn for restricted REITs discourages potential investors, while a lack of sufficient investor education and awareness further impedes market expansion. As a result, the REIT market capitalization in Kenya remains significantly lower compared to other regions.
The underdeveloped capital markets in Kenya has continually failed to provide alternative means of financing Real Estate developments. Due to this, most property developers rely on conventional sources of funding such as banks, compared to other developed countries. As a result, Kenya’s REIT Market Capitalization to GDP has remained significantly low at 0.2%, compared to other countries such as South Africa with 3.4 %, as shown below;
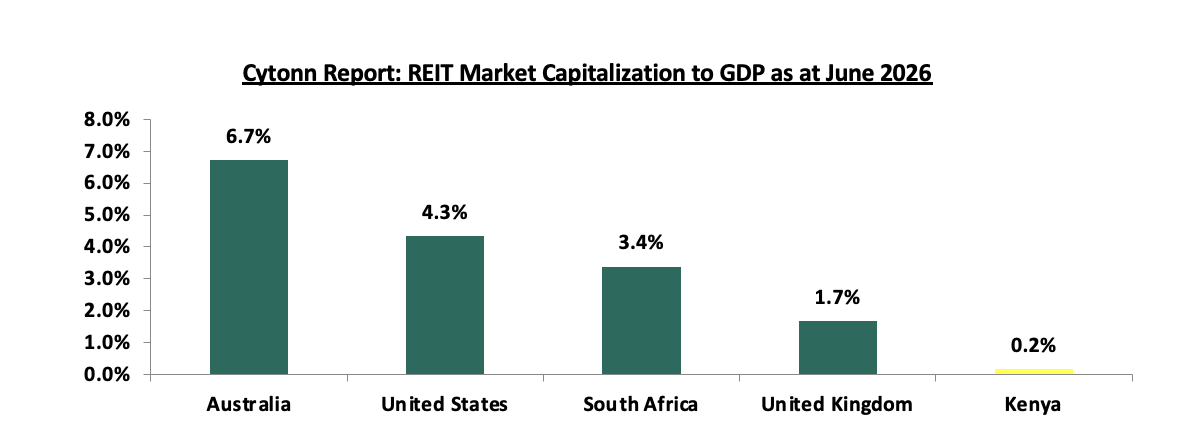
Source: European Public Real Estate Association (EPRA), World Bank, S&P global, Cytonn Research
Most property developers in Kenya continue to rely on traditional funding sources, such as banks, unlike in more developed markets. Since the establishment of REIT regulations, Six REITs have been approved in Kenya, with the recent listing of Africa Logistics Property Income REIT ALP-I REIT and TRIFIC Green I-REIT. TRIFIC I-REIT is the only REIT that is actively trading on the Main Investment Market Segment of the Nairobi Securities Exchange (NSE). LAPTrust Imara I-REIT and ALP Industrial I-REIT are listed but are quoted on the restricted market sub-segment of the NSE's Main Investment Market. The ILAM Fahari I-REIT, Acorn I-REIT and D-REIT are not listed but trade on the Unquoted Securities Platform (USP), an over-the-counter market segment of the NSE. The table below outlines all REITs authorized by the Capital Markets Authority (CMA) in Kenya
|
Cytonn Report: Authorized REITs in Kenya |
||||||
|
# |
Issuer |
Name |
Type of REIT |
Listing Date |
Market Segment |
Status |
|
1 |
ICEA Lion Asset Management (ILAM) |
Fahari |
I-REIT |
July 2024 |
Unquoted Securities Platform (USP) |
Trading |
|
2 |
Acorn Holdings Limited |
Acorn Student Accommodation (ASA) – Acorn ASA |
I-REIT |
February 2021 |
Unquoted Securities Platform (USP) |
Trading |
|
3 |
Acorn Holdings Limited |
Acorn Student Accommodation (ASA) – Acorn ASA |
D-REIT |
February 2021 |
Unquoted Securities Platform (USP) |
Trading |
|
4 |
Local Authorities Pension Trust (LAPTrust) |
Imara |
I-REIT |
March 2023 |
Restricted Market Sub-Segment of the Main Investment Market |
Restricted |
|
5 |
Africa Logistics properties (ALP) |
ALP REIT |
I-REIT |
March 2026 |
Restricted Market Sub-Segment of the Main Investment Market |
Restricted |
|
6 |
Two Rivers Land Company Limited (TRIFIC SEZ) |
TRIFIC Green |
I-REIT |
June 2026 |
Main Investment market segment |
Trading |
Source: Nairobi Securities Exchange, CMA
Section II: Themes that Shaped the REIT Sector in H1’2026
In our report on review of the REITs sector, we explored how evolving regulations, strategic acquisitions, and capital-raising initiatives have influenced the REIT industry's trajectory. Additionally, we provide insights into the broader factors that have impacted the sector's performance and overall direction during this period. For more information on themes that continue to shape the REIT sector, please visit our report Review of Real Estate Investments Trusts (REITs) in Kenya 2026
Section III: Summary Performance of the REITs in H1’2026
The tables below highlight the performance of the Kenyan REITs sector, showing the performance using several National Association of Real Estate Investments Trusts (NAREIT) approved metrics, and the key take-outs include;
All figures in Kshs unless stated otherwise
|
Cytonn Report: Summary Performance Kenya REITs in H1’2026 |
||||||||||||||||||
|
|
Imara I-REIT |
ILAM Fahari I-REIT |
Acorn I-REIT |
Acorn D-REIT |
ALP I-REIT* |
All REITs |
Y/Y change |
|||||||||||
|
Metric |
H1'2025 |
H1'2026 |
y/y Change |
H1'2025 |
H1'2026 |
y/y Change |
H1'2025 |
H1'2026 |
y/y Change |
H1'2025 |
H1'2026 |
y/y Change |
H1'2026 |
H1'2025 |
H1'2026 |
|||
|
Operating Metrics |
||||||||||||||||||
|
|
|
|
|
|
|
|
|
|
|
|
|
|
|
|
|
|
||
|
Net Operating Income (NOI) |
103.9 |
77.1 |
(25.7%) |
64.3 |
84.7 |
31.6% |
293.0 |
345.2 |
17.8% |
566.8 |
493.5 |
(12.9%) |
37.4 |
1028.0 |
1037.9 |
1.0% |
||
|
|
||||||||||||||||||
|
Profitability Metrics |
||||||||||||||||||
|
|
||||||||||||||||||
|
Funds from Operations |
80.9 |
57.8 |
(28.5%) |
64.3 |
84.7 |
31.6% |
444.7 |
410.0 |
(7.8%) |
566.8 |
493.5 |
(12.9%) |
37.4 |
1156.8 |
1083.4 |
(6.3%) |
||
|
Adjusted FFO |
80.9 |
57.8 |
(28.5%) |
61.2 |
84.7 |
38.3% |
444.7 |
410.0 |
(7.8%) |
566.8 |
493.5 |
(12.9%) |
37.4 |
1153.6 |
1083.4 |
(6.1%) |
||
|
Cash Available for Distribution (CAD) |
80.9 |
57.8 |
(28.5%) |
70.6 |
84.7 |
19.9% |
99.9 |
169.1 |
69.2% |
205.0 |
29.1 |
(85.8%) |
61.7 |
456.5 |
402.4 |
(11.9%) |
||
|
Cash Amounts Distributed (CAD) |
0.0 |
0.0 |
0.0 |
0.0 |
102.6 |
70.6 |
(31.2%) |
0.0 |
0.0 |
0.0 |
102.6 |
70.6 |
(31.2%) |
|||||
|
Valuation Metrics |
||||||||||||||||||
|
Net Asset Value (NAV) |
6,379.7 |
5,868.5 |
(8.0%) |
3567.0 |
3715.4 |
4.2% |
8,617.8 |
9,899.0 |
14.9% |
7,716.3 |
8,675.0 |
12.4% |
5,396.7 |
26,280.8 |
33,554.6 |
27.7% |
||
Source: Cytonn Research, *ALP is trading in dollars exchange rate used = 129.5 as of 30th June 2026
Key takeaways from the table include:
-
The combined Net Operating Income (NOI) of Kenyan REITs saw a 1.0 % increase, reaching Kshs 1,037.9 mn in H1’2026, up from Kshs 1,028.0 mn mn in H1’2025. This growth was largely driven by a 31.6% rise in the net operating income of Fahari I -REIT, which increased to Kshs 84.7 mn from Kshs 64.3 mn in H1’2025. Additionally, Acorn I-REIT reported a notable NOI growth of 17.8%, reaching to Kshs 345.2 mn from Kshs 283.0 mn in similar period in 2025, further contributing to the overall positive performance. The ALP I-REIT was launched during the period and they recorded a NOI of 37.3 mn despite having rental income for two months. Imara I-REIT’s NOI saw the largest drop, falling by 47.9% to Kshs 77.1 mn from Kshs 103.9 mn in H1’2025, followed by Acorn D-REIT which fell by 12.9% to Kshs 493.5 mn in H1’2026 from Kshs 566.8 mn in H1’2025,
-
Combined Funds from Operations (FFO) of Kenyan REITs decreased by 6.3% in H1’2026, to Kshs 1,083.4 mn from Kshs 1,156.8 mn in H1’2025. Similarly, Adjusted FFOs for Kenyan REITs decreased by 6.1%, reaching Kshs 1083.4 mn in H1’2026 from Kshs 1,153.6 mn in H1’2025. This decrease was largely due to the decrease witnessed by all REITs FFOs except for Fahari I-REIT which increased by 31.6% to Kshs 84.7 mn from Kshs 64.3 mn in H1’2025 ALP I-REIT FFO came in at kshs 37.3 mn
-
The REITs combined Cash amounts available for paying dividends to REIT investors which we measured using the Cash Available for Distribution (CAD) metric decreased by 11.9% in H1’2026 to Kshs 402.4 mn from Kshs 456.5 mn in H1’2025. The performance was propelled by Acorn D-REIT’s distributable earnings which decreased by 31.2% to come in at Kshs 70.6 mn from Kshs 102.6 mn during the same period last year.
-
Notably, the REIT managers of the REITs did not recommend provisional dividends except for Laptrust Imara I-REIT, the REIT Manager suggested a dividend distribution of Kshs 46.3 mn, amounting to Kshs 0.14 per unit a decrease from 0.23 per unit in H1’2025, which was approved by the Trustee for the H1’2026, and,
-
The combined Net Asset Values (NAV) for Kenyan REITs increased by 27.7% to reach Kshs 33,554.6 mn in H1’2026, from Kshs 26,280.8 mn in H1’2025. This increase was driven by an increase in all REITs increase in net asset value except for Imara I-Reit which decreased by 8.0% to 5,868.5 mn in H1’2026 from 6,379.7 Mn in 2025 similar period. Notably the new REIT, ALP industrial I-REIT added to the total NAV by Kshs 5,396.7 mn. All other REITS recorded an increase in NAV by 4.2%, 14.9% and 12.4% for ILAM Fahari I-REIT, Acorn I-REIT and D-REIT respectively.
The table below makes a comparison of the leverage and liquidity ratios of all four Kenyan REITs during H1’2025 and H1’2026;
All figures in Kshs unless stated otherwise
|
Cytonn Report: Summary Performance Kenya REITs in H1’2026 |
|||||||||||||||||
|
|
Imara I-REIT |
ILAM Fahari I-REIT |
Acorn I-REIT |
Acorn D-REIT |
ALP I-REIT* |
All REITs |
Y/Y change |
||||||||||
|
Metric |
H1'2025 |
H1'2026 |
y/y Change |
H1'2025 |
H1'2026 |
y/y Change |
H1'2025 |
H1'2026 |
y/y Change |
H1'2025 |
H1'2026 |
y/y Change |
H1'2026 |
FY'2025 |
FY'2026 |
||
|
Leverage Ratios |
|||||||||||||||||
|
Debt to Equity Ratios |
0.0% |
0.0% |
0.0% |
0.0% |
0.0% |
0.0% |
0.0% |
21.1% |
21.1% |
60.6% |
46.5% |
(14.1%) |
0.0% |
18.6% |
37.7% |
19.1% |
|
|
Debt to Total Market Cap Ratio |
0.0% |
0.0% |
0.0% |
0.0% |
0.0% |
0.0% |
0.0% |
21.3% |
21.3% |
64.9% |
46.4% |
(18.5%) |
0.0% |
19.9% |
37.8% |
17.9% |
|
|
Debt to Gross Book Value Ratio |
0.0% |
0.0% |
0.0% |
0.0% |
0.0% |
0.0% |
0.0% |
15.2% |
15.2% |
29.0% |
23.2% |
(5.9%) |
0.0% |
8.9% |
21.4% |
12.5% |
|
|
Debt to EBITDA Multiple |
0.0x |
0.0x |
0.0% |
0.0x |
0.0x |
0.0% |
0.0x |
5.8x |
8.3x |
6.6x |
(20.5%) |
0.0x |
2.6% |
6.9x |
171.7% |
||
|
Liquidity Ratio |
|||||||||||||||||
|
Debt Service Coverage Ratio |
0.0 |
0.0 |
0.0% |
0.0% |
0.0% |
0.0% |
0.0% |
16.5% |
0.0% |
12.1% |
12.2% |
0.1% |
0.0% |
3.7% |
8.1% |
4.4% |
|
|
Implied Capitalization Rate |
1.4% |
1.1% |
(0.3%) |
4.2% |
4.3% |
0.1% |
5.8% |
5.3% |
(0.5%) |
8.0% |
6.5% |
(1.6%) |
5.9% |
4.9% |
4.6% |
(0.3%) |
|
source: Cytonn Research, *ALP is trading in dollars exchange rate used = 129.5 as of 30th June 2026
Key takeaways from the table include;
-
Majority of the REITs remained ungeared during H1’2026, with their leverage ratios remaining at zero except Acorn D-REIT and I-REIT. Acorn D-REIT debt ratios decreased in H1’2026 on account of a 13.8% decrease in its long-term borrowings to Kshs 4.0 bn from Kshs 4.7 bn in H1’2025, Acorn I-REIT debt ratios increased due to the increase in the long term borrowing from kshs 2.1 bn from zero borrowing from H1’2025
-
The total Debt to EBITDA for the two REITs came in at 6.9x in H1’2026 from 2.6x signifying a 171.7% increase. Acorn D-REIT’s Debt to EBITDA Multiple decreased by 20.5% to 6.6x in H1’2026, from 8.3x recorded in H1’2025. This was on the back of a faster drop in the REIT’s long-term borrowings which outpaced the EBITDA’s incline. Acorn D-REIT EBITDA in H1’2026 increased by 8.5% to Kshs 615.1 mn from Kshs 566.8 mn in H1’2025, compared to a 13.8 % decrease in the REIT’s long-term debt, Acorn I-REIT debt to EBITDA came in at 5.8x due to the new long-term borrowings. and,
-
The average Implied Capitalization rate for all REITs came in at 4.6%. Acorn D-REIT traded at the highest implied capitalization rate of 6.5 %, signifying a higher return on investment compared to other REITs. In contrast, Imara I-REIT had the lowest implied capitalization rate of 1.1%.
The table below presents a summary of key valuation metrics of Kenyan REITs in H1’2026;
All figures in Kshs unless stated otherwise
|
Cytonn Report: Summary Performance Kenya REITs in H1’2026 |
|||||||||||||||||
|
|
Imara I-REIT |
ILAM Fahari I-REIT |
Acorn I-REIT |
Acorn D-REIT |
ALP I-REIT* |
All REITs |
Y/Y change |
||||||||||
|
Metric |
H1'2025 |
H1'2026 |
y/y Change |
H1'2025 |
H1'2026 |
y/y Change |
H1'2025 |
H1'2026 |
y/y Change |
H1'2025 |
H1'2026 |
y/y Change |
H1'2026 |
H1'2025 |
H1'2026 |
||
|
Valuation Metrics |
|||||||||||||||||
|
Price/FFO per share |
89.9 |
119.8 |
33.3% |
30.9 |
29.5 |
(4.6%) |
18.2 |
23.9 |
31.9% |
12.7 |
17.6 |
38.6% |
1.1 |
37.9 |
38.4 |
1.2% |
|
|
Dividend Yield |
1.11% |
0.83% |
(0.3%) |
0.0% |
0.0% |
0.0% |
1.3% |
0.7% |
(0.6%) |
0.0% |
0.0% |
0.0% |
0.0 |
0.6% |
0.3% |
(0.3%) |
|
|
Dividend Coverage/Payout Ratio |
77.9% |
74.9% |
(2.9%) |
0.0% |
0.0% |
0.0% |
35.0% |
20.4% |
(14.6%) |
0.0% |
0.0% |
0.0% |
0.0 |
28.2% |
19.1% |
(9.2%) |
|
|
Net Asset Value |
6379.7 |
5868.5 |
(8.0%) |
3567.0 |
3715.4 |
4.2% |
8,617.8 |
9899.0 |
14.9% |
7,716.3 |
8,675.0 |
12.4% |
5396.7 |
26,280.8 |
33,545.7 |
27.6% |
|
|
Net Asset Value per share |
18.4 |
16.9 |
(8.0%) |
19.7 |
20.5 |
4.2% |
23.5 |
24.4 |
3.9% |
27.4 |
29.7 |
8.4% |
135.1 |
22.3 |
45.3 |
103.5% |
|
|
Implied Capitalization Rate |
1.4% |
1.1% |
(0.3%) |
4.2% |
4.3% |
1.3% |
5.8% |
5.3% |
(0.5%) |
8.0% |
6.5% |
(1.6%) |
5.9% |
4.9% |
4.6% |
(0.3%) |
|
|
Annualized Divided Yield |
2.2% |
1.7% |
(0.6%) |
0.0% |
0.0% |
0.0% |
2.6% |
1.4% |
(1.1%) |
0.0% |
0.0% |
0.0% |
0% |
1.2% |
0.6% |
(0.6%) |
|
source: Cytonn Research, *ALP is trading in dollars exchange rate used = 129.5 as of 30th June 2026
-
Imara I-REIT units are trading at a premium relative to its peers, with a Price to FFO per share multiple of Kshs 119.8, and this was an increase of 33.3% from Kshs 89.9 price per FFO per share multiple,
-
Imara I-REIT’s and Acorn I-REIT boasted the highest annualized dividend yield in H1’2026 at 1.7% and 1.4% respectively, surpassing Acron I-REIT’s 0.0%, ALP I-REIT 0.0% and ILAM Fahari I-REIT 0.0%. On the payout side, Imara I-REIT and Acorn I-REIT had payouts of 74.9%, and 20.4%, respectively. All REITs dividend payout did not adhere to Kenya's REIT regulations that mandate distributing at least 80.0% of net profits as dividends,
-
ALP I-REIT recorded the highest NAV per share of Kshs 135.1 (USD 1.04) given the REIT is trading in dollars at an exchange rate of 129.5 as of 30th June 2026. Acorn D-REIT recorded the second highest NAV per share at Kshs 29.7, an 8.4% increase from H1’2025’s NAV per share of Kshs 27.4. This is on the back of an increase in the number of shares, which increased by 3.7% to292.6 mn from Kshs 282.0 mn in H1’2025; and a 12.4% growth in the Net Asset Value (NAV) to Kshs 8.7 bn from Kshs 7.7 mn in H1’2025. Imara I-REIT, Fahari I-REIT and Acorn I-REIT recorded a NAV per share of Kshs 16.9, Kshs 20.5 and kshs 24.4, and,
The REITs registered positive annualized rental returns of 10.6%, 9.4%, 8.4%, 5.7% and 4.4% for Fahari I-REIT, ALP I-REIT, Acorn I-REIT, Acorn D-REIT and Laptrust Amara IREIT respectfully. On average, REITS yields came in at 7.7% showing relatively lower returns as compared to other assets. The chart below shows the comparison of REITs yield performance versus other assets.
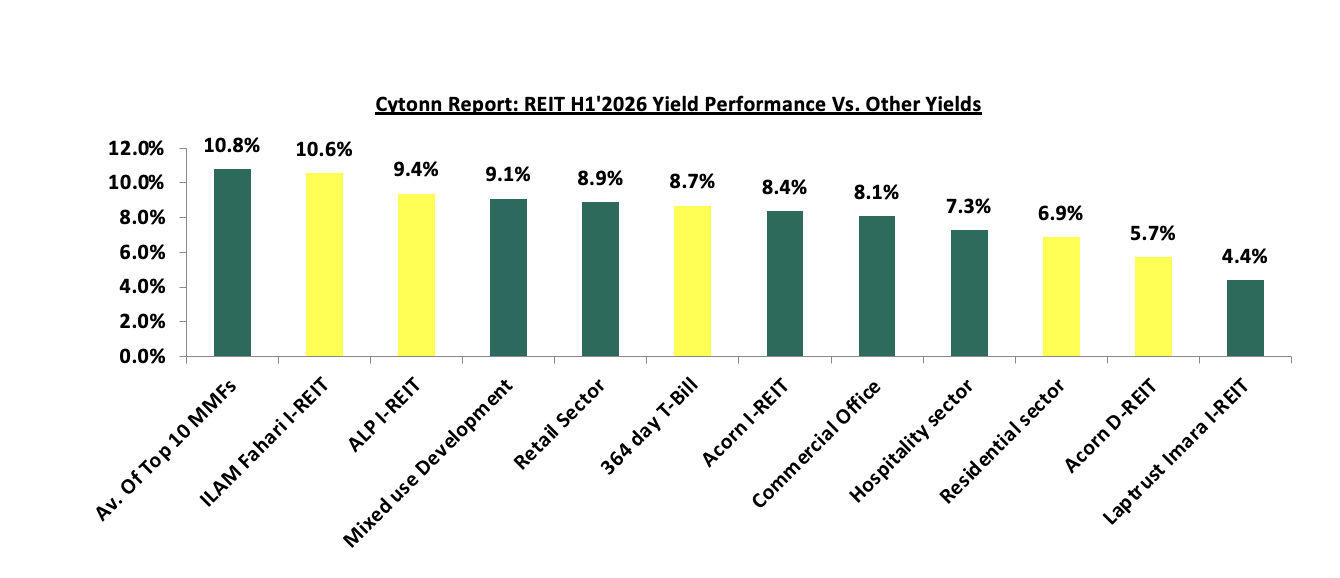
Source: Cytonn Research
Section IV: Conclusion, Recommendations, and Outlook for the REITs Sector
Kenya's REITs market has seen moderate performance, shaped by various factors. Despite challenges, there are encouraging trends, such as growth in net operating incomes, indicating improved financial performance. Additionally, leverage ratios for most REITs have remained low, with many REITs being ungeared and relying on short-term debt for their operations to avoid overexposure to the high interest rates. This trend is expected to continue as REITs seek to maintain financial sustainability.
Recommendations to Enhance the REITs Sector:
-
Stakeholder education: There is an urgent need to enhance understanding of the REIT framework among all key stakeholders. Comprehensive investor education and awareness initiatives should be implemented to clearly communicate both the benefits and risks associated with REIT investments. Improved investor literacy will expand participation, deepen market confidence, and support the long-term growth and sustainability of the REIT sector.
-
Broadening permissible legal structures: In contrast to Kenya’s predominantly trust-based REIT framework, markets such as South Africa, Belgium, and the United States permit REITs to be established under various legal forms, including public limited companies, limited liability companies, cooperatives, and partnerships. This structural flexibility accommodates diverse business models and investor preferences. To enhance the competitiveness and accessibility of Kenya’s REIT market, it is recommended that allowable structures be expanded beyond trusts to include corporate and partnership models. Such diversification would reduce entry barriers and foster a more resilient and dynamic REIT ecosystem.
-
Streamlining the approval and regulatory process: The current REIT approval process involves oversight by both the Capital Markets Authority (CMA) and the Kenya Revenue Authority (KRA), creating procedural duplication and delays. Consolidating the approval function under a single regulatory framework would significantly improve efficiency. A unified approval process would reduce compliance costs, shorten timelines, and enhance transparency, thereby making REIT formation more attractive to issuers and fund managers.
-
Encourage hybrid REIT vehicles: Currently, investors are required to subscribe separately to income and development REITs, resulting in duplicated costs and administrative complexity. Introducing hybrid REIT vehicles that combine development-stage growth potential with stable income-generating assets would offer investors a more balanced risk-return profile. Such structures would simplify investment decisions, reduce costs, and enhance overall market attractiveness.
-
Flexibility in listing: Given the apprehensions of many companies regarding an immediate shift to public listing, a phased approach is recommended. Providing REITs with an initial period of private operation before mandating public listing could ensure a smoother transition and align with corporate comfort levels. For example, Belgium’s model, requiring 30% public shareholding, strikes a balance between public participation and promoter flexibility. Kenya could adopt a similar strategy, or even consider offering REITs the choice between public and private listings, which would foster inclusivity and better accommodate diverse investor preferences while bolstering market liquidity.
-
Lower capital requirement for trustees: Currently, the minimum capital requirement for REIT trustees is set at Kshs 100.0 mn, a threshold that effectively restricts trusteeship primarily to major banking institutions. With only a handful of banks registered as REIT trustees, such as Kenya Commercial Bank (KCB), Co-operative Bank, Housing Finance Bank, and NCBA Bank Kenya, it is recommended that this minimum be reduced to Kshs 10.0 mn. This adjustment, aligning with the minimum standards set for Pension Fund Trustees, would expand the pool of potential trustees and encourage more competitive, innovative service provision for REIT managers.
-
Introduce tokenization of REITs: Embracing the concept of tokenization presents an innovative avenue to broaden market participation. By digitizing REIT units into smaller denominations, potentially allowing investments as low as Kshs 100.0, it becomes possible to lower entry barriers, enhance liquidity, and attract a broader range of investors, including those with limited capital.
-
Diminishing Entry Barriers: Revisiting the current minimum investment requirement of Kshs 0.1 mn for D-REITs and Kshs 5.0 mn for the restricted I-REIT, is essential to eliminate barriers that restrict individual participation. Notably, given that D-REITs are riskier compared to I-REITS, it makes no sense having I-REITs with higher minimum investment requirements compared to D-REITs. Lowering this threshold to Kshs 50,000 for I-REITs would foster a more inclusive investment environment, allowing a wider array of investors to access and benefit from the REIT market, ultimately bolstering overall market vibrancy and liquidity.
The outlook for Kenya's REITs sector remains cautiously optimistic. While challenges such as high construction costs and market saturation in certain areas persist, the continued government support through infrastructure development and affordable housing initiatives provides a positive backdrop. Investors are expected to remain focused on income-generating REITs, particularly those tied to resilient sectors like retail and commercial properties. The sector's growth will likely hinge on increased investor awareness and the broadening of investment options within the REITs market.
In 2026, we expect REITS to continue to gain popularity as developers such as Africa Logistics properties and Centum Real Estate launching dollar based Industrial REIT and Income REIT. We expect that the dollar based I-REITs will: i) increase foreign investments by boosting investors’ confidence against local currency uncertainties, ,ii) dollar-denominated REITs provide an alternative for investors seeking more liquid and globally recognized investment options, iii) the dollar based move is likely to set a precedent for other players in the market, encouraging the development of more innovative and investor-centric financial products, and, iv) the fund could force policy regulatory framework improvement to ensure transparency and investments protection.
In addition, we expect the sector will continue to lag behind in comparison to other African countries such as South Africa, attributable to several challenges facing the sector such as; i) lack of sufficient investor awareness regarding the potential of REITs as an investment tool, ii) lengthy approval procedures for establishing REITs have hindered their formation and deployment in the market, iii) high minimum capital requirement of Kshs 100.0 mn for REIT trustees compared to Kshs 10.0 mn for pension funds Trustees, essentially limiting the licensed REIT Trustee to banks only,, and, iv) steep minimum subscription amounts or offer parcels set at Kshs 0.1 mn for D-REITs and Kshs 5.0 mn for restricted I-REITs.
However, we also expect the trend of strategic acquisitions to persist, with REITs actively seeking opportunities to broaden and diversify their portfolios, cater to evolving market demands and also set standards in promoting environmental sustainability such as execution of green bonds by Acorn holding. While there are supportive factors for the growth of REITs in Kenya, such as urbanization and government infrastructure projects, challenges like high interest rates and regulatory constraints may tamper performance. Stakeholders in the REIT sector are advised to monitor these dynamics closely and engage in strategic planning to navigate the evolving market landscape effectively.
Moving forward, we also expect the trend of strategic acquisitions to persist, with REITs actively seeking opportunities to broaden and diversify their portfolios, cater to evolving market demands and also set standards in promoting environmental sustainability such as execution of green bonds by Acorn holding.
Disclaimer: The views expressed in this publication are those of the writers where particulars are not warranted. This publication, which is in compliance with Section 2 of the Capital Markets Authority Act Cap 485A, is meant for general information only and is not a warranty, representation, advice, or solicitation of any nature. Readers are advised in all circumstances to seek the advice of a registered investment advisor.

- Talk to us
- Kenya
- P.O Box 20695 - 00200, Nairobi, Kenya
- Cell +254709101200
- Tel +254709101200
- WhatsApp +254741676635
- United States
- +254709101200
- DOWNLOAD OUR APP
-


- Kenya
- 8th Floor, Pinetree Plaza, Kaburu Drive, Ngong Road, Nairobi, Kenya
- USA
- Suite 1150, 1775 Eye Street NW, USA, Washington DC 20006, USA
- Investments
- High Yield
- Private Equity
- Real Estate
- Real Estate
- RiverRun Estates
- Cytonn Towers
- The Ridge
- Taraji Heights
- The Alma