Nairobi Commercial Office Report, & Cytonn Weekly #10/2018
By Cytonn Research Team, Mar 11, 2018
Executive Summary
Fixed Income
Treasury bills were oversubscribed during the week, with the overall subscription rate at 155.0%, compared to 155.8% recorded the previous week. Yields on the 91, 182 and 364-day T-bills remained unchanged at 8.0%, 10.4%, and 11.1%, respectively. Stanbic Bank released their Monthly Purchasing Manager’s Index (PMI) for February, which indicated that the business operating environment in the country improved, with the index coming in at 54.7 in February, up from 52.9 in January;
Equities
During the week, the equities market registered mixed performance, with NASI and NSE 20 declining 0.4% and 1.0%, respectively, while NSE 25 rose 0.5%. KCB Group and Stanbic Holdings released FY’2017 results. KCB Group registered a flat growth in core earnings per share, while Stanbic Holdings registered a 2.5% decline in core earnings per share;
Private Equity
According to a report by the East Africa Private Equity and Venture Capital Association (EAVCA), private equity and venture capital firms injected Kshs 43.6 bn (USD 430.0 mn) into the Kenyan economy in 2017, a 26.4% increase from Kshs 34.5 bn (USD 340 mn) worth of deals recorded in 2016. South-African based private equity fund Uqalo has invested Kshs 404.0 mn (USD 4.0 mn) to acquire an undisclosed stake in Kenyan fast food chain Big Square;
Real Estate
During the week, Knight Frank released the 2018 Wealth Report according to which, the number of ultra-high net-worth individuals in Kenya worth USD 50.0 mn excluding their primary residence increased by 13.0% to 90 in 2017 from 80 in 2016, and is further expected to grow by 56.0% by 2022; while those worth USD 5.0 mn excluding their primary residence increased by 16.2% to 1,290 in 2017 from 1,110 in 2016, and are expected to grow by 60.5% by 2022. The number of individuals with a net-worth of USD 500.0 mn remain below 10 and are projected to remain below 10 for the next 5-years;
Focus of the Week
This week we focus on the office market in Nairobi. We cover supply, demand and performance in terms of rents, yields and occupancy rates by nodes and by class in 2017, the opportunity in the sector and conclude by giving an outlook for the theme. According to the report, increased supply has constrained performance with occupancy rates declining by 4.8% y/y from 88.0% in 2016 to 83.2% in 2017 and rental yields declining by 0.1% points y/y from 9.3% in 2016 to 9.2% in 2017. The market had an oversupply of 4.7 mn SQFT in 2017, an increase of 62.1% from the oversupply of 2.9 mn SQFT recorded in 2016 and this is expected to grow by 12.8% to 5.3 mn SQFT in 2018. The significant increase in oversupply was mainly due to a decrease in occupancy levels of 4.8% y/y as a result of reduced demand constrained by the protracted electioneering period and low credit supply in the market. We therefore recommend that any investments in the commercial office sector to be purely long term with expected returns in 3-5 years and be limited to more resilient segments such as Grade A offices in markets with low supply and differentiated concepts such as serviced offices with rental yields of 13.4%.
- Our Investments Analyst, Caleb Mugendi, discussed the pre-tax profit for KCB. Watch Caleb on CNBC here
- Our Investments Analyst, Stephanie Onchwati, discussed the Kenyan Public Debt. Watch Stephanie on KU (Kenyatta University) TV here
- We continue to hold weekly workshops and site visits on how to build wealth through real estate investments. The weekly workshops and site visits target both investors looking to invest in real estate directly and those interested in high yield investment products to familiarize themselves with how we support our high yields. Watch progress videos and pictures of The Alma, Amara Ridge, The Ridge, and Taraji Heights. Key to note is that our cost of capital is priced off the loan markets, where all-in pricing ranges from 16.0% to 20.0%, and our yield on real estate developments ranges from 23.0% to 25.0%, hence our top-line gross spread is about 6.0%. If interested in attending the site visits, kindly register here
- We continue to see very strong interest in our weekly Private Wealth Management Training (largely covering financial planning and structured products). The training is at no cost and is open only to pre-screened participants. We also continue to see institutions and investment groups interested in the trainings for their teams. The Wealth Management Trainings are run by the Cytonn Foundation under its financial literacy pillar. If interested in our Private Wealth Management Training for your employees or investment group please get in touch with us through wmt@cytonn.com or book through this link Wealth Management Training. To view the Wealth Management Training topics, click here
- For recent news about the company, see our news section here
- We have 10 investment-ready projects, offering attractive development and buyer targeted returns of around 23.0% to 25.0% p.a. See further details here: Summary of Investment-Ready Projects
- We continue to beef up the team with ongoing hires for: Clerks of Works, Financial Advisor and Unit Manager for Mt Kenya Region, among others. Visit the Careers section at Cytonn’s Website to apply
Treasury bills were oversubscribed during the week, with the overall subscription rate at 155.0%, compared to 155.8% recorded the previous week. The subscription rates for the 91, 182 and 364-day papers came in at 96.1%, 149.7%, and 183.8% compared to 192.3%, 163.3%, and 133.7%, respectively, the previous week. Yields on the 91, 182 and 364-day T-bills remained unchanged at 8.0%, 10.4%, and 11.1%, respectively. The overall acceptance rate increased to 87.8% compared to 81.9% the previous week, with the government accepting a total of Kshs 32.7 bn of the Kshs 37.2 bn worth of bids received, against the Kshs 24.0 bn on offer. The government is ahead of its domestic borrowing target for the current fiscal year, having borrowed Kshs 219.7 bn, against a target of Kshs 206.0 bn (assuming a pro-rated borrowing target throughout the financial year of Kshs 297.6 bn from the 2018 Budget Policy Statement (BPS)).
For the month of March 2018, the Kenyan Government has issued two new bonds, a 5-year (FXD 1/2018/5) and a 20-year (FXD 1/2018/20) with the 5-year coupon to be market-determined and the 20-year coupon set at 13.2%. The government will be seeking to raise Kshs 40.0 bn for budgetary support. We shall give our view on a bidding range in next week’s report.
Liquidity levels remains stable in the market as indicated by the slight decline in the interbank rate to 4.7%, from 5.0% recorded the previous week, and also the decline in the average volumes traded in the interbank market by 2.5% to Kshs 13.5 bn from Kshs 13.8 bn the previous week, as larger banks dominated the market borrowing at low rates.
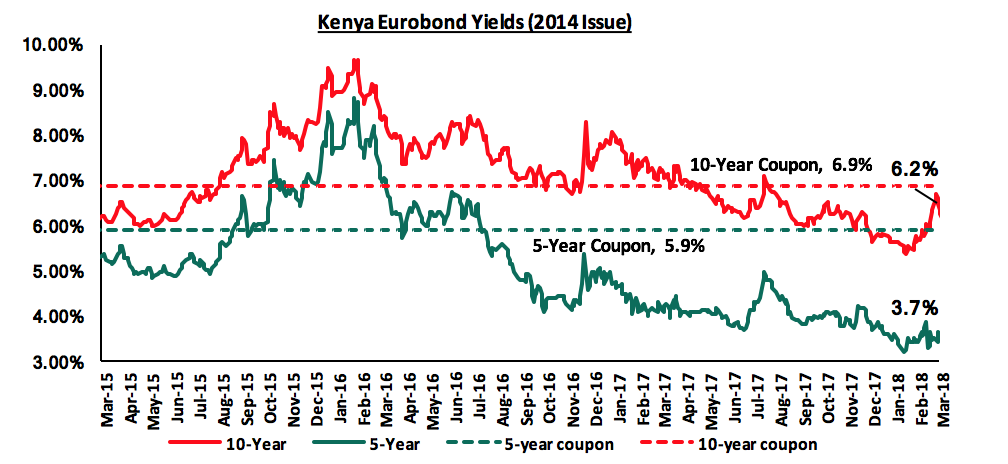
According to Bloomberg, the yield on the 5-year Eurobond issued in June 2014 remained unchanged at 3.7%, while the yield on the 10-year Eurobond (2014) increased by 10 bps to close at 6.2% from 6.3%, respectively, the previous week. Since the mid-January 2016 peak, yields on the Kenya Eurobonds have declined by 5.1% points and 3.4% points for the 5-year and 10-year Eurobonds, respectively, due to the relatively stable macroeconomic conditions in the country.
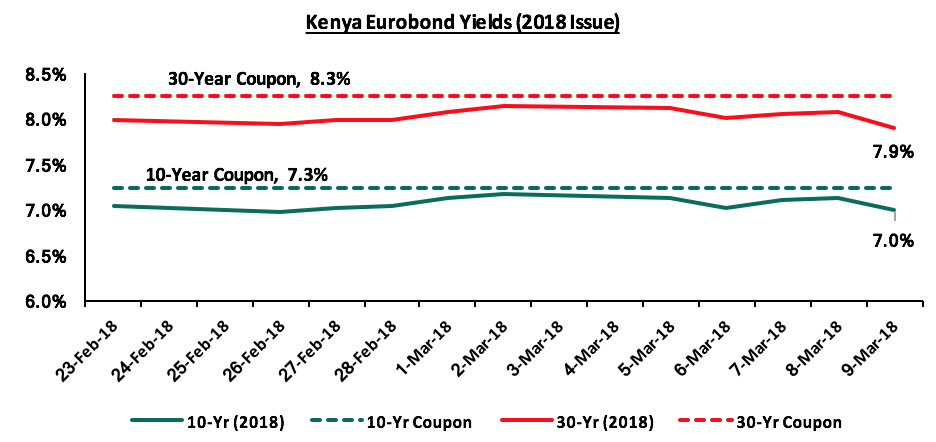
For the February 2018 issue, during the week, the yields on the 10-year and 30-year Eurobonds have decreased by 20 bps each to close the week at 7.0% and 7.9% from 7.2% and 8.1%, respectively. Since the issue date, the yield on the 10-year has remained unchanged while the yield on the 30-year Eurobond has declined by 0.1% points, indicating foreign investor confidence in Kenya’s strong and relatively diversified economy.
The Kenya Shilling appreciated marginally by 0.1% against the US Dollar, during the week, to close at Kshs 101.2, from Kshs 101.3 the previous week, due to end month inflows from horticultural export earnings. On a YTD basis, the shilling has gained 1.9% against the USD. In our view, the shilling should remain relatively stable against the dollar in the short term, supported by:
- Weakening of the USD in the global markets as indicated by the US Dollar Index, which shed 9.9% in 2017, and has shed 2.3% YTD,
- Improving diaspora remittances, which increased by 26.6% to USD 203.8 mn in December 2017 from USD 160.9 mn in December 2016, driven by a 39.2% and 30.9% increase in remittances from North America and Europe, respectively,
- CBK’s intervention activities, as they have sufficient forex reserves, currently at USD 7.2 bn (equivalent to 4.8 months of import cover). Key to note is that an IMF team is still in Nairobi discussing a possible new program. Kenya has also requested for a 6-month extension on the USD 1.5 bn stand-by credit facility by the IMF to allow for completion of outstanding reviews of the program, a request which will be put to the board before expiry. Previously, the IMF had decided to withdraw the facility effective 13th March 2018 as conditions previously agreed upon for the facility to be extended had not been met, and,
- A possible increase in the forex reserves following the successful issuance of the Eurobond.
Stanbic Bank released their Monthly Purchasing Manager’s Index (PMI) for February, which indicated that the business operating environment in the country improved, with the index coming in at 54.7 in February, up from 52.9 in January. The rise was driven by an increase in output and new orders, supported by increasing underlying demand and a rise in new business. The business environment has been improving since January as seen from the improving PMI index, above the 50.0 mark that signals improving conditions, increasing output and increased staffing by production firms as a result. This is expected to support economic growth and lead to stronger GDP growth this year. We maintain our outlook of 5.4% GDP growth in 2018, driven by growth in manufacturing, tourism, construction and real estate sectors, and recovery of the agriculture sector.
According to Africa Oil, one of the partner companies developing the country’s first oilfield, construction of the oil export pipeline is supposed to start mid this year. It is estimated that oil will earn Kenya about a tenth of revenue once production is at its peak - as per the 2017/18 budget, this is about Kshs 164 bn. Production will start in 2021/22, starting with 210 mn barrels of oil (capacity is 560 mn). Daily production will start at 60,000 - 80,000 barrels per day (bpd), potentially increasing to 100,000 bpd, which is not as high as in other countries in SSA, which have production as follows: (i) Nigeria currently at 180,000 bpd and planning to increase this to 300,000 bpd in 2018 and 500,000 bpd by 2020, and (ii) Ghana with 123,000 bpd, expected to rise to 250,000 bpd in 2018. The first stage of production and construction of the pipeline are estimated at costs of USD 2.9 bn and USD 1.1 bn, respectively. In our view, this will further contribute to revenue collections in the fiscal year 2021/22 onwards and support the government’s plan to reduce the budget deficit to 3.0% of GDP by then as per the 2018 BPS, if they manage to keep expenditure in check.
Given the changes in government borrowing that we have witnessed so far in 2018, we carried out a review of the seven indicators of interest rates that we track in order to re-evaluate our view. The table below highlights the different economic drivers, and their effects on interest rates:
|
Macro-Economic Indicators |
2017 Experience |
YTD Experience |
Outlook Going Forward |
Previous View |
Current View |
|
Government Borrowing |
Government has been behind its target on its domestic borrowing schedule since the fiscal year 2017/18 begun, currently having borrowed Kshs 61.0 bn against a pro-rated target of Kshs 140 bn
The government had met 39.2% of its H1’2017/18 foreign borrowing target |
The domestic borrowing target was revised downwards to Kshs 297.6 bn from Kshs 410.2 bn, taking the government ahead of their domestic borrowing target, having borrowed Kshs 219.7 bn against a pro-rated target of Kshs 206.0 bn
The government has met 69.9% of its total foreign borrowing target following issue of the Kshs 202.0 bn Eurobond |
Government to be under no pressure to borrow as it is ahead of both domestic and foreign pro-rated borrowing targets for FY 2017/18, and KRA is not significantly behind its target Past June, at the start of the next fiscal year however, the government will once again begin a new borrowing cycle. However, with the petition by the Treasury to amend the Division of Revenue Act 2017 and reduce expenditure by counties and an expected improvement in revenue collections, the borrowing targets for the next fiscal year might be lower |
Negative |
Positive |
|
Revenue Collection |
The KRA missed their collection target for the 2016/2017 FY having collected Kshs 1.4 tn against a target of Kshs 1.5 tn. The 2017/2018 FY target was set at Kshs 1.7 tn. As per the Q1’2017/18 budget review, the KRA met 89.1% of its first quarter target |
The KRA collected Kshs 709.4 bn, 91.2% of their target for H1’2017/18 and 86.3% of the pro-rated target for the same |
KRA is unlikely to meet its collection target due to expected suppressed corporate earnings in 2017, which is half of the fiscal year. However, KRA is not expected to be significantly behind target, that can be easily plugged in from the local market borrowing Corporate earnings are expected to be better this year than last year, with earnings growth expected at 12.0% in 2018, higher than the expected 8.0% growth for 2017. This coupled with the VAT on petroleum products effective September 2018 is expected to boost revenue collections in the next fiscal year |
Negative |
Neutral |
|
Monetary Policy |
CBR has been maintained at 10.0% throughout 2017 The 91 Day T-Bill hit 8.0% from 8.8% recorded at the end of January 2017 |
In the January 2018 MPC meeting, the committee maintained the CBR at 10.0% |
No upward pressure on interest rates, with the government ahead of its pro-rated borrowing targets for the fiscal year. Also, with the Banking (Amendment) Act, 2015, the MPC might be unable to do much with the CBR which has remained at 10.0% throughout 2017 |
Neutral |
Neutral |
|
Inflation |
Inflation declined to 5.7% in October from 7.1% in September, on account of improved weather conditions. The inflation rate hit a high of 11.7% in May, driven by an increase in basic food prices, and was at 7.0% in January The YTD average inflation rate is 8.7%, compared to 6.3% in the same period last year |
Inflation in January and February 2018 came in at 4.8% and 4.5%, with y/y inflation remaining low mainly due to the base effect but m/m inflation rising due to increasing food, fuel, electricity and transport prices |
Inflation to average 7.5% in 2018, which is at the upper limit of the 2.5% - 7.5% government target |
Positive |
Positive |
|
Exchange Rate |
The shilling has depreciated by 1.2% against the dollar YTD, having remained relatively stable for the better part of the year, with volatility only witnessed during the election period following the August 8th election and the repeat presidential poll on 26th October. Volatility was mainly driven by speculation in the forex market and demand from oil importers |
The Shilling has appreciated by 1.9% against the USD YTD to Kshs 101.2 from Kshs 103.2 at the end of December 2017, hitting a high of Kshs 100.8 due to increased flower exports to the Eurozone in mid-February |
We expect the currency to remain relatively stable against the dollar due to a weaker USD in the global markets and It is also important to note that the CBK has sufficient reserves (USD 7.2 bn - equivalent to 4.8 months of import cover) to support the shilling in the short term. However, a worsening current account deficit, which worsened to 7.0% of GDP in Q3’2017, as compared to 6.0% of GDP in a similar period last year, may have a negative effect |
Neutral |
Neutral |
|
Investor Sentiments |
Investor sentiment has been high, with foreign investors entering the market in search of attractive valuations, amid a relatively peaceful election period. However, foreign investors were net sellers in 2017, with a net outflow of USD 117.1 mn compared to net inflows of USD 88.8 mn recorded in 2016 |
The Kenya Eurobond was 7.0x oversubscribed partly showing the appetite for Kenyan securities by the foreign community, and investor confidence in Kenya’s stable and relatively diversified economy |
Given (i) the now settling operating environment following the elections in Q3’2017, (ii) the expectation that long term investors will enter the market seeking to take advantage of the valuations which are still historically low, and (iii) expectations of a relatively stable shilling, we expect investor sentiment to improve in 2018 |
Positive |
Positive |
|
Security |
In January, the U.S. Department of State issued a travel warning regarding threats by Al-Shabaab on the Somalia border, coastal and north-eastern counties. In March, the U.K government issued a warning due to security concerns in parts of Laikipia County. As the election date approached, security was beefed up across the country |
The political climate in the country has eased, compared to Q3’2017 with security maintained and business picking up |
We expect security to be maintained in 2018, especially given that the elections are now concluded and the government is settling into office |
Positive |
Positive |
Fixed Income Conclusion:
Of the 7 indicators we track, previously, we were negative on government borrowing and revenue collection. Upon review, 4 are positive (government borrowing, inflation, investor sentiment and security) and 3 are neutral (revenue collection, monetary policy and currency). The outlook on government borrowing and revenue collection has changed from negative to positive and neutral, respectively. Rates in the fixed income market have remained stable as the government rejects expensive bids. With the government under no pressure to borrow for this fiscal year as (i) they are currently ahead of their domestic borrowing target by 14.3%, (ii) have met approx. 103.9% of their pro-rated foreign borrowing target, and (iii) the KRA is not significantly behind target in revenue collection, we expect interest rates to remain stable. With the expectation of a relatively stable interest rate environment, our view is that investors should be biased towards medium term fixed income instruments.
Note that we have changed our fixed income view from a short term bias to a medium term bias.
During the week, the equities market recorded mixed performance, with NASI and NSE 20 declining 0.4% and 1.0%, respectively, while NSE 25 rose 0.5% taking their YTD performance to 5.5%, 0.2% and 7.6% for NASI, NSE 20 and NSE 25, respectively. This week’s performance was due to gains in Equity Group and KCB Group that rose 3.8% and 2.1%, respectively. For the last twelve months (LTM), NASI, NSE 20 and NSE 25 gained 50.7%, 26.1%, and 44.4%, respectively.
Equities turnover declined 19.0% to USD 46.2 mn from USD 57.0 mn registered last week. We expect the market to remain supported by positive investor sentiment this year, as investors take advantage of the attractive stock valuations on select counters.
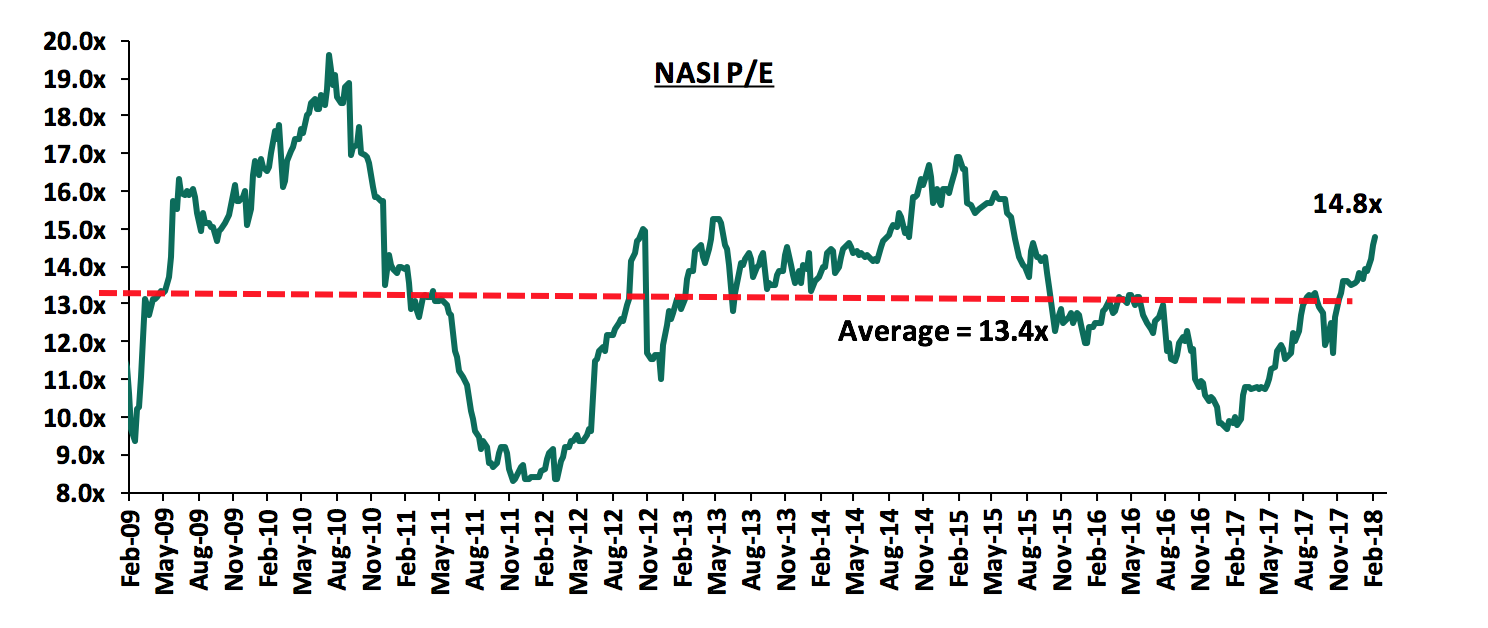
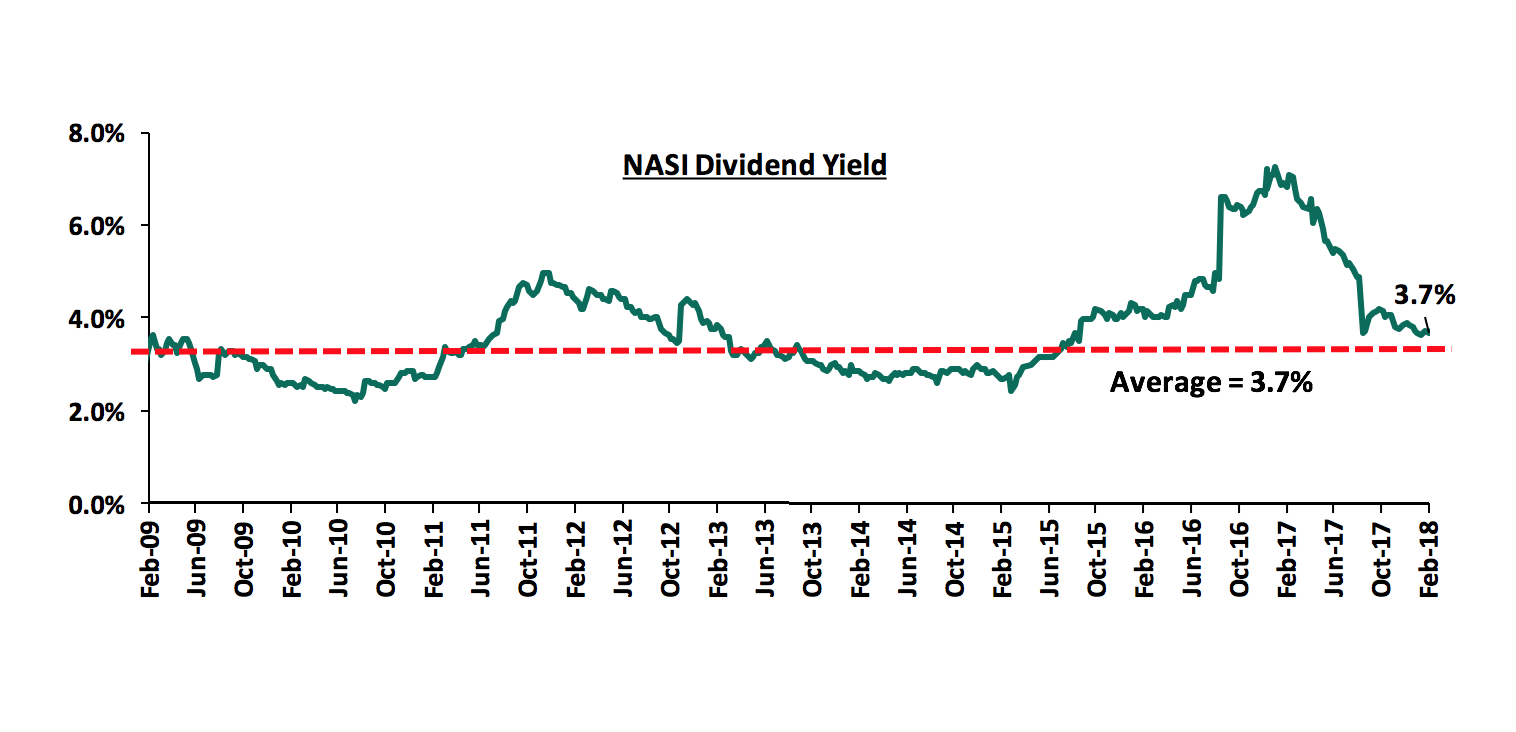
The market is currently trading at a price to earnings ratio (P/E) of 14.8x, which is 10.3% above the historical average of 13.4x, and a dividend yield of 3.7%, similar to the historical average of 3.7%. The current P/E valuation of 14.8x is 52.6% above the most recent trough valuation of 9.7x experienced in the first week of February 2017, and 78.1% above the previous trough valuation of 8.3x experienced in December 2011.
KCB Group released FY’2017 results during the week
KCB Group released FY’2017 results, with its core earnings per share flat at Kshs 6.4 similar to FY’2016, compared to our expectation of a slight increase to Kshs 6.5. Performance was driven by a 2.7% increase in operating income, despite a 4.7% increase in operating expenses. Highlights for the performance from FY’2016 to FY’2017 include:
- Total operating revenue grew by 2.7% y/y to Kshs 71.4 bn from Kshs 69.5 bn, driven by slight increases in both Net Interest Income (NII) and Non Funded Income (NFI). NII rose by 2.9% to Kshs 48.4 bn from Kshs 47.0 bn in FY'2016, while NFI rose 2.5% to Kshs 23.0 bn from Kshs 22.5 bn in FY'2016,
- Interest Income rose by 1.4% to Kshs 63.7 bn from Kshs 62.8 bn in FY’2016. The interest income on loans and advances alone declined by 0.8% y/y to Kshs 50.8 bn from Kshs 51.2 bn, while interest income on government securities grew by 13.8% y/y to Kshs 12.4 bn from Kshs 10.9 bn. As a result, the yield on interest-earning assets declined to 11.5% from 12.2% in FY’2016,
- Interest expense decreased by 3.1% to Kshs 15.3 bn from Kshs 15.8 bn in FY’2016, following a 6.0% decline in interest expense on customer deposits to Kshs 13.6 bn from Kshs 14.5 bn, thus bringing down the cost of funds to 3.0% from 3.3% in FY’2016. The Net Interest Income increased 2.9% to Kshs 48.4 bn from Kshs 47.0 bn. The Net Interest Margin however declined to 8.7% from 9.2% in FY'2016, owing to a faster growth in interest earning assets,
- Non-Funded Income (NFI) recorded a growth of 2.5% to Kshs 23.0 bn from Kshs 22.5 bn in FY'2016. The growth in NFI was driven by a 50.0% increase in other fees and commissions to Kshs 9.1 bn from Kshs 6.1 bn in FY'2016, despite a 14.7% decline in fees and commissions on loans to Kshs 5.6 bn from Kshs 6.6 bn in FY'2016. The current revenue mix stands at 68:32 funded to non-funded income, same as in FY’2016, owing to a similar increase in both the NII and NFI,
- The 50.0% increase in other fees and commissions was driven by growth in commissions from alternative banking channels including digital platforms and agency banking. The volume of transactions made through these alternative channels increased to 87% from 77% in FY’2016,
- Total operating expenses increased by 4.7% to Kshs 42.3 bn from Kshs 40.4 bn, driven by a 54.7% increase in Loan Loss Provisions to Kshs 5.9 bn from Kshs 3.8 bn in FY'2016, coupled with an 8.1% increase in staff costs to Kshs 19.1 bn from Kshs 17.7 bn in FY'2016. Increases in LLP and staff costs were offset by a 15.2% decline in other operating expenses to Kshs 12.6 bn from Kshs 14.9 bn in FY'2016. The growth in staff costs is attributed to the staff rationalization programme that saw 316 staff released from service (249 from KCB Bank Kenya and 67 in KCB Subsidiaries), that cost Kshs 2.0 bn to rollout, whose costs are expected to be recovered within 18-months,
- The Cost to Income ratio deteriorated to 59.2% from 58.1% in FY'2016. Without LLP, the Cost to Income ratio improved to 50.9% from 52.6% in FY'2016,
- Profit before tax remained flat at Kshs 29.1 bn. Profit after tax was also flat at Kshs 19.7 bn,
- The bank recommends a final dividend of Kshs 2.0 per share, having already paid an interim dividend of Kshs 1.0 per share, translating to a total dividend payout of Kshs 3.0 per share, unchanged from 2016, translating to a dividend yield of 4.1%.
- The total assets increased by 8.6% to Kshs 646.7 bn from Kshs 595.2 bn in FY'2016. This growth was driven by a 9.6% growth in the loan book to Kshs 422.7 bn from Kshs 385.7 bn in FY’2016. Investment in government and other securities increased by 7.4% to Kshs 110.0 bn from Kshs 102.5 bn in FY'2016,
- Total liabilities rose by 8.4% to Kshs 540.7 bn from Kshs 498.7 bn in FY'2016, driven by an 11.5% increase in deposits to Kshs 499.5 bn from Kshs 448.2 bn in FY'2016. Deposits per branch increased 10.2% to Kshs 1.9 bn from Kshs 1.7 bn in FY’2016,
- Shareholders’ funds increased by 12.2% to Kshs 103.2 bn from Kshs 92.0 bn in FY’2016, due to a 14.4% y/y increase in retained earnings to Kshs 63.0 bn from Kshs 55.0 bn,
- The faster growth in deposits compared to the loan book led to a decline in the loan to deposit ratio to 84.6% from 86.1% in FY'2016,
- Gross non-performing loans increased by 17.9% to Kshs 37.5 bn from Kshs 31.8 bn. The NPL ratio thus deteriorated to 8.4% from 7.8% in FY’2016, due to the faster growth NPLs in the loan book,
- KCB Group is currently sufficiently capitalized with a core capital to risk weighted assets ratio at 15.4%, 4.9% above the statutory requirement, with total capital to total risk weighted assets at 16.6%, exceeding statutory requirement by 2.1%
Going forward, we expect KCB’s growth to be propelled by;
- Channel diversification to more efficient and customer convenient channels such as mobile and digital channels that allow for more transactional fee based income, thus increasing its Non Funded Income. KCB’s Funded to Non Funded Income ratio of 68:32 is still below peer average of 66:34 in terms of NFI contribution to total revenue,
- Improvements in asset quality, with the increase in NPLs causing KCB’s Gross Non-Performing Loans ratio to deteriorate to 8.4%, which is above peer average of 8.2%.
For a comprehensive analysis, see our KCB Group FY’2017 Earnings Note.
Stanbic Holdings released FY’2017 results
Stanbic Holdings released FY’2017 results, registering a 2.5% decline in its core earnings per share to Kshs 10.9 from Kshs 11.2 in FY’2016, driven by a 9.6% growth in operating expenses that outpaced a 3.0% rise in operating revenue. Highlights for the performance from FY’2016 to FY’2017 include:
- Total operating revenue rose by 3.0% to Kshs 19.1 bn from Kshs 18.5 bn in FY’2016. This was supported by a 10.0% growth in Non-Funded Income, despite a 2.0% decline in Net Interest Income,
- Stanbic Bank’s interest income declined by 3.0% to Kshs 16.6 bn from Kshs 17.1 bn in FY’2016, owing to an 8.9% decline in interest income on Government securities to Kshs 4.3 bn from Kshs 4.7 bn in FY’2016. Interest income on loans and advances remained relatively flat at Kshs 12.1 bn. As a result, the yield on interest-earning assets declined to 8.1% from 9.3% in FY’2016,
- Stanbic Bank’s interest expense decreased by 5.3% to Kshs 6.0 bn from Kshs 6.3 bn in FY’2016. The costs of funds also declined to 3.4% from 4.0% in FY’2016. The Group’s Net Interest Income (NII) declined by 2.0% to Kshs 10.6 bn from Kshs 10.9 bn in FY’2016. The Net Interest Margin thus declined to 5.2% from 5.9% in FY'2016,
- Non-Funded income (NFI) recorded an increase of 10.0% to Kshs 8.4 bn from Kshs 7.7 bn in FY’2016. The increase in NFI was driven by a 31.5% y/y rise in foreign exchange income to Kshs 4.4 bn from Kshs 3.4 bn and a 43.6% increase in other fees and commissions to Kshs 3.2 bn from Kshs 2.2 bn in FY’2016. With the NFI rising while the NII declined, the proportion of NFI to total revenue increased, with the current revenue mix at 56:44 funded to non-funded income from 59:41 in FY’2016,
- Total operating expenses grew by 9.6% to Kshs 13.7 bn from Kshs 12.5 bn in FY’2016 following a 57.6% y/y growth in Loan loss provision (LLP) to Kshs 2.8 bn from Kshs 1.8 bn. Without LLP, operating expenses increased by 1.7% to Kshs 10.9 bn from Kshs 10.7 bn registered in FY’2016,
- Cost to income ratio worsened to 71.7% from 67.3% in FY’2016. Without LLP, the cost to Income ratio improved slightly to 57.2% from 57.9% in FY’2016,
- Profit before tax declined 10.7% to Kshs 5.4 bn from Kshs 6.1 bn while profit after tax (PAT) declined by 2.5% to Kshs 4.3 bn from Kshs 4.4 bn in FY’2016, owing to a decline in the effective tax yield to 20.2% from 27%,
- The bank recommends a final dividend of Kshs 4.0 per share, having already paid an interim dividend of Kshs 1.25 per share, translating to a total dividend payout of Kshs 5.25 per share, unchanged from 2016, translating to a dividend yield of 4.9%,
- The balance sheet recorded an expansion in FY’2017, with total assets increasing by 15.9% to Kshs 248.7 bn from Kshs 214.7 bn in FY’2016, driven by a 42.6% increase in investment securities and an 8.1% rise in the loan book,
- The Loan book grew by 8.1% to Kshs 143.3 bn from Kshs 132.6 bn in FY'2016, while investment securities rose by 42.6% to Kshs 71.3 bn from Kshs 50.0 bn in FY’2016,
- Total liabilities increased by 17.9% to Kshs 205.8 bn from Kshs 174.5 bn in FY’2016, while shareholders’ funds increased by 7.0% to Kshs 43.0 bn from Kshs 40.1 bn,
- Customer deposits grew by 24.1% to Kshs 193.4 bn from Kshs 155.8 bn in FY’2016. Deposits per branch increased by 28.2% to Kshs 7.4 bn from Kshs 5.8 bn per branch. The faster growth in deposits compared to loans led to a decline in the loan to deposit ratio to 74.1% from 85.1% in FY’2016,
- Gross non-performing loans grew by 47.7% to Kshs 10.4 bn from Kshs 7.0 bn in FY’2016, faster than the growth in loans, which saw the NPL ratio worsen to 7.0% from 5.2% in FY’2016,
- Stanbic Bank is currently sufficiently capitalized with a core capital to risk weighted assets ratio at 15.4%, 4.9% above the statutory requirement, with total capital to total risk weighted assets exceeding statutory requirement by 2.4% to close the period at 16.9%.
Despite the decreased profitability, going forward, we expect Stanbic’s growth to be driven by;
- Cost efficiency, as the cost to income ratio of 71.7% is worse than peer average of 60.3%,
- Improvements in asset quality, with the increase in NPLs causing Stanbic’s Gross Non-Performing Loans ratio to deteriorate to 7.0%, which is however still below peer average of 8.4%.
For a comprehensive analysis, see our Stanbic Holdings FY’2017 Earnings Note.
Below is a summary of the FY’2017 results for the three listed banks that have released, and key take-outs from the results:
|
Listed Banks FY'2017 Earnings and Growth Metrics |
||||||||||
|
Bank |
Core EPS Growth |
Interest Income Growth |
Interest Expense Growth |
Net Interest Income Growth |
Non-Funded Income (NFI) Growth |
NFI to Total Operating Income |
Growth in Total Fees& Commissions |
Deposit Growth |
Loan Growth |
Growth in Govt. Securities |
|
KCB Group |
(0.1%) |
1.4% |
(3.1%) |
2.9% |
2.5% |
32.2% |
16.4% |
11.5% |
9.6% |
7.4% |
|
Stanbic |
(2.5%) |
(3.0%) |
(5.3%) |
(2.0%) |
10.0% |
44.2% |
38.6% |
24.1% |
8.1% |
42.6% |
|
Barclays Bank |
(6.4%) |
(3.4%) |
(7.2%) |
(2.4%) |
(9.5%) |
27.9% |
8.6% |
12.5% |
(0.7%) |
20.1% |
|
Weighted Average |
(2.0%) |
(0.4%) |
(4.4%) |
0.9% |
0.5% |
32.7% |
17.4% |
13.4% |
6.9% |
15.2% |
|
* *The weighted average is based on Market Cap as at 9th March, 2018 |
||||||||||
Key takeaways:
- None of the 3 banks has recorded a growth in core earnings per share, with the average decline in core earnings across the banking sector at 2.0%, owing to the tough operating environment as a result of the interest rate caps and political uncertainty in the country that affected the business environment,
- Average deposit growth came in at 13.4%. However, despite the average deposits having grown, the interest expense paid on deposits recorded a negative growth of 4.4% on average, indicating that banks are growing deposits but opening less interest earning accounts and possibly transferring some existing interest earning accounts to transaction accounts,
- Average loan growth has been recorded at 6.9%, however interest income has decreased by 0.4%, showing the effects of the rate caps,
- Investment in government securities has grown by 15.2% outpacing loan growth of 6.9%, showing increased lending to the government by banks as they avoid the risky borrowers,
- Non-funded income has however grown by 0.5%, which included a Fee and Commissions growth of 17.4%. This shows that banks are charging more fee income to improve their income on loans above the rate cap maximum.
The International Finance Corporation (IFC), World Bank’s private sector lending arm, has advanced a Kshs 15.2 bn loan to Co-operative Bank. The loan is meant for onward lending to small firms, and its tenure is seven-years. The loan benefits Co-operative Bank as the long term funding is at attractive interest rates, while IFC will also meet its social investment goals of expanding credit to SMEs in the agricultural, manufacturing and trade sectors. IFC has invested in more than 150 local companies including Britam, KTDA, Goodlife Pharmacy and KCB Group.
The Arab Bank for Economic Development in Africa (BADEA) has opened a line of credit with HF Group for Kshs 1.5 bn, which is also meant for lending to the SME sector. The facility is meant to complement HFC’s strategic initiative for its SME and retail banking segment. It will also play a pivotal role in financing the working capital and expansion of the bank’s growing SME customer base. This highlights the trend that many Kenyan banks are looking for cheaper long term financing that global banks are willing and able to provide.
In an effort to keep our rankings of companies on the Cytonn Corporate Governance Ranking (Cytonn CGR) Report up-to-date, we continually update the rankings whenever there are changes on any of the 24 metrics that we track, and how this affects the company ranking. This week, Barclays Bank Kenya appointed Mr. Japheth Olende and Mr. Louis Onyango as independent Non-Executive Directors. Barclays Bank’s gender diversity declined slightly to 40.0% from 50.0%, but still maintains the top score of 1.0, as it still has more than 33% gender diversity. In addition, the increase in board size to 10 members from an initial 8 members maintains the board at an even number with a score of 0.5. Barclays Bank therefore maintained its overall score at 79.2% and its ranking at position 9.
Below is our Equities Universe of Banking Coverage:
|
all prices in Kshs unless stated otherwise |
|||||||||||
|
No. |
Company |
Price as at 2/03/18 |
Price as at 9/03/18 |
w/w Change |
YTD Change |
LTM Change |
Target Price* |
Dividend Yield |
Upside/ (Downside)** |
||
|
1. |
NIC*** |
37.0 |
37.5 |
1.4% |
9.6% |
54.6% |
61.4 |
3.5% |
70.6% |
||
|
2. |
Ghana Commercial |
6.1 |
4.8 |
(21.5%) |
(5.9%) |
(3.1%) |
7.7 |
7.7% |
70.2% |
||
|
3. |
DTBK |
209.0 |
210.0 |
0.5% |
8.9% |
101.9% |
281.7 |
1.3% |
35.4% |
||
|
4. |
KCB Group |
47.8 |
48.8 |
2.1% |
11.7% |
71.1% |
59.7 |
4.1% |
30.5% |
||
|
5. |
I&M Holdings |
120.0 |
120.0 |
0.0% |
(5.5%) |
36.4% |
150.4 |
2.5% |
27.9% |
||
|
6. |
Barclays |
11.1 |
11.1 |
0.0% |
15.6% |
23.3% |
12.8 |
9.1% |
25.5% |
||
|
7. |
Stanbic Uganda |
29.0 |
29.0 |
0.0% |
6.4% |
13.7% |
36.3 |
0.0% |
25.1% |
||
|
8. |
HF Group*** |
10.9 |
10.5 |
(3.2%) |
4.3% |
(4.5%) |
11.7 |
0.8% |
15.2% |
||
|
9. |
CRDB Tanzania |
190.0 |
190.0 |
0.0% |
18.8% |
2.7% |
207.7 |
5.6% |
14.9% |
||
|
10. |
Union Bank Nigeria |
7.1 |
7.1 |
0.7% |
(9.0%) |
67.1% |
8.2 |
0.0% |
14.8% |
||
|
11. |
Zenith Bank Nigeria |
31.6 |
30.9 |
(2.1%) |
20.5% |
110.9% |
33.3 |
6.5% |
14.4% |
||
|
12. |
Bank of Baroda –UG |
120.0 |
116.0 |
(3.3%) |
2.7% |
5.5% |
130.6 |
0.0% |
12.6% |
||
|
13. |
Co-op Bank |
18.6 |
18.8 |
1.1% |
16.3% |
79.8% |
18.6 |
5.4% |
9.0% |
||
|
14. |
Bank of Kigali -RW |
295.0 |
295.0 |
0.0% |
(1.7%) |
20.4% |
299.9 |
4.2% |
5.8% |
||
|
15. |
Stanbic Holdings |
84.0 |
82.0 |
(2.4%) |
3.7% |
22.4% |
79.0 |
4.9% |
1.9% |
||
|
16. |
Standard Chartered |
210.0 |
209.0 |
(0.5%) |
1.0% |
3.0% |
201.1 |
4.3% |
1.0% |
||
|
17. |
Equity Group |
46.0 |
47.8 |
3.8% |
15.7% |
80.2% |
42.3 |
4.2% |
0.3% |
||
|
18. |
Ecobank Ghana |
11.7 |
11.6 |
(0.8%) |
52.6% |
61.8% |
10.7 |
7.1% |
(0.4%) |
||
|
19. |
UBA Bank Nigeria |
12.8 |
12.9 |
1.2% |
25.2% |
157.5% |
10.7 |
5.8% |
(11.2%) |
||
|
20. |
SBM Holdings- MA |
7.6 |
7.6 |
0.0% |
1.3% |
8.3% |
6.6 |
1.3% |
(12.4%) |
||
|
21. |
GT Bank Nigeria |
48.5 |
47.7 |
(1.6%) |
17.1% |
77.0% |
37.2 |
4.3% |
(17.7%) |
||
|
22. |
Access Bank Nigeria |
13.3 |
13.0 |
(2.3%) |
24.4% |
94.0% |
9.5 |
5.0% |
(21.9%) |
||
|
23. |
Stanbic IBTC Holdings |
47.0 |
48.5 |
3.2% |
16.9% |
165.2% |
37.0 |
1.2% |
(22.5%) |
||
|
24. |
NBK |
9.1 |
8.6 |
(5.5%) |
(2.7%) |
29.3% |
5.6 |
0.0% |
(29.0%) |
||
|
25. |
Stanchart- Ghana |
34.5 |
34.5 |
0.0% |
36.6% |
130.0% |
19.5 |
3.3% |
(40.3%) |
||
|
*Target Price as per Cytonn Analyst estimates |
|||||||||||
|
**Upside / (Downside) is adjusted for Dividend Yield |
|||||||||||
|
***Banks in which Cytonn and/or its affiliates holds a stake. For full disclosure, Cytonn and/or its affiliates holds a significant stake in NIC Bank, ranking as the 6th largest shareholder |
|||||||||||
We maintain a “NEUTRAL” recommendation on equities for investors with short-term investment horizon since the market has rallied and brought the market P/E slightly above its’ historical average. However, pockets of value exist, with a number of undervalued sectors like Financial Services, and with expectations of higher corporate earnings this year, the market will be cheaper for long-term investors hence we are “POSITIVE” for investors with a long-term horizon.
South-African based private equity fund Uqalo has invested Kshs 404.0 mn (USD 4.0 mn) to acquire an undisclosed stake in Kenyan fast food chain Big Square. Big Square has 9 branches in Kenya and operates the Big Square and Pizza Mojo restaurants. The investment is beneficial for both parties as it will (i) finance Big Squares expansion plan, as the outlet targets to expand Big Squares footprint from the current 9 branches to 30 branches over the next four-years, and (ii) it expands Uqalo’s footprint and portfolio in Kenya. Uqalo has previously invested in Kenya’s Twiga Foods, where it owns a 5.0% stake in the business-to-business food supplier. The interest by investors in the hospitality sector in the country indicates a positive outlook in the performance of the sector, which is supported by (i) the growing middle class with increasing disposable income, and (ii) the continued growth of the sector in the country in the past years. The food and services sector produced a total of Kshs 16.2 bn in Gross Income in 2016, a 4.5% increase from Kshs 15.5 bn recorded in 2015.
According to a report by the East Africa Private Equity and Venture Capital Association (EAVCA), private equity and venture capital firms injected Kshs 43.6 bn (USD 430.0 mn) into the Kenyan economy in 2017. This was Kshs 9.1 bn (USD 90.0 mn) more than Kshs 34.5 bn (USD 340 mn) worth of deals recorded in 2016. Kenya accounted for 89.5% of the total deal value in East Africa, valued at Kshs 48.7 bn (USD 480.4 mn), a jump from 70.2% of the Kshs 49.1 bn (USD 484.1 mn) deal value in 2016. The value of deals in the region in Kenya decreased by 0.8% to Kshs 48.7 bn in 2017, from Kshs 49.1 bn recorded in 2016 as the number of deals in the region dropped by 29.3% to 29 from 41 recorded in 2016. The slowdown in PE activity was attributed to reduced deal activity in some countries such as Kenya, whose extended uncertainty during the election period resulted in investors adopting a wait-and-see approach to deals during the year. However, the minimal decline in deal value, despite the significant decline in number of deals, affirms the continued investor’s confidence in the region, driven by attractive valuations in the region and better economic projections in the region as compared to global markets, with Sub Saharan Africa (SSA) expected to register economic growth of 3.4% in 2018, higher than the 2.6% expected in 2017 and 1.4% recorded in 2016. We expect continued growth in Private equity deals and deal value in the region, attributed to (i) a general improvement in ease of doing business in the region, (ii) high return potential across major sectors, especially those underserved by the Government, (iii) a well-diversified economy, resilient to external shocks, and (iv) improved political stability.
Private equity investments in Africa remains robust as evidenced by the increasing investor interest, which is attributed to; (i) rapid urbanization, a resilient and adapting middle class and increased consumerism, (ii) the attractive valuations in Sub Saharan Africa’s private markets compared to its public markets, (iii) the attractive valuations in Sub Saharan Africa’s markets compared to global markets, and (iv) better economic projections in Sub Sahara Africa compared to global markets. We remain bullish on PE as an asset class in Sub-Sahara Africa. Going forward, the increasing investor interest and stable macro-economic environment will continue to boost deal flow into African markets.
During the week, Knight Frank released the 2018 Wealth Report, which tracks individuals’ growth in wealth around the globe. Key highlights from the report include:
- Kenya’s ultra-high net-worth individuals (UHNWI), that is, individuals worth USD 50.0 mn excluding their primary residence, increased by 13.0% to 90 in 2017 from 80 in 2016, while high net-worth individuals (HNWI), that is, individuals with a net worth of over USD 5.0 mn, increased by 16.2% to 1,290 in 2017 from 1,110 in 2016, which we attribute to Kenya’s stable and diversified economy and the performance of property investments,
- The number of wealthy Kenyans worth at least USD 5.0 mn is expected to grow by 60.5% by 2022, from 1,290 currently as at 2017, while persons worth over USD 50.0 mn is expected to grow by 56.0% by 2022, from 90 currently as at 2017. Those with a net worth of over USD 500.0 mn remain below 10 and are projected to remain below 10 for the next 5-years,
- Investors continue to see real estate as an attractive part of their overall investment portfolios for benefits such as diversification, stable income returns and the potential for capital growth. According to their attitudes survey, 39.0% of investment portfolios in Africa were allocated to property in 2017, a 14.0% points increase from 25.0% in 2016.
We attribute the increase in Kenya’s high net-worth individuals to (i) Kenya’s stable and diversified economy with 2018 GDP growth expected to come in at between 5.3% - 5.5%, and (ii) good performance from the real estate sector with average returns of 24.3% over the last 6-years.
In other reports, Central Bank of Kenya (CBK) released the Credit Survey for 2017, which tracks credit standards in the Kenyan banks and developments in the domestic credit market. According to the report, 42.0% of the surveyed institutions tightened credit standards to the real estate sector and 45.0% to the construction sector citing an increase in non-performing loans, which in our view is due to the decline in transaction volumes following the wait-and-see approach adopted by investors during last year’s prolonged electioneering period. There is therefore need for endorsement of alternative fundraising options such as Real Estate Investment Trusts, structured real estate products and pre-sales, to enable developers meet their capital requirements for real estate developments.
In the retail sector, Carrefour recorded Kshs 8.2 bn worth of revenues in Kenya for the period May 2016 to December 2017, by which the retailer had a total of 3 retail outlets and an indoor entertainment unit at Two Rivers. The high revenues are attributable to increased sales following the international retailer’s expansion strategies that have seen its current number of branches grow to 4 with locations at The Hub, Two Rivers, Thika Road Mall, and Junction Mall, with a 5th branch set to open by mid-2018 at the Sarit Centre. Its first outlet at Karen’s The Hub had recorded Kshs 1.5 bn of sales revenues for the same period. As at December 2017, Carrefour’s total assets in Kenya stood at Kshs 3.1 bn. This follows similar expansion drives as seen through local retailers such as Naivas and Quickmart as well as Botswana’s Choppies who are also increasingly growing their footprint in Kenya. In our view, the growth is largely attributable to (i) Kenya’s expanding middle class, (ii) changing tastes and preferences that incline towards quality and international brands, and (iii) infrastructural development that has made it possible to invest in other areas away from Nairobi’s CBD. It is a boost to the retail real estate sector given the growing retail space supply, with Nairobi set to get an additional 6.9 mn SQFT by 2020 from the current 5.6 mn SQFT, as these retailers serve as anchors to malls and Mixed Use Developments due to the footfall they generate.
The hospitality and tourism sectors are set for further improvement as Members of Parliament push for a bill that could see the tourism sector get a Kshs 6.0 bn injection through the Kenya Airports Authority Fund established through the Air Passenger Charge Act 2016. The Ministry’s key projects include the construction of the Kshs 29.0 bn Mombasa International Convention Centre and the Kshs 27.0 bn Nairobi International Convention Centre . The move is expected to increase capacity boosting local and international conference tourism, which as per the Cytonn Nairobi Hospitality Report 2017 grew by 17.4% and 4.1%, respectively in 2016. We expect the increased efforts to improve the tourist numbers in Kenya through MICE tourism thus leading to an improved performance of the hospitality sector by raising hotel occupancy rates through demand for bed spaces.
Other highlights during the week include:
- Local Authorities Pensions Trust (Laptrust) announced plans of due completion of the fund’s Kshs 3.0 bn mixed-use development located in Langata entailing the 120,000 SQFT Freedom Mall and 252 residential units that comprises of 2, 3 and 4 bedroom units, which are set to be complete by end of 2018. The mall is set to be anchored by local retailer Naivas.
We expect the real estate sector to continue on its upward growth trajectory following (i) Continued improvement on infrastructure, (ii) demand for institutional grade quality properties by local and international investors, and (iii) growth of the tourism sector following the continued efforts by the government to upgrade the country to a world-class tourist destination
In 2017, we released our Nairobi Commercial Office Report - 2017, which covered the performance of the office sector in Nairobi in 2016. According to the report, the commercial office sector was transitioning to a buyers’ market due to an oversupply of space that stood at 2.9 mn SQFT in 2016, expected to reach 3.2 mn SQFT in 2017. Rental yields had stagnated at 2015 levels of 9.3%, and occupancy rates reduced by 1.0% points to come in at 88.0% in 2016 from 89.0% in 2015. However, we noted that the commercial office theme had pockets of value in differentiated concepts such as Mixed-Use Developments (MUDs), serviced offices and also in Kenyan Counties due to devolution. This week, we update that report with our Nairobi Commercial Office Report - 2018. The report highlights the performance of the office sector in 2017, based on rental yields, prices, occupancy rates, demand and supply, all in comparison to 2016 and the years before to identify the trends, and hence outlook for the sector, and we give a recommendation for investment. In this focus note, we will highlight the key take-outs from the report, starting with a brief introduction to the commercial office sector in Nairobi, performance summary over time, by nodes and by grades, and conclude by highlighting the outlook and thus opportunity in the sector.
Introduction
Supported by robust GDP growth of more than 5.0% p.a, growth in professional services, financial services as well as the growth of Small and Medium Enterprises (SMEs), the commercial office sector boomed between 2011 and 2015. The sector recorded high returns with average rental yields of 10.0% and occupancy levels of on average 90.0% as at 2011. Attracted by the high demand for office space from the bodies above and the high returns, developers increased the supply of office space in the market with the stock of office space increasing from 6.7mn SQFT in 2011 to 22.9 mn SQFT in 2015, a 4 year CAGR of 27.9%. In 2016, largely as a result of the increase in supply the market’s performance started softening with occupancy rates declining by 1.0% points y/y, and rental yields stagnating at 2015 levels of 9.3%. In 2017, the commercial office performance softened further, with occupancy rates declining by 4.8% points from an average of 88.0% in 2016 to an average of 83.2%, the largest annual decline over the last five years. The rental yields also softened, reducing by 0.1% points from an average of 9.3% in 2016 to an average of 9.2% in 2017. The decline in performance is largely attributed to;
- An oversupply in the market – In 2017, the commercial office market had an oversupply of 4.7mn SQFT of office space, a 62.1% increase from the 2.9mn SQFT recorded in 2016, and 46.9% higher than our forecast of 3.2mn SQFT as at 2016, mainly as a result of the 4.8% points decrease in occupancy rates and increased supply with 3.5mn SQFT delivered in the market with commercial buildings such as FCB Mirhab and Vienna Court opening in Kilimani area, Dunhill Towers, Sanlam Towers, Westpark Suites and Westside Towers in Westlands, Britam Towers in Upperhill, among others,
- Reduced demand – There was a decline in demand for office space in 2017 as a result of a tough operating environment in the country characterized by;
- Low credit supply in the market as a result of implementation of the Banking Amendment Act, 2015, that saw private sector credit growth decline to 2.4% as at October 2017 from a five-year average of 14.4%. This affected the growth of SMEs in the country as some reduced the scale of operations and others cut down on expansion plans and thus reduced demand for office space. SMEs contribute to approximately 45% of Kenya’s GDP, 80% of employment in Kenya and constitute 98% of businesses locally, according to a CNBC News Report 2014 and are thus a key driver for the commercial office sector,
- Political Uncertainty – The election period in Kenya in 2017 was long and protracted and thus investors adopted a wait and see attitude waiting for its completion before investing. This reduced demand for office space during the year
The reduced demand thus led to a decline in occupancy rates and consequently an increase in oversupply as showed below;
|
Summary of Nairobi Commercial Office Demand and Supply Trends Over Time |
||||||||||||
|
Year |
2011 |
2013 |
2015 |
2016 |
2017 |
2018F |
3 Year CAGR (2013-2016) |
y/y ∆ 2016 |
y/y ∆ 2017 |
|||
|
Office Stock (SQFT) |
6.7mn |
9.7mn |
22.9mn |
28.9mn |
31.8mn |
35.5mn |
31.4% |
26.2% |
10.0% |
|||
|
Completions (SQFT) |
2.1 mn |
7.8 mn |
6.5mn |
3.5mn |
4.3mn |
32.6% |
(16.7%) |
(46.2%) |
||||
|
Vacancy Rates (%) |
11.0% |
10.0% |
11.0% |
12.0% |
16.8% |
16.8% |
|
1.0% |
4.8% points |
|||
|
*Demand (SQFT) |
1.9mn |
6.8mn |
5.6mn |
1.6mn |
3.7mn |
31.0% |
(17.6%) |
(71.4%) |
||||
|
** Supply ( SQFT) |
2.6mn |
8.8mn |
8.4mn |
6.3mn |
9.0mn |
34.1% |
(4.5%) |
(25.0%) |
||||
|
***Oversupply (SQFT) |
|
0.8mn |
2.1mn |
2.9mn |
4.7mn |
5.3mn |
38.0% |
38.1% |
62.1% |
|||
*Demand – It is computed by summing space absorbed during the year and depreciated office stock. Space absorbed is computed by subtracting occupied stock the previous year from occupied stock the current year. We assume depreciation at a rate of 2% on all available commercial office stock **Supply – It is computed by summing the vacant stock the previous period to the size of completed stock the current period **Oversupply – Computed by subtracting the supply from the demand, if supply exceeds demand, then the market has an oversupply |
||||||||||||
Source: Cytonn Research, Building Plan Approvals Data from the Nairobi City County
Market Performance
In our analysis of commercial office market performance in 2017, we will look at the performance i) over time, ii) based on nodes/ submarkets, iii) based on Classes/ Grades, and iv) a combination of Grades and Nodes
- Commercial Office Performance: Occupancy, Rents, Sales Price & Rental Yield
In 2017, the commercial office sector’s performance in Nairobi softened slightly with asking rental yields declining by 0.1% points to average at 9.2%, from 9.3% in 2016. Occupancy rates recorded the highest decline year on year over the last five-years, declining by 4.8% points to average at 83.2% from 88.0% in 2016. This is as a result of an increase in supply leading to an oversupply of 4.7 mn SQFT. Rents and prices remained stable mainly as higher quality office space came to the market attracting higher rents, and as office leases are normally long term (6 years) and subject to escalations, therefore relatively inelastic in the short run.
The table below summarizes the performance of the commercial office theme over time:
|
Nairobi Commercial Office Performance Summary Over Time |
|||||||
|
Year |
2011 |
2013 |
2015 |
2016 |
2017 |
y/y ∆ 2016 |
y/y ∆ 2017 |
|
Occupancy (%) |
91.0% |
90.0% |
89.0% |
88.0% |
83.2% |
(1.0%) |
(4.8% points) |
|
Asking Rents (Kshs/SQFT) |
78 |
95 |
97 |
97 |
99 |
0.0% |
1.8% |
|
Average Prices (Kshs/SQFT) |
10,557 |
12,433 |
12,776 |
12,031 |
12,595 |
(5.8%) |
4.7% |
|
Average Rental Yields (%) |
9.8% |
10.0% |
9.3% |
9.3% |
9.2% |
0.0% |
(0.1% points) |
|
|||||||
Source: Cytonn Research
- Submarket Analysis
For submarket analysis, we classified the main office nodes in Nairobi into 8 nodes: i) Nairobi CBD, covering the Central Business District, ii) Westlands, covering environs including Riverside, iii) Parklands, iv) Mombasa Road, v) Thika Road, vi) Upperhill, vii) Karen, and viii) Kilimani, covering space in Kilimani, Kileleshwa and Lavington. As was the case in 2015 and 2016, Parklands and Karen had the highest returns with average rental yields of 9.7% and 9.5%, respectively. This is attributed to their prime locations and high-quality office spaces enabling them to charge prime rents. Nairobi CBD, Thika Road, and Mombasa Road had the lowest returns with average rental yields of 8.7% for the CBD, and 8.5% for both Mombasa Road and Thika Road. The poor performance is attributed to two main reasons:
- Congestion and zoning regulations, for instance, in
- The CBD, there is insufficient development land, and high human and vehicular traffic leading to congestion. As a result of the congestion, the CBD has been relegated to playing mainly a retail function, due to the high foot fall, and, due to the centrality of its location, tertiary institutions have also taken up space. For instance, Jomo Kenyatta University of Agriculture and Technology (JKUAT) bought the ICEA Building along Kenyatta Avenue and established a campus. This has thus resulted in companies moving from the CBD to more prime business districts such as Upperhill and Westlands,
- For Mombasa Road, traffic congestion reducing the ease of movement to and from the node as well as zoning for industrial use in some areas limit its attractiveness as an office zone, and for
- Thika Road, its zoning as a low to middle income residential area lowers its attractiveness as commercial office zone, the area has very few commercial offices with a market share of just 0.6%, out of the total office space,
- Low quality office space in that, these areas have higher concentrations of Grade B and C offices. For instance, the CBD does not have a Grade A office space and thus lower rental rates. The nodal office performance is as summarized in the table below:
|
Commercial Office Performance in 2017 by Nodes |
||||||||||
|
Area |
Price (Kshs/ SQFT) |
Rent 2017 (Kshs/SQFT) |
Occupancy 2017(%) |
Yield 2017(%) |
Price 2016 (Kshs/SQFT) |
Rent 2016 (Kshs/SQFT) |
Occupancy 2016(%) |
Yield 2016 (%) |
% Change in Rents Y/Y |
|
|
Parklands |
12,729 |
103 |
85.7% |
9.7% |
11,771 |
102 |
80.0% |
10.0% |
1.3% |
|
|
Karen |
13,167 |
113 |
89.2% |
9.5% |
13,500 |
107 |
90.0% |
10.1% |
5.8% |
|
|
Kilimani |
12,901 |
101 |
84.5% |
9.5% |
12,667 |
99 |
90.5% |
9.5% |
2.2% |
|
|
Westlands |
12,872 |
103 |
88.5% |
9.4% |
12,482 |
102 |
92.1% |
9.3% |
1.1% |
|
|
UpperHill |
12,995 |
99 |
82.0% |
9.0% |
12,529 |
102 |
89.8% |
9.0% |
(3.0%) |
|
|
Nairobi CBD |
12,286 |
88 |
84.1% |
8.7% |
11,750 |
92 |
92.7% |
9.3% |
(4.2%) |
|
|
Thika Road |
11,500 |
82 |
73.6% |
8.5% |
11,700 |
91 |
80.3% |
8.3% |
(10.3%) |
|
|
Mombasa Road |
11,641 |
82 |
74.2% |
8.5% |
10,720 |
80 |
86.1% |
8.3% |
2.1% |
|
|
Average |
12,679 |
99 |
83.9% |
9.23% |
12,053 |
100 |
88.9% |
9.2% |
(0.6%) |
|
|
||||||||||
- Commercial Office Performance by Class/Grade
We also analyzed performance in terms of class and nodes where we classified commercial office buildings into three main categories based on size and quality of office spaces. These are:
- Grade A: Office buildings with a total area ranging from 100,001 - 300,000 square feet that are pacesetters in establishing rents and that generally have ample natural good lighting, good views, prestigious finishing and on-site undercover parking, and a parking ratio of 3:1000 SQFT,
- Grade B: Office buildings with a total area ranging from 50,000 to 100,000 SQFT. They have good (but lower than Grade A) technical services and ample parking space, and,
- Grade C: These are buildings of any size, usually older and in need of renovation, they lack lobbies and may not have on-site parking space. They charge below average rental rates.
Under this category, Grade A outperformed other classes recording yields of 9.8% as the offices are in prime business districts with superior amenities and are thus able to charge prime rents, which are on average Kshs 112 per SQFT per month, against a market average of Kshs 99 per SQFT per month. Despite the high returns, the increase in supply in the market constrained the performance of Grade A offices, leading to a 0.2% points decline in yields from the 10.0% recorded in 2016. Grade B offices are the most popular with the highest average occupancy of 85.1%. This is as they are of a better quality than Grade C offices and are more affordable than Grade A offices, with Grade B rents being 11.4% cheaper per SQFT compared to Grade A offices. They therefore bucked the downward trend of returns recording a 0.1%-point increase in yields from 9.3% in 2016 to 9.2% in 2017. Grade C offices had the lowest returns with average rental yields of 8.4% mainly due to low quality of office space and thus attract rents that are lower than market averages. Similar to Grade A offices, the performance of Grade C offices softened in 2017 as a result of an increase in supply and the economic slowdown. The yields declined by 0.2% points from 8.6% in 2016 to 8.4% in 2017. The performance according to grades / class is as summarized in the table below;
|
Commercial Office Performance in Nairobi 2017 by Grades |
||||||||||||
|
Typology |
Price Kshs/ SQFT |
Rent 2017 (Kshs/SQFT) |
Occupancy 2017(%) |
Yield 2017(%) |
Price 2016 (Kshs/SQFT) |
Rents 2016 (Kshs/SQFT) |
Occupancy 2016 (%) |
Rental Yields 2016(%) |
y/y Change in yields |
|||
|
Grade A |
13,053 |
112 |
81.5% |
9.8% |
12,889 |
112 |
85.7% |
10.0% |
(0.2%) |
|||
|
Grade B |
12,804 |
99 |
85.1% |
9.3% |
11,959 |
98 |
90.6% |
9.2% |
0.1% |
|||
|
Grade C |
11,929 |
84 |
83.1% |
8.4% |
11,245 |
82 |
87.5% |
8.6% |
(0.2%) |
|||
|
Average |
12,595 |
99 |
83.2% |
9.2% |
12,031 |
97 |
88.0% |
9.3% |
(0.1%) |
|||
|
||||||||||||
- Class and Node Analysis
Combining the analysis of performance by nodes and by class shows that for Grade A offices the opportunity is in Kilimani with high yields of on average 9.9%. For Grade B, the opportunity is in Parklands with average rental yield of 9.9%. For Grade C, the opportunity in lies in Kilimani with rental yields of on average 9.1% and 98.3% occupancy levels
|
Commercial Office Performance by Nodes and Grades in Nairobi 2017 |
||||||
|
Grade A |
Grade B |
Grade C |
||||
|
Area |
Yield |
Occupancy |
Yield |
Occupancy |
Yield |
Occupancy |
|
Karen |
9.4% |
92.9% |
9.7% |
86.7% |
||
|
Kilimani |
9.9% |
69.6% |
9.4% |
86.4% |
9.1% |
98.3% |
|
Msa Road |
10.1% |
84.9% |
9.7% |
79.8% |
7.3% |
67.6% |
|
Parklands |
9.7% |
59.8% |
9.9% |
87.8% |
8.9% |
90.0% |
|
UpperHill |
9.4% |
74.9% |
9.1% |
83.5% |
8.2% |
92.5% |
|
Westlands |
9.7% |
90.7% |
9.4% |
89.5% |
9.1% |
85.0% |
|
Thika Road |
9.1% |
65.3% |
8.0% |
81.8% |
||
|
Nairobi CBD |
|
|
8.7% |
83.7% |
8.3% |
86.1% |
|
||||||
Source: Cytonn Research
Commercial Office Performance in Select Sub Saharan African Cities
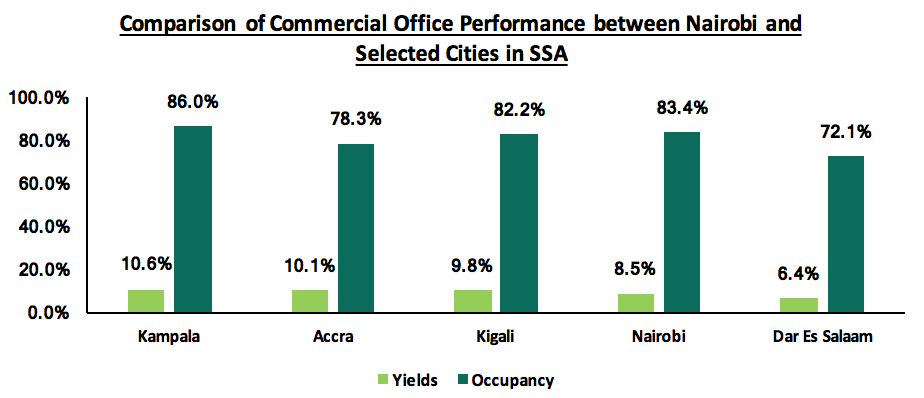
We also compared the performance of the commercial office market in Nairobi with selected cities in Sub Saharan African markets that we cover. These are; Accra- Ghana, Kampala- Uganda, Dar Es Salaam- Tanzania, and Kigali- Rwanda. Nairobi outperforms Dar Es Salaam generating an average rental yield of 8.5% to the dollar, against an average of 6.4% in Dar Es Salaam. Kampala - Uganda has the highest yields for commercial offices at 10.6%, followed by Accra and Kigali with average rental yields of 10.1%, and 9.8%, respectively.
Source: Cytonn Research
Office Market Conclusion and Outlook
|
Nairobi Commercial Office Outlook |
||||
|
Measure |
2016 Sentiment |
2017 Sentiment |
2017 Outlook |
2018 Outlook |
|
Supply |
|
|
Negative
|
Negative |
|
Demand |
|
|
Negative |
Positive |
|
Office Market Performance |
|
|
Neutral |
Negative |
|
General Outlook and Opportunity |
|
|||
For the 2017 commercial office outlook, we had two out of the three metrics as negative and one neutral and thus a negative outlook for the commercial office market in Nairobi. For 2018, two of the metrics under consideration are negative and one positive and thus we retain our negative outlook for the commercial office market in Nairobi. Investments in the sector should, therefore, be biased toward the long-term, for gains when the market picks up in 3-5 years. The pockets of value in the sector are in zones with low supply and high returns such as Karen and in differentiated concepts such a serviced offices and green buildings.
--------------------------
Disclaimer: The views expressed in this publication, are those of the writers where particulars are not warranted- as the facts may change from time to time. This publication is meant for general information only, and is not a warranty, representation or solicitation for any product that may be on offer. Readers are thereby advised in all circumstances, to seek the advice of an independent financial advisor to advise them of the suitability of any financial product for their investment purposes.

- Talk to us
- Kenya
- P.O Box 20695 - 00200, Nairobi, Kenya
- Cell +254709101200
- Tel +254709101200
- WhatsApp +254741676635
- United States
- +254709101200
- DOWNLOAD OUR APP
-


- Kenya
- 8th Floor, Pinetree Plaza, Kaburu Drive, Ngong Road, Nairobi, Kenya
- USA
- Suite 1150, 1775 Eye Street NW, USA, Washington DC 20006, USA
- Investments
- High Yield
- Private Equity
- Real Estate
- Real Estate
- RiverRun Estates
- Cytonn Towers
- The Ridge
- Taraji Heights
- The Alma