Nairobi Metropolitan Area Residential Report 2025, & Cytonn Weekly #20/2025
By Research team, May 18, 2025
Executive Summary
Fixed Income
During the week, T-bills were oversubscribed for the second consecutive week, with the overall subscription rate coming in at 179.7%, albeit lower than the subscription rate of 219.5% recorded the previous week. Investors’ preference for the shorter 91-day paper persisted, with the paper receiving bids worth Kshs 8.1 bn against the offered Kshs 4.0 bn, translating to a subscription rate of 202.2%, lower than the oversubscription rate of 258.4%, recorded the previous week. The subscription rates for the 182-day decreased to 53.6% from the 208.3% recorded the previous week while the 364-day papers increased to 296.8% from the 215.0% respectively recorded the previous week. The government accepted a total of Kshs 37.4bn worth of bids out of Kshs 43.1 bn bids received, translating to an acceptance rate of 86.8%. The yields on the government papers were on a downward trajectory with the yields on the 182-day paper decreasing the most by 1.8 bps to 8.58% from the 8.60% recorded the previous week while the yields on the 91-day and 364-day papers decreased by 1.2 bps and 0.8 bps respectively to 8.37% and 10.00% from the 8.38% and 10.01% respectively recorded the previous week;
During the week, The Energy and Petroleum Regulatory Authority (EPRA) released their monthly statement on the maximum retail fuel prices in Kenya, effective from 15th May 2025 to 14th June 2025. Notably, the maximum allowed price for Super Petrol, Diesel and Kerosene remained unchanged at Kshs 174.6, Kshs 164.9 and Kshs 150.0 per litre respectively;
Equities
During the week, the equities market was on an upward trajectory, with NSE 10 gaining the most by 6.6% while NASI, NSE 25 and NSE 20 gained by 5.8%, 5.6% and 4.1% respectively, taking the YTD performance to gains of 7.1%, 6.7%, 3.7% and 3.2% for NASI, NSE 20, NSE 25 and NSE 10. The equities market performance was driven by gains recorded by large-cap stocks such as KCB Bank, EABL and Co-operative Bank which increased by 11.3%, 10.2%, and 8.8%, respectively. The performance was however weighed down by losses recorded by large cap stock such as Bamburi of 4.4%;
Additionally, in the regional equities market, the East African Exchanges 20 (EAE 20) share index gained by 0.1% to 100.1 from 100.0 recorded the previous week, attributable to gains recorded by large cap stocks such KCB Group, Safaricom and Cooperative Bank of 10.6%, 7.6% and 5.9% respectively, the performance was however weighed down by losses recorded by large cap stocks such as CRDB Bank, Stanbic Uganda Holdings and I&M Rwanda of 0.8%, 0.8% and 0.2% respectively;
During the week Cooperative Bank released their Q1’2025 financial results, highlighting that their profit after tax (PAT) increased by 5.3% to Kshs 6.9 bn, from Kshs 6.6 bn in Q1’2024. The performance was mainly driven by a 12.8% increase in Total Operating Income to Kshs 21.2 bn, from Kshs 18.8 bn in Q1’2024, which was however weighed down by the 19.1% increase in Total Operating expense to Kshs 11.7 bn in Q1’2025, from Kshs 9.9 bn in Q1’2024. The increase in Operating expenses was largely driven by the 32.6% increase in loan loss provisions expense to Kshs 2.1 bn from Kshs 1.6 bn in Q1’2024;
Real Estate
During the week, the Central Bank of Kenya (CBK) released the Quarterly Economic Review Q4 2024, which highlighted the status and performance of Kenya’s economy of the period under review;
During the week, the Kenya National Bureau of Statistics (KNBS) released the Leading Economic Indicators (LEI) March 2025Reports, which highlighted the performance of major economic indicators;
During the week, Superior Homes Kenya (SHK), a real estate developer, and KCB Bank Kenya, formalized a strategic partnership through a Memorandum of Understanding (MOU), that aims to bridge the gap between property development and financing, addressing long-standing challenges in Kenya’s Real Estate sector;
During the week, Africa Travel Investments, a tourism investment firm trading as Africa Travel and backed by a wealthy figure such as Aliko Dangote, has made a 100% acquisition worth Kshs 4.0 bn of Pollman’s Tours and Safaris Limited (Pollman’s) following an unconditional approval from the Competition Authority of Kenya (CAK);
On the Unquoted Securities Platform, Acorn D-REIT and I-REIT traded at Kshs 25.4 and Kshs 22.2 per unit, respectively, as per the last updated data on 2nd May 2025. The performance represented a 27.0% and 11.0% gain for the D-REIT and I-REIT, respectively, from the Kshs 20.0 inception price. Additionally, ILAM Fahari I-REIT traded at Kshs 11.0 per share as of 2nd May 2025, representing a 45.0% loss from the Kshs 20.0 inception price. The volume traded to date came in at Kshs 1.2 mn shares for the I-REIT since inception in November 2015;
Focus of the Week
This week, we update our previous research with the Nairobi Metropolitan Area (NMA) Residential Report 2025 titled ‘Navigating Opportunities in a Resilient Market’ by analyzing the residential sector's performance in the region in terms of price appreciation, rental yields, and market uptake, based on the coverage of 35 regions within the Nairobi Metropolis;
Investment Updates:
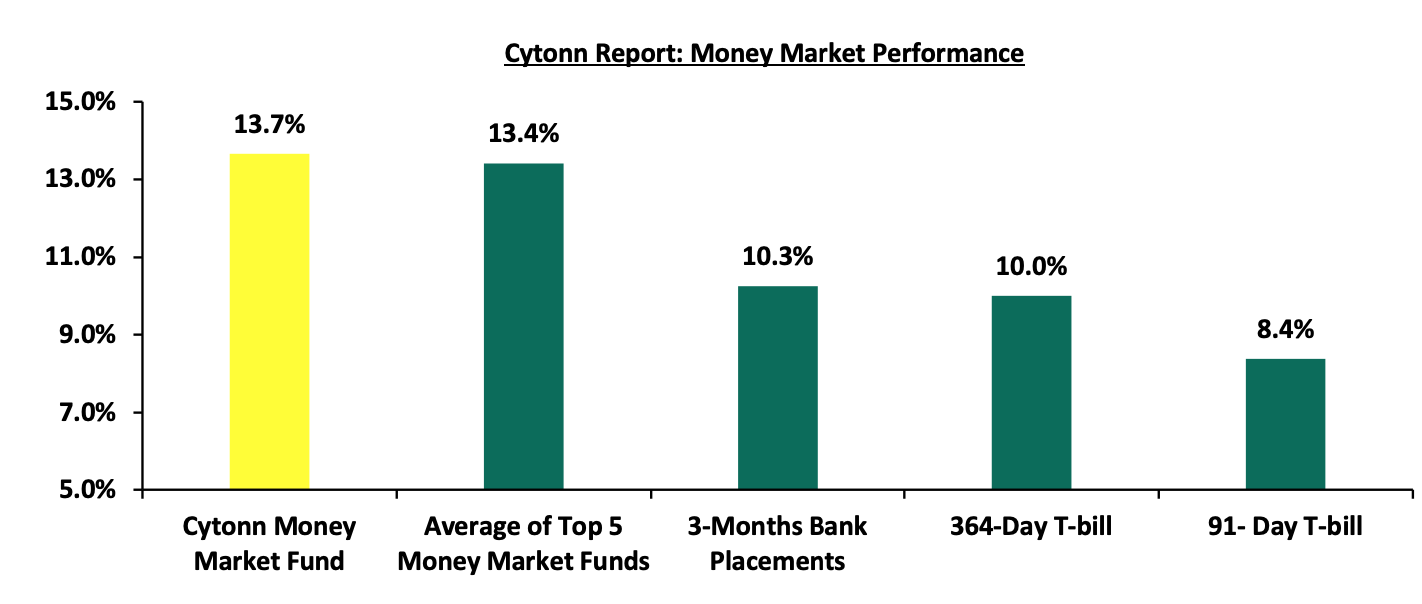
- Weekly Rates: Cytonn Money Market Fund closed the week at a yield of 13.7 % p.a. To invest, dial *809# or download the Cytonn App from Google Play store here or from the Appstore here;
- We continue to offer Wealth Management Training every Tuesday, from 7:00 pm to 8:00 pm. The training aims to grow financial literacy among the general public. To register for any of our Wealth Management Trainings, click here;
- If interested in our Private Wealth Management Training for your employees or investment group, please get in touch with us through wmt@cytonn.com;
- Cytonn Insurance Agency acts as an intermediary for those looking to secure their assets and loved ones’ future through insurance namely; Motor, Medical, Life, Property, WIBA, Credit and Fire and Burglary insurance covers. For assistance, get in touch with us through insuranceagency@cytonn.com;
- Cytonn Asset Managers Limited (CAML) continues to offer pension products to meet the needs of both individual clients who want to save for their retirement during their working years and Institutional clients that want to contribute on behalf of their employees to help them build their retirement pot. To more about our pension schemes, kindly get in touch with us through pensions@cytonn.com;
Hospitality Updates:
- We currently have promotions for Staycations. Visit cysuites.com/offers for details or email us at sales@cysuites.com;
Money Markets, T-Bills Primary Auction:
During the week, T-bills were oversubscribed for the second consecutive week, with the overall subscription rate coming in at 179.7%, albeit lower than the subscription rate of 219.5% recorded the previous week. Investors’ preference for the shorter 91-day paper persisted, with the paper receiving bids worth Kshs 8.1 bn against the offered Kshs 4.0 bn, translating to a subscription rate of 202.2%, lower than the oversubscription rate of 258.4%, recorded the previous week. The subscription rates for the 182-day decreased to 53.6% from the 208.3% recorded the previous week while the 364-day papers increased to 296.8% from the 215.0% respectively recorded the previous week. The government accepted a total of Kshs 37.4bn worth of bids out of Kshs 43.1 bn bids received, translating to an acceptance rate of 86.8%. The yields on the government papers were on a downward trajectory with the yields on the 182-day paper decreasing the most by 1.8 bps to 8.58% from the 8.60% recorded the previous week while the yields on the 91-day and 364-day papers decreased by 1.2 bps and 0.8 bps respectively to 8.37% and 10.00% from the 8.38% and 10.01% respectively recorded the previous week.
The chart below shows the yield performance of the 91-day, 182-day and 364-day papers from January 2024 to May 2025: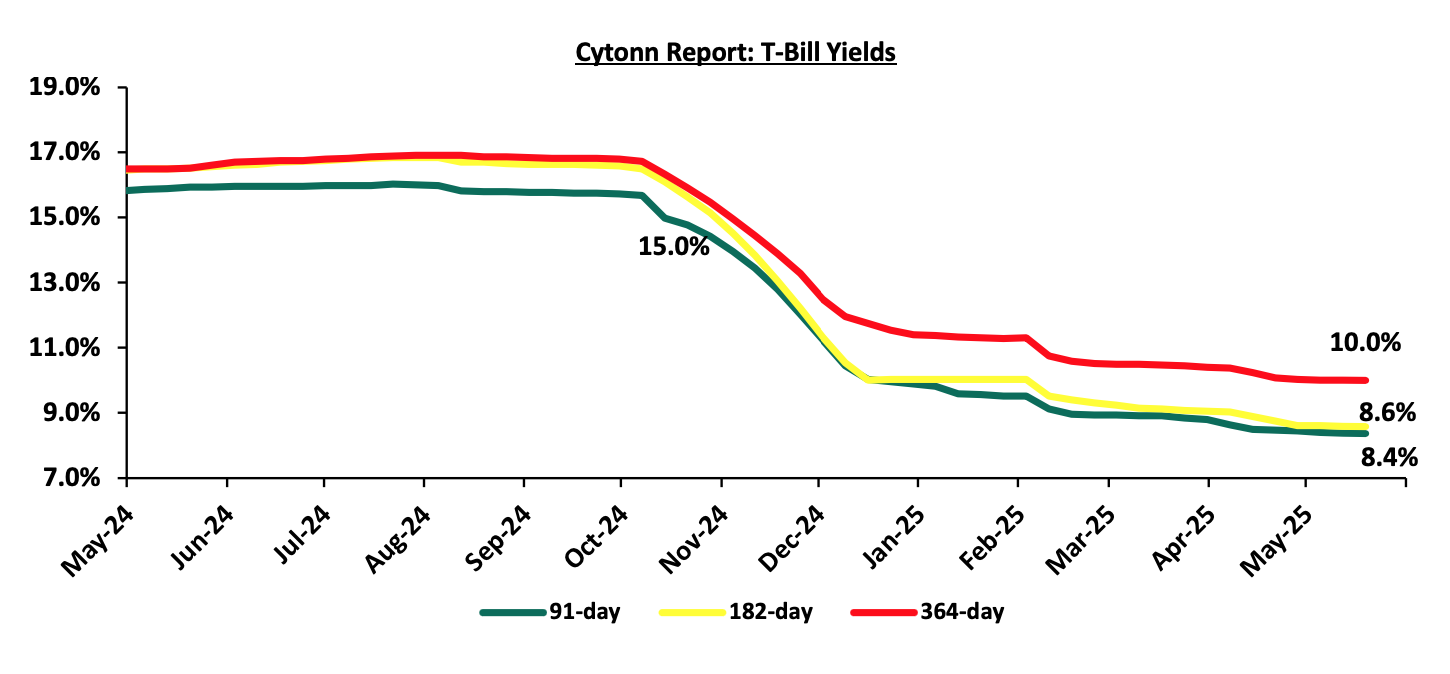
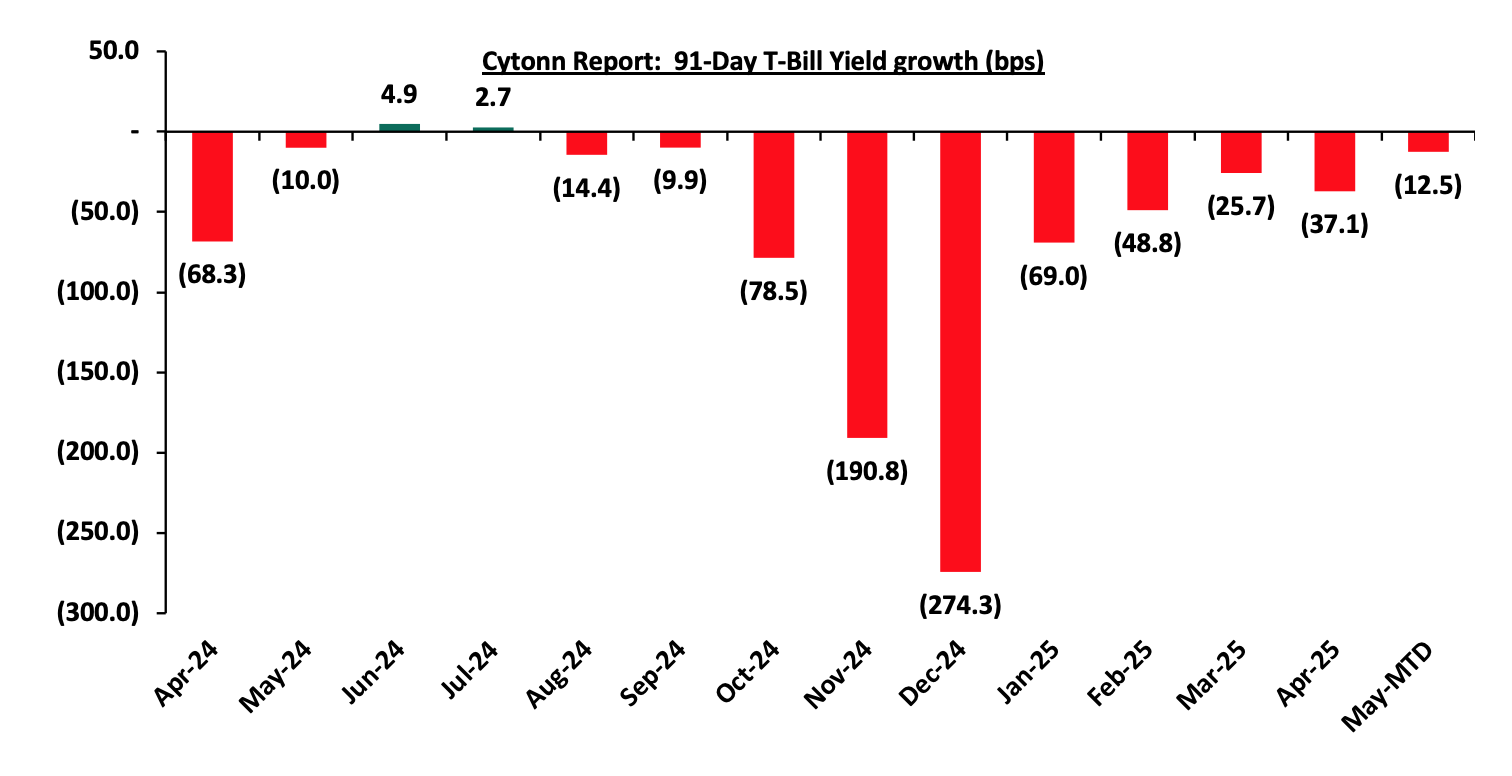
The chart below shows the yield growth for the 91-day T-bill:
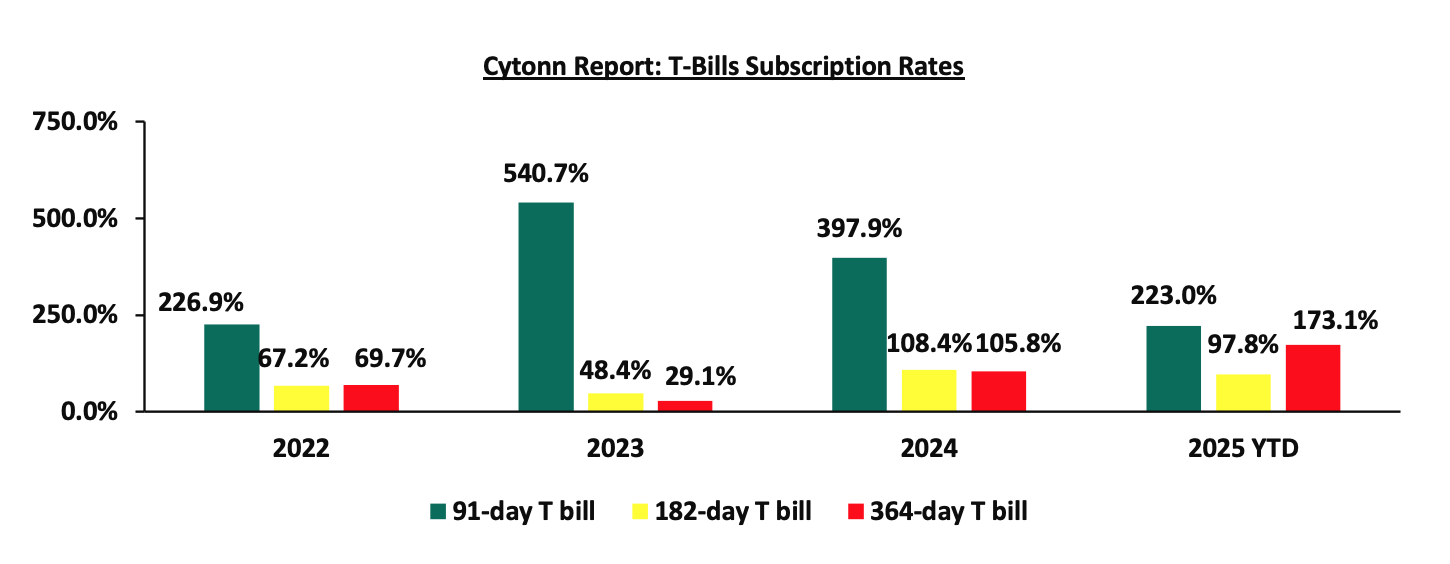
The chart below compares the overall average T-bill subscription rates obtained in 2022,2023, 2024 and 2025 Year-to-date (YTD):
Money Market Performance:
In the money markets, 3-month bank placements ended the week at 10.3% (based on what we have been offered by various banks) and the yields on the government papers were on a downward trajectory with the yields on 91-day and 364-day papers decreased by 1.2 bps and 0.8 bps respectively to 8.37% and 10.00% from the 8.38% and 10.01% respectively recorded the previous week. The yield on the Cytonn Money Market Fund decreased by 8.0 bps to remain relatively unchanged from the 13.7% recorded the previous week, while the average yields on the Top 5 Money Market Funds decreased by 2.6 bps to close the week at 13.4%, relatively unchanged from the previous week.
The table below shows the Money Market Fund Yields for Kenyan Fund Managers as published 16th May 2025:
|
Cytonn Report: Money Market Fund Yield for Fund Managers as published on 16th May 2025 |
||
|
Rank |
Fund Manager |
Effective Annual Rate |
|
1 |
Gulfcap Money Market Fund |
13.9% |
|
2 |
Cytonn Money Market Fund ( Dial *809# or download Cytonn App) |
13.7% |
|
3 |
Kuza Money Market fund |
13.4% |
|
4 |
GenAfrica Money Market Fund |
13.1% |
|
5 |
Ndovu Money Market Fund |
13.1% |
|
6 |
Arvocap Money Market Fund |
13.1% |
|
7 |
Etica Money Market Fund |
13.0% |
|
8 |
Lofty-Corban Money Market Fund |
12.8% |
|
9 |
Enwealth Money Market Fund |
12.1% |
|
10 |
British-American Money Market Fund |
12.1% |
|
11 |
Old Mutual Money Market Fund |
12.0% |
|
12 |
Orient Kasha Money Market Fund |
11.9% |
|
13 |
Madison Money Market Fund |
11.7% |
|
14 |
Nabo Africa Money Market Fund |
11.4% |
|
15 |
Jubilee Money Market Fund |
11.3% |
|
16 |
Sanlam Money Market Fund |
11.1% |
|
17 |
Faulu Money Market Fund |
11.0% |
|
18 |
Dry Associates Money Market Fund |
11.0% |
|
19 |
CIC Money Market Fund |
10.3% |
|
20 |
Co-op Money Market Fund |
10.2% |
|
21 |
KCB Money Market Fund |
10.1% |
|
22 |
Apollo Money Market Fund |
10.1% |
|
23 |
Genghis Money Market Fund |
10.0% |
|
24 |
Mali Money Market Fund |
9.8% |
|
25 |
ICEA Lion Money Market Fund |
9.7% |
|
26 |
Absa Shilling Money Market Fund |
9.5% |
|
27 |
Mayfair Money Market Fund |
9.2% |
|
28 |
AA Kenya Shillings Fund |
8.2% |
|
29 |
Stanbic Money Market Fund |
7.5% |
|
30 |
Ziidi Money Market Fund |
7.3% |
|
31 |
Equity Money Market Fund |
5.0% |
Source: Business Daily
Liquidity:
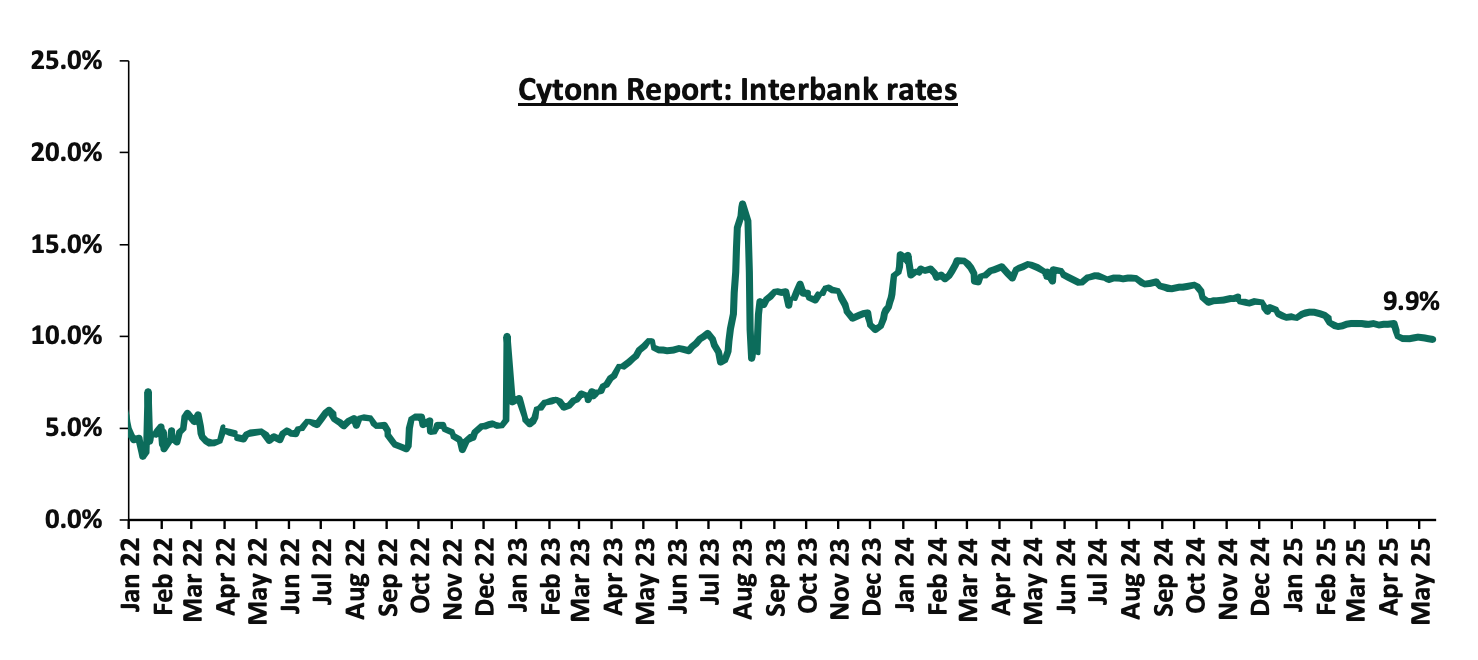
During the week, liquidity in the money markets marginally eased, with the average interbank rate decreasing by 5.8 bps, to remain relatively unchanged from the 9.9% recorded the previous week, partly attributable to tax remittances that were offset by government payments. The average interbank volumes traded decreased by 23.6% to Kshs 7.5 bn from Kshs 9.8 bn recorded the previous week. The chart below shows the interbank rates in the market over the years:
Kenya Eurobonds:
During the week, the yields on Kenya’s Eurobonds were on a downward trajectory with the yield on the 10-year Eurobond issued in 2018 decreasing the most by 63.3 bps to 9.2% from the 9.8% recorded the previous week. The table below shows the summary performance of the Kenyan Eurobonds as of 15th May 2025;
|
Cytonn Report: Kenya Eurobonds Performance |
|
||||||
|
|
2018 |
2019 |
2021 |
2024 |
2025 |
||
|
Tenor |
10-year issue |
30-year issue |
7-year issue |
12-year issue |
13-year issue |
7-year issue |
11-year issue |
|
Amount Issued (USD) |
1.0 bn |
1.0 bn |
0.3 bn |
1.2 bn |
1.0 bn |
1.5 bn |
1.5 bn |
|
Years to Maturity |
2.9 |
22.9 |
2.1 |
7.1 |
9.2 |
5.8 |
11.0 |
|
Yields at Issue |
7.3% |
8.3% |
7.0% |
7.9% |
6.2% |
10.4% |
9.9% |
|
02-Jan-25 |
9.1% |
10.3% |
8.5% |
10.1% |
10.1% |
10.1% |
|
|
01-May-25 |
10.1% |
11.4% |
8.4% |
11.1% |
10.9% |
11.2% |
|
|
08-May-25 |
9.8% |
11.2% |
8.1% |
10.8% |
10.6% |
10.9% |
|
|
09-May-25 |
9.7% |
11.2% |
8.1% |
10.8% |
10.6% |
10.8% |
|
|
12-May-25 |
9.3% |
10.9% |
7.8% |
10.5% |
10.3% |
10.5% |
|
|
13-May-25 |
9.1% |
10.8% |
7.7% |
10.2% |
10.1% |
10.3% |
|
|
14-May-25 |
9.1% |
10.8% |
7.7% |
10.3% |
10.1% |
10.2% |
10.0% |
|
15-May-25 |
9.2% |
10.9% |
7.8% |
10.3% |
10.2% |
10.3% |
|
|
Weekly Change |
(0.6%) |
(0.3%) |
(0.3%) |
(0.4%) |
(0.4%) |
(0.6%) |
- |
|
MTD Change |
(0.9%) |
(0.5%) |
(0.6%) |
(0.7%) |
(0.7%) |
(0.9%) |
- |
|
YTD Change |
0.1% |
0.6% |
(0.7%) |
0.3% |
0.1% |
0.2% |
- |
Source: Central Bank of Kenya (CBK) and National Treasury
Kenya Shilling:
During the week, the Kenyan Shilling depreciated marginally against the US Dollar by 2.4 bps, to remain relatively unchanged from the Kshs 129.3 recorded the previous week. On a year-to-date basis, the shilling has appreciated by 0.6 bps against the dollar, compared to the 17.4% appreciation recorded in 2024.
We expect the shilling to be supported by:
- Diaspora remittances standing at a cumulative USD 4,997.2 mn in the twelve months to April 2025, 12.1% higher than the USD 4,457.5 mn recorded over the same period in 2024. These has continued to cushion the shilling against further depreciation. In the April 2025 diaspora remittances figures, North America remained the largest source of remittances to Kenya accounting for 59.6% in the period,
- The tourism inflow receipts which came in at Kshs 452.2 bn in 2024, a 19.8% increase from Kshs 377.5 bn inflow receipts recorded in 2023, and owing to tourist arrivals that improved by 14.6% to 2,394,376 in 2024 from 2,089,259 in 2023, and,
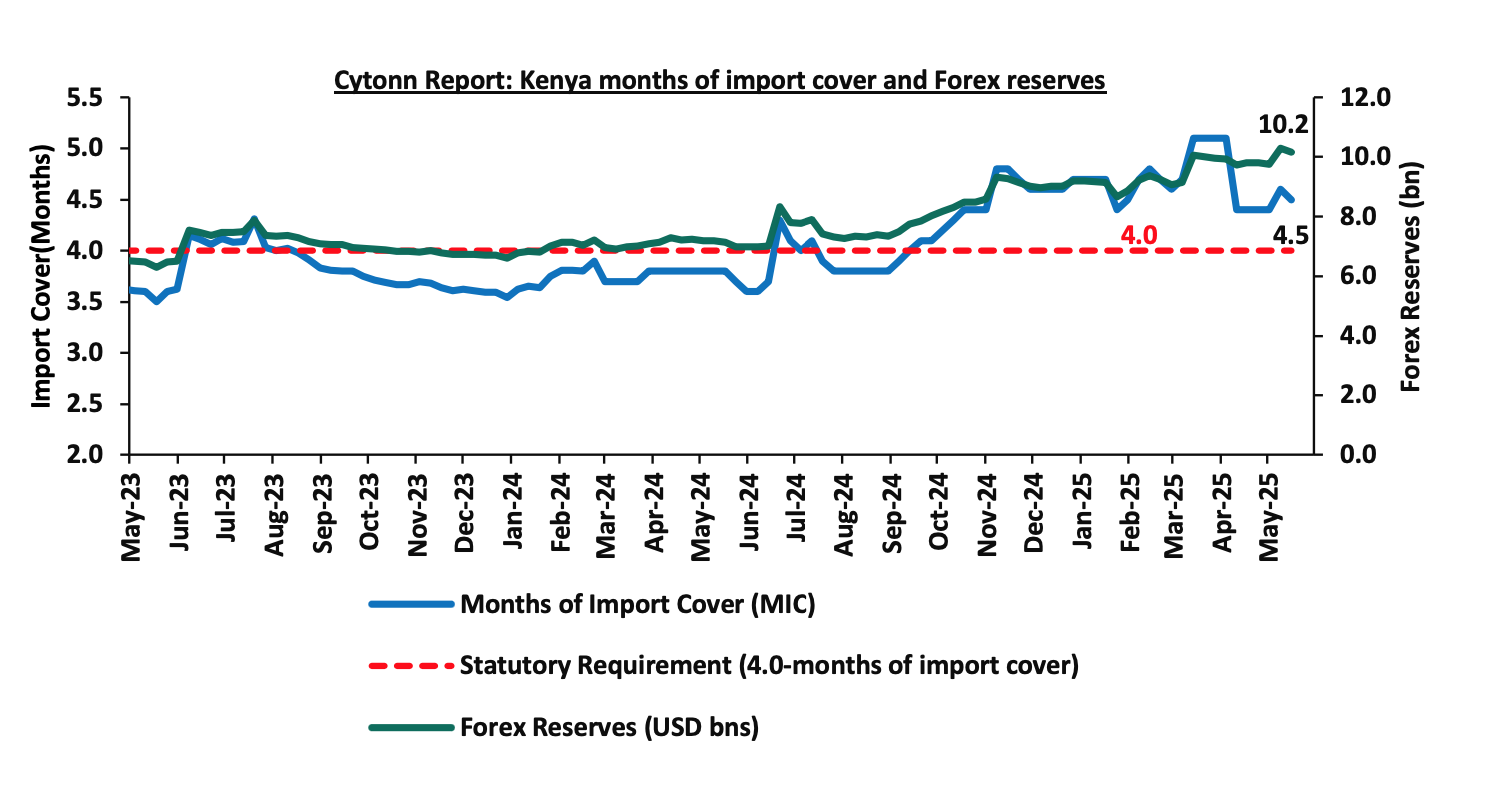
- Improved forex reserves currently at USD 10.2 bn (equivalent to 4.5-months of import cover), which is above the statutory requirement of maintaining at least 4.0-months of import cover and at par with the EAC region’s convergence criteria of 4.5-months of import cover.
The shilling is however expected to remain under pressure in 2025 as a result of:
- An ever-present current account deficit which came at 3.1% of GDP in the twelve months to February 2025, and,
- The need for government debt servicing, continues to put pressure on forex reserves given that 62.0% of Kenya’s external debt is US Dollar-denominated as of December 2024.
Key to note, Kenya’s forex reserves decreased by 1.2% during the week, to USD 10.2 bn from USD 10.3 bn recorded in the previous week. The current holdings are equivalent to 4.5 months of import cover (based on updated import data) and they are above the statutory requirement of maintaining at least 4.0-months of import cover.
The chart below summarizes the evolution of Kenya's months of import cover over the years:
Weekly Highlights
- Fuel Prices effective 15th May 2025 to 14th June 2025
During the week, The Energy and Petroleum Regulatory Authority (EPRA) released their monthly statement on the maximum retail fuel prices in Kenya, effective 15th May 2025 to 14th June 2025. Notably, the maximum allowed price for Super Petrol, Diesel and Kerosene remained unchanged at Kshs 174.6, Kshs 164.9 and Kshs 150.0 per litre respectively.
Other key take-outs from the performance include;
- The average landing costs per cubic meter for Diesel, Kerosene and Super Petrol decreased by 6.6%, 4.5% and 3.0% to USD 594.6, USD 599.8, and USD 588.2 respectively from the USD 636.8, USD 628.2 and USD 606.1 respectively recorded in March.
- The Kenyan Shilling remained stable against the US Dollar, depreciating slightly by 9.3 bps to Kshs 129.8 from Kshs 129.7 recorded in March.
We note that fuel prices in the country have stabilized in recent months largely due to the government's efforts to stabilize pump prices through the petroleum pump price stabilization mechanism which expended Kshs 9.9 bn in the FY’2023/24 to cushion the increases applied to the petroleum pump prices, coupled with the appreciation of the Kenyan Shilling against the dollar and other major currencies, as well as a decrease in international fuel prices. Additionally, the government has reduced spending through the price stabilization mechanism, subsidizing Kshs 2.2, Kshs 0.3 and Kshs 2.7 per litre for Petrol, Diesel and Kerosene respectively, compared to Kshs 4.7, Kshs 6.1 and Kshs 6.2 per litre for Petrol, Diesel and Kerosene in March resulting in stabilization in fuel prices for the period under review. Going forward, we expect that fuel prices will stabilize in the coming months as a result of the government's efforts to mitigate the cost of petroleum through the pump price stabilization mechanism and a stable exchange rate. As such, we expect the business environment in the country to improve as fuel is a major input cost, as well as continued stability in inflationary pressures, with the inflation rate expected to remain within the CBK’s preferred target range of 2.5%-7.5% in the short to medium-term.
Rates in the Fixed Income market have been on a downward trend due to high liquidity in the money market which allowed the government to front load most of its borrowing. The government is 77.8% ahead of its prorated net domestic borrowing target of Kshs 528.2 bn, and 57.3% ahead of the total FY’2024/25 net domestic borrowing target of Kshs 597.2 bn, having a net borrowing position of Kshs 939.3 bn (inclusive of T-bills). However, we expect the yield curve to stabilize in the short and medium term, with the government looking to increase its external borrowing to maintain the fiscal surplus, hence alleviating pressure in the domestic market. As such, we expect the yield curve to remain stable in the short to medium-term and hence investors are expected to shift towards the long-term papers to lock in the high returns.
Market Performance
During the week, the equities market was on an upward trajectory, with NSE 10 gaining the most by 6.6% while NASI, NSE 25 and NSE 20 gained by 5.8%, 5.6% and 4.1% respectively, taking the YTD performance to gains of 7.1%, 6.7%, 3.7% and 3.2% for NASI, NSE 20, NSE 25 and NSE 10. The equities market performance was driven by gains recorded by large-cap stocks such as KCB Bank, EABL and Co-operative Bank which registered gains of 11.3%, 10.2%, and 8.8%, respectively. The performance was however weighed down by losses recorded by large cap stock such as Bamburi of 4.4%.
Additionally, in the regional equities market, the East African Exchanges 20 (EAE 20) share index gained by 0.1%to 100.1 from 100.0 recorded the previous week, attributable to gains recorded by large cap stocks such KCB Group, Safaricom and Cooperative Bank of 10.6%, 7.6% and 5.9% respectively, the performance was however weighed down by losses recorded by large cap stocks such as CRDB Bank, Stanbic Uganda Holdings and I&M Rwanda of 0.8%, 0.8% and 0.2% respectively.
During the week, equities turnover increased by 81.5% to USD 25.1 mn, from USD 13.8 mn recorded the previous week, taking the YTD total turnover to USD 300.4 mn. Foreign investors became net buyers for the first time in six weeks, with a net buying position of USD 1.9 mn, from a net selling position of USD 0.3 mn recorded the previous week, taking the YTD foreign net selling position to USD 30.1 mn, compared to a net selling position of USD 16.9 mn in 2024.
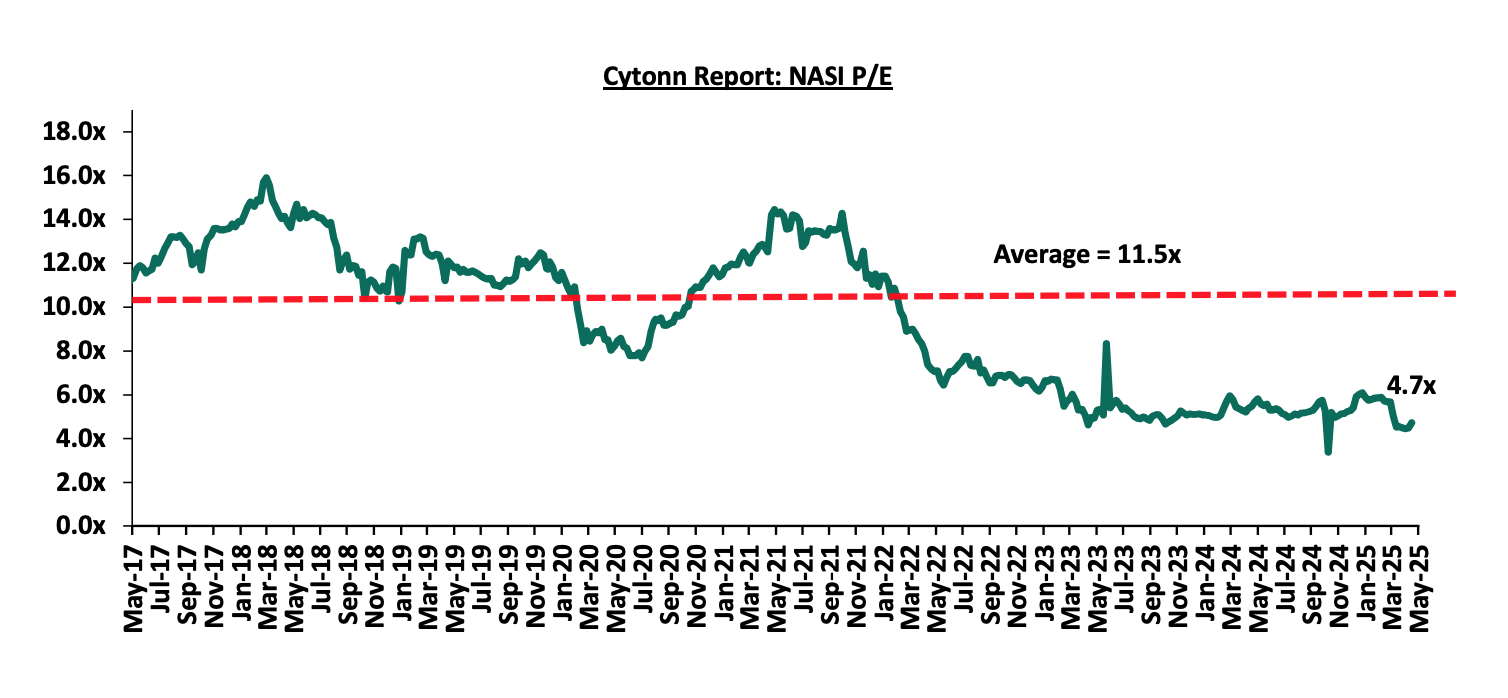
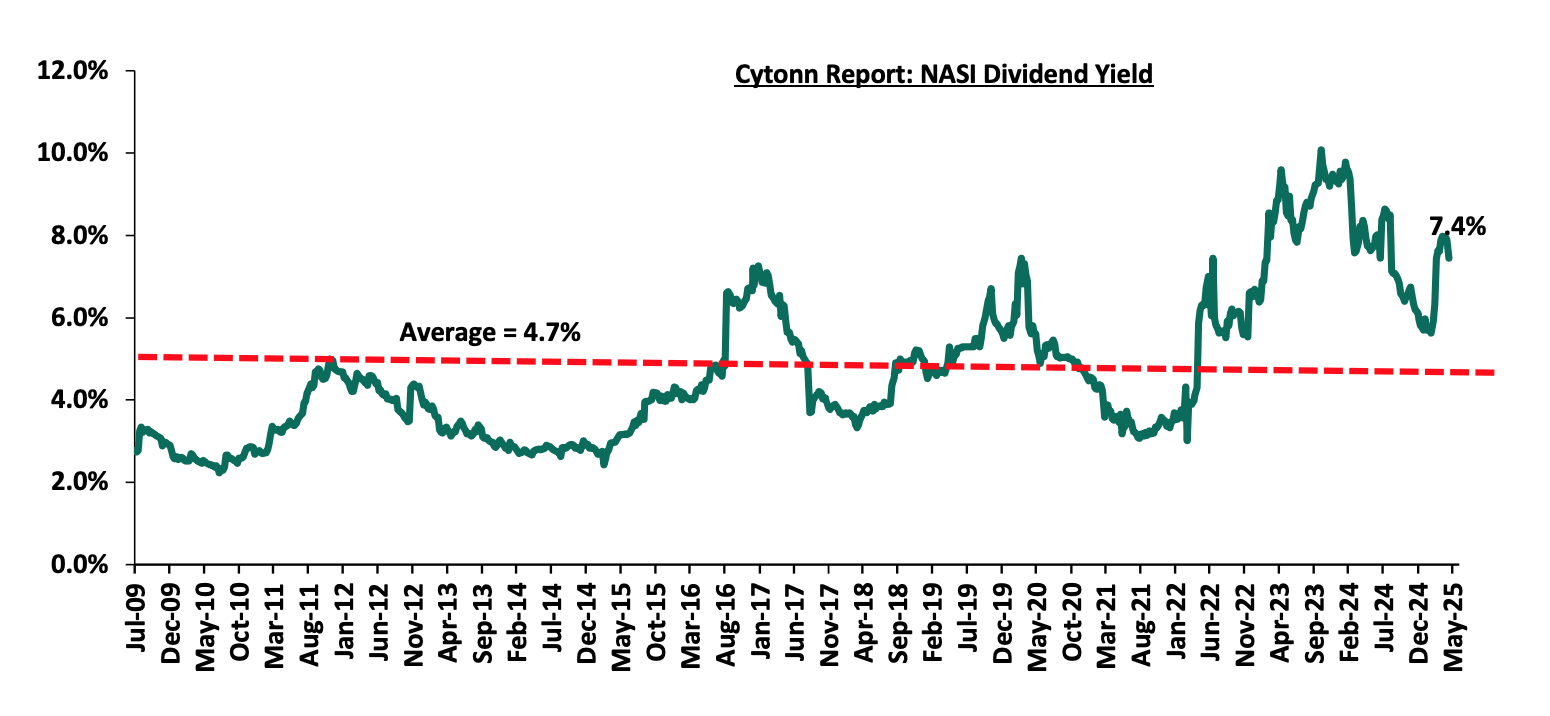
The market is currently trading at a price-to-earnings ratio (P/E) of 4.7x, 59.0% below the historical average of 11.5x. The dividend yield stands at 7.4%, 2.8% points above the historical average of 4.7%. Key to note, NASI’s PEG ratio currently stands at 0.6x, an indication that the market is undervalued relative to its future growth. A PEG ratio greater than 1.0x indicates the market is overvalued while a PEG ratio less than 1.0x indicates that the market is undervalued. The charts below indicate the historical P/E and dividend yields of the market;
Universe of Coverage:
|
Cytonn Report: Equities Universe of Coverage |
||||||||||
|
Company |
Price as at 09/05/2025 |
Price as at 16/05/2025 |
w/w change |
YTD Change |
Year Open 2025 |
Target Price* |
Dividend Yield |
Upside/ Downside** |
P/TBv Multiple |
Recommendation |
|
Standard Chartered Bank |
267.8 |
270.0 |
0.8% |
(5.3%) |
285.3 |
328.8 |
16.7% |
38.4% |
1.5x |
Buy |
|
Jubilee Holdings |
205.0 |
206.0 |
0.5% |
17.9% |
174.8 |
260.7 |
6.6% |
33.1% |
0.3x |
Buy |
|
ABSA Bank |
16.7 |
17.1 |
2.7% |
(9.3%) |
18.9 |
21.0 |
10.2% |
33.0% |
1.1x |
Buy |
|
Co-op Bank |
14.3 |
15.5 |
8.8% |
(11.2%) |
17.5 |
18.6 |
9.7% |
29.8% |
0.5x |
Buy |
|
Diamond Trust Bank |
71.0 |
73.0 |
2.8% |
9.4% |
66.8 |
87.1 |
9.6% |
28.9% |
0.3x |
Buy |
|
NCBA |
49.0 |
51.0 |
4.1% |
0.0% |
51.0 |
60.2 |
10.8% |
28.8% |
0.8x |
Buy |
|
KCB Group |
38.5 |
42.9 |
11.3% |
1.1% |
42.4 |
50.7 |
7.0% |
25.3% |
0.5x |
Buy |
|
I&M Group |
30.0 |
31.9 |
6.3% |
(11.4%) |
36.0 |
36.8 |
9.4% |
24.8% |
0.6x |
Buy |
|
Stanbic Holdings |
169.5 |
169.8 |
0.1% |
21.5% |
139.8 |
185.3 |
12.2% |
21.4% |
1.0x |
Buy |
|
CIC Group |
2.9 |
2.7 |
(6.3%) |
25.7% |
2.1 |
3.1 |
4.8% |
20.1% |
0.7x |
Buy |
|
Equity Group |
47.4 |
48.6 |
2.5% |
1.3% |
48.0 |
52.8 |
8.7% |
17.4% |
0.8x |
Accumulate |
|
Britam |
6.7 |
6.7 |
(1.5%) |
13.7% |
5.8 |
7.5 |
0.0% |
13.3% |
0.6x |
Accumulate |
|
*Target Price as per Cytonn Analyst estimates **Upside/ (Downside) is adjusted for Dividend Yield ***Dividend Yield is calculated using FY’2024 Dividends |
||||||||||
Weekly Highlights
- Cooperative Bank Q1’2025 Financial Results
During the week, Co-operative Bank released their Q1’2025 financial results. Below is a summary of the performance
|
Balance Sheet Items |
Q1'2024 |
Q1'2025 |
y/y change |
|
Government Securities |
200.2 |
242.1 |
20.9% |
|
Net Loans and Advances |
378.1 |
384.5 |
1.7% |
|
Total Assets |
714.7 |
774.1 |
8.3% |
|
Customer Deposits |
481.8 |
525.2 |
9.0% |
|
Deposits per branch |
2.5 |
2.6 |
0.5% |
|
Total Liabilities |
589.0 |
618.4 |
5.0% |
|
Shareholders’ Funds |
127.1 |
155.9 |
22.7% |
|
Balance Sheet Ratios |
Q1'2024 |
Q1'2025 |
y/y change |
|
Loan to Deposit Ratio |
78.5% |
73.2% |
(5.3%) |
|
Government Securities to Deposits Ratio |
41.6% |
46.1% |
4.5% |
|
Return on average equity |
19.7% |
18.2% |
(1.5%) |
|
Return on average assets |
3.5% |
3.5% |
(0.0%) |
|
Income Statement |
Q1'2024 |
Q1'2025 |
y/y change |
|
Net Interest Income |
11.7 |
14.2 |
21.7% |
|
Non-Interest Income |
7.1 |
6.9 |
(1.9%) |
|
Total Operating income |
18.8 |
21.2 |
12.8% |
|
Loan Loss provision |
(1.6) |
(2.1) |
32.6% |
|
Total Operating expenses |
(9.9) |
(11.7) |
19.1% |
|
Profit before tax |
9.0 |
9.6 |
6.8% |
|
Profit after tax |
6.6 |
6.9 |
5.3% |
|
Core EPS |
1.1 |
1.2 |
5.3% |
|
Income Statement Ratios |
Q1'2024 |
Q1'2025 |
Y/Y Change |
|
Yield from interest-earning assets |
12.3% |
13.8% |
1.4% |
|
Cost of funding |
5.1% |
4.1% |
(1.0%) |
|
Net Interest Spread |
7.3% |
9.7% |
2.4% |
|
Net Interest Income as % of operating income |
62.3% |
67.2% |
4.9% |
|
Non-Funded Income as a % of operating income |
37.7% |
32.8% |
(4.9%) |
|
Cost to Income |
52.5% |
55.5% |
2.9% |
|
CIR without provisions |
44.1% |
45.5% |
1.4% |
|
Cost to Assets |
1.2% |
1.2% |
0.1% |
|
Net Interest Margin |
7.8% |
8.4% |
0.5% |
|
Capital Adequacy Ratios |
Q1'2024 |
Q1'2025 |
% points change |
|
Core Capital/Total deposit Liabilities |
22.3% |
23.7% |
1.4% |
|
Minimum Statutory ratio |
8.0% |
8.0% |
|
|
Excess |
14.3% |
15.7% |
1.4% |
|
Core Capital/Total Risk Weighted Assets |
18.2% |
19.8% |
1.6% |
|
Minimum Statutory ratio |
10.5% |
10.5% |
|
|
Excess |
7.7% |
9.3% |
1.6% |
|
Total Capital/Total Risk Weighted Assets |
21.6% |
22.8% |
1.2% |
|
Minimum Statutory ratio |
14.5% |
14.5% |
|
|
Excess |
7.1% |
8.3% |
1.2% |
|
Liquidity Ratio |
51.2% |
61.3% |
10.1% |
|
Minimum Statutory ratio |
20.0% |
20.0% |
|
|
Excess |
31.2% |
41.3% |
10.1% |
For a more detailed analysis, please see the Co-operative Bank’s Q1’2025 Earnings Note
Key Take-Outs:
- Increased earnings - Core earnings per share (EPS) grew by 5.3% to Kshs 1.2, from Kshs 1.1 in Q1’2024, driven by the 12.8% increase in total operating income to Kshs 21.2 bn, from Kshs 18.8 bn in Q1’2024.However the performance was weighed down by a 19.1% increase in total operating expenses to Kshs 11.7 bn from Kshs 9.9 bn in Q1’ 2024
- Deteriorated asset quality –The bank’s Asset Quality deteriorated, with Gross NPL ratio increasing to 17.1% in Q1’2025 from 15.9% in Q1’2024, attributable to a 11.4% increase in Gross non-performing loans to Kshs 74.1 bn, from Kshs 66.5 bn in Q1’2024, relative to the 3.6% increase in gross loans to Kshs 432.1 bn, from Kshs 417.1 bn recorded in Q1’2024
- Expanded Balanced sheet - The balance sheet recorded an expansion as total assets increased by 8.3% to Kshs 774.1 bn, from Kshs 714.7 bn in Q1’2024, mainly driven by a 20.9% increase in governments securities holdings to Kshs 242.1 bn, from 200.2 bn in Q1’2024, Notably Net loans and advances increased by 1.7% to Kshs 384.5 bn, from Kshs 378.1 bn in Q1’2024.
- Increased lending- Customer net loans and advances increased by 1.7% to Kshs 384.5 bn in Q1’2025, from Kshs 378.1 bn in Q1’2024 despite increased credit risk with high NPLs in the industry, with the lender preferring to increase customer lending.
Asset Quality:
The table below shows the asset quality of listed banks that have released their Q1’2025 results using several metrics:
|
Cytonn Report: Listed Banks Asset Quality in Q1’2025 |
||||||
|
|
Q1'2025 NPL Ratio* |
Q1'2024 NPL Ratio** |
% point change in NPL Ratio |
Q1'2025 NPL Coverage* |
Q1'2024 NPL Coverage** |
% point change in NPL Coverage |
|
Stanbic Holdings |
8.7% |
8.9% |
(0.2%) |
80.8% |
72.3% |
8.5% |
|
Cooperative Bank |
17.1% |
15.9% |
1.2% |
64.2% |
58.6% |
5.6% |
|
Mkt Weighted Average* |
13.5% |
14.3% |
(0.8%) |
71.2% |
60.1% |
11.2% |
|
*Market cap weighted as at 16/05/2025 |
||||||
|
**Market cap weighted as at 24/05/2024 |
||||||
Key take-outs from the table include;
- Asset quality for the listed banks that have released results improved during Q1’2025, with market-weighted average NPL ratio decreasing by 0.8% points to 13.5% from 14.3% in Q1’2024 largely due to Co-operative Banks’s numbers, and,
- Market-weighted average NPL Coverage for the two listed banks increased by 11.2% points to 71.2% in Q1’2025 from 60.1% recorded in Q1’2024. The increase was attributable to Stanbic Bank’s coverage ratio increasing by 8.5% points to 80.8% from 72.3% in Q1’2024, coupled with Co-operatives Group’s NPL coverage ratio increasing by 5.6% points to 64.2% from 58.6% in Q1’2024.
Summary Performance
The table below shows the performance of listed banks that have releases their Q1'2025results using several metrics:
|
Cytonn Report: Listed Banks Performance in Q1’2025 |
|||||||||||||
|
Bank |
Core EPS Growth |
Interest Income Growth |
Interest Expense Growth |
Net Interest Income Growth |
Net Interest Margin |
Non-Funded Income Growth |
NFI to Total Operating Income |
Growth in Total Fees & Commissions |
Deposit Growth |
Growth in Government Securities |
Loan to Deposit Ratio |
Loan Growth |
Return on Average Equity |
|
Stanbic Group |
(16.6%) |
(8.9%) |
(24.6%) |
4.6% |
7.8% |
(27.2%) |
28.9% |
44.1% |
(5.0%) |
27.2% |
72.3% |
(4.6%) |
20.0% |
|
Co-operative Bank |
5.3% |
14.4% |
3.3% |
21.7% |
8.4% |
(1.9%) |
32.8% |
6.7% |
9.0% |
20.9% |
73.2% |
1.7% |
18.2% |
|
Q1'2025 Mkt Weighted Average* |
(4.0%) |
4.5% |
(8.5%) |
14.4% |
8.1% |
(12.6%) |
31.1% |
22.6% |
3.1% |
23.6% |
72.8% |
(1.0%) |
19.0% |
|
Q1’2024 Mkt Weighted Average* |
29.8% |
35.3% |
64.7% |
22.8% |
8.0% |
10.9% |
38.6% |
10.7% |
14.1% |
3.1% |
68.4% |
7.5% |
21.9% |
|
*Market cap weighted as at 16/05/2025 |
|||||||||||||
|
**Market cap weighted as at 24/05/2024 |
|||||||||||||
Key take-outs from the table include:
- The listed banks that have released their Q1’2025 results recorded a 4.0% decline in core Earnings per Share (EPS) in Q1’2025, compared to the weighted average growth of 29.8% in Q1’2024, an indication of declined performance attributable to the declined operating environment experienced during Q1’2025,
- Interest income recorded a weighted average growth of 4.5% in Q1’2025, compared to 35.3% in Q1’2024. Similarly, interest expenses recorded a market-weighted average decline of 8.5% in Q1’2025 compared to a growth of 64.7% in Q1’2024,
- The Banks’ net interest income recorded a weighted average growth of 14.4% in Q1’2025, a decline from the 22.8% growth recorded over a similar period in 2024, while the non-funded income declined by 12.6% in Q1’2025 compared to the 10.9% growth recorded in Q1’2024 despite the revenue diversification strategies implemented by most banks, and,
- The Banks recorded a weighted average deposit growth of 3.1%, compared to the market-weighted average deposit growth of 14.1% in Q1’2024.
We are “Bullish” on the Equities markets in the short term due to current cheap valuations, lower yields on short-term government papers and expected global and local economic recovery, and, “Neutral” in the long term due to persistent foreign investor outflows. With the market currently trading at a discount to its future growth (PEG Ratio at 0.6x), we believe that investors should reposition towards value stocks with strong earnings growth and that are trading at discounts to their intrinsic value. We expect the current high foreign investors sell-offs to continue weighing down the economic outlook in the short term.
- Industry Report
- Quarterly Economic Review
During the week, the Central Bank of Kenya (CBK) released the Quarterly Economic Review Q4’2024, which highlighted the status and performance of Kenya’s economy of the period under review. The following were the key take outs from the report, with regards to the Real Estate and related sectors;
- Real Estate Sector;
The gross loans advanced to the Real Estate sector increased quarter-on-quarter (q/q) by 1.1% to Kshs 513.0 bn in Q4’2024, up from Kshs 507.6 bn in Q3’2024. On a year-on-year (y/y) basis, this represented a 0.8% increase from Kshs 509.0 bn in Q4’2023. This increase is attributed to; (i) sustained construction activity in the residential housing segment, supported by increased private developer activity and individual homebuyer demand, (ii) ongoing momentum from the government’s affordable housing program aimed at addressing the national housing deficit which is currently exceeding 2 million units.
Gross NPLs in the Real Estate sector increased by 1.4% q/q to Kshs 118.6 bn in Q4’2024, from Kshs 117.0 bn in Q3’2024, and by 16.6% y/y from Kshs 101.7 bn in Q4’2023. This translates to a 3.1% increase in NPL ratio to 23.1% in Q4’2024 from 20.0% in Q4’2023. The rise in NPLs is attributed to; (i) continued macroeconomic pressure including inflation and cost-of-living increases impacting borrower repayment capacity, (ii) despite CBK’s monetary policy rate cuts from 12.8% in Q3’2024 to 11.3% in Q4’2024, commercial bank lending rates averaged 16.9% in Q4’2024, increasing debt servicing costs for borrowers, (iii) prolonged project approval cycles and delayed off-take in commercial developments, affecting cash flows.
The graph below shows the Gross Loans advanced to the Real Estate sector against Non-Performing Loans in the sector from Q1’2020 to Q4’2024;
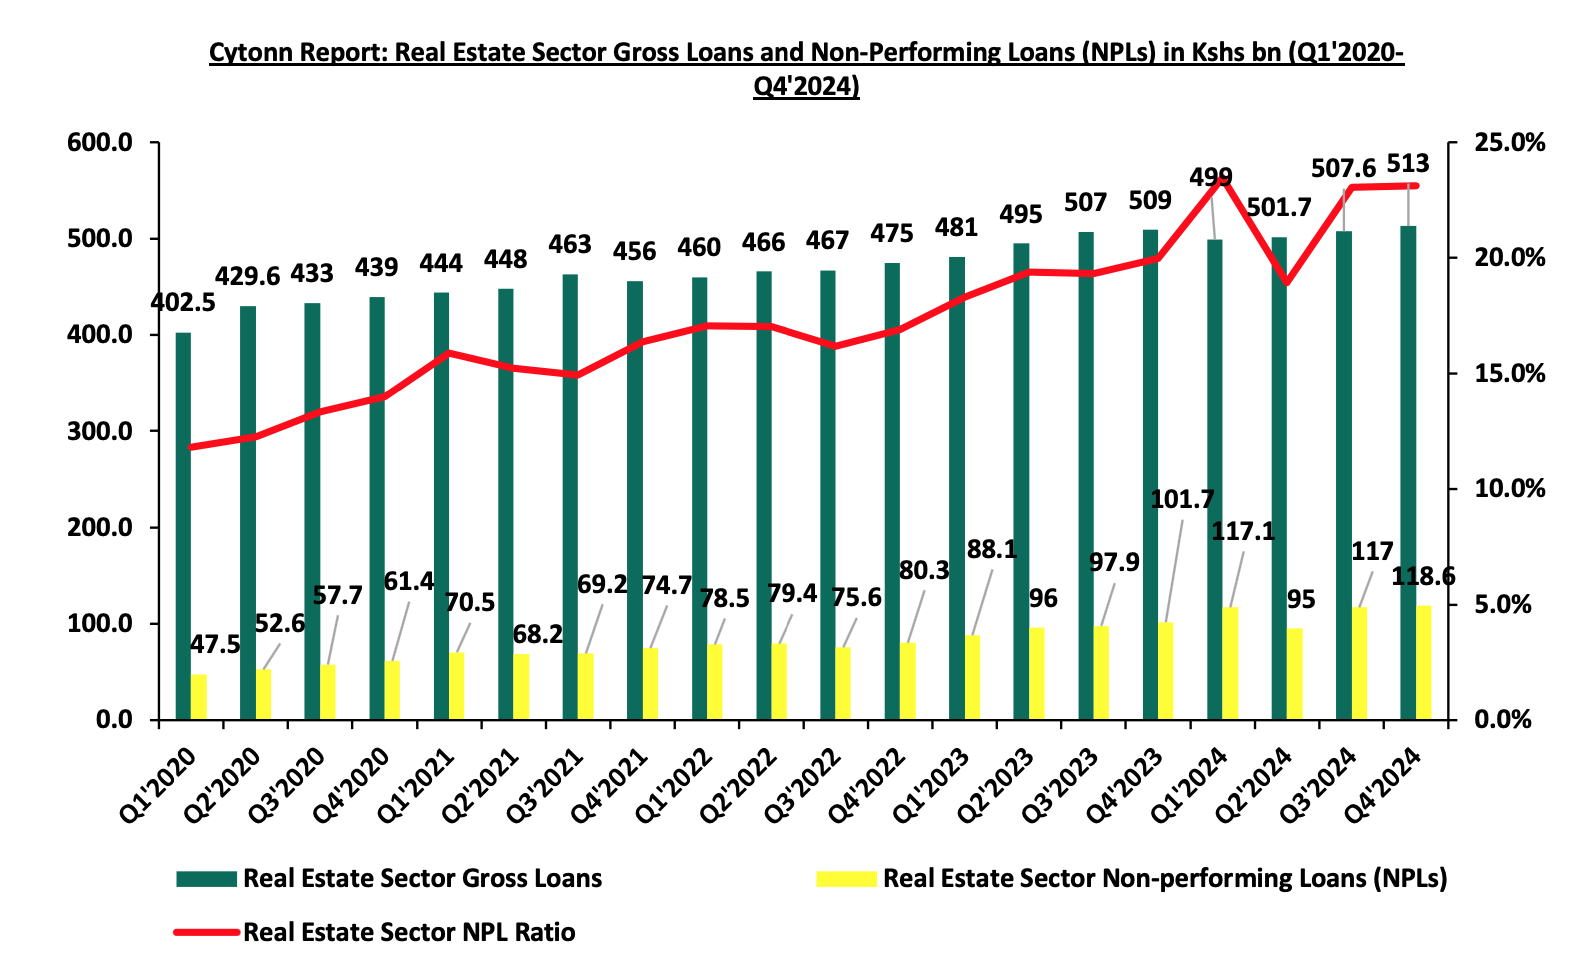
Kenya’s real estate sector faces significant challenges, with a 23.1% NPL ratio and 16.6% y/y NPL growth in Q4’2024, driven by high lending rates, economic slowdown, and subdued construction activity. Gross loans grew modestly by 1.1% q/q and 0.8% y/y, supported by affordable housing initiatives but constrained by credit risk. Historical trends show a 93.2% NPL increase since 2020, underscoring persistent asset quality issues. Targeted interventions, including loan restructuring, Public-Private-Partnership (PPP) expansion, and monetary easing, are critical to reducing NPLs and stimulating loan growth in 2025, ensuring the sector’s resilience and contribution to Kenya’s economy.
- Hospitality Sector;
The gross loans advanced to the Hospitality sector (Tourism, Restaurants & Hotels) stood at Kshs 107.0 bn in Q4’2024, a 7.9% q/q decrease from Kshs 116.2 bn in Q3’2024, and a 13.0% y/y decrease from Kshs 123.0 bn in Q4’2023. This is attributable to; (i) Elevated borrowing costs: High interest rates discouraged borrowing even as the CBK reduced the CBR to 11.8% in Q4 2024, (ii) a post-peak tourism season slowdown, which reduced credit demand, (iii) banks tightened lending due to rising credit risks in the sector.
Gross NPLs in the Hospitality sector on q/q increased by 7.1% to Kshs 16.7 bn in Q4’2024, down from Kshs 15.6 bn in Q3’2024. This translates to a 1.5% increase in NPL ratio to 15.6% in Q4’2024 from 14.1% in Q4’2023. This increase is mainly attributable to (i) temporary liquidity challenges during off-peak season, (ii) rising input costs increasing operational expenses. On a y/y basis, there was a 4.0% decrease to Kshs 16.7 bn in Q4 2024 from Kshs 17.4 bn in Q4’2023. This was attributed to: (i) successful loan restructuring and repayment plans implemented over the year, (ii) gradual recovery in tourism and travel boosting revenue streams, (iii) improved credit risk management by lenders, and (iv) Enhanced operational efficiencies reducing financial stress on businesses improved loan recoveries and some restructuring efforts.
The graph below shows Gross Loans advanced to the Hospitality sector against Non-Performing Loans in the sector from Q1’2020 to Q4’2024;
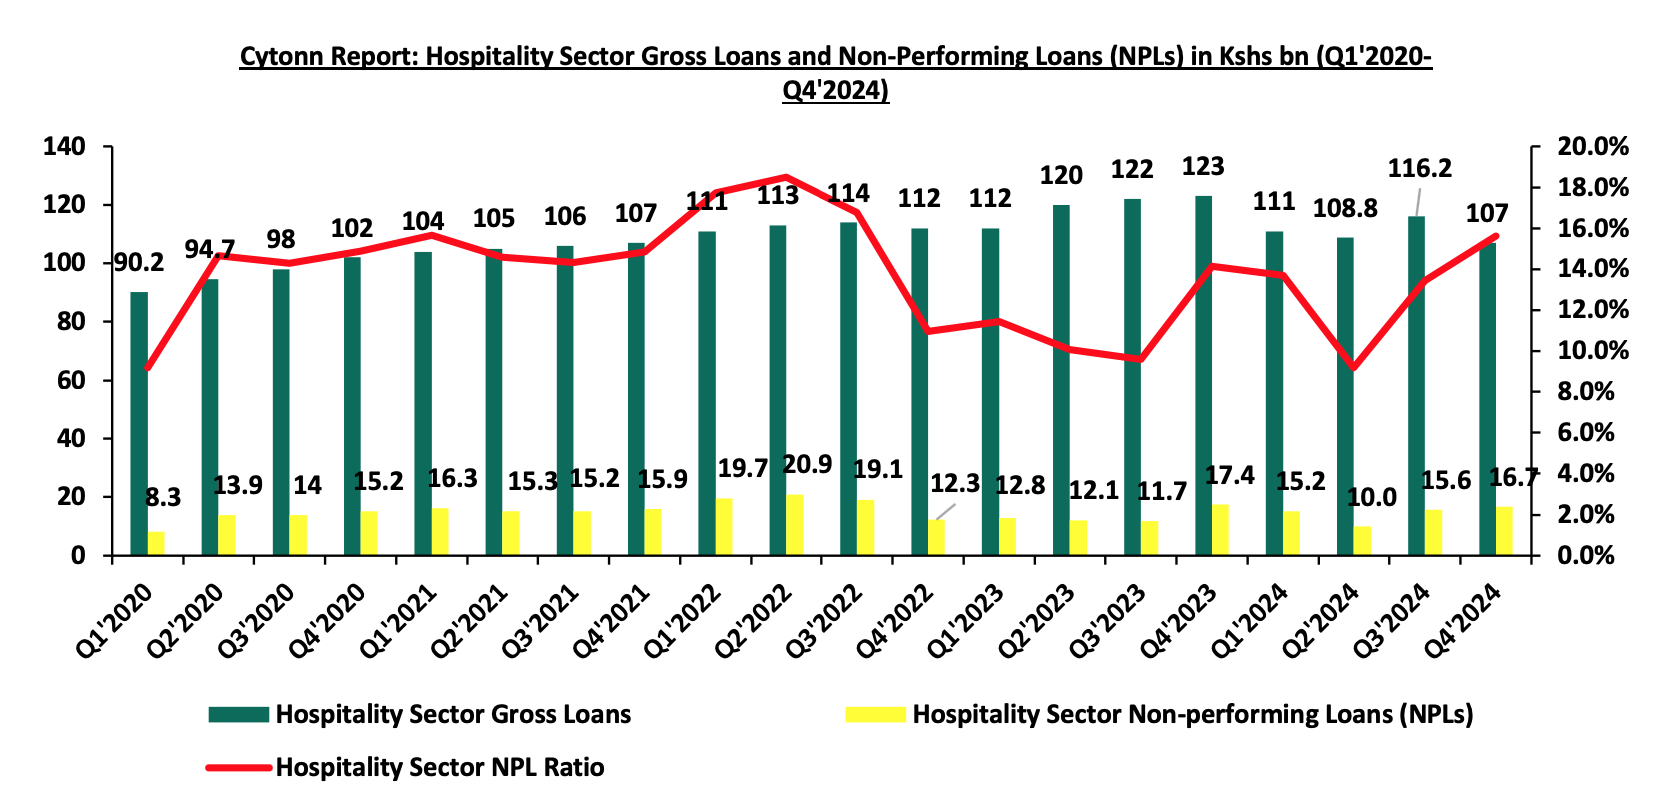
Kenya’s hospitality sector shows resilience with a 4.0% y/y NPL decline in Q4’2024, driven by tourism recovery and remittance inflows, but faces challenges with a 15.6% NPL ratio and significant loan contraction (7.9% q/q, 13.0% y/y). High lending rates, seasonal fluctuations, and economic slowdown have constrained credit growth, particularly for smaller businesses. Historical trends show a 9.9% cumulative NPL increase since 2020, driven by pandemic-related disruptions and subsequent economic challenges, underscoring the sector’s ongoing recovery hurdles. Targeted interventions, including loan restructuring, tourism financing, and monetary easing, are critical to reducing NPLs and stimulating loan growth in 2025.
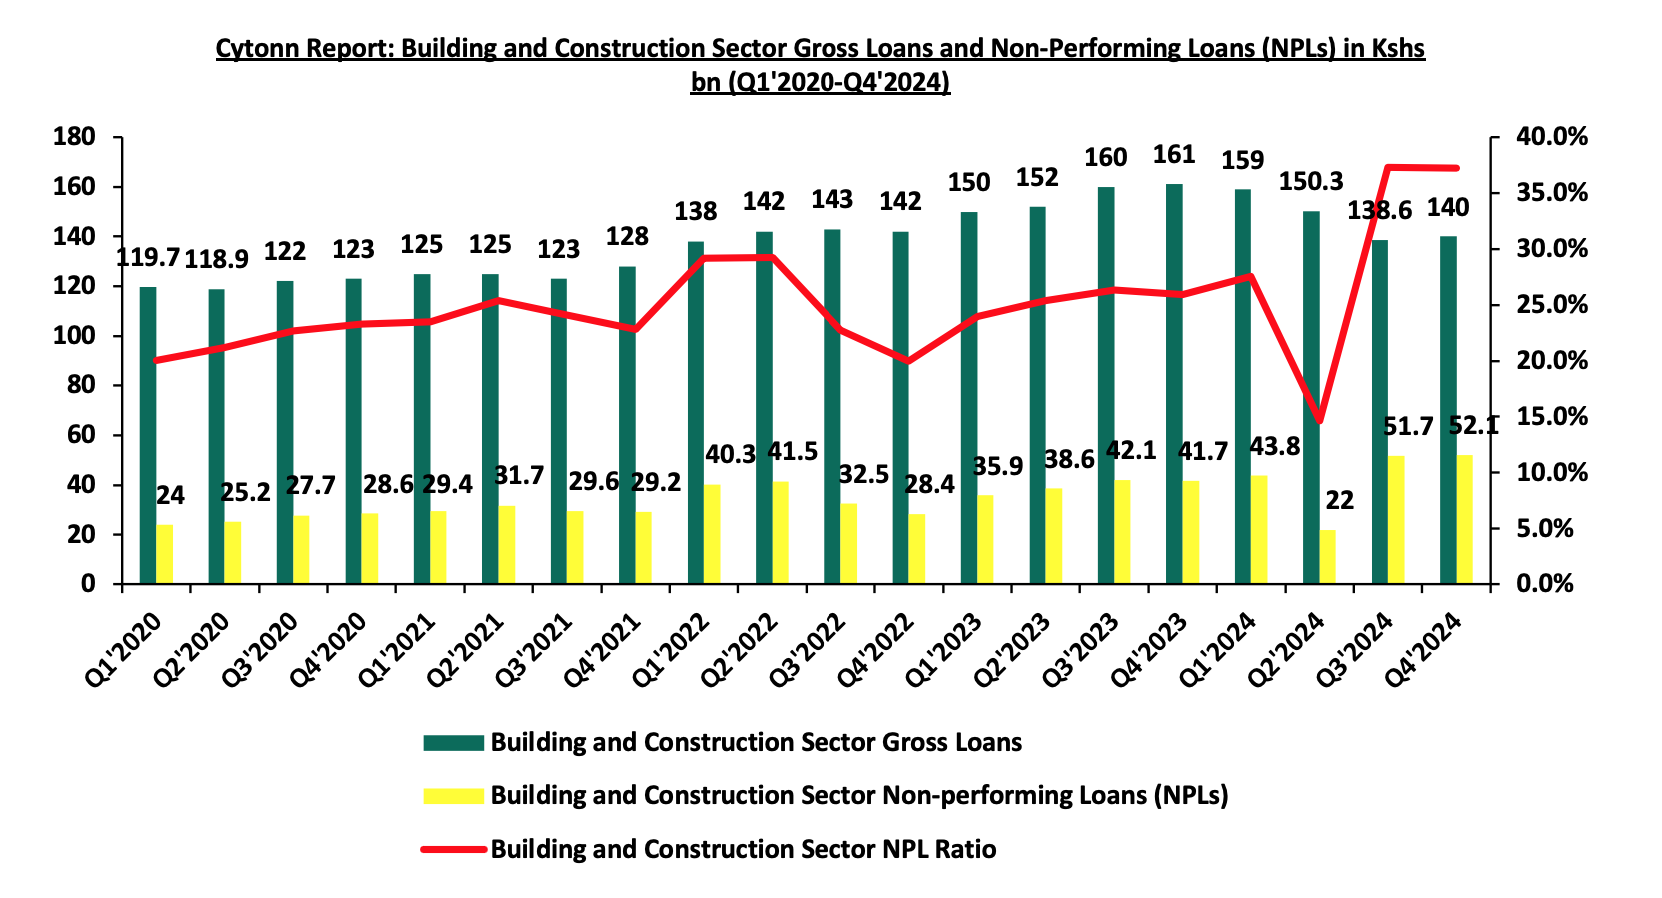
- Building and Construction sector;
Gross loans advanced to the Building and Construction sector increased by 1.0% q/q to Kshs 140.0 bn in Q4’2024, from Kshs 138.6 bn in Q3’2024 mainly due to (i) Slight rebound in project financing due to ongoing infrastructure projects (ii) Increased demand for residential and commercial developments. A 13.0% decrease on y/y from Kshs 161.0 bn in Q4’2023. (i) High borrowing costs driven by elevated interest rates (ii) Delayed project completions and stalled projects due to funding constraints (iii) Stricter lending criteria by financial institutions amid rising default risks (iv) Reduced investor confidence and cutbacks on large-scale projects.
Gross NPLs in the Building and Construction sector rose on q/q by 0.8% to Kshs 52.1 bn in Q4’2024, from Kshs 51.7 bn in Q3’2024. This translates to a 11.3% increase in NPL ratio to 37.2% in Q4’2024 from 25.9% in Q4’2023. This is attributable to: (i) Seasonal cash flow constraints affecting debt repayment schedules (ii) Rising costs of materials and labor putting pressure on project budgets. For instance, a bag of cement recorded 10.7% increase in cost from Kshs 830 in December 2024 from Kshs 750 in December 2023 (iii) Delays in project completions leading to postponed revenue generation. A 24.9% increase on y/y from Kshs 41.7 bn in Q4’2023. This was primarily due to, (i) High interest rates elevating debt servicing costs, (ii) Project delays and stalled developments resulting in cash flow challenges, (iii) Stricter regulatory compliance and licensing requirements affecting project timelines. The graph below shows Gross Loans advanced to the Hospitality sector against Non-Performing Loans in the sector from Q1’2020 to Q4’2024;
- LEI March Highlights
During the week, the Kenya National Bureau of Statistics (KNBS) released the Leading Economic Indicators (LEI) March 2025Report, which highlighted the performance of major economic indicators. Key highlights related to the Real Estate sector include:
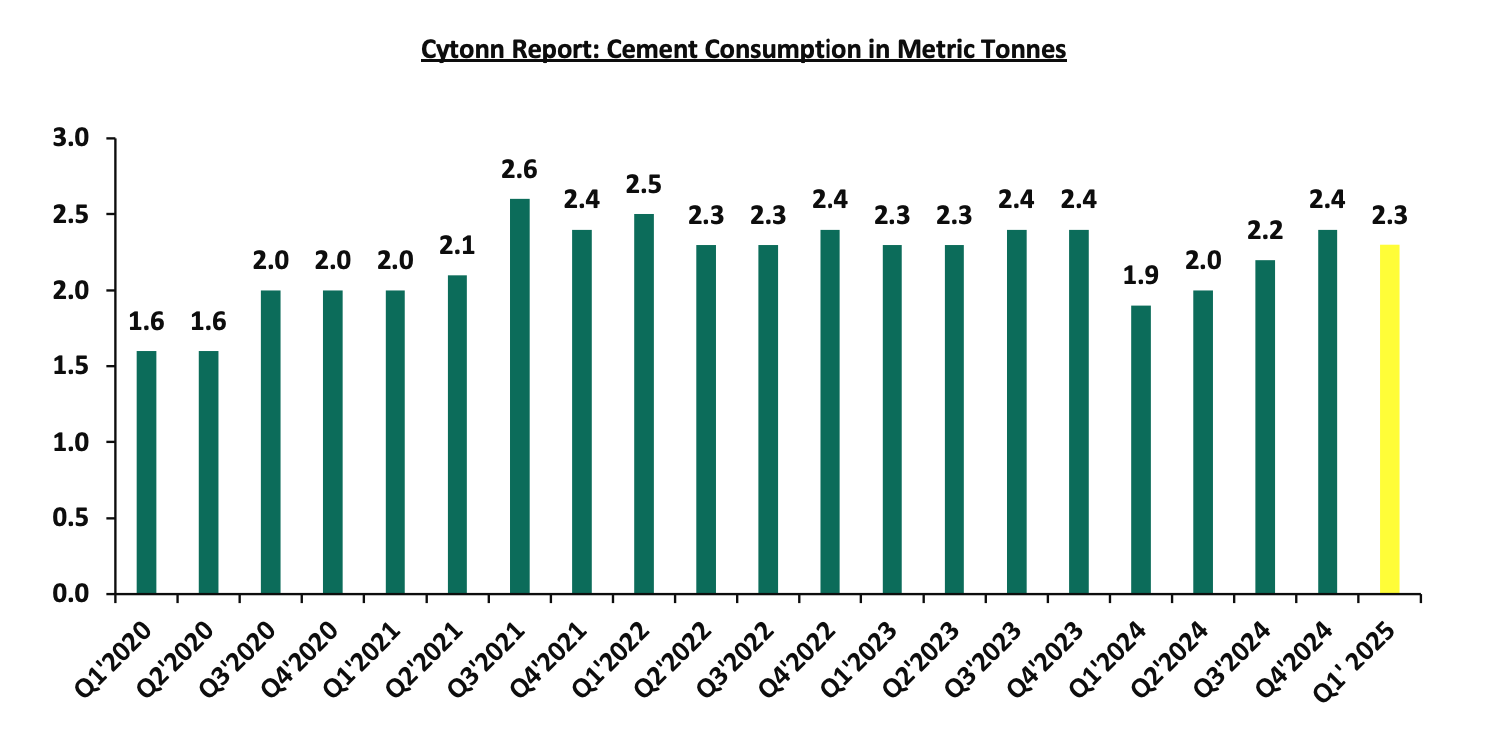
- Cement consumption in Q1’2025 decreased slightly by 0.2% to 2.3 bn metric tonnes from 2.4 bn metric tonnes in Q4’2024. This decline indicates a temporary slowdown in construction activity or demand at the start of the year, potentially influenced by (i) seasonal Slowdown in construction activity as Q1 often experiences a temporary slowdown in construction due to post-holiday resource reallocation and planning phases, particularly in January and February, which may have reduced cement demand, (ii) adverse weather conditions arising from the long rains starting in March,which disrupted construction activities nationwide.
- On a year-on-year basis, cement consumption in Q1’2025 increased by 20.7% to 2.3 bn metric tonnes, up from 1.9 bn metric tonnes recorded in Q1’2024. This significant growth reflects a broader resurgence in the construction sector, driven by, (i) a surge in domestic construction and infrastructure development fuelled by an increase in private sector investments in residential, commercial, and mixed-use developments, which have spurred higher cement usage, (ii) Expanded government-led infrastructure programs that saw the government's continued investment in flagship infrastructure projects such as roads, affordable housing, water and sanitation systems, and public buildings under the Bottom-Up Economic Transformation Agenda (BETA) has sustained cement demand. These initiatives are designed to provide jobs while upgrading critical infrastructure.
The chart below shows cement consumption in metric tonnes in Kenya between Q1’2020 and Q1’2025.
- Residential Sector
- Superior Homes Kenya (SHK) and KCB Partnership
During the week, Superior Homes Kenya (SHK), a real estate developer, and KCB Bank Kenya, formalized a strategic partnership through a Memorandum of Understanding (MOU), that aims to bridge the gap between property development and financing, addressing long-standing challenges in Kenya’s Real Estate sector that include massive housing deficit, unaffordability, widespread informal settlements, land tenure insecurity, and limited financing. By leveraging KCB’s financial expertise and SHK’s innovative housing projects, the partnership seeks to empower middle-income earners while contributing to Kenya’s housing agenda of reducing the housing deficit which currently stands at 80%.
The SHK-KCB partnership is designed to address key challenges in Kenya’s Real Estate sector, particularly the limited access to structured financial solutions for homeownership. The primary objectives include:
- Enhancing Access to Mortgage Financing: as the partnership will enable SHK investors to access tailor-made mortgage products from KCB Bank. These products will include (i) competitive interest rates, (ii) structured repayment plans, (iii) longer tenure options, (iii) dedicated customer support to guide buyers through the application and approval processes.
- Promoting Sustainable Homeownership: as the financial solutions will cater for diverse buyer profiles including first-time buyers, investors, and diaspora Kenyans. It is important to note that the partnership aligns with SHK and KCB’s shared vision of empowering more Kenyans to achieve homeownership in a financially sustainable manner.
- Driving Sustainable Urban Growth: as the collaboration supports Kenya’s housing agenda by facilitating the development of master-planned communities that prioritize sustainability, quality infrastructure, and community living, contributing to the country’s broader urban development goals.
- Bridging the Gap Between Development and Financing: by addressing the disconnect between property development and accessible financing, a significant barrier in Kenya where 6% of citizens rely on personal savings for home construction due to limited mortgage uptake at 3.6% as per Kenya Bankers Association.
- Kenya Mortgage Refinance Company (KMRC) Facility: The partnership leverages the KMRC mortgage facility, enabling up to 105.0% borrowing to cover both the property purchase and associated closing costs, such as legal fees and stamp duty, easing the transition into home ownershi
While the partnership holds significant promise, several challenges could affect its success:
- Awareness and Financial Literacy: Many Kenyans lack awareness of mortgage options or distrust formal financing due to cultural preferences for saving-based construction. SHK and KCB will need to invest in financial literacy campaigns to educate potential buyers about the benefits of mortgages.
- Regulatory and Market Risks: Changes in government policies, such as tax reforms or housing regulations, could affect the real estate market.
- Environmental and Social Concerns: As Kenya grapples with the environmental impact of rapid urbanization SHK must ensure that its projects adhere to sustainable practices to avoid exacerbating ecological issues.
As Kenya’s real estate sector continues to grow, this collaboration could serve as a model for future partnerships aimed at transforming the housing landscape.
- Hospitality Sector
- Acquisition of Pollman’s Tours and Safaris Limited by Alterra Capital
During the week, Africa Travel Investments, a tourism investment firm trading as Africa Travel and backed by a wealthy figure such as Aliko Dangote, has made a 100% acquisition worth Kshs 4.0 bn of Pollman’s Tours and Safaris Limited (Pollman’s)following an unconditional approval from the Competition Authority of Kenya (CAK). The acquisition, facilitated through private equity fund Alterra Capital marks a strategic entry into Kenya’s tourism sector, signalling strong confidence in its long-term growth prospects.
The CAK noted that the transaction will not alter the market share or concentration of Kenya’s fragmented tour operator market, which comprises over 300 firms, including Bonfire Adventures and Bountiful Safaris, as the acquirer and target operate in distinct business segments. The deal is expected to have no adverse impact on employment or small business competitiveness, aligning with Kenya’s public interest considerations under merger law.
This acquisition follows Alterra Capital’s recent investment in ARP Africa Travel Group, which operates Pollman’s, and its majority stake acquisition in the Java Coffee chain, which operates 73 branches across Kenya, Uganda, and Rwanda.
Founded in 2020 for the investment purposes in Africa, Alterra Capital has paid a keen interest in Kenya’s tourism sector which has been on a revival over the recent past, with holiday-bound tourist arrivals crossing the one million mark for the first time in 2024 and revenues crossing Kshs 650.0 bn.
This strategic move reflects confidence in the sector's growth potential and aims to bolster its development. It is poised to act as a catalyst for broader economic activity with the following key implications:
- Boost to Kenya’s Hospitality Sector: the investment underscores a strong vote of confidence in Kenya's tourism industry, a significant contributor to the national economy. With backing from influential investors, the sector is well-positioned for enhanced growth and increased global competitiveness.
- Anticipated Expansion in Tourism activities: which is likely to foster demand for hospitality amenities such as hotels, lodges, resorts and vacation rentals, and supporting infrastructure such as shopping malls and restaurants. This acquisition could also lead to the exploration and promotion of lesser-known tourist destinations.
- Real estate and Infrastructure Development: Increased tourism activity is likely to spur real estate development in previously underdeveloped areas, leading to infrastructure development such as roads and airports. This could lead to property value appreciation and economic revitalization in these areas.
- Access to Global Best Practices: The involvement of a globally connected investor introduces access to international best practices, diversified customer bases, and advanced risk management tools that can make local operators more resilient to shocks such as pandemics, geopolitical unrest, or economic downturns. This could help stabilize the tourism industry, which has traditionally been highly vulnerable to external disruptions.
The acquisition represents more than just a business deal; it signals renewed confidence in Kenya’s tourism potential. Beyond strengthening the hospitality sector, this strategic investment is poised to act as a catalyst for broader economic activity, especially in the real estate space. From increased demand for hotels and resorts to the revitalization of underdeveloped regions and appreciation of property values, the ripple effects are set to be significant.
- Real Estate Investments Trusts (REITs) Performance
On the Unquoted Securities Platform, Acorn D-REIT and I-REIT traded at Kshs 25.4 and Kshs 22.2 per unit, respectively, as per the last updated data on 2nd May 2025. The performance represented a 27.0% and 11.0% gain for the D-REIT and I-REIT, respectively, from the Kshs 20.0 inception price. The volumes traded for the D-REIT and I-REIT came in at Kshs 12.8 mn and Kshs 37.5 mn shares, respectively. Additionally, ILAM Fahari I-REIT traded at Kshs 11.0 per share as of 2nd May 2025, representing a 45.0% loss from the Kshs 20.0 inception price. The volume traded to date came in at Kshs 1.2 mn shares for the I-REIT since inception in November 2015.
REITs offer various benefits, such as tax exemptions, diversified portfolios, and stable long-term profits. However, the ongoing decline in the performance of Kenyan REITs and the restructuring of their business portfolios are hindering significant previous investments. Additional general challenges include:
- Insufficient understanding of the investment instrument among investors leading to a slower uptake of REIT products,
- Lengthy approval processes for REIT creation,
- High minimum capital requirements of Kshs 100.0 mn for REIT trustees compared to Kshs 10.0 mn for pension funds Trustees, essentially limiting the licensed REIT Trustee to banks only
- The rigidity of choice between either a D-REIT or and I-REIT forces managers to form two REITs, rather than having one Hybrid REIT that can allocate between development and income earning properties
- Limiting the type of legal entity that can form a REIT to only a trust company, as opposed to allowing other entities such as partnerships, and companies,
- We need to give time before REITS are required to list – they would be allowed to stay private for a few years before the requirement to list given that not all companies maybe comfortable with listing on day one, and,
- Minimum subscription amounts or offer parcels set at Kshs 0.1 mn for D-REITs and Kshs 5.0 mn for restricted I-REITs. The significant capital requirements still make REITs relatively inaccessible to smaller retail investors compared to other investment vehicles like unit trusts or government bonds, all of which continue to limit the performance of Kenyan REITs.
We expect Kenya’s Real Estate sector to remain on a growth trend, supported by: i) demand for housing sustained by positive demographics, such as urbanization and population growth rates of 3.8% p.a and 2.0% p.a, respectively, against the global average of 1.7% p.a and 0.9% p.a, respectively, as at 2023,, ii) activities by the government under the Affordable Housing Program (AHP) iii) heightened activities by private players in the residential sector iv) increased investment by local and international investors in the retail sector. However, challenges such as rising construction costs, strain on infrastructure development (including drainage systems), high capital requirements for REITs, and existing oversupply in select Real Estate sectors will continue to hinder the sector’s optimal performance by limiting developments and investments.
In 2024, we published the Nairobi Metropolitan Area Residential Report 2024 themed ‘Untapped Investment Niches’. This week, we update our previous research with the Nairobi Metropolitan Area (NMA) Residential Report 2025 titled ‘Navigating Opportunities in a Resilient Market’ by highlighting the residential sector's performance in the region in terms of price appreciation, rental yields, and market uptake, based on the coverage of 35 regions within the Nairobi Metropolis. We shall also discuss factors influencing residential supply and demand, current developments affecting the industry, and conclude with a look at investment options as well as the sector's general outlook for the coming fiscal year. As such, we shall discuss the following;
- Overview of the Residential Sector,
- Recent Developments in the Sector,
- Residential Market Performance, and,
- Conclusion, Residential Market Outlook, and Investment Opportunity.
Section I: Overview of the Residential Sector
In FY’2024/25, the residential sector maintained resilience despite economic challenges, supported by sustained demand from Kenya’s high urbanization rate of 3.8% p.a. and population growth 2.0% p.a. rates compared to the global average of 1.7%p.a and 0.9% p.a, respectively, as per World Bank 2023 data. According to the Kenya National Bureau of Statistics (KNBS)2025 Economic Survey, the Real Estate sector’s contribution to GDP grew by 4.6% to KSh 283.1 bn in Q4’2024, up from KSh 270.5 bn in Q4’2023, contributing 10.0% to GDP a 0.3% decrease from 10.3% in Q4’2023. Cumulatively, Real Estate and construction sectors accounted for 15.6% of GDP, a 3.6% decline from 19.2% in Q4’2023, reflecting economic slowdown and reduced construction activity.
The residential sector recorded a slight downtrend in performance, with the average total returns to investors coming in at 5.8%, a 0.3%-point decline from 6.1% recorded in FY’2023. The performance was attributed to a decrease in the residential average y/y price appreciation which came in at 0.4% in FY’2024, 0.2%-points lower than the 0.6% appreciation recorded in FY’2023, driven by slowed property transactions during the year. However, we expect the sector’s contribution to continue improving in 2025 supported by;
- Government and private sector aggressiveness in implementing housing initiative programs, which focus on affordable housing. As of 2024, the Affordable Housing Programme (AHP) advanced with 1,189 units completed and an estimated total of 730,062 housing units under construction by both the government and the private sector. This is according to the Architectural Association of Kenya (AAK’s) Status of the Built Environment Report 2024,
- Continued efforts by the Kenya Mortgage Refinance Company (KMRC) to drive the availability and affordability of home loans to Kenyans by providing single-digit fixed rate, and long-term finance to Primary Mortgage Lenders (PMLs) such as banks and SACCOs. In FY’2023, KMRC had disbursed Kshs 9.6 bn to twelve participating PMLs (7 banks and 5 saccos),
- Concerted efforts by the government to provide affordable mortgages through the Kenya Mortgage Refinance Company (KMRC), in a bid to make home ownership more accessible to Kenyans by providing long-term, low-interest home loans to potential home buyers. By December 2023, KMRC refinanced 3,128 mortgages for refinancing at a low interest rate of 5.0%, and,
- The growing trend towards use of alternative financing for Real Estate development particularly Public-Private Partnerships (PPPs) like Lapfund Bellevue Park Residences, enhancing supply.
Going forward, we anticipate that the following factors will influence the performance of the residential sector;
- Housing Deficit: The Center for Affordable Housing Finance Africa (CAHF) projected that Kenya's housing deficit reached 80.0% in 2024. This estimation arises from the annual delivery of approximately 50,000 new homes, falling significantly short of the demand, which amounts to 250,000 homes per year. Notably, the low-income segment faces substantial under-representation, receiving only 2% of the constructed residences. To bridge this disparity, the government, through the Affordable Housing Programme (AHP), is committed to addressing the issue. Consequently, the demand for affordable housing continues to surge, driven by increased participation from private sector entities entering into Public Private Partnerships (PPPs),
- Demographics: Kenya continues to witness positive demographics as evidenced by Kenya’s relatively high urbanization and population growth rates of 3.8% p.a and 2.0% p.a, respectively, against the global averages of 1.7%p.a and 0.9% p.a, respectively, as at 2023. As such, the demand for Real Estate development in the country continues to increase, and,
- Access to Credit: High mortgage interest rates currently at 14.3% and high transaction costs, have made it difficult for low- and middle-income earners to afford mortgages. Nonetheless, we foresee that heightened cooperation among industry stakeholders and the Kenya Mortgage Refinance Company (KMRC) will help alleviate this challenge. Particularly noteworthy are the government's initiatives aimed at enhancing accessibility to affordable home loans for Kenyans, offering reduced interest rates starting from 9.5%. These measures are poised to enhance the effectiveness of mortgage lending by enhancing accessibility to home loans, thereby stimulating higher adoption rates across the nation.
In terms of supply, the residential sector has been largely constrained by insufficient access to affordable funding by developers, and bureaucracies and delays in approval processes. In 2025, new supply is also expected to slow down owing to:
- Rising construction costs: In 2024, construction costs decreased by 8% to an average of Kshs 66,375 per SQM from an average of Kshs 71,200 per SQM recorded in 2023. This decrease can be attributed to the Kenyan shilling’s appreciation against the US Dollar, strengthening from Kshs 153.3 in December 2023 to Kshs 129.0 by December 2024,
- Constrained Access to Financing: Lenders continue to tighten their lending requirements and demand more collateral from developers as a result of elevated credit risk in the Real Estate sector as evidenced by the 16.6% increase in gross Non-Performing Loans (NPLs) to Kshs 118.6 bn in Q4’2024, from Kshs 101.7 bn recorded during Q4’2023, and,
Section II: Recent Developments in the Sector
In FY’2024/25, the government announced the following regulations, policies, measures, and proposals affecting the residential sector namely:
- The Kenyan government proposed amendmentsto the Land Act 2012 seek to shorten the period within which affordable housing loan defaulters must regularize their payments before lenders can initiate foreclosure. The changes would reduce the default notice window from 90 to 45 days and the foreclosure notice from 40 to 20 days. For more information, please see our Cytonn Weekly #16/2025,
- The Kenyan government introduceda State-backed initiative to provide affordable mortgages of up to Kshs 6.0 mn to non-salaried workers, aiming to enhance homeownership among the informal sector, which comprises approximately 83.0% of the nation's 18.0 mn labor force. For more information, please see our Cytonn Q1’2025 Markets Review,
- The Kenyan government has introduceda Kshs 10.0 bn low-cost mortgage scheme aimed at facilitating rural home construction. This initiative, funded by the Housing Levy, offers single-digit interest loans repayable over ten years, with individual applicants eligible for up to Kshs 5.0 mn and multiple-family dwellings up to Kshs 10.0 mn. For more information, please see our Cytonn weekly #51/2024 ,
- Affordable Housing Act 2024: This enactment follows a rigorous legislative process, spurred by a High Court ruling that declared the previous housing levy unconstitutional, citing administrative and discriminatory flaws. In the wake of this ruling, the government embarked on creating a more robust and inclusive framework for addressing the nation's housing needs. For more information, please see our Cytonn Weekly #12/2024, and,
- FY’2025/26 Budget Statement: the 2025 Budget Policy Statement indicates that the government's allocation for Infrastructure, Energy, and Information and Technology (ICT) for the fiscal year 2025/2026 is expected to be Kshs 504.6 bn, a 0.2% decrease from the previous fiscal year's allocation of Kshs 505.7 bn. The decreased budgetary allocation to the Infrastructure, Energy, and Information and Technology (ICT) sector in the FY’2025/26 Budget Statement is attributed to various factors, including the government’s fiscal policy stance to prioritize reduction of public debt vulnerabilities especially after the June 2024 protests that led to the withdrawal of the Finance Bill 2024 leading to revenue shortfalls and a revised fiscal framework.
It is important to highlight that various multilateral institutions, private entities, and the government have embarked on diverse approaches to secure funding for residential projects, including leveraging the capital markets and offering grants and loans. These initiatives are aimed at bolstering the supply side of the affordable housing initiative, with the goal of achieving an annual target of 250,000 units. Additionally, organizations have actively pursued partnerships and agreements to facilitate the realization of their residential projects. Some of the notable initiatives include;
- KCB Bank and Mi Vida Homes entereda partnership to accelerate the development of eco-friendly, affordable housing in Kenya. This collaboration supports the government’s Affordable Housing Programme, which aims to deliver 250,000 units annually to bridge the country’s significant housing deficit. Under the agreement, KCB will provide construction financing for Mi Vida’s projects and also offer mortgage loans to buyers, aiming to make homeownership more accessible. Mi Vida plans to develop 5,000 homes over the next five years, focusing on well-planned, sustainable communities. For more information, please see our Cytonn Weekly #15/2025,
- Shelter Afrique Development Bank (ShafDB) and the African Union (AU) have signeda Memorandum of Understanding (MOU) to address Africa's significant housing deficit, estimated at 0 mn units with a financing gap of USD 1.4 tn. For more information, please see our Cytonn weekly #51/2024,
- Centum Real Estate announced a strategic partnership with Gulf African Bank to offer Shariah-compliant mortgage financing to its customers. This collaboration aims to expand home financing options and drive the uptake of Centum's property portfolio. Under the agreement, customers will access up to 90.0% mortgage financing with a repayment period of up to 20 years and an expedited 48-hour approval process. For more information, please see our Cytonn weekly #46/2024,
- Shelter Afrique Development Bank (ShafDB) and the regional stock exchange serving the West African Economic and Monetary Union (WAEMU) region, Bourse Régionale des Valeurs Mobilières (BRVM), announced the signing of a partnership aimed at addressing Africa’s housing deficit, by establishing a framework to mobilize financial resources through innovative instruments such as green, sustainability-linked, and social bonds, as well as Real Estate Investment Trusts (REITs). For more information, please see our Cytonn monthly Report-October 2024 .
In terms of financing for residential unit demand, the government is intensifying its efforts to facilitate affordable mortgages via the Kenya Mortgage Refinance Company (KMRC). The objective is to enhance accessibility to homeownership for Kenyan citizens by offering long-term, low-interest home loans to prospective buyers. In 2023, KMRC successfully refinanced 3,128 mortgages at an advantageous interest rate of 5.0%. Some of the notable highlights regarding affordable mortgages include;
- The Kenyan government secured Kshs 559.6 mn from the World Bank Group to initiate a credit guarantee scheme aimed at providing affordable mortgages to non-salaried workers, commonly referred to as "hustlers." This initiative, managed by the Kenya Mortgage Guarantee Trust (KMGT), seeks to mitigate lender risk by covering up to 40% of potential mortgage defaults, encouraging financial institutions to extend home loans to informal sector workers who typically lack consistent income streams. For more information, please see our Cytonn Q1’2025 Markets Review,
- The Kenya Mortgage Refinance Company (KMRC) broadened its refinancing services to include non-shareholders, such as SACCOs and microfinance institutions. This is a strategic move to improve access to affordable mortgages, particularly for low- and middle-income earners, a key target of Kenya's affordable housing agenda. For more information, please see our Cytonn Weekly #39/2024.
Section III: Residential Market Performance
In FY’2024/25 there was a slight decrease in residential market performance in Nairobi Metropolitan Area, with the average total returns to investors coming in at 5.8%, a 0.3%-point decline from 6.1% recorded in FY’2023/24. The performance was attributed to a decrease in the residential average y/y price appreciation which came in at 0.4% in FY’2024/25, 0.2%-points lower than the 0.6% appreciation recorded in FY’2023/24, driven by slowed property transactions during the year. On the other hand, the average rental yield came in at 5.4% in FY’2024/25, recording a 0.1%-points decline from the 5.5% rental yield recorded in FY’2023/24. The average rental yield came in at 5.5% in FY’2023, recording a 0.4%-points increase from the 5.1% rental yield recorded in FY’2022/23. This was driven by a decline in the average rent per SQM by 5.3 % to Kshs 567, from Kshs 599 recorded in FY’2023. The table below shows the comparison between the performance in FY’2024’25 and FY’2023/24;
|
Cytonn Report: Residential Market Performance Summary: FY’2024/25 - FY’2024/25 |
|||||||||||
|
Segment |
Average of Price per SQM FY'2024/25 |
Average of Rent per SQM FY'2024/25 |
Average of Rental Yield FY'2024/25 |
Average of Price Appreciation FY'2024/25 |
Average of Total Returns FY'2024/25 |
Average of Rental Yield FY'2023/24 |
Average of Price Appreciation FY'2023/24 |
Average of Total Returns FY'2023/24 |
y/y ∆ in Rental Yield (% points) |
y/y ∆ in Price Appreciation (% points) |
y/y ∆ in Total Returns (% points) |
|
Detached Units |
|||||||||||
|
High End |
198,900 |
863 |
4.8% |
0.1% |
4.9% |
5.4% |
0.4% |
5.8% |
(0.6%) |
(0.3%) |
(0.9%) |
|
Lower Middle |
80,839 |
362 |
4.9% |
0.6% |
5.5% |
5.3% |
0.8% |
6.1% |
(0.4%) |
(0.2%) |
(0.6%) |
|
Upper Middle |
145,906 |
632 |
5.0% |
0.3% |
5.3% |
5.4% |
0.4% |
5.7% |
(0.4%) |
0.0% |
(0.4%) |
|
Detached Units Average |
141,882 |
619 |
4.9% |
0.4% |
5.2% |
5.4% |
0.5% |
5.9% |
(0.5%) |
(0.1%) |
(0.6%) |
|
Apartments |
|||||||||||
|
Lower Mid- End Suburbs |
91,530 |
473 |
5.7% |
0.0% |
5.7% |
5.8% |
0.8% |
6.6% |
(0.1%) |
(0.8%) |
(0.9%) |
|
Upper Mid- End |
118,861 |
652 |
6.0% |
1.2% |
7.2% |
5.7% |
0.1% |
5.8% |
0.3% |
1.1% |
1.4% |
|
Lower Mid-End Satellite Towns |
73,997 |
421 |
6.3% |
(0.1%) |
6.2% |
5.6% |
0.9% |
6.5% |
0.7% |
(1.0%) |
(0.3%) |
|
Apartments Average |
94,796 |
515 |
6.0% |
0.4% |
6.4% |
5.7% |
0.6% |
6.3% |
0.3% |
(0.2%) |
0.1% |
|
Residential Market Average |
118,339 |
567 |
5.4% |
0.4% |
5.8% |
5.5% |
0.6% |
6.1% |
(0.1%) |
(0.2%) |
(0.3%) |
Source: Cytonn Research
Sub-Market Analysis
In our submarket analysis, we classified the various suburbs in the Nairobi Metropolitan Area into three segments;
High End Segment – Consists of prime suburbs in Nairobi, such as Karen, Runda and Kitisuru. The majority of these areas have been designated for low-rise residential construction and are distinguished by their large, luxurious villas and bungalows,
Upper Middle-Income Segment – Consists of suburbs zoned for both high rise and low-density houses such as Kilimani, Lavington, Kileleshwa, Loresho, and Ridgeways among others. The population in these zones are middle class but with higher incomes than the average characterization of middle class,
Lower Middle-Income Segment – Consists of suburbs in Nairobi habited by middle class such as Ruiru, Kikuyu, Ruaka, Dagoretti, Upper Kabete (Uthiru and parts of Mountain View), and Ngong Road (Race Course, Lenana, Corner), among others.
- Detached Units
The segment registered an average total return of 5.2%, 0.6% lower than the 5.8% recorded in FY’2023. The performance was driven by a 0.4%-points decrease in the average rental yield to 4.9% in FY’2024, from 5.3% recorded in FY’2023. The decrease in performance was attributable to a 7.7% decrease in the average rents per SQM to Kshs 619 in FY’2024, from Kshs 671 recorded in FY’2023. The best-performing segment was the Lower-middle segment offering an average total return of 5.5%, attributable to a relatively high average price appreciation of 0.6%, 0.2%-points higher than the detached market average appreciation of 0.4%. The impressive performance of the segment was driven by returns from well-performing nodes such as Kitengela, Ngong and Juja, which have continued to offer relatively high returns to investors. Overall, Kitengela was the best-performing node, offering the highest returns at 6.7%, 1.5% points higher than the detached market average of 5.2%, driven by a relatively high y/y price appreciation of 1.7%. The node has seen increased detached unit property investments owing to an inflow of residents brought about by the enhanced accessibility to the Nairobi CBD through various roads such as Mombasa road and the Nairobi Express way. Also, the area enjoys proximity to various amenities such as the SGR and JKIA. Ngong followed with an average total return of 6.4%, 1.2% points higher than the detached market average of 5.2%.
|
All values in Kshs unless stated otherwise |
|||||||||||
|
Cytonn Report: Residential Detached Units Summary FY’2024/25 |
|||||||||||
|
Area |
Average of Occupancy FY'2024/25 |
Average of Annual Uptake FY'2024/25 |
Average of Rental Yield FY'2024 |
Average of Price Appreciation FY'2024 |
Average of Total Returns FY'2024/25 |
Average of Rental Yield FY'2023/24 |
Average of Price Appreciation FY'2023/24 |
Average of Total Returns FY'2023/24 |
Change in Rental Yield (% Points) |
Change in Price Appreciation (% Points) |
Change in Total Returns (% Points) |
|
High End |
|||||||||||
|
Lower Kabete |
92.9% |
10.4% |
4.9% |
1.1% |
6.0% |
4.6% |
1.0% |
5.6% |
0.3% |
0.1% |
0.4% |
|
Rosslyn |
92.9% |
11.2% |
5.2% |
0.0% |
5.2% |
5.4% |
(0.3%) |
5.1% |
(0.2%) |
0.3% |
0.1% |
|
Runda |
95.9% |
8.9% |
5.2% |
(0.4%) |
4.8% |
5.1% |
0.2% |
5.3% |
0.1% |
(0.6%) |
(0.5%) |
|
Karen |
91.6% |
10.6% |
4.5% |
0.0% |
4.5% |
6.6% |
(0.1%) |
6.5% |
(2.1%) |
0.1% |
(2.0%) |
|
Kitisuru |
90.7% |
9.7% |
4.2% |
0.0% |
4.2% |
5.1% |
1.1% |
6.2% |
(0.9%) |
(1.1%) |
(2.0%) |
|
Average |
92.8% |
10.2% |
4.8% |
0.1% |
4.9% |
5.4% |
0.4% |
5.8% |
(0.6%) |
(0.3%) |
(0.9%) |
|
Upper Middle |
|||||||||||
|
South B/C |
89.6% |
10.6% |
6.4% |
(0.1%) |
6.3% |
4.3% |
0.2% |
4.5% |
2.1% |
(0.3%) |
1.8% |
|
Loresho |
90.6% |
10.6% |
5.6% |
0.1% |
5.7% |
5.3% |
0.0% |
5.3% |
0.3% |
0.1% |
0.4% |
|
Redhill/Sigona |
92.0% |
10.9% |
5.3% |
0.4% |
5.7% |
5.4% |
0.9% |
6.3% |
0.1% |
(0.5%) |
(0.6%) |
|
Runda Mumwe |
91.1% |
14.8% |
4.7% |
0.7% |
5.4% |
4.8% |
1.2% |
5.9% |
(0.1%) |
(0.5%) |
(0.5%) |
|
Ridgeways |
87.5% |
9.7% |
5.0% |
0.0% |
5.0% |
6.2% |
(0.2%) |
6.0% |
(1.2%) |
0.2% |
(1.0%) |
|
Lavington |
91.2% |
9.8% |
3.8% |
0.8% |
4.6% |
6.3% |
(0.6%) |
5.7% |
(2.5%) |
1.4% |
(1.1%) |
|
Langata |
91.1% |
7.6% |
4.2% |
0.0% |
4.2% |
4.3% |
0.6% |
4.9% |
(0.1%) |
(0.6%) |
(0.6%) |
|
Average |
90.4% |
10.6% |
5.0% |
0.3% |
5.3% |
5.4% |
0.3% |
5.7% |
(0.4%) |
0.0% |
(0.4%) |
|
Lower Middle |
|||||||||||
|
Kitengela |
91.1% |
10.7% |
5.0% |
1.7% |
6.7% |
5.0% |
0.7% |
5.7% |
0.0% |
1.0% |
1.0% |
|
Ngong |
94.4% |
7.3% |
5.2% |
1.2% |
6.4% |
5.8% |
1.5% |
7.3% |
(0.6%) |
(0.3%) |
(0.9%) |
|
Juja |
89.0% |
8.1% |
4.3% |
1.9% |
6.2% |
5.5% |
0.5% |
6.0% |
(1.2%) |
1.4% |
0.2% |
|
Thika |
83.2% |
11.6% |
5.5% |
0.4% |
5.9% |
5.3% |
0.0% |
5.3% |
(0.2%) |
0.4% |
0.6% |
|
Rongai |
96.9% |
11.4% |
5.2% |
0.5% |
5.6% |
4.5% |
0.4% |
4.9% |
0.7% |
0.1% |
0.7% |
|
Syokimau/ Mlolongo |
91.6% |
11.2% |
4.9% |
0.0% |
5.0% |
5.5% |
1.6% |
7.1% |
(0.6%) |
(1.6%) |
(2.1%) |
|
Athi River |
88.6% |
9.8% |
4.9% |
(0.6%) |
4.3% |
5.6% |
1.1% |
6.7% |
(0.7%) |
0.5% |
(2.4%) |
|
Donholm/ Komarock |
87.5% |
9.9% |
4.0% |
0.0% |
4.0% |
4.8% |
(0.3%) |
4.5% |
(0.8%) |
0.3% |
(0.5%) |
|
Average |
90.3% |
10.0% |
4.9% |
0.6% |
5.5% |
5.3% |
0.8% |
6.1% |
(0.4%) |
(0.2%) |
(0.6%) |
|
Detached Average |
91.2% |
10.2% |
4.9% |
0.4% |
5.2% |
4.3% |
0.5% |
5.8% |
0.6% |
(0.1%) |
(0.6%) |
Source: Cytonn Research
- Apartments
The segment posted a slight decrease in performance with the average total returns to apartments’ investors coming in at 6.4%, recording a 0.2%-points increase from the 6.2% recorded during FY’2023. The slight improved performance was driven by a 0.2%-points increase in the average rental yield to 5.9% in FY’2024, from 5.7% recorded in FY’2023. This was driven by a slightly increased apartment property transactions during the period, attributable to 4.0% points increase in the average occupancy to 91.6% in FY’2024 from 87.6% in FY’2023. The best-performing segment was the upper mid-end suburbs towns with average total returns of 7.1%, attributed to a relatively high average y/y price appreciation of 1.2% and rental yield of 6.0%. The impressive performance of the segment was driven by returns from well-performing nodes such as Westlands, parklands, Kileleshwa and Kilimani that have continued to offer competitive returns to investors in comparison to other segments. Overall, the best-performing node was Kahawa West, offering investors average total returns of 12.0%, 5.6%-points higher than the apartment market average total return of 6.4%. Kahawa West is attracting apartment investments owing to infrastructural development with the roads such as Thika Road, proximity to CBD favouring residents in the area, a high number of middle-class families in the area, proximity to retail centers such as Garden City, Juja Mall, and Thika Road Mall, and proximity to higher learning institutions such as Kenyatta University. The table below shows the NMA residential sector detached units’ performance during FY’2024/25;
|
All values in Kshs unless stated otherwise |
|||||||||||
|
Cytonn Report: Residential Apartments Summary FY’2024/25 |
|||||||||||
|
Area |
Average of Occupancy FY'2024/25 |
Average of Annual Uptake FY'2024/25 |
Average of Rental Yield FY'2024/25 |
Average of Price Appreciation FY'2024/25 |
Average of Total Returns FY'2024/25 |
Average of Rental Yield FY'2023/24 |
Average of Price Appreciation FY'2023/24 |
Average of Total Returns FY'2023/24 |
Change in Rental Yield (% Points) |
Change in Price Appreciation (% Points) |
Change in Total Returns (% Points) |
|
Upper Mid-End |
|||||||||||
|
Westlands |
90.1% |
14.5% |
6.3% |
4.4% |
10.6% |
5.7% |
0.8% |
6.5% |
0.6% |
3.6% |
4.1% |
|
Parklands |
92.7% |
12.4% |
6.2% |
1.5% |
7.7% |
5.4% |
0.0% |
5.4% |
0.8% |
1.5% |
2.3% |
|
Kileleshwa |
96.1% |
10.8% |
6.6% |
0.0% |
6.6% |
5.6% |
0.5% |
6.1% |
1.0% |
(0.5%) |
0.5% |
|
Kilimani |
92.8% |
12.8% |
6.3% |
0.3% |
6.6% |
5.8% |
0.4% |
6.2% |
0.5% |
(0.1%) |
0.4% |
|
Upperhill |
88.3% |
10.1% |
5.8% |
0.5% |
6.2% |
6.0% |
(0.8%) |
5.2% |
(0.2%) |
1.3% |
1.0% |
|
Loresho |
95.8% |
7.2% |
4.5% |
0.3% |
4.8% |
5.9% |
(0.2%) |
5.7% |
(1.4%) |
0.5% |
(0.9%) |
|
Average |
92.6% |
11.3% |
5.9% |
1.2% |
7.1% |
5.7% |
0.1% |
5.8% |
0.2% |
1.1% |
1.3% |
|
Lower Mid-End Suburbs |
|||||||||||
|
Kahawa West |
92.1% |
7.2% |
3.6% |
8.3% |
12.0% |
5.9% |
1.0% |
6.9% |
(2.3%) |
7.3% |
5.1% |
|
Dagoretti |
88.8% |
11.5% |
9.6% |
1.9% |
11.5% |
5.7% |
0.7% |
6.4% |
3.9% |
1.2% |
5.1% |
|
Waiyaki Way |
91.9% |
12.3% |
5.7% |
0.9% |
6.6% |
5.7% |
1.8% |
7.5% |
0.0% |
(0.9%) |
(0.9%) |
|
Race Course/Lenana |
85.5% |
10.8% |
5.7% |
0.8% |
6.5% |
6.1% |
0.6% |
6.7% |
(0.4%) |
(0.2%) |
(0.2%) |
|
South B |
93.0% |
12.1% |
4.8% |
0.0% |
4.8% |
6.0% |
(0.3%) |
5.7% |
(1.2%) |
0.3% |
(0.9%) |
|
South C |
84.9% |
14.0% |
4.0% |
0.0% |
4.0% |
5.8% |
1.4% |
7.2% |
(1.8%) |
(1.4%) |
(3.2%) |
|
Langata |
93.3% |
10.0% |
4.4% |
(0.6%) |
3.8% |
5.7% |
(0.2%) |
5.5% |
(1.3%) |
(0.4%) |
(1.7%) |
|
Imara Daima |
95.9% |
8.3% |
5.8% |
(2.7%) |
3.1% |
5.3% |
1.7% |
7.0% |
0.5% |
(4.4%) |
(3.9%) |
|
Average |
90.7% |
10.8% |
5.5% |
1.1% |
6.5% |
5.8% |
0.8% |
6.6% |
(0.3%) |
0.3% |
(0.1%) |
|
Lower Mid-End Satellite Towns |
|||||||||||
|
Ngong |
93.7% |
11.0% |
6.2% |
3.1% |
9.3% |
5.8% |
0.9% |
6.7% |
0.4% |
2.2% |
2.6% |
|
Ruaka |
90.9% |
12.5% |
5.1% |
3.2% |
8.3% |
5.1% |
1.5% |
6.6% |
0.0% |
1.7% |
1.7% |
|
Syokimau |
87.8% |
10.9% |
5.4% |
2.5% |
7.9% |
5.4% |
0.6% |
6.0% |
0.0% |
1.9% |
1.9% |
|
Ruiru |
87.1% |
12.6% |
5.9% |
0.0% |
5.9% |
5.5% |
1.0% |
6.5% |
0.4% |
(1.0%) |
(0.6%) |
|
Rongai |
89.7% |
11.9% |
5.5% |
(0.4%) |
5.1% |
6.0% |
(0.4%) |
5.6% |
(0.5%) |
0.0% |
(0.5%) |
|
Kikuyu |
95.8% |
15.0% |
6.5% |
(1.9%) |
4.5% |
5.2% |
0.3% |
5.5% |
1.3% |
(2.2%) |
(1.0%) |
|
Athi River |
97.1% |
11.7% |
9.4% |
(7.1%) |
2.3% |
5.9% |
1.5% |
7.4% |
3.5% |
(8.6%) |
(5.1%) |
|
Average |
91.4% |
12.4% |
6.3% |
(0.6%) |
5.7% |
5.6% |
0.9% |
6.5% |
0.7% |
(1.5%) |
(0.8%) |
|
Apartment Average |
91.6% |
11.5% |
5.9% |
0.5% |
6.4% |
5.7% |
0.6% |
6.3% |
0.2% |
(0.1%) |
0.1% |
Source: Cytonn Research
Section IV: Conclusion, Market Outlook, and Investment Opportunity
We incorporated demand, infrastructure, purchasing power, access to credit, and performance, as the key metrics to gauge our sentiment for the sector going forward.
Key: Green – POSITIVE, Grey – NEUTRAL, Red – NEGATIVE
|
Cytonn Report: Residential Demand Outlook |
|||
|
Metric |
FY'2024/25 Experience and Outlook going forward |
2024 Outlook |
2025 Outlook |
|
Demand |
· According to World Bank Kenya has relatively high urbanization and population growth rates averaging 3.8% and 2.0% respectively, compared to the global averages of 1.7% and 0.9%, respectively, as of 2023. This will continue to provide sustained demand for more housing units in the country |
Positive |
Positive |
|
Infrastructure |
· The government aims at completing various infrastructural projects in the country including Riruta – Lenana – Ngong Railway Line, fast-track construction of Phase I of the Nairobi Railway City (NRC) Project, the Meter Gauge Railway (MGR) Link from Mombasa SGR Terminus to Mombasa MGR Station, and the Railway Bridge across Makupa Causeway. The government also aims to acquire a new ferry for Lake Victoria, complete construction of the control tower at Kisumu Airport, and complete rehabilitation of the terminal building and apron at Ukunda Airport |
Neutral |
Positive |
|
Purchasing Power |
· Two direct indicators of purchasing power, inflation, and currency performance, have shown better performance in Q1'2025. The Kenyan Shilling has been appreciating against major currencies such as the US dollar, while inflation has slowed for the better part of Q1'2025. Looking ahead, we anticipate that consumers' purchasing power will improve, although they are still affected by heavy taxation and persistent unemployment. |
Neutral |
Neutral |
|
Access to Credit |
· The government has continued to promote access to affordable credit through the Kenya Mortgage Refinance Company (KMRC) which has been crucial in providing Kenyans with low cost loans increasing home ownership
· However, lenders continue to tighten their lending requirements and demand more collateral from developers as a result of elevated credit risk in the Real Estate sector as evidenced by the 16.7% increase in gross Non-Performing Loans (NPLs) to Kshs 118.6 bn in Q4’2024, from Kshs 101.7 bn recorded during Q4’2023 |
Neutral |
Neutral |
|
Performance |
· Residential sector in 2024/25 recorded slight decline in average total returns coming in at 5.8% from 6.1% recorded in 2023/24. The performance was attributed to a decrease in the price appreciation at 0.4% in FY’2024/25, 0.2%-points lower than the 0.6% appreciation recorded in FY’2023/24, driven by slowed property transactions during the year
· We expect more investments in the lower-middle segment offering an average total return of 5.5%, higher than the detached market average of 5.2%. Apartments in Westlands, Kahawa West and Ngong recorded the highest returns at 10.6%, 12.0% and 9.3% respectively, higher than the market average of 6.4% |
Neutral |
Neutral |
We have identified three neutral outlooks on performance, purchasing power, and access to credit, and two positive outlooks on demand and infrastructure. Therefore, our general market outlook for the residential sector in 2025 is NEUTRAL. This is mainly driven by the increase in population, especially in urban areas, which is fueling the need for housing. Although this demand is being continuously addressed by the government through the implementation of the affordable housing program, there still remains a large deficit. Additionally, activities by players in the residential sector are poised to help address the housing shortage and improve the sector's performance. We expect the government to make major progress with the already established infrastructure projects in the pipeline and to launch other new projects in order to open up more satellite areas. We anticipate that the purchasing power of consumers, backed by the improved Kenya shilling and inflation, will sustain performance in the long term. However, we expect sector performance to be dampened by low penetration of mortgages and regulatory hindrances such as approval of building plans, high construction costs, and tough economic conditions such as high taxation. For detached units, investment opportunities lie in areas such as Lower Kabete, South B/C, and Kitengela, while for apartments, investment opportunities are in Westlands, Kahawa West, and Ngong, driven by the current performance in terms of returns to investors.
Disclaimer: The views expressed in this publication are those of the writers where particulars are not warranted. This publication is meant for general information only and is not a warranty, representation, advice or solicitation of any nature. Readers are advised in all circumstances to seek the advice of a registered investment advisor.

- Talk to us
- Kenya
- P.O Box 20695 - 00200, Nairobi, Kenya
- Cell +254709101200
- Tel +254709101200
- WhatsApp +254741676635
- United States
- +254709101200
- DOWNLOAD OUR APP
-


- Kenya
- 8th Floor, Pinetree Plaza, Kaburu Drive, Ngong Road, Nairobi, Kenya
- USA
- Suite 1150, 1775 Eye Street NW, USA, Washington DC 20006, USA
- Investments
- High Yield
- Private Equity
- Real Estate
- Real Estate
- RiverRun Estates
- Cytonn Towers
- The Ridge
- Taraji Heights
- The Alma