Nairobi Metropolitan Area (NMA) Mixed Use Developments Report 2025, & Cytonn Weekly #47/2025
By Research Team, Nov 23, 2025
Executive Summary
Fixed Income
This week, T-bills were oversubscribed for the seventh consecutive week, with the overall subscription rate coming in at 180.9%, higher than the subscription rate of 127.3% recorded the previous week. Investors’ preference for the shorter 91-day paper increased, with the paper receiving bids worth Kshs 13.4 bn against the offered Kshs 4.0 bn, translating to a subscription rate of 336.6%, significantly higher than the subscription rate of 163.5%, recorded the previous week. The subscription rates for the 182-day paper increased to 42.3% from 36.9% recorded the previous week, while that of the 364-day papers increased to 257.3% from 203.1% recorded the previous week. The government accepted a total of Kshs 43.39 bn worth of bids out of Kshs 43.42 bn bids received, translating to an acceptance rate of 99.9%. The yields on the government papers recorded a mixed performance with the yields on the 364-day paper increasing the most by 2.2 bps to 9.38% from the 9.36% recorded the previous week, while the182-day paper increased by 0.7 bps to 7.80% from the 7.79% recorded the previous week. The yields on the 91-day paper decreased by 0.6 bps 7.78% from the 7.79% recorded the previous week;
During the week, the Central Bank of Kenya released the auction results for the re-opened treasury bonds FXD3/2019/015 and FXD1/2022/025 with tenors to maturities of 8.7 years and 21.9 years respectively and fixed coupon rates of 12.3% and 14.2% respectively. The bonds were oversubscribed, with the overall subscription rate coming in at 289.6%, receiving bids worth Kshs 115.9 bn against the offered Kshs 40.0 bn. The government accepted bids worth Kshs 54.8 bn, translating to an acceptance rate of 47.3%. The weighted average yield for the accepted bids for the FXD3/2019/015 and FXD1/2022/025 came in at 12.6% and 13.7% respectively. Notably, the 13.7% on the FXD1/2022/025 was lower than the 14.1% recorded the last time the bond was reopened in September 2025 while the 12.6% on the FXD3/2019/015 was higher than the 12.3% recorded the last time the bond was reopened in October 2021. With the Inflation rate at 4.6% as of October 2025, the real returns of the FXD3/2019/015 and FXD1/2022/025 are 8.0% and 9.1%. Given the 10.0% withholding tax on the bonds, the tax equivalent yields for shorter term bonds with 15.0% withholding tax are 13.3% and 14.6% for the FXD3/2019/015 and FXD1/2022/025 respectively;
Additionally, during the week, the Central Bank of Kenya released the auction results for the three-year buyback treasury bond issue no. FXD1/2023/003 with a fixed coupon of 14.2% and a tenor to maturity of 0.6 years. The bond was oversubscribed, with the overall subscription rate coming in at 114.3% lower than 112.2% recorded in the previous buyback. The government accepted bids worth Kshs 20.1 bn, translating to an acceptance rate of 58.5% which is lower than the 89.3% recorded in the previous buyback. The weighted average yield for the accepted bids for the FXD1/2023/003 came in at 7.8%. The yields are largely in line with the T-bill rates making the refinancing cost the same. This is the second time in 2025 that the Kenyan government has bought back treasury bonds since the February 2025 buyback of FXD1/2020/005, FXD1/2022/003 and IFB1/2016/009;
Also, we are projecting the y/y inflation rate for November 2025 to increase marginally to the range of 4.6% - 4.8%;
Equities
During the week, the equities market showed mixed performance, with NASI gaining by 0.3% while NSE 10, NSE 25 and NSE 20 declined by 0.9%, 0.7% and 0.7% respectively, taking the YTD performance to gains of 53.4%, 49.9%, 45.4% and 45.1% of NSE 20, NASI, NSE 10 and NSE 25 respectively. The equities market performance was mainly driven by losses recorded by large-cap stocks such as Absa Bank, Cooperative bank and Stanbic of 8.4%, 3.4% and 2.6%, respectively. The performance was, however, supported by gains by large cap stocks such as Safaricom and NCBA of 2.8% and 1.5% respectively;
Also, during the week, the banking sector index declined by 1.7% to close at 200.1 from the 203.6 recorded the previous week. This was attributable to losses recorded by large-cap stocks such as Absa Bank, Cooperative bank and Stanbic of 8.4%, 3.4% and 2.6%, respectively. The performance was, however, supported by gains recorded by stocks such as NCBA of 1.5%;
During the week, KCB released its Q3’2025 financial results, with its Core Earnings per Share increasing by 0.7% to Kshs 19.1 from Kshs 19.0 in Q3’2024. Additionally, Diamond Trust Bank Kenya released its Q3’2025 financial results, with its Earnings Per Share increasing by 12.3% to Kshs 29.9 from Kshs 26.6 in Q3’2024. Absa Bank also released its Q3’2025 financial results, with its Core Earnings Per Share increasing by 14.7% to Kshs 2.7 from Kshs 3.1 in Q3’2024. NCBA bank released its Q3’2025 financial results, with its Core Earnings Per Share increasing by 8.5% to Kshs 9.9 from Kshs 9.2 in Q3’2024. Stanbic Bank released its Q3’2025 financial results, with its Core Earnings Per Share decreasing by 7.7% to Kshs 23.7 from Kshs 25.7 in Q3’2024. I&M Bank also released its Q3’2025 financial results, with its Core Earnings Per Share increasing by 24.2% to Kshs 5.5 from Kshs 6.9 in Q3’2024
Real Estate
During the week, Jambojet revealed its plans to triple its fleet and launch longer routes, including new destinations in West and Southern Africa over the next five years as revenue surpassed Kshs 13.0 bn attributable to increased demand. This expansion will allow Jambojet to increase frequency of flights in Kenya under the De Havilland Dash 8-400 plane as well as acquire other aircrafts to deepen presence in East Africa and enter markets in west Africa, South Africa and North Africa;
During the week, Real Estate Developer, Acorn secured CMA approval to launch a new Build-To-Rent D-REIT in a bid to strengthen its push into Nairobi’s affordable rental market for the young workers. The new Acorn Build-To-Rent D-REIT will focus on rental homes for young urban workers aged between 20-30 Years who work across Nairobi’s major hubs. The Kshs 2.2 bn D-REIT will start with a committed capital of Kshs 1.3 bn from Private Infrastructure Development Group through its InfraCo vehicle, Kshs 258.4 mn from Shelter Afrique Development Bank and Kshs 645.0 bn from Acorn;
On the Unquoted Securities Platform, Acorn D-REIT and I-REIT traded at Kshs 27.4 and Kshs 23.2 per unit, respectively, as per the last updated data on 7th November 2025. The performance represented a 33.4% and 14.5% gain for the D-REIT and I-REIT, respectively, from the Kshs 20.0 inception price. The volumes traded for the D-REIT and I-REIT came in at Kshs 12.8 mn and Kshs 40.6 mn shares, respectively, with a turnover of Kshs 323.5 mn and Kshs 791.5 mn, respectively, since inception in February 2021. Additionally, ILAM Fahari I-REIT traded at Kshs 11.0 per share as of 7th November 2025, representing a45.0% loss from the Kshs 20.0 inception price. The volume traded to date came in at 1.2 mn shares for the I-REIT, with a turnover of Kshs 1.5 mn since inception in November 2015.
Focus of the Week
In November 2024, we released the Nairobi Metropolitan Area Mixed-Use Developments (MUDs) Report 2024 which highlighted that Mixed-Use Developments recorded an average rental yield of 8.6%, 1.5% points higher than the respective single-use themes which recorded an average rental yield of 7.1% in a similar period in 2023. The relatively better performance was mainly attributed to; i) heightened demand for prime locations attracting clients willing to pay premium rents, ii) strategic and prime locations of the developments with the capability to attract prospective clients, and, iii)) the area’s proximity to amenities such as shopping malls enhancing the desirability.
This week we update our report with 2025 market research data in order to determine the progress and performance of MUDs against the market performance of single-use Residential, Commercial Office, and Retail developments. Therefore, this topical will cover the following:
- Overview of Mixed-Use Developments,
- Mixed-Use Developments Performance Summary in 2025, and,
- Mixed-Use Developments Investment Opportunity and Outlook.
Investment Updates:
- Weekly Rates: Cytonn Money Market Fund closed the week at a yield of 12.05% p.a. To invest, dial *809# or download the Cytonn App from Google Play store here or from the Appstore here;
- We continue to offer Wealth Management Training every Monday, from 10:00 am to 12:00 pm. The training aims to grow financial literacy among the general public. To register for any of our Wealth Management Trainings, click here;
- If interested in our Private Wealth Management Training for your employees or investment group, please get in touch with us through wmt@cytonn.com;
- Cytonn Insurance Agency acts as an intermediary for those looking to secure their assets and loved ones’ future through insurance namely; Motor, Medical, Life, Property, WIBA, Credit and Fire and Burglary insurance covers. For assistance, get in touch with us through insuranceagency@cytonn.com;
- Cytonn Asset Managers Limited (CAML) continues to offer pension products to meet the needs of both individual clients who want to save for their retirement during their working years and Institutional clients that want to contribute on behalf of their employees to help them build their retirement pot. To more about our pension schemes, kindly get in touch with us through pensions@cytonn.com;
Money Markets, T-Bills Primary Auction:
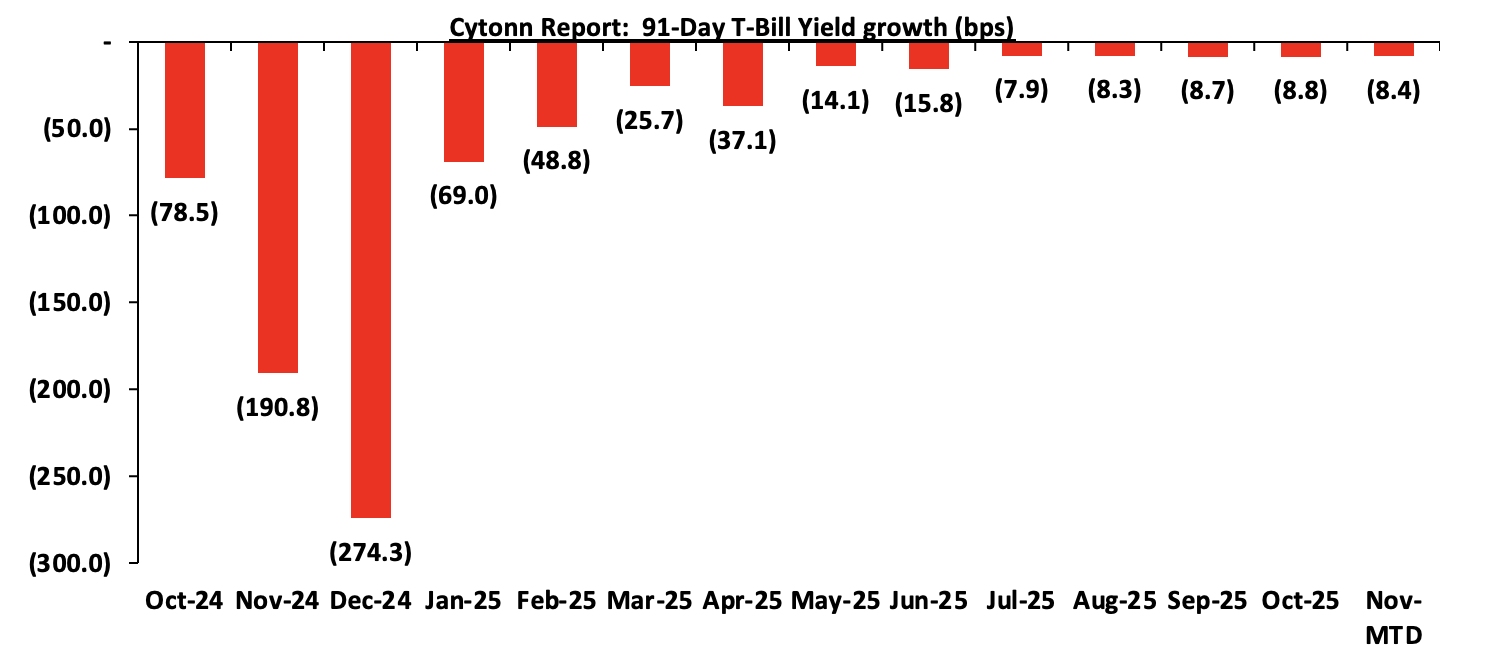
This week, T-bills were oversubscribed for the seventh consecutive week, with the overall subscription rate coming in at 180.9%, higher than the subscription rate of 127.3% recorded the previous week. Investors’ preference for the shorter 91-day paper increased, with the paper receiving bids worth Kshs 13.4 bn against the offered Kshs 4.0 bn, translating to a subscription rate of 336.6%, significantly higher than the subscription rate of 163.5%, recorded the previous week. The subscription rates for the 182-day paper increased to 42.3% from 36.9% recorded the previous week, while that of the 364-day papers increased to 257.3% from 203.1% recorded the previous week. The government accepted a total of Kshs 43.39 bn worth of bids out of Kshs 43.42 bn bids received, translating to an acceptance rate of 99.9%. The yields on the government papers recorded a mixed performance with the yields on the 364-day paper increasing the most by 2.2 bps to 9.38% from the 9.36% recorded the previous week, while the182-day paper increased by 0.7 bps to 7.80% from the 7.79% recorded the previous week. The yields on the 91-day paper decreased by 0.6 bps 7.78% from the 7.79% recorded the previous week
The chart below shows the yield growth rate for the 91-day paper in the year to October 2025 and November month-to-date:
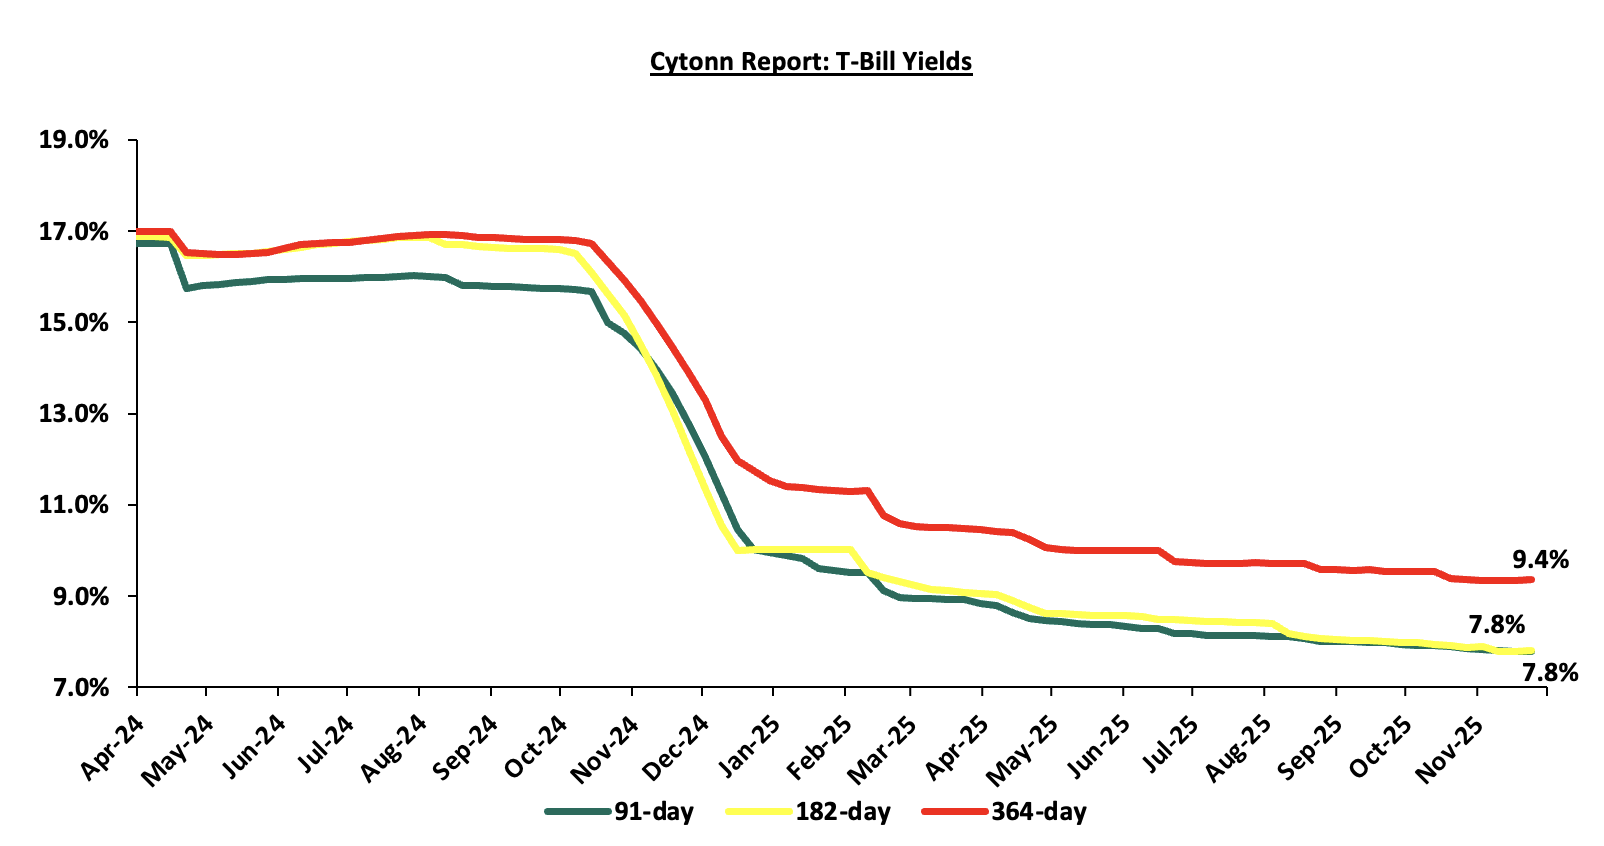
The charts below show the interest rates of the 91-day, 182-day and 364-day papers from January 2024 to November 2025:
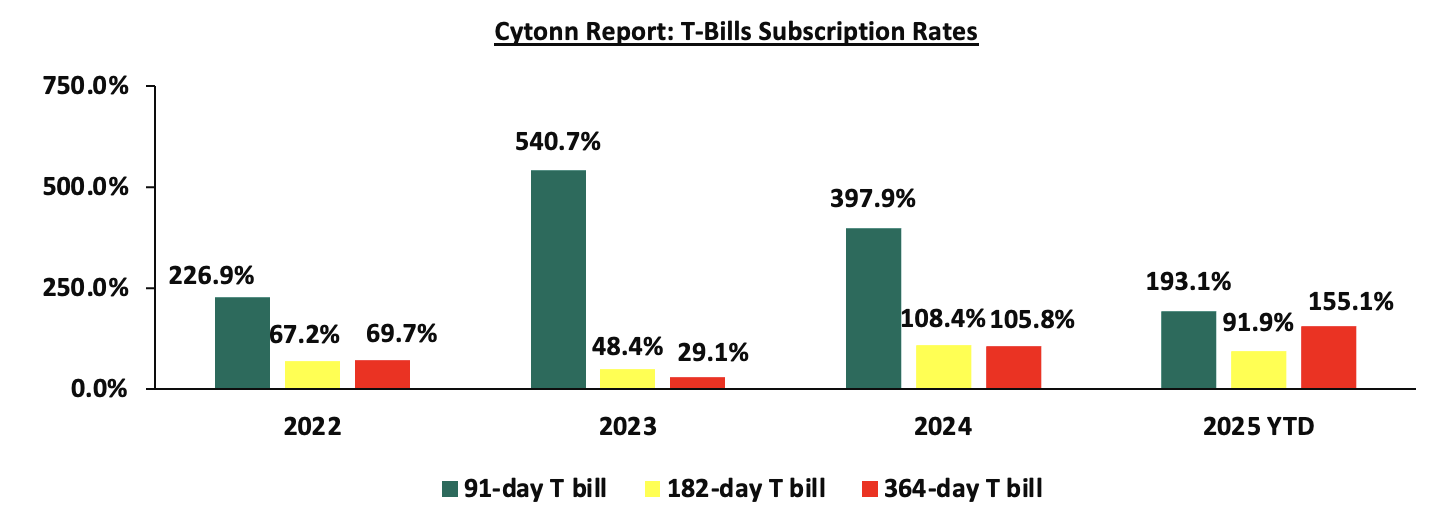
The chart below compares the overall average T-bill subscription rates obtained in 2022,2023, 2024 and 2025 Year-to-date (YTD):
During the week, the Central Bank of Kenya released the auction results for the re-opened treasury bonds FXD3/2019/015 and FXD1/2022/025 with tenors to maturities of 8.7 years and 21.9 years respectively and fixed coupon rates of 12.3% and 14.2% respectively. The bonds were oversubscribed, with the overall subscription rate coming in at 289.6%, receiving bids worth Kshs 115.9 bn against the offered Kshs 40.0 bn. The government accepted bids worth Kshs 54.8 bn, translating to an acceptance rate of 47.3%. The weighted average yield for the accepted bids for the FXD3/2019/015 and FXD1/2022/025 came in at 12.6% and 13.7% respectively. Notably, the 13.7% on the FXD1/2022/025 was lower than the 14.1% recorded the last time the bond was reopened in September 2025 while the 12.6% on the FXD3/2019/015 was higher than the 12.3% recorded the last time the bond was reopened in October 2021. With the Inflation rate at 4.6% as of October 2025, the real returns of the FXD3/2019/015 and FXD1/2022/025 are 8.0% and 9.1%. Given the 10.0% withholding tax on the bonds, the tax equivalent yields for shorter term bonds with 15.0% withholding tax are 13.3% and 14.6% for the FXD3/2019/015 and FXD1/2022/025 respectively;
Additionally, during the week, the Central Bank of Kenya released the auction results for the three-year buyback treasury bond issue no. FXD1/2023/003 with a fixed coupon of 14.2% and a tenor to maturity of 0.6 years. The bond was oversubscribed, with the overall subscription rate coming in at 114.3% lower than 112.2% recorded in the previous buyback. The government accepted bids worth Kshs 20.1 bn, translating to an acceptance rate of 58.5% which is lower than the 89.3% recorded in the previous buyback. The weighted average yield for the accepted bids for the FXD1/2023/003 came in at 7.8%. The yields are largely in line with the T-bill rates making the refinancing cost the same. This is the second time in 2025 that the Kenyan government has bought back treasury bonds since the February 2025 buyback of FXD1/2020/005, FXD1/2022/003 and IFB1/2016/009;
Money Market Performance:
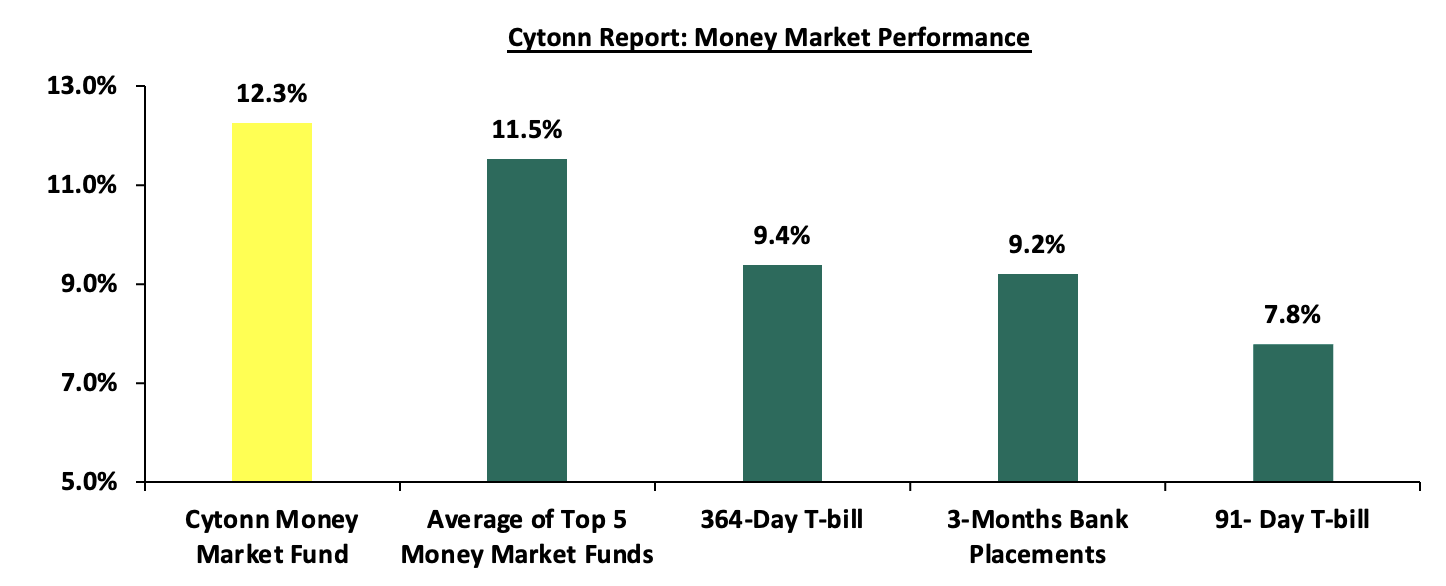
In the money markets, 3-month bank placements ended the week at 9.2% (based on what we have been offered by various banks). The yields on the 91-day paper decreased by 0.6 bps 7.78% from the 7.79% recorded the previous week with yields on the 364-day paper increasing by 2.2 bps to 9.38% from the 9.36% recorded the previous week. The yield on the Cytonn Money Market Fund increased by 31.0 bps to 12.3% from 11.9% recorded in the previous week, while the average yields on the Top 5 Money Market Funds decreased by 3.6 bps to 11.5% from the 11.6% recorded the previous week.
The table below shows the Money Market Fund Yields for Kenyan Fund Managers as published on 21st November 2025:
|
Money Market Fund Yield for Fund Managers as published on 21st November 2025 |
||
|
Rank |
Fund Manager |
Effective Annual Rate |
|
1 |
Cytonn Money Market Fund (Dial *809# or download Cytonn App) |
12.3% |
|
2 |
Etica Money Market Fund |
11.7% |
|
3 |
Lofty-Corban Money Market Fund |
11.3% |
|
4 |
Nabo Africa Money Market Fund |
11.2% |
|
5 |
Enwealth Money Market Fund |
11.1% |
|
6 |
Ndovu Money Market Fund |
11.1% |
|
7 |
Kuza Money Market fund |
11.0% |
|
8 |
Gulfcap Money Market Fund |
10.9% |
|
9 |
Orient Kasha Money Market Fund |
10.8% |
|
10 |
Old Mutual Money Market Fund |
10.7% |
|
11 |
Arvocap Money Market Fund |
10.6% |
|
12 |
Jubilee Money Market Fund |
10.3% |
|
13 |
British-American Money Market Fund |
10.3% |
|
14 |
Madison Money Market Fund |
10.1% |
|
15 |
GenAfrica Money Market Fund |
9.9% |
|
16 |
Faulu Money Market Fund |
9.9% |
|
17 |
Dry Associates Money Market Fund |
9.7% |
|
18 |
Sanlam Money Market Fund |
9.5% |
|
19 |
Apollo Money Market Fund |
9.5% |
|
20 |
KCB Money Market Fund |
9.4% |
|
21 |
ICEA Lion Money Market Fund |
8.7% |
|
22 |
CIC Money Market Fund |
8.5% |
|
23 |
CPF Money Market Fund |
8.3% |
|
24 |
Co-op Money Market Fund |
8.3% |
|
25 |
Mali Money Market Fund |
8.2% |
|
26 |
Mayfair Money Market Fund |
8.2% |
|
27 |
Genghis Money Market Fund |
8.1% |
|
28 |
Absa Shilling Money Market Fund |
7.9% |
|
29 |
AA Kenya Shillings Fund |
6.6% |
|
30 |
Ziidi Money Market Fund |
6.5% |
|
31 |
Stanbic Money Market Fund |
6.4% |
|
32 |
Equity Money Market Fund |
5.0% |
Source: Business Daily
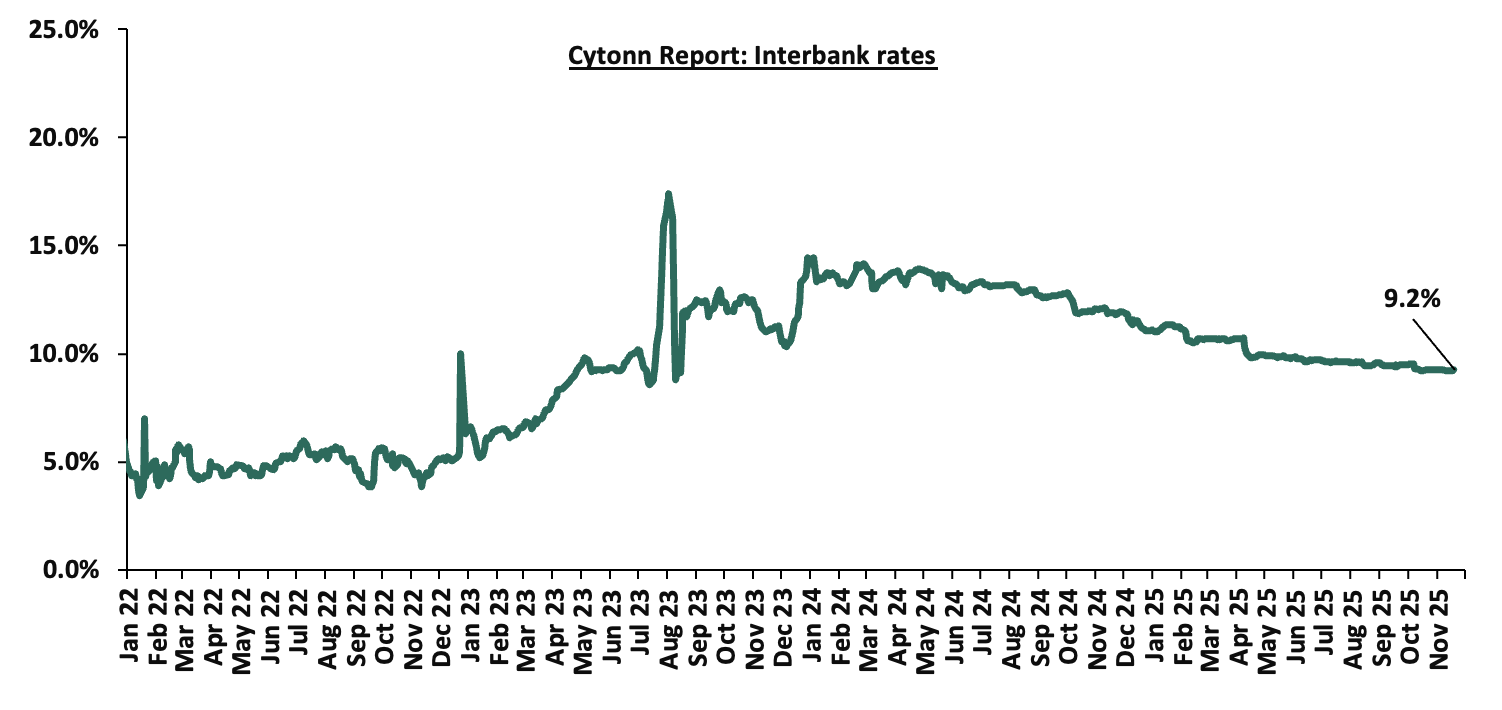
Liquidity:
During the week, liquidity in the money markets tightened with the average interbank rate increasing by 0.5 bps to remain unchanged at 9.2% recorded the previous week, partly attributable to tax remittances that offset government payments. The average interbank volumes traded decreased by 28.2% to Kshs 10.0 bn from Kshs 13.9 bn recorded the previous week. The chart below shows the interbank rates in the market over the years:
Kenya Eurobonds:
During the week, the yields on the Eurobonds were on an upward trajectory with the yield on the 13-year Eurobond issued in 2021 increasing the most by 12.8 bps to 8.6% from 8.5% recorded the previous week. The table below shows the summary performance of the Kenyan Eurobonds as of 20th November 2025;
|
Cytonn Report: Kenya Eurobond Performance |
|||||||
|
|
2018 |
2019 |
2021 |
2024 |
2025 |
||
|
Tenor |
10-year issue |
30-year issue |
7-year issue |
12-year issue |
13-year issue |
7-year issue |
11-year issue |
|
Amount Issued (USD) |
1.0 bn |
1.0 bn |
0.9 bn |
1.2 bn |
1.0 bn |
1.5 bn |
1.5 bn |
|
Years to Maturity |
2.5 |
22.5 |
1.7 |
6.7 |
8.8 |
5.5 |
10.5 |
|
Yields at Issue |
7.3% |
8.3% |
7.0% |
7.9% |
6.2% |
10.4% |
9.9% |
|
2-Jan-25 |
9.1% |
10.3% |
8.5% |
10.1% |
10.1% |
10.1% |
|
|
3-Nov-25 |
6.0% |
9.2% |
- |
8.1% |
8.4% |
7.8% |
|
|
13-Nov-25 |
6.1% |
9.2% |
- |
8.1% |
8.5% |
7.9% |
|
|
14-Nov-25 |
6.1% |
9.2% |
- |
8.2% |
8.6% |
7.9% |
|
|
17-Nov-25 |
6.1% |
9.2% |
- |
8.1% |
8.5% |
7.9% |
|
|
18-Nov-25 |
6.1% |
9.2% |
- |
8.2% |
8.6% |
7.9% |
|
|
19-Nov-25 |
6.2% |
9.2% |
- |
8.2% |
8.7% |
8.0% |
10.0% |
|
20-Nov-25 |
6.1% |
9.2% |
- |
8.2% |
8.6% |
7.9% |
|
|
Weekly Change |
0.1% |
0.0% |
- |
0.1% |
0.1% |
0.0% |
- |
|
MTD Change |
0.1% |
0.0% |
- |
0.1% |
0.2% |
0.1% |
0.0% |
|
YTD Change |
(3.0%) |
(1.1%) |
- |
(1.9%) |
(1.5%) |
(2.2%) |
0.0% |
Source: Central Bank of Kenya (CBK) and National Treasury
Kenya Shilling:
During the week, the Kenya Shilling depreciated against the US Dollar by 45.1 bps, to close the week at Kshs 129.9, from Kshs 129.3 recorded the previous week. On a year-to-date basis, the shilling has depreciated by 0.4% bps against the dollar, lower than the 17.6% appreciation recorded in 2024.
We expect the shilling to be supported by:
- Diaspora remittances standing at a cumulative USD 5,081.6 mn in the twelve months to October 2025, 5.8% higher than the USD 4,804.1 mn recorded over the same period in 2024. This has continued to cushion the shilling against further depreciation. In the October 2025 diaspora remittances figures, North America remained the largest source of remittances to Kenya accounting for 59.9% in the period,
- The tourism inflow receipts which are projected to reach KSh 560.0 bn in 2025 up from KSh 452.2 bn in 2024 a 23.9% increase, and owing to tourist arrivals that improved by 9.9% to 2,424,382 in the 12 months to June 2025 from 2,206,469 in the 12 months to June 2024, and,
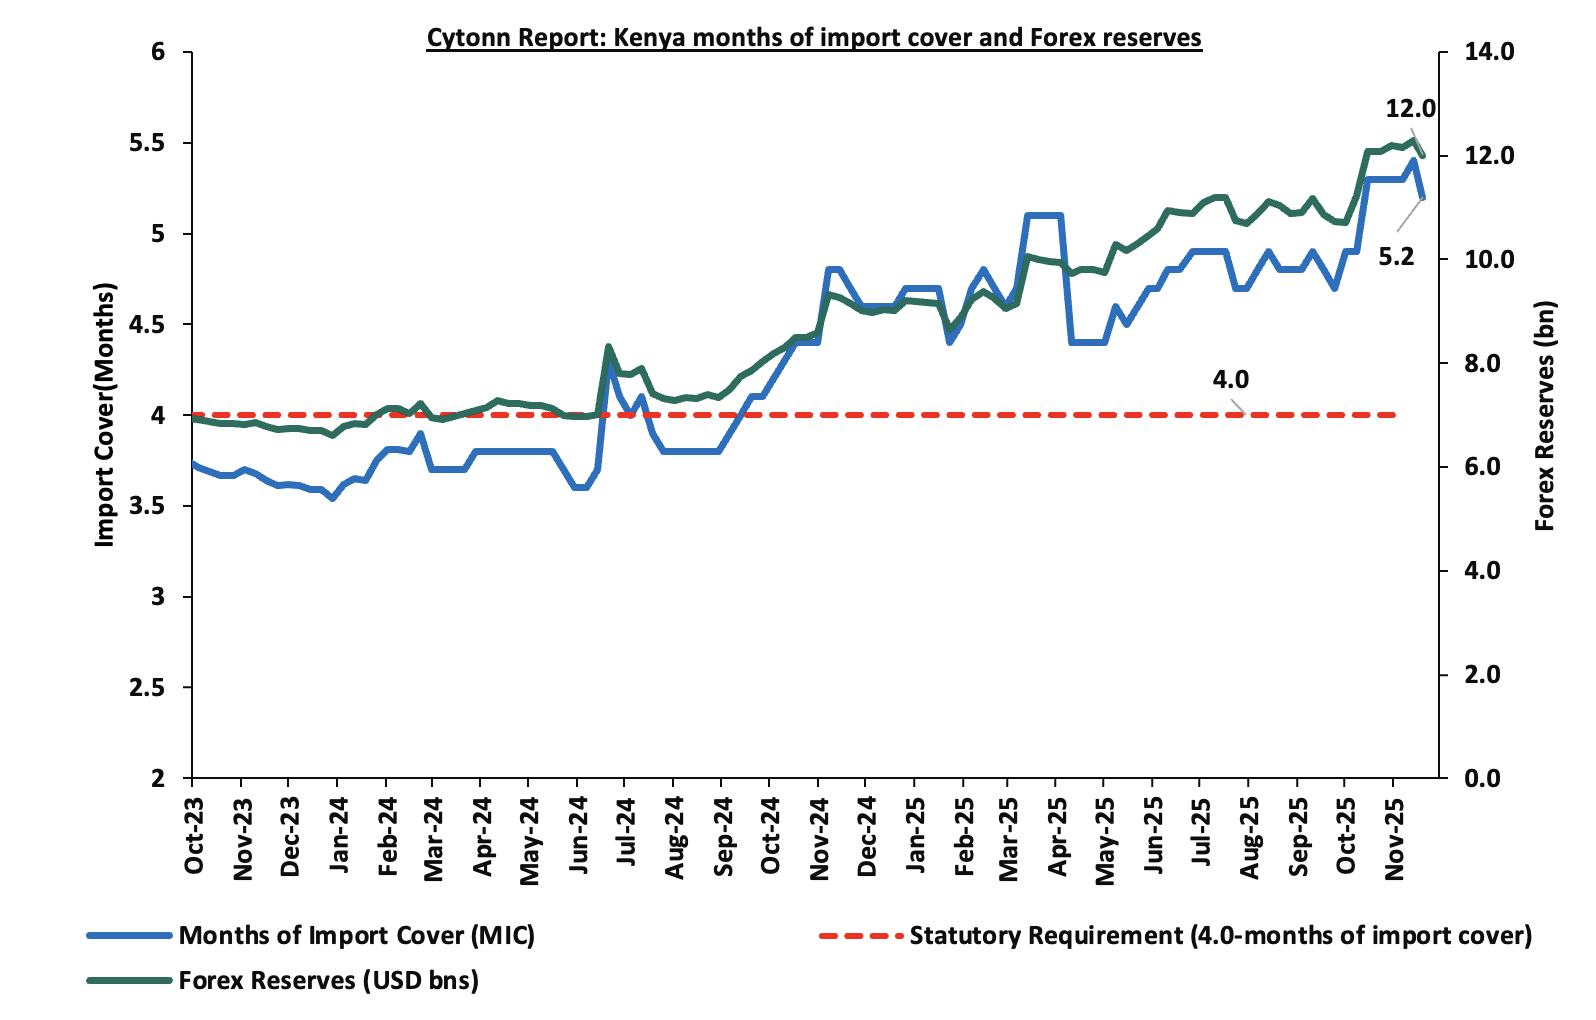
- Improved forex reserves currently at USD 12.0 bn (equivalent to 5.2-months of import cover), which is above the statutory requirement of maintaining at least 4.0-months of import cover and above the EAC region’s convergence criteria of 4.5-months of import cover.
The shilling is however expected to remain under pressure in 2025 as a result of:
- An ever-present current account deficit which came at 2.1% of GDP in the twelve months to August 2025, and,
- The need for government debt servicing, continues to put pressure on forex reserves given that 59.7% of Kenya’s external debt is US Dollar-denominated as of June 2025.
Kenya’s forex reserves decreased by 2.3% during the week to USD 12.0 bn from the USD 12.3 bn recorded the previous week, equivalent to 5.2 months of import cover, but remained above the statutory requirement of maintaining at least 4.0-months of import cover.
The chart below summarizes the evolution of Kenya's months of import cover over the years:
Weekly Highlights
- November 2025 Inflation Projection Highlight
We are projecting the y/y inflation rate for November 2025 to increase marginally to the range of 4.6% – 4.8%, mainly on the back of:
- Increased electricity prices – In November 2025, electricity prices increased marginally on the back of an increase in the forex adjustment charges. EPRA increased the fuel energy cost, and forex adjustment charge by Kshs 3.8, Kshs and Kshs 1.0 respectively, bringing the total increase to Kshs 4.8 per unit. With electricity being one the major inputs of inflation, this increase is expected to increase production costs for businesses as well as increase electricity costs for households and thus decreasing inflation.
- Depreciation of the Kenya Shilling against the US Dollar – The Kenya Shilling has recorded a 48.8 bps month-to-date depreciation as of 21st November to Kshs 129.9 from Kshs 129.2 recorded at the beginning of the month. This depreciation in the exchange rate could induce inflationary pressures, making imported goods more expensive.
- The decrease in the Central Bank Rate (CBR) by 25.0 bps to 9.25% from 9.50% – In 2025, the CBK Monetary Policy Committee has continued adopting an accommodative monetary policy stance, reducing the Central Bank Rate (CBR) by a cumulative 175.0 bps from 11.25% at the beginning of the year. Notably, the MPC cut the Central Bank Rate (CBR) by 25.0 bps in October 2025, lowering it to 9.25% from 9.50% in October 2025. This reduction in the CBR is likely to increase the money supply through lower borrowing costs, which may cause a slight rise in inflation rates as the effects of the CBR continue to gradually take hold in the broader economy.
We, however, expect that inflation rate will, however, be supported by:
- Stable Fuel Prices in November 2025– The Energy and Petroleum Regulatory Authority (EPRA) released their monthly statement on the maximum retail fuel prices in Kenya, effective from 15th November 2025 to 14th December 2025. Notably, the maximum allowed prices for Super Petrol, Diesel and Kerosene remained unchanged from the previous pricing cycle in October. Consequently, Super Petrol, Diesel and Kerosene will continue to retail at Kshs 184.5, Kshs 171.5 and Kshs 154.8 per litre respectively. This unchanged fuel prices may alleviate upward pressure on inflation, given fuel's significant role in transportation and production costs across the economy.
Going forward, we expect inflationary pressures to remain anchored in the short term, remaining within the CBK’s target range of 2.5%-7.5%. However, risks remain, particularly from the potential for increased demand-driven inflation due to accommodative monetary policy. The decision to lower the CBR to 9.25% during the latest MPC meeting will likely increase money supply, in turn increasing inflation, especially with further cuts expected in the coming meetings. The CBK’s ability to balance growth and inflation through close monitoring of both inflation and exchange rate stability will be key to maintaining inflation within the target range.
Rates in the Fixed Income market have been on a downward trend due to high liquidity in the money market which allowed the government to front load most of its borrowing. The government is 106.7% ahead of its prorated net domestic borrowing target of Kshs 254.6 bn, having a net borrowing position of Kshs 526.2 bn (inclusive of T-bills). However, we expect a stabilization of the yield curve in the short and medium term, with the government looking to increase its external borrowing to maintain the fiscal surplus, hence alleviating pressure in the domestic market. As such, we expect the yield curve to stabilize in the short to medium-term and hence investors are expected to shift towards the long-term papers to lock in the high returns
Market Performance:
During the week, the equities market showed mixed performance, with NASI gaining by 0.3% while NSE 10, NSE 25 and NSE 20 declined by 0.9%, 0.7% and 0.7% respectively, taking the YTD performance to gains of 53.4%, 49.9%, 45.4% and 45.1% of NSE 20, NASI, NSE 10 and NSE 25 respectively. The equities market performance was mainly driven by losses recorded by large-cap stocks such as Absa Bank, Cooperative bank and Stanbic of 8.4%, 3.4% and 2.6%, respectively. The performance was, however, supported by gains by large cap stocks such as Safaricom and NCBA of 2.8% and 1.5% respectively.
During the week, the banking sector index declined by 1.7% to close at 200.1 from the 203.6 recorded the previous week. This was attributable to losses recorded by large-cap stocks such as Absa Bank, Cooperative bank and Stanbic of 8.4%, 3.4% and 2.6%, respectively. The performance was, however, supported by gains recorded by stocks such as NCBA of 1.5%.
During the week, equities turnover increased by 6.0% to USD 29.4 mn from USD 27.8 mn recorded the previous week, taking the YTD turnover to USD 957.2 mn. Foreign investors remained net sellers for the seventh consecutive week, with a net selling position of USD 6.4 mn, from a net selling position of USD 3.0 mn recorded the previous week, taking the YTD net selling position to USD 88.2 mn.
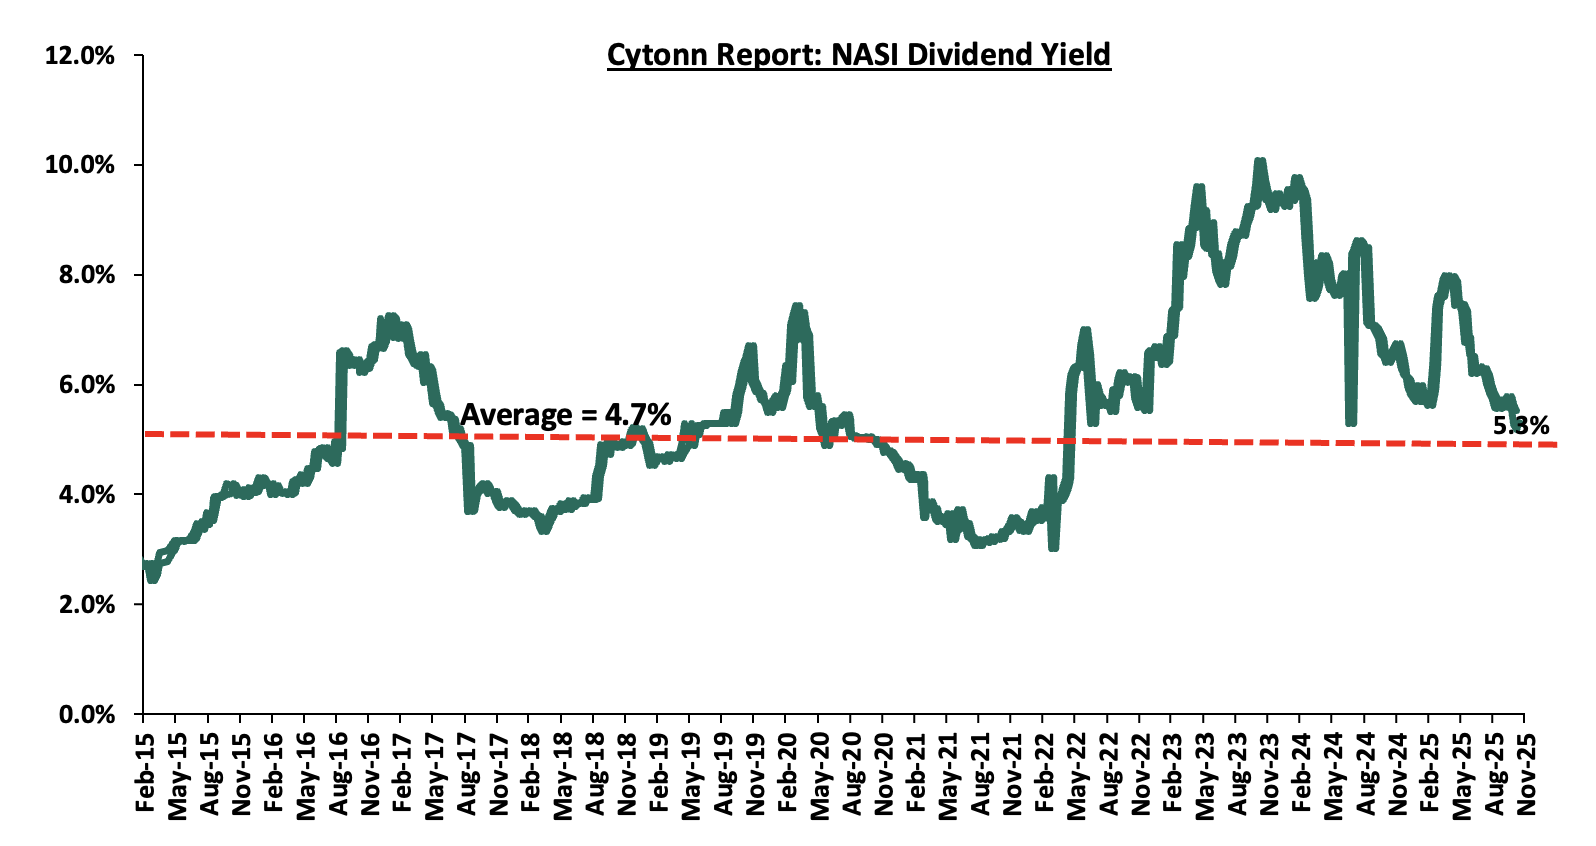
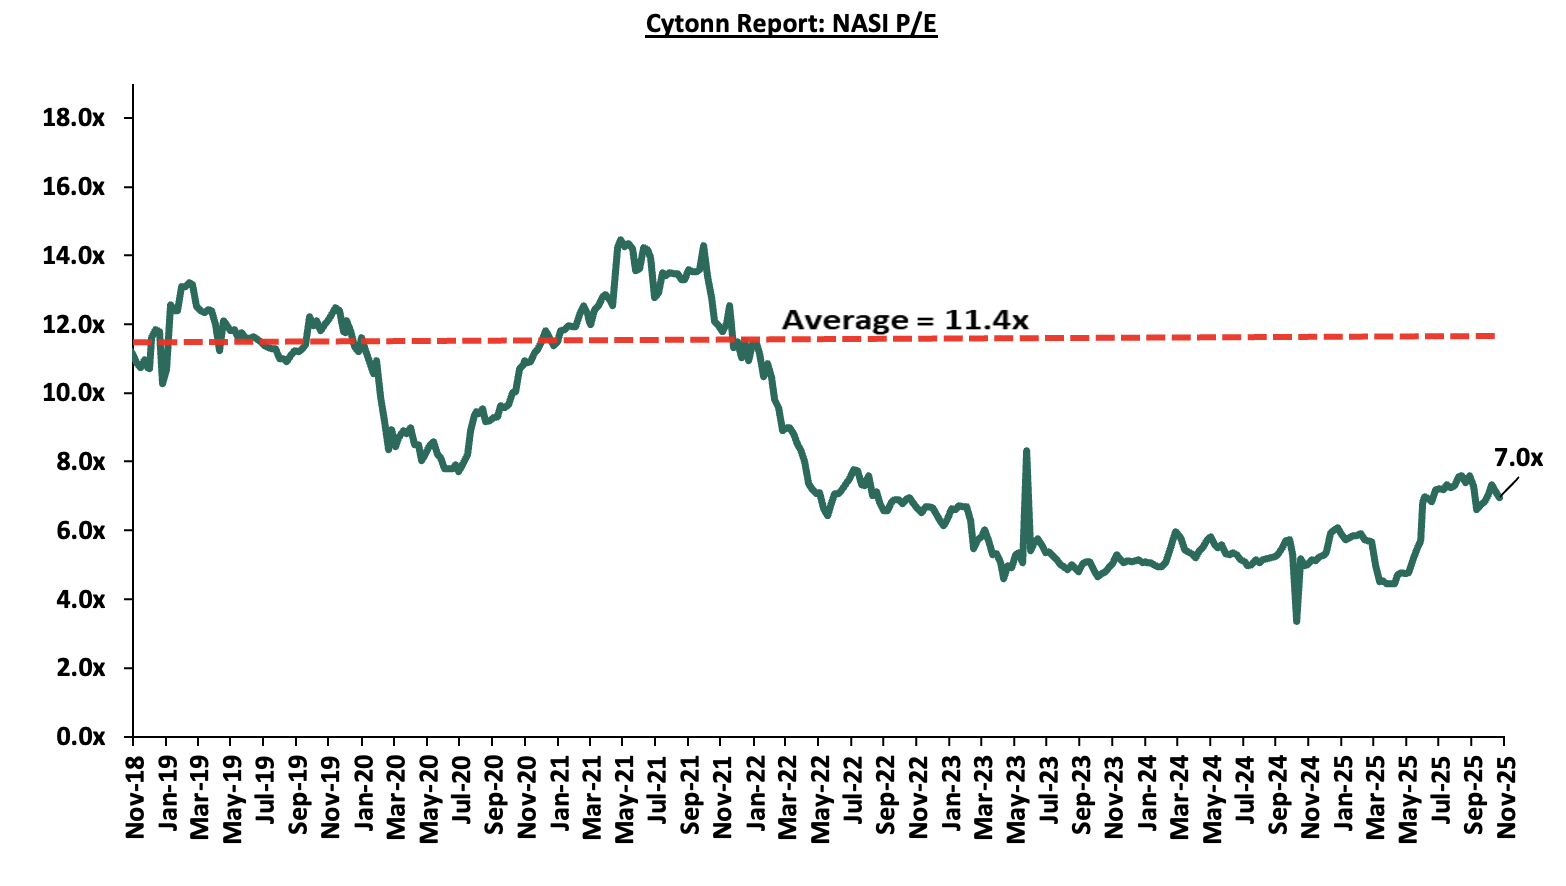
The market is currently trading at a price to earnings ratio (P/E) of 7.0x, 38.8% below the historical average of 11.4x, and a dividend yield of 5.3%, 0.6% points above the historical average of 4.7%. Key to note, NASI’s PEG ratio currently stands at 0.9x, an indication that the market is slightly undervalued relative to its future growth. A PEG ratio greater than 1.0x indicates the market may be overvalued while a PEG ratio less than 1.0x indicates that the market is undervalued.
The charts below indicate the historical P/E and dividend yields of the market;
Universe of Coverage:
|
Cytonn Report: Equities Universe of Coverage |
|||||||||||
|
Company |
Price as at 14/11/2025 |
Price as at 21/11/2025 |
w/w change |
YTD Change |
Year Open 2025 |
Target Price* |
Dividend Yield |
Upside/ Downside** |
P/TBv Multiple |
Recommendation |
|
|
Standard Chartered Bank |
302.5 |
298.8 |
(1.2%) |
4.7% |
285.3 |
314.1 |
15.1% |
20.2% |
1.7x |
Buy |
|
|
Diamond Trust Bank |
116.0 |
115.0 |
(0.9%) |
72.3% |
66.8 |
128.3 |
6.1% |
17.6% |
0.4x |
Accumulate |
|
|
Stanbic Holdings |
194.5 |
189.5 |
(2.6%) |
35.6% |
139.8 |
194.8 |
10.9% |
13.7% |
1.2x |
Accumulate |
|
|
ABSA Bank |
25.0 |
22.9 |
(8.4%) |
21.5% |
18.9 |
24.1 |
7.6% |
12.8% |
1.5x |
Accumulate |
|
|
I&M Group |
45.8 |
45.9 |
0.3% |
27.5% |
36.0 |
48.2 |
6.5% |
11.5% |
0.8x |
Accumulate |
|
|
Britam |
8.8 |
8.7 |
(0.5%) |
49.8% |
5.8 |
9.5 |
0.0% |
9.2% |
0.8x |
Hold |
|
|
KCB Group |
65.0 |
64.3 |
(1.2%) |
51.5% |
42.4 |
63.6 |
4.7% |
3.7% |
0.8x |
Lighten |
|
|
Equity Group |
64.0 |
63.8 |
(0.4%) |
32.8% |
48.0 |
61.2 |
6.7% |
2.6% |
1.1x |
Lighten |
|
|
Jubilee Holdings |
328.0 |
325.0 |
(0.9%) |
86.0% |
174.8 |
312.9 |
4.2% |
0.4% |
0.5x |
Lighten |
|
|
NCBA |
83.0 |
84.3 |
1.5% |
65.2% |
51.0 |
79.0 |
6.5% |
0.3% |
1.4x |
Lighten |
|
|
Co-op Bank |
24.8 |
24.0 |
(3.4%) |
37.2% |
17.5 |
21.1 |
6.3% |
(5.5%) |
0.8x |
Sell |
|
|
CIC Group |
4.5 |
4.6 |
1.3% |
114.5% |
2.1 |
4.0 |
2.8% |
(9.4%) |
1.2x |
Sell |
|
|
*Target Price as per Cytonn Analyst estimates **Upside/ (Downside) is adjusted for Dividend Yield ***Dividend Yield is calculated using FY’2024 Dividends |
|
||||||||||
Weekly Highlights
- KCB Group Q3’2025 Performance
During the week, KCB Group released its Q3’2025 performance. Below is a summary.
|
Balance Sheet Items |
Q3'2024 |
Q3'2025 |
y/y change |
|
Government Securities |
314.7 |
333.8 |
6.1% |
|
Net Loans and Advances |
1,053.2 |
1,139.9 |
8.2% |
|
Total Assets |
1,993.1 |
2,044.5 |
2.6% |
|
Customer Deposits |
1,538.4 |
1,525.8 |
(0.8%) |
|
Deposits per branch |
2.7 |
3.4 |
24.9% |
|
Total Liabilities |
1,736.4 |
1,727.1 |
(0.5%) |
|
Shareholders’ Funds |
249.0 |
308.5 |
23.9% |
|
Balance Sheet Ratios |
Q3'2024 |
Q3'2025 |
% y/y change |
|
Loan to Deposit Ratio |
68.5% |
74.7% |
6.2% |
|
Government Securities to Deposit Ratio |
20.5% |
21.9% |
1.4% |
|
Return on average equity |
22.4% |
22.7% |
0.3% |
|
Return on average assets |
2.6% |
3.1% |
0.6% |
|
Income Statement (Kshs Bn) |
Q3'2024 |
Q3'2025 |
y/y change |
|
Net Interest Income |
92.8 |
104.3 |
12.4% |
|
Net non-Interest Income |
50.1 |
45.1 |
(10.1%) |
|
Total Operating income |
142.9 |
149.4 |
4.5% |
|
Loan Loss provision |
(17.8) |
(18.3) |
2.7% |
|
Total Operating expenses |
(85.5) |
(87.3) |
2.1% |
|
Profit before tax |
57.43 |
62.08 |
8.1% |
|
Profit after tax |
45.76 |
47.32 |
3.4% |
|
Core EPS |
19.0 |
19.1 |
0.7% |
|
Capital Adequacy Ratios |
Q3'2024 |
Q3'2025 |
% points change |
|
Core Capital/Total Liabilities |
14.5% |
18.5% |
4.0% |
|
Minimum Statutory ratio |
8.0% |
8.0% |
0.0% |
|
Excess |
6.5% |
10.5% |
4.0% |
|
Core Capital/Total Risk Weighted Assets |
16.5% |
17.0% |
0.5% |
|
Minimum Statutory ratio |
10.5% |
10.5% |
0.0% |
|
Excess |
6.0% |
6.5% |
0.5% |
|
Total Capital/Total Risk Weighted Assets |
19.3% |
19.6% |
0.3% |
|
Minimum Statutory ratio |
14.5% |
14.5% |
0.0% |
|
Excess |
4.8% |
5.1% |
0.3% |
|
Liquidity Ratio |
47.2% |
46.7% |
(0.5%) |
|
Minimum Statutory ratio |
20.0% |
20.0% |
0.0% |
|
Excess |
27.2% |
26.7% |
(0.5%) |
Key Take-Outs:
- Increased earnings - Core earnings per share (EPS) grew by 0.7% to Kshs 19.1, from Kshs 19.0 in Q3’2024, driven by the 4.5% increase in total operating income to Kshs 149.4 bn, from Kshs 142.9 bn in Q3’2024, which outpaced the 2.1% increase in total operating expenses to Kshs 87.3 bn from Kshs 85.5 bn in Q3’2024,
- Improved asset quality –The bank’s Asset Quality improved, with Gross NPL ratio decreasing to 17.2% in Q3’2025, from 18.1% in Q3’2024, attributable to an 8.4% increase in gross loans to Kshs 1,290.7 bn, from Kshs 1,190.5 bn recorded in Q3 ‘2024 which outpaced the 3.1% increase in Gross non-performing loans to Kshs 222.1 bn, from Kshs 215.3 bn in Q3’2024,
- Expanded balanced sheet - The balance sheet recorded an expansion as total assets increased by 2.6% to Kshs 2,044.5 bn, from Kshs 1,993.1 bn in Q3’2024, mainly driven by a 6.1% increase in investment in government securities to Kshs 333.8 bn, from 314.7 bn in Q3’2024
For a more detailed analysis, please see the KCB Group’s Q3’2025 Earnings Note
- I&M Group’s Q3’2025
During the week, I&M released its Q3’2025 results. Below is a summary;
|
Balance Sheet Items |
Q3’2024 |
Q3’2025 |
y/y change |
|
Government Securities |
96.2 |
158.9 |
65.2% |
|
Net Loans and Advances |
281.3 |
301.9 |
7.3% |
|
Total Assets |
567.7 |
640.4 |
12.8% |
|
Customer Deposits |
413.8 |
455.8 |
10.2% |
|
Deposits/Branch |
4.3 |
4.1 |
(2.9%) |
|
Total Liabilities |
473.6 |
519.2 |
9.6% |
|
Shareholders’ Funds |
87.6 |
113.8 |
29.9% |
|
Balance Sheet Ratios |
Q3’2024 |
Q3’2025 |
% points change |
|
Loan to Deposit Ratio |
68.0% |
66.2% |
(1.8%) |
|
Government Securities to Deposit Ratio |
23.2% |
34.9% |
11.6% |
|
Return on average equity |
16.8% |
19.2% |
2.4% |
|
Return on average assets |
2.7% |
3.2% |
0.5% |
|
Income Statement (Kshs Bn) |
Q3’2024 |
Q3’2025 |
y/y change |
|
Net Interest Income |
26.3 |
31.8 |
21.1% |
|
Net non-Interest Income |
9.5 |
11.2 |
17.9% |
|
Total Operating income |
35.8 |
43.0 |
20.2% |
|
Loan Loss provision |
(5.5) |
(6.7) |
21.9% |
|
Total Operating expenses |
(22.4) |
(25.8) |
15.6% |
|
Profit before tax |
14.1 |
17.8 |
25.8% |
|
Profit after tax |
9.9 |
12.7 |
27.4% |
|
Core EPS |
5.5 |
6.9 |
24.2% |
|
Dividend Payout ratio |
21.6% |
19.6% |
(2.0%) |
|
Annualized Dividend Yield |
8.9% |
7.0% |
(1.9%) |
*Annualized dividend yield calculated using trailing DPS
|
Income Statement Ratios |
Q3’2024 |
Q3’2025 |
% points change |
|
Yield from interest-earning assets |
14.2% |
13.1% |
(1.0%) |
|
Cost of funding |
6.6% |
5.3% |
(1.3%) |
|
Net Interest Margin |
7.8% |
8.3% |
0.5% |
|
Net Interest Income as % of operating income |
73.5% |
74.0% |
0.5% |
|
Non-Funded Income as a % of operating income |
26.5% |
26.0% |
(0.5%) |
|
Cost to Income Ratio |
62.5% |
60.1% |
(2.4%) |
|
Cost to Income Ratio without LLP |
47.1% |
44.5% |
(2.6%) |
|
Cost to Assets |
3.0% |
3.0% |
0.0% |
|
Capital Adequacy Ratios |
Q3’2024 |
Q3’2025 |
% points change |
|
Core Capital/Total Liabilities |
17.4% |
20.8% |
3.5% |
|
Minimum Statutory ratio |
8.0% |
8.0% |
0.0% |
|
Excess |
9.4% |
12.8% |
3.5% |
|
Core Capital/Total Risk Weighted Assets |
14.6% |
17.1% |
2.5% |
|
Minimum Statutory ratio |
10.5% |
10.5% |
0.0% |
|
Excess |
4.1% |
6.6% |
2.5% |
|
Total Capital/Total Risk Weighted Assets |
18.0% |
19.6% |
1.6% |
|
Minimum Statutory ratio |
14.5% |
14.5% |
0.0% |
|
Excess |
3.5% |
5.1% |
1.6% |
|
Liquidity Ratio |
51.5% |
57.8% |
6.2% |
|
Minimum Statutory ratio |
20.0% |
20.0% |
0.0% |
|
Excess |
17.4% |
20.8% |
3.5% |
Key Take-Outs:
- Increased earnings - Core earnings per share grew by 24.2% to Kshs 6.9, from Kshs 5.5 in Q3’2024, driven by the 20.2% increase in total operating income to Kshs 43.0 bn, from Kshs 35.8 bn in Q3’2024, which outpaced the 15.6% increase in total operating expenses to Kshs 25.8 bn, from Kshs 22.4 bn in Q3’2024,
- Improved asset quality –The bank’s Asset Quality improved, with Gross NPL decreasing to 10.2% in Q3’2025, from 11.8% in Q3’2024, attributable to a 7.0% decrease in Gross non-performing loans to Kshs 33.2 bn, from Kshs 35.7 bn in Q3’2024, compared to the 7.2% increase in gross loans to Kshs 325.0 bn, from Kshs 303.2 bn recorded in Q3’2024,
- Expanded Balanced sheet - The balance sheet recorded an expansion as total assets increased by 12.8% to Kshs 640.4 bn, from Kshs 567.7 bn in Q3’2024, mainly driven by a 65.2% increase in governments securities holdings to Kshs 158.9 bn, from 96.2 bn in Q3’2024, coupled with a 7.3% increase in net loans and advances to Kshs 301.9 bn, from Kshs 281.3 bn in Q3’2024,
- Increased lending- Customer net loans and advances increased 7.3% Kshs 301.9 bn, from Kshs 281.3 bn in Q3’2024, and,
- Declaration of Dividends - The Board of Directors recommended an interim dividend of Kshs 1.5 for Q3’2025, translating to an annualized dividend yield and dividend payout ratio of 7.0% and 19.6% respectively.
For a more detailed analysis, please see the I&M Group’s Q3’2025 Earnings Note
- DTB-K Q3’2025 Performance
During the week, DTBK released its Q3’2025 results. Below is a summary of the performance:
>
|
Balance Sheet Items |
Q3'2024 |
Q3'2025 |
y/y change |
|
Government Securities |
129.6 |
159.3 |
22.9% |
|
Net Loans and Advances |
275.0 |
296.4 |
7.8% |
|
Total Assets |
590.6 |
641.8 |
8.7% |
|
Customer Deposits |
441.9 |
510.3 |
15.5% |
|
Deposits/ Branch |
2.9 |
3.2 |
11.1% |
|
Total Liabilities |
506.6 |
530.5 |
4.7% |
|
Shareholders’ Funds |
74.6 |
99.4 |
33.2% |
|
Balance Sheet Ratios |
Q3'2024 |
Q3'2025 |
% Points change |
|
Loan to Deposit Ratio |
62.2% |
58.1% |
(4.2%) |
|
Government Securities to Deposit ratio |
29.3% |
31.2% |
1.9% |
|
Return on average equity |
11.8% |
11.2% |
(0.6%) |
|
Return on average assets |
1.5% |
1.6% |
0.1% |
|
Income Statement |
Q3'2024 |
Q3'2025 |
y/y change |
|
Net Interest Income |
21.3 |
25.1 |
17.9% |
|
Net non-Interest Income |
9.7 |
9.1 |
(5.8%) |
|
Total Operating income |
31.0 |
34.3 |
10.5% |
|
Loan Loss provision |
5.3 |
5.7 |
7.6% |
|
Other Operating expenses |
8.9 |
9.7 |
8.9% |
|
Total Operating expenses |
21.1 |
23.1 |
9.5% |
|
Profit before tax |
9.8 |
11.2 |
14.4% |
|
Profit after tax |
7.4 |
8.4 |
12.3% |
|
Core EPS |
26.6 |
29.9 |
12.3% |
|
Capital Adequacy Ratios |
Q3'2024 |
Q3'2025 |
% Points Change |
|
Core Capital/Total Liabilities |
17.5% |
15.3% |
(2.2%) |
|
Minimum Statutory ratio |
8.0% |
8.0% |
|
|
Excess |
9.5% |
7.3% |
(2.2%) |
|
Core Capital/Total Risk Weighted Assets |
16.3% |
14.8% |
(1.5%) |
|
Minimum Statutory ratio |
10.5% |
10.5% |
|
|
Excess |
5.8% |
4.3% |
(1.5%) |
|
Total Capital/Total Risk Weighted Assets |
18.0% |
16.2% |
(1.8%) |
|
Minimum Statutory ratio |
14.5% |
14.5% |
|
|
Excess |
3.5% |
1.7% |
(1.8%) |
|
Liquidity Ratio |
52.5% |
60.1% |
7.6% |
|
Minimum Statutory ratio |
20.0% |
20.0% |
|
|
Excess |
32.5% |
40.1% |
7.6% |
Key Take-Outs:
- Increased earnings - Core earnings per share (EPS) grew by 12.3% to Kshs 29.9 in Q3’2025 from Kshs 26.6 in Q3’2024, driven by the 10.5% growth in total operating income to Kshs 34.3 bn in Q3’2025 from Kshs 31.0 bn in Q3’2024, which outpaced the 9.5% increase in total operating expenses to Kshs 23.1 bn in Q3’2025 from Kshs 21.1 bn in Q3’2024.
- Improved asset quality – The bank’s asset quality improved, with the Gross NPL ratio declining to 12.4% in Q3’2025 from 13.5% in Q3’2024, as the 9.2% growth in gross loans to Kshs 316.9 bn in Q3’2025 from Kshs 290.3 bn in Q3’2024 outpaced the marginal 0.8% increase in gross non-performing loans to Kshs 39.4 bn in Q3’2025 from Kshs 39.1 bn in Q3’2024,
- Expanded Balanced sheet - The balance sheet expanded, with total assets increasing by 8.7% to Kshs 641.8 bn in Q3’2025 from Kshs 590.6 bn in Q3’2024, driven by a 7.8% increase in net loans and advances to Kshs 296.4 bn in Q3’2025 from Kshs 275.0 bn in Q3’2024, alongside a strong 22.9% increase in government securities to Kshs 159.3 bn in Q3’2025 from Kshs 129.6 bn in Q3’2024,
- Increased lending- Customer net loans and advances increased by 7.8% to Kshs 296.4 bn in Q3’2025 from Kshs 275.0 bn in Q3’2024, despite elevated credit risk in the banking industry, reflecting the bank’s continued appetite to expand customer lending.
For a more detailed analysis, please see the DTB-K’s Q3’2025 Earnings Note
- Absa Bank Kenya’s Q3’2025 performance
Below is a summary of Absa Bank Kenya’s Q3’2025 performance:
|
Balance Sheet |
Q3'2024 (Kshs bn) |
Q3'2025 (Kshs bn) |
y/y change |
|
Government Securities |
97.5 |
166.9 |
71.1% |
|
Net Loans and Advances |
311.5 |
309.7 |
(0.6%) |
|
Total Assets |
484.4 |
554.3 |
14.4% |
|
Customer Deposits |
351.8 |
384.3 |
9.2% |
|
Deposit per Branch |
4.6 |
4.4 |
(4.6%) |
|
Total Liabilities |
407.0 |
460.0 |
13.0% |
|
Shareholder's Funds |
77.3 |
94.4 |
22.0% |
|
Balance sheet ratios |
Q3'2024 |
Q3'2025 |
% point change |
|
Loan to Deposit Ratio |
88.5% |
80.6% |
(7.9%) |
|
Govt Securities to Deposit ratio |
27.7% |
43.4% |
15.7% |
|
Return on average equity |
26.4% |
26.8% |
0.5% |
|
Return on average assets |
3.8% |
4.4% |
0.6% |
|
Income Statement |
Q3'2024 (Kshs bn) |
Q3'2025 (Kshs bn) |
y/y change |
|
Net Interest Income |
34.5 |
33.0 |
(4.6%) |
|
Net non-Interest Income |
12.2 |
13.6 |
11.2% |
|
Total Operating income |
46.8 |
46.6 |
(0.4%) |
|
Loan Loss provision |
(8.0) |
(4.8) |
(39.6%) |
|
Total Operating expenses |
(25.7) |
(22.3) |
(13.0%) |
|
Profit before tax |
21.1 |
24.2 |
14.9% |
|
Profit after tax |
14.7 |
16.9 |
14.7% |
|
Core EPS |
2.7 |
3.1 |
14.7% |
|
Capital Adequacy Ratios |
Q3'2024 |
Q3'2025 |
% point change |
|
Core Capital/Total Liabilities |
19.1% |
20.8% |
1.7% |
|
Minimum Statutory ratio |
8.0% |
8.0% |
0.0% |
|
Excess |
11.1% |
12.8% |
1.7% |
|
Core Capital/Total Risk Weighted Assets |
15.6% |
18.0% |
2.4% |
|
Minimum Statutory ratio |
10.5% |
10.5% |
0.0% |
|
Excess |
5.1% |
7.5% |
2.4% |
|
Total Capital/Total Risk Weighted Assets |
19.4% |
20.9% |
1.5% |
|
Minimum Statutory ratio |
14.5% |
14.5% |
0.0% |
|
Excess |
4.9% |
6.4% |
1.5% |
|
Liquidity Ratio |
38.1% |
49.8% |
11.7% |
|
Minimum Statutory ratio |
20.0% |
20.0% |
0.0% |
|
Excess |
18.1% |
29.8% |
11.7% |
Key Take-Outs:
- Increased earnings - Core earnings per share grew by 14.7% to Kshs 3.1, from Kshs 2.7 in Q3’2024, driven by the 13.9% decrease in total operating expense to Kshs 22.3 bn, from Kshs 25.7 bn in Q3’2024. However, the performance was weighed down by a 0.4% decrease in total operating income to Kshs 46.8 bn from Kshs 46.6 bn in Q3’ 2024,
- Deteriorated asset quality – The bank’s Asset Quality deteriorated, with Gross NPL ratio increasing to 13.0% in Q3’2025, from 12.6% in Q3’2024, attributable to a 3.6% increase in Gross non-performing loans to Kshs 44.2 bn, from Kshs 42.7 bn in Q3’2024, relative to the 0.01% increase in gross loans to Kshs 339.4 bn, from Kshs 339.3 bn recorded in Q3’2024,
- Expanded Balanced sheet - The balance sheet recorded an expansion as total assets increased by 14.4% to Kshs 554.3 bn, from Kshs 484.4 bn in Q3’2024, mainly driven by a 71.1% increase in governments securities holdings to Kshs 166.9 bn, from 97.5 bn in Q3’2024. Net loans and advances decreased by 0.6% to Kshs 309.7 bn, from Kshs 311.5 bn in Q3’2024.
- Decreased lending- Customer net loans and advances decreased by 0.6% to Kshs 309.7 bn in Q3’2025, down from Kshs 311.5 bn in Q3’2024, as the lender decreased lending due the high industry NPLs, and despite the gradual easing of the Central Bank Rate to 9.25% in August from 9.50% in October 2025.
For a more detailed analysis, please see the Absa’s Q3’2025 Earnings Note
- NCBA Group’s Q3’2025 Performance
During the week, NCBA Group released its Q3’2025 results. Below is the summary;
|
Balance Sheet Items |
Q3'2024 |
Q3'2025 |
y/y change |
|
Net Loans and Advances |
303.5 |
292.7 |
(3.5%) |
|
Government Securities |
178.4 |
183.7 |
3.0% |
|
Total Assets |
678.8 |
665.3 |
(2.0%) |
|
Customer Deposits |
515.1 |
488.0 |
(5.3%) |
|
Deposits per Branch |
4.4 |
4.1 |
(7.7%) |
|
Total Liabilities |
579.0 |
545.1 |
(5.9%) |
|
Shareholders’ Funds |
99.8 |
120.3 |
20.5% |
|
Key Ratios |
Q3'2024 |
Q3'2025 |
% points change |
|
Loan to Deposit Ratio |
58.9% |
60.0% |
1.1% |
|
Government Securities to Deposit ratio |
34.6% |
37.6% |
3.0% |
|
Return on average equity |
23.3% |
21.0% |
(2.2%) |
|
Return on average assets |
3.2% |
3.4% |
0.2% |
|
Income Statement |
Q3'2024 |
Q3'2025 |
y/y change |
|
Net Interest Income |
25.1 |
32.0 |
27.4% |
|
Net non-Interest Income |
21.8 |
21.4 |
(1.9%) |
|
Total Operating income |
47.0 |
53.4 |
13.8% |
|
Loan Loss provision |
4.1 |
5.1 |
24.5% |
|
Total Operating expenses |
28.6 |
33.0 |
15.5% |
|
Profit before tax |
18.4 |
20.5 |
11.1% |
|
Profit after tax |
15.1 |
16.4 |
8.5% |
|
Core EPS |
9.2 |
9.9 |
8.5% |
|
Capital Adequacy Ratios |
Q3'2024 |
Q3'2025 |
% points change |
|
Core Capital/Total Liabilities |
18.5% |
22.0% |
3.5% |
|
Minimum Statutory ratio |
8.0% |
8.0% |
|
|
Excess |
10.5% |
14.0% |
3.5% |
|
Core Capital/Total Risk Weighted Assets |
19.6% |
21.9% |
2.3% |
|
Minimum Statutory ratio |
10.5% |
10.5% |
|
|
Excess |
9.1% |
11.4% |
2.3% |
|
Total Capital/Total Risk Weighted Assets |
19.7% |
22.0% |
2.3% |
|
Minimum Statutory ratio |
14.5% |
14.5% |
|
|
Excess |
5.2% |
7.5% |
2.3% |
|
Liquidity Ratio |
53.7% |
55.1% |
1.4% |
|
Minimum Statutory ratio |
20.0% |
20.0% |
|
|
Excess |
33.7% |
35.1% |
1.4% |
Key Take-Outs:
- Increased earnings – Core earnings per share increased by 8.5% to Kshs 9.9, from Kshs 9.2 in Q3’2024, mainly driven by the 13.8% increase in total operating income to Kshs 53.4 bn, from Kshs 47.0 bn in Q3’2024, however, this was weighed down by the 15.5% increase in total operating expenses to Kshs 33.0 bn, from Kshs 28.6 bn in Q3’2024
- Improved asset quality – The bank’s Asset Quality improved, with Gross NPL ratio reduced by 0.4% points to 12.1% in Q3’ 2025 from 12.5% in Q3’2024, attributable to the the 6.0% decrease in gross non-performing loans to Kshs 38.7 bn, from Kshs 41.1 bn in Q3’2024, which outpaced the 2.6% decrease in gross loans to Kshs 319.4 bn, from Kshs 328.0 bn recorded in Q3’2024,
- Decreased Lending – The bank’s loan book recorded a contraction of 2.6% to Kshs 319.4 bn from Kshs 328.0 bn in Q3’2024 attributed to increased credit risk aversion with NPLs decreasing to 12.1% in September 2025, from 12.5% in September 2024.
- Contracted Balance sheet- The balance sheet recorded a contraction as total assets declined by 2.0% to Kshs 665.3 bn, from Kshs 678.8 bn in Q3’2024, mainly driven by a 3.5% loan book contraction to Kshs 292.7 bn from Kshs 303.5 bn in Q3’2024.
For a more detailed analysis, please see the NCBA’s Q3’2025 Earnings Note
- Stanbic Bank’s Q3’2025 Performance
Below is a summary of Stanbic Bank’s Q3’2025 performance:
|
Balance Sheet |
Q3'2024 (Kshs bn) |
Q3'2025 (Kshs bn) |
y/y change |
|
Net Loans and Advances to Customers |
218.8 |
253.1 |
15.7% |
|
Kenya Government Securities |
74.2 |
98.6 |
32.8% |
|
Total Assets |
462.6 |
476.2 |
3.0% |
|
Customer Deposits |
327.8 |
343.9 |
4.9% |
|
Deposits Per Branch |
10.9 |
11.5 |
4.9% |
|
Total Liabilities |
401.0 |
410.3 |
2.3% |
|
Shareholders' Funds |
61.5 |
65.9 |
7.1% |
|
Income Statement Ratios |
Q3'2024 |
Q3'2025 |
% points change |
|
Yield from interest-earning assets |
12.9% |
11.1% |
(1.8%) |
|
Cost of funding |
6.7% |
4.5% |
(2.2%) |
|
Net Interest Margin |
6.8% |
6.3% |
(0.5%) |
|
Net Interest Income as % of operating income |
64.7% |
72.4% |
7.7% |
|
Non-Funded Income as a % of operating income |
35.3% |
27.6% |
(7.7%) |
|
Cost to Income Ratio |
52.1% |
54.5% |
2.4% |
|
CIR without LLP |
42.9% |
45.6% |
2.7% |
|
Cost to Assets |
2.7% |
2.7% |
(0.0%) |
|
Income Statement |
Q3'2024 (Kshs bn) |
Q3'2025 (Kshs bn) |
y/y change |
|
Net interest Income |
19.0 |
20.5 |
8.0% |
|
Non-interest income |
10.4 |
7.8 |
(24.5%) |
|
Total Operating income |
29.3 |
28.3 |
(3.5%) |
|
Loan loss provision |
(2.7) |
(2.5) |
(6.6%) |
|
Total Operating expenses |
(15.3) |
(15.4) |
1.0% |
|
Profit before tax |
14.1 |
12.9 |
(8.3%) |
|
Profit after tax |
10.1 |
9.4 |
(7.7%) |
|
Core EPS |
25.7 |
23.7 |
(7.7%) |
|
Income Statement Ratios |
Q3'2024 |
Q3'2025 |
y/y change |
|
Yield from interest-earning assets |
12.9% |
11.1% |
(1.8%) |
|
Cost of funding |
6.7% |
4.5% |
(2.2%) |
|
Net Interest Margin |
6.8% |
6.3% |
(0.5%) |
|
Net Interest Income as % of operating income |
64.7% |
72.4% |
7.7% |
|
Non-Funded Income as a % of operating income |
35.3% |
27.6% |
(7.7%) |
|
Cost to Income Ratio |
52.1% |
54.5% |
2.4% |
|
CIR without LLP |
42.9% |
45.6% |
2.7% |
|
Cost to Assets |
2.7% |
2.7% |
(0.0%) |
|
Capital Adequacy Ratios |
Q3'2024 |
Q3'2025 |
% points change |
|
Core Capital/Total Liabilities |
16.5% |
17.3% |
0.8% |
|
Minimum Statutory ratio |
8.0% |
8.0% |
0.0% |
|
Excess |
8.5% |
9.3% |
0.8% |
|
Core Capital/Total Risk Weighted Assets |
14.7% |
14.3% |
(0.4%) |
|
Minimum Statutory ratio |
10.5% |
10.5% |
0.0% |
|
Excess |
4.2% |
3.8% |
(0.4%) |
|
Total Capital/Total Risk Weighted Assets |
17.8% |
17.9% |
0.1% |
|
Minimum Statutory ratio |
14.5% |
14.5% |
0.0% |
|
Excess |
3.3% |
3.4% |
0.1% |
|
Liquidity Ratio |
50.0% |
49.0% |
(1.0%) |
|
Minimum Statutory ratio |
20.0% |
20.0% |
0.0% |
|
Excess |
30.0% |
29.0% |
(1.0%) |
Key Take-Outs:
- Decreased earnings - Core earnings per share declined by 7.7% to Kshs 23.7, from Kshs 25.7 in Q3’2024, driven by the 1.0% increase in total operating expense to Kshs 15.4 bn, from Kshs 15.3 bn in Q3’2024 coupled with a 3.5% decrease in total operating income to Kshs 28.3 bn from Kshs 29.3 bn in Q3’ 2024,
- Improved asset quality – The bank’s Asset Quality improved, with Gross NPL ratio decreasing to 8.2% in Q3’2025, from 10.4% in Q3’2024, attributable to a 8.3% decrease in Gross non-performing loans to Kshs 22.8 bn, from Kshs 24.8 bn in Q3’2024, relative to the 17.5% increase in gross loans to Kshs 279.4 bn, from Kshs 237.7 bn recorded in Q3’2024,
- Expanded Balanced sheet - The balance sheet recorded an expansion as total assets increased by 3.0% to Kshs 476.2 bn, from Kshs 462.6 bn in Q3’2024, mainly driven by a 32.8% increase in governments securities holdings to Kshs 98.6 bn, from 74.2 bn in Q3’2024. Net loans and advances increased by 15.7% to Kshs 253.1 bn, from Kshs 218.8 bn in Q3’2024.
- Increased lending- Customer loans increased by 15.7% to Kshs 253.1 bn, from Kshs 218.8 bn in Q3’2024 as the lender increased lending despite the high industry NPLs, a move possibly supported by the gradual easing of the Central Bank Rate to 9.25% in October from 9.50% in June 2025.
For a more detailed analysis, please see the Stanbic’s Q3’2025 Earnings Note
Summary Performance
The table below shows the performance of listed banks that have released their Q3’2025 results using several metrics:
|
Bank |
Core EPS Growth |
Interest Income Growth |
Interest Expense Growth |
Net Interest Income Growth |
Net Interest Margin |
Non-Funded Income Growth |
NFI to Total Operating Income |
Growth in Total Fees & Commissions |
Deposit Growth |
Growth in Government Securities |
Loan to Deposit Ratio |
Loan Growth |
Return on Average Equity |
COF |
YIEA |
|
Equity Group |
32.7% |
2.9% |
(20.7%) |
16.1% |
7.9% |
2.5% |
40.1% |
7.6% |
2.2% |
19.9% |
63.9% |
7.5% |
24.5% |
3.7% |
11.3% |
|
I&M Group |
24.2% |
0.6% |
(23.1%) |
21.1% |
8.3% |
17.9% |
26.0% |
15.7% |
10.2% |
65.2% |
66.2% |
7.3% |
19.2% |
5.3% |
13.1% |
|
Absa Bank Kenya |
14.7% |
(9.6%) |
(21.9%) |
(4.6%) |
9.6% |
11.2% |
29.2% |
16.3% |
9.2% |
71.1% |
80.6% |
(0.6%) |
26.8% |
3.8% |
12.9% |
|
Diamond Trust Bank |
12.3% |
0.9% |
(14.6%) |
17.9% |
6.1% |
(5.8%) |
26.7% |
10.7% |
15.5% |
22.9% |
58.1% |
7.8% |
11.2% |
5.5% |
11.3% |
|
Co-operative Bank |
12.3% |
10.0% |
(9.0%) |
22.8% |
8.7% |
(0.8%) |
32.8% |
1.6% |
6.7% |
20.7% |
74.1% |
6.6% |
18.8% |
5.4% |
13.4% |
|
NCBA Group |
8.5% |
(11.8%) |
(42.3%) |
27.4% |
7.3% |
(1.9%) |
40.0% |
2.5% |
(5.3%) |
3.0% |
60.0% |
(3.5%) |
21.0% |
5.3% |
12.1% |
|
KCB Group |
0.7% |
1.1% |
(17.6%) |
12.4% |
8.4% |
(10.1%) |
30.2% |
(1.5%) |
(0.8%) |
6.1% |
74.7% |
8.2% |
22.7% |
4.0% |
12.2% |
|
Stanbic Group |
(7.7%) |
(17.2%) |
(41.4%) |
8.0% |
6.3% |
(24.5%) |
27.6% |
1.1% |
4.9% |
32.8% |
73.6% |
15.7% |
13.4% |
4.5% |
11.1% |
|
Q3'2025 Mkt Weighted Average* |
12.6% |
(0.7%) |
(18.7%) |
12.3% |
7.2% |
(0.9%) |
28.8% |
5.1% |
3.5% |
24.2% |
61.9% |
5.7% |
19.0% |
3.8% |
10.7% |
|
Q3’2024 Mkt Weighted Average** |
16.9% |
22.5% |
41.4% |
12.5% |
6.6% |
5.4% |
32.3% |
6.2% |
2.6% |
4.8% |
59.6% |
(3.1%) |
19.5% |
4.6% |
10.9% |
|
*Market cap weighted as at 21/11/2025 |
|||||||||||||||
|
**Market cap weighted as at 18/11/2024 |
|||||||||||||||
Key take-outs from the table include:
- The listed banks that have released their Q3’2025 results recorded a 12.6% increase in core Earnings per Share (EPS) in Q3’2025, compared to the weighted average growth of 16.9% in Q3’2024.
- Interest income declined by 0.7% in Q3’2025, compared to the 22.5% growth recorded in Q3’2024. Interest expenses fell by 18.7% in Q3’2025, compared to a 41.4% increase in Q3’2024.
- The Banks’ net interest income recorded a weighted average growth of 12.3% in Q3’2025, broadly unchanged from the 12.5% growth recorded over a similar period in 2024, while non-funded income declined by 0.9% in Q3’2025 compared to the 5.4% growth recorded in Q3’2024.
- The Banks recorded a weighted average deposit growth of 3.5% in Q3’2025, compared to the market-weighted average deposit growth of 2.6% in Q3’2024.
Asset Quality:
The table below shows the asset quality of listed banks that have released their Q3’2025 results using NPL ratio and NPL coverage:
|
Bank |
Q3'2025 NPL Ratio* |
Q3'2024 NPL Ratio** |
% point change in NPL Ratio |
Q3'2025 NPL Coverage* |
Q3'2024 NPL Coverage** |
% point change in NPL Coverage |
|
Cooperative Bank |
17.3% |
16.5% |
0.8% |
63.7% |
60.5% |
3.2% |
|
Absa Bank Kenya |
13.0% |
12.6% |
0.5% |
67.1% |
65.3% |
1.8% |
|
KCB Group |
18.1% |
18.1% |
0.0% |
67.9% |
63.8% |
4.1% |
|
NCBA Bank |
12.1% |
12.5% |
(0.4%) |
68.9% |
59.7% |
9.2% |
|
Equity Group |
13.6% |
14.4% |
(0.8%) |
71.1% |
56.8% |
14.4% |
|
Diamond Trust Bank |
12.4% |
13.5% |
(1.0%) |
52.1% |
39.1% |
13.0% |
|
I&M Group |
10.2% |
11.8% |
(1.6%) |
69.5% |
61.3% |
8.2% |
|
Stanbic Holdings |
8.2% |
10.4% |
(2.2%) |
83.2% |
76.5% |
6.7% |
|
Mkt Weighted Average* |
14.3% |
13.5% |
0.8% |
68.7% |
64.5% |
4.2% |
Key take-outs from the table include;
- Asset quality for the listed banks that have released results improved during Q3’2025, with the market-weighted average NPL ratio decreasing by 1.2% points to 12.3%, from 13.5% in Q3’2024. The improvement was supported by reduced NPL ratios across several banks, including Stanbic Holdings, I&M Group, DTB, NCBA Bank, and Equity Group.
- Market-weighted average NPL coverage declined by 4.1% points to 60.4% in Q3’2025 from 64.5% recorded in Q3’2024. The decline was despite increases in coverage by individual banks such as Equity Group 14.4% points, Diamond Trust Bank 13.0% points, I&M Group 8.2% points, and NCBA Bank 9.2% points.
We are “Bullish” on the Equities markets in the short term due to current cheap valuations, lower yields on short-term government papers and expected global and local economic recovery, and, “Neutral” in the long term due to persistent foreign investor outflows. With the market currently trading at a discount to its future growth (PEG Ratio at 0.9x), we believe that investors should reposition towards value stocks with strong earnings growth and that are trading at discounts to their intrinsic value. We expect the current high foreign investors sell-offs to continue weighing down the economic outlook in the short term.
- Hospitality Sector
- Jambojet eyes expansion in the West and Southern Africa routes
During the week, Jambojet revealed its plans to triple its fleet and launch longer routes, including new destinations in West and Southern Africa over the next five years as revenue surpasses the Kshs 13.0 bn attributable to increased demand. This expansion will allow Jambojet to increase frequency of flights in Kenya under the De Havilland Dash 8-400 plane as well as acquire other aircrafts to deepen presence in East Africa and enter markets in West Africa, South Africa and North Africa.
This expansion will have immense benefits on the hospitality sector in Kenya,
- Increased regional connectivity will lead to more tourists: This could boost demand for hotels, especially in Nairobi and at tourist hotspots,
- Boost to domestic and regional tourism: With more planes and more routes, Jambojet can increase the frequency of flights on domestic routes to serve both travel and business demand,
- Increase in hospitality supply: There could be opportunities for new hotel developments, mixed-use hospitality real estate, and more investment in lodging infrastructure.
We expect that Jambojet’s decision to triple its fleet and open routes into West and Southern Africa will significantly lift Kenya’s hospitality sector. By improving regional connectivity, lowering travel costs, and attracting more business and leisure travelers, the expansion strengthens demand for hotels, resorts, and serviced apartments across the country.
- Real Estate Investment Trusts
- Acorn gets CMA approval for Build-To-Rent D-REIT
During the week, Real Estate Developer, Acorn secured CMA approval to launch a new Build-To-Rent D-REIT in a bid to strengthen its push into Nairobi’s affordable rental market for the young workers. The new Acorn Build-To-Rent D-REIT will focus on rental homes for young urban workers aged between 20-30 Years who work across Nairobi’s major hubs. The Kshs 2.2 bn D-REIT will start with a committed capital of Kshs 1.3 bn from Private Infrastructure Development Group through its InfraCo vehicle, Kshs 258.4 mn from Shelter Afrique Development Bank and Kshs 645.0 bn from Acorn.
A Build-To-Rent Development Real Estate Investment Trust is a type of real estate investment structure where investors pool money together to develop residential properties specifically meant for long-term renting, not selling. It focuses on building rental housing, leasing it out and generating stable rental income for investors. Its benefits include, stable and recurring income and low volatility than commercial real estate.
This will have immense benefits on the residential sector in Kenya.
- Boost in institutional quality rental housing: This REIT will help finance purpose-built rental housing. Rather than fragmented, informal landlords, we’ll see professionally developed and managed properties,
- Increase capital flows into Real Estate: The REIT starts with a committed capital of Kshs 1.3 bn from Private Infrastructure Development Group through its InfraCo vehicle, Kshs 258.4 mn from Shelter Afrique Development Bank and Kshs 645.0 bn from Acorn. These signals growing confidence in regulated Real Estate vehicles in Kenya. More REITs like this could attract further institutional capital into the residential sector,
- Impact on the Mortgage Market: Over time, this might also influence how people think of housing, not just as a purchase, but as a long-term rental investment.
Acorn’s approval for the Kshs 2.2 bn Build-to-Rent D-REIT marks a defining moment for Kenya’s residential market. By channeling institutional capital into purpose-built, affordable rental housing, the initiative strengthens supply, raises quality standards, and introduces a more professional, sustainable approach to property development and management.
- Real Estate Investment Trusts (REITs)
On the Unquoted Securities Platform, Acorn D-REIT and I-REIT traded at Kshs 27.4 and Kshs 23.2 per unit,
respectively, as per the last updated data on 7th November 2025. The performance represented a 33.4% and 14.5% gain for the D-REIT and I-REIT, respectively, from the Kshs 20.0 inception price. The volumes traded for the D-REIT and I-REIT came in at Kshs 12.8 mn and Kshs 40.6 mn shares, respectively, with a turnover of Kshs 323.5 mn and Kshs 791.5 mn, respectively, since inception in February 2021. Additionally, ILAM Fahari I-REIT traded at Kshs 11.0 per share as of 7th November 2025, representing a 45.0% loss from the Kshs 20.0 inception price. The volume traded to date came in at 1.2 mn shares for the I-REIT, with a turnover of Kshs 1.5 mn since inception in November 2015.
REITs offer various benefits, such as tax exemptions, diversified portfolios, and stable long-term profits. However, the ongoing decline in the performance of Kenyan REITs and the restructuring of their business portfolios are hindering significant previous investments. Additional general challenges include:
- Insufficient understanding of the investment instrument among investors leading to a slower uptake of REIT products,
- Lengthy approval processes for REIT creation,
- High minimum capital requirements of Kshs 100.0 mn for REIT trustees compared to Kshs 10.0 mn for pension funds Trustees, essentially limiting the licensed REIT Trustee to banks only
- The rigidity of choice between either a D-REIT or and I-REIT forces managers to form two REITs, rather than having one Hybrid REIT that can allocate between development and income earning properties. However, with the move by Acorn to establish the Build-To-Rent D-REIT, this marks a step towards achieving a hybrid Real Estate Investment Trust (REITS) which will foster flexibility of choice among investors.
- Limiting the type of legal entity that can form a REIT to only a trust company, as opposed to allowing other entities such as partnerships, and companies,
- We need to give time before REITS are required to list – they would be allowed to stay private for a few years before the requirement to list given that not all companies maybe comfortable with listing on day one, and,
- Minimum subscription amounts or offer parcels set at Kshs 0.1 mn for D-REITs and Kshs 5.0 mn for restricted I-REITs. The significant capital requirements still make REITs relatively inaccessible to smaller retail investors compared to other investment vehicles like unit trusts or government bonds, all of which continue to limit the performance of Kenyan REITs.
We expect Kenya’s real estate sector to maintain a positive growth trajectory, driven by key developments across the hospitality and REITs segments. The planned JamboJet expansion to Western and Southern Africa is expected to boost tourism and eco-friendly hospitality investments. The REITs market shows mixed performance, with gains in Acorn D-REIT and I-REIT, though high capital requirements and limited investor uptake continue to constrain growth.
In November 2024, we released the Nairobi Metropolitan Area Mixed-Use Developments (MUDs) Report 2024 which highlighted that Mixed-Use Developments recorded an average rental yield of 8.6%, 1.5% points higher than the respective single-use themes which recorded an average rental yield of 7.1% in a similar period in 2023. The relatively better performance was mainly attributed to; i) heightened demand for prime locations attracting clients willing to pay premium rents, ii) strategic and prime locations of the developments with the capability to attract prospective clients, and, iii)) the area’s proximity to amenities such as shopping malls enhancing the desirability.
This week we update our report with 2025 market research data in order to determine the progress and performance of MUDs against the market performance of single-use Residential, Commercial Office, and Retail developments. Therefore, this topical will cover the following:
- Overview of Mixed-Use Developments,
- Mixed-Use Developments Performance Summary in 2025, and,
- Mixed-Use Developments Investment Opportunity and Outlook.
Section I: Overview of Mixed-Use Developments
A Mixed-Use Development (MUD) is an urban development that integrates various real estate functions, including residential, commercial, retail, and hospitality components. By combining these diverse uses, a single development can fulfill multiple purposes within one location, offering enhanced convenience by bringing living, working, and recreational spaces together. This integration of different functions provides easy access to amenities and services, making MUDs increasingly popular in Kenya as they respond to the evolving lifestyles and demands of clients. For the year 2025;
- Business Bay Square developer announcedplans to invest Kshs 65.0 bn in a 60-acre mixed-use development at Tatu City. The project marks a strategic expansion by the Eastleigh-based investor into large-scale ventures beyond Nairobi’s central business district. The ambitious development will comprise residential units, office spaces, retail outlets, warehouses, and a mosque. Construction is expected to commence within the next year and will span approximately a decade under the Tatu City Special Economic Zone framework. For more information, please see our Cytonn Weekly # 42/2025.
Some of the factors that have been driving the growth of MUDs include;
- Growing Demand: with relatively high urbanization and population growth rates of 3.7% p.a and 2.0% p.a, respectively, against the global average of 1.7% p.a and 1.0% p.a, respectively, as at 2024. This trend drives a strong demand for development, supporting the expansion and success of Mixed-Use Developments (MUDs). Additionally, the market's need for flexible, integrated spaces that cater to diverse needs has led to the rise of Mixed-Use Developments (MUDs). MUDs offer a comprehensive solution by combining residential, commercial, and recreational components within a single development,
- Change in Urban lifestyle and Consumer preferences: Shifting urban lifestyles and consumer preferences are driving demand for Mixed-Use Developments (MUDs). These developments offer convenient, integrated living experiences that align with modern lifestyles. As a result, Kenya is witnessing a surge in MUD construction. Consumers are in a position to access all services they require within a single development,
- Relatively Higher Investment Returns: MUDs offer greater financial potential than single-use developments. By combining various real estate uses, investors can diversify income streams from property sales and leases of office, residential, retail, and recreational spaces,
- Improved Infrastructure: Recent infrastructure developments by the government, such as the Nairobi Expressway and Western Bypass, have facilitated the growth of Mixed-Use Developments. Improved infrastructure enhances connectivity and accessibility, creating favorable conditions for these integrated developments,
- Optimal Land Utilization: MUDs maximize land utilization by integrating multiple functions into a single development. This is especially beneficial in urban areas with limited land availability and growing populations,
- Strategic Locations: MUDs are typically situated in well-connected urban areas, attracting a diverse range of residents and businesses, including high-income individuals seeking convenience,
- Diversification: MUDs offer a diversified investment strategy by combining multiple Real Estate asset classes. This reduces risk exposure to fluctuations in a single market segment, and,
- Aspect of Sustainability: Mixed-Use Developments seamlessly integrate different real estate classes in a single project and location, optimizing space usage. This reduces commuting needs as residents can live, work, and shop all within one locale, contributing to a more sustainable lifestyle.
Despite the aforementioned factors, there exist various setbacks hindering the development and performance of MUDs such as:
- High Development Costs: Developing and financing Mixed-Use Developments (MUDs) tends to be more expensive than single-use projects, largely due to the complex designs required to ensure smooth integration of varied real estate functions. Balancing appeal with functionality adds challenges for developers seeking funding from banks and other stakeholders. Despite this, construction costs in Kenya showed signs of stabilization, largely supported by subdued inflation of 6% y/y as of July 2025 and a relatively stable currency. According to the Kenya National Bureau of Statistics (KNBS) Q2’2025 Construction Input Price Indices Report, the Building Cost Index (BCI) increased slightly to 119.8 in Q2’2025 from 119.1 in Q1’2025, marking a 0.6% quarter-on-quarter increase. This indicates a moderation in construction cost growth, driven by steadier prices for key inputs such as fuel, steel and transport. Prices for specific materials, however, continued to rise modestly; cement increased by 2.6%, quarry products by 2.7%, and sand by 1.4%, suggesting that while input inflation is moderate, developers are still facing some upward pressure in select areas,
- Oversupply in Select Real Estate Sectors: Existing oversupply of physical space in select sectors. With approximately 5.7 mn SQFT in the NMA commercial office market, and approximately 3.0 mn SQFT in the Nairobi Metropolitan Area (NMA) retail market, which in turn hinders optimum performance of the developments, and,
- Coordinating Diverse Uses: Successfully integrating the varied uses within MUDs can be challenging, as each real estate component has unique needs and requirements. Achieving the right balance requires careful management, ensuring that tenants complement one another and align with the development’s overall objective which can be complex to implement effectively.
Section II: Mixed-Use Developments Performance Summary in 2025
- Summary of MUDs Performance in Comparison to General Market Performance
Mixed-Use Developments recorded an average rental yield of 8.7% in 2025, 0.1% points higher than the respective single-use themes which recorded an average rental yield of 7.1% in a similar period the previous year. The relatively better performance was mainly attributable to changing client preferences and MUDs' attractiveness driven by the diversity in amenities and social offerings they provide to clients.
Both the office and retail themes in the MUDs recorded 0.4% points increase in average rental yields to 8.6% and 10.5% respectively in 2025, from 8.2% and 10.1 % in 2024. This increase was primarily driven by the addition of prime spaces commanding higher rents and yields and aggressive expansion efforts by both local and international retailers such as Carrefour, China square and Naivas, contributed to the growth during the period under review. For the Residential theme in the MUDs, the average rental yield decreased by 0.2% to 7.2% in 2025, from 7.4% in 2024. The decrease in performance was primarily influenced by a decrease in asking rents to Kshs 1,082 per SQM from Kshs 1775 per SQM in 2024
The table below shows the performance of single-use and Mixed-Use development themes between 2024 and 2025;
|
Cytonn Report: Thematic Performance in MUDs Vs. Key Nodes Hosting MUDs Market Performance 2024-2025 |
||||||
|
|
MUD Themes Average |
Market Average |
|
|
||
|
|
Rental Yield % 2024 |
Rental Yield % 2025 |
Rental Yield % 2024 |
Rental Yield % 2025 |
∆ in y/y MUD Rental yields |
∆ in theme Rental Yields |
|
Retail |
10.1% |
10.5% |
8.2% |
8.3% |
0.4% |
0.04% |
|
Offices |
8.2% |
8.6% |
7.2% |
7.6% |
0.4% |
0.4% |
|
Residential |
7.4% |
7.2% |
6.1% |
5.5% |
(0.2%) |
(0.5%) |
|
Average |
8.6% |
8.7% |
7.2% |
7.1% |
0.2% |
(0.04%) |
|
* Market performance is calculated from nodes where sampled MUDs exist |
||||||
Source: Cytonn Research
- Mixed-Use Developments Performance per Node
In terms of performance per node, Karen, Kilimani, and Westlands were the best performing of all sampled nodes with an average yield of 10.7%, 9.6%, and 9.6% respectively; 2.0% and 0.9% higher than the market average of 8.7% in 2025. The strong performance was mainly attributed to: i) a large base of residents with substantial consumer spending power, ii) robust infrastructure supporting investment opportunities, and iii) the availability of prime retail and office spaces commanding higher rents and yields. On the other hand, Mombasa Road recorded the lowest performance with an average rental yield of 7.6%, 1.5% lower than the market average of 8.7%. This performance can be attributed to; i) heavy traffic on Mombasa Road potentially deterring businesses and residents, reducing demand and rental yields, ii) low rental rates attracted by developments, and iii) the area's perception as an industrial hub reducing appeal for high-rent tenants. The table below shows the performance of Mixed-Use Developments by node in 2025;
|
Cytonn Report: Nairobi Metropolitan Area Mixed Use Developments Performance by Nodes 2025 |
||||||||||||
|
Location |
Commercial Office |
Commercial Retail |
Residential |
Average MUD Yield |
||||||||
|
Rent (Kshs/SQFT) |
Occupancy |
Rental Yield |
Rent (Kshs/SQFT) |
Occupancy |
Rental Yield |
Price (Kshs/SQM) |
Rent (Kshs/SQM) |
Annual Uptake |
Rental Yield |
|
||
|
Eastlands |
92 |
72.5% |
6.4% |
232 |
87.0% |
10.4% |
|
|
|
|
8.4% |
|
|
Karen |
129 |
85.0% |
9.6% |
270 |
95.0% |
11.8% |
|
|
|
|
10.7% |
|
|
Kilimani |
121 |
85.4% |
9.1% |
186 |
88.0% |
10.2% |
|
|
|
|
9.6% |
|
|
Limuru Road |
113 |
77.5% |
7.8% |
305 |
77.5% |
12.9% |
180,396 |
1,314 |
23.1% |
7.9% |
9.5% |
|
|
Mombasa road |
112 |
70.0% |
7.4% |
205 |
77.5% |
9.0% |
427,404 |
693 |
8.6% |
6.5% |
7.6% |
|
|
Thika road |
120 |
82.7% |
9.2% |
207 |
81.7% |
9.8% |
145,260 |
766 |
11.7% |
5.3% |
8.1% |
|
|
UpperHill |
112 |
87.0% |
9.3% |
173 |
80.0% |
9.7% |
|
|
|
|
9.5% |
|
|
Westlands |
129 |
79.8% |
9.7% |
204 |
75.4% |
10.1% |
287,314 |
3,460 |
8.5% |
9.1% |
9.6% |
|
|
Average |
116 |
80.0% |
8.6% |
223 |
82.8% |
10.5% |
260,093 |
1,558 |
13.0% |
7.2% |
8.7% |
|
|
*Selling prices used in the computation of rental yields for commercial office and retail themes entailed a combination of both real figures and market estimates of comparable properties in the locations of the Mixed-Use Developments (MUDs) sampled |
|
|||||||||||
Source: Cytonn Research
- Performance of Real Estate Themes in MUDs versus Single-themed Developments’ Performance
In our Mixed-Use Development analysis, we looked into the performance of the retail, commercial office, and residential themes:
- Retail Space
The average rental yield of retail spaces in Mixed-Use Developments came in at 10.5% in 2025, 2.2% points higher than single-use retail developments that realized an average rental yield of 8.3%. This was mainly attributable to the high rental rates that MUDs generated at Kshs 223 per SQFT when compared to the Kshs 200 per SQFT recorded for the single-use retail spaces owing to the availability of prime quality spaces attracting higher rental rates.
Limuru Road and Karen nodes continued to register the best performance with the average rental yield at 12.9% and 11.8% significantly higher than the market average of 10.5%. This was mainly driven by; i) relatively stable occupancy rates ii) increased and relatively higher rental rates which translates to higher returns, iii) the presence of residents with high incomes and significant purchasing power, and, iv) the availability of sufficient infrastructure and connectivity that effectively supports the MUDs. Conversely, Mombasa Road recorded the lowest rental yields at 9.0%, 1.5% points lower than the market average of 10.5%. This can be attributed to relatively lower rental rates of Kshs 205 in comparison to the market average of Kshs 223 and the popularity of the area as an industrial zone. The table below provides a summary of the performance of retail spaces in MUDs against market performance in 2025;
|
All values in Kshs Unless Stated Otherwise |
||||||
|
Cytonn Report: Performance of Retail in MUDs Vs. Market Performance 2025 |
||||||
|
Location |
MUD Performance |
Market Performance |
||||
|
Rent/SQFT |
Occupancy (%) |
Rental Yield (%) |
Rent/SQFT |
Occupancy (%) |
Rental Yield (%) |
|
|
Limuru Road |
305 |
77.5% |
12.9% |
211 |
75.7% |
9.2% |
|
Karen |
270 |
95.0% |
11.8% |
225 |
84.5% |
9.5% |
|
Eastlands |
232 |
87.0% |
10.4% |
150 |
78.2% |
6.4% |
|
Kilimani |
186 |
88.0% |
10.2% |
204 |
81.7% |
9.9% |
|
Westlands |
204 |
75.4% |
10.1% |
246 |
79.9% |
7.2% |
|
Thika road |
207 |
81.7% |
9.8% |
193 |
79.8% |
7.5% |
|
UpperHill |
173 |
80.0% |
9.7% |
|
|
|
|
Mombasa road |
205 |
77.5% |
9.0% |
174 |
80.1% |
8.3% |
|
Average |
223 |
82.8% |
10.5% |
200 |
80.0% |
8.3% |
Source: Cytonn Research
- Commercial Office Space
The average rental yield for commercial office spaces in MUDs came in at 8.6%, 1.0% points higher than single-use commercial developments which realized an average rental yield of 7.6% in 2025. The performance by MUDs was largely attributed to the high rental rates chargeable per SQM within the developments driven by; i) Strategic locations attracting multinationals and international organizations, boosting demand for these spaces, and, ii) High rental rates for prime Grade A offices are driven by their exceptional quality, and sustainability features.
In terms of submarket performance, Westlands, Karen, and Upperhill were the best-performing nodes posting average rental yields of 9.7%, 9.6%, and 9.3% attributable to; i) the presence of high-end business parks Sarit, GTC, the Hub and Galleria, offering high rental rates and returns, ii) quality and ample infrastructure improving accessibility to the nodes, iii) quick access to the CBD, and, iv) increasing demand for these spaces. In contrast, Eastlands exhibited the lowest performance among nodes, with an average rental yield of 6.4%, primarily due to: i) lower-quality office spaces with lower rental rates, and, ii) Insufficient infrastructure to adequately support MUDs. The table below shows the performance of office spaces in MUDs against the single-use themed market in 2025;
|
All Values are in Kshs Unless Stated Otherwise |
||||||
|
Cytonn Report: Performance of Commercial Offices in MUDs Vs. Market Performance 2025 |
||||||
|
Location |
MUD Performance |
Market Performance |
||||
|
Rent/SQFT |
Occupancy (%) |
Rental Yield (%) |
Rent/SQFT |
Occupancy (%) |
Rental Yield (%) |
|
|
Westlands |
129 |
79.8% |
9.7% |
120 |
82.8% |
9.5% |
|
Karen |
129 |
85.0% |
9.6% |
115 |
81.5% |
8.0% |
|
UpperHill |
112 |
87.0% |
9.3% |
104 |
75.6% |
7.0% |
|
Thika road |
120 |
82.7% |
9.2% |
91 |
80.1% |
6.7% |
|
Kilimani |
121 |
85.4% |
9.1% |
102 |
83.2% |
7.9% |
|
Limuru Road |
113 |
77.5% |
7.8% |
|
|
|
|
Mombasa road |
112 |
70.0% |
7.4% |
82 |
72.7% |
6.4% |
|
Eastlands |
92 |
72.5% |
6.4% |
|
|
|
|
Average |
116 |
80.0% |
8.6% |
102 |
79.3% |
7.6% |
Source: Cytonn Research
- Residential Space
In 2025, residential units within MUDs recorded an average rental yield of 7.2%, marking a 1.7% higher compared to the single-use residential market average of 5.5%. This was 0.2% points lower than 2024 performance of 7.4%. The decrease performance was primarily influenced by a decrease in asking rents to Kshs 1,082 per SQM from Kshs 1775 per SQM in 2024. Additionally, there was a decrease in unit uptakes by 4.5% to 13.0% from 17.5%. This reduction in performance can be attributed to harsh economic conditions which reduced the household purchasing power due to high cost of living forcing landlords to lower rents and slow intake of residential units.
Regarding sub-market performance, Westlands and Limuru Road emerged as the top-performing nodes with an average rental yield of 9.1% and 7.9%, respectively, attributed to; i) improved infrastructure easing access to these nodes, ii) availability of amenities enhancing desirability of apartments in the nodes, presence of tenants willing to pay premium rents, and, iii) presence of upscale developments commanding higher rental rates. Conversely, Mombasa Road ranked as the least performing node, registering an average rental yield of 5.3%, mainly due to the lower prices and rental rates associated with developments within the specific area. The table below summarizes the performance of residential spaces in MUDs against the single-themed market in 2025:
|
All Values are in Kshs Unless Stated Otherwise |
||||||||
|
Cytonn Report: Performance of Residential Units in MUDs Vs. Market Performance 2025 |
||||||||
|
Location |
MUD Performace |
Market Performance |
||||||
|
Price/SQM |
Rent/SQM |
Annual Uptake |
Rental Yield % |
Price/SQM |
Rent/SQM |
Annual Uptake |
Rental Yield % |
|
|
Westlands |
287,314 |
1,558 |
8.5% |
9.1% |
164,593 |
749 |
9.7% |
5.5% |
|
Limuru Road |
180,396 |
1,314 |
23.1% |
7.9% |
113,234 |
549 |
10.5% |
5.3% |
|
Mombasa Road |
427,404 |
693 |
8.6% |
6.5% |
81,629 |
444 |
9.7% |
5.6% |
|
Thika Road |
145,260 |
766 |
11.7% |
5.3% |
85,547 |
485 |
8.9% |
5.6% |
|
Average |
260,093 |
1,082 |
13.0% |
7.2% |
111,251 |
557 |
9.7% |
5.5% |
Source: Cytonn Research
Section III: Mixed-Use Developments Investment Opportunity and Outlook
The table below summarizes our outlook on Mixed-Use Developments (MUDs), where we look at the general performance of the key sectors that compose MUDs i.e., retail, commercial office, and residential, and investment opportunities that lie in the themes;
|
|
Cytonn Report: Mixed-Use Developments (MUDs) Outlook |
|
|
|
Sector |
|
2025 Sentiment and Outlook |
2025 Outlook |
|
Retail |
• The average rental yield of retail spaces in Mixed-Use Developments came in at 10.5% in 2025, 2.2% points higher than single-use retail developments that realized an average rental yield of 8.3%. This was mainly attributable to the high rental rates that MUDs generated at Kshs 223 per SQFT when compared to the Kshs 200 per SQFT recorded for the single-use retail spaces owing to the availability of prime quality spaces attracting higher rental rates. • We expect retail spaces within MUDs to continue performing strongly, bolstered by the aggressive expansion of both local and international retailers—including Carrefour and China Square—as they seek to entrench market dominance and fill the void left by outgoing brands such as Nakumatt and Uchumi. This momentum is further supported by Kenya’s favourable population demographics, which continue to drive demand for goods and services, as well as rising foreign capital inflows into the retail sector alongside steady growth in e-commerce. • However, the retail market in the Nairobi Metropolitan Area faces constraints due to an existing oversupply of more than 3.0 mn SQFT, challenging economic conditions like inflation that reduce consumer purchasing power, and a continued shift toward e-commerce. These factors are likely to dampen the sector's performance. • Investment opportunities lie in Limuru Road, Karen, and Eastlands, with the nodes providing relatively higher rental yields |
Neutral |
|
|
Office |
• The average rental yield for commercial office spaces in MUDs came in at 8.6%, 1.0% points higher than single-use commercial developments which realized an average rental yield of 7.6% in 2025. The performance by MUDs was largely attributed to the high rental rates chargeable per SQM within the developments driven by; i) Strategic locations attracting multinationals and international organizations, boosting demand for these spaces, and, ii) High rental rates for prime Grade A offices are driven by their exceptional quality, and sustainability features. • A gradual increase in the uptake of commercial office spaces is expected, supported by the rising popularity of co-working environments. However, overall sector performance will continue to face pressure from the existing oversupply of approximately 5.7 mn SQFT. Encouragingly, the number of new projects in the pipeline has declined compared to the previous year, which may help ease the oversupply in the medium term. • Westlands, Upperhill, and Karen provide the best investment opportunities owing to their relatively higher rental yields resulting from higher rates chargeable due to the superiority in quality of spaces in the areas in comparison to other nodes |
Neutral |
|
|
Residential |
• residential units within MUDs recorded an average rental yield of 7.2%, marking a 1.7% higher compared to the single-use residential market average of 5.5%. This was 0.2% points lower than 2024 performance of 7.4%. The decrease performance was primarily influenced by a decrease in asking rents to Kshs 1,082 per SQM from Kshs 1775 per SQM in 2024. Additionally, there was a decrease in unit uptakes by 4.5% to 13.0% from 17.5%. This reduction in performance can be attributed to harsh economic conditions which reduced the household purchasing power due to high cost of living forcing landlords to lower rents and slow intake of residential units. • The best investment opportunity lies in Limuru Road and Westlands, which recorded the highest rental yields, above the market average |
Neutral |
|
|
Outlook |
Given that all our metrics are neutral, we retain a NEUTRAL outlook for Mixed-Use Developments (MUDs), supported by the remarkable returns compared to single-use themes, changing client preferences, and MUDs attractiveness driven by the diversity in amenities and social offerings they provide to clients. However, the existing oversupply of the NMA office market at 5.7 mn SQFT, and 3.0 mn SQFT in the NMA retail market, is expected to weigh down the performance. Karen, Kilimani, and Westlands nodes provide the best investment opportunities, with the areas providing the highest average MUD yields of 10.7%, and 9.6% respectively, compared to the market average of 9.1%. |
||
Disclaimer: The views expressed in this publication are those of the writers where particulars are not warranted. This publication, which is in compliance with Section 2 of the Capital Markets Authority Act Cap 485A, is meant for general information only and is not a warranty, representation, advice or solicitation of any nature. Readers are advised in all circumstances to seek the advice of a registered investment advisor

- Talk to us
- Kenya
- P.O Box 20695 - 00200, Nairobi, Kenya
- Cell +254709101200
- Tel +254709101200
- WhatsApp +254741676635
- United States
- +254709101200
- DOWNLOAD OUR APP
-


- Kenya
- 8th Floor, Pinetree Plaza, Kaburu Drive, Ngong Road, Nairobi, Kenya
- USA
- Suite 1150, 1775 Eye Street NW, USA, Washington DC 20006, USA
- Investments
- High Yield
- Private Equity
- Real Estate
- Real Estate
- RiverRun Estates
- Cytonn Towers
- The Ridge
- Taraji Heights
- The Alma