Nairobi Metropolitan Area Commercial Office Report 2025 and Cytonn Weekly #09.2026
By Research Team, Mar 8, 2026
Executive Summary
Fixed Income
During the week, T-bills were oversubscribed for the sixth consecutive week, with the overall subscription rate coming in at 418.4%, higher than the subscription rate of 243.9% recorded the previous week. Investors’ preference for the shorter 91-day paper waned, with the paper receiving bids worth Kshs 1.9 bn against the offered Kshs 4.0 bn, translating to a subscription rate of 48.7%, significantly lower than the subscription rate of 308.5%, recorded the previous week. The subscription rate for the 182-day paper increased significantly to 151.6% from the 7.9% recorded the previous week, while that of the 364-day paper increased to 833.2% from 454.0% recorded the previous week. The government accepted a total of Kshs 41.4 bn worth of bids out of Kshs 100.4 bn bids received, translating to an acceptance rate of 41.2%. The yields on the government papers registered a mixed performance where the yields on the 182-day papers increased by 2.2 bps to 7.82% from the 7.80% recorded the previous week. However, the yields on the 364-day paper decreased the most by 14.6 bps to 8.6% from 8.8% recorded the previous week, while the yields on the 91-day paper decreased by 0.1 bps to remain relatively unchanged at 7.6% in comparison to last week;
During the week, Stanbic Bank released its monthly Purchasing Manager’s Index (PMI), highlighting that the index for the month of February 2026 remained in expansion territory, coming in at 50.4, albeit lower than 51.9 recorded in January 2026, marking the sixth consecutive month the index remained above the 50.0 neutral mark, signaling a sustained improvement in business conditions, mainly attributable to marginal growth in output and new orders;
The Capital Markets Authority (CMA) proposed licensing regulations which would significantly alter the regulatory cost structure for Fund Managers in Kenya. Under the proposal, the current flat annual licensing fee of Kshs 150,000 would be replaced with a variable fee of 0.05% of Assets Under Management (AUM), subject to a minimum fee of Kshs 100,000 and a cap of Kshs 15.0 mn;
On 4th March 2026, the National Treasury presented the Supplementary Budget for the Fiscal Year 2025/26 to the National Assembly revealing plans to increase the gross total supplementary budget by 7.4% to Kshs 4,6181.6 bn, from Kshs 4,301.9 bn in the June budget;
Equities
The equities market was on a downward trajectory, with NSE 20, NASI, NSE 10, and NSE-25 declining by 3.9%, 3.5%, 3.1% and 3.1% respectively, taking the YTD performance to gains of 14.8%, 12.6%, 11.3% and 11.2% for NSE 20, NSE 25, NSE 10 and NASI respectively. The equities market performance was mainly driven by losses recorded by large cap stocks such as ABSA, SCBK and NCBA of 6.4%, 6.1% and 4.9% respectively. However, the performance was supported by gains recorded by large cap stocks such as Cooperative Bank and DTB-K of 2.7% and 1.5% respectively;
Also, during the week, the banking sector index lost by 3.1% to 238.3 from 245.9 recorded the previous week. This is attributable to losses recorded by stocks such as ABSA, SCBK and NCBA of 6.4%, 6.1% and 4.9% respectively. The performance was supported by gains recorded by stocks such as Cooperative Bank and DTB-K of 2.7% and 1.5% respectively;
During the week, Absa released FY ’2025 financial results, PAT increased by 9.7% to Kshs 22.9 bn, from Kshs 20.9 bn in FY’2024, mainly driven by 12.2% decrease in total operating expenses to Kshs 28.6 bn, from Kshs 32.6 bn in FY’2024, which outpaced the 1.6% decrease in operating income to Kshs 61.4 bn, from Kshs 62.3 bn in FY’ 2024. The decrease in operating expenses was largely driven by the 31.8% decrease in loan loss provisions to Kshs 6.2 bn, from Kshs 9.0 bn in FY’2024;
During the week, the Kenya Pipeline Company (KPC) IPO results were released, showing that the offer was oversubscribed by 105.7%, with investors subscribing for 12.5 bn shares worth Kshs 112.4 bn against 11.8 bn shares worth Kshs 106.3 bn offered at Kshs 9.0 per share;
Real Estate
During the week we reviewed, the Architects Bill, 2026, which seeks to establish a revised legal framework for regulating the architectural profession in Kenya. Currently, architects are regulated under the Architects and Quantity Surveyors Act, which establishes the Board of Registration of Architects and Quantity Surveyors (BORAQS) as the body responsible for regulating both architects and quantity surveyors. The proposed Bill introduces a separate institutional framework dedicated specifically to architects;
During the week, the National Treasury and Kenya Railways Corporation (KRC) ramped up the expansion of the Standard Gauge Railway (SGR) from Naivasha to Malaba via Kisumu, with the Treasury allocating an additional Kshs 14.0 bn. To facilitate the 263.7-kilometre Phase 2B corridor, KRC announced plans to acquire over 5,000 acres of land through the National Land Commission (NLC), which will deploy digital data collection to ensure transparent compensation;
During the week, the Kenya Urban Roads Authority (KURA) commenced implementation of the Kshs 7.6 bn Outer Ring Road Bus Rapid Transit (BRT) Line 5 project, with contract signing for the 10.5 kilometer corridor from Allsops to Taj Mall completed on March 4;
During the week, the government revised upwards the projected collections from the Affordable Housing Levy for the current financial year to Kshs 97.0 bn, up from the earlier estimate of Kshs 95.0 bn, reflecting stronger compliance and enforcement of the statutory deductions from pay slips;
During the week, the Kenya Revenue Authority (KRA) announced plans for a major real estate expansion. The development will include data centres, warehouses, offices, housing, laboratories, and training facilities, and will be implemented under a public-private-partnership (PPP) model using a build-operate-and-transfer structure;
During the week, the ALP Industrial Real Estate Investment Trust (ALP I-REIT) announced the results of its restricted offer, with the announcement made on 5th March 2026 following the conclusion of the offer period. The offer, priced at USD 1.0 per unit, raised USD 29.6 mn against a USD 30.0 mn target, translating to a 98.5% subscription rate, well above the minimum success threshold of USD 11.0 mn. Investor demand was further boosted by InfraCo Africa’s commitment to invest an additional USD 5.0 mn in a pipeline asset, bringing the effective subscription level to 115.2%;
On the Unquoted Securities Platform, Acorn D-REIT and I-REIT traded at Kshs 27.4 and Kshs 23.2 per unit, respectively, as per the last updated data on 6th March 2026. The performance represented a 33.4% and 14.5% gain for the D-REIT and I-REIT, respectively, from the Kshs 20.0 inception price. The volumes traded for the D-REIT and I-REIT came in at 13.4 mn and 42.0 mn shares, respectively. Additionally, ILAM Fahari I-REIT traded at Kshs 11.0 per share as of 6th March 2026 representing a 45.0% loss from the Kshs 20.0 inception price;
Focus of the Week
In 2025, we published the Nairobi Metropolitan Area Commercial Office Report 2024 themed ‘Supply-Heavy Market’. The report provided an in-depth analysis of the sector's performance in 2024, along with insights into future prospects and investment opportunities. According to the report, the sector experienced notable improvements, with the average rental yield improving by 0.1% points to 7.8% in FY’2024 from 7.7% recorded in FY’2023, due to improved occupancy and rental rates. Average asking rents per SQFT in the NMA increased by 1.7% to Kshs 105 per SQFT from Kshs 103, owing to economic recovery which boosted business confidence and operations. The overall occupancy rates increased by 1.2% points to 80.7% from 79.5% as a result of a slow but rising demand for physical space. Also, the report noted that, Gigiri emerged as the top-performing node, boasting an average rental yield of 8.8%, surpassing the market average of 7.8% by 1.0% points. The Nairobi Metropolitan Area (NMA) commercial office sector experienced a consistent oversupply of office space, amounting to 5.7 million square feet (SQFT), a figure lower to that of 2023 by 5.8 million square feet (SQFT). This decrease in the supply can be primarily be contributable to decrease in vacancy rates by 0.4% points to 19.3% in 2024 from 19.7% in 2023. In 2026, we update our previous research with the Commercial Office Report 2025 themed From Oversupply to selective Demand, in order to determine the market’s performance and analyse the ongoing trends.
Investment Updates:
- Weekly Rates: Cytonn Money Market Fund closed the week at a yield of 11.4 % p.a. To invest, dial *809# or download the Cytonn App from Google Play store here or from the Appstore here;
- We continue to offer Wealth Management Training every Tuesday, from 7:00 pm to 8:00 pm. The training aims to grow financial literacy among the general public. To register for any of our Wealth Management Trainings, click here;
- If interested in our Private Wealth Management Training for your employees or investment group, please get in touch with us through wmt@cytonn.com;
- Cytonn Insurance Agency acts as an intermediary for those looking to secure their assets and loved ones’ future through insurance namely; Motor, Medical, Life, Property, WIBA, Credit and Fire and Burglary insurance covers. For assistance, get in touch with us through insuranceagency@cytonn.com;
- Cytonn Asset Managers Limited (CAML) continues to offer pension products to meet the needs of both individual clients who want to save for their retirement during their working years and Institutional clients that want to contribute on behalf of their employees to help them build their retirement pot. To more about our pension schemes, kindly get in touch with us through pensions@cytonn.com;
Hospitality Updates:
- We currently have promotions for Staycations. Visit cysuites.com/offers for details or email us at sales@cysuites.com;
Money Markets, T-Bills Primary Auction:
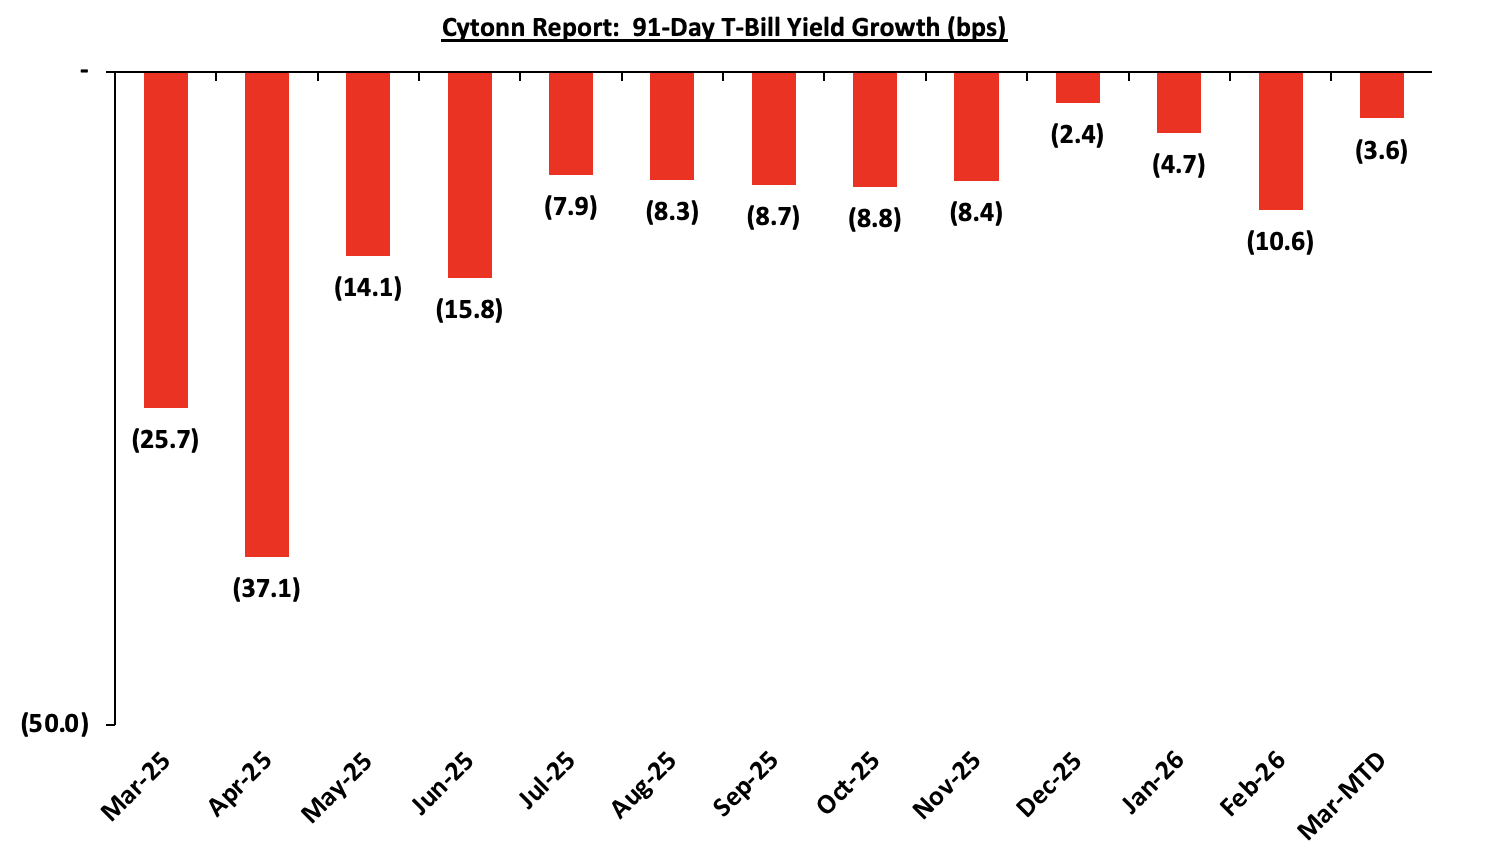
This week, T-bills were oversubscribed for the sixth consecutive week, with the overall subscription rate coming in at 418.4%, higher than the subscription rate of 243.9% recorded the previous week. Investors’ preference for the shorter 91-day paper waned, with the paper receiving bids worth Kshs 1.9 bn against the offered Kshs 4.0 bn, translating to a subscription rate of 48.7%, significantly lower than the subscription rate of 308.5%, recorded the previous week. The subscription rate for the 182-day paper increased significantly to 151.6% from the 7.9% recorded the previous week, while that of the 364-day paper increased to 833.2% from 454.0% recorded the previous week. The government accepted a total of Kshs 41.4 bn worth of bids out of Kshs 100.4 bn bids received, translating to an acceptance rate of 41.2%. The yields on the government papers registered a mixed performance where the yields on the 182-day papers increased by 2.2 bps to 7.82% from the 7.80% recorded the previous week. However, the yields on the 364-day paper decreased the most by 14.6 bps to 8.6% from 8.8% recorded the previous week, while the yields on the 91-day paper decreased by 0.1 bps to remain relatively unchanged at 7.6% in comparison to last week. The chart below shows the yield growth rate for the 91-day paper from January 2024 to date:
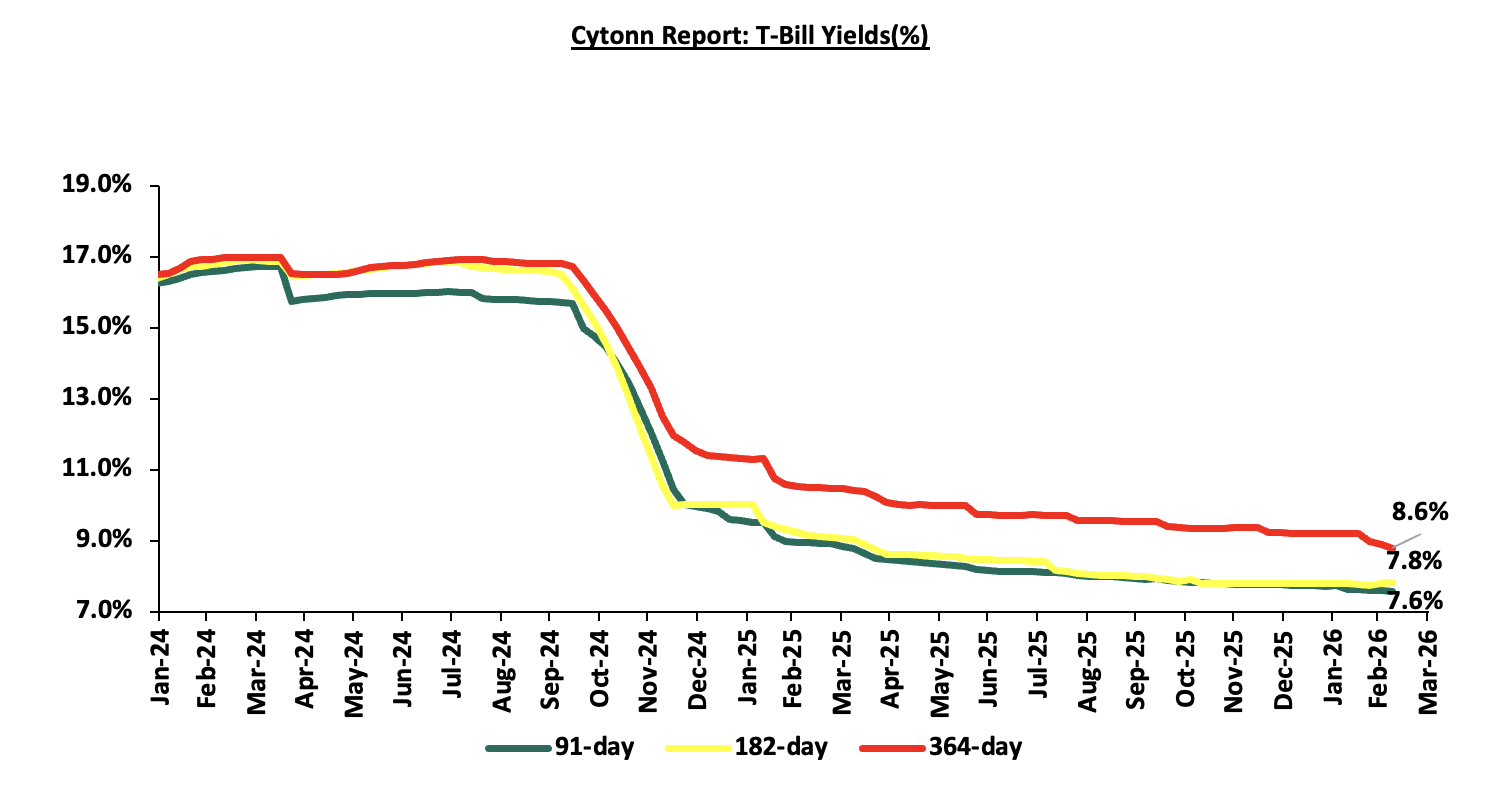
The chart below shows the performance of the 91-day, 182-day and 364-day papers from March 2025 to March 2026:
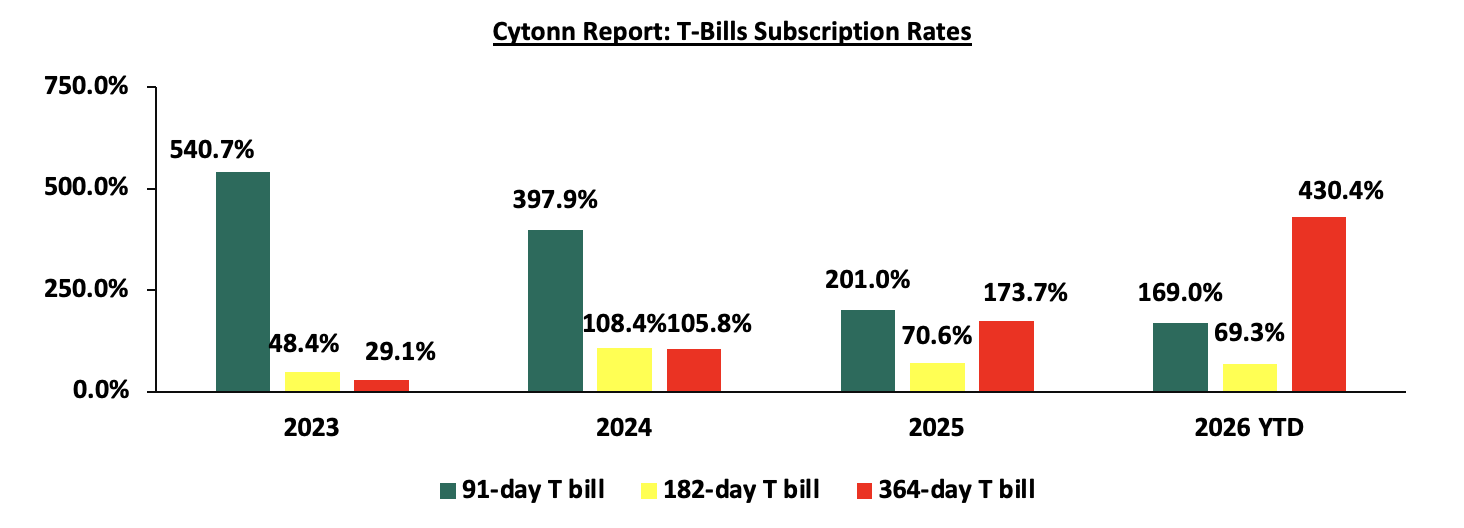
The chart below compares the overall average T-bill subscription rates obtained in 2023, 2024, 2025 and 2026 Year-to-date (YTD):
Money Market Performance:
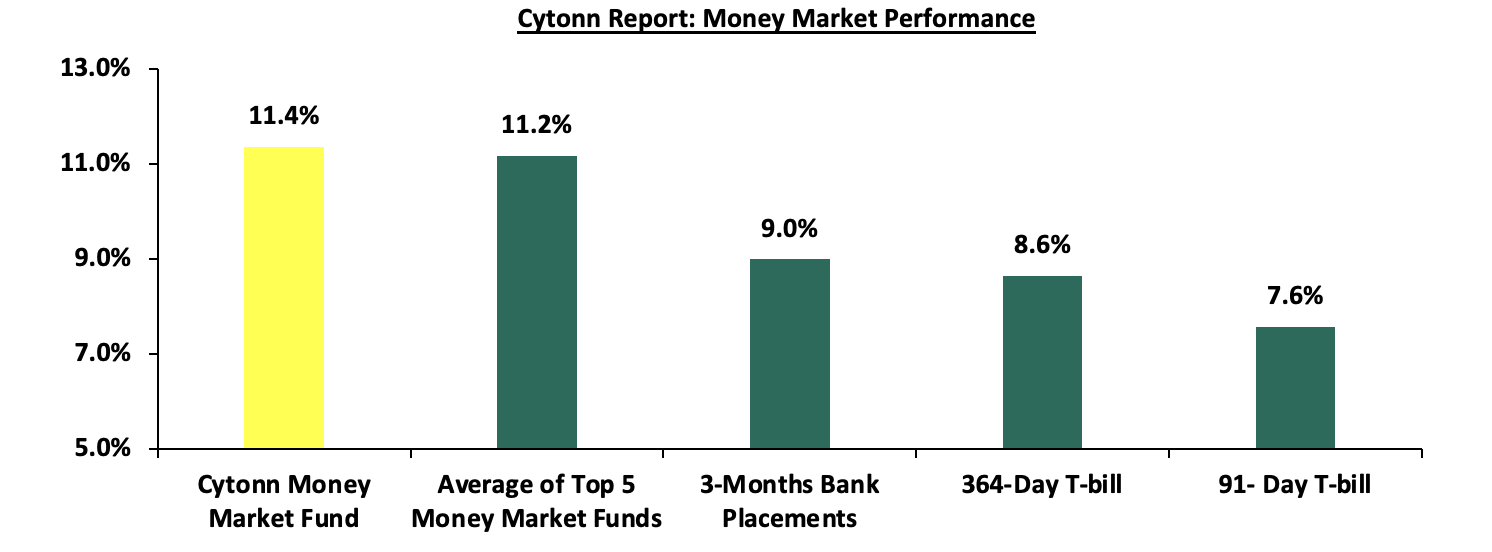
In the money markets, 3-month bank placements ended the week at 9.0% (based on rates offered by various banks), while yields on government papers recorded a downward performance, with the 364-day paper declining by 14.6 bps to 8.6% from 8.8% recorded the previous week, and the 91-day paper decreasing marginally by 0.1 bps to remain relatively unchanged at 7.6% in comparison to last week. The yield on the Cytonn Money Market Fund decreased by 22.0 bps to 11.4% from 11.6% recorded the previous week, while the average yields on the Top 5 Money Market Funds decreased by 15.6 bps to 11.2% from 11.3% recorded the previous week.
The table below shows the Money Market Fund Yields for Kenyan Fund Managers as published on 6th March 2026:
|
Money Market Fund Yield for Fund Managers as published on 6th March 2026 |
||
|
Rank |
Fund Manager |
Effective Annual Rate |
|
1 |
Cytonn Money Market Fund (Dial *809# or download Cytonn App) |
11.4% |
|
2 |
Gulfcap Money Market Fund |
11.4% |
|
3 |
Nabo Africa Money Market Fund |
11.3% |
|
4 |
Arvocap Money Market Fund |
11.0% |
|
5 |
Enwealth Money Market Fund |
10.7% |
|
6 |
Lofty-Corban Money Market Fund |
10.7% |
|
7 |
Ndovu Money Market Fund |
10.5% |
|
8 |
Kuza Money Market fund |
10.4% |
|
9 |
Jubilee Money Market Fund |
10.3% |
|
10 |
Madison Money Market Fund |
10.1% |
|
11 |
Old Mutual Money Market Fund |
10.1% |
|
12 |
Etica Money Market Fund |
10.1% |
|
13 |
British-American Money Market Fund |
9.9% |
|
14 |
Faulu Money Market Fund |
9.9% |
|
15 |
Orient Kasha Money Market Fund |
9.9% |
|
16 |
Dry Associates Money Market Fund |
9.7% |
|
17 |
GenAfrica Money Market Fund |
9.5% |
|
18 |
SanlamAllianz Money Market Fund |
9.3% |
|
19 |
KCB Money Market Fund |
9.2% |
|
20 |
Genghis Money Market Fund |
9.1% |
|
21 |
Apollo Money Market Fund |
8.5% |
|
22 |
CIC Money Market Fund |
8.5% |
|
23 |
CPF Money Market Fund |
8.4% |
|
24 |
Co-op Money Market Fund |
8.4% |
|
25 |
ICEA Lion Money Market Fund |
8.3% |
|
26 |
Mali Money Market Fund |
8.1% |
|
27 |
Absa Shilling Money Market Fund |
7.3% |
|
28 |
Mayfair Money Market Fund |
7.0% |
|
29 |
Ziidi Money Market Fund |
6.1% |
|
30 |
AA Kenya Shillings Fund |
5.9% |
|
31 |
Stanbic Money Market Fund |
5.6% |
|
32 |
Equity Money Market Fund |
5.1% |
Source: Business Daily
Liquidity:
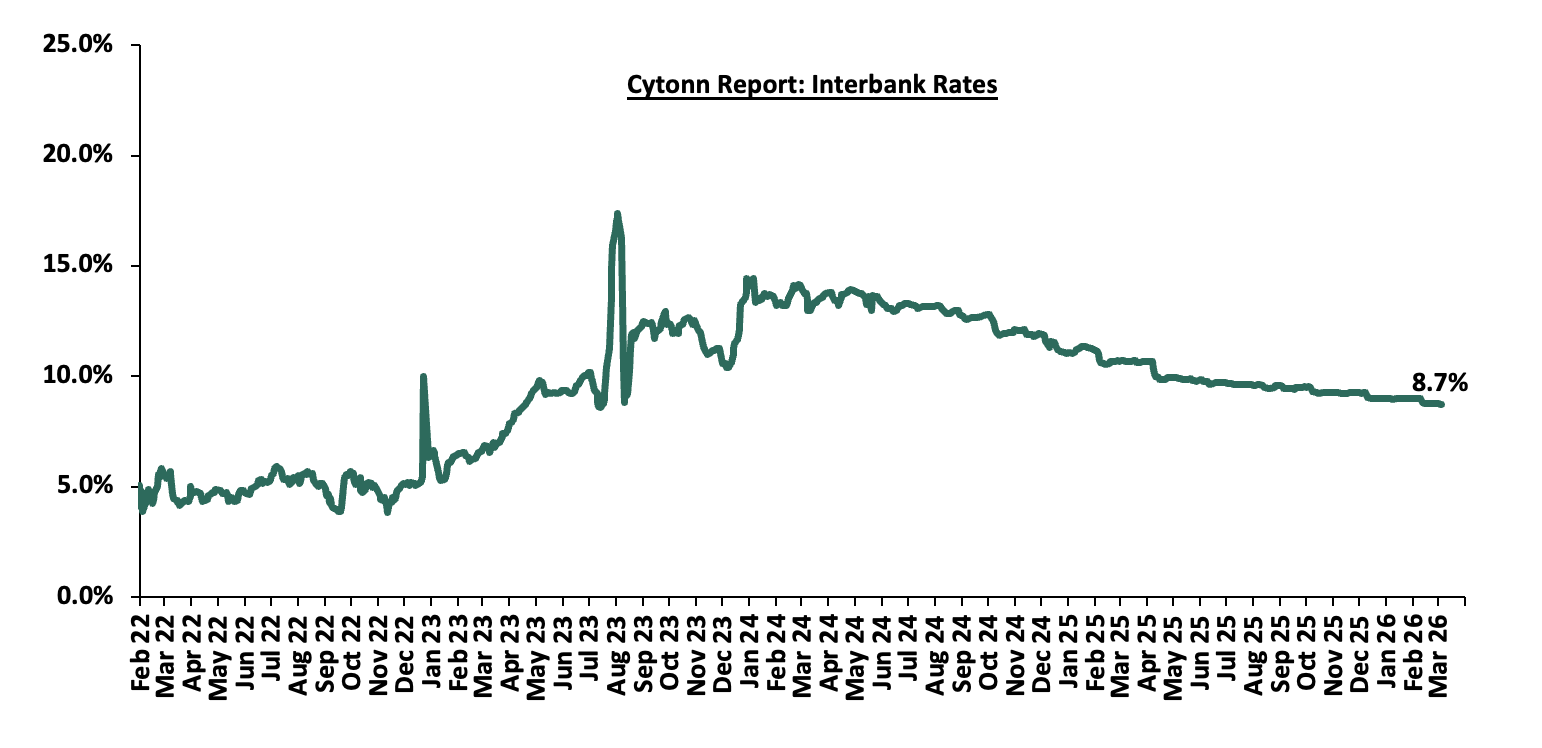
During the week, liquidity in the money markets eased with the average interbank rate decreasing by 2.9 bps to 8.7% from 8.8% recorded the previous week, partly attributable to government payments that offset tax remittances. The average interbank volumes traded decreased by 2.2% to Kshs 8.8 bn from Kshs 9.0 bn recorded the previous week. The chart below shows the interbank rates in the market over the years:
Kenya Eurobonds:
During the week, the yields on the Eurobonds were on an upward trajectory with the yield on the 12-year Eurobond issued in 2019, increasing the most by 63.0 bps to 7.7% from 7.0% recorded the previous week respectively. The table below shows the summary performance of the Kenyan Eurobonds as of 5th March 2026;
|
Cytonn Report: Kenya Eurobonds Performance |
||||||
|
|
2018 |
2019 |
2021 |
2024 |
||
|
Tenor |
10-year issue |
30-year issue |
12-year issue |
13-year issue |
7-year issue |
|
|
Amount Issued (USD) |
1.0 bn |
1.0 bn |
1.0 bn |
1.5 bn |
1.5 bn |
|
|
Years to Maturity |
2.5 |
22.5 |
8.8 |
5.5 |
10.5 |
|
|
Yields at Issue |
7.3% |
8.3% |
6.2% |
10.4% |
9.9% |
|
|
2-Jan-26 |
6.1% |
8.8% |
7.2% |
7.8% |
7.1% |
|
|
26-Feb-26 |
5.9% |
8.9% |
7.0% |
8.1% |
6.9% |
|
|
27-Feb-26 |
6.0% |
9.0% |
7.1% |
8.1% |
6.9% |
|
|
02-Mar-26 |
6.1% |
9.1% |
7.2% |
8.3% |
7.1% |
|
|
03-Mar-26 |
6.4% |
9.3% |
7.6% |
8.7% |
7.5% |
|
|
04-Mar-26 |
6.2% |
9.2% |
7.6% |
8.5% |
7.4% |
|
|
05-Mar-26 |
6.4% |
9.3% |
7.7% |
8.6% |
7.5% |
|
|
Weekly Change |
0.5% |
0.4% |
0.6% |
0.5% |
0.6% |
|
|
MTD Change |
0.3% |
0.2% |
0.4% |
0.3% |
0.3% |
|
|
YTD Change |
0.3% |
0.5% |
0.5% |
0.8% |
0.4% |
|
Source: Central Bank of Kenya (CBK) and National Treasury
Kenya Shilling:
During the week, the Kenya Shilling depreciated by 12.4 bps against the US Dollar, to Kshs 129.2 from the Kshs 129.0 recorded the previous week. On a year-to-date basis, the shilling has appreciated by 10.1 bps against the dollar, lower than the 22.9 bps appreciation recorded in 2025.
We expect the shilling to be supported by:
- Diaspora remittances standing at a cumulative USD 5,020.7 mn in the twelve months to January 2026, 1.2% higher than the USD 4,960.2 mn recorded over the same period in 2025. These have continued to cushion the shilling against further depreciation. In the January 2026 diaspora remittances figures, North America remained the largest source of remittances to Kenya accounting for 51.3% in the period, and,
- Tourism inflows, which strengthened significantly. Tourism receipts reached Kshs 560.0 bn in 2025, up from Kshs 452.2 bn in 2024, representing a 23.9% increase, supported by improved international arrivals through the country’s major airports, and,
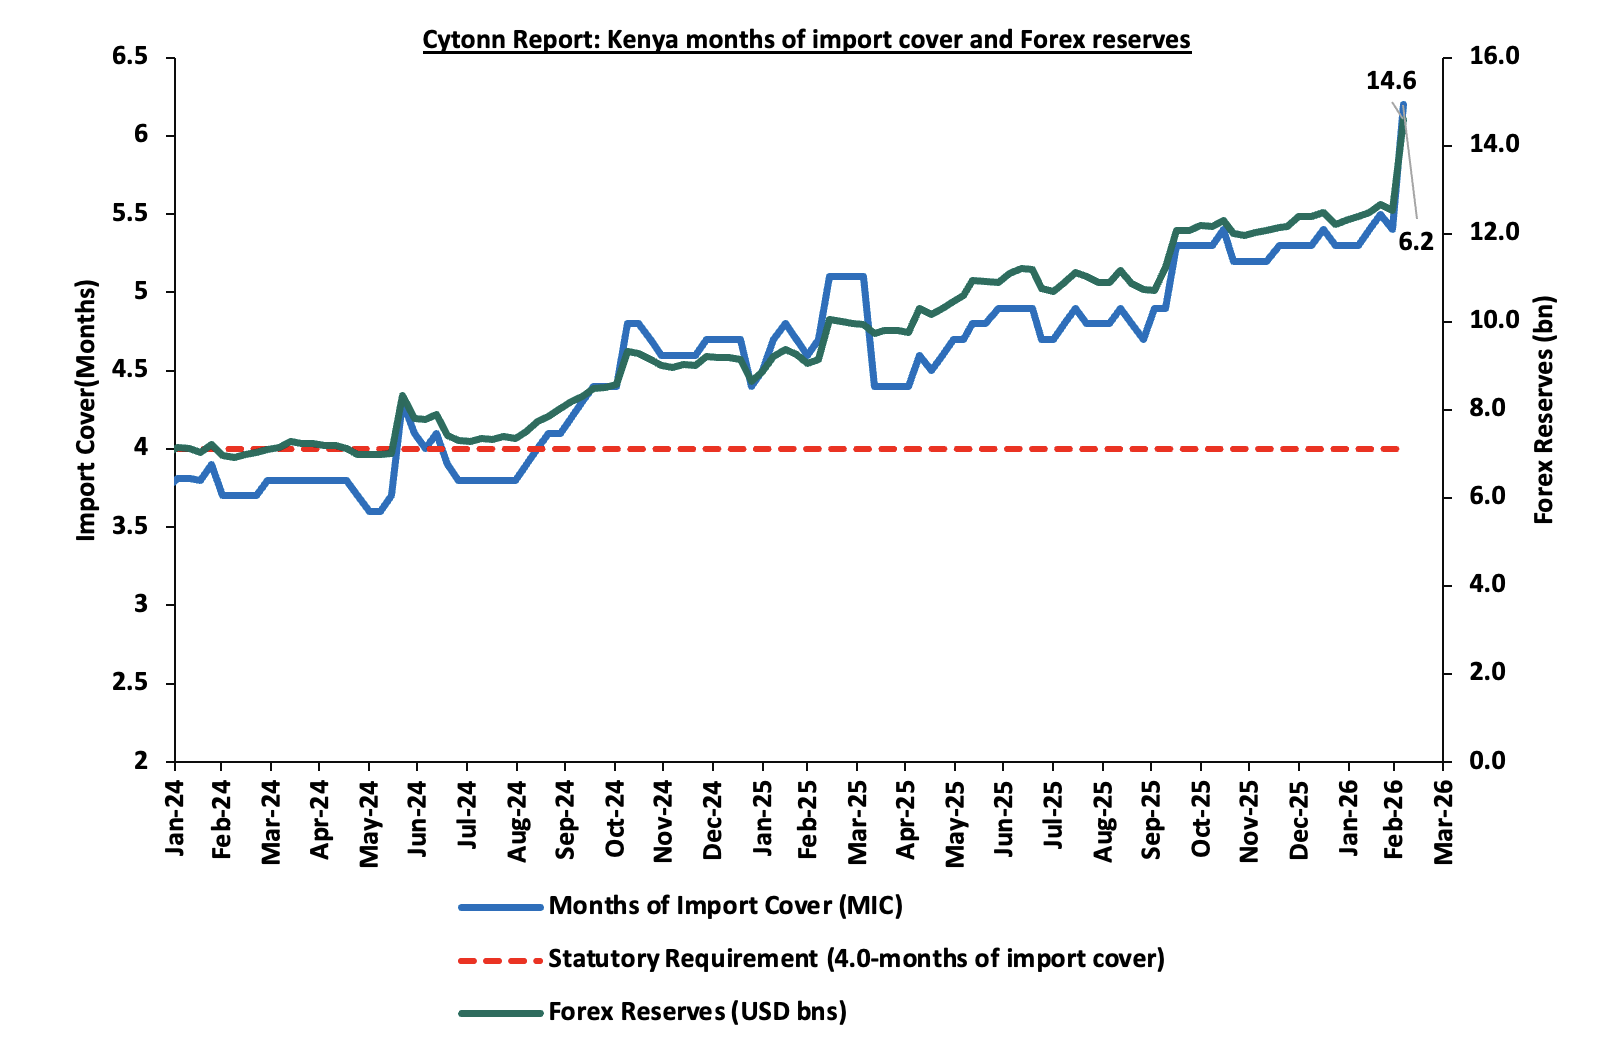
- Improved forex reserves currently at USD 14.6 bn (equivalent to 6.2-months of import cover), which is above the statutory requirement of maintaining at least 4.0-months of import cover and above the EAC region’s convergence criteria of 4.5-months of import cover.
The shilling is however expected to remain under pressure in 2026 as a result of:
- An ever-present current account deficit which came at 2.2% of GDP in the twelve months to October 2025, and,
- The need for government debt servicing, continues to put pressure on forex reserves given that 52.0% of Kenya’s external debt is US Dollar-denominated as of September 2025.
Kenya’s forex reserves increased by 16.4% during the week to USD 14.6 bn from the USD 12.5 bn recorded the previous week, equivalent to 6.2 months of import cover, and above the statutory requirement of maintaining at least 4.0-months of import cover. This is attributable to Eurobond buyback offer, continued strong diaspora remittance inflows, and foreign exchange purchases by the Central Bank of Kenya and reserve accumulation amid relatively stable currency conditions in Kenya.
The chart below summarizes the evolution of Kenya's months of import cover over the years:
Weekly Highlights
- Stanbic Bank’s February 2026 Purchasing Manager’s Index (PMI)
During the week, Stanbic Bank released its monthly Purchasing Manager’s Index (PMI), Kenya’s Purchasing Managers’ Index (PMI) stood at 50.4 in February 2026, remaining above the 50.0 expansion threshold for the sixth consecutive month, although lower than 51.9 in January and the 55.0 peak recorded in November, indicating that business activity continues to expand but at a slower pace. Growth was supported by marginal growth in output, new orders, and sustained employment creation, with demand in construction, wholesale and retail and services sectors remaining resilient even as the agriculture and manufacturing sectors softened. At the same time, input and output prices continued to rise, largely driven by taxation, higher operating costs and increased competition, highlighting emerging cost pressures. Overall, the data points to moderate but easing economic expansion heading into 2026. The chart shows Kenya's Purchasing Manager's Index for the last 24 Months
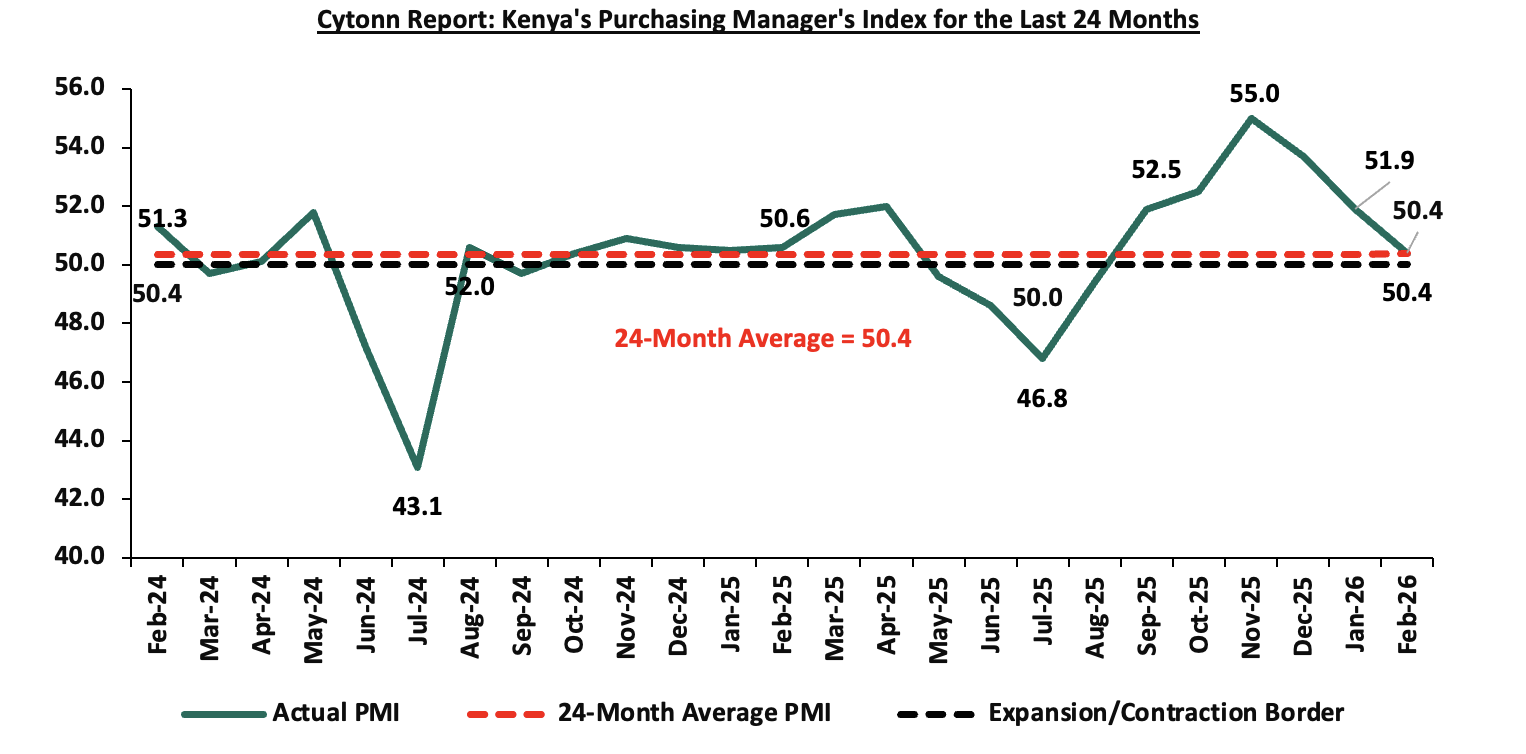
Going forward, the business environment is expected to remain supportive in the short to medium term, underpinned by strengthening demand conditions, improved supply chain performance, and a more accommodative monetary policy stance following the Central Bank of Kenya’s rate cut to 8.75% in February 2026 and the prospect of further easing. However, rising input costs driven by operating costs and tax concerns, and subdued consumer purchasing power are expected to weigh on business profitability and overall growth. Overall, the private sector recovery is expected to continue, though with emerging headwinds in the months ahead.
- Proposed Changes to CMA Licencing Fees
The Capital Markets Authority (CMA) has proposed licensing regulations which would significantly alter the regulatory cost structure for Fund Managers in Kenya. The proposed regulatory changes introduce an asset-based licensing fee model in which fund managers would pay 0.05% of AUM annually instead of a uniform flat fee. The framework includes safeguards such as a minimum fee of Kshs 100,000 and a maximum cap of Kshs 15.0 mn to balance the burden across smaller and larger firms. However, the shift is expected to significantly increase regulatory contributions from large fund managers, who could collectively pay hundreds of millions of shillings each year. For a more detailed analysis, please see our Proposed Changes to CMA Licensing Fees Note.
- Supplementary Budget FY’2025/2026
On 4th March 2026, the National Treasury presented the Supplementary Budget for the Fiscal Year 2025/26 to the National Assembly revealing plans to increase the gross total supplementary budget by 7.4% to Kshs 4,6181.6 bn, from Kshs 4,301.9 bn in the June budget. For a more detailed analysis, please see our Supplementary Budget FY’2025/2026 Note.
Rates in the Fixed Income market have been on a downward trend due to high liquidity in the money market which allowed the government to front load most of its borrowing. The government is 108.3% ahead of its prorated net domestic borrowing target of Kshs 634.8 bn, having a net borrowing position of Kshs 911.7bn (inclusive of T-bills). However, we expect a stabilization of the yield curve in the short and medium term, with the government looking to increase its external borrowing to maintain the fiscal surplus, hence alleviating pressure in the domestic market. As such, we expect the yield curve to stabilize in the short to medium-term and hence investors are expected to shift towards the long-term papers to lock in the high returns
Market Performance:
The equities market was on a downward trajectory, with NSE 20, NASI, NSE 10, and NSE-25 declining by 3.9%, 3.5%, 3.1% and 3.1% respectively, taking the YTD performance to gains of 14.8%, 12.6%, 11.3% and 11.2% for NSE 20, NSE 25, NSE 10 and NASI respectively. The equities market performance was mainly driven by losses recorded by large cap stocks such as ABSA, SCBK and NCBA of 6.4%, 6.1% and 4.9% respectively. However, the performance was supported by gains recorded by large cap stocks such as Cooperative Bank and DTB-K of 2.7% and 1.5% respectively.
Also, during the week, the banking sector index lost by 3.1% to 238.3 from 245.9 recorded the previous week. This is attributable to losses recorded by stocks such as ABSA, SCBK and NCBA of 6.4%, 6.1% and 4.9% respectively. The performance was supported by gains recorded by stocks such as Cooperative Bank and DTB-K of 2.7% and 1.5% respectively.
During the week, equities turnover decreased by 20.6% to USD 39.4 mn from USD 49.6 mn recorded the previous week, taking the YTD total turnover to USD 332.1 mn. Foreign investors remained net sellers for the sixth consecutive week with a net selling position of USD 4.3 mn, from a net selling position of USD 7.1 mn recorded the previous week, taking the YTD foreign net selling position to USD 39.3 mn, compared to a net selling position of USD 92.9 mn recorded in 2025.
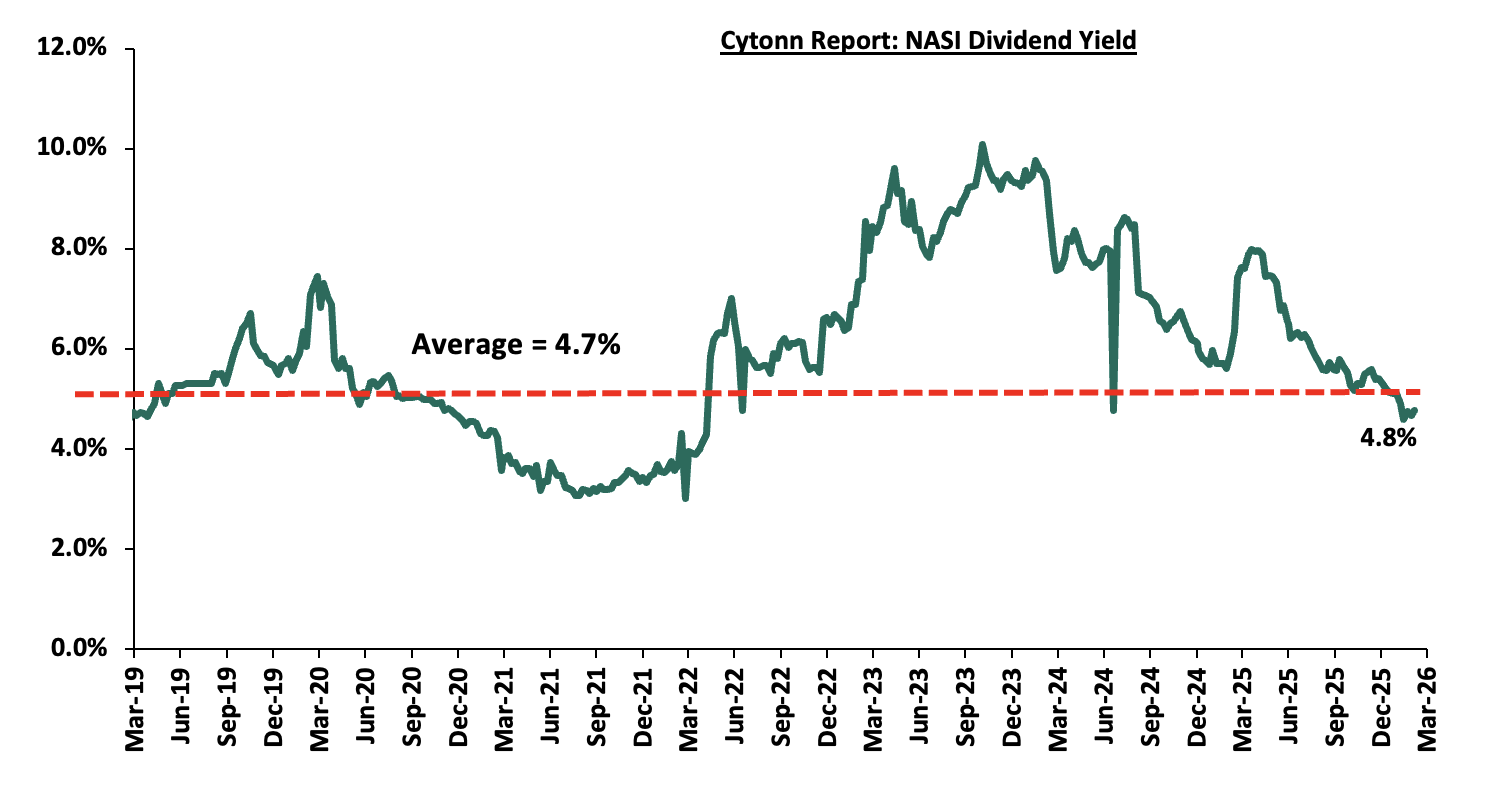
The market is currently trading at a price to earnings ratio (P/E) of 7.8x, 31.1% below the historical average of 11.3x. The dividend yield stands at 4.8%, 0.1% points above the historical average of 4.7. Key to note, NASI’s PEG ratio currently stands at 1.0x, suggesting that the market is fairly valued relative to its expected earnings growth. A PEG ratio greater than 1.0x indicates the market may be overvalued while a PEG ratio less than 1.0x indicates that the market is undervalued.
The charts below indicate the historical P/E and dividend yields of the market.
Universe of Coverage:
|
Cytonn Report: Equities Universe of Coverage |
|||||||||||
|
Company |
Price as at 27/02/2026 |
Price as at 06/03/2026 |
w/w change |
YTD Change |
Year Open 2026 |
Target Price* |
Dividend Yield |
Upside/ Downside** |
P/TBv Multiple |
Recommendation |
|
|
I&M Group |
51.0 |
49.6 |
(2.8%) |
15.8% |
42.8 |
57.4 |
6.1% |
21.8% |
0.9x |
Buy |
|
|
NCBA |
92.5 |
88.0 |
(4.9%) |
3.5% |
85.0 |
101.3 |
6.3% |
21.4% |
1.5x |
Buy |
|
|
Standard Chartered Bank |
362.3 |
340.3 |
(6.1%) |
13.5% |
299.8 |
366.6 |
13.2% |
21.0% |
2.1x |
Buy |
|
|
Equity Group |
77.3 |
74.5 |
(3.6%) |
11.2% |
67.0 |
84.1 |
5.7% |
18.6% |
1.3x |
Accumulate |
|
|
Britam |
13.0 |
11.6 |
(10.4%) |
28.0% |
9.1 |
13.5 |
0.0% |
16.4% |
1.2x |
Accumulate |
|
|
ABSA Bank |
32.2 |
30.2 |
(6.4%) |
21.3% |
24.9 |
33.0 |
6.8% |
16.3% |
2.1x |
Accumulate |
|
|
KCB Group |
80.3 |
77.5 |
(3.4%) |
17.9% |
65.8 |
86.9 |
3.9% |
16.1% |
1.0x |
Accumulate |
|
|
CIC Group |
5.4 |
4.9 |
(8.4%) |
8.1% |
4.5 |
5.5 |
2.6% |
14.7% |
1.5x |
Accumulate |
|
|
Diamond Trust Bank |
154.8 |
157.0 |
1.5% |
36.8% |
114.8 |
170.0 |
4.5% |
12.7% |
0.5x |
Accumulate |
|
|
Co-op Bank |
29.2 |
30.0 |
2.7% |
25.5% |
23.9 |
31.9 |
5.0% |
11.2% |
1.2x |
Accumulate |
|
|
Stanbic Holdings |
256.5 |
255.0 |
(0.6%) |
29.0% |
197.8 |
262.4 |
8.1% |
11.0% |
1.6x |
Accumulate |
|
|
Jubilee Holdings |
374.5 |
378.8 |
1.1% |
17.4% |
322.5 |
380.0 |
3.6% |
3.9% |
0.6x |
Lighten |
|
|
*Target Price as per Cytonn Analyst estimates **Upside/ (Downside) is adjusted for Dividend Yield ***Dividend Yield is calculated using FY’2024 Dividends |
|
||||||||||
Weekly Highlights
- Earnings Releases:
- Absa Bank Kenya’s FY’2025 Performance
Below is a summary of Absa’s FY’2025 performance
|
Balance Sheet |
FY'2024 (Kshs bn) |
FY'2025 (Kshs bn) |
y/y change |
|
Government Securities |
130.6 |
157.7 |
20.7% |
|
Net Loans and Advances |
309.1 |
312.2 |
1.0% |
|
Total Assets |
506.5 |
537.6 |
6.2% |
|
Customer Deposits |
367.1 |
372.4 |
1.4% |
|
Deposit per Branch |
4.8 |
4.4 |
(8.2%) |
|
Total Liabilities |
421.3 |
437.1 |
3.8% |
|
Shareholder's Funds |
85.2 |
100.5 |
18.0% |
|
Balance sheet ratios |
FY'2024 |
FY'2025 |
% points change |
|
Loan to Deposit Ratio |
84.2% |
83.8% |
(0.4%) |
|
Govt Securities to Deposit ratio |
35.6% |
42.3% |
6.8% |
|
Return on average equity |
27.0% |
24.7% |
(2.4%) |
|
Return on average assets |
4.1% |
4.4% |
0.3% |
|
Income Statement |
FY'2024 (Kshs bn) |
FY'2025 (Kshs bn) |
y/y change |
|
Net Interest Income |
46.2 |
43.3 |
(6.4%) |
|
Net non-Interest Income |
16.1 |
18.1 |
12.2% |
|
Total Operating income |
62.3 |
61.4 |
(1.6%) |
|
Loan Loss provision |
(9.1) |
(6.2) |
(31.8%) |
|
Total Operating expenses |
(32.6) |
(28.6) |
(12.2%) |
|
Profit before tax |
29.7 |
32.7 |
10.1% |
|
Profit after tax |
20.9 |
22.9 |
9.7% |
|
Core EPS |
3.84 |
4.22 |
9.7% |
|
Dividend per share |
1.75 |
2.05 |
17.1% |
|
Dividend Yield |
9.2% |
6.8% |
(2.4%) |
|
Dividend Payout Ratio |
45.5% |
48.6% |
3.1% |
|
Income statement ratios |
FY'2024 |
FY'2025 |
% points change |
|
Yield from interest-earning assets |
14.2% |
12.2% |
(2.0%) |
|
Cost of funding |
4.5% |
3.5% |
(1.0%) |
|
Net Interest Spread |
4.7% |
3.4% |
(1.3%) |
|
Net Interest Margin |
10.1% |
9.1% |
(1.0%) |
|
Cost of Risk |
14.6% |
10.1% |
(4.5%) |
|
Net Interest Income as % of operating income |
74.2% |
70.6% |
(3.6%) |
|
Non-Funded Income as a % of operating income |
25.8% |
29.4% |
3.6% |
|
Cost to Income |
52.3% |
46.7% |
(5.7%) |
|
Cost to Income (Without LLPs) |
37.7% |
36.5% |
(1.2%) |
|
Cost to Assets |
4.6% |
4.2% |
(0.5%) |
|
Capital Adequacy Ratios |
FY'2024 |
FY'2025 |
% points change |
|
Core Capital/Total Liabilities |
19.9% |
22.3% |
2.4% |
|
Minimum Statutory ratio |
8.0% |
8.0% |
0.0% |
|
Excess |
11.9% |
14.3% |
2.4% |
|
Core Capital/Total Risk Weighted Assets |
17.0% |
18.3% |
1.3% |
|
Minimum Statutory ratio |
10.5% |
10.5% |
0.0% |
|
Excess |
6.5% |
7.8% |
1.3% |
|
Total Capital/Total Risk Weighted Assets |
20.7% |
21.0% |
0.3% |
|
Minimum Statutory ratio |
14.5% |
14.5% |
0.0% |
|
Excess |
6.2% |
6.5% |
0.3% |
|
Liquidity Ratio |
42.5% |
45.6% |
3.1% |
|
Minimum Statutory ratio |
20.0% |
20.0% |
0.0% |
|
Excess |
22.5% |
25.6% |
3.1% |
Key Take-Outs:
- Increased earnings - Core earnings per share grew by 9.7% to Kshs 4.2, from Kshs 3.8 in FY’2024, driven by the 12.2% decrease in total operating expense to Kshs 28.6 bn, from Kshs 32.6 bn in FY’2024. However, the performance was weighed down by a 1.6% decrease in total operating income to Kshs 61.4 bn from Kshs 62.3 bn in FY’ 2024,
- Improved asset quality – The bank’s Asset Quality improved , with Gross NPL ratio decreasing to 11.5% in FY’2025, from 12.6% in FY’2024, attributable to a 8.4% decrease in Gross non-performing loans to Kshs 38.9 bn, from Kshs 42.5 bn in FY’2024 and decrease in gross loans to Kshs 337.3 bn, from Kshs 337.1 bn recorded in FY’2024, relative to the 8.4% increase in interest suspense to Kshs 7.8 bn from Kshs 7.2 bn recorded in FY’2024.
- Expanded Balanced sheet - The balance sheet recorded an expansion as total assets increased by 6.2% to Kshs 537.6 bn, from Kshs 506.5 bn in FY’2024, mainly driven by a 20.7% increase in governments securities holdings to Kshs 157.7 bn, from 130.6 bn in FY’2024. Net loans and advances increased by 1.0% to Kshs 312.2 bn, from Kshs 309.1 bn in FY’2024.
- Increased Government Holdings – Government Securities increased by 20.7% to Kshs 157.7 bn from Kshs 130.6 bn recorded in FY’2024. This is attributable to a conscious shift towards government securities amid the interest rate environment.
For a more detailed analysis, please see our Absa Bank Kenya FY’2025 Earnings Note
- KPC IPO Results
During the week, the Kenya Pipeline Company (KPC) IPO results were released, showing that the offer was oversubscribed by 105.7%, with investors subscribing for 12.5 bn shares worth Kshs 112.4 bn against 11.8 bn shares worth Kshs 106.3 bn offered at Kshs 9.0 per share. The IPO, which opened on 19th January 2026, offered 65% of the company’s stake offered to the public and is set to be listed on the NSE’s Main Investment Market Segment.
Key take-outs from the results include:
- Local institutional investors including National Social Security Fund emerged as the largest shareholder block, accounting for 41.0% of the allocation, equivalent to 7.5 bn shares.
- The Government of Kenya retained a 35.0% stake post‑IPO with 6.4 bn shares.
- East African Community (EAC) investors secured 21.2% of the allocation, equivalent to 3.9 bn shares, largely driven by participation from Ugandan National Oil company and the Rwandan pension industry.
- Retail investors (Kenyan individuals) were allocated approximately 464.8 mn shares, representing about 2.6% of the allocation, while foreign investors received 3.9 mn shares, accounting for a marginal 0.02% stake.
- Due to the absence of a greenshoe option, Kshs 6.1 billion will be refunded from the oversubscription.
- Overall, Kenyan investors (institutional and retail) secured 67.0% of the offered shares, equivalent to 7.9 bn shares, highlighting strong domestic participation in the IPO.
The tables below represent summary of the KPC IPO results:
|
Cytonn Report: Summary of the KPC IPO results |
|
|
Offer Price (Kshs) |
9.0 |
|
Shares Offered (Kshs bn) |
11.8 |
|
Shares Received (Kshs bn) |
12.5 |
|
Subscription Rate |
105.7% |
|
Amount Targeted (Kshs bn) |
106.3 |
|
Amounts Received (Kshs bn) |
112.4 |
|
Amounts to be refunded (Kshs bn) |
6.1 |
Source: www.kpc.co.ke
|
Cytonn Report: KPC IPO Shares Allocation |
||||
|
Investors Pools |
Number of Shares |
% of Total Shares |
Number of Shares Post IPO |
Stake in KPC Post IPO |
|
Kenyan Institutional Investors |
2,362,528,870 |
13.0% |
7,450,143,476 |
41.0% |
|
Government of Kenya |
6,360,654,650 |
35.0% |
6,360,654,650 |
35.0% |
|
EAC Investors |
2,362,528,870 |
13.0% |
3,857,024,178 |
21.2% |
|
Kenyan Retail Investors |
2,362,528,870 |
13.0% |
464,826,004 |
2.6% |
|
Oil Marketing Companies |
1,771,896,653 |
9.8% |
25,762,222 |
0.1% |
|
KPC Employees: ESOP |
590,632,217 |
3.2% |
11,020,520 |
0.1% |
|
Foreign Investors |
2,362,528,870 |
13.0% |
3,867,950 |
0.02% |
|
Total |
18,173,299,000 |
100.0% |
18,173,299,000 |
100.0% |
Source: www.kpc.co.ke
The offer period, originally set to close on 19th February 2026, was extended to 24th February 2026 to accommodate additional investor demand. The oversubscription reflects robust confidence from institutional and regional investors in KPC as a strategic infrastructure asset. However, retail participation remained low, likely due to liquidity constraints or cautious sentiment among individual investors. While the extension of the offer period demonstrated responsiveness to investor demand, the lack of a greenshoe option limited the government’s ability to fully absorb excess subscriptions. As the transaction largely involved the government divesting a 35.0% stake, the Kshs 106.3 bn raised will primarily accrue to the Government of Kenya to support its fiscal financing needs under the national budget framework. A significant portion of these proceeds is expected to be channeled into the National Infrastructure Fund, which finances strategic infrastructure projects such as transport corridors, energy infrastructure, water systems, and other large-scale public investments aimed at supporting long-term economic growth. Overall, the IPO represents a significant milestone in broadening ownership of strategic assets and deepening Kenya’s capital markets.
Following the allocation announcement on 4th March 2026, the government and transaction advisors will complete final payments, electronic crediting of shares to investor CDS accounts, and refunds on 6th March 2026. Thereafter, KPC shares are scheduled to begin trading on the Nairobi Securities Exchange (NSE) on 10th March 2026, allowing investors to trade and monitor the company’s performance as it transitions into a partially privatized, regionally owned energy infrastructure entity.
We maintain a “cautiously optimistic” short-term outlook supported primarily earnings-led attractive valuations, lower yields on short-term government papers and expected global and local economic recovery, and, “neutral” in the long term as persistent foreign investor outflows continue to constrain market liquidity and limit broad-based market re-rating. With the market currently trading at par to its future growth (PEG Ratio at 1.0x), where performance will be driven by company-specific fundamentals rather than general market direction, we believe that investors should reposition towards value stocks exhibiting strong earnings growth, attractive dividend yields, solid balance sheets, sustainable competitive advantages and trading at compelling discounts to their intrinsic value. While foreign investor sell-offs are expected to continue exerting pressure in the near term, we believe this will create selective entry opportunities for long-term investors.
- Statutory Reviews
- The Architects Bill, 2026
During the week we reviewed, the Architects Bill, 2026, which seeks to establish a revised legal framework for regulating the architectural profession in Kenya. Currently, architects are regulated under the Architects and Quantity Surveyors Act, which establishes the Board of Registration of Architects and Quantity Surveyors (BORAQS) as the body responsible for regulating both architects and quantity surveyors. The proposed Bill introduces a separate institutional framework dedicated specifically to architects. The Bill therefore seeks to reform professional regulation by establishing new governance institutions, revising registration requirements, strengthening disciplinary oversight and introducing stricter enforcement mechanisms against unlicensed architectural practice. These reforms represent a structural shift from the current joint regulatory framework to a dedicated governance structure for the architectural profession.
Here are the key highlights from the Bill;
- Institutional governance & structure: The Bill establishes an Architects Councilas the central regulatory authority responsible for overseeing the architectural profession in Kenya. The Council is composed of eight members, including a Chairperson with at least fifteen years of experience, six elected architects (where at least two must have over fifteen years of experience), and the Executive Director serving ex-officio. The Council is vested with the powers to manage the Institute’s assets and funds, approve budgets, and oversee the registration process. It further holds the authority to adjudicate professional misconduct, delegate regulatory functions to committees, and ensure full compliance with the provisions governing architectural practice.
The Bill also establishes the Institute of Architects, which would function as the professional body responsible for promoting professional competence within the architectural profession. The criteria for membership require an individual to be a registered architect or architectural technician who possesses prescribed academic qualifications from a recognized university. Membership is contingent upon the fulfillment of Continuous Professional Development (CPD) programs and the payment of prescribed annual fees.
In addition, the Bill establishes an Architects Examinations Board. The Board is granted the powers to regulate the professional examination syllabus, conduct and supervise examinations for graduate architects, and evaluate the standards of architectural degree programs. It is also empowered to certify the practical experience of candidates to ensure they meet the rigorous benchmarks required for entry into the profession.
-
Registration and licensing requirements: The Bill establishes a registration committee which serves as the operational arm responsible for the entry of professionals into the register. Its membership consists of a Chairperson and members appointed by the Council. The committee is granted the powers to review all applications for registration, verify academic and professional credentials, and recommend to the Council the issuance or denial of practicing certificates. It is also empowered to maintain and update the various categories of registers for architects, technicians, and firms, ensuring that only qualified individuals are authorized to operate.
The Bill also provides for the registration of architectural firms. A firm may only be registered if at least one partner or director is a registered architect holding a valid practicing certificate.
The Bill further defines the scope of architectural practice to include activities such as designing buildings, preparing architectural plans and specifications, inspecting construction works, and providing urban planning or landscape services. In addition, the Bill provides circumstances under which registration may be refused or revoked. These include cases where an individual has been convicted of fraud, declared bankrupt, found guilty of professional misconduct or legally determined to be of unsound mind.
-
Disciplinary framework & quality assurance: To strengthen professional accountability, the Bill establishes a Professional Conduct Committee responsible for investigating complaints against registered architects and determining disciplinary action and sanctions where misconduct is established. These sanctions include suspension of a practising certificate, cancellation of a practicing certificate, imposition of fines or removal of an architect’s name from the professional register. The Bill also provides mechanisms for appeal, allowing individuals affected by disciplinary decisions to challenge those decisions through the legal procedures provided under the Act.
-
Financial provisions & funding: The Bill establishes a clear financial framework to ensure the Institute and the Council have the resources necessary to execute their mandates. The sources of funding include application and registration fees, annual subscription fees paid by members, and fees charged for the issuance of practising certificates. Additionally, the Institute is empowered to receive grants, gifts, or donations from the government and other lawful sources, as well as revenue generated from architectural competitions and continuous professional development programs.
-
Legal penalties & enforcement: The Bill introduces stricter enforcement provisions aimed at preventing unlicensed architectural practice and protecting the integrity of the profession. A person who practices architecture without being registered or who falsely represents themselves as a registered architect commits an offence and may be liable to a fine not exceeding Kshs 5.0 mn, imprisonment for a term not exceeding three years, or both. The Bill also imposes penalties for individuals who make false or fraudulent entries in the professional register or related records, with such offences attracting a fine not exceeding Kshs 1.0 mn or imprisonment for a term not exceeding two years, or both. In addition, where an offence is committed under the Act and no specific penalty is prescribed, the Bill provides a general penalty of a fine not exceeding Kshs 1.0 mn or imprisonment for a term not exceeding one year, or both.
-
Transition & impact analysis: If enacted, the Bill would introduce a transition from the existing regulatory framework under the Architects and Quantity Surveyors Act to a new institutional structure specifically governing architect. The establishment of the Architects Council, Institute of Architects and Architects Examinations Board would require administrative restructuring as well as transitional arrangements for architects currently registered under Board of Registration of Architects and Quantity Surveyors (BORAQS). Practitioners and firms operating within the architectural sector may therefore need to comply with revised licensing, registration and regulatory procedures once the new law takes effect. The new bill also seeks to reduce building collapses and accidents caused by poor designs from unqualified individuals.
From an industry perspective, the proposed reforms may strengthen oversight within the construction sector by ensuring that building design and project supervision are undertaken by properly qualified professionals. By strengthening enforcement against unlicensed practice, the reforms may also contribute to improving professional accountability in the built environment sector. However, the establishment of additional regulatory institutions may introduce new administrative processes for licensing, certification and professional development within the profession. These changes may increase compliance requirements for practitioners and architectural firms.
-
Key Policy Concerns: The Bill introduces a comprehensive regulatory framework aimed at strengthening governance of the architectural profession. The establishment of dedicated institutions responsible for regulation, professional development and professional examinations has the potential to enhance professional standards and improve oversight within the sector. However, the creation of multiple institutions, namely the Architects Council, the Institute of Architects and the Architects Examinations Board, may increase regulatory complexity within the profession. Practitioners may be required to interact with several bodies for registration, professional certification and continuous professional development, potentially increasing administrative requirements for architectural firms. The reforms may also have indirect implications for construction costs. Architectural services form part of the professional consultancy costs associated with construction projects. Additional licensing requirements, certification processes and professional compliance obligations may increase the administrative costs associated with architectural practice. Where these costs are incorporated into professional service fees charged to developers, they may contribute to marginal increases in project design costs and, consequently, the overall cost of construction.
Overall, the Bill represents a significant reform in the governance of the architectural profession. Its effectiveness will depend on the efficient operationalization of the proposed institutions and the establishment of clear transitional arrangements for practitioners currently operating under the existing regulatory framework.
- Residential Sector
- Affordable housing levy target raised to Kshs 97.0 bn
During the week, the government revised upwards the projected collections from the Affordable Housing Levy for the current financial year to Kshs 97.0 bn, up from the earlier estimate of Kshs 95.0 bn, reflecting stronger compliance and enforcement of the statutory deductions from pay slips. The upward revision follows Kshs 73.2 bn collected in the 2024/25 financial year, surpassing the Kshs 63.2 bn originally projected, and represents a 32.5% increase over the previous year’s collections. The levy, which faced initial legal challenges for being limited to formal-sector workers, was amended under the Affordable Housing Act 2024 to include informal sector employees, allowing deductions to resume.
We expect the increased levy collections to accelerate the delivery of affordable housing units across key urban centres, support construction activity, and stimulate demand for residential real estate, while creating a more predictable pipeline of projects for developers and contractors in the sector.
- Infrastructure Sector
- Land acquisition and funding for Naivasha-Kisumu SGR extension
During the week, the National Treasury and Kenya Railways Corporation (KRC) ramped up the expansion of the Standard Gauge Railway (SGR) from Naivasha to Malaba via Kisumu, with the Treasury allocating an additional Kshs 14.0 bn. This brings the total allocation for the current financial year to Kshs 30.0 bn, complementing a broader financing plan that includes a Kshs 390.0 bn securitized bond and foreign investment. To facilitate the 263.7-kilometre Phase 2B corridor, KRC announced plans to acquire over 5,000 acres of land through the National Land Commission (NLC), which will deploy digital data collection to ensure transparent compensation. The project, estimated at a total cost of Kshs 502.9 bn, will feature a branch line to the Kisumu port and is designed to improve last-mile connectivity while coordinating with Uganda’s SGR development from Tororo to Malaba.
We expect the SGR expansion to boost demand for land along the corridor, increase development activity in Kisumu County and surrounding towns, and support industrial, logistics, and commercial real estate growth due to improved connectivity between Nairobi, Kisumu, and regional trade hubs.
- KURA advances Kshs 7.6 bn Outer Ring Road BRT line 5 Project
During the week, the Kenya Urban Roads Authority (KURA) commenced implementation of the Kshs 7.6 bn Outer Ring Road Bus Rapid Transit (BRT) Line 5 project, with contract signing for the 10.5 kilometer corridor from Allsops to Taj Mall completed on 4th March 2026. The project, which will feature a two-lane dedicated bus corridor, 13 BRT stations, three river bridges, two overpasses, footbridge modifications, street lighting, landscaping, and drainage works, is expected to be completed within two years. The Outer Ring BRT is part of a broader five-line network designed to transform Nairobi’s transport infrastructure, improve public transit efficiency, and reduce congestion along key urban routes.
The previous BRT initiatives, most notably the Line 2 (Simba Line) on Thika Superhighway, stalled primarily due to persistent funding shortfalls and the government’s failure to settle billions in pending bills with contractors. Institutional hurdles, including a lack of a clear legal framework for the Nairobi Metropolitan Area Transport Authority (NAMATA) and resistance from the existing matatu industry, further hampered progress. Additionally, early attempts were criticized for poor infrastructure design, such as merely painting lanes without constructing the necessary specialized stations or footbridges, leading to a loss of momentum and public confidence.
We expect the project to enhance accessibility along the Outer Ring Road, supporting commercial and mixed-use development, increasing land values, and creating opportunities for transit-oriented real estate investment along the corridor.
- Mixed Use Developments
- KRA plans large-scale Real Estate expansion through PPP model
During the week, the Kenya Revenue Authority (KRA) announced plans for a major real estate expansion to provide a conducive working environment to KRA staff while accommodating additional recruitment of staff from 8,523 in the year 2024 to 14,583 by the end of the year 2025. The development will include data centres, warehouses, offices, housing, laboratories, and training facilities, and will be implemented under a Public-Private-Partnership (PPP) model using a build-operate-and-transfer structure. Currently, KRA holds 82 properties across the country, but the expansion seeks to optimize existing estates, reduce rental expenses, and provide supportive infrastructure for operational efficiency and automation initiatives.
We expect the planned expansion to stimulate demand for real estate services in key urban and peri-urban centers, create opportunities for PPP-based property development, and set a benchmark for institutional-led mixed-use developments targeting staff housing, offices, and specialized facilities.
- Real Estate Investments Trusts
- ALP Industrial Real Estate Investment Trust (ALP I-REIT) restricted offer results
During the week, the ALP Industrial Real Estate Investment Trust (ALP I-REIT) announced the results of its restricted offer, with the announcement made on 5th March 2026 following the conclusion of the offer period. The offer, priced at USD 1.0 per unit, raised USD 29.6 mn against a USD 30.0 mn target, translating to a 98.5% subscription rate, well above the minimum success threshold of USD 11.0 mn. Investor demand was further boosted by InfraCo Africa’s commitment to invest an additional USD 5.0 mn in a pipeline asset, bringing the effective oversubscription level to 115.2%. Additionally, the promoter, Africa Logistics Properties Holdings (ALPH), received 10.4 mn units in exchange for transferring three initial logistics properties into the REIT, bringing the total number of units expected to list on the Nairobi Securities Exchange (NSE) to 40.0 mn, with trading scheduled to commence on 11th March 2026.
The strong uptake reflects growing investor appetite for industrial and logistics Real Estate, a segment benefiting from expanding e-commerce, manufacturing activity, and regional trade logistics. Kenya’s Grade-A warehousing market, particularly around Nairobi’s logistics corridor, continues to attract institutional capital due to relatively strong occupancy rates and stable rental performance compared to the office and retail sectors.
Currently, only a few REITs are listed on the NSE, including the ILAM Fahari I-REIT and the Acorn D-REIT and I-REIT, with trading activity remaining relatively thin. We expect the successful uptake and listing of the ALP I-REIT, Kenya’s first industrial-focused REIT, to deepen the country’s still nascent REIT market, while increasing investor access to income-generating logistics real estate, a sector supported by structural growth in supply chain and distribution infrastructure.
- REITs Weekly Performance
On the Unquoted Securities Platform, Acorn D-REIT and I-REIT traded at Kshs 27.4 and Kshs 23.2per unit, respectively, as per the last updated data on 6th March 2026. The performance represented a 33.4% and 14.5% gain for the D-REIT and I-REIT, respectively, from the Kshs 20.0 inception price. The volumes traded for the D-REIT and I-REIT came in at 13.4 mn and 42.0 mn shares, respectively. Additionally, ILAM Fahari I-REIT traded at Kshs 11.0 per share as of 6th March 2026 representing a 45.0% loss from the Kshs 20.0 inception price. The volume traded to date came in at 1.2 mn shares for the I-REIT.
REITs offer various benefits, such as tax exemptions, diversified portfolios, and stable long-term profits. However, the ongoing decline in the performance of Kenyan REITs and the restructuring of their business portfolios are hindering significant previous investments. Additional general challenges include:
- Insufficient understanding of the investment instrument among investors leading to a slower uptake of REIT products,
- Lengthy approval processes for REIT creation,
- High minimum capital requirements of Kshs 100.0 mn for REIT trustees compared to Kshs 10.0 mn for pension funds Trustees, essentially limiting the licensed REIT Trustee to banks only
- The rigidity of choice between either a D-REIT or and I-REIT forces managers to form two REITs, rather than having one Hybrid REIT that can allocate between development and income earning properties
- Limiting the type of legal entity that can form a REIT to only a trust company, as opposed to allowing other entities such as partnerships, and companies,
- We need to give time before REITS are required to list, they would be allowed to stay private for a few years before the requirement to list given that not all companies maybe comfortable with listing on day one, and,
- Minimum subscription amounts or offer parcels set at Kshs 0.1 mn for D-REITs and Kshs 5.0 mn for restricted I-REITs. The significant capital requirements still make REITs relatively inaccessible to smaller retail investors compared to other investment vehicles like unit trusts or government bonds, all of which continue to limit the performance of Kenyan REITs.
We expect the performance of Kenya’s real estate sector to remain resilient, supported by several factors: i) Extension of SGR to Malaba and Kisumu ii) KRA Plans Large-Scale Real Estate Expansion Through PPP Model, iii. Strong Performance of ALP I-REIT restricted offer, iv. Increase in affordable housing due to increase in funding from the affordable housing levy. However, challenges such as rising construction costs, infrastructure constraints, weak investor appetite in listed REITs such as ILAM Fahari I-REIT, oversupply in select real estate classes, and high capital demands will continue to impede the sector’s optimal performance.
In 2025, we published the Nairobi Metropolitan Area Commercial Office Report 2024 themed ‘Supply-Heavy Market’. The report provided an in-depth analysis of the sector's performance in 2024, along with insights into future prospects and investment opportunities. According to the report, the sector experienced notable improvements, with the average rental yield improving by 0.1% points to 7.8% in FY’2024 from 7.7% recorded in FY’2023, due to improved occupancy and rental rates. Average asking rents per SQFT in the NMA increased by 1.7% to Kshs 105 per SQFT from Kshs 103, owing to economic recovery which boosted business confidence and operations. The overall occupancy rates increased by 1.2% points to 80.7% from 79.5% as a result of a slow but rising demand for physical space. Also, the report noted that, Gigiri emerged as the top-performing node, boasting an average rental yield of 8.8%, surpassing the market average of 7.8% by 1.0% points. Westlands followed closely as the second-best performing node, achieving an average rental yield of 8.5%. Karen secured the third position with an average rental yield of 8.3%. The Nairobi Metropolitan Area (NMA) commercial office sector experienced a consistent oversupply of office space, amounting to 5.7 million square feet (SQFT), a figure lower to that of 2023 by 5.8 million square feet (SQFT). This decrease in the supply can be primarily be contributable to decrease in vacancy rates by 0.4% points to 19.3% in 2024 from 19.7% in 2023.
However, despite the persistent oversupply, there was a notable decline in the average office vacancy rate, decreasing from 19.3% in 2024 to 15.3% in 2025. Consequently, the increased demand led to higher absorption rates of both new and existing developments throughout 2025, even with the introduction of 0.6 mn SQFT of office space.
This week, we update our previous research with the Commercial Office Report 2025 themed From Oversupply to selective Demand, in order to determine the market’s performance and analyse the ongoing trends, by looking at the following:
- Overview of the Commercial Office Sector,
- Commercial Office Supply in the Nairobi Metropolitan Area,
- Commercial Office Performance, by Location and by Grades, and,
- Office Market Outlook and the Investment Opportunity in the Sector.
Section I: Overview of the Commercial Office Sector
In 2025, the commercial office market across the Nairobi Metropolitan Area experienced a surge in activity compared to 2024. This growth was primarily driven by a rising demand for office spaces and a significant uptick in development projects led by property developers. Additionally, an increasing appetite for convenience has bolstered the appeal of co-working office arrangements, as evidenced by a growing number of developments offering fully serviced offices. A range of factors has collectively spurred this robust market performance, including:
- Business resurgence: The ongoing post-COVID-19 recovery led to increased business activities, boosting demand for commercial office spaces. This surge contributed to higher occupancy rates and improved rental yields, encouraging the development of new office complexes and the refurbishment of existing ones to meet the growing demand.
- Rise of flexible workspaces: Serviced offices and co-working spaces continued to gain popularity in Kenya due to their convenience and flexibility. These spaces offered cost-effective and adaptable solutions for entrepreneurs and small businesses, appealing to both tenants and investors.
- Demand for premium and sustainable spaces: The entry of multinational corporations (MNCs) into Kenya heightened the demand for premium Grade A office spaces with a focus on sustainability. MNCs preferred developments that provided high-quality work environments incorporating Environmental, Social, and Governance (ESG) features, including green technology. Developers recognized that green buildings offered a competitive market advantage and aligned with sustainable business practices, making them more attractive than traditional office spaces.
- Nairobi's strategic positioning: Nairobi maintained its status as a key investment destination for multinational corporations (MNCs) in the region. The establishment of regional offices by organizations such as the Commonwealth Enterprise and Investment Council (CWEIC) underscored Nairobi’s role as East Africa’s business hub, attracting international organizations. This positioning enhanced the commercial office sector's appeal for investment compared to other regional cities.
- Favorable demographic trends: Kenya’s urbanization rate stood at 2.8%, surpassing the global average of 1.4%, according to the World Bank as of 2024. Rapid urban growth fueled demand for office spaces as more individuals migrated to urban centers in search of employment opportunities and a better quality of life. This trend was expected to persist, supported by ongoing government initiatives to promote urbanization and infrastructure development.
- Return-to-Office policies: Mandated in-person work reduced vacancy rates to 15.7% and increased occupancy rates to 84.7%, reinforcing demand for physical office space amid evolving hybrid work models.
- Economic recovery & business confidence: Kenya’s 2025 GDP growth hit 4.9% in Q3’2025 up from 4.2% in Q3’2024. With Inflation at 4.5% and a CBR cut to 9.00% boosted business confidence and spurred office leasing.
Conversely, the sector continues to face setbacks such as;
- Oversupply of office space: In 2025, the Nairobi Metropolitan Area continued to face an excess supply of office space, surpassing current demand levels and resulting in an oversupply of 3.4 mn SQFT. This 40.4% decrease from the 5.7 mn recorded in 2024 can be attributed to delayed delivery of office supply which is estimated at 2.5 mn SQFT which is scheduled for 2027/2028. Despite this decrease, this surplus has contributed to prolonged vacancy rates, prompting developers to adopt a cautious "wait-and-see" approach regarding new construction projects until the surplus office space is absorbed. Nairobi has long grappled with an oversupply of office space, exacerbated by escalating capital costs, further contributing to developers' cautious stance towards new investments,
Section II: Commercial Office Supply in the Nairobi Metropolitan Area
In 2025, there was introduction of five new office projects that contributed up to 0.6 mn SQFT of office supply to the commercial office market. These developments comprised the 761 Lenana Rd in Kilimani, Eneo in Tatu City, Purple tower in Mombasa Road, Matrix One and the Mandrake in Westlands. Meanwhile, there are plans for an additional 0.1 mn SQFT of space to be introduced into the market in 2026. This upcoming supply includes projects such as The Angelo in Lavington and 227 Brookside. The table below shows some of the notable office completions during the review period as well as incoming spaces:
|
Cytonn Report: Nairobi Metropolitan Area Commercial Office Space Supply |
|||||||
|
|
Major Commercial Office Space Supply in 2025 |
Major incoming Commercial Office Completion in 2026 |
|||||
|
# |
Development |
Location |
Size (SQFT) |
# |
Development |
Location |
Size (SQFT) |
|
1 |
|
|
|
1 |
277 Brookside |
Westlands |
70,000 |
|
2 |
Eneo |
Tatu City |
74,120 |
2 |
The Angelo |
Lavington |
42,000 |
|
3 |
The Mandrake |
Westlands |
120,000 |
|
|
|
|
|
4 |
Matrix One |
Westlands |
108,000 |
|
|
|
|
|
5 |
Purple Tower |
Msa Rd |
197,800 |
|
|
|
|
|
Total |
627,420 |
Total |
|
112,000 |
|||
Source: Cytonn Research, Knight Frank
In 2025, the Nairobi Metropolitan Area (NMA) commercial office sector experienced a consistent oversupply of office space, amounting to 3.4 mn SQFT, a figure lower to that of 2024 at 5.7 Mn SQFT which represents 40.4% decrease. This decrease in the supply can be primarily be contributable to decrease in vacancy rates by 4.0% points to 15.3% in 2025 from 19.3% in 2024. Increase in occupancy rates was supported by factors such as market recovery from the global pandemic which has seen companies and organizations abolish remote working. Consequently, there was heightened demand which led to faster absorption rates of both new and existing developments throughout 2025, even with the introduction of 0.6 Mn SQFT of office space into the market, a 14.2% decrease from the 0.7 Mn SQFT supplied in 2024. The oversupply is caused by the factors such as construction of new office spaces such as the purple tower in Mombasa Road, Matrix One and Mandrake in Westlands, which outpaced the occupancy and uptake of these spaces
Looking ahead, the release of 0.1 mn of office space in 2026 is expected to further increase the oversupply, however the improving economy will see rise to demand for new spaces as companies and organizations planning expansion balancing the supply-demand dynamics. The table below summarizes the commercial office space supply over time;
|
Cytonn Report: Nairobi Metropolitan Area Office Space Analysis |
||||||||||||||
|
Year |
2014 |
2015 |
2016 |
2017 |
2018 |
2019 |
2020 |
2021 |
2022 |
2023 |
2024 |
2025 |
|
|
|
Stock (Mn SQFT) |
15.4 |
22.9 |
28.9 |
31.8 |
35.5 |
36.3 |
36.4 |
36.8 |
37.4 |
37.1 |
37.8 |
37.6 |
|
|
|
Completions (Mn SQFT) |
5.9 |
7.8 |
6.5 |
3.5 |
4.3 |
1.5 |
0.8 |
0.5 |
0.6 |
0.3 |
0.6 |
0.6 |
|
|
|
Vacancy Rate (%) |
10.0% |
11.0% |
12.0% |
16.8% |
16.7% |
19.5% |
22.3% |
22.1% |
20.6% |
19.7% |
19.3% |
15.3% |
|
|
|
Vacant Stock (Mn SQFT) |
1.5 |
2.5 |
3.5 |
5.3 |
5.9 |
7.1 |
8.1 |
8.1 |
7.7 |
7.3 |
7.3 |
5.8 |
|
|
|
Occupied Stock (Mn SQFT) |
13.9 |
20.3 |
25.4 |
26.5 |
29.6 |
29.2 |
28.3 |
28.7 |
29.7 |
29.8 |
30.5 |
31.9 |
|
|
|
Net Absorption |
5.1 |
6.5 |
5.1 |
1 |
3.1 |
-0.4 |
-1 |
0.4 |
1 |
0.3 |
0.7 |
1.4 |
|
|
|
Demand |
5.3 |
6.8 |
5.6 |
1.6 |
3.7 |
0.4 |
-0.2 |
1.2 |
1.8 |
1.9 |
1.4 |
2.1 |
|
|
|
Available Supply, AS(T) |
6.5 |
8.8 |
8.4 |
6.3 |
9 |
6.7 |
7.1 |
7.9 |
7.6 |
7.7 |
7.2 |
5.6 |
|
|
|
Gap, GAP(T) |
(1.2) |
(2.1) |
(2.9) |
(4.7) |
(5.2) |
(6.3) |
(7.3) |
(6.7) |
(5.7) |
(5.8) |
(5.7) |
(3.4) |
|
|
Source: Cytonn Research/ Building Plan Approvals Data from the Nairobi City County
Section III: Commercial Office Performance, by Location and by Grades
The Commercial Office sector realized a 0.9%-points increase in average rental yields in 2025 to 8.9%, from 7.8% recorded in 2024 attributable to increased occupancy and rental rates. Average asking rents per SQFT in the Nairobi Metropolitan Area (NMA) increased by 5.7% to Kshs 111 per SQFT from Kshs 105 per SQFT in 2024. Additionally, occupancy rates increased by 4.0%-points to 84.7% from 80.7% achieved in 2024. The sector's improved performance can be attributed to various factors, including; i) the gradual resurgence of demand for physical spaces as more firms resumed full operations, ii) economic recovery which boosted business confidence and operations, iii) a more stable and favourable business environment post-COVID-19 era also played a role in the sector's improved performance. The table below summarizes the performance of the commercial office theme over time:
|
(All Values in Kshs Unless Stated Otherwise) |
||||||||||||
|
Cytonn Report: Commercial Office Performance Over Time |
||||||||||||
|
Year |
2015 |
2016 |
2017 |
2018 |
2019 |
2020 |
2021 |
2022 |
2023 |
2024 |
2025 |
y/y ∆ |
|
Occupancy (%) |
89.0% |
88.0% |
82.6% |
83.8% |
80.3% |
77.7% |
77.6% |
79.4% |
79.5% |
80.7% |
84.7% |
4.0% |
|
Asking Rents (Kshs/SQFT) |
97 |
97 |
101 |
101 |
96 |
93 |
94 |
96 |
103 |
105 |
111 |
5.7% |
|
Average Prices (Kshs/SQFT) |
12,776 |
12,031 |
12,649 |
12,407 |
12,638 |
12,280 |
12,106 |
12,223 |
12,673 |
12,677 |
12,718 |
0.3% |
|
Node Average Rental Yields (%) |
8.1% |
8.5% |
7.9% |
8.3% |
7.5% |
7.0% |
7.3% |
7.6% |
7.7% |
7.8% |
8.9% |
0.9% |
Source: Cytonn Research
- Commercial Office Performance by Nodes
For the purposes of submarket analysis, we categorized the primary office locations within the Nairobi Metropolitan Area into 9 major nodes; i) Nairobi CBD, ii) Westlands, covering environs including Riverside, iii) Parklands, iv) Mombasa Road, v) Thika Road, vi) Upperhill, vii) Karen, viii) Gigiri, and, ix) Kilimani, which includes offices in Kilimani, Kileleshwa and Lavington.
The table below shows the Nairobi Metropolitan Area (NMA) sub-market performance
|
All values in Kshs unless stated otherwise |
|||||||||||
|
Cytonn Report: Nairobi Metropolitan Area Commercial Office Market Performance FY’2025 |
|||||||||||
|
Area |
Price/SQFT FY 2024 |
Rent/SQFT FY 2024 |
Occupancy FY 2024 |
Rental Yields FY 2024 |
Price Kshs/ SQFT FY 2025 |
Rent Kshs/ SQFT FY 2025 |
Occupancy FY 2025 |
Rental Yield FY 2025 |
∆ in Rent |
∆ in occupancy |
∆ in Rental Yields (% points) |
|
Westlands |
12,448 |
119 |
80.4% |
8.5% |
12,370 |
124 |
82.2% |
9.8% |
4.2% |
1.8% |
1.3% |
|
Kilimani |
14,077 |
115 |
80.9% |
8.2% |
13,565 |
120 |
87.1% |
9.3% |
4.3% |
6.2% |
1.1% |
|
Parklands |
11,922 |
94 |
83.0% |
7.8% |
12,066 |
106 |
86.9% |
9.2% |
12.8% |
3.9% |
1.4% |
|
Nairobi CBD |
12,857 |
104 |
76.1% |
7.6% |
12,441 |
100 |
88.4% |
8.5% |
(3.8%) |
12.3% |
0.9% |
|
Gigiri |
14,850 |
131 |
82.6% |
8.8% |
14,950 |
126 |
82.2% |
8.4% |
(3.8%) |
(0.4%) |
(0.4%) |
|
Karen |
12,873 |
101 |
82.9% |
8.3% |
14,225 |
115 |
84.3% |
8.1% |
13.9% |
1.4% |
(0.2%) |
|
Upperhill |
12,206 |
92 |
86.6% |
7.9% |
13,086 |
102 |
85.4% |
7.9% |
10.9% |
(1.2%) |
0.0% |
|
Mombasa Rd |
11,325 |
80 |
72.2% |
6.5% |
11,065 |
87 |
80.1% |
7.7% |
8.7% |
7.9% |
1.2% |
|
Thika Road |
12,643 |
90 |
79.3% |
6.7% |
12,650 |
96 |
84.5% |
7.7% |
6.7% |
5.2% |
1.0% |
|
Average |
12,800 |
102.9 |
80.4% |
7.8% |
12,935 |
108.4 |
84.6% |
8.5% |
6.0% |
4.1% |
0.7% |
Source: Cytonn Research
Key take-outs from the table above include;
- In FY’2025, Westlands emerged as the top-performing node, boasting an average rental yield of 9.8%, surpassing the market average of 8.5% by 1.3% point. Kilimani followed closely as the second-best performing node, achieving an average rental yield of 9.3%. Parklands secured the third position with an average rental yield of 9.2%. The strong demand for premium office spaces and the attractiveness of investment opportunities in these areas can be attributed to several key factors: i) These locations feature a high concentration of top-tier office buildings that command premium rental rates and yields, ii) Landlords in these areas often prefer to collect rent in dollars, enhancing the investment appeal, iii) Well-developed infrastructure and abundant amenities add significant value to investments in these locations, iv) The presence of multinational corporations, and international organizations increases the demand for high-quality office spaces, and,
- On the contrary, Thika Road emerged as the least performing node in FY’2024, recording an average rental yield of 7.7%, which was 0.8%-points lower than the market average of 8.5%. Several factors contributed to this underperformance: i) The high prevalence of lower-quality office buildings in this area leads to lower average rental rates, typically around Kshs 96 per SQFT as compared to an average of Kshs 108 per SQF , ii) Thika Road is predominantly recognized as a residential zone, reducing its attractiveness to office-based businesses seeking commercial spaces, iii) Intense competition from other sub-markets further compounds the challenges Thika Road faces in attracting tenants and achieving higher rental yields.
- Commercial Office Performance by Class/Grade:
Commercial office buildings are categorized into three main classes based on the quality and sizes of office spaces as follows:
- Grade A: These are high quality office buildings characterized by their adequate amenities, facilities, and finishes. They therefore fetch higher rental rates and yields compared to other office types. Also, these office building sizes range from 100,001 - 300,000 SQFT,
- Grade B: These office buildings have their sizes ranging between 50,000 to 100,000 SQFT. They have good amenities and services, however not as good as Grade A offices, hence charge moderate rental rates, and,
- Grade C: These buildings are usually old, hence their lack of adequate services and facilities. Usually, they charge rents below the average market rate.
Based on our analysis of office grade distribution, Grade A offices dominated the office space market in the Nairobi Metropolitan Area during 2025, comprising 48.3% of the total market share. This reflects a marginal decrease of 0.9%-points from the 49.2% observed in 2024. This marginal decrease can be attributed to the reduced rate of completion of Grade A offices. Notably, the supply of Grade B office spaces increased by 0.9% to reach 44.1% from the previous 43.2% recorded in 2024, this decline is attributable increase in the number of the Grade B offices in the market competitively substituting Grade A offices
In our nodal analysis, Gigiri, Mombasa Road and Karen exhibited the highest proportion of Grade A offices, accounting for 79.0%, 73.5% and 62.5% respectively of their total office inventory. Conversely, Kilimani maintained the highest percentage of Grade B offices at 68.2%. Regarding Grade C offices, Nairobi CBD retained the highest share of office spaces, comprising 19.9% of the current market share, this has remained constant from 2024.
In terms of concentration, Westlands boasted the highest mix of office types, with Grade A, Grade B, and Grade C office spaces making up 55.4%, 34.6%, and 10.0% respectively of its total office inventory. The distribution of various office classes/grades is as summarized in the table below:
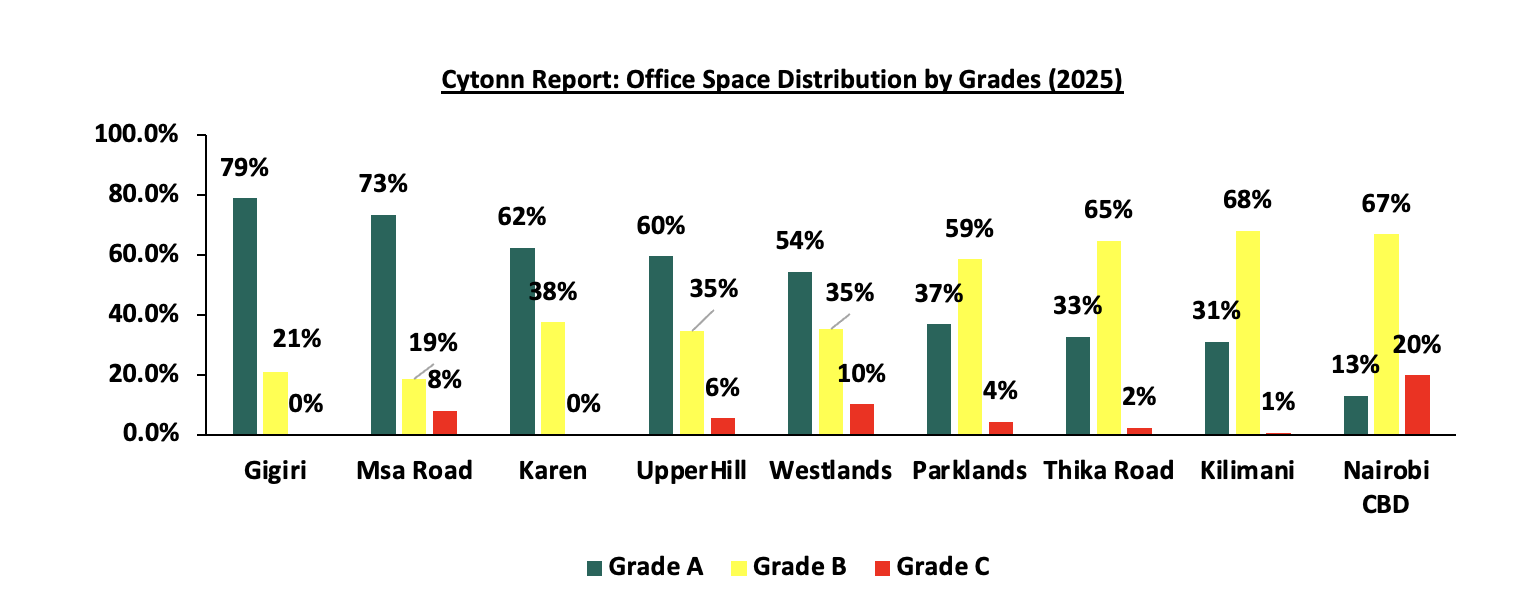
Source: Cytonn Research
In terms of performance;
- Grade A office spaces achieved the highest rental yields, reaching 9.3%, a 1.7%-point increase from the 7.6% recorded in 2024. The strong performance of Grade A offices can be attributed to their growing popularity among tenants, as evidenced by a 4.0% increase in occupancy rates. This rise is mainly due to their competitively affordable rental rates and quality compared to Grade B offices, which experienced a 3.6% increase in occupancy rates. Additionally, Grade A and B offices offer superior technical services compared to Grade C spaces. However, Grade C office spaces demonstrated a significant improvement in occupancy rates, increasing by 4.9% in 2025,
- Grade C offices saw the most substantial Year-on-Year (y/y) rise in rental rates, increasing by 14.5% in 2025 to Kshs 101.3 per SQFT from Kshs 88.5 per SQFT in 2024. This surge is credited to the affordability of Grade C spaces, which command higher occupancies, as well as heightened demand from the local top tier corporations and organizations, and,
- Grade A offices dominated the office space market in the Nairobi Metropolitan Area during 2025, comprising 49.2% of the total market share. Grade A offices decreased to 48.3% in 2025 a 0.9%-points decrease from the 49.2% observed in 2024. This decrease in Grade A offices spaces forced the landlords to increase the rents to remain competitive in the market as well as to attract more tenants as evidenced by slow increase in occupancy rates to 82.9% in 2024 from 78.9% in 2024.
The performance according to grades/class is as summarized in the table below:
|
(All Values in Kshs Unless Stated Otherwise) |
|||||||||||
|
Office Grade |
Price 2024 Kshs/SQFT |
Rent 2024 Kshs/SQFT |
Occupancy 2024 |
Rental Yield 2024 |
Price 2025 Kshs/SQFT |
Rent 2025 Kshs/SQFT |
Occupancy 2025 |
Rental Yield 2025 |
∆ Rent Y/Y |
∆ Occupancy Y/Y |
∆ Rental Yield Y/Y |
|
Grade A |
13,546 |
119.0 |
78.9% |
7.6% |
13,475 |
125.5 |
82.9% |
9.3% |
5.5% |
4.0% |
1.7% |
|
Grade B |
12,519 |
101.6 |
82.3% |
7.9% |
12,781 |
108.8 |
85.9% |
8.8% |
7.1% |
3.6% |
0.9% |
|
Grade C |
11,208 |
88.5 |
79.2% |
7.2% |
11,422 |
96.1 |
84.1% |
8.5% |
8.6% |
4.9% |
1.3% |
|
Average |
12,424 |
103 |
80.1% |
7.6% |
12,559 |
113 |
84.3% |
9.1% |
10.5% |
4.2% |
1.6% |
Source: Cytonn Research
- Commercial Office Performance by Class and Node:
In 2025, Grade A offices in Thika Road and Westlands achieved the highest average rental yields, reaching 12.0% and 10.5% respectfully. This was primarily due to; i) their strategic locations attract high-end clientele willing to pay premium rates, often in dollars, ii) the availability of adequate amenities and well-developed infrastructure enhances accessibility in these areas, iii) the serene environment provides an ideal office setting, away from the hustle and bustle of the city center. Grade C offices performed well in some nodes such as Nairobi CBD and Mombasa Road where they out performed Grade A rental yield. For instance; despite Grade A offices in Nairobi CBD charging higher rental rates at Kshs 120 per SQFT compared to Grade C offices' average rates of Kshs 91 per SQFT, Grade C offices had higher yields at 8.3% compared to the 6.0% recorded by Grade A offices since they have higher occupancy signifying their high demand. In contrast, Grade B offices in Kilimani, Parklands, and Westlands boasted the highest rental yields all to reach a 9.5%, 9.3% and 9.2% respectively in rental yields. Similarly, Grade C offices in Westlands, Kilimani and Nairobi CBD delivered the best returns with average rental yields reaching 9.9%, 8.8% and 8.3% respectively. The class performance by node is as summarized in the table below with the best performing areas of each grade highlighted in yellow;
|
|
Cytonn Report: Commercial Office Performance in 2025 by Nodes and Grades |
||||||
|
|
Grade A |
|
Grade B |
|
Grade C |
|
|
|
Location |
Average of Occupancy (%) |
Average of Rental Yield |
Average of Occupancy (%) |
Average of Rental Yield |
Average of Occupancy (%) |
Average of Rental Yield |
|
|
Gigiri |
82.3% |
8.6% |
82.0% |
8.1% |
|||
|
Karen |
83.8% |
8.2% |
84.8% |
8.1% |
|||
|
Kilimani |
87.3% |
9.1% |
87.4% |
9.5% |
84.0% |
8.8% |
|
|
Msa Road |
79.0% |
6.9% |
89.5% |
9.0% |
77.0% |
7.8% |
|
|
Nairobi CBD |
60.0% |
6.0% |
89.9% |
8.8% |
90.6% |
8.3% |
|
|
Parklands |
87.2% |
10.2% |
86.7% |
9.3% |
87.0% |
7.7% |
|
|
Thika Road |
94.0% |
12.0% |
84.5% |
7.1% |
75.0% |
5.8% |
|
|
UpperHill |
87.4% |
8.4% |
83.5% |
7.5% |
86.7% |
8.1% |
|
|
Westlands |
79.8% |
10.5% |
83.5% |
9.2% |
83.4% |
9.9% |
|
Source: Cytonn Research
- Serviced Offices
In 2025, serviced offices experienced a notable 7.0% year-on-year (y/y) growth in rental revenues, with average rental rates rising to Kshs 230.3 per SQFT, up from Kshs 215.2 per SQFT in 2024. In contrast, unserviced offices saw a more modest revenue increase of 3.2%, with average rental rates climbing to Kshs 108 per SQFT in 2025, compared to Kshs 105 per SQFT in 2024. Notably, serviced offices in Westlands and Thika Road recorded the most substantial rent hikes of 10.5% and 8.3% respectively. The improved performance in these areas can be attributed to several factors: i) the presence of quality infrastructure, enhancing accessibility, ii) diverse themes and sophisticated designs demanding top-tier standards, iii) high-quality facilities attracting premium rents, often in dollars, and iv) tranquil office locations appealing to clients seeking to escape the hustle and bustle of the city. The table below gives a comparison of the performance of the NMA serviced office sector;
|
(All values in Kshs Unless Stated Otherwise) |
||||||
|
Cytonn Report: Nairobi Metropolitan Area Serviced Office Performance |
||||||
|
Location |
Revenue Per SQFT 2024 |
Revenue Per SQFT 2025 |
Serviced Offices Revenue growth (%) |
Unserviced Offices Revenue growth (%) |
||
|
Serviced Offices |
Un-serviced Offices |
Serviced Offices |
Un-serviced Offices |
|||
|
Westlands |
267 |
119 |
295 |
124 |
10.5% |
4.2% |
|
Thika Rd |
120 |
90 |
130 |
96 |
8.3% |
6.7% |
|
Msa Rd |
180 |
80 |
195 |
87 |
8.3% |
8.7% |
|
Gigiri |
283 |
131 |
305 |
126 |
7.8% |
(3.8%) |
|
Nairobi CBD |
196 |
104 |
210 |
100 |
7.1% |
(3.8%) |
|
Karen |
221 |
101 |
235 |
115 |
6.3% |
13.9% |
|
Kilimani |
233 |
115 |
246 |
120 |
5.6% |
4.3% |
|
Upperhill |
243 |
92 |
256 |
102 |
5.3% |
10.9% |
|
Parklands |
194 |
94 |
200 |
105 |
3.1% |
11.7% |
|
Average |
215.2 |
105 |
230.2 |
108 |
7.0% |
3.2% |
Source: Cytonn Research
In 2025, there was a noticeable surge in the development of specialized office spaces tailored to specific niches in Kenya, particularly in the realm of co-working spaces. Illustrating this trend, IWG, a global leader in hybrid working solutions known for its prestigious lineup of brands like Spaces and Regus, unveiled a workspace centers in areas such as Loresho, Crescent Parklands and Mombasa Rd contributing an expansive 25,800 square feet of new flexible space We expect a rise in the establishment of additional co-working spaces in the future. According to Knight Frank’s H2 2025 Kenya Market Update, many organizations opted to return to working from office adopting physical offices over working remote. However, KOFISI, a leading provider of flexible workspaces, closed two outlets in Kenya after recording a loss of Kshs 417.0 mn in 2024 with the company attributing losses largely to non-core activities. The table below highlights major co-working office spaces released into the market in 2025;
|
Cytonn Report: Notable Co-working Space Office Developments delivered in 2025 |
||||
|
# |
Space provider |
Office Name |
Location |
Size (SQFT) |
|
1 |
Tulivu Co-working |
Former Hilton Hotel |
Nairobi CBD |
- |
|
2 |
Worknest |
- |
Runda |
- |
Source: Cytonn Research, Knight Frank
Section IV: Office Market Outlook and the Investment Opportunity in the Sector
Our overall outlook for the Nairobi Metropolitan Area commercial office sector is POSITIVE. We expect the sector to remain stable with a slight improvement attributable to i) the increasing presence of multinational companies in Kenya is likely to drive up occupancy levels, ii) co-working spaces are gaining in popularity in the region iii) the gradual return to “working from office” after the Covid-19 pandemic, iv) more start-ups are expected to drive demand for commercial spaces, and v) a considerable take-up of prevailing commercial office spaces after developers adopted a 'wait-and-see' approach to avoid vacancies in newly built spaces, However, the sector continues to face challenges due to a significant oversupply of office space, currently standing at 5.7 mn SQFT. Despite these challenges, there are attractive investment opportunities in areas such as Westlands, Gigiri, Karen and Kilimani, which offer returns that exceed the market average.
|
Cytonn Report: Nairobi Metropolitan Area (NMA) Commercial Office Outlook |
||||
|
Measure |
2024 Sentiment |
2025 Sentiment and 2026 Outlook |
2025 Review |
2026 Outlook |
|
Supply |
The Nairobi Metropolitan Area (NMA) commercial office sector experienced a consistent oversupply of office space, amounting to 5.7 mn square feet (SQFT), a figure comparable to that of 2023 5.8 Mn. This decrease in the supply can be primarily be contributable to decrease in vacancy rates by 0.4% points to 19.3% in 2024 from 19.7% in 2023. Increase in occupancy rates was supported by factors such as market recovery from the global pandemic which has seen companies and organizations abolish remote working. Consequently, there was heightened demand which led to faster absorption rates of both new and existing developments throughout 2024, even with the introduction of 0.6 Mn SQFT of office space into the market—a 113.5% increase from the 0.3 Mn SQFT supplied in 2023. The oversupply is caused by the factors such as construction of new office spaces such as Purple Towers in Mombasa road and the Atrium in Nyali road and easing economic pressures evidenced by reducing inflation rate and CBK rates |
In 2025, the Nairobi Metropolitan Area (NMA) commercial office sector experienced a consistent oversupply of office space, amounting to 3.4 mn square feet (SQFT), a figure lower to that of 2024 at 5.7 Mn SQFT. This decrease in the supply can be primarily be contributable to decrease in vacancy rates by 3.6% points to 15.7% in 2025 from 19.3% in 2024. Increase in occupancy rates was supported by factors such as market recovery from the global pandemic which has seen companies and organizations abolish remote working. Consequently, there was heightened demand which led to faster absorption rates of both new and existing developments throughout 2025, even with the introduction of 0.6 Mn SQFT of office space into the market—a 14.2% decrease from the 0.7 Mn SQFT supplied in 2024. The oversupply is caused by the factors such as construction of new office spaces such as the purple tower in Mombasa Road, Matrix One and Mandrake in Westlands Mandrake in Westlands, which outpaced the occupancy and uptake of these spaces We expect the office space oversupply to increase by 108.1% to 7.7 mn SQFT from 3.7 mn SQFT in 2025 attributable to an expected increase in vacancy rates by 6.0% to 19.3% from 15.3% in 2025. Also, construction of new office spaces expected within 2026 year amounting to 0.1 Mn SQF |
Neutral |
Neutral |
|
Demand |
The Commercial Office sector realized a 0.1%-points increase in average rental yields in 2024 to 7.8%, from 7.7% recorded in 2023 attributable to increased occupancy and rental rates. Average asking rents per SQFT in the Nairobi Metropolitan Area (NMA) increased by 1.7% to Kshs 105 per SQFT from Kshs 103 per SQFT in 2023. Additionally, occupancy rates increased by 1.2%-points to 80.7% from 79.5% achieved in 2023. The sector's improved performance can be attributed to various factors, including; i) the gradual resurgence of demand for physical spaces as more firms resumed full operations, ii) economic recovery which boosted business confidence and operations, iii) a more stable and favourable business environment post-COVID-19 era also played a role in the sector's improved performance. Furthermore, office space uptake rose by 93.6% to reach 0.7 Mn SQFT in 2023, up from the 0.3 Mn SQFT registered in 2023. This increase is credited to a higher occupancy rate of both conventional unserviced and serviced office spaces, driven by the resumption of full business operations across various sectors |
The Commercial Office sector realized a 0.9%-points increase in average rental yields in 2025 to 8.9%, from 7.8% recorded in 2024 attributable to increased occupancy and rental rates. Average asking rents per SQFT in the Nairobi Metropolitan Area (NMA) increased by 5.7% to Kshs 111 per SQFT from Kshs 105 per SQFT in 2024. Additionally, occupancy rates increased by 4.0%-points to 84.7% from 80.7% achieved in 2024. The sector's improved performance can be attributed to various factors, including; i) the gradual resurgence of demand for physical spaces as more firms resumed full operations, ii) economic recovery which boosted business confidence and operations, iii) a more stable and favourable business environment post-COVID-19 era also played a role in the sector's improved performance. We expect the occupancy rates to stabilize mainly attributed to the recovery that has been happening since 2020, businesses are still exercising caution due to the uncertainties in the market, abolition of remote work policies by companies, however the occupancies might be affected by an oversupply of 7.7 mn SQFT of office spaces in 2026. These factors are likely to stabilize absorption rates |
Positive |
Neutral |
|
Office Market Performance |
The Commercial Office sector realized a 0.1%-points increase in average rental yields in 2024 to 7.8%, from 7.7% recorded in 2023 attributable to increased occupancy and rental rates. Average asking rents per SQFT in the Nairobi Metropolitan Area (NMA) increased by 1.7% to Kshs 105 per SQFT from Kshs 103 per SQFT in 2023. Additionally, occupancy rates increased by 1.2%-points to 80.7% from 79.5% achieved in 2023. The sector's improved performance can be attributed to various factors, including; i) the gradual resurgence of demand for physical spaces as more firms resumed full operations, ii) economic recovery which boosted business confidence and operations, iii) a more stable and favourable business environment post-COVID-19 era also played a role in the sector's improved performance. Serviced offices experienced a notable 1.6% year-on-year (y/y) growth in rental revenues, with average rental rates rising to Kshs 215.2 per SQFT, up from Kshs 211.6 per SQFT in 2023. In contrast, unserviced offices saw a more modest revenue increase of 4.1%, with average rental rates climbing to Kshs 105 per SQFT in 2024, compared to Kshs 103 per SQFT in 2023. |
The Commercial Office sector realized a 0.9%-points increase in average rental yields in 2025 to 8.9%, from 7.8% recorded in 2024 attributable to increased occupancy and rental rates. Average asking rents per SQFT in the Nairobi Metropolitan Area (NMA) increased by 5.7% to Kshs 111 per SQFT from Kshs 105 per SQFT in 2024. Additionally, occupancy rates increased by 4.0%-points to 84.7% from 80.7% achieved in 2024. The sector's improved performance can be attributed to various factors, including; i) the gradual resurgence of demand for physical spaces as more firms resumed full operations, ii) economic recovery which boosted business confidence and operations, iii) a more stable and favourable business environment post-COVID-19 era also played a role in the sector's improved performance. Serviced offices experienced a notable 7.0% year-on-year (y/y) growth in rental revenues, with average rental rates rising to Kshs 230.3 per SQFT, up from Kshs 215.2 per SQFT in 2024. In contrast, unserviced offices saw a more modest revenue increase of 3.2%, with average rental rates climbing to Kshs 108 per SQFT in 2025, compared to Kshs 105 per SQFT in 2024. Notably, serviced offices in Westlands and Thika Road recorded the most substantial rent hikes of 10.5% and 8.3% respectively. The improved performance in these areas can be attributed to several factors: i) the presence of quality infrastructure, enhancing accessibility, ii) diverse themes and sophisticated designs demanding top-tier standards, iii) high-quality facilities attracting premium rents, often in dollars, and iv) tranquil office locations appealing to clients seeking to escape the hustle and bustle of the city. We anticipate a modest increase in rental yields for the sector in 2026, driven by several factors; i) the growing popularity of serviced office spaces is expected to contribute positively to this trend, ii) while the sector's expansion may be gradual, it is steadily progressing, supported by the ongoing recovery of the economy towards pre-COVID-19 levels, iii) the pipeline of developments in the sector is expected to help address the oversupply challenge, thereby improving absorption rates for available and incoming spaces. As a result, we foresee an improvement in occupancy rates and asking rents, which will ultimately enhance average rental yields. However, the projected oversupply of office spaces, estimated at 7.7 Mn square feet in the Nairobi Metropolitan Area, is expected to exert downward pressure on the sector's overall performance by dampening demand for physical space. |
Positive |
Positive |
Our overall outlook for the Nairobi Metropolitan Area commercial office sector is POSITIVE. We expect the sector to remain stable with a slight improvement attributable to i) the increasing presence of multinational companies in Kenya is likely to drive up occupancy levels, ii) co-working spaces are gaining in popularity in the region iii) the gradual return to “working from office” after the Covid-19 pandemic, iv) more start-ups are expected to drive demand for commercial spaces, and v) a considerable take-up of prevailing commercial office spaces after developers adopted a 'wait-and-see' approach to avoid vacancies in newly built spaces, However, the sector continues to face challenges due to a significant oversupply of office space, currently standing at 3.4 mn SQFT. Despite these challenges, there are attractive investment opportunities in areas such as Parklands, Westlands and Karen which offer returns that exceed the market average.
Disclaimer: The views expressed in this publication are those of the writers where particulars are not warranted. This publication, which follows Section 2 of the Capital Markets Authority Act Cap 485A, is meant for general information only and is not a warranty, representation, advice or solicitation of any nature. Readers are advised in all circumstances to seek the advice of a registered investment advisor

- Talk to us
- Kenya
- P.O Box 20695 - 00200, Nairobi, Kenya
- Cell +254709101200
- Tel +254709101200
- WhatsApp +254741676635
- United States
- +254709101200
- DOWNLOAD OUR APP
-


- Kenya
- 8th Floor, Pinetree Plaza, Kaburu Drive, Ngong Road, Nairobi, Kenya
- USA
- Suite 1150, 1775 Eye Street NW, USA, Washington DC 20006, USA
- Investments
- High Yield
- Private Equity
- Real Estate
- Real Estate
- RiverRun Estates
- Cytonn Towers
- The Ridge
- Taraji Heights
- The Alma