Nairobi Metropolitan Area Commercial Office Report 2022, & Cytonn Weekly #12/2022
By Cytonn Research, Mar 27, 2022
Executive Summary
Fixed Income
During the week, T-bills were undersubscribed, with the overall subscription rate coming in at 55.8%, down from the 82.8% recorded the previous week. The 364-day paper recorded the highest subscription rate, receiving bids worth Kshs 7.2 bn against the offered Kshs 10.0 bn, translating to a subscription rate of 72.2%, a decline from the 96.6% recorded the previous week. The performance is partly attributable to investors’ preference for the longer-dated paper, which offers a higher yield of 9.8% compared to the 8.1% and 7.3% yields offered by the 182-day and 91-day papers, respectively. The subscription rate for the 91-day paper increased to 58.0%, from 49.5% recorded the previous week while that of the 182-day paper declined to 38.4%, from 82.4% recorded the previous week. The yields on the government papers were on an upward trajectory with yields on the 364-day, 182-day and 91-day papers increasing by 0.4 bps, 4.1 bps and 3.1 bps, to 9.8%, 8.1% and 7.3%, respectively;
For the month of April, the government has issued two new bonds, FXD1/2022/03 and FXD1/2022/15 with tenors of 3.0 years and 15.0 years respectively, in a bid to raise Kshs 70.0 bn for budgetary support. The period of sale for FXD1/2022/03 runs from 24th March to 5th April, while that of FXD1/2022/15 runs from 24th March 2022 to 19th April 2022. Key to note, the bonds coupon rates will be market determined;
During the week, Fitch Ratings affirmed Kenya’s Long-Term Foreign- Currency Issuer Default Rating (IDR) at ‘B+’ with a Negative Outlook, unchanged from the previous review in March 2021. For the month of March 2022, we are projecting the y/y inflation rate to fall within the range of 5.3% - 5.7%, compared to the 5.1% recorded in February 2022, mainly driven by increasing fuel and food prices;
Equities
During the week, the equities market was on upward trajectory, with NASI and NSE 25 increasing by 2.3% and 1.1%, respectively, while NSE 20 remained relatively unchanged taking their YTD performance to losses of 4.0%, 2.8% and 3.2% for NASI, NSE 20 and NSE 25, respectively. The equities market performance was driven by gains recorded by large cap stocks such as Safaricom, NCBA, Standard Chartered Bank of Kenya (SCBK) and Diamond Trust Bank (DTB-K) of 4.2%, 3.8%, 1.6% and 0.9%, respectively. The gains were however weighed down by losses recorded by other large cap stocks such as Co-operative Bank, KCB Group, Bamburi and Equity Group of 3.0%, 1.3%, 1.1% and 1.0%, respectively;
Also during the week, the Central Bank of Kenya (CBK) released the Quarterly Economic Review Report October-December 2021, highlighting that the sector’s total assets increased by 10.8% to Kshs 6.0 tn in December 2021, from Kshs 5.4 tn in December 2020 and Profit before Tax (PBT) increased by 0.4% to Kshs 49.3 bn, from Kshs 49.1 bn in Q4’2020. Additionally, the Insurance Regulatory Authority of Kenya (IRA) released the Quarterly Insurance Industry Report for the period ended 31st December highlighting that the industry’s gross premiums rose by 18.5% to Kshs 276.1 bn, from Kshs 233.0 bn recorded in Q4’2020, with the general insurance business contributing 55.2% of the industry’s premium income, a 1.0% point decline from the 56.2% contribution witnessed in Q4’2020;
Real Estate
During the week, the Central Bank of Kenya (CBK), released the Quarterly Economic Review Report October-December 2021 highlighting that the gross loans advanced to the Real Estate sector decreased by 3.9% to Kshs 456.0 bn in FY’2021, from Kshs 439.0 bn realized in FY’2020. In the residential sector, Pan- African mortgage lender Shelter Afrique in partnership with the Centre for Affordable Housing Finance in Africa (CAHF) developed a ‘Housing Affordability Calculator’ to vet proposals by developers pitching for financing of affordable housing. In the retail sector, Naivas supermarket, announced plans to open 3 new outlets in the next few weeks. The outlets will be located at Kiambu Mall along Kiambu Road, at Safari Center in Naivasha while the third store will be opened in Meru. Additionally, Simbisa Brands, Zimbabwe’s largest fast-food restaurant operator, which runs quick-service restaurants such as Chicken Inn, Pizza Inn, Bakers Inn, and Creamy Inn, announced plans to expand to 245 outlets in Kenya by June 2022 from 190 outlets as at December 2021. In the hospitality sector, global US hotel brand JW Marriott International, signed an agreement with Baraka Lodges Limited to open its first luxury safari lodge in Maasai Mara, Narok County. Global five-star hotel brand Radisson Blu located in Nairobi Upper Hill announced plans to resume operations on 9th May 2022 following easing of the coronavirus crisis. In Listed Real Estate, the ILAM Fahari I-REIT closed the week trading at an average price of Kshs 6.0 per share. This represented a 3.4% Week-to-Date (WTD) increase and 6.3% Year-to-Date (YTD) decline, from Kshs 5.8 per share and Kshs 6.4 per share, respectively. Additionally, the Board of Directors of the REIT Manager and the REIT Trustee of ILAM Fahari I-REIT issued a Cautionary Announcement to unitholders of the REIT and the general public saying that the I-REIT Manager has undertaken a strategic review of the I-REIT with the Trustee’s consent which, if approved and implemented may involve restructuring of the REIT;
Focus of the Week
In 2021, we published the Nairobi Metropolitan Area Commercial Office Report 2021 themed “Market under Pandemic,’ a report which was highlighting the performance of the sector in 2020, as well as giving insights on the outlook and areas best fit for investment opportunities. This week, we will update our research with the Commercial Office report 2022 themed ‘Changing Working Patterns Driving the Market’, in order to determine the market’s performance in the year 2021. The Commercial Office sector realized an improvement in its overall performance in 2021, with the average rental yields coming in at 7.1%, 0.1 % points higher than the 7.0% recorded in 2020. The average occupancy rates increased as well by 0.2% points to 77.9%, from 77.7% recorded in 2020;
Investment Updates:
- Weekly Rates:
- Cytonn Money Market Fund closed the week at a yield of 10.56%. To invest, dial *809#;
- Cytonn High Yield Fund closed the week at a yield of 13.93% p.a. To invest, email us at sales@cytonn.com and to withdraw the interest, dial *809#;
- Justin Mwangi, a Senior Investment Analyst, was on an interview with metropol TV to discuss the FY’2021 banks performance. Watch Justin here
- We continue to offer Wealth Management Training every Thursday and every third Saturday of the month, from 9:00 am to 11:00 am, through our Cytonn Foundation. The training aims to grow financial literacy among the general public. To register for any of our Wealth Management Trainings, click here;
- If interested in our Private Wealth Management Training for your employees or investment group, please get in touch with us through wmt@cytonn.com;
- Any CHYS and CPN investors still looking to convert are welcome to consider one of the five projects currently available for conversion, click here for the latest conversion term sheet;
- Cytonn Insurance Agency acts as an intermediary for those looking to secure their assets and loved ones’ future through insurance namely; Motor, Medical, Life, Property, WIBA, Credit and Fire and Burglary insurance covers. For assistance, get in touch with us through insuranceagency@cytonn.com;
- Cytonnaire Savings and Credit Co-operative Society Limited (SACCO) provides a savings and investments avenue to help you in your financial planning journey. To enjoy competitive investment returns, kindly get in touch with us through clientservices@cytonn.com;
Real Estate Updates:
- For an exclusive tour of Cytonn’s real estate developments, visit: Sharp Investor's Tour, and for more information, email us at sales@cytonn.com;
- Phase 3 of The Alma is now ready for occupation. To rent please email properties@cytonn.com;
- We have 8 investment-ready projects, offering attractive development and buyer targeted returns; See further details here: Summary of Investment-ready Projects;
- For recent news about the group, see our news section here;
Hospitality Updates:
- We currently have promotions for Staycations. Visit cysuites.com/offers for details or email us at sales@cysuites.com;
Money Markets, T-Bills & T-Bonds Primary Auction:
During the week, T-bills were undersubscribed, with the overall subscription rate coming in at 55.8%, down from the 82.8% recorded the previous week. The 364-day paper recorded the highest subscription rate, receiving bids worth Kshs 7.2 bn against the offered Kshs 10.0 bn, translating to a subscription rate of 72.2%, a decline from the 96.6% recorded the previous week. The performance is partly attributable to investors’ preference for the longer-dated paper, which offers a higher yield of 9.8% compared to the 8.1% and 7.3% yields offered by the 182-day and 91-day papers, respectively. The subscription rate for the 91-day paper increased to 58.0%, from 49.5% recorded the previous week while that of the 182-day paper declined to 38.4%, from 82.4% recorded the previous week. The yields on the government papers were on an upward trajectory with yields on the 364-day, 182-day and 91-day papers increasing by 0.4 bps, 4.1 bps and 3.1 bps, to 9.8%, 8.1% and 7.3%, respectively. The government continued rejecting expensive bids, accepting bids worth Kshs 13.2 bn out of the Kshs 13.4 bn worth of bids received, translating to an acceptance rate of 99.0%.
For the month of April, the government has issued two new bonds, FXD1/2022/03 and FXD1/2022/015 with tenors of 3.0 years and 15.0 years respectively, in a bid to raise Kshs 70.0 bn for budgetary support. The period of sale for FXD1/2022/03 runs from 24th March to 5th April, while that of FXD1/2022/15 runs from 24th March 2022 to 19th April 2022. Key to note, the bonds coupon rates will be market determined. We expect investors to prefer the longer dated paper, FXD1/2022/15, in search of higher yields. Our recommended bidding range for the two bonds is 10.4%-10.8% for FXD1/2022/03 and 13.6% - 13.8% for FXD1/2022/15 within which bonds of a similar tenors are trading.
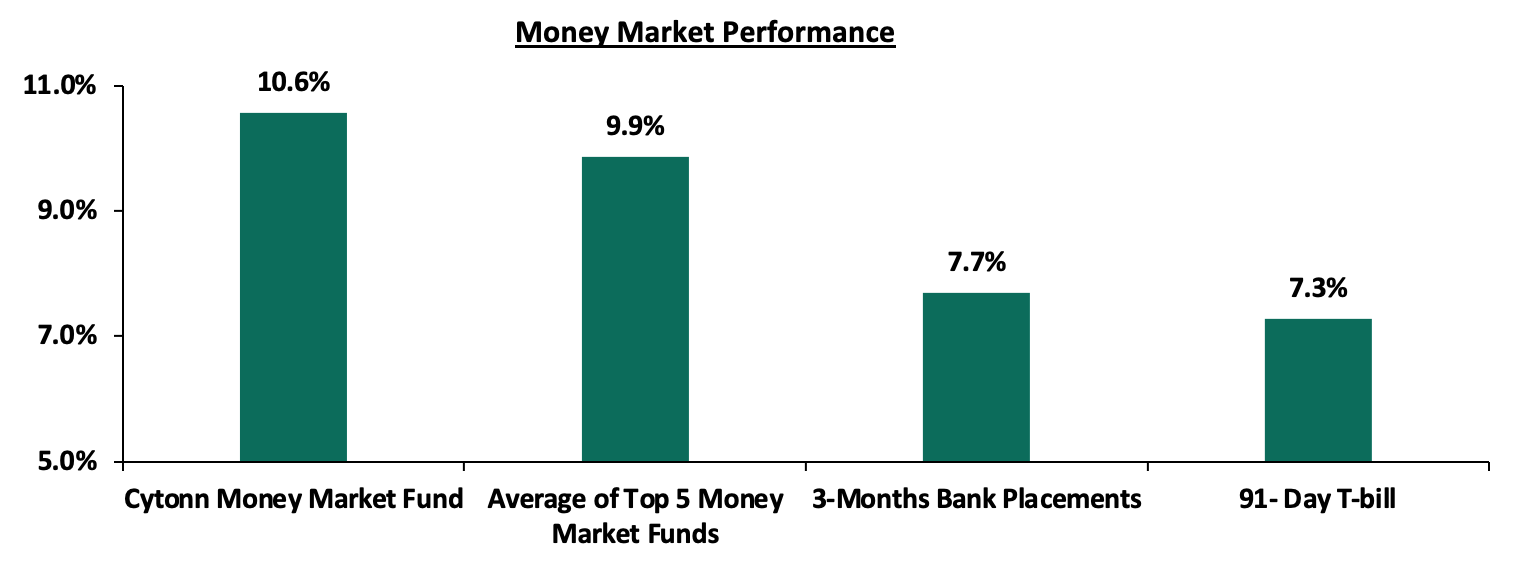
In the money markets, 3-month bank placements ended the week at 7.7% (based on what we have been offered by various banks), while the yield on the 91-day T-bill increased by 3.1 bps to 7.3%. The average yield of the Top 5 Money Market Funds increased marginally by 0.1% points to 9.9%, from 9.8% recorded the previous week while the yield on the Cytonn Money Market Fund increased by 0.2% points to 10.6%, from 10.4% recorded the previous week.
The table below shows the Money Market Fund Yields for Kenyan Fund Managers as published on 25th March 2022:
|
Money Market Fund Yield for Fund Managers as published on 25th March 2022 |
||
|
Rank |
Fund Manager |
Effective Annual Rate |
|
1 |
Cytonn Money Market Fund |
10.6% |
|
2 |
Zimele Money Market Fund |
9.9% |
|
3 |
Nabo Africa Money Market Fund |
9.7% |
|
4 |
Sanlam Money Market Fund |
9.7% |
|
5 |
Apollo Money Market Fund |
9.5% |
|
6 |
GenCap Hela Imara Money Market Fund |
9.4% |
|
7 |
Dry Associates Money Market Fund |
9.1% |
|
8 |
CIC Money Market Fund |
9.0% |
|
9 |
Madison Money Market Fund |
8.9% |
|
10 |
Orient Kasha Money Market Fund |
8.6% |
|
11 |
Co-op Money Market Fund |
8.6% |
|
12 |
NCBA Money Market Fund |
8.4% |
|
13 |
ICEA Lion Money Market Fund |
8.4% |
|
14 |
British-American Money Market Fund |
8.3% |
|
15 |
AA Kenya Shillings Fund |
8.2% |
|
16 |
Old Mutual Money Market Fund |
7.1% |
Source: Business Daily
Liquidity:
During the week, liquidity in the money markets remained ample, with the average interbank rate remaining relatively unchanged at 4.3%, as recorded the previous week, partly attributable to government payments which offset tax remittances. The average interbank volumes traded declined by 36.9% to Kshs 10.9 bn, from Kshs 17.2 bn recorded the previous week.
Kenya Eurobonds:
During the week, the yields on Kenyan Eurobonds were on an upward trajectory, partly attributable to the affirmation of Kenya's Long-Term Foreign-Currency Issuer Default Rating (IDR) at 'B+' with a negative outlook by Fitch Ratings coupled with the United States Federal Reserve’s interest rate hike in the previous week, which saw capital outflows from emerging markets as investors shifted to the United States Bonds market. Yields on the 10-year bond issued in 2018, 30-year bond issued in 2018, 12-year bond issued in 2019 and the 12-year bond issued in 2021 all increased by 0.4% points to 8.6%, 9.8%, 9.1% and 8.8%, respectively. Similarly, yields on the 10-year bond issued in 2014 and the 7-year bond issued in 2019 increased by 0.8% points and 0.5% points to 7.1% and 8.8%, respectively. Below is a summary of the performance:
|
Kenya Eurobond Performance |
||||||
|
2014 |
2018 |
2019 |
2021 |
|||
|
Date |
10-year issue |
10-year issue |
30-year issue |
7-year issue |
12-year issue |
12-year issue |
|
3-Jan-22 |
4.4% |
5.8% |
8.1% |
5.6% |
6.7% |
6.6% |
|
1-Mar-22 |
5.3% |
8.2% |
9.7% |
8.2% |
8.2% |
8.5% |
|
18-Mar-22 |
6.3% |
8.2% |
9.4% |
8.3% |
8.7% |
8.4% |
|
21-Mar-22 |
6.4% |
8.3% |
9.5% |
8.4% |
8.7% |
8.4% |
|
22-Mar-22 |
6.7% |
8.4% |
9.6% |
8.5% |
8.9% |
8.5% |
|
23-Mar-22 |
6.7% |
8.5% |
9.7% |
8.7% |
9.0% |
8.7% |
|
24-Mar-22 |
7.1% |
8.6% |
9.8% |
8.8% |
9.1% |
8.8% |
|
Weekly Change |
0.8% |
0.4% |
0.4% |
0.5% |
0.4% |
0.4% |
|
MTD Change |
1.8% |
0.4% |
0.2% |
0.5% |
0.8% |
0.3% |
|
YTD Change |
2.7% |
2.8% |
1.7% |
3.2% |
2.4% |
2.2% |
Source: CBK
Kenya Shilling:
During the week, the Kenyan shilling depreciated by 0.3% against the US dollar, to close the week at Kshs 114.7, from Kshs 114.4 recorded the previous week, partly attributable to increased dollar demand from the oil and energy sectors. Key to note, this is the lowest the Kenyan shilling has ever depreciated against the dollar. On a year to date basis, the shilling has depreciated by 1.4% against the dollar, in comparison to the 3.6% depreciation recorded in 2021. We expect the shilling to remain under pressure in 2022 as a result of:
- Rising global crude oil prices on the back of supply constraints and geopolitical pressures at a time when demand is picking up with the easing of COVID-19 restrictions and as economies reopen. Key to note, risks abound the recovery following the emergence of the new COVID-19 variants,
- Increased demand from merchandise traders as they beef up their hard currency positions in anticipation for more trading partners reopening their economies globally,
- An ever present current account deficit due to an imbalance between imports and exports, with Kenya’s current account deficit estimated to come in at 5.6% of GDP in the 12 months to February 2022 compared to the 4.3% for a similar period in 2021. The wider deficit reflects a higher import bill, particularly for oil, which more than offset increased receipts from agricultural and services exports, and remittances, and,
- The aggressively growing government debt, with Kenya’s public debt having increased at a 10-year CAGR of 18.4% to Kshs 8.0 tn in December 2021, from Kshs 1.5 tn in December 2011 thus putting pressure on forex reserves to service some of the public debt.
The shilling is however expected to be supported by:
- High Forex reserves currently at USD 7.9 bn (equivalent to 4.8-months of import cover), which is above the statutory requirement of maintaining at least 4.0-months of import cover, and the EAC region’s convergence criteria of 4.5-months of import cover. In addition, the reserves were boosted by the USD 1.0 bn proceeds from the Eurobond issued in July 2021, USD 972.6 mn IMF disbursement, USD 130.0 mn World Bank loan financing received in June 2021 and the recently approved USD 750.0 mn World Bank loan facility, and,
- Improving diaspora remittances evidenced by a 23.5% y/y increase to USD 321.5 mn as of February 2022, from USD 260.3 mn recorded over the same period in 2021, which has continued to cushion the shilling against further depreciation.
Weekly Highlights:
- Fitch Ratings - Kenya
During the week, Fitch Ratings affirmed Kenya’s Long-Term Foreign- Currency Issuer Default Rating (IDR) at ‘B+’ with a Negative Outlook, unchanged from the previous review in March 2021. The B+ rating was on the back of the strong economic growth, with Kenya’s economy having recorded a 9.9% growth in Q3’2021, up from a 2.1% contraction recorded in a similar period in 2020, coupled with the continued macroeconomic stability. Fitch Ratings estimates Kenya’s real GDP growth to come in at 6.5% in 2021 and to slow down to 6.0% in 2022, due to downsides posed by the upcoming August general elections. Further, policy reforms under the USD 2.3 bn Extended Fund Facility (EFF) and Extended Credit Facility (ECF) program from the IMF have contributed to progress on fiscal consolidation and positive sentiments from external financing sources. However, the positive factors were weighed down by several factors below the ‘B’ range median. Some of the factors that led to the Negative outlook include:
- The increasing Public Debt levels, which stood at 66.2% of GDP as at December 2021, projected to rise to 69.0% in FY’2022 and stagnate at approximately 70.0% over the medium term,
- High net external indebtedness attributable to external debt growing at a faster 10-year CAGR of 19.8%, to Kshs 4.2 tn in December 2021 from Kshs 0.6 tn in December 2011 as compared to a 10-CAGR of 17.6% for domestic debt to Kshs 4.0 tn in December 2021 from Kshs 0.8 tn in December 2011,
- Relatively high debt to revenue ratio which is forecasted to stand at 424.0% in FY’2022 as compared to 434.0% in FY’2021, but higher than ‘B’ median debt to revenue ratio of 321.0%,
- Ever present fiscal deficit which is expected to narrow to 7.8% of GDP in FY’2022 from 8.2% in FY’2021 but still above the ‘B’ median fiscal deficit forecast of 3.7% of GDP,
- Inflationary pressures caused by increasing food and fuel cost pressures likely to be accelerated by the recent geo-political pressures between Russia and Ukraine which has led to rising global fuel prices. Although inflation is expected to remain within the government’s target range of 2.5% - 7.5%, Fitch forecasts an annual increase of 6.5% in FY’2022, as compared to the 6.1% in FY’2021, and,
- Widening current accounts deficit, which increased to 5.5% of GDP in 2021 from 4.7% in 2020, mainly attributable to higher energy imports due to the increasing oil prices. However, improving export performance and increasing remittance inflows are expected to contain the current account deficit from further widening in 2022.
Fitch Ratings noted that a credible fiscal plan coupled with a significant decline in net external indebtedness would lead to positive ratings action while a failure to stabilise public debt to GDP at current levels, costlier external debt servicing and a weaker than expected GDP growth remain the biggest factors to a negative rating action. Despite the affirmation of a negative outlook by Fitch Ratings, we expect the recently approved USD 750.0 mn facility by the World Bank, coupled with fiscal reforms promoted by the EFF/ECF arrangement by the IMF to improve sentiments around the country and cushion it against further ratings deterioration. Further, fiscal consolidation efforts will be boosted by the positive revenue collection drives as evidenced by total revenue collections as at end of February surpassing the targets. However, risk abound fiscal consolidation with the looming August 2022 elections which are expected to see increased expenditure and reduced revenue collection as a result of deterioration of business environment. We also expect Kenya’s sovereign bonds to remain largely unaffected in the near and medium term, as a result of affirmation of the rankings. Below is a summary of the credit ratings on Kenya so far:
|
Rating Agency |
Previous Rating |
Current Rating |
Current Outlook |
Date Released |
|
Fitch Ratings |
B+ |
B+ |
Negative |
22nd March 2022 |
|
S&P Global |
B+ |
B |
Stable |
5th March 2021 |
|
Moody’s |
B1 |
B2 |
Negative |
19th June 2020 |
- March 2022 Inflation projections
We are projecting the y/y inflation rate for March 2022 to fall within the range of 5.3% - 5.7%. The key drivers include:
- Increasing fuel prices - Fuel prices for the period 15th March 2022 to 14th March 2022 increased by 3.9% to Kshs 134.7 per litre for Super Petrol and by 4.5% to Kshs 115.6 per litre for Diesel, while Kerosene remained unchanged at Kshs 103.5 per litre. With fuel being a major contributor to Kenya's headline inflation, we expect the increasing fuel prices to exert upward pressure on the inflation basket,
- Increasing food prices - This was evidenced by the 8.7% y/y increase in the prices food & non-alcoholic beverages as of February 2022 due to increased costs of production. Food prices increased by 0.8% m/m from January 2022 mainly due to increases in the prices of cooking oil (salad), cooking oil and cabbages among other food items. Further, adverse weather conditions in most parts of the country have affected the food prices upwards, and,
- The price of electricity which reduced by 15.7% in January 2022 marking the first phase of compliance with President Uhuru Kenyatta’s directive to cut the cost of electricity by 30.0% in order to reduce the cost of living. The reduction in electricity costs helped prices of goods remain stable during the month of February 2022 due to lower production costs. Additionally, the further 15.0% reduction in the cost of electricity is expected to be done within Q1’2022 coupled with the Energy and Petroleum Regulatory Authority maintaining the Fuel Cost Charge at 4.3 from January 2022 will help mute energy inflationary pressures going forward.
Going forward, we expect the inflation rate to remain within the government’s set range of 2.5% - 7.5%. However, concerns remain high on the widening trade deficit as global fuel prices continue to rise due to supply bottlenecks coupled with Geopolitical tensions arising from the Russia-Ukraine invasion. We are of the opinion that the rising global fuel prices are likely to deplete the fuel subsidy program currently in place and further lead to elevated inflationary pressures coupled with a depreciation of the local currency.
Rates in the Fixed Income market have remained stable due to the relatively ample liquidity in the money market. The government is 7.9% ahead of its prorated borrowing target of Kshs 496.2 bn having borrowed Kshs 535.4 bn of the Kshs 661.6 bn borrowing target for the FY’2021/2022. We expect a gradual economic recovery as evidenced by the revenue collections of Kshs 1.2 tn during the first eight months of the current fiscal year, which was equivalent to 100.8% of the prorated revenue collection target. However, despite the projected high budget deficit of 11.4% and the affirmation of the `B+’ rating with negative outlook by Fitch Ratings, we believe that the support from the IMF and World Bank will mean that the interest rate environment will remain stable since the government is not desperate for cash. Owing to this, our view is that investors should be biased towards short-term fixed-income securities to reduce duration risk.
Markets Performance
During the week, the equities market was on an upward trajectory, with NASI and NSE 25 increasing by 2.3% and 1.1%, respectively, while NSE 20 remained relatively unchanged taking their YTD performance to losses of 4.0%, 2.8% and 3.2% for NASI, NSE 20 and NSE 25, respectively. The equities market performance was driven by gains recorded by large cap stocks such as Safaricom, NCBA, Standard Chartered Bank of Kenya (SCBK) and Diamond Trust Bank (DTB-K) of 4.2%, 3.8%, 1.6% and 0.9%, respectively. The gains were however weighed down by losses recorded by other large cap stocks such as Co-operative Bank, KCB Group, Bamburi and Equity Group of 3.0%, 1.3%, 1.1% and 1.0%, respectively.
During the week, equities turnover increased by 52.1% to USD 20.3 mn, from USD 13.3 mn recorded the previous week, taking the YTD turnover to USD 231.2 mn. Foreign investors remained net sellers, with a net selling position of USD 1.5 mn, from a net selling position of USD 1.7 mn recorded the previous week, taking the YTD net selling position to USD 12.3 mn.
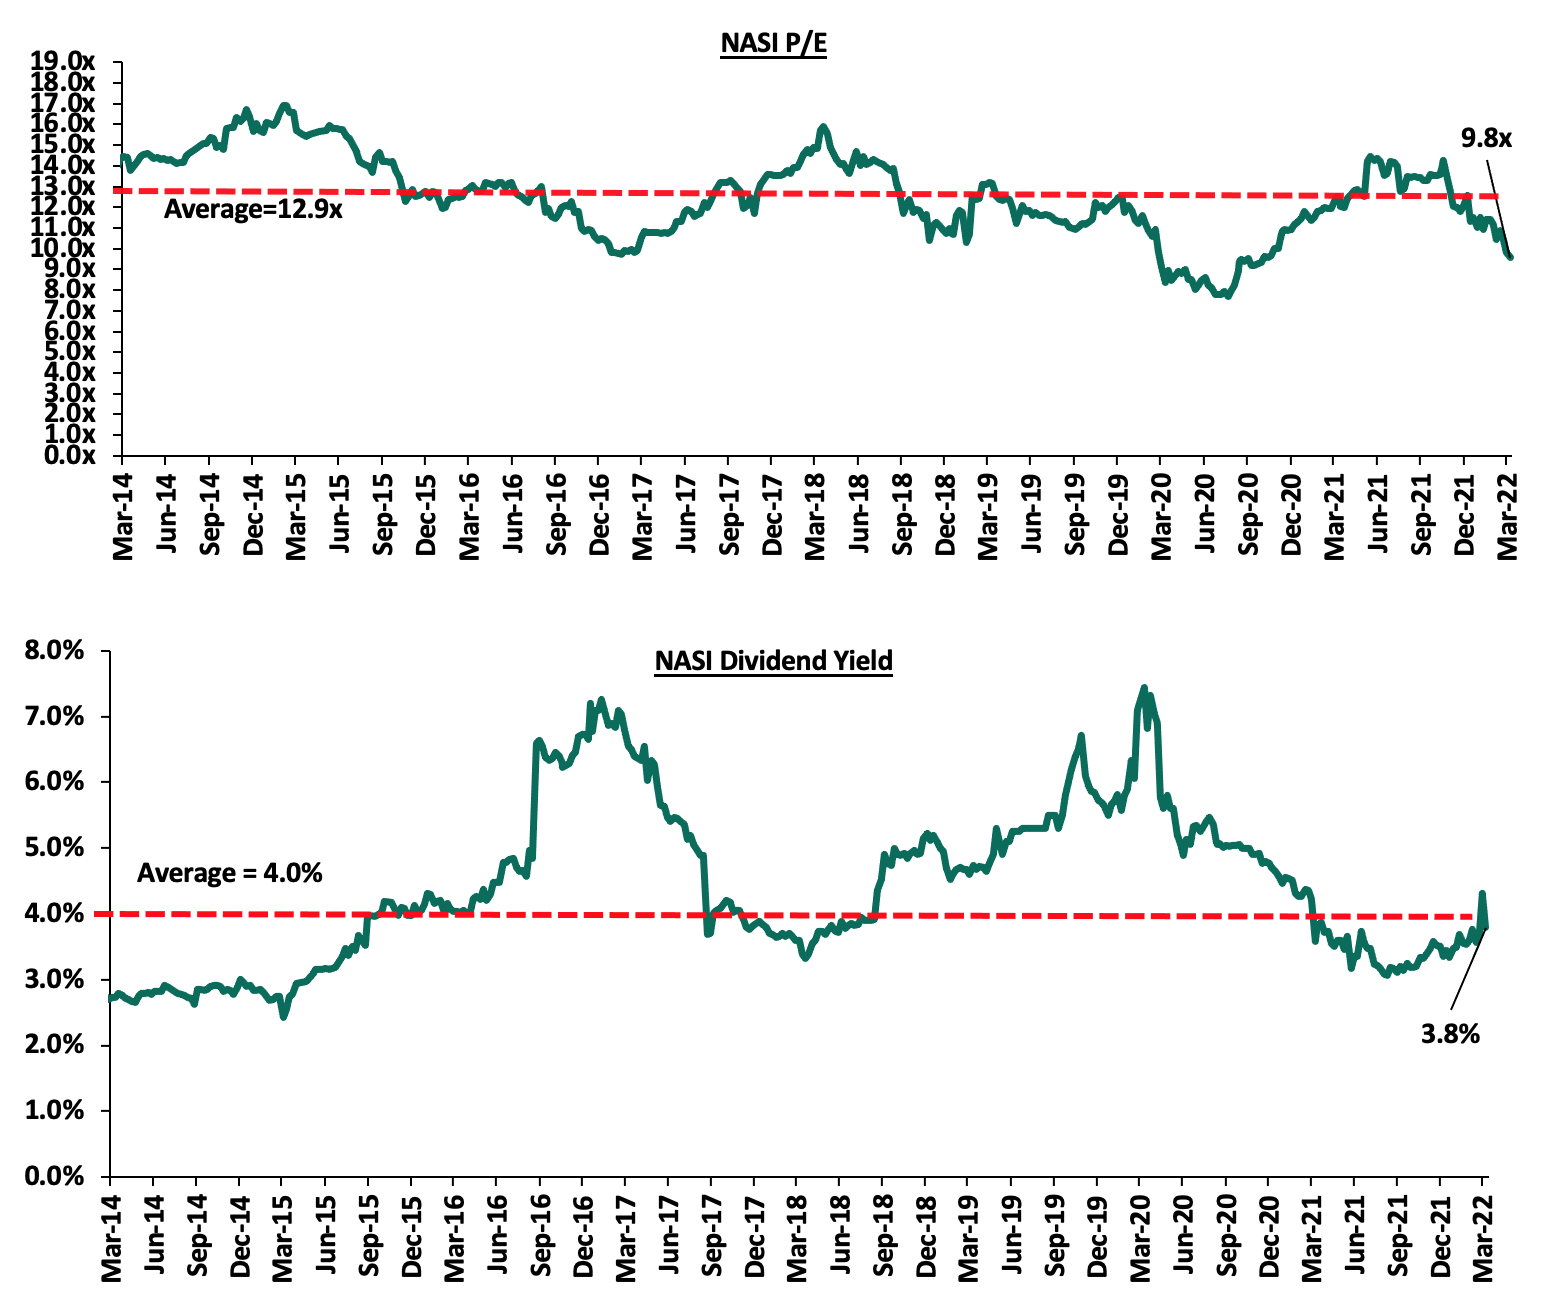
The market is currently trading at a price to earnings ratio (P/E) of 9.8x, 23.9% below the historical average of 12.9x, and a dividend yield of 3.8%, 0.2% points below the historical average of 4.0%. Key to note, NASI’s PEG ratio currently stands at 1.2x, an indication that the market is trading at a premium to its future earnings growth. A PEG ratio greater than 1.0x indicates the market may be overvalued while a PEG ratio less than 1.0x indicates that the market is undervalued. The current P/E valuation of 9.8x is 27.4% above the most recent trough valuation of 7.7x experienced in the first week of August 2020. The charts below indicate the historical P/E and dividend yields of the market:
Weekly Highlight:
- Q4’2021 Quarterly Economic Review
During the week, the Central Bank of Kenya (CBK) released the Quarterly Economic Review Report October-December 2021, for the period ending 31st December 2021, highlighting that the banking sector remained stable and resilient during the period. According to the report, the sector’s total assets increased by 3.2% to Kshs 6.0 tn in December 2021, from Kshs 5.8 tn in September 2021. The increase was mainly attributable to a 5.7% increase in loans and advances coupled with a 12.7% and 1.9% increase in placements and government securities during the quarter. On a yearly basis, total assets increased by 10.8% to Kshs 6.0 tn, from Kshs 5.4 tn in December 2020. Notably, net loans and advances accounted for 48.8% of total assets in Q4’2021, which was a 0.6% points decline from 49.4% of total assets in Q3’2021 and a 1.0% point decline from 49.8% of the total assets in Q4’2020.
Other key take-outs from the report include:
- The banking sector recorded a 0.4% increase in Profit before Tax (PBT) to Kshs 49.3 bn in Q4’2021, from Kshs 49.1 bn in Q3’2021, with the increase in profitability having been weighed down by a higher 8.4% increase in expenses to Kshs 117.5 bn from Kshs 108.4 bn, compared to the 5.9% increase in income to Kshs 166.7 bn, from Kshs 157.4 bn in Q4’2021. On a yearly basis, PBT increased by 108.9%, to Kshs 49.3 bn, from Kshs 23.6 bn recorded in Q4’2020,
- The sector’s Return on Assets (ROA) remained unchanged at 2.6% in Q4’2021, as was recorded in Q3’2021. Year on year, the Return on Assets increased by 1.0% point from 1.6%, recorded in Q4’2020. Additionally, Return On Equity (ROE) declined by 0.4% points to 21.6% from 22.0% in Q4’2021, but increased by 7.8% from 13.8%, recorded in Q4’2020,
- Lending increased by 1.7% to Kshs 3.25 tn in Q4’2021, from Kshs 3.19 tn in Q3’2021, attributable to an increase in loans and advances to trade, Personal and Household, as well as the Manufacturing sector which increased by 4.0%, 2.0% and 1.3%, respectively. On a yearly basis, lending was up by 8.3% to Kshs 3.2 tn, from Kshs 3.0 tn in Q4’2020,
- Deposits recorded a 2.2% increase to Kshs 4.4 tn in December 2021, from Kshs 4.3 tn in Q3’2021, attributable to a 1.1% increase in local currency deposits which increased to Kshs 3.4 tn in December 2021, from Kshs 3.3 tn in September 2021. Compared to last year, deposits increased by 10.4% to Kshs 4.4 tn in Q4’2021, from Kshs 4.0 tn in Q4’2020. Key to note, customer deposits remain the main source of funding for banks, accounting for 73.9% of the sector’s total liabilities and shareholders’ funds as at Q4’2021, 0.7% points and 0.3% points lower than the 74.6% and 74.2% that was recorded in Q3’2021 and Q4’2020, respectively,
- Credit risk remained elevated in the sector, despite the gross Non-Performing Loans (NPLs) ratio reducing to 13.1% in Q4’2021, from 13.6% in Q3’2021. The manufacturing sector registered the highest decrease in NPLs by 12.9% in Q4’2021 as a result of the continued economic recovery. Notably, the asset quality, improved compared to last year as the NPL ratio declined by 0.5% points to 13.6% in Q4’2021, from 14.1% in Q4’2020,
- The sector’s NPL coverage ratio increased to 54.1% in Q4’2021, from 53.5% in Q3’2021, an indication that the banks maintained the current relatively high provisioning levels to manage risks given the tough economic conditions. The NPL coverage as of Q4’2020 stood at 51.9%,
- The banking sector remained adequately capitalized, with the aggregate Core Capital to Total Risk-Weighted Assets ratio coming in at 16.7% in Q4’2021, 0.4% points higher than the 16.3% that was recorded in Q3’2021 and similar to what was recorded in Q4’2020. The Core Capital to Total Risk-Weighted Assets ratio was 6.2% points above the CBK’s minimum statutory ratio of 10.5%. On the other hand, Total Capital to Total Risk-Weighted Assets ratio, increased by 0.8% points to 19.6% in Q4’2021, from 18.8% in Q3’2021, and, up 0.4% points from 19.2% recorded in Q4’2020. The Q4’2021 Total Capital to Total Risk-Weighted Assets ratio was 5.1% points above the CBK’s minimum statutory ratio of 14.5%, and,
- The sector remained sufficiently liquid during the period under review, despite the liquidity ratio declining to 56.2% in Q4’2021, from 56.7% in Q3’2021. Year on year, the ratio increased by 1.6% points from 54.6% record in Q4’2020. This was 36.2% points above the minimum statutory level of 20.0%. The decline in the banking sector’s liquidity during the quarter is attributable to a 1.0% increase in total short-term liabilities, which outpaced the 0.1% increase in total liquid assets.
The increasing profitability in Q4’2021 points towards an improving economy and a continued recovery of the banking sector. We note that the banking sector’s asset quality has continued to improve in tandem with the gradual economic recovery. Going forward, we expect to see a similar trend as credit risk continues to decline following an improving business environment. However, risks lie on the downside on the back of uncertainties surrounding the August 2022 elections and the emergence of new COVID-19 variants. Further, the sector remains sufficiently capitalized and with adequate liquidity levels, evidenced by the capital adequacy and liquidity ratios remaining above the minimum statutory ratios. Overall, we expect the banking sector to remain resilient boosted by the CBK’s efforts to improve their liquidity positions by maintaining the Cash Reserve Ratio at 4.25%, proactive monitoring of the loan book by commercial banks and improved capital adequacy across the sector. Additionally, we expect the banking sector to redesign their operating models for loans, as well as establish a workflow management tool to aid in reducing the non-performing loans in order to support the improvement of the banks’ asset quality.
- Q4’2021 Insurance Industry Report
Recently, the Insurance Regulatory Authority of Kenya (IRA) released the Quarterly Insurance Industry Report for the period ending 31st December highlighting that the industry’s profits after tax increased by 16.3% to Kshs 5.7 bn, from Kshs 4.9 bn in Q4’2020 mainly driven by an 18.5% increase in net premium income to Kshs 221.5 bn, from Kshs 187.0 bn in Q4’2020, as the business environment improved. The industry’s gross premiums rose by 18.5% as well to Kshs 276.1 bn, from Kshs 233.0 bn recorded in Q4’2020, with the general insurance business contributing to 55.2% of the industry’s premium income, a 1.0% point decline from the 56.2% contribution witnessed in Q4’2020. However, the general insurance business has continued to report high underwriting losses mainly attributed to increases in loss ratios as the net claims outpace net premiums.
Other key take-outs from the report include:
- Investment income increased by 44.3% to Kshs 51.8 bn in Q4’2021, from Kshs 35.9 bn recorded in Q4’2020 for long term insurance businesses, and also increased by 15.7% for general insurance businesses to Kshs 11.6 bn, from Kshs 10.0 bn recorded in Q4’2020. The increases can be attributed to fair value gains on quoted equity investments in the capital market as evidenced by the increases in the NASI, NSE 25 and NSE 20 which posted gains of 9.5%, 9.8% and 1.6%, respectively, in 2021,
- The net claims for the long term insurance business increased by 19.5% to Kshs 81.0 bn, from Kshs 67.8 bn in Q4’2020, mainly driven by increased but modest requests from individuals wishing to access their pension benefits given the reduction in their disposable income. The loss ratio for the long term business declined slightly by 0.4% points to 70.4%, from 70.8% recorded in Q4’2020,
- The loss ratio for the general insurance businesses increased to 68.8% in Q4’2021, from 63.6% in Q4’2020 owing to a 22.3% increase in claims which outpaced the 16.7% increase in the net earned premium income. The increase in claims was mainly driven by the 38.5% growth in medical claims to Kshs 27.0 bn, from Kshs 21.0 bn in Q4’2020 coupled with a 50.5% growth in motor insurance claims to Kshs 35.4 bn from Kshs 29.4 bn. Key to note, the incurred loss ratio during the quarter of 68.8% is 4.6% points higher than the three-year industry average of 64.2%,
- The combined ratio for general insurance business increased by 0.7% points to 106.2% in Q4 2021, from 105.5% recorded in Q3'2021 and 4.9% points higher than the 101.3% recorded in Q4'2020. The increase in the combined ratio is mainly attributable to the increasing claims ratio, having increased by 5.2% points to 68.8% in Q4'2021, from 63.6% in Q4'2020, and,
- General insurance businesses recorded an underwriting loss of Kshs 6.3 bn in Q4’2021 as compared to a loss of Kshs 1.2 mn in Q4’2020. This increased loss was mainly driven by an 85.2% increase in Motor private class of general insurance loss to Kshs 6.2 bn from Kshs 3.3 bn in Q4’2021. Workmen’s compensation class made the highest underwriting profit of Kshs 2.8 bn while motor private and motor commercial classes of general insurance business incurred the highest losses of Kshs 6.2 bn and Kshs 3.3 bn respectively.
In our view, the insurance sector is expected to continue improving in 2022 as more people embark on insurance following an improving economic environment. We anticipate an increase in net premiums in tandem with the increase in disposable income as well as an increase in investment income mainly driven by gains recorded in both the equities and fixed income markets. However, risks abound the positive outlook on the back of the high loss ratios and ahead of the August 2022 elections which are likely to have a negative effect on investment performance and the net claims.
Earnings Releases
During the week, Equity Group and NCBA Group released their FY’2021 financial results. Below is a summary of their performance;
- Equity Group
|
Equity Group FY’2021 Key Highlights |
|||||
|
Balance Sheet |
|||||
|
Balance Sheet Items |
FY'2020 (Kshs bn) |
FY'2021 (Kshs bn) |
y/y change |
||
|
Net Loans and Advances |
477.8 |
587.8 |
23.0% |
||
|
Government Securities |
175.7 |
228.5 |
30.0% |
||
|
Total Assets |
1,015.1 |
1,304.9 |
28.6% |
||
|
Customer Deposits |
740.8 |
959.0 |
29.5% |
||
|
Deposits per Branch |
2.2 |
2.8 |
29.1% |
||
|
Total Liabilities |
876.5 |
1128.7 |
28.8% |
||
|
Shareholders’ Funds |
132.2 |
169.2 |
28.0% |
||
|
Income Statement |
|||||
|
Income Statement Items |
FY'2020 (Kshs bn) |
FY'2021 (Kshs bn) |
y/y change |
||
|
Net Interest Income |
55.1 |
68.8 |
24.8% |
||
|
Net non-Interest Income |
38.5 |
44.6 |
15.8% |
||
|
Total Operating income |
93.7 |
113.4 |
21.1% |
||
|
Loan Loss provision |
(26.6) |
(5.8) |
(78.1%) |
||
|
Total Operating expenses |
(72.7) |
(61.5) |
(15.4%) |
||
|
Profit before tax |
22.2 |
51.9 |
134.0% |
||
|
Profit after tax |
20.1 |
40.1 |
99.4% |
||
|
Core EPS |
5.3 |
10.6 |
99.4% |
||
|
Key Ratios |
|||||
|
Income Statement Ratios |
FY'2020 |
FY'2021 |
% point change |
||
|
Yield from interest-earning assets |
10.1% |
9.3% |
(0.8%) |
||
|
Cost of funding |
2.70% |
2.65% |
(0.05%) |
||
|
Cost of risk |
28.4% |
5.2% |
(23.2%) |
||
|
Net Interest Margin |
7.6% |
6.8% |
(0.8%) |
||
|
Net Interest Income as % of operating income |
58.9% |
60.7% |
1.8% |
||
|
Non-Funded Income as a % of operating income |
41.1% |
39.3% |
(1.8%) |
||
|
Cost to Income Ratio |
77.6% |
54.2% |
(23.4%) |
||
|
Cost to Income Ratio without LLP |
49.2% |
49.1% |
(0.1%) |
||
|
Cost to Assets |
5.5% |
4.8% |
(0.7%) |
||
|
Capital Adequacy Ratios |
|||||
|
Ratios |
FY'2020 |
FY'2021 |
% points change |
||
|
Core Capital/Total Liabilities |
16.2% |
14.2% |
(2.0%) |
||
|
Minimum Statutory ratio |
8.0% |
8.0% |
0.0% |
||
|
Excess |
8.2% |
6.2% |
(2.0%) |
||
|
Core Capital/Total Risk Weighted Assets |
14.8% |
12.9% |
(1.9%) |
||
|
Minimum Statutory ratio |
10.5% |
10.5% |
0.0% |
||
|
Excess |
4.3% |
2.4% |
(1.9%) |
||
|
Total Capital/Total Risk Weighted Assets |
18.9% |
17.7% |
(1.2%) |
||
|
Minimum Statutory ratio |
14.5% |
14.5% |
0.0% |
||
|
Excess |
4.4% |
3.2% |
(1.2%) |
||
Key take-outs from the earnings release include;
- Core earnings per share increased by 99.4% to Kshs 10.6 in FY’2021, from Kshs 5.3 recorded in FY’2020, higher than our projections of an 84.0% increase to Kshs 9.8. The performance was driven by a 21.1% growth in total operating income to Kshs 113.4 bn, from Kshs 93.7 bn in FY’2020, coupled with a 15.4% decline in total operating expenses to Kshs 61.5 bn, from Kshs 72.7 bn in FY’2020,Key take-outs from the earnings release include;
- Interest income increased by 27.9% to Kshs 94.3 bn, from Kshs 73.8 bn in FY’2020 driven by a 22.6% increase in interest income on loans and advances to Kshs 63.8 bn, from Kshs 52.0 bn recorded in FY’2020, coupled with a 40.7% increase in interest income from government securities to Kshs 29.5 bn, from Kshs 20.9 bn in FY’2020,
- he Yield on Interest-Earning Assets, however, declined by 0.8% points to 9.3%, from 10.1% in FY’2020, as the average interest-earning assets grew faster by 39.1% to Kshs 1,014.7 bn, from Kshs 729.3 bn in FY’2020 compared to the 27.9% increase in trailing interest income,
- Interest expense rose by 37.2% to Kshs 25.5 bn, from Kshs 18.6 bn in FY’2020, following a 30.3% increase in interest expense on customer deposits to Kshs 17.9 bn, from Kshs 13.7 bn in FY’2020, coupled with a 70.9% increase in other interest expenses to Kshs 6.1 bn, from Kshs 3.6 bn in FY’2020. Cost of funds declined marginally to 2.65%, from 2.70% in FY’2020, owing to the 39.8% growth in the average interest-bearing liabilities, which outpaced the faster 37.2% growth in trailing interest expense,
- Net Interest Margin (NIM) however declined to 6.8%, from 7.6% in FY’2020, attributable to the 39.1% growth in average interest-earning assets, which outpaced the 24.8% growth of trailing Net Interest Income (NII),
- Total operating expenses declined by 15.4% to Kshs 61.5 bn in FY’2021, from Kshs 72.7 bn recorded in FY’2020, mainly due to a 78.1% decline in Loans Loss Provision to Kshs 5.8 bn in FY’2021, from Kshs 26.6 bn recorded in FY’2020. The reduced provisioning level was due to declining credit risk on the back of increased business activities in 2021 driven by the gradual economic recovery. On the other hand, Staff Costs grew by 23.9% to Kshs 19.1 bn in FY’2021 from Kshs 15.4 bn recorded in FY’2020,
- The balance sheet recorded an expansion as Total Assets increased by 28.6% to Kshs 1,304.9 bn in FY’2021, from Kshs 1,015.1 bn recorded in FY’2020. This growth was largely driven by the 0% growth of the loan book to Kshs 587.8 bn, from Kshs 477.8 bn recorded in FY’2020, coupled with a 30.0% growth in Government securities to Kshs 228.5 bn in FY’2021, from Kshs 175.7 bn in FY’2020. The remarkable expansion in the balance sheet is also partly attributable to the 66.5% stake acquisition of Banque Commerciale Du Congo (BCDC) in August 2020. BCDC contributed Kshs 419.8 bn worth of assets in FY’2021 to the Group – 32.2% of the total assets,
- Total liabilities rose by 28.8% to Kshs 1,128.7 bn, from Kshs 876.5 bn in FY’2020, driven by a 29.5% increase in customer deposits to Kshs 959.0 bn, from Kshs 740.8 bn in FY’2020. Key to note, the strong growth in customer deposits is mainly attributable to the acquisition of BCDC, with the subsidiary contributing Kshs 361.4 bn to the total deposits – 32.0% of total deposits,
- Deposits per branch increased by 29.1% to Kshs 2.8 bn, from Kshs 2.2 bn in FY’2020, with the number of branches increasing by 1 to 337 branches in FY’2021, from 336 in FY’2020, with Equity Bank Rwanda contributing 1 additional branch,
- Gross Non-Performing Loans (NPLs) reduced by 9.3% to Kshs 53.9 bn in FY’2021, from Kshs 59.4 bn recorded in FY’2020. The group’s asset quality improved, with the NPL ratio declining to 8.6% in FY’2021, from 11.5% recorded in FY’2020, attributable to the 9.3% decline in Gross Non-Performing Loans (NPLs) coupled with a 21.3% growth in gross loans. The main sectors that contributed to the Non-Performing Loans were MSMEs and Agriculture, which contributed 18.5% and 6.5%, respectively. The group’s Tanzanian subsidiary recorded the highest NPL ratio, coming in at 23.3% in FY’2021, with Equity Bank Kenya recording an NPL ratio of 8.2% in FY’2021,
- With the general Loan Loss Provisions declining by 2.2% to Kshs 27.7 bn, from Kshs 28.3 bn in FY’2020, slower than the 9.3% decline in the Gross Non-Performing Loans, the NPL coverage improved to 68.7%, from 62.4% in FY’2020, an indication of sufficient provisioning, and,
- Equity Group is currently sufficiently capitalized with a core capital to risk-weighted assets ratio of 12.9%, 2.4% points above the minimum statutory requirement of 10.5%. In addition, the total capital to risk-weighted assets ratio was 17.7%, exceeding the minimum statutory requirement of 14.5% by 3.2% points. Adjusting for IFRS 9, the core capital to risk-weighted assets stood at 12.9% while total capital to risk-weighted assets came in at 17.7%.
For a comprehensive analysis, please see our Equity Group FY’2021 Earnings Note
- NCBA Group
|
NCBA Group FY’2021 Key Highlights |
|||||
|
Balance Sheet |
|||||
|
Balance Sheet Items |
FY’2020 (Kshs bn) |
FY’2021 (Kshs bn) |
y/y change |
||
|
Net Loans and Advances |
248.5 |
244.0 |
(1.8%) |
||
|
Government Securities |
148.3 |
196.1 |
32.2% |
||
|
Total Assets |
528.0 |
591.1 |
12.0% |
||
|
Customer Deposits |
421.5 |
469.9 |
11.5% |
||
|
Deposits per Branch |
5.4 |
6.0 |
11.4% |
||
|
Total Liabilities |
455.4 |
513.1 |
12.7% |
||
|
Shareholders’ Funds |
72.3 |
77.9 |
7.6% |
||
|
Income Statement |
|||||
|
Income Statement Items |
FY'2020 (Kshs bn) |
FY'2021 (Kshs bn) |
y/y change |
||
|
Net Interest Income |
17.0 |
20.2 |
19.1% |
||
|
Net non-Interest Income |
16.1 |
16.1 |
(0.2%) |
||
|
Total Operating income |
33.1 |
36.3 |
9.7% |
||
|
Loan Loss provision |
13.4 |
9.2 |
(31.3%) |
||
|
Total Operating expenses |
28.6 |
24.7 |
(13.8%) |
||
|
Profit before tax |
3.8 |
11.1 |
192.0% |
||
|
Profit after tax |
2.5 |
6.5 |
159.0% |
||
|
Core EPS |
1.5 |
4.0 |
159.0% |
||
|
Key Ratios |
|||||
|
Income Statement Ratios |
FY'2020 |
FY'2021 |
% point change |
||
|
Yield from interest-earning assets |
6.1% |
10.2% |
4.1% |
||
|
Cost of funding |
3.1% |
4.1% |
1.1% |
||
|
Net Interest Spread |
3.1% |
6.1% |
3.0% |
||
|
Net Interest Margin |
3.2% |
6.2% |
3.0% |
||
|
Cost of Risk |
40.4% |
25.3% |
(15.1%) |
||
|
Net Interest Income as % of operating income |
51.3% |
55.7% |
4.4% |
||
|
Non-Funded Income as a % of operating income |
48.7% |
44.3% |
(4.4%) |
||
|
Cost to Income Ratio |
86.5% |
68.0% |
(18.5%) |
||
|
Capital Adequacy Ratios |
|||||
|
Ratios |
FY'2020 |
FY'2021 |
% point change |
||
|
Core Capital/Total Liabilities |
15.4% |
16.8% |
1.4% |
||
|
Minimum Statutory ratio |
8.0% |
8.0% |
0.0% |
||
|
Excess |
7.4% |
8.8% |
1.4% |
||
|
Core Capital/Total Risk Weighted Assets |
17.3% |
19.0% |
1.7% |
||
|
Minimum Statutory ratio |
10.5% |
10.5% |
0.0% |
||
|
Excess |
6.8% |
8.5% |
1.7% |
||
|
Total Capital/Total Risk Weighted Assets |
17.5% |
19.1% |
1.6% |
||
|
Minimum Statutory ratio |
14.5% |
14.5% |
0.0% |
||
|
Excess |
3.0% |
4.6% |
1.6% |
||
Key take-outs from the earnings release include;
- Core earnings per share increased by 123.7% to Kshs 6.2 from Kshs 2.8 in FY’2020 higher than our projections of a 78.6% increase to Kshs 5.0. The performance in the earnings per share was driven by the 5.8% growth in total operating income to Kshs 49.2 bn, from Kshs 46.4 bn in FY’2020 coupled with the 16.4% decline in total operating expenses to Kshs 33.4 bn from Kshs 40.0 bn,
- Interest income rose by 5.1% to Kshs 46.5 bn, from Kshs 44.2 bn in FY’2020 mainly driven by a 20.9% growth in interest income from government securities to Kshs 20.3 bn, from Kshs 16.8 bn in FY’2020. The growth was however weighed down by a 4.3% decline in interest income from loans and advances to Kshs 25.5 bn, from Kshs 26.7 bn in FY’2020,
- The yield on interest-earning assets marginally declined by 0.3% points to 10.0% in FY’2021, from 10.3% in FY’2020, due to the faster 10.0% growth in average interest-earning assets to Kshs 485.2 bn, from Kshs 441.0 bn in FY’2020, compared to the 5.1% growth in trailing Interest Income
- Interest expense rose by 3.9% to Kshs 19.5 bn, from Kshs 18.8 bn in FY’2020, mainly attributable to a 7.8% increase in interest expense on customer deposits to Kshs 18.5 bn, from Kshs 17.2 bn in FY’2020. The growth was mitigated by a 45.7% decline in other interest expenses to Kshs 0.7 bn in FY’2021, from Kshs 1.3 bn coupled with an 11.8% decline in expenses in deposits and placements from banking institutions to Kshs 266.8 mn, from Kshs 302.5 mn in FY’2020. Cost of funds declined to 4.2% from 4.4% in FY’2020 owing to the 16.4% decline in trailing interest expense compared to the 10.9% growth recorded on average interesting bearing liabilities,
- The Net Interest Margin came in at 5.8%, higher than the 5.9% seen in 2020, due to the slower 6.1% growth in Net Interest Income, compared to the 10.0% growth seen in the average interest-earning assets,
- Total operating expenses declined by 16.4% to Kshs 33.4 bn, from Kshs 40.0 bn in FY’2020, largely driven by the 37.8% decline in loan loss provision to Kshs 12.7 bn, from Kshs 20.4 bn in FY’2020. The lower provisioning level was caused by declining credit risk as a result of increased business activity in 2021 on the back of the gradual economic recovery. Staff costs increased by 10.0% to Kshs 8.0 bn, from Kshs 7.2 bn recorded in FY’2020,
- The balance sheet recorded an expansion with total assets growth of 12.0% to Kshs 591.1 bn, from Kshs 528.0 bn in FY’2020. This growth was largely driven by a 32.2% increase in government securities to Kshs 196.1 bn, from the Kshs 148.3 bn recorded in FY’2020. The loan book on the other hand, contracted by 1.8% to Kshs 244.0 bn, from Kshs 248.5 bn in FY’2020, partly attributable to the bank’s cautious lending owing to their increasing non-performing loans,
- Total liabilities rose by 12.7% to Kshs 513.1 bn, from Kshs 455.4 bn in FY’2020, driven by an 11.5% growth in customer deposits to Kshs 469.9 bn, from Kshs 421.5 bn in FY’2020. Additionally, placements by other banking institutions increased by 134.4% to the Kshs 14.8 bn recorded in FY’2021, from Kshs 6.3 bn in FY’2020,
- Deposits per branch declined by 4.6% to Kshs 4.5 bn, from Kshs 4.7 bn in FY’2021, with the number of branches increasing by 15 to 104 branches in FY’2021 from 89 branches in FY’2021. In its continued branch expansion strategy, the group plans to open 11 more branches in Kenya,
- Gross non-performing loans (NPLs) rose by 10.7% to Kshs 44.3 bn in FY’2021, from Kshs 40.1 bn in FY’2020. Consequently, the NPL ratio rose to 16.0% in FY’2021, from 14.7% in FY’2020 attributable to the faster 10.7% increase in NPLs that outpaced the 1.4% increase in gross loans which came in at Kshs 276.7 bn in FY’2021, from the Kshs 272.1 bn in FY’2020. General loan loss provisions increased by 36.8% to Kshs 24.4 bn, from Kshs 17.8 bn in FY’2020,
- The NPL coverage rose to 73.6% in FY’2021, from 60.9% owing to the faster 36.8% increase in general loan loss provisions, compared to the 10.7% growth in gross NPLs, and,
- NCBA Group is currently sufficiently capitalized with a core capital to risk weighted assets ratio of 19.0%, 8.5% above the statutory requirement. In addition, the total capital to risk weighted assets ratio was 19.1%, exceeding the statutory requirement by 4.6%. Adjusting for IFRS 9, the core capital to risk weighted assets stood at 19.8%, while total capital to risk weighted assets came in at 19.9%.
For a comprehensive analysis, please see our NCBA Group FY’2021 Earnings Note
Asset Quality
The table below is a summary of the asset quality for the banks that have released
|
|
FY'2020 NPL Ratio** |
FY'2021 NPL Ratio* |
% point change in NPL Ratio |
FY'2020 NPL Coverage** |
FY'2021 NPL Coverage* |
% point change in NPL Coverage |
|
ABSA Bank Kenya |
7.7% |
7.9% |
0.2% |
71.1% |
77.7% |
6.6% |
|
Equity Group |
11.5% |
8.6% |
(2.9%) |
62.4% |
68.7% |
6.3% |
|
Stanbic Bank |
11.8% |
9.3% |
(2.5%) |
60.6% |
51.8% |
(8.8%) |
|
Co-operative Bank of Kenya |
18.7% |
14.6% |
(4.1%) |
50.3% |
60.6% |
10.3% |
|
NCBA Group |
14.7% |
16.0% |
1.3% |
60.9% |
73.6% |
12.7% |
|
Standard Chartered Bank Kenya |
16.0% |
16.0% |
(0.0%) |
80.6% |
84.4% |
3.8% |
|
KCB Group |
14.8% |
16.6% |
1.8% |
59.8% |
52.9% |
(6.9%) |
|
Mkt Weighted Average |
14.2% |
13.8% |
(0.4%) |
62.8% |
63.1% |
0.3% |
|
*Market cap weighted as at 25/03/2021 |
||||||
|
**Market cap weighted as at 15/04/2020 |
||||||
Key take-outs from the table include;
- Asset quality for the listed banks that have released their FY’2021 results improved during the period, with the weighted average NPL ratio declining by 0.4% points to a market cap weighted average of 13.8%, from an average of 14.2% for the listed banking sector in FY’2020. The improvement in asset quality is attributable to declining credit risk on the back of increased business activities in 2021 driven by the gradual economic recovery,
- NPL Coverage for the listed banks increased to a market cap weighted average of 63.1% in FY’2021, from 62.8% recorded in FY’2020, as the banks increased their provisioning levels to proactively manage risks brought about by the emergence of new COVID-19 variants coupled with the slow recovery of some sectors such as tourism and hospitality and,
- KCB Group recorded a decline in their NPL coverage despite the NPL ratio rising, which would suggest modest provisioning. Given the slow recovery in some sectors locally and the high NPL ratios in some of the group’s subsidiaries, we expected the group to maintain the high provisioning to cater for the existing credit risk. Key to note, If KCB’s NPL Coverage remained at the 59.8% level recorded in 2020, the bank would have had an additional provisioning of Kshs 8.4 bn, which would have reduced the earnings per share from the reported Kshs 10.6 to Kshs 8.6.
Summary Performance
The table below highlights the performance of the banks that have released so far, showing the performance using several metrics, and the key take-outs of the performance;
|
Bank |
Core EPS Growth |
Interest Income Growth |
Interest Expense Growth |
Net Interest Income Growth |
Net Interest Margin |
Non-Funded Income Growth |
NFI to Total Operating Income |
Growth in Total Fees & Commissions |
Deposit Growth |
Growth in Government Securities |
Loan to Deposit Ratio |
Loan Growth |
Return on Average Equity |
|
ABSA |
161.2% |
1.9% |
15.9% |
8.0% |
7.1% |
4.7% |
31.6% |
11.6% |
5.9% |
5.2% |
87.2% |
12.2% |
21.1% |
|
NCBA |
123.7% |
5.1% |
3.9% |
6.1% |
5.9% |
5.6% |
45.0% |
2.5% |
11.5% |
20.9% |
51.9% |
(1.8%) |
13.6% |
|
Equity |
99.4% |
27.9% |
37.2% |
24.8% |
6.8% |
15.8% |
39.3% |
29.4% |
29.5% |
30.0% |
61.3% |
23.0% |
26.6% |
|
KCB |
74.3% |
15.1% |
17.6% |
14.4% |
8.4% |
8.8% |
28.0% |
9.0% |
9.1% |
29.7% |
80.7% |
13.5% |
21.8% |
|
SCBK |
66.2% |
(6.1%) |
(24.7%) |
(1.6%) |
6.4% |
24.9% |
35.5% |
19.9% |
3.5% |
(4.2%) |
47.5% |
3.7% |
17.4% |
|
Co-op |
53.0% |
13.9% |
17.0% |
12.9% |
8.0% |
11.0% |
32.1% |
18.1% |
7.7% |
13.7% |
76.1% |
8.2% |
17.3% |
|
Stanbic |
43.2% |
1.6% |
15.2% |
12.2% |
6.2% |
4.2% |
42.6% |
(8.5%) |
(5.8%) |
(17.4%) |
83.0% |
11.2% |
14.0% |
|
FY'21 Mkt Weighted Average* |
81.0% |
8.2% |
11.1% |
10.5% |
7.6% |
10.3% |
32.0% |
11.0% |
5.9% |
12.5% |
76.5% |
10.6% |
19.3% |
|
FY'20 Mkt Weighted Average** |
(26.8%) |
16.7% |
12.5% |
18.9% |
7.3% |
6.4% |
35.4% |
(2.1%) |
22.3% |
26.3% |
69.8% |
11.7% |
13.2% |
|
*Market cap weighted as at 25/03/2021 |
|||||||||||||
|
**Market cap weighted as at 15/04/2020 |
|||||||||||||
Key takeaways from the table above include:
- The listed banks that have released recorded an 81.0% weighted average growth in core Earnings per Share (EPS), compared to a weighted average decline of 26.8% in FY’2020 for the listed banking sector. The performance is however largely skewed by the strong performance from ABSA Bank and NCBA whose core EPS grew by 161.2% and 123.7%, respectively,
- The Banks have recorded a weighted average deposit growth of 5.9%, slower than the 22.3% growth recorded in FY’2020,
- Interest expense grew at a slower pace, by 11.1%, compared to the 12.5% growth in FY’2020. Similarly, cost of funds declined, coming in at a weighted average of 2.6% in FY’2021, from 2.9% in FY’2020, owing to the faster growth in average interest-bearing liabilities, an indication that the listed banks were able to mobilize cheaper deposits,
- Average loan growth came in at 10.6%, 1.1% points lower than the 11.7% growth recorded in FY’2020. Additionally, the loan growth was lower than the 12.5% growth in government securities, an indication that banks shied away from lending due to uncertainties surrounding the emergence of new COVID-19 variants coupled with the slow recovery of some sectors such as tourism and hospitality,
- Interest income grew by 8.2%, compared to a growth of 16.7% recorded in FY’2020 while the weighted average Yield on Interest Earning Assets (YIEA) increased to 9.9%, from the 9.5% recorded in FY’2020 for the listed banking sector, an indication of the increased allocation to higher-yielding assets by the sector during the period. Consequently, the Net Interest Margin (NIM) now stands at 7.6%, 0.3% points higher than the 7.3% recorded in FY’2020 for the whole listed banking sector, and,
- Non-Funded Income grew by 10.3%, compared to the 6.4% growth recorded in FY’2020. This can be attributable to the faster growth in the fees and commission which grew by 11.0% compared to a decline of 2.1% in FY’2020, following the expiry of the waiver on fees on mobile transactions.
Cytonn Coverage:
|
Company |
Price as at 18/03/2023 |
Price as at 25/03/2024 |
w/w change |
YTD Change |
Year Open 2022 |
Target Price* |
Dividend Yield |
Upside/ Downside** |
P/TBv Multiple |
Recommendation |
|
Kenya Reinsurance |
2.3 |
2.3 |
(0.9%) |
(1.7%) |
2.3 |
3.2 |
8.8% |
50.1% |
0.2x |
Buy |
|
Jubilee Holdings |
275.3 |
274.0 |
(0.5%) |
(13.5%) |
316.8 |
381.7 |
3.3% |
42.6% |
0.5x |
Buy |
|
I&M Group*** |
20.7 |
21.2 |
2.4% |
(0.9%) |
21.4 |
24.4 |
10.9% |
25.9% |
0.6x |
Buy |
|
KCB Group*** |
44.6 |
44.0 |
(1.3%) |
(3.4%) |
45.6 |
51.4 |
6.7% |
23.4% |
0.9x |
Buy |
|
Liberty Holdings |
6.5 |
6.3 |
(3.7%) |
(11.3%) |
7.1 |
7.7 |
0.0% |
22.3% |
0.5x |
Buy |
|
Equity Group*** |
52.0 |
51.5 |
(1.0%) |
(2.4%) |
52.8 |
56.6 |
5.8% |
15.7% |
1.3x |
Accumulate |
|
Britam |
6.9 |
6.8 |
(0.6%) |
(9.5%) |
7.6 |
7.9 |
0.0% |
15.1% |
1.1x |
Accumulate |
|
NCBA*** |
25.0 |
25.9 |
3.8% |
1.8% |
25.5 |
26.4 |
12.0% |
13.9% |
0.6x |
Accumulate |
|
Stanbic Holdings |
100.0 |
102.0 |
2.0% |
17.2% |
87.0 |
105.2 |
9.0% |
12.1% |
0.9x |
Accumulate |
|
Co-op Bank*** |
13.3 |
12.9 |
(3.0%) |
(0.8%) |
13.0 |
13.1 |
7.5% |
8.8% |
1.0x |
Hold |
|
Diamond Trust Bank*** |
56.5 |
57.0 |
0.9% |
(4.2%) |
59.5 |
61.8 |
0.0% |
8.4% |
0.2x |
Hold |
|
Standard Chartered*** |
139.8 |
142.0 |
1.6% |
9.2% |
130.0 |
137.7 |
10.0% |
7.0% |
1.1x |
Hold |
|
Sanlam |
11.0 |
11.4 |
3.6% |
(1.3%) |
11.6 |
12.1 |
0.0% |
5.8% |
1.2x |
Hold |
|
ABSA Bank*** |
12.4 |
12.4 |
(0.4%) |
5.1% |
11.8 |
11.9 |
8.9% |
5.3% |
1.2x |
Hold |
|
CIC Group |
2.1 |
2.0 |
(2.9%) |
(7.4%) |
2.2 |
1.9 |
0.0% |
(6.3%) |
0.7x |
Sell |
|
HF Group |
3.1 |
3.2 |
4.5% |
(15.0%) |
3.8 |
3.0 |
0.0% |
(8.6%) |
0.2x |
Sell |
|
*Target Price as per Cytonn Analyst estimates **Upside/ (Downside) is adjusted for Dividend Yield ***For Disclosure, these are stocks in which Cytonn and/or its affiliates are invested in |
||||||||||
We are “Neutral” on the Equities markets in the short term. With the market currently trading at a premium to its future growth (PEG Ratio at 1.2x), we believe that investors should reposition towards value stocks with strong earnings growth and that are trading at discounts to their intrinsic value. We expect the discovery of new COVID-19 variants, the upcoming Kenyan general elections and the slow vaccine rollout to continue weighing down the economic outlook. On the upside, we believe that the relaxation of COVID-19 containment measures in the country will lead to improved investor sentiments.
- Industry Reports
During the week, the Central Bank of Kenya (CBK), released the Quarterly Economic Review Report October-December 2021, and the key take-outs were as follows;
- The gross loans advanced to the Real Estate sector decreased by 1.5% to Kshs 456.0 bn in FY’2021, from Kshs 463.0 bn in Q3’2021. On a YoY basis, this was an increase of 3.9% from the Kshs 439.0 bn realized in FY’2020. Additionally, gross loans advanced to the Tourism sector also increased by 0.9% to Kshs 107.0 bn in FY’2021, from Kshs 106.0 bn in Q3’2021 and 4.9% from Kshs 102.0 bn in FY’2020,
- Gross loans advanced to the Building and Construction sector increased by 4.1% to Kshs 128.0 bn in FY’2021, from Kshs 123.0 bn in Q3’2021, similar to FY’2020. This was mainly attributed to increased construction activities in select Real Estate sectors such as the residential sector which has witnessed activities due to improved business environment,
- The Gross Non Performing Loans in the Real Estate sector increased by 7.9% to Kshs 74.7 bn in FY’2021, from Kshs 69.2 bn recorded in Q3’2021. On a YoY basis, the performance represented a 21.6% increase from Kshs 61.4 bn realized in FY’2020, attributed to increased Real Estate loan default rates due to the tough economic environment, and,
- The gross NPLs to gross loans ratio decreased to 13.1% in FY’2021, from 13.6% in Q3’2021. This was due to a 2.0% decrease in gross NPLs as compared to a 1.7% increase in gross loans.
The graph below shows the number of Real Estate non-performing loans compared to the total Real Estate loan book from 2016-2021;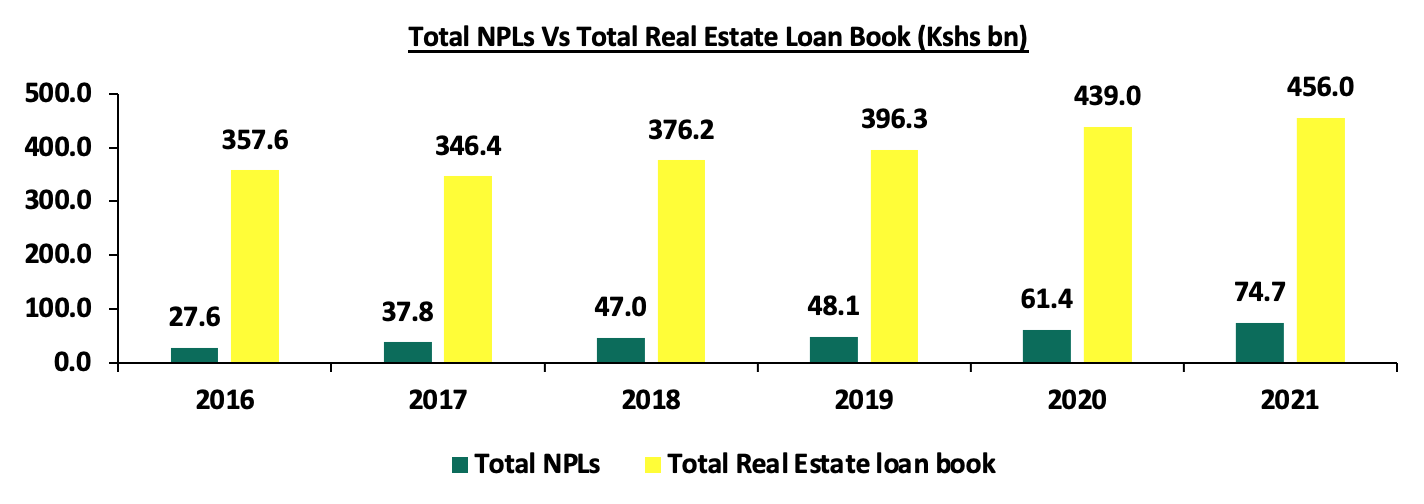
Source: Central Bank of Kenya
We expect the Real Estate sector’s performance to be driven by expected increase in visitor arrivals into the country hence boosting the performance of hospitality sector coupled with the increased infrastructural developments thereby opening up various areas for investments. Despite this, we expect lending to the Real Estate sector to continue being muted in the medium term, given the high NPLs, which have been growing at a 5-year CAGR of 22.0% to Kshs 74.7 bn in FY’2021, from Kshs 27.6 bn in FY’2016.
- Residential Sector
During the week, Pan- African mortgage lender, Shelter Afrique in partnership with the Centre for Affordable Housing Finance in Africa (CAHF) developed a ‘Housing Affordability Calculator’ to vet proposals by developers pitching for financing of affordable housing. To gauge affordability, the calculator will apply background data and assumptions based on the prevailing mortgage terms in individual countries, percentage of monthly household income spent on transport based on distance of house from city centre, and percentage of monthly household income spent on transport and housing for each income band. Other benefits that the housing affordability calculator will offer include;
- Enhancing understanding of housing affordability as it pertains to the demand and supply sides in the context of African countries,
- Assisting banks to vet projects using the criteria to ensure affordability of the purchase price, finance and the cost of living,
- Enable Shelter Afrique evaluate housing project proposals submitted, with respect to whether the units proposed are likely to be affordable to a low income target market in that location,
- Streamlining the pricing process for affordable homes through ensuring that developers put up prices at standardized prices thereby limiting overpricing of units while claiming to put up affordable houses, and,
- Hasten implementation of state policy on beneficiaries of tax incentives for affordable housing since the houses will be priced affordably to increase home ownership. In Kenya such incentives by the government include; scrapped stamp duty for first-time buyers, provision of bulk infrastructure such as drainage and utilities and reduced corporate tax from 30.0% to 15.0% for developers.
The move by Shelter Afrique and CAHF is expected to result to effective demand of the affordable housing units developed thus mitigating the risk of overpriced houses that would have had a downturn on the demand. In Kenya, the Affordable Housing Programme has so far delivered about 1,600 units only cumulatively, thus falling short of the targeted 500,000 units by 2022. Additionally, home ownership continued to lag behind at 21.3% in Kenya, compared to other countries in Africa such as South Africa and Ghana with 53.0% and 47.2%, hence we expect that the move by Shelter Afrique to ensure affordable house prices will increase demand and hence enhance home ownership in Kenya. The graph below shows the home ownership percentages of different countries compared to Kenya;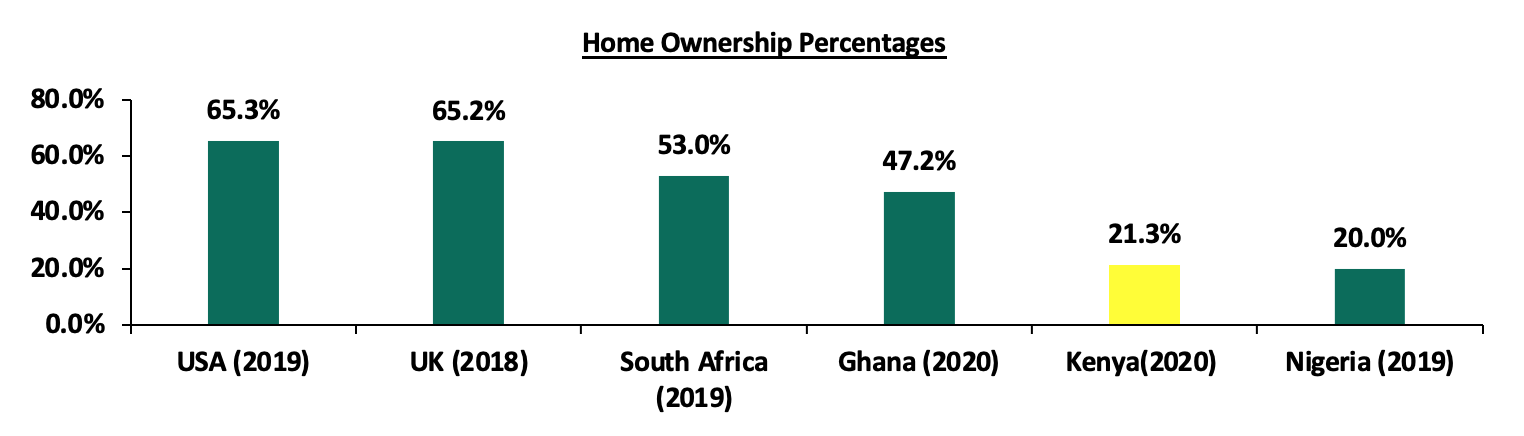
Source: Centre for Affordable Housing Africa, Federal Reserve
We expect the residential sector to record increased activities on the affordable housing front supported by; i) efforts to standardize house prices to boost affordability, ii) availability of affordable mortgages through firms such as Shelter Afrique, and, iiI) demand for affordable housing units by the growing Kenyan middle class.
- Retail Sector
- Naivas announces plans to open 3 more stores
During the week Naivas supermarket, a local retail chain, announced plans to open 3 new outlets in the next few weeks. One of the outlets will be located at Kiambu Mall along Kiambu Road at a space that was previously occupied by troubled Botswana retailer Choppies Supermarket. The Kiambu Mall outlet and the second outlet which will be located at Safari Center in Naivasha are set to be opened by 14th April 2022. The third store will be opened in Meru on a date that is yet to be specified by the retailer. Currently, Naivas operates 82 outlets, having opened 3 outlets so far this year, with the latest being at Katani, along Mombasa Road.
The retailer’s decision to expand in Kiambu Road is supported by presence of a good transport network as the area is mainly served by, Kiambu Road and easily accessible through Boma Road and Ruiru-Kamiti Road which will enhance client and supplier accessibility, i) the strategic positioning of the mall which will provide a high footfall from residents of the surrounding estates, and, iii) presence of the prime space left by troubled retailers such as Choppies. In terms of performance, according to the Cytonn Annual Markets Review-2021, Satellite Towns where Kiambu Mall is categorized recorded average rent per SQFT of Kshs 142, which is 16.5% lower than the market average of Kshs 170 per SQFT with a relatively high rental yield of 6.2%.
The table below shows the submarket performance of nodes in the Nairobi Metropolitan Area (NMA);
|
Nairobi Metropolitan Area Retail Market Performance FY’2021 |
|||
|
Area |
Rent/SQFT FY’2021 (Kshs) |
Occupancy% FY’2021 |
Rental Yield FY’2021 |
|
Westlands |
213 |
78.8% |
10.0% |
|
Karen |
202 |
84.0% |
9.8% |
|
Kilimani |
183 |
86.0% |
9.8% |
|
Ngong Road |
171 |
79.0% |
7.7% |
|
Kiambu Road |
180 |
74.2% |
7.7% |
|
Mombasa Road |
148 |
75.0% |
6.8% |
|
Thika Road |
161 |
74.0% |
6.7% |
|
Satellite Towns |
142 |
69.0% |
6.2% |
|
Eastlands |
133 |
71.6% |
5.6% |
|
Average |
170 |
76.8% |
7.8% |
Source: Cytonn Research
On the other hand, according to Kenya Retail Report 2021, Nakuru County where Safari Center is located, recorded average rent per SQFT of Kshs 59 , which is 39.9% lower than the market average of Kshs 118 per SQFT in the Kenyan retail market. The retailer’s decision to invest in the area is also supported by other factors such as; i) strategic location of the mall along Nairobi-Nakuru Road thus promoting accessibility, and, ii) increased demand evidenced by Nakuru’s high population growth rate at 3.2%, a 0.9% points higher than Kenya’s growth rate at 2.3%.
Additionally, Mount Kenya where Meru is classified recorded an average rent per SQFT of Kshs 128 with an occupancy rate of 81.7% thus bringing its rental yield to 7.9%, 1.1% points higher than the market average of 6.8%. Other factors supporting expansion in Mount Kenya include; i) positive demographics with Meru having a population of 1.5 mn as of 2019, 7.1% higher than 1.4 mn recorded in 2009, according to KNBS, ii) the attractiveness of the region as a tourist hub in close proximity to key tourist attractions such as the Ol Pejeta Conservancy in Nanyuki and Mount Kenya National Park, and, iii) a growing middle class with increased consumer purchasing power. The table below shows performance of the key urban centers in Kenya;
|
Summary of Retail Performance in Key Urban Cities in Kenya 2021 |
|||
|
Region |
Rent/ SQFT 2021 |
Occupancy Rate 2021 |
Rental yield 2021 |
|
Mount Kenya |
128 |
81.7% |
7.9% |
|
Nairobi |
168 |
75.8% |
7.5% |
|
Mombasa |
119 |
77.6% |
6.8% |
|
Kisumu |
101 |
74.6% |
6.4% |
|
Eldoret |
131 |
80.8% |
6.3% |
|
Nakuru |
59 |
80.0% |
6.1% |
|
Average |
118 |
78.4% |
6.8% |
Source: Cytonn Research, 2021
The table below shows the summary of the number of stores of the key local and international retailer supermarket chains in Kenya;
|
Main Local and International Retail Supermarket Chains |
||||||||||
|
Name of Retailer |
Category |
Highest number of branches that have ever existed as at FY’2018 |
Highest number of branches that have ever existed as at FY’2019 |
Highest number of branches that have ever existed as at FY’2020 |
Highest number of branches that have ever existed as at FY’2021 |
Number of branches opened in 2022 |
Closed branches |
Current number of Branches |
Number of branches expected to be opened |
Projected number of branches FY’2022 |
|
Naivas |
Local |
46 |
61 |
69 |
79 |
3 |
0 |
82 |
3 |
85 |
|
QuickMart |
Local |
10 |
29 |
37 |
48 |
2 |
0 |
50 |
0 |
50 |
|
Chandarana |
Local |
14 |
19 |
20 |
23 |
1 |
1 |
24 |
4 |
28 |
|
Carrefour |
International |
6 |
7 |
9 |
16 |
0 |
0 |
16 |
0 |
16 |
|
Cleanshelf |
Local |
9 |
10 |
11 |
12 |
0 |
0 |
12 |
0 |
12 |
|
Tuskys |
Local |
53 |
64 |
64 |
3 |
0 |
61 |
3 |
0 |
3 |
|
Game Stores |
International |
2 |
2 |
3 |
3 |
0 |
0 |
3 |
0 |
3 |
|
Uchumi |
Local |
37 |
37 |
37 |
2 |
0 |
35 |
2 |
0 |
2 |
|
Choppies |
International |
13 |
15 |
15 |
0 |
0 |
13 |
0 |
0 |
0 |
|
Shoprite |
International |
2 |
4 |
4 |
0 |
0 |
4 |
0 |
0 |
0 |
|
Nakumatt |
Local |
65 |
65 |
65 |
0 |
0 |
65 |
0 |
0 |
0 |
|
Total |
|
257 |
313 |
334 |
186 |
6 |
179 |
192 |
7 |
199 |
Source: Online Search
- Zimbabwe’s largest fast-food restaurant operator Simbisa Brands to expand in Kenya
Simbisa Brands, Zimbabwe’s largest fast-food restaurant operator, announced plans to expand to 245 outlets in Kenya by June 2022 from 190 outlets as at December 2021. The brand, which operates quick-service restaurants such as Chicken Inn, Pizza Inn, Bakers Inn, and Creamy Inn, targets to open the additional 55 restaurants by June this year amid increased competition from big players in the fast-food industry such as Kentucky Fried Chicken (KFC), McDonald’s, and Burger King.
The expansion of the fast-food retail chain into the Kenyan market is supported by; i) the brand’s need to increase its geographical footprint, ii) the easing of Covid-19 restrictions following mass vaccinations which has boosted businesses, iii) the vibrant youthful population in the country who are expected to form a large part of the firms targeted clientele particularly through e-commerce, and, iv) Nairobi’s rise as a hub for international corporations supported by the developing infrastructure.
The Kenyan retail sector performance is expected to be supported by the expansion of multi-national franchises such as Simbisa Brands, and the rise of e-commerce through online payments and deliveries complementing sales in physical outlets. We expect the retail sector to continue witnessing expansion activities by local and international retailers driven by factors such as; i) positive demographics, ii) infrastructure developments opening up areas for accessibility and investments, and, iii) the improved business environment promoting transactions and activities. However, rise of e-commerce has also led to reduced need for physical retail space hence the oversupply of 1.7mn SQFT of space in the Kenya retail market and 3.0 mn SQFT in the Nairobi Metropolitan Area as of 2021, is expected to weigh down performance of the retail sector.
- Hospitality Sector
- JW Marriott International Hotel to Open a Lodge in Maasai Mara
Global US hotel brand JW Marriott International, signed an agreement with Baraka Lodges Limited to open its first luxury safari lodge in Masai Mara, Narok County. The JW Marriott Maasai Mara Lodge in Kenya is expected to be opened in 2023, and will be Marriott’s first luxury safari property in Africa. The facility will join other luxury brands in the reserve including British billionaire Richard Branson's Mahali Mzuri, Keekorok Lodge owned by Sun Africa Hotels, Olare Mara Kempinski and Ol Seki Hemingways Mara Camp among others.
The prime location of the lodge, overlooking the famed banks of the River Talek and on the edge of the reserve, will offer guests elevated views of Maasai Mara National Reserve, its stunning vistas, and, abundant wildlife. The move is expected to boost occupancy rates at the reserve as it will enhance Maasai Mara’s brand visibility thus attracting more tourists.
- Radisson Blu to Resume Operations in May
Additionally, during the week, global five-star hotel brand Radisson Blu located in Nairobi Upper Hill announced plans to resume operations on 9th May 2022 following easing of the coronavirus crisis. The 271-room hotel sent most of their staff home in December 2020 following low bookings due to the Covid-19 pandemic. However, its sister establishments, Radisson Blu Hotel & Residence Nairobi Arboretum and Park Inn by Radisson Nairobi Westlands, remained in operation. It will become the second five-star hotel to reopen after The Norfolk which is set to resume operations in April 2022 amid a decline in the country's daily coronavirus case count and increased mass vaccinations.
The move by Radisson Blu is supported by the increased activities in the hospitality sector attributed to; i) relaxation of travel advisories by governments of key tourism markets thereby increasing international visitor arrivals, ii) repackaging of the tourism sector’s products to appeal to domestic tourists, and, iii) increased hotel bookings due to events, conferences and tourism activities.
According to the Monetary Policy Committee Hotels Survey - November 2021, there was an overall improvement in the general operating environment of hotels evidenced by the increased number of hotels in operations, bed occupancy levels, and share of foreign clientele. The graph below shows the overall percentage of the number of operating hotels in Kenya between January 2021– January 2021;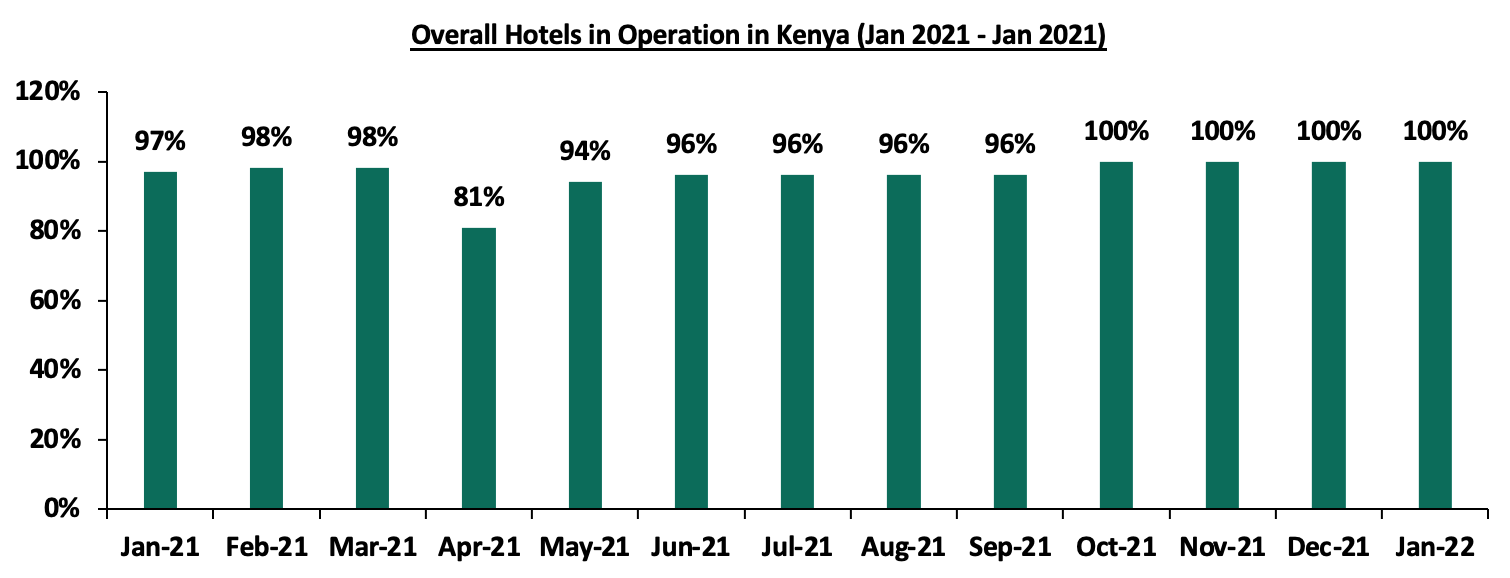
Source: Central Bank of Kenya (CBK)
The graph below highlights the hotel bed occupancy rates in Kenya between January - November 2021;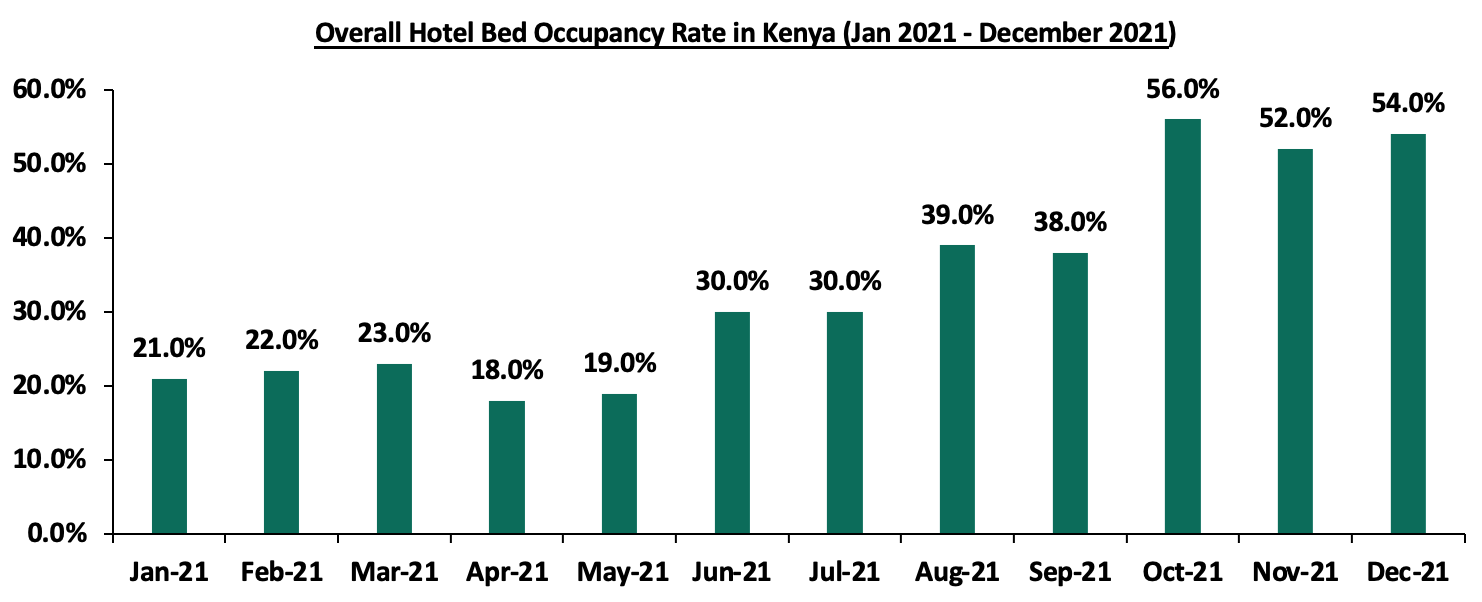
Source: Central Bank of Kenya (CBK)
We expect the sector to register increased activities supported by increasing international visitors which will boost performance of the tourism industry, and improve occupancy rates in hotels and serviced apartments.
- Listed Real Estate
In the Nairobi Stock Exchange, the ILAM Fahari I-REIT closed the week trading at an average price of Kshs 6.0 per share. This represented a 3.4% Week-to-Date (WTD) increase and 6.3% Year-to-Date (YTD) decline, from Kshs 5.8 per share and Kshs 6.4 per share, respectively. On Inception-to-Date (ITD) basis, the share price has recorded a decline of 70.0%, from Kshs 20.0 recorded in November 2015. The graph below shows Fahari I-REIT’s performance from November 2015 to March 2022;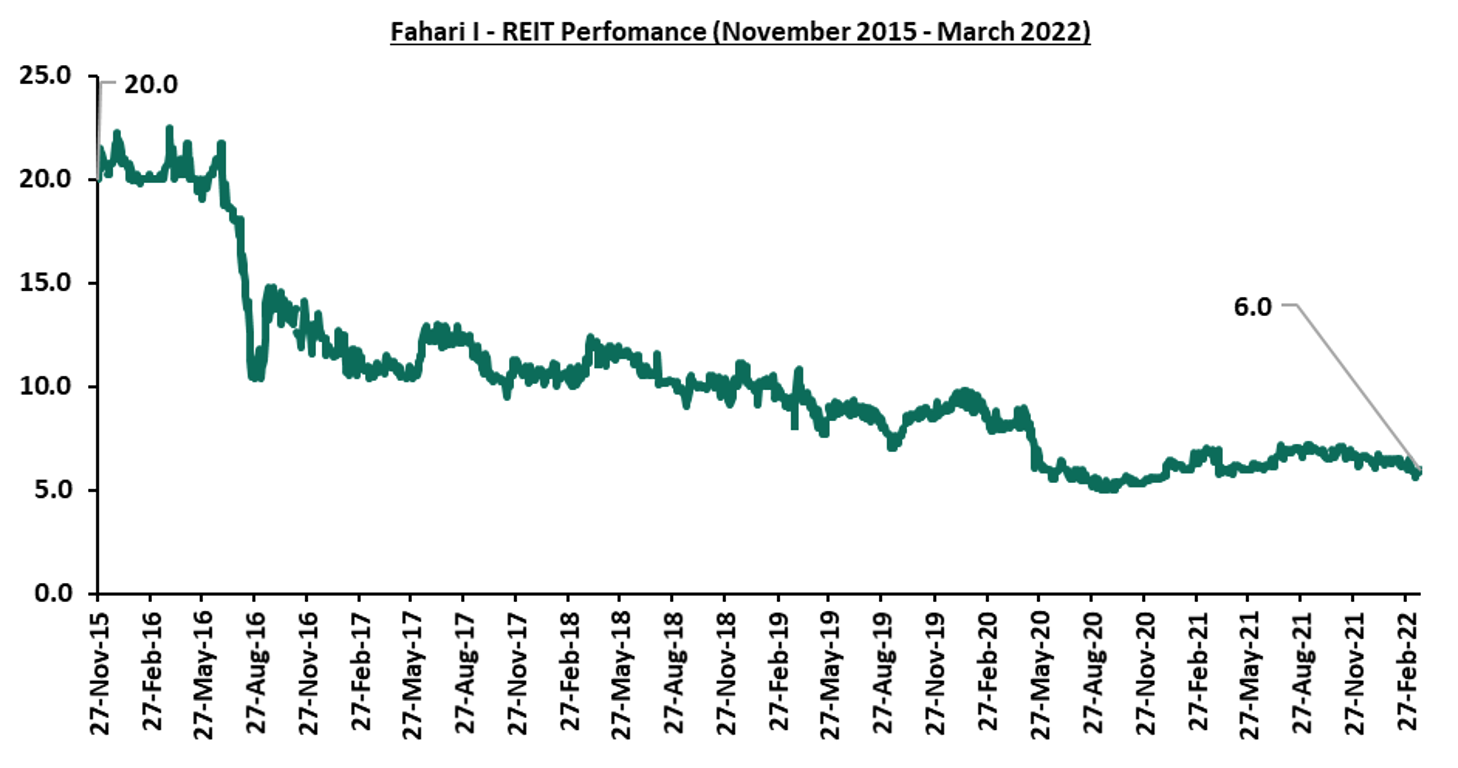
In other highlights;
- During the week, The Board of Directors of the REIT Manager and the REIT Trustee of ILAM Fahari I-REIT issued a Cautionary Announcement to unitholders of the REIT and the general public. In the statement they announced that the I-REIT Manager has undertaken a strategic review of the I-REIT with the Trustee’s consent which, if approved and implemented may involve restructuring of the REIT. Additionally, unitholders and the public were advised to exercise caution when dealing in the units of the I-REIT.
Restructuring is a type of corporate action taken when significantly modifying the debt, operations or structure of a company as a means of potentially eliminating financial harm and improving the business. The Kenyan REIT market performance continues to be weighed down by; i) a general lack of knowledge on the financing instrument, ii) high minimum capital requirements for a Trustee of Kshs 100.0 mn and for investors at Kshs 5.0 mn, iii) general lack of interest of the REIT by investors, and, iv) lengthy approval processes to get all the necessary requirements thus discouraging those interested in investing in it. Therefore, we expect that restructuring of the REIT will help address these challenges to improve performance of the instrument.
We expect Kenya’s property market to continue recording growth and development activities driven by initiatives to support affordable housing, expansion of local and international retailers, and, resumption of hotel operations. However, investor’s minimal appetite for the REIT instrument is expected to weigh down the overall performance of the property sector.
In 2021, we published the Nairobi Metropolitan Area Commercial Office Report 2021 themed “Market under Pandemic, in which we highlighted the performance of the sector in 2020, as well as giving insights on the outlook and areas best fit for investment opportunities. According to the report, the sector’s performance softened in 2020 recording a 0.5% points decline in average rental yields to 7.0% in 2020, from 7.5% in 2019. Occupancy rates declined as well by 2.6% points to 77.7% in 2020, from 80.3% realized in 2019. Also, asking rents and prices declined by 3.0% and 2.8% respectively to an average of Kshs 93 and Kshs 12,280 per SQFT in 2020, from Kshs 96 and Kshs 12,638 per SQFT in 2019. The drop in performance was mainly attributed to a challenging financial environment that led to reduced spending patterns, coupled with an oversupply of 7.3 mn SQFT forcing landlords to reduce rates in a bid to attract and retain existing clients.
This week we will update our research with the Commercial Office report 2022 themed ‘Changing Working Patterns Driving the Market’, in order to determine the market’s performance by looking at the following:
- Overview of the Commercial Office Sector,
- Commercial Office Supply in the Nairobi Metropolitan Area,
- Commercial Office Performance, by Location and by Grades, and,
- Office Market Outlook and the Investment Opportunity in the Sector.
Section I: Overview of the Commercial Office Sector
In 2021, the Nairobi Metropolitan Area (NMA) commercial office market witnessed an improvement in expansion activities by various firms, and its overall performance, compared to 2020. Additionally, the market witnessed additional supply of office spaces as a result of completed buildings worth 0.5 mn SQFT. Some of the factors that have been driving the increased performance and activities in the market include;
- Reopening of the Economy: The reopening of the economy in 2021 facilitated the full resumption of various business operations. This in turn led to a slight increase in the overall occupancy rates of the commercial office sector, as well as the overall rental yields,
- Positive Demographics: Kenya’s urbanization growth rate is currently at 4.0%, 3.2% points higher than the world’s 1.8% according to the World Bank. This in turn drives the demand for office spaces as a result of people moving into the urban areas,
- Serviced Offices/ Co-Working Spaces: These have been gaining traction in Kenya due to their convenience and flexibility, which in turn makes them attractive to tenants and investors, and,
- Nairobi’s recognition as a regional hub: This has attracted investments from foreigners. In January 2022, Max International Company alongside CCI Group of Companies took up commercial office space at the Garden City Business Park bringing its total occupancy rate to 93.0%.
Conversely, the sector continues to face setbacks such as;
- Remote/ Hybrid Working Model: The remote/hybrid working model which continues to be embraced by some firms, continues to weigh down the overall occupancy rates of office spaces and the overall returns to landlords. Notably, though, a shift to a hybrid working model by companies who had adapted the full remote working model will help boost office occupancy rates,
- Oversupply of the office Space: The addition of office spaces against the existing demand in Nairobi has led to an oversupply of 6.7 mn SQFT in 2021, and in turn affecting the overall occupancy rates of the buildings. Moreover, developers are halting their construction plans as they await the absorption of the existing office spaces,
- Price/ Rent Concessions: As a result of discounts provided by landlords in order to attract and retain clients, rental rates and prices have stagnated or in other instances reduced. As such, this has affected the overall yields generated by various commercial developments, evidenced by average rental rates that stabilized at Kshs 93 per SQFT in 2021, a sign of the rates having not resumed to their pre-COVID prices, which averaged at Kshs 96 per SQFT as at 2019, and,
- Financial Constraints: Access to credit loans continue to be a challenge faced by developers due to the tedious transaction processes and timelines. Moreover, banks continue to tighten their loan lending terms while requesting for more collateral, due to the increasing default rates. According to Central Bank of Kenya’s October-December 2021 Quarterly Economic Review, the Gross Non Performing Loans in the Real Estate sector increased by 21.7% to Kshs 74.7 bn in FY’2021, from Kshs 61.4 bn realized in FY’2020. This therefore leads to longer construction timelines and heavy debts incurred at the end of projects.
Section II: Commercial Office Supply in the Nairobi Metropolitan Area
The supply of new commercial space continued to rise in 2021, with the addition of 3 other commercial buildings offering up to 0.5 mn SQFT of extra space in to the commercial office market. The developments included; Global Trade Centre (GTC) Office Tower and Riverside Square, both located in Westlands, and Karen Green in Karen. We expect the office space supply to further increase in 2022 with the addition of other various developments in the pipeline totaling 0.6 mn SQFT of space. These developments include; The Cube and Sandalwood both located in Riverside, and, One Principal Place and the Piano both located in Westlands. The table below shows some of the notable office completions during the review period as well as incoming spaces:
|
Nairobi Metropolitan Area Commercial Office Space Supply |
||||||
|
Major Commercial Office Completion in 2021 |
Major Incoming Commercial Office Space Supply in 2022 |
|||||
|
# |
Development |
Location |
Size (SQFT) |
Development |
Location |
Size (SQFT) |
|
1 |
Global Trade Centre (GTC) Office Tower |
Westlands |
272,359 |
The Cube |
Riverside |
77,876 |
|
2 |
Riverside Square |
Westlands |
136,907 |
Sandalwood |
Riverside |
250,000 |
|
3 |
Karen Green |
Karen |
69,000 |
One Principal Place |
Westlands |
126,109 |
|
4 |
The Piano |
Westlands |
136,167 |
|||
|
Total |
478,266 |
590,152 |
||||
Source: Cytonn Research/Knight Frank Research
There was an office space over supply of 6.7 mn SQFT in 2021, an 8.2% decrease from the 7.3 mn SQFT realized in 2020. This was attributed to increased demand of physical office spaces as some firms resumed full operations, as well as a decline in the supply of new office developments, which came in at 0.5 mn SQFT in 2021, 37.5% lower than the 0.8 mn SQFT recorded in 2020. The table below summarizes the commercial office space supply over time:
|
Nairobi Metropolitan Area Office Space Analysis |
|||||||||||
|
Year |
2012 |
2013 |
2014 |
2015 |
2016 |
2017 |
2018 |
2019 |
2020 |
2021 |
2022 F |
|
Stock ( Mn Sqft) |
7.7 |
9.7 |
15.4 |
22.9 |
28.9 |
31.8 |
35.5 |
36.3 |
36.4 |
36.8 |
37.4 |
|
Completions ( Mn Sqft) |
1.2 |
2.1 |
5.9 |
7.8 |
6.5 |
3.5 |
4.3 |
1.5 |
0.8 |
0.5 |
0.6 |
|
Vacancy Rate (%) |
9.0% |
10.0% |
10.0% |
11.0% |
12.0% |
16.8% |
16.7% |
19.5% |
22.3% |
22.1% |
23.3% |
|
Vacant Stock ( Mn Sqft) |
0.7 |
1.0 |
1.5 |
2.5 |
3.5 |
5.3 |
5.9 |
7.1 |
8.1 |
8.1 |
8.7 |
|
Occupied Stock (Mn Sqft) |
7.1 |
8.8 |
13.9 |
20.3 |
25.4 |
26.5 |
29.6 |
29.2 |
28.3 |
28.7 |
28.7 |
|
Net Absorption |
1.0 |
1.7 |
5.1 |
6.5 |
5.1 |
1.0 |
3.1 |
(0.4) |
(1.0) |
0.4 |
0.0 |
|
Demand |
1.1 |
1.9 |
5.3 |
6.8 |
5.6 |
1.6 |
3.7 |
0.4 |
(0.2) |
1.2 |
0.8 |
|
Available Supply, AS(T) |
1.7 |
2.6 |
6.5 |
8.8 |
8.4 |
6.3 |
9.0 |
6.7 |
7.1 |
7.9 |
8.0 |
|
Gap, GAP(T) |
(0.5) |
(0.8) |
(1.2) |
(2.1) |
(2.9) |
(4.7) |
(5.2) |
(6.3) |
(7.3) |
(6.7) |
(7.2) |
Source: Cytonn Research/ Building Plan Approvals Data from the Nairobi City County
Section III: Commercial Office Performance, by Location and by Grades
The Commercial Office sector realized an improvement in its overall performance in 2021, with the average rental yields coming in at 7.1%, 0.1 % points higher than the 7.0% recorded in 2020. The average occupancy rates increased as well by 0.2% points to 77.9%, from 77.7% recorded in 2020. The improvement in performance was mainly driven by an improved business environment following the lifting of the COVID-19 containment measures, as well as some businesses resuming full operations hence boosting the occupancy rates. The table below summarizes the performance of the commercial office theme over time:
(All Values in Kshs Unless Stated Otherwise)
|
Commercial Office Performance Over Time |
|||||||||
|
Year |
2013 |
2015 |
2016 |
2017 |
2018* |
2019 |
2020 |
2021 |
y/y ∆ 2021 |
|
Occupancy (%) |
90.0% |
89.0% |
88.0% |
82.6% |
83.8% |
80.3% |
77.7% |
77.9% |
0.2% |
|
Asking Rents (Kshs/SQFT) |
95 |
97 |
97 |
101 |
101 |
96 |
93 |
93 |
0.0% |
|
Average Prices (Kshs/SQFT) |
12,433 |
12,776 |
12,031 |
12,649 |
12,407 |
12,638 |
12,280 |
12,279 |
0.0% |
|
Node Average Rental Yields (%) |
8.3% |
8.1% |
8.5% |
7.9% |
8.3% |
7.5% |
7.0% |
7.1% |
0.1% |
Source: Cytonn Research
- Commercial Office Performance by Nodes
In 2021, We classified the main office nodes in the Nairobi Metropolitan Area into 9 nodes: i) Nairobi CBD, ii) Westlands, covering environs including Riverside, iii) Parklands, iv) Mombasa Road, v) Thika Road, vi) Upperhill, vii) Karen, viii) Gigiri, and ix) Kilimani, which includes offices in Kilimani, Kileleshwa and Lavington.
The table below shows the Nairobi Metropolitan Area (NMA) sub-market performance;
(All Values in Kshs Unless Stated Otherwise)
|
NMA Commercial Office Submarket Performance 2021 |
|||||||||||
|
Area |
Price /SQFT (Kshs) 2020 |
Rent /SQFT (Kshs) 2020 |
Occupancy 2020 |
Rental Yields 2020 |
Price Kshs/ SQFT 2021 |
Rent Kshs /SQFT 2021 |
Occupancy 2021(%) |
Rental Yield 2021 |
∆ in Rent |
∆ in Occupancy |
∆ in Rental Yields |
|
Gigiri |
13,400 |
116 |
82.5% |
8.5% |
13,500 |
119 |
81.3% |
8.6% |
2.3% |
(1.2%) |
0.1% |
|
Westlands |
11,975 |
104 |
74.4% |
7.8% |
11,972 |
104 |
75.5% |
8.1% |
0.4% |
1.1% |
0.3% |
|
Karen |
13,567 |
106 |
83.6% |
7.8% |
13,325 |
106 |
83.0% |
7.7% |
(0.4%) |
(0.6%) |
(0.1%) |
|
Parklands |
10,958 |
93 |
79.9% |
7.6% |
11,336 |
91 |
80.1% |
7.6% |
(1.4%) |
0.2% |
0.0% |
|
Kilimani |
12,233 |
93 |
79.1% |
6.8% |
12,364 |
91 |
79.8% |
7.1% |
(1.5%) |
0.7% |
0.3% |
|
Upperhill |
12,684 |
92 |
78.5% |
6.9% |
12,409 |
94 |
78.0% |
7.0% |
2.2% |
(0.5%) |
0.2% |
|
Nairobi CBD |
11,889 |
82 |
82.4% |
6.8% |
11,787 |
82 |
82.8% |
6.8% |
(0.7%) |
0.4% |
0.0% |
|
Thika Road |
12,500 |
80 |
76.1% |
5.8% |
12,571 |
79 |
76.3% |
5.7% |
(1.8%) |
0.2% |
(0.1%) |
|
Mombasa road |
11,313 |
73 |
63.0% |
4.8% |
11,250 |
73 |
64.2% |
5.1% |
0.6% |
1.2% |
0.3% |
|
Node Averages |
12,280 |
93 |
77.7% |
7.0% |
12,279 |
93 |
77.9% |
7.1% |
0.0% |
0.2% |
0.1% |
Source: Cytonn research
Key take-outs include;
- Key to note, Gigiri and Westlands were the best performing nodes with average rental yields of 8.6% and 8.1%, respectively, compared to the market average of 7.1%, in 2021. This was mainly attributed to the presence of high quality offices attracting high rents.
- On the other hand, Mombasa Road was the worst performing node with average rental yields of 5.1% in 2021, 2.0% points lower than the market average of 7.1%. This was mainly driven by; i) the low average rents at Kshs 73.0 per SQFT compared to the market average of Kshs 93 per SQFT, ii) zoning regulations as Mombasa Road is mainly considered an industrial area thus making it unattractive to business firms, and iii) current traffic snarl-ups caused by the ongoing Nairobi Expressway project thus making the area unattractive. However this is a temporary situation as we expect the area to record improved performance upon the completion of the project.
- Karen and Thika Road were the only nodes to record declines in rental yield, both declining by 0.1% points to 7.7% and 5.7%, respectively. This was mainly attributable to a decline in their rents by 0.4% and 1.8%, respectively.
- Commercial Office Performance by Class/Grade:
Commercial office buildings are classified into three main categories based on the size and quality of office spaces. These are:
- Grade A: These are high quality office buildings characterized by their adequate amenities, facilities, and finishes. They therefore fetch higher rental rates and yields compared to other office types. Also these office building sizes range from 100,001 - 300,000 SQFT,
- Grade B: These office buildings have their sizes ranging between 50,000 to 100,000 SQFT. They have good amenities and services, however not as good as Grade A offices, hence charge moderate rental rates, and,
- Grade C: These buildings are usually old, hence their lack of adequate services and facilities. Usually, they charge rents below the average market rate.
From our analysis, Grade B office spaces still account for a majority office spaces in Nairobi, with the current market share being 56.0%. However, this is a 1.8% points decline from the 57.8% share recorded in 2020, as a result of the increased completions of Grade A offices such as the GTC Office Tower in Westlands. For the individual nodes, Gigiri has the highest percentage of Grade A offices at 60.0%, whereas Kilimani has the highest percentage of Grade B offices at 81.8%. For Grade C, Mombasa Road accounts for majority of the office spaces with a current market share of 55.6%. In terms of concentration, Parklands has the highest mix of office types, having recorded 21.1%, 52.6%, and 26.3% of Grade A, Grade B, and Grade C office spaces. The distribution of various office classes/grades is as summarized in the table below: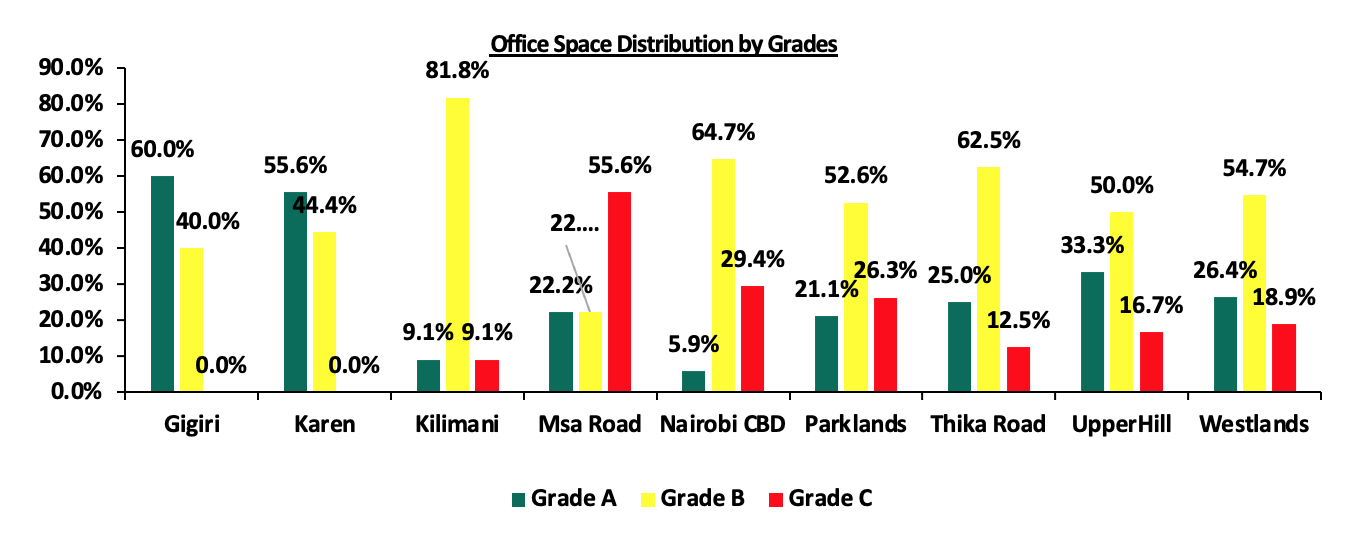
Source: Cytonn Research
In terms of performance;
- Grade A and B office spaces had the highest rental yields at 7.5% as tenants prefer them because of their relative better technical services in comparison to Grade C office spaces,
- Grade A offices recorded the highest overall increase in occupancy rates by 3.1% points in 2021 to 79.4% from the 76.3% realized in 2020 as a result of increased demand, and,
- For rental rates, Grade C offices recorded the largest drop in the average rental rates by 3.3% which in turn led to the largest drop in rental yields by 0.2% points in the period of focus.
The performance according to grades/class is as summarized in the table below:
(All Values in Kshs Unless Stated Otherwise)
|
Commercial Office Performance Based On Grades |
|||||||||||
|
Office Grade |
Price 2020 Kshs/SQFT |
Rent 2020 Kshs/SQFT |
Occupancy 2020 (%) |
Rental Yield 2020 |
Price 2021 Kshs/SQFT |
Rent 2021 Kshs/SQFT |
Occupancy 2021 (%) |
Rental Yield (%) 2021 |
∆ Rent Y/Y |
∆ Occupancy Y/Y (% points) |
∆ Rental Yield Y/Y (%points) |
|
Grade A |
13,628 |
101 |
76.3% |
6.8% |
12,674 |
99 |
79.4% |
7.5% |
(1.8%) |
3.1% |
0.7% |
|
Grade B |
12,202 |
96 |
78.7% |
7.5% |
12,340 |
97 |
78.2% |
7.5% |
(1.1%) |
(0.5%) |
0.0% |
|
Grade C |
10,721 |
85 |
74.3% |
6.8% |
10,839 |
82 |
74.3% |
6.6% |
(3.3%) |
0.0% |
(0.2%) |
Source: Cytonn Research
- Commercial Office Performance by Class and Node:
In 2021, Grade A offices in Gigiri, Karen and Parklands offered the highest average rental yields all at 8.2%, and Westlands at 7.8%. This was attributed to their superior locations characterized by serene environment attracting high-end clients and premium rates, coupled with the presence of adequate amenities and infrastructure servicing the areas. The Grade B offices in Gigiri and Westlands had the highest rental yields of 9.0% and 8.6%, respectively, whereas for the Grade C category, Westlands and Nairobi CBD had the best returns with average rental yields that came in at 7.7% and 7.3%, respectively. The class performance by node is as summarized in the table below with the best performing areas of each grade highlighted in yellow:
|
Commercial Office Performance in 2021 by Nodes and Grades |
||||||
|
|
Grade A |
Grade B |
Grade C |
|||
|
Row Labels |
Average of Occupancy (%) |
Average of Rental Yield |
Average of Occupancy (%) |
Average of Rental Yield |
Average of Occupancy (%) |
Average of Rental Yield |
|
Gigiri |
77.5% |
8.2% |
85.1% |
9.0% |
- |
- |
|
Karen |
85.8% |
8.2% |
80.3% |
7.4% |
- |
- |
|
Parklands |
84.8% |
8.2% |
75.0% |
7.2% |
84.6% |
7.7% |
|
Westlands |
78.2% |
7.8% |
75.6% |
8.6% |
71.8% |
7.2% |
|
Kilimani |
72.5% |
6.2% |
80.7% |
7.2% |
80.0% |
7.2% |
|
Upper Hill |
77.9% |
7.3% |
80.2% |
7.2% |
72.5% |
6.3% |
|
Nairobi CBD |
- |
- |
83.2% |
6.7% |
82.0% |
7.3% |
|
Thika Road |
80.0% |
6.6% |
76.3% |
5.7% |
73.0% |
4.6% |
|
Msa Road |
75.0% |
5.3% |
61.5% |
5.0% |
61.0% |
5.0% |
Source: Cytonn Research
- Serviced Offices
Serviced offices realized a 0.8% Y/Y rental growth to Kshs 183 per SQFT in 2021, from Kshs 161 per SQFT recorded in 2020. In comparison to the unserviced offices which recorded average rents of Kshs 93, the average rents for the serviced offices were higher by 49.2% in 2021. The remarkable performance was mainly attributed to; i) convenience resulting from access to existing facilities, ii) flexibility of the leases, and, iii) no set-up costs required.
Westlands and Karen recorded the highest rent appreciations of 3.9% and 3.1%, respectively, compared to the market average of 0.8% for the serviced offices, due to the presence of quality infrastructure, and facilities attracting prime rents.
All values in Kshs Unless Stated Otherwise
|
Nairobi Metropolitan Area Serviced Office Performance |
||||||
|
Location |
Rent Per SQFT 2020 |
Rent Per SQFT 2021 |
Serviced Offices Rental growth (%) |
Un-serviced Offices Rental growth (%) |
||
|
|
Serviced Offices |
Un-serviced Offices |
Serviced Offices |
Un-serviced Offices |
||
|
Westlands |
204 |
93 |
212 |
104 |
3.9% |
10.6% |
|
Karen |
186 |
104 |
192 |
106 |
3.1% |
1.9% |
|
Parklands |
174 |
106 |
169 |
91 |
(3.3%) |
(16.5%) |
|
Gigiri |
181 |
116 |
- |
119 |
- |
2.5% |
|
Upperhill |
- |
92 |
235 |
94 |
- |
2.1% |
|
Kilimani |
190 |
82 |
194 |
91 |
2.2% |
9.9% |
|
Nairobi CBD |
160 |
93 |
164 |
82 |
2.6% |
(13.4%) |
|
Msa Rd |
105 |
73 |
- |
73 |
- |
0.0% |
|
Thika Rd |
116 |
80 |
112 |
79 |
(3.6%) |
(1.3%) |
|
Nodes Average |
161 |
93 |
183 |
93 |
0.8% |
0.0% |
Source: Cytonn Research
Section IV: Office Market Outlook and the Investment Opportunity in the Sector
Based on the office market supply, demand, performance, and investor returns, we have a NEUTRAL outlook for the commercial office sector theme in Nairobi Metropolitan Area (NMA) mainly due to the 6.7 mn SQFT oversupply of space. However, with most firms and business fully embarking to working from the office amidst the improved economic environment, we expect that this will cushion the performance of the sector. The table below summarizes our outlook on the sector based on the various key driving factors.
|
Nairobi Commercial Office Outlook |
||||
|
Measure |
2020 Sentiment |
2021 Sentiment and 2022 Outlook |
2021 Review |
2022 Outlook |
|
Supply |
We had an oversupply of 7.3 mn SQFT of office space in 2020, and it is expected to grow by 1.1% to 8.0 mn SQFT in 2021, due to reduced occupancy rates brought about by reduced demand as people adopt the working from home alongside the incoming supply which is expected to affect the occupancy rates |
There was an oversupply of 6.7mn SQFT in 2021, an 8.3% decrease from the 7.3 mn SQFT realized in 2020. This was due to increased demand of physical office spaces as some firms resumed full operations. The incoming supply in 2021 came it 0.5 mn SQFT 3.6% lower than the 0.8 mn SQFT recorded in 2020. We expect the office space oversupply to further increase by 9.0% in 2022 to 7.1 mn SQFT, attribute to an expected addition of 0.6 mn SQFT from commercial office buildings that are currently under construction, coupled with an anticipated decline in occupancy rates in 2022 as per Cytonn 2022 Markets Outlook |
Neutral |
Negative |
|
Demand |
There was reduced demand for office space in the Nairobi Metropolitan Area (NMA) evidenced by the 1.3% y/y decline in the average occupancy rates mainly attributable to an oversupply. investment opportunity lies in differentiated concepts such as serviced offices offering yields of up to 11.2% compared to 7.0% average rental yields of Unserviced materials |
There was an increased demand for office spaces, evidenced by the 0.2% increase in the average occupancy rates which came in at 77.9% in 2021, from the 77.7% recorded in 2020. This was mainly attributed to businesses resuming full operations after the lifting of COVID-19 containment measures. In addition to this, the absorption of office spaces increased to 1.2mn SQFT in 2021 from (0.2) mn SQFT recorded in 2020 We however expect the occupancy rates to be weighed down by some businesses still embracing the remote/ hybrid working model, and the market uncertainties due to the incoming general elections |
Neutral |
Neutral |
|
Office Market Performance |
The commercial office sector performance softened in 2020 recording a 0.5% points decline in average rental yields to 7.0% in 2020 from 7.5% in 2019. The average occupancies also declined in 2020 coming in at 77.7%, a 2.6%points decline from 80.3% in 2019. In 2020, we expect average rental prices to drop slightly over the short term due to downward pressure arising from the decline in effective demand from the existing oversupply in the market, and the COVID-19 effects that has caused decline in occupancy rates and yields |
The sector realized a slight improvement in its overall performance in FY’2021, with the average rental yields coming in at 7.1%. We expect that the full resumption of operations by some firms and businesses amidst the improved economy to continue driving the market’s performance. However, the remote working model still being embraced by some firms, coupled with existing oversupply of office spaces currently at 6.7 mn SQFT are expected to weigh down the overall occupancy rates and yields of the sector |
Neutral |
Neutral |
Our outlook for the NMA commercial office sector is NEUTRAL, from negative last year, mainly due to the full resumption of operations by some firms and businesses amidst the improved economy. However, the remote working model still being embraced by some firms, coupled with existing oversupply of office spaces currently at 6.7 mn SQFT are expected to weigh down the overall occupancy rates and yields of the sector. Investment opportunity lies in Gigiri and Karen supported by relatively low supply of office spaces, and high returns of 8.6% and 7.7%, respectively, compared to the market average of 7.1%, as at 2021. For the full Commercial Office Report 2022, click here.
Disclaimer: The views expressed in this publication are those of the writers where particulars are not warranted. This publication, which is in compliance with Section 2 of the Capital Markets Authority Act Cap 485A, is meant for general information only and is not a warranty, representation, advice or solicitation of any nature. Readers are advised in all circumstances to seek the advice of a registered investment advisor.

- Talk to us
- Kenya
- P.O Box 20695 - 00200, Nairobi, Kenya
- Cell +254709101200
- Tel +254709101200
- WhatsApp +254741676635
- United States
- +254709101200
- DOWNLOAD OUR APP
-


- Kenya
- 8th Floor, Pinetree Plaza, Kaburu Drive, Ngong Road, Nairobi, Kenya
- USA
- Suite 1150, 1775 Eye Street NW, USA, Washington DC 20006, USA
- Investments
- High Yield
- Private Equity
- Real Estate
- Real Estate
- RiverRun Estates
- Cytonn Towers
- The Ridge
- Taraji Heights
- The Alma