Nairobi Metropolitan Area Infrastructure Report 2018, & Cytonn Weekly #41/2018
By Cytonn Research Team, Oct 28, 2018
Executive Summary
Fixed Income
T-bills were under-subscribed during the week, with the overall subscription rate coming in at 66.8%, an increase from 51.5% recorded the previous week. Yields on the 91-day paper remained unchanged at 7.5%, while the yields on the 182-day and 364-day papers declined to 8.4% and 9.5%, from 8.5% and 9.6%, the previous week. According to a report released by the International Monetary Fund (IMF), Kenya’s risk of debt distress has increased from low to moderate. The IMF also noted that the interest rate controls and interbank market volatility have hampered monetary policy effectiveness and the Kenyan shilling is overvalued by approximately 17.5%, meaning that the KES/USD exchange rate, according to IMF, ought to be at 118.9 as compared to 101.2 recorded during the week;
Equities
During the week, the equities market recorded mixed performances with NSE 20 and NSE 25 gaining by 0.5% and 0.6%, respectively while NASI declined by 0.3%, taking their YTD performance to declines of 24.0%, 15.7% and 14.8%, for NSE 20, NSE 25 and NASI, respectively. Liberty Holdings Ltd announced the resignation of Dr Susan Mboya Kidero as the Board Chair, and KCB Group announced the appointment of Mr. Andrew Wambari Kairu as the new Group Chairman;
Private Equity
African Private Equity and Venture Capital Association (AVCA) released the African Private Equity Data Tracker for H1’2018, a brief providing a provisional look at half-year private equity activity in Africa. The key takeout from the report was the reduced total value of deals compared to H1’2017;
Real Estate
During the week, H.E President Uhuru Kenyatta signed into law the Supplementary Appropriation Bill No. 2 of 2018, with the housing department receiving Kshs 21.0 bn for the affordable housing initiative, which is 44.7% of the Kshs 47.3 bn supplementary budget and a 223.1% increment from the Kshs 6.5 bn allocated in the Kenya National Budget for 2018/19. Urithi Housing Co-operative Society Limited launched a development of 5,000 low-cost housing units on 100-acres at Birmingham Woodlands Estate in Mangu, off Thika Road;
Focus of the Week
Infrastructure is one of the key enablers of the real estate sector. In the recent past, we have witnessed the Kenyan Government’s dedication to improving the infrastructural levels in Kenya, especially transport and utilities. Nairobi as the capital city, and its environs, have witnessed a host of infrastructural developments in a bid to attract foreign investments and promote economic growth, which has in turn, boosted the region’s real estate activity. Given our continued focus on real estate investment, with majority of our projects in the Nairobi Metropolitan Area, this week we, therefore, look at the state of infrastructure in the Nairobi Metropolitan Area, ongoing infrastructural projects and the areas expected to benefit from these, and then take a view of the potential areas for real estate investment.
- Cytonn Investments, our group company, held a quarterly company update at The Ridge on Saturday October 27th, reporting a group pre-tax profitability of Kshs. 238 mn for the 9 months ended September 2018, compared to Kshs. 305 mn for same time last year. Commenting on the financial performance, Samuel Ng’ang’a, Group Finance Manager, said that “We are not immune to the prevailing tough economic environment, hence the 22% drop in profitability, however it is noteworthy that our core business of real estate performed very well, with 9 months gross profitability in real estate up by over 113%, to Kshs. 610.3 mn from Kshs. 286.4 mn for the same period last year. The drag in pre-tax profit is mainly due to significant drops in our investments in equities, which dropped in line with equities market performance.” See event note here:
- We shall be holding a training for Pension Trustees, topic of discussion will be Alternative Investments and how to increase returns, if interested please subscribe here
- Raphael Mwaniki, Clerk of Works at The Alma was on Njata t.v to discuss The Alma development by Cytonn Real Estate. See Raphael here
- The Alma by Cytonn Real Estate was featured on the Property show on KTN. See the feature here
- We continue to hold weekly workshops and site visits on how to build wealth through real estate investments. The weekly workshops and site visits target both investors looking to invest in real estate directly and those interested in high yield investment products to familiarize themselves with how we support our high yields. Watch progress videos and pictures of The Alma, Amara Ridge, The Ridge, and Taraji Heights. Key to note is that our cost of capital is priced off the loan markets, where all-in pricing ranges from 16.0% to 20.0%, and our yield on real estate developments ranges from 23.0% to 25.0%, hence our top-line gross spread is about 6.0%. If interested in attending the site visits, kindly register here;
- We continue to see very strong interest in our weekly Private Wealth Management Training (largely covering financial planning and structured products). The training is at no cost and is open only to pre-screened participants. We also continue to see institutions and investment groups interested in the training for their teams. The Wealth Management Training is run by the Cytonn Foundation under its financial literacy pillar. If interested in our Private Wealth Management Training for your employees or investment group, please get in touch with us through wmt@cytonn.com. To view the Wealth Management Training topics, click here;
- For recent news about the company, see our news section here;
- We have 10 investment-ready projects, offering attractive development and buyer targeted returns of around 23.0% to 25.0% p.a. See further details here: Summary of Investment-Ready Projects; and
- We continue to beef up the team with ongoing hires for Financial and Real Estate Advisors for our offices in Nairobi, Nakuru, Kisumu, and Nyeri. Visit the Careers section on our website to apply.
- Cytonn Centre for Affordable Housing (CCFAH) is looking for a 2-acre land parcel for a joint venture or to buy in; Kiambu County (Ruiru, Kikuyu, Lower Kabete), Nairobi County and its environs.
The parcel should be; i) fronting a main road, or not more than 800 metres from the main road and ii) priced at Kshs 20mn per acre or below. For more information or leads email us at affordablehousing@cytonn.com
T-Bills & T-Bonds Primary Auction:
T-bills were under-subscribed during the week, with the overall subscription rate coming in at 66.8%, an increase from 51.5% recorded the previous week. The subdued performance is partly attributable to tighter liquidity in the interbank market, as evidenced by the increase in the interbank rate to 4.1% as at 22nd October from 3.8% at the close of the previous week. However, liquidity improved throughout the week, with inter-bank rate recording 3.0% as at the close of the week. The subscription rate for the 364-day paper increased to 105.6% from 49.6% the previous week, while the subscription rate for the 91-day and 182-day papers declined to 61.0% and 30.3% from 95.8% and 35.8%, recorded the previous week, respectively. The yields on the 91-day paper remained unchanged at 7.5%, while the yields on the 182-day and 364-day papers declined to 8.4% and 9.5%, from 8.5% and 9.6%, the previous week. The acceptance rate for T-bills improved to 100.0% from 97.4% recorded the previous week, with the government accepting Kshs 16.0 bn.
The Kenyan Government has re-opened the 15-year Treasury bond, issue No. FXD 2/2018/15, that closed last week with a coupon rate of 12.75% with the period of sale ending on 30th October 2018. The government seeks to raise Kshs 32.0 bn for budgetary support. The issuing of longer-term bonds is in a bid to lengthen the average time to maturity for the Kenyan Government’s debt portfolio. The Central Bank of Kenya (CBK), in their Financial Sector Stability Report 2017, identified the continued shortening of debt maturities as posing potential rollover risks in the medium term if the trend is not reversed, having reduced to 4.1 years as at the end of 2017, from 4.5 years at the end of 2016, and highs of 8.9 years as at 2010. We are of the view that the continued issuance of medium to long-term domestic securities is well guided as lengthening the average maturity will reduce the pressures on the domestic debt market. Given that the Treasury bonds with the same tenor as FXD2/2018/15 are currently trading at a yield of 12.6%, we expect bids to come in at between 12.6% and 12.8%.
Liquidity:
The average interbank rate declined marginally to 3.6%, from 3.7% the previous week, while the average volumes traded in the interbank market rose by 36.7% to Kshs 21.1 bn from Kshs 15.4 bn the previous week, reflecting banks’ mobilization of funds for tax remittances. The lower interbank rate points to improved liquidity conditions, attributed to large banks trading at lower interest rates.
Kenya Eurobonds:
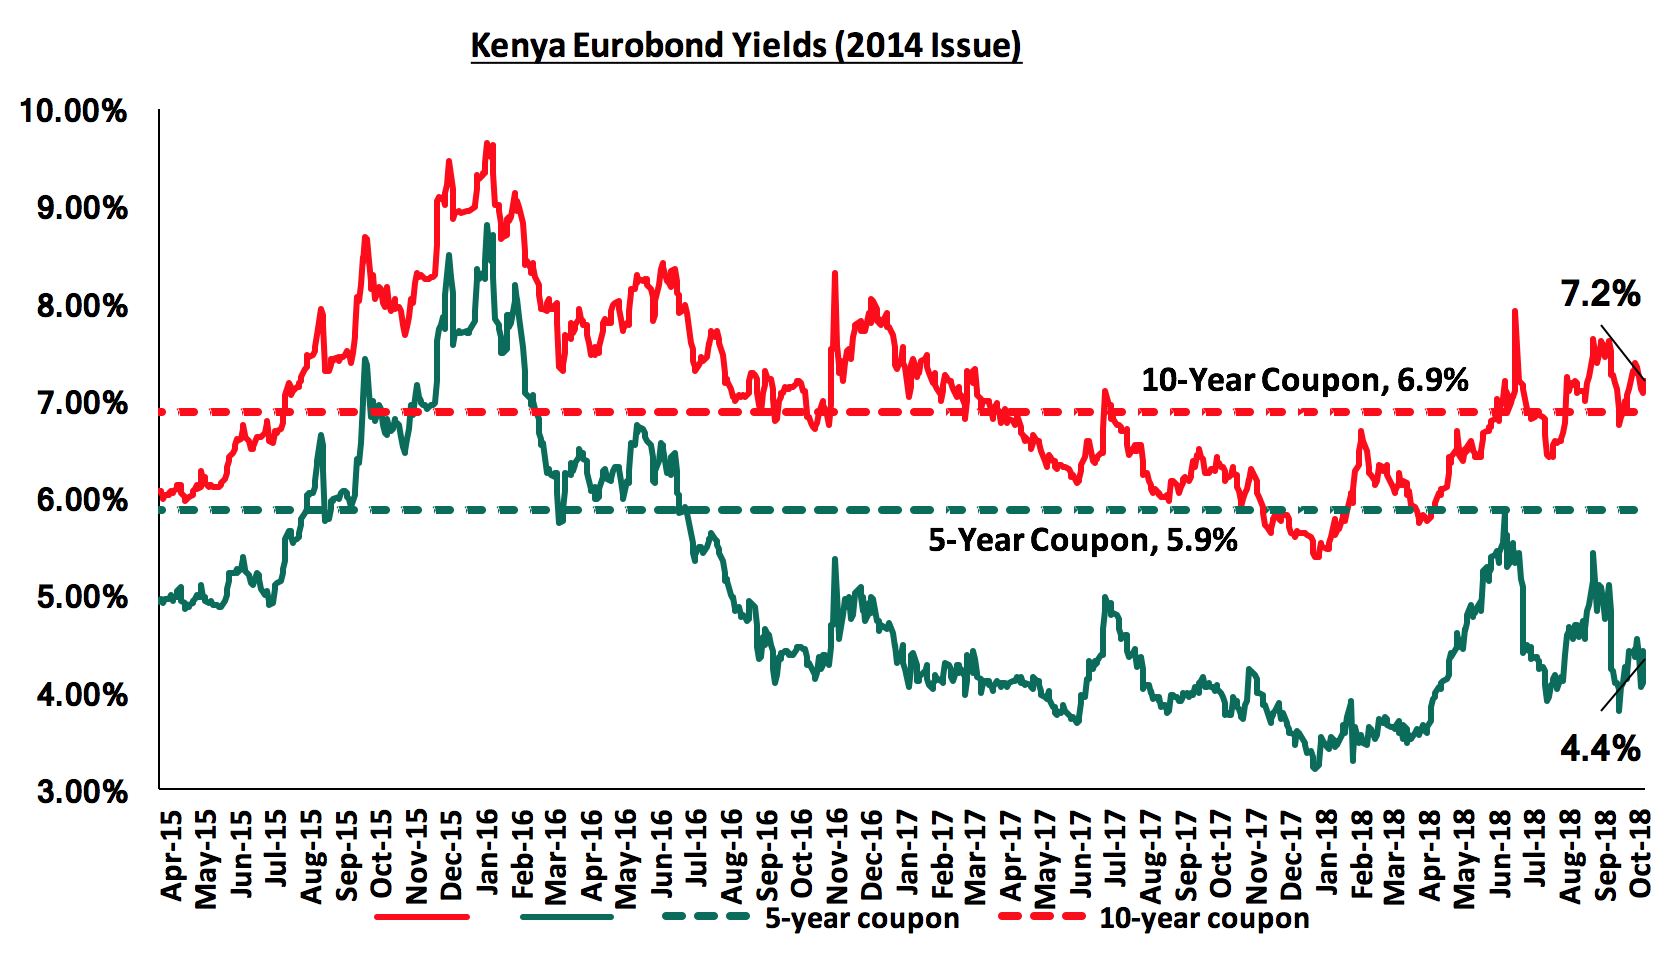
According to Bloomberg, the yield on the 5-year Eurobond issued in 2014 increased by 0.1% points to 4.4% from 4.3% the previous week, while the yield on the 10-year Eurobond issued in 2014 was constant from the previous week at 7.2%. Since the mid-January 2016 peak, yields on the Kenyan Eurobonds have declined by 2.5% points and 4.4% points for the 10-year and 5-year Eurobonds, respectively, an indication of the relatively stable macroeconomic conditions in the country. Key to note is that these bonds have 0.7 years and 5.7 years to maturity for the 5-year and 10-year, respectively.
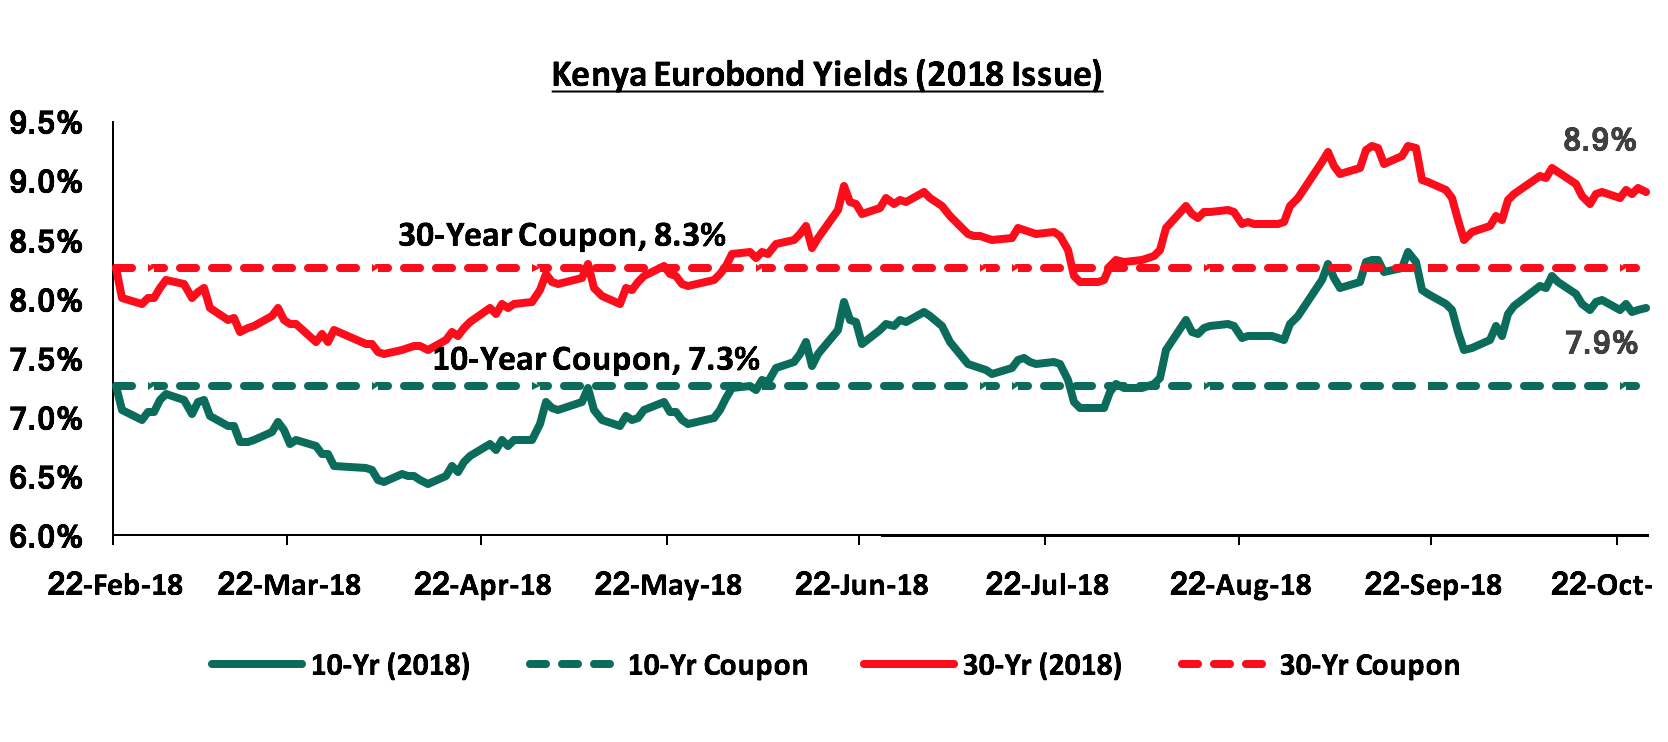
For the February 2018 Eurobond issue, during the week, the yields on both the 10-year Eurobond declined by 0.1% points to 7.9% from 8.0% the previous week, while the yield on the 30-year Eurobond remained constant at 8.9%. Since the issue date, the yields on the 10-year and 30-year Eurobonds have both increased by 0.6% points.
Kenya Shilling:
During the week, the Kenya Shilling depreciated by 0.2% against the US Dollar to close at Kshs 101.2 from Kshs 101.0, recorded the previous week, attributed to end-month dollar demand from oil and merchant importers. The Kenya Shilling has appreciated by 1.9% year to date, and in our view the shilling should remain relatively stable to the dollar in the short term, supported by:
- The narrowing of the current account deficit to 5.8% in the 12-months to June 2018, from 6.3% in March 2018, attributed to improved agriculture exports, and lower capital goods imports following the completion of Phase I of the Standard Gauge Railway (SGR) project,
- Stronger inflows from principal exports, which include coffee, tea, and horticulture, which increased by 1.7% during the month of July to Kshs 24.7 bn, from Kshs 24.3 bn in June, with the exports from horticulture improving by 9.1%,
- Improving diaspora remittances, which increased by 71.9% y/y to USD 266.2 mn in June 2018 from USD 154.9 mn in June 2017 and by 4.9% m/m, from USD 253.7 mn in May 2018, with the largest contributor being North America at USD 130.1 mn, attributed to; (a) recovery of the global economy, (b) increased uptake of financial products by the diaspora due to financial services firms, particularly banks, targeting the diaspora, and (c) new partnerships between international money remittance providers and local commercial banks making the process more convenient, and,
- High levels of forex reserves, currently at USD 8.4 bn, equivalent to 5.6-months of import cover, compared to the one-year average of 5.4-months.
Highlight of the Week:
During the week, the International Monetary Fund (IMF) released a report based on bilateral discussions held with the Kenyan Government on the country’s economic developments and policies. The economic and financial information collected was used to establish the Performance Criteria for the second review under the precautionary Stand-By Arrangement (SBA), amounting to USD 985.9 mn (Kshs 99.0 bn), extended to Kenya on 14th March 2016. The program expired on 14th September 2018 after being extended from 14th March 2018, and the Treasury announced that it was not keen on renewing the precautionary credit facility with the IMF, despite having requested an extension of the same in March 2018, arguing that the country had kept macroeconomic fundamentals stable despite the country not drawing on the facility. For more information, see our focus on The IMF Precautionary Credit Facility 2018. The key take outs from the IMF report were:
- Kenya’s risk of debt distress has increased from low to moderate: The IMF noted that Kenya’s debt and debt servicing has increased because of the government’s public investment drive and revenue shortfalls in recent years. Public debt is projected to rise to 63.2% of GDP in end 2018 from 58.0% in 2017 and 53.2% in 2016 due to increased infrastructural projects. The higher level of debt, coupled with rising reliance on non-concessional borrowing, has raised fiscal vulnerabilities and increased interest payments on public debt to nearly 20.0% of revenue, placing Kenya in the top quartile among its peers,
- The interest rate cap, introduced in September 2016, weakened economic performance: Interest rate controls have reduced the profitability of commercial banks, which have been forced to adjust their deposit and lending facilities with the controls, significantly reducing their net interest income. The IMF also noted that the interest rate cap had led to lower credit growth, reduced financial inclusion, weaker tax revenues, and higher financial stability risks. The estimated decline in growth due to the interest rate controls in 2017 is estimated at 0.25% - 0.75% points. Key to note, the recent removal of the floor rate on deposit due to the assent of the Finance Bill 2018 could increase banks profitability without necessarily increasing lending to SMEs, as it would lead to reduced cost of funding. Whether the amendment will translate to higher lending will be dependent on the "risk free" rate of government securities. If yields on government securities remain high, banks will continue to be incentivized to lend to the government rather than customers perceived to be riskier, and with lower cost of funds for the banks, return on equity could be higher. However, were yields on government securities to decline, the combination of greater spreads from the lower funding costs and diminished attractiveness of government securities could reignite lending to the private sector,
- The interest rate controls and interbank market volatility have hampered monetary policy effectiveness: The report stated that the Central Bank Rate (CBR) has lost its signaling role as interest rate controls have weakened the link between the CBR and bank lending and deposit rates. Prior to introduction of interest rate controls, the CBK had been changing the CBR with respect to developments in inflation and growth. However, since the implementation of the rate cap, the impact of the CBR cuts has not been clear. The weighted average interest rate in the interbank market has ranged between 3.0% and 10.0% during 2017 and early 2018. The wide range has entailed significant day-to-day volatility, which has had adverse effects on bank lending rates, incentivizing banks to retain excess liquidity, and weakened the monetary policy transmission mechanism,
- Additional measures would be needed for FY’2018/19 to meet the deficit target: The IMF noted that the weak performance of income generation and mobilization of tax revenue by the government are likely to persist, partially offsetting the effects of the revenue boosting measures as outlined in the FY’2018/2019 budget whose main focus was on fiscal consolidation. These measures include (i) the increment in excise duty of bank transaction, data and voice calls to 15.0% from 10.0% (ii) removal of the VAT exemption on petroleum imports and (iii) removing various VAT and Corporate Income Tax (CIT) exemptions. The measures are expected to yield to 1.1% of GDP in additional revenue. However, in order for the government to achieve its fiscal deficit target of 5.7% of GDP in FY’2018/19 down from 6.8% for the 2017/2018 fiscal year, the IMF projects that measures of an additional 0.6% of GDP will be needed. In line with this, the government has begun implementing austerity measures. The National Assembly passed an expenditure reduction of Kshs 37.6 bn, which is to be achieved through a reduction in recurrent expenditure and capital expenditure for FY’2018/2019 by Kshs 9.1 bn and Kshs 28.5 bn, respectively coupled with a reinstatement of Kshs 1.5 bn to the judiciary,
- The Kenyan shilling is over-valued by approximately 17.5%: The IMF’s assessment of Kenya’s current account deficit suggested an overvaluation of the real exchange rate by approximately 17.5%. This was attributed partly to CBK engaging in periodic foreign exchange interventions, reflecting limited movement of the shilling relative to the US dollar. CBK underscored their adherence to a flexible exchange rate policy and that their interventions were undertaken to avoid excessive exchange rate volatility, which they view as important for achieving macroeconomic and financial stability. In response to the IMF report, CBK stated that their calculations support the view that there is no fundamental misalignment reflected in the exchange rate and reiterates that the Kenya shilling reflects the currency’s fundamental value.
Kenya’s medium-term outlook remains favorable and we expect the GDP growth to average 5.4% - 5.6% in 2018. However, this positive outlook hinges on the implementation of reforms that will maintain macroeconomic and financial stability within the country. The government should continue with its efforts to work on a fiscal consolidation plan aimed at narrowing the fiscal deficit to 5.7% of GDP from 6.8% of GDP in the FY 2017/18 and further to around 3.0% of GDP by FY 2021/22. This can be achieved through revenue enhancement measures, which will in turn lead to reduced dependency on debt in a bid to reduce Kenya’s public debt burden. Abolishing or significantly modifying interest rate controls is also key for improving the subdued private sector credit growth, which has remained below the 5-year average of 13.0%, despite improving to 4.3% in August 2018. The government should also embark on aggressive privatization of state corporations, through listing, in order to diversify sources of funding for funding the budget effectively reducing the fiscal deficit as well as reduce a portion of the recurrent expenditure in running these corporations. CBK has emphasized its commitment to further strengthening macroeconomic stability and enhancing the resilience of the economy. They will also continue to sustain efforts towards maintaining low and stable inflation, further strengthening financial sector supervision and regulation, and deepening structural reforms.
Rates in the fixed income market have been on a declining trend, as the government continues to reject expensive bids, as it is currently 46.8% ahead of its pro-rated borrowing target for the current financial year, having borrowed Kshs 130.5 bn against a pro-rated target of Kshs 88.9 bn. The 2018/19 budget had given a domestic borrowing target of Kshs 271.9 bn, 8.6% lower than the 2017/2018 fiscal year’s target of Kshs 297.6 bn, which may result in reduced pressure on domestic borrowing. With the rate cap still in place, with the president having assented to the Finance Bill 2018, we maintain our expectation of stability in the interest rate environment. With the expectation of a relatively stable interest rate environment, our view is that investors should be biased towards medium-term fixed-income instrument.
Market Performance:
During the week, the equities market recorded mixed performances with NSE 20 and NSE 25 gaining by 0.5% and 0.6% respectively, while NASI declined by 0.3%, taking their YTD performance to declines of 24.0%, 15.7% and 14.8%, for NSE 20, NSE 25 and NASI, respectively. This week’s performance was driven by gains in large cap counters such as Bamburi, Equity, and KCB Group, which gained by 5.6%, 4.6%, and 0.7%, respectively. For the last twelve months (LTM), NASI, NSE 25 and NSE 20 have declined by 8.7%, 11.2% and 21.7%, respectively.
Equities turnover increased by 203.6% to USD 80.5 mn from USD 26.5 mn the previous week, bringing the YTD turnover to USD 1.6 bn. Foreign investors remained net sellers, with net weekly outflows decreasing by 9.6% to USD 11.7 mn, from USD 12.9 mn previously. We expect the market to remain subdued in the near-term as international investors exit the broader emerging markets due to the expectation of rising US interest rates coupled with the global strengthening US Dollar.
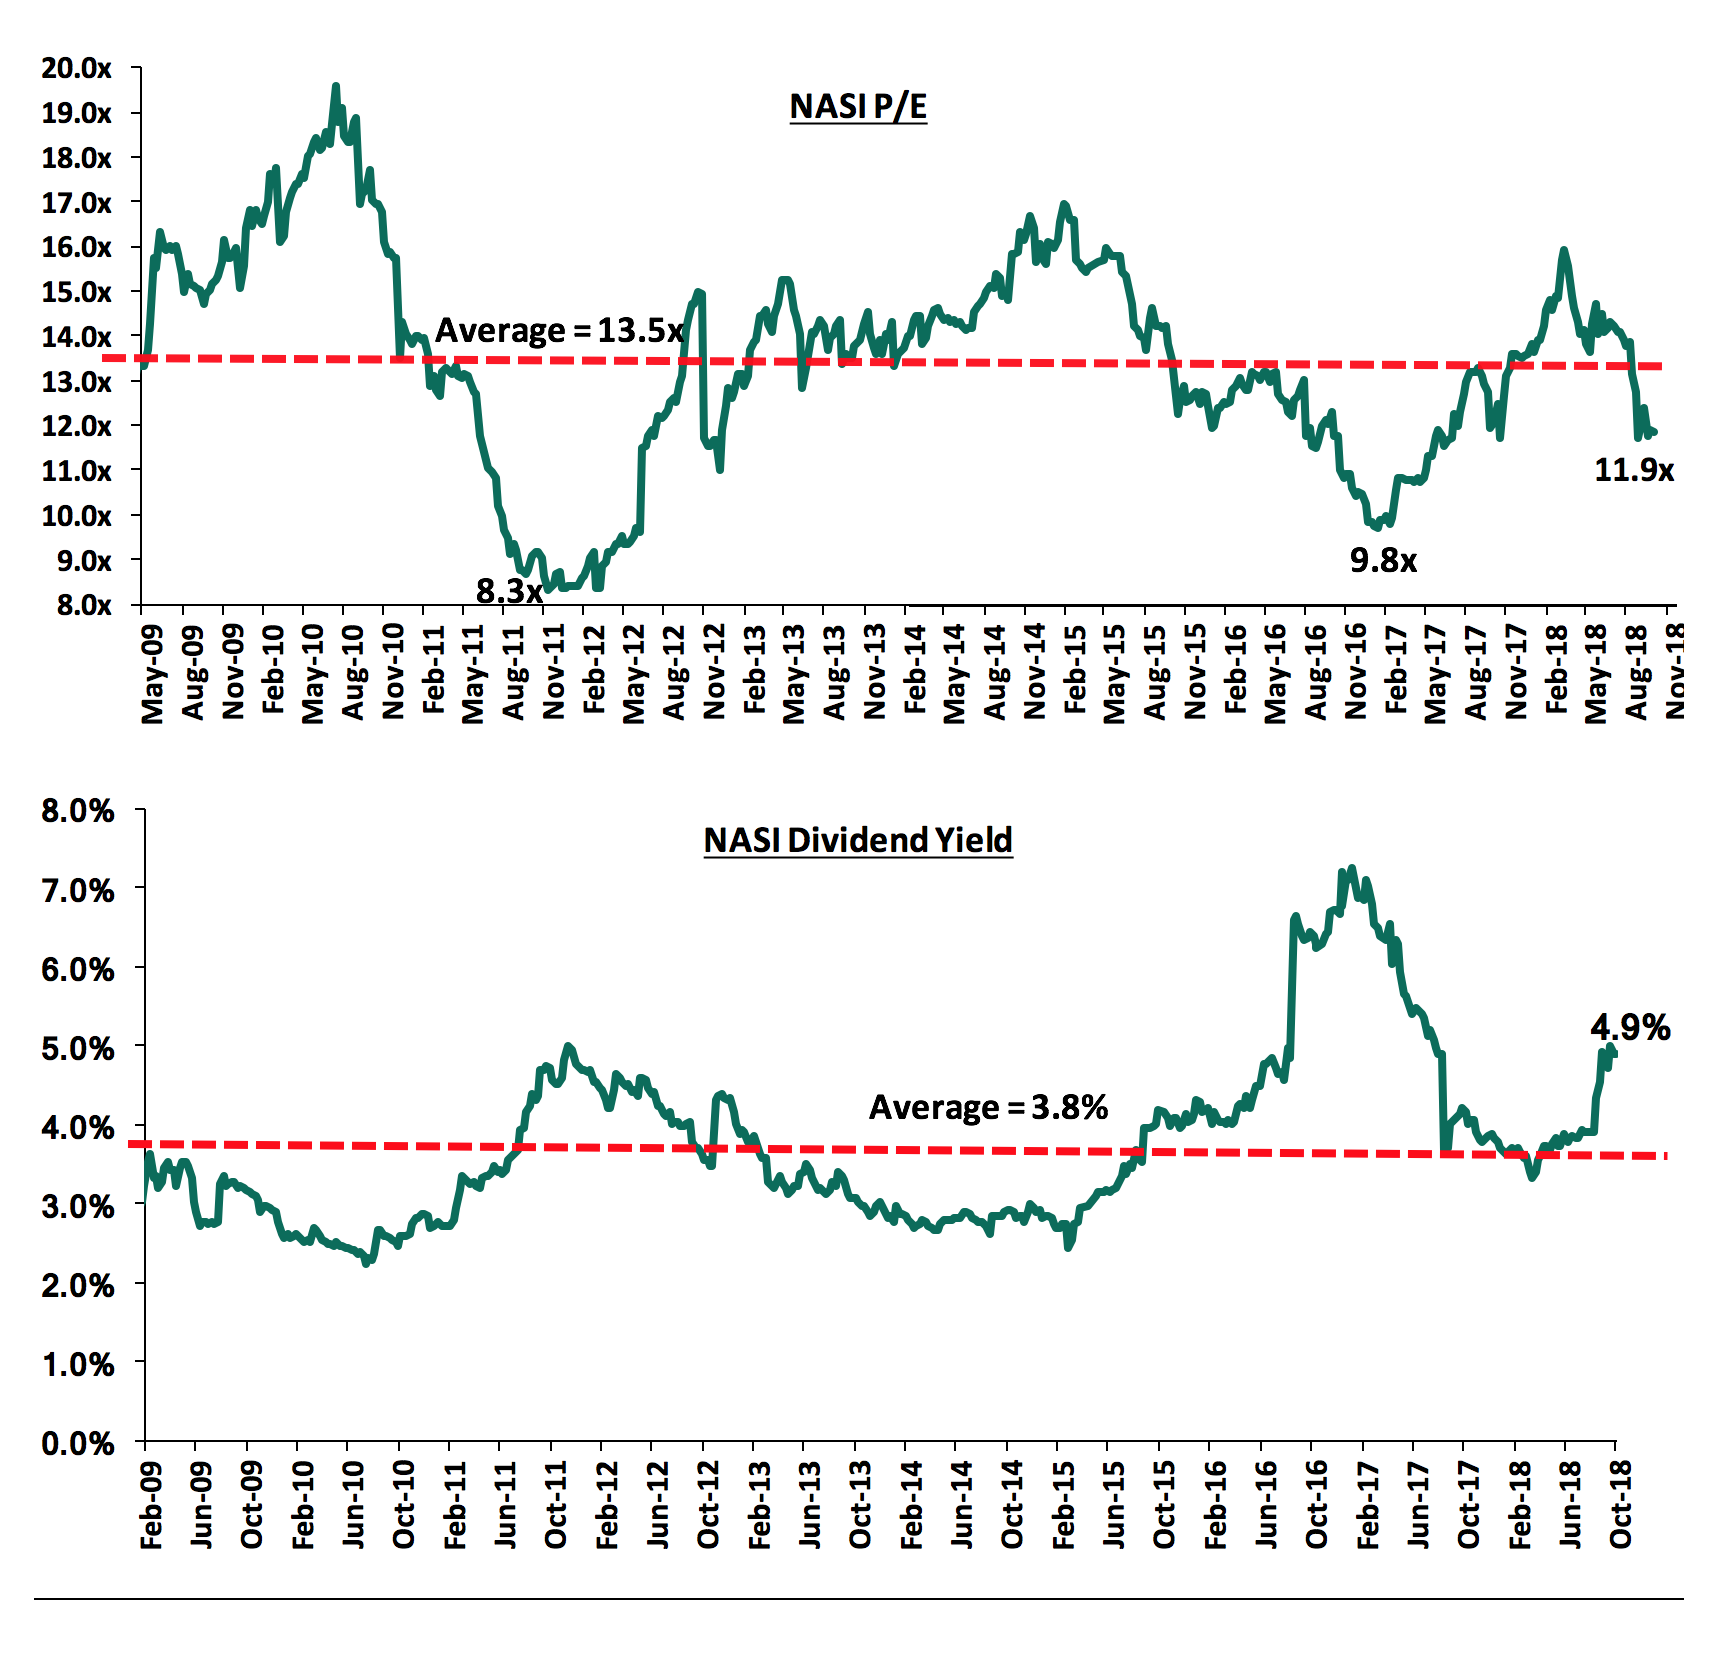
The market is currently trading at a price to earnings ratio (P/E) of 11.9x, which is 11.8% below the historical average of 13.5x, and a dividend yield of 4.9%, higher than the historical average of 3.8%. The current P/E valuation of 11.9x is 21.0% above the most recent trough valuation of 9.8x experienced in the first week of February 2017, and 42.7% above the previous trough valuation of 8.3x experienced in December 2011. The chart below indicates the historical P/E and dividend yields of the market:
Weekly Highlights:
During the Week, the Official Monetary and Financial Institutions Forum (OMFIF) in association with Absa Group Limited released the Absa Africa Financial Markets Index report 2018. The report evaluated financial market development in 20 Africa countries, as well as highlighting markets with clearest growth prospects. The report mainly analyzed and rank countries on six different pillars:
- Market depth,
- Access to foreign exchange,
- Market transparency, tax and regulatory environment,
- Capacity of local investors,
- Macroeconomic opportunity,
- Legality and enforceability of standard financial markets master agreements.
The top five highest ranked financial markets in Africa according to the index are; South Africa, Botswana, Kenya, Mauritius and Nigeria, respectively. Kenya climbed two spots to position three due to ease of access to foreign exchange as well as implementation of proper foreign trading policies such as reducing capital controls, which has boosted its performance.
Overall, Kenya had a score of 65% and was #3, an improvement from #5 last year. It ranked #1 on access to foreign exchange with a score of 93%, #8 on market depth with a score of 44%, #7 on capacity of local investors with a score of 33% and #6 on the macroeconomic opportunity with a score of 65%.
Key take-outs from the report include:
- Countries are progressing with policies that support the development of financial markets across the continent. An example is Mozambique’s ‘financial sector development strategy’ that stood out among the frameworks introduced over the past year. Such initiatives have boosted performance for the index as a whole,
- The greatest area for improvement for the continent remains the ‘capacity of local investors’. This is mainly due to lack of knowledge and expertise of pension fund trustees and other asset owners and this hinders the development of new financial products,
- ‘Market Transparency, Tax and Regulatory Environment’ and ‘Macroeconomic Opportunity’ are the highest-ranking pillars in the industry, and,
- Foreign exchange liquidity remains low in Africa, with just three countries (South Africa, Kenya and Ghana) recording interbank foreign exchange turnover of above $20 bn.
We are of the view that the following should be addressed to facilitate growth in the number of investors in the country and facilitate growth in the number of new listings as well as develop the number of new products in the NSE:
- Harmonizing tax incentives - We are of the view that tax incentives available to banks should also be made available to non-bank funding entities and new products such as unit trusts;
- Embarking on privatization of some of the state corporations through listing, this will increase the number of IPOs by state owned enterprises hence attracting a good number of private companies to list in the market; and
- Awareness programs aimed at enhancing literacy on capital markets. This will increase the knowledge of local investors on the new products available in the market.
For more information on Unlocking New listings on the Nairobi Bourse, see Cytonn Weekly #40
Corporate Governance Changes:
Liberty Holdings Ltd announced the resignation of Dr. Susan Mboya Kidero as the board chair.
Following the resignation, the following are the changes on the Corporate Governance metrics for Liberty Holdings Ltd:
- The board size has decreased to 5 from 6 hence an improvement of the metric score to 1 from 0.5 since the board consists of an odd number of members from an even number, raising the possibility that there will be no tie in case board members decide to vote on a decision;
- Gender diversity has declined to 0% from 16.7% since there is no longer a female member in the board;
- Ethnic diversity has improved to 60% from 66.7% since there are 2 out of 5 members of the board from the same ethnic group, a change from 2 out of 6; and;
- The proportion of non-executive members has changed to 80.0% from 83.3%;
Overall, the comprehensive score has remained the same at 77.1% and remains joint at position 9 with BAT, EABL and Jubilee Holdings in the 2018 Cytonn Corporate Governance Index.
KCB Group announced the appointment of Mr. Andrew Wambari Kairu as the new chairman, replacing Mr. Ngeny Biwott who held the position for five years.
Following the appointment to the KCB Group Board, the following are the implications on the Corporate Governance metrics for KCB Group;
- The board size has remained the same at 9 since Mr. Andrew Kairu was a non-independent director of KCB Bank Kenya and now joins the KCB Group board;
- Gender diversity has remained the same at 77.8%;
- Ethnic diversity has remained the same at 77.8%, since there are 2 out of 9 members of the board from the same ethnic group;
- The proportion of non-executive members has remained at 77.8%;
Overall, the comprehensive score has remained the same at 85.4% and remains joint at position 1 with NSE and Safaricom in the 2018 Cytonn Corporate Governance Index.
Equities Universe of Coverage:
Below is our Equities Universe of Coverage:
|
Banks |
Price as at 19/10/2018 |
Price as at 26/10/2018 |
w/w change |
YTD Change |
LTM Change |
Target Price |
Dividend Yield |
Upside/Downside |
P/TBv Multiple |
|
NIC Bank*** |
24.8 |
23.0 |
(7.1%) |
(31.9%) |
(31.2%) |
48.8 |
4.3% |
116.5% |
0.6x |
|
Diamond Trust Bank |
164.0 |
158.0 |
(3.7%) |
(17.7%) |
(11.2%) |
283.7 |
1.6% |
81.2% |
0.9x |
|
KCB Group |
38.3 |
38.5 |
0.7% |
(9.9%) |
0.7% |
61.3 |
7.8% |
67.0% |
1.2x |
|
Union Bank Plc |
5.0 |
5.1 |
1.0% |
(35.3%) |
(17.6%) |
8.2 |
0.0% |
61.4% |
0.5x |
|
I&M Holdings*** |
95.0 |
90.0 |
(5.3%) |
(29.1%) |
(27.4%) |
138.6 |
3.9% |
57.9% |
0.9x |
|
Ecobank |
8.0 |
6.9 |
(13.2%) |
(9.2%) |
0.1% |
10.7 |
0.0% |
55.5% |
1.5x |
|
Ghana Commercial Bank*** |
5.4 |
5.3 |
(0.9%) |
5.0% |
26.2% |
7.7 |
7.2% |
52.8% |
1.2x |
|
Zenith Bank*** |
22.9 |
24.0 |
4.8% |
(6.4%) |
(6.7%) |
33.3 |
11.3% |
50.1% |
1.1x |
|
Equity Group |
38.3 |
40.0 |
4.6% |
0.6% |
10.3% |
56.2 |
5.0% |
45.5% |
1.9x |
|
UBA Bank |
8.2 |
8.0 |
(1.8%) |
(22.3%) |
(14.1%) |
10.7 |
10.6% |
44.4% |
0.5x |
|
Co-operative Bank |
14.6 |
14.6 |
(0.3%) |
(9.1%) |
(9.6%) |
19.9 |
5.5% |
42.3% |
1.3x |
|
CRDB |
150.0 |
150.0 |
0.0% |
(6.3%) |
(11.8%) |
207.7 |
0.0% |
38.5% |
0.5x |
|
CAL Bank |
1.1 |
1.0 |
(5.5%) |
(3.7%) |
13.2% |
1.4 |
0.0% |
34.6% |
0.9x |
|
Barclays |
10.5 |
10.4 |
(0.5%) |
8.3% |
13.7% |
12.5 |
9.6% |
29.8% |
1.4x |
|
HF Group*** |
5.9 |
5.5 |
(7.6%) |
(47.6%) |
(46.0%) |
6.6 |
6.4% |
27.5% |
0.2x |
|
Access Bank |
8.3 |
8.0 |
(4.2%) |
(23.9%) |
(16.3%) |
9.5 |
5.0% |
24.5% |
0.5x |
|
Standard Chartered |
187.0 |
178.0 |
(4.8%) |
(14.4%) |
(17.2%) |
196.3 |
7.0% |
17.3% |
1.4x |
|
Stanbic Bank Uganda |
32.5 |
33.0 |
1.5% |
21.1% |
20.0% |
36.3 |
3.5% |
13.5% |
2.3x |
|
SBM Holdings |
6.3 |
6.1 |
(1.9%) |
(18.1%) |
(17.9%) |
6.6 |
4.9% |
11.7% |
0.9x |
|
Bank of Kigali |
289.0 |
289.0 |
0.0% |
(3.7%) |
1.4% |
299.9 |
4.8% |
8.6% |
1.6x |
|
Guaranty Trust Bank |
36.8 |
37.0 |
0.5% |
(9.2%) |
(11.9%) |
37.1 |
6.5% |
6.8% |
2.3x |
|
Stanbic Holdings |
90.0 |
90.1 |
0.1% |
11.2% |
14.0% |
92.6 |
2.5% |
5.3% |
0.9x |
|
National Bank |
5.0 |
5.0 |
0.0% |
(46.5%) |
(45.4%) |
4.9 |
0.0% |
(2.0%) |
0.4x |
|
Bank of Baroda |
126.0 |
140.0 |
11.1% |
23.9% |
27.3% |
130.6 |
1.8% |
(4.9%) |
1.2x |
|
Stanbic IBTC Holdings |
45.0 |
46.0 |
2.2% |
10.8% |
4.4% |
37.0 |
1.3% |
(18.3%) |
2.4x |
|
Standard Chartered |
26.0 |
25.0 |
(3.8%) |
(1.0%) |
49.1% |
19.5 |
0.0% |
(22.2%) |
3.1x |
|
FBN Holdings |
9.1 |
9.0 |
(1.1%) |
2.3% |
46.3% |
6.6 |
2.8% |
(23.6%) |
0.5x |
|
Ecobank Transnational |
17.0 |
16.8 |
(1.5%) |
(1.5%) |
(1.5%) |
9.3 |
0.0% |
(44.6%) |
0.6x |
|
*Target Price as per Cytonn Analyst estimates **Upside / (Downside) is adjusted for Dividend Yield ***Banks in which Cytonn and/or its affiliates holds a stake. For full disclosure, Cytonn and/or its affiliates holds a significant stake in NIC Bank, ranking as the 5th largest shareholder **** Stock prices are in respective country currency |
|||||||||
We are “NEUTRAL” on equities since the markets are currently trading below historical P/E averages. However, pockets of value continue to exist, with a number of undervalued sectors like Financial Services, which provide an attractive entry point for medium and long-term investors, and with expectations of higher corporate earnings this year, we are “POSITIVE” for investors with a long-term investment horizon.
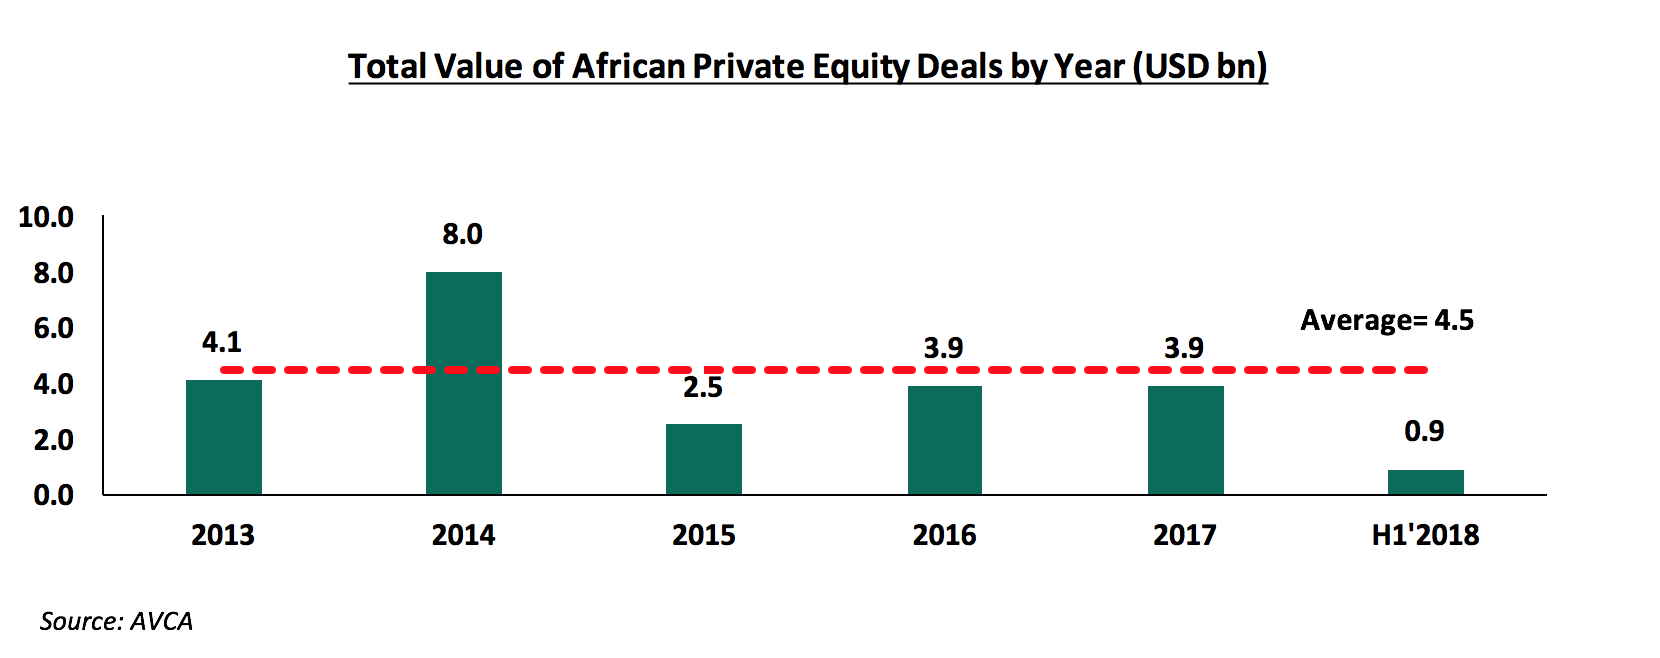
African Private Equity and Venture Capital Association (AVCA) released the African Private Equity Data Tracker brief for H1’2018, which presents the African Continent’s private equity (‘PE’) activity for the first half of the year. According to the report, the total value of reported African private equity deals in H1’2018 was USD 0.9 bn, a 10.0% drop from USD 1.0 bn reported in H1’2017. In terms of the share of deal value, the utilities sector was the largest sector in H1’2018, coming in at USD 0.3 bn or 37.0% of total value of deals, up from only USD 30.0 mn (3.0% of total value of deals) in H1’2017. The financial services sector’s deal volume share increased to USD 144.0 mn (or 16.0% of the total deal volume) in H1’2018 from USD 100.0 mn (or 10.0% of the total deal volume) in H1’2017.
In regard to fund raising, the total value of African PE fundraising in H1’2018 was USD 2.1 bn, comprised of USD 1.7 bn in interim (as highlighted in the yellow column below) and USD 0.4 bn in final closes. This is an improvement compared to the total value fundraising in H1’2017, which was reported at USD 2.0 bn.
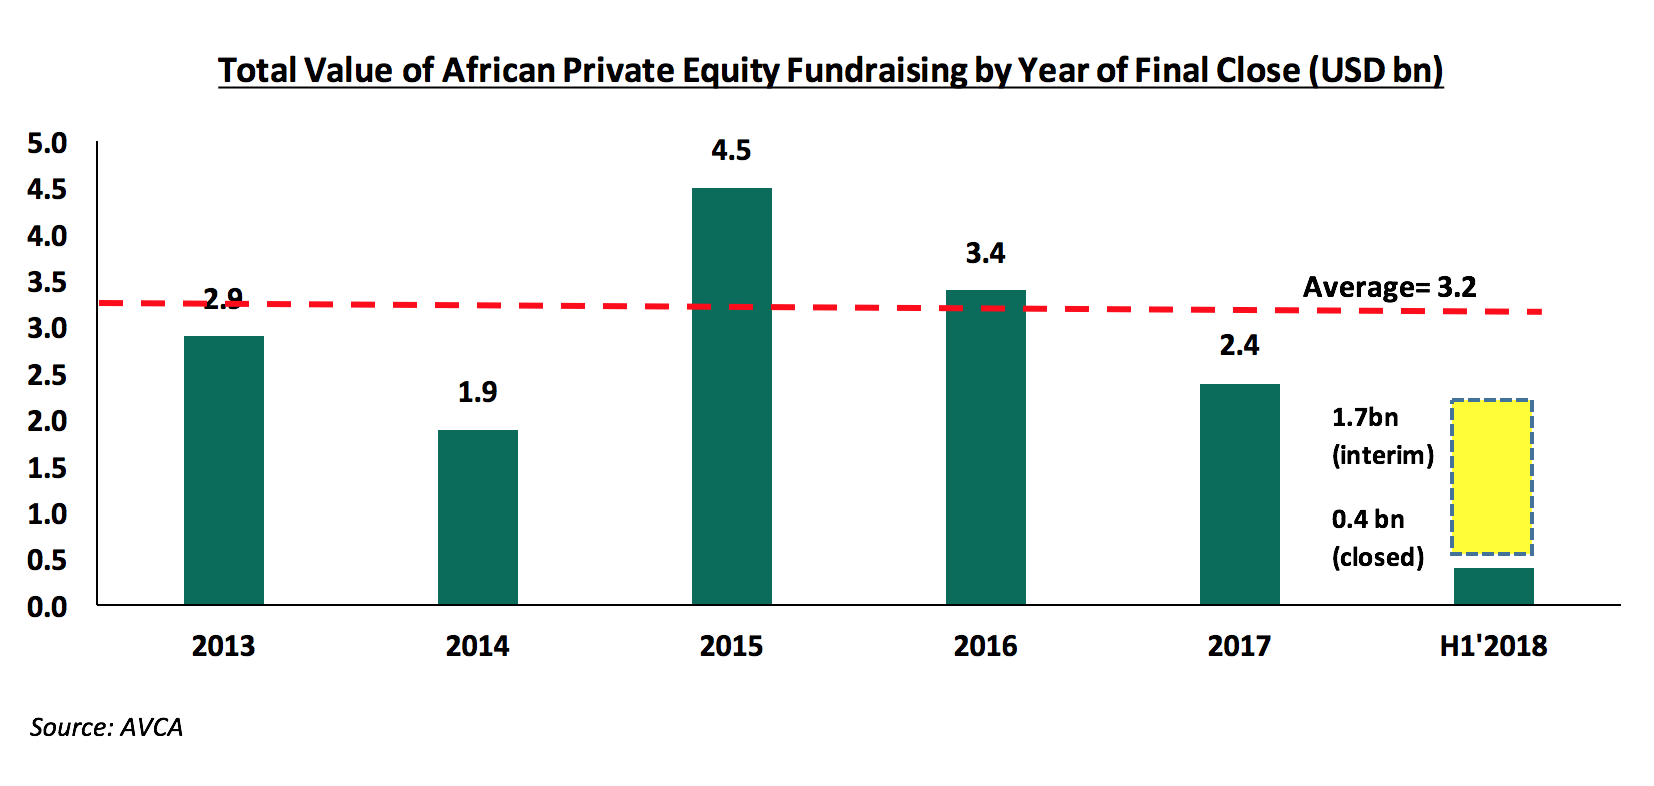
The key private equity funds that closed (not allowing new investments) during H1’ 2018 are highlighted below;
|
Selection of PE funds that announced a close in 2018 H1 |
|||||||||
|
Fund Manager |
Fund Name |
Status |
Reported Close Amount (USD mn) |
Regional Focus |
Sector Focus |
||||
|
Cepheus Growth Capital Partners |
Cepheus Growth Capital Fund |
First Close |
51.0 |
East Africa |
Generalist |
||||
|
Inspired Evolution Investment Management |
Evolution II |
Second Close |
124.5 |
Sub-Saharan Africa |
Energy |
||||
|
Investec Asset Management |
Growthpoint Investec African Properties |
First Close |
212.0 |
Pan-Africa |
Rela Estate |
||||
|
Partech |
Partech Africa Fund |
First Close |
57.0 |
Pan-Africa |
Generalist (Technology) |
||||
Source: AVCA
Outlook:
Back-to-back years of struggles across 2016 and 2017 caused by macroeconomic headwinds hitting two of the continent's most developed PE markets, namely; South Africa and Nigeria coupled with a slump in oil prices negatively affected private investments. Policy shocks, such as the interest rate caps in Kenya, Africa’s third largest developed PE market, slowed credit growth, which also had a negative effect. Despite this, we view the long-term growth trajectory for PE as positive, supported by an expected shift in investor sentiment. We expect this growth to be driven by the following key factors;
- Economic Growth: According to the World Bank, GDP growth in Sub-Saharan Africa rebounded to 2.4% in 2017, after slowing sharply to 1.3% in 2016. Growth in the region is projected to continue to rise to 3.1% in 2018 and an average of 3.6% in 2019-20, on the back of firming commodity prices and gradually strengthening domestic demand,
According to IMF analysis, private investment increases when GDP growth is high; a 1%-point increase in GDP growth rates leads to 0.21% points increase in the private investment rate. We expect this positive correlation to hold and as a result, private equity activity is set to improve,
- Political Stability. According to IMF data, reforms that strengthen the judiciary and regulatory environment are crucial for promoting private investment during periods of strong economic growth. Democratic elections have passed in multiple African countries, including Angola, which saw its first transfer of power to the opposition party since peacetime in 2002. This should provide investors in those countries with much greater confidence than in previous years, and,
- Economic recovery in West Africa. Improvements in commodity prices combined with the regions expected economic recovery will drive further investment in West Africa. Private equity investors and other state players, such as China, will also benefit from a potential uptick in public sector spending on important infrastructure works, and we may see greater appetite for Private Public Partnerships (PPPs) and general private capital in government-led projects.
Despite the recent slowdown in growth, we maintain a positive outlook on private equity investments in Africa as evidenced by the increasing investor interest, which is attributed to; (i) Economic growth, which is projected to improve in Africa’s most developed PE markets , (ii) the attractive valuations in Sub Saharan Africa’s private markets compared to its public markets, and, (iii) the attractive valuations in Sub Saharan Africa’s markets compared to global markets. Going forward, the increasing investor interest, stable macro-economic and political environment will continue to boost deal flow into African markets
- Residential Sector
The affordable housing initiative by the Kenyan Government under the Big 4 Agenda continues to witness increased support of its implementation from both private investors and the government. During the week, H.E President Uhuru Kenyatta signed into law the Supplementary Appropriation Bill No. 2 of 2018, with the housing department receiving Kshs 21.0bn, which is 44.7% of the Kshs 47.3 bn supplementary budget and a 223.1% increment from the Kshs 6.5 bn allocated in Kenya National Budget 2018/19, in support of the affordable housing initiative. The additional funding shows the government’s commitment to delivering 500,000 affordable housing units by 2022, an initiative expected to cost a total of Kshs 2.3 tn. This comes just after the Cabinet approved the guidelines for the implementation of the initiative in terms of projects’ financing, cost, design, quality and affordability last week. This far, the government has made advancements by putting in place various policies and strategies to support both developers and homebuyers, some of which include:
Measures to Support Home Buyers:
- 15% tax relief, for buyers of units developed under the affordable housing scheme up to a maximum of Kshs 108,000 p.a, or Kshs 9,000 p.m,
- Exemption from stamp duty tax, normally set at 2.0% - 4.0% of the property value, for first time home buyers of units under the affordable housing initiative, and,
- Plans to establish the Kenya Mortgage Refinancing Company (KMRC) by 2019, whose aim is to enhance mortgage affordability by enabling long-term loans at attractive market rates. So far, the KMRC has already received pledges for seed funding from the World Bank worth Kshs 15.1 bn, The National Treasury pledging Kshs 1.5 bn and banks such as the Cooperative Bank pledging Kshs 0.2 bn. For more information, please see our note on KMRC here.
Measures to Support Developers:
- 15% corporate tax rate for developers who provide at least 100 low – cost housing units p.a,
- Scrapping off of NEMA and NCA levies, encouraging developers to construct more units, due to the reduction in costs,
- Establishment of the National Housing Development Fund (NHDF), with the Kenyan President approving the Finance Bill 2018, which includes a 1.5% levy on employee’s basic salaries up to Kshs. 5,000 p.m. and the employer expected to match the same amount that will be channeled into the fund,
- Partnerships with developers through availing of public land for development, and,
- Establishment of a land bank whereby unutilized prime government land will be gathered together and availed for use by both local and foreign investors for affordable housing projects.
These advancements, as well as the increased funding, are commendable and a proof to the Kenyan Government’s commitment to delivering the affordable homes to Kenyans, and we anticipate the launch of various projects in coming months especially in Nairobi, with the Urban Housing Renewal Development LLP and Technofin, a developer, unveiling the house plans for Pangani Housing Project. However, we expect the affordable housing initiative to face impediments such as inadequacies in public-private partnership (PPP) package for private developers due to the persistent challenges that hinder the success of PPPs in Kenya such as (i) persistent red tape during government approval processes, (ii) equivocal profit-sharing strategies for the private partners, and (iii) long and extended time-frames that tend to characterize PPP projects, thus making them unattractive to private developers and inadequate infrastructure in several parts of the country, which will increase the construction cost, hence compromising the affordability.
During the week, Urithi Housing Co-operative Society Limited, a Co-operative that is registered by the Ministry of Trade, Industry and Co-operatives in Kenya, launched a development of 5,000 low-cost housing units on 100-acres at Birmingham Woodlands Estate in Mang’u Area, off Thika Road. The development will consist of 130 SQM bungalows, 105 SQM maisonettes, and 80 SQM & 60 SQM 3 & 2-bed apartments, selling at an average price of Kshs 6.45 mn, Kshs 4.95 mn, Kshs 3.95 mn, and Kshs 2.95 mn, respectively, translating to an average selling price per SQM of Kshs 48,815. We attribute the increased focus by developers on affordable housing to i) the large housing deficit mainly for the low income and lower-middle segment of the market, with a cumulative demand of 2 mn units growing by 200,000 units per year, according to National Housing Corporation, ii) the government affordable housing initiative and incentives, and iii) the high returns in the real estate sector, averaging at 24.3% over the last 5-years. According to Nairobi Metropolitan Area Residential Report 2018, satellite towns recorded a rental yield of 5.9%, 0.5% points higher than the market average at 5.4% thus attracting investors. On the other hand, with an average selling price of Kshs 74,759 per SQM, which is 37.6% lower than the market average at Kshs 119,827 per SQM, satellite towns attracting home buyers who are looking for affordability. We therefore, expect to see increased developments in satellite towns such as Thika and Juja that are recording higher rental yields of 6.1%. For developers, these areas are attractive given the affordability of land for development, with satellite towns average price being Kshs 21.0 mn, compared to Nairobi Suburbs-Low Rise Residential Areas at Kshs 92.0 mn and Nairobi Suburbs-High Rise Residential Areas at Kshs 220.3 mn, hence are able to save on costs thus providing more affordable housing. However, these areas lack the requisite infrastructure for development, such as proper access roads, power and sewerage services, hence developers are forced to incur these costs, which are then passed on to the end buyer, compromising on affordability. We therefore recommend increased focus on infrastructural development in satellite towns in order to enable developers achieve affordable units according to government affordable housing guidelines.
- Commercial Office Sector
In the commercial office sector, Ushuru Sacco office block along Wood Avenue in Kilimani, owned by Ushuru Co-op Savings and Credit Society Limited, is scheduled for opening in November 2018 (size and other details undisclosed). According to Cytonn Q3’2018 Markets Review, Kilimani, classified as a high-rise commercial office zone, recorded a yield of 9.6% in Q3’2018, 0.2% points increase from 9.4% in Q2’2018, while occupancy increased by 1.9% points from 85.4% in Q2’ 2018 to 87.3% in Q3’2018, and rent remained flat at Kshs 101 per SQFT. The increase in occupancy rates was because of the availability of Grade A offices that are attracting tenants due to the state-of-the-art technical services provided such as high-quality elevators, fittings and automation systems and ample parking at a minimum ratio of 3:1000 (3 parking slots for every 1000 SQFT) which lack in Grade B and C offices. Overall, the Nairobi Office Market had an average rental yield of 9.5% at an average occupancy rate of 87.3%, recording 0.2% and 3.1% points increase in rental yield and occupancy rates, respectively from Q2’2018 despite the total oversupply of 4.7 mn SQFT as at 2017.
The table below shows the performance of the commercial office sector in Nairobi in Q3’2018:
|
(All values in Kshs unless otherwise stated) |
|||||||||||
|
Nairobi Commercial Office Performance by Nodes Q3’2018 |
|||||||||||
|
Nodes |
Price Kshs / SQFT Q3' 2018 |
Rent Kshs/SQFT Q3 2018 |
Occupancy (%) Q3 2018 |
Rental Yield (%) Q3 2018 |
Price Kshs / SQFT Q2 2018 |
Rent Kshs/SQFT Q2 2018 |
Occupancy (%) Q2 2018 |
Rental Yield (%) Q2 2018 |
Q/Q Δ in Rents (%) |
Q/Q Δ in Yields (%) |
Q/Q Δ in Occupancy (%) |
|
Karen |
12,888 |
117 |
89.0% |
10.8% |
13,776 |
118 |
87.2% |
10.2% |
(0.7%) |
0.6% |
1.8% |
|
Westlands |
10,667 |
111 |
89.0% |
10.0% |
12,567 |
109 |
84.7% |
9.7% |
2.0% |
0.3% |
4.3% |
|
Parklands |
12,208 |
103 |
86.0% |
9.8% |
12,433 |
103 |
85.6% |
9.8% |
0.0% |
0.0% |
0.4% |
|
Kilimani |
13,031 |
101 |
87.3% |
9.6% |
12,694 |
101 |
85.4% |
9.4% |
0.0% |
0.2% |
1.9% |
|
Nbi CBD |
11,333 |
88 |
92.1% |
9.1% |
11,750 |
87 |
92.1% |
8.7% |
1.3% |
0.4% |
0.0% |
|
UpperHill |
13,386 |
100 |
90.1% |
9.0% |
12,708 |
101 |
85.7% |
9.0% |
(1.0%) |
0.0% |
4.4% |
|
Msa Road |
11,750 |
82 |
71.0% |
8.7% |
11,770 |
83 |
68.0% |
8.6% |
(1.0%) |
0.1% |
3.0% |
|
Thika Road |
11,750 |
85 |
89.0% |
8.7% |
11,500 |
85 |
80.0% |
8.7% |
0.0% |
0.0% |
9.0% |
|
Grand Average |
12,202 |
102 |
87.3% |
9.5% |
12,527 |
102 |
84.6% |
9.3% |
0.1% |
0.2% |
3.1% |
Source: Cytonn Research
We attribute the growth to; i) a stable macro-economic environment in 2018 making it conducive for business operations, and ii) growth of SMEs and multinational firms, which have created demand for quality offices. Despite the improved performance, we retain a neutral outlook on the office market and recommend investments in differentiated concepts such as serviced offices, which have low supply with a market share of just 0.35% and high returns with average rental yields of 13.4% compared to a market average of 9.5% and mixed-use developments with an average rental yield of 11.0%.
We expect continued increase in activities in the real estate sector, particularly in the residential sector, supported by government initiatives and commitment to delivering the affordable homes to Kenyans.
Infrastructure refers to the fundamental structure of an organization or system, which is necessary for its operation, and entails public water, energy, and systems for communication and transport. It is thus, considered the backbone of any country’s economic growth. Infrastructural improvements such as road and rail networks enhance a nation’s connectivity thus, unlocking the economic potential of a region by opening it up for trade and investments, as it allows for easy transport of labor, goods and services to where they are in demand. In real estate, infrastructure acts facilitate the sector’s growth as its availability, or lack thereof, determines the growth momentum of the real estate sector in a given location. Transport systems, for instance, enhance accessibility from home to the work place and vice versa, whereas utilities such as water, sewage disposal and electricity are essential for human living.
In the recent past, we have witnessed the Kenyan Government’s dedication to improving the infrastructural levels in Kenya, especially transport, as part of its efforts to elevate the country to upper middle-class status by 2030. For instance, according to the KNBS Economic Survey 2018, the development expenditure on roads is set to grow by 19.2% to Kshs 134.9 bn in 2017/18 from Kshs 109.0 bn 2016/17. Additionally, the Kenya Roads Board (KRB) is set to increase disbursements to the various road agencies and County Governments by 5.0% to Kshs 63.5 bn in 2017/18, from Kshs 60.5 bn in 2016/17. Examples of key road projects launched within the Nairobi Metropolitan Area since 2017 include the Western Bypass, and the dualling of Ngong Road Phase 3, among others. We anticipate that such projects will have a positive impact on the economic development in the region through driving sectoral growth including that of real estate.
Given our continued focus on real estate investment, with majority of our projects being in the Nairobi Metropolitan Area, this week we look at the state of infrastructure in the Nairobi Metropolitan Area, ongoing infrastructural projects and the areas expected to benefit from these and then take a view of the potential areas for real estate investment. To cover this, we shall address the following;
- Factors Affecting Infrastructure in the Nairobi Metropolitan Area; Drivers, Challenges, and Recent Developments,
- The State of Infrastructure in the Nairobi Metropolitan Area,
- Impact of Infrastructure on Real Estate, and,
- Conclusion – Recommended Areas for Real Estate Investment.
- Factors Affecting Infrastructure in the Nairobi Metropolitan Area; Drivers, Challenges, and Recent Developments
In the last few years, there has been increased investment in infrastructure in the Nairobi Metropolitan Area by both public and private sector players. The main factors driving investment in the sector include:
- Positive Demographics:
Nairobi Metropolitan Area has a relatively high population growth rate of 3.1% against the national and global average growth rate of 2.5% and 1.2%, respectively, as at 2018, which continues to outstrip infrastructure and service capacity thus creating demand for the same as required to serve the growing population. Nairobi County has the highest population density at 6,474 people per SQKM and growing at 4.1% p.a, followed by Kiambu County with a density of 818 people per SQKM and growing at 2.8% p.a, according to the Kenya National Bureau of Statistics (KNBS). Below is a summary table of the various counties’ demographics;
|
Nairobi Metropolitan Area Demographics |
||||
|
County |
Population (2018) |
Land Size(SQ.KM) |
No of people per SQ.KM 2018 |
Population Growth Rate |
|
Kajiado |
1,112,305 |
21,910 |
51 |
5.5% |
|
Nairobi |
4,499,785 |
695 |
6,474 |
4.1% |
|
Kiambu |
2,080,109 |
2,543 |
818 |
2.8% |
|
Machakos |
1,317,022 |
6,208 |
212 |
2.5% |
|
Murang'a |
976,564 |
2,559 |
382 |
0.4% |
|
Average |
|
|
294 |
3.1% |
Source: Kenya National Bureau of Statistics
- Government Initiatives:
These include:
- Establishment of the Road Annuity Fund:
The Roads Annuity Fund was established under the Public Finance Management (Roads Annuity Fund) Regulations, in 2015, for the purposes of providing capital to meet the National Government’s annuity payment obligations for the development and maintenance of roads under the Roads Annuity Programme (RAP). Some of the roads in the Nairobi Metropolitan Area that have been tarmacked or improved using the fund include; Uplands-Githunguri-Ngewa-Ruiru and Bomas-Karen-Dagoretti-Ruiru Road,
- Establishment of the Infrastructure Bond:
In 2016, the Government of Kenya issued a 15-year infrastructure bond of USD 300 Million to fund infrastructure projects. The fund aims to facilitate infrastructural development by acting as a bridge between the public and private sectors, helping eliminate the bottlenecks for private projects and Public Private Partnership Projects,
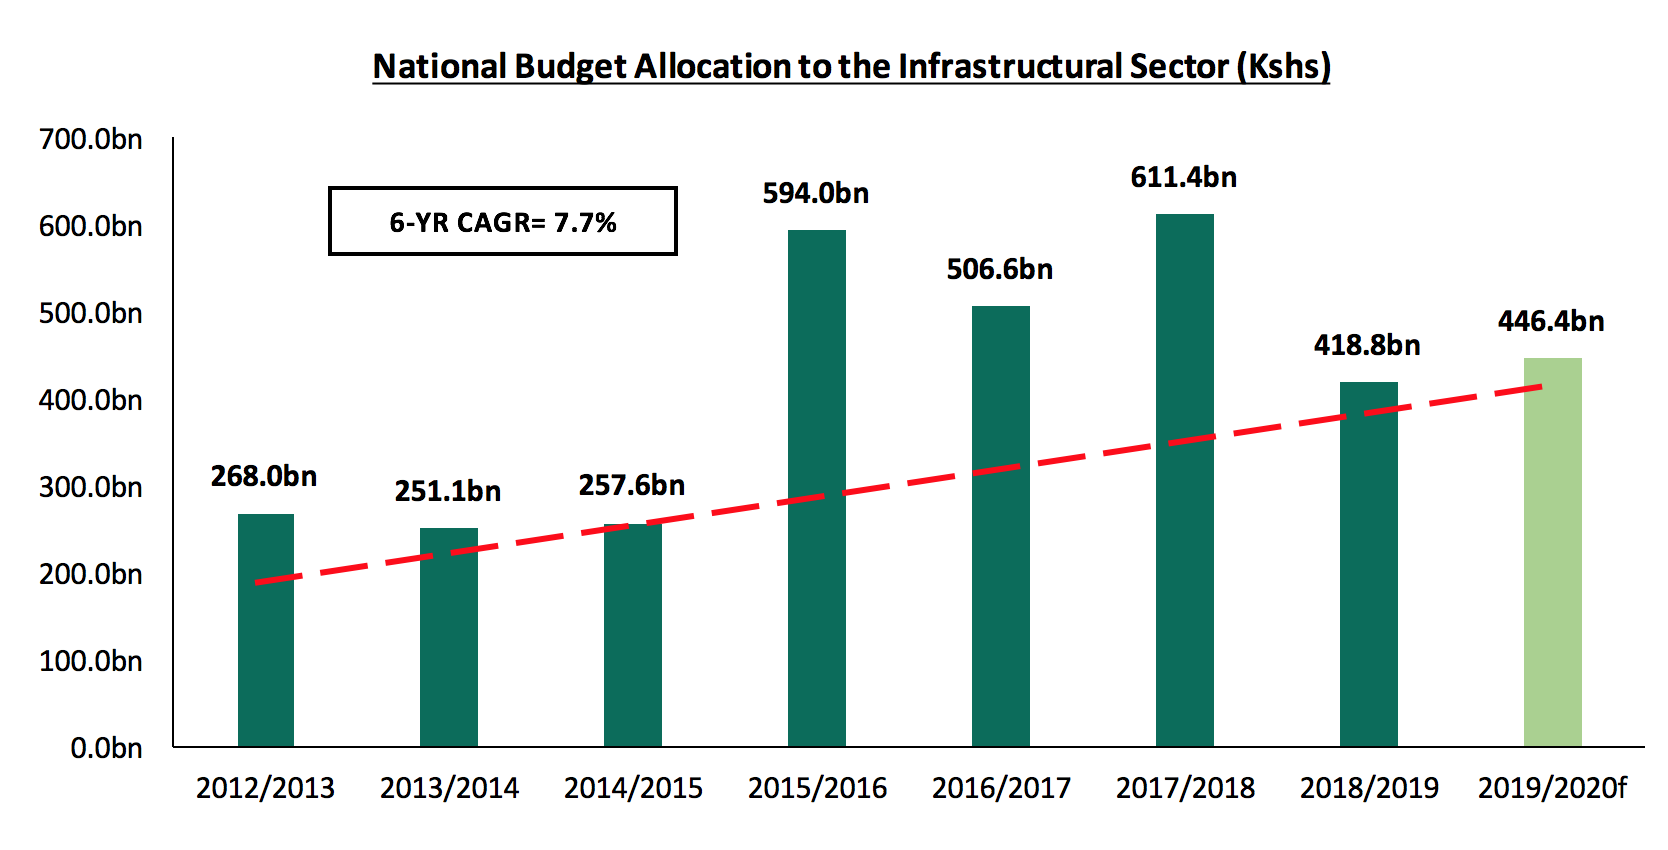
- Increased Budgetary Allocation to Improve Infrastructure in the Country:
The government has intensified efforts to enhance infrastructural development throughout the country, the Nairobi Metropolitan Area included. This is evidenced by the significant National Budget allocation, which recorded a 6-year CAGR of 7.7% from 2012 to 2019. For the year 2018/2019, the budget allocation to infrastructure came in at Kshs 418.8 bn, which is 13.6% of the national budget, as shown below:
Source: The National Treasury
For the Nairobi Metropolitan Area, the total budget allocation made to counties continues to increase, growing by a 6-year CAGR of 73.1%, and a 2.9% increase from Kshs 44.4 bn allocated in the 2017/2018 budget to Kshs 45.7 bn allocated in 2018/2019. This has resulted in continued funding of projects at Kenyan County level, including infrastructural projects. The county’s allocation is as illustrated below: 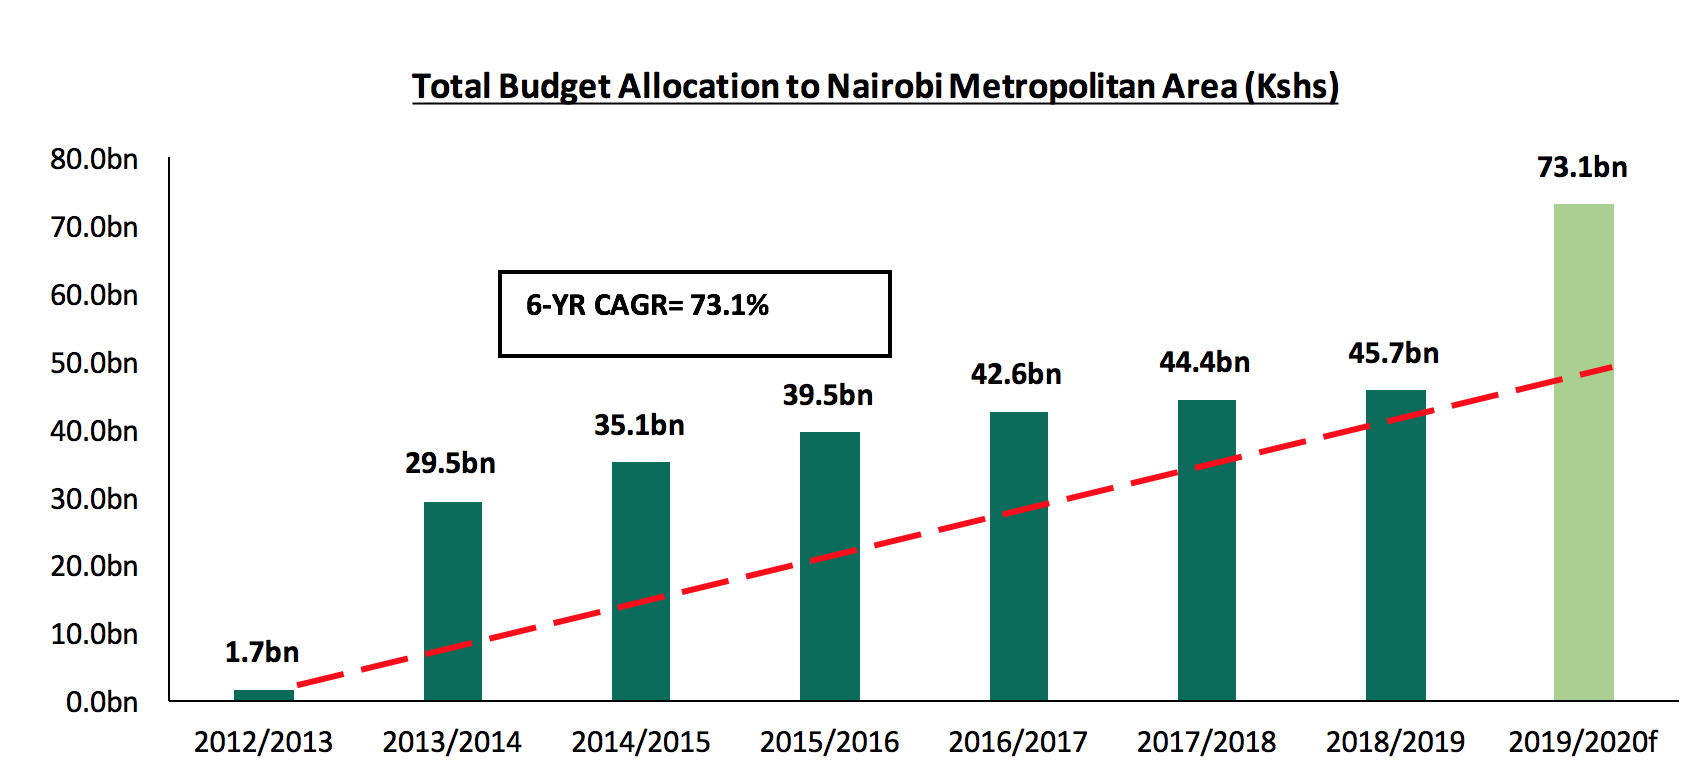
Source: The National Treasury
- Rising Foreign Direct Investment (FDI) in Infrastructure:
Kenya saw FDI inflow increase by 71.8% from Kshs 39.0 bn in 2016 to Kshs 67.0 bn in 2017, which was attributed to buoyant domestic demand and inflows into the country’s ICT industries. As a result, the country was ranked the 4th highest FDI recipient in East Africa after Ethiopia, Tanzania and Uganda in the World Investment 2018 Report, by the United Nations Conference on Trade and Development (UNCTAD). In line with the same, the infrastructural sector has witnessed entry of foreign institutions such as Bechtel, a global leader in engineering, procurement, and construction. The firm will be constructing the first high-speed expressway in the country, designed to run between Nairobi and the seaport at Mombasa,
- Increasing Private Sector Investment:
Kenya continues to develop programs to foster private sector participation in infrastructure investments to help address the funding gap in the sector. This has resulted in the emergence of Private Public Partnerships (PPP), which boosts the prospects of local construction companies and financial institutions that can offer finance to the companies. Some of the factors encouraging private sector investment include;
- Incentives to encourage private sector involvement: The government continues to encourage private sector investment into the sector through introduction of incentives. For example, through a 25.0% tax exemption, which allows investors in commercial property who spend on social infrastructure such as power, water, sewer lines, and roads to recover their expenses within 4-years, according to the Finance Bill 2012, and,
- Introduction of Power Purchase Agreements to Boost Investment in Energy: Since 2016, Kenya Power has entered into arrangements in the form of Power Purchase Agreements (PPA); an investor, usually a private power company establishes a power plant and sells to Kenya Power at a predetermined rate over a fixed period of approximately 20-years enabling them to recoup their investment. Some of the firms that have entered into a PPA agreement are Akiira Geothermal Limited, who are developing a 70 MW geothermal facility in Kajiado, and Kipeto Power Limited, who are developing a 100 MW wind energy also in Kajiado. Both projects will be sold to Kenya Power as per the PPA.
In spite of the factors boosting the sector’s growth, development of infrastructure also faces various constraints including:
- Huge capital outlay required to develop infrastructural projects, which has continued to discourage potential investors especially from the private sector,
- Encroachment and illegal occupation of land meant for infrastructural projects resulting in delay of projects and escalated project completion costs. For instance, the railway reserve in Kibera, which had been encroached by approximately 9,000 families, thus affecting the operation of cargo trains,
- Vandalism of facilities, such as petroleum products pipeline, electricity transformers and fiber optic lines, have resulted in high maintenance costs and capital loss, thus crippling infrastructural development,
- Lengthy legislative requirements, which include elongated processes of approval discourage investors from taking up infrastructural projects, as they are time consuming and expensive,
In terms of recent trends, some of the new developments in the last 2-years, which are likely to influence the sector include:
- Reintroduction of Toll Roads - The Kenyan Government is now reintroducing toll roads as a way of enhancing the expansion and maintenance of roads. Some of the key highways earmarked for tolling include; the Jomo Kenyatta International Airport (JKIA)-Rironi Highway, the proposed Nairobi-Mombasa Expressway, Nairobi Southern Bypass and the Thika Superhighway, and,
- Government’s Big Four Agenda: The Kenyan Government has embarked on increased focus on infrastructure, which must precede development of projects and has been identified as a key enabler of its Big Four Pillars, which include; a) provision of affordable housing with the delivery of 500,000 housing units by 2022, b) affordable healthcare, c) manufacturing and d) ensuring food security.
- State of Infrastructure in The Nairobi Metropolitan Area
We covered the current supply of infrastructure in the Nairobi Metropolitan Area and projects that are currently underway with a focus on roads, railways, water, sewerage, electricity and airports in the Nairobi, Kiambu, Machakos, Kajiado and Murang’a Counties. From our analysis, majority of the current provision of infrastructure is concentrated in the Nairobi County ranking the highest, followed by Kiambu County. We attribute this to Nairobi’s positioning as not only the capital city of Kenya, but also a key regional commercial hub, thus attracting a large portion of investments by both the public and private sectors.
Below is the analysis of the infrastructure provision in the Nairobi Metropolitan Area;
- Roads
Roads are the most common mode of transport in Kenya accounting for 62.9% of the total value of output from the transport sector as at 2018, according to the Kenya National Bureau of Statistics (KNBS). In 2011, it was estimated that, with the exception of Nairobi, 9.6% of roads in the Nairobi Metropolitan Region were paved compared to a national average of 13.7%. Excluding Nairobi County, Kiambu had the highest percentage of paved roads at 16.0%, Murang’a at 9.7%, Machakos at 6.9% and Kajiado had the lowest at 5.9%. We anticipate that the number of paved roads has significantly increased since then given the increased investment in the roads sector.
Between 2012 and 2018, Nairobi County has received the largest share of funds allocated to road projects at 61%. This is because of completion of roads such as the Southern Bypass, Eastern Bypass and Northern Bypass. In terms of road length, Kiambu County has the highest percentage at 39% attributable to construction roads in the county such as: the 80 km road from Muigai Inn through Kiandutu and Kiganjo to Muthaiga, and the 40 km road from Gatundu to Karinga.
|
Roads Completed in Nairobi Metropolitan Area (2012-2018) |
||||
|
County |
Scope (KM) |
Amount (Kshs) |
Percentage of Roads |
Percentage of Funds |
|
Nairobi |
111.6 |
29,319m |
24% |
61% |
|
Murang’a |
126.9 |
9,393m |
27% |
19% |
|
Kiambu |
184.0 |
6,331m |
39% |
13% |
|
Machakos |
48.0 |
3,240m |
10% |
7% |
|
Grand Total |
470.5 |
48,283m |
100% |
100% |
Source: KenHA, KERRA, KURA
With the increased disbursements of funds for roads development, construction of over 1000 kms of roads within the Nairobi Metropolitan Area has been underway, with Murang’a County having the largest road kilometers under construction at 29.0% of the total road projects. In terms of value, Nairobi has the highest value of investments in roads at 53.2% of the total amounts investments, as most of the roads under construction are class A roads, as Nairobi is the center of the country’s road network.
Some of the key roads under construction include; Western Bypass being built by China Road and Bridge Corporation and running for 31 km starting from Ruaka to the Nakuru highway at Gitaru in Kiambu County. Dualling of Ngong Road (Dagoretti Corner - Karen Roundabout Section) stretching up to 9.8 km in Nairobi County, while in Machakos County; construction of the 8 km Mombasa road to Daystar University Road and the Athi River – Machakos Turn off road covering 21 km. In Murang’a County, one of the major roads under construction is the 40 km road from Murang’a through Gitungi to Njumbi Mioro.
Below is a summary of roads under construction within the Nairobi Metropolitan Area:
|
Summary of Roads Under Construction Within Various Counties Within Nairobi Metropolitan Area |
||||
|
County |
Distance (KM) |
Cost (Kshs) |
% of Road Km |
% of Amounts Investment |
|
Nairobi |
260.8 |
79,192m |
14.0% |
53.2% |
|
Murang’a |
533.1 |
22,700m |
29.0% |
15.3% |
|
Kiambu |
464.5 |
19,505m |
13.2% |
13.2% |
|
Machakos |
314.2 |
19,101m |
17.1% |
12.8% |
|
Kajiado |
267.0 |
8,223m |
14.5% |
5.5% |
|
Total |
1,839.6 |
148,722m |
100.0% |
100.0% |
Source: KenHA, KERRA, KURA
- Railways
The use of rail transport is still low in Kenya accounting for only 0.5% of the value of output from the transport sector in 2017 compared to roads at 62.9%. The total Nairobi Metropolitan Area railway network coverage is 206 km. It consists of 75 km and 15 railway stations within the Nairobi County, and 131 km and 5 railway stations within Kiambu County.
The main railway routes serving the Nairobi Metropolitan Area include:
|
Main Railway Routes in Nairobi Metropolitan Area |
|||
|
Railway Routes |
Intermediate Stops |
Services Per Day |
Average Boarding Per Train |
|
Ruiru - Nairobi |
Kahawa, Githurai, Mwiki, Maili Saba, Dandora, S. Mtwinda, Makadara |
2 |
900 |
|
Embakasi Village - Nairobi |
Aviation, Tai Mall, Avenue Park, Quarry, Donholm, Makadara |
2 |
800 |
|
Kikuyu - Nairobi |
Thogoto, Dagoretti Station, Lenana, Satellite, Kibera, Gatwekera, Mashomoni, Laini Saba |
2 |
800 |
|
Syokimau - Nairobi |
Imara, Makadara |
6 |
732 |
Source: Nairobi Rail Service
To improve public rail transportation for both passengers and cargo, railway infrastructure is undergoing expansion through a number of projects that will serve to improve access within the Metropolitan Area.
Some of the new railway stations recently launched include, Makadara railway station and Imara Daima launched in 2013. Some of the upcoming projects include the Upgrading of Nairobi Railway Station and the Rail flyover project, which is part of Nairobi Integrated Urban Development Master Plan 2030, which will connect Enterprise Road to the Nairobi Central Business District.
|
List of Ongoing and Complete Railway Projects |
||||
|
Ongoing Projects |
Timeline |
Status |
Length |
Value(Kshs) |
|
Kahawa Railway Station |
20 18 |
Completed |
353mn |
|
|
Mombasa-Nairobi |
2017 |
Completed |
472km |
327bn |
|
Nairobi Commuter Rail Network |
2018 |
Ongoing |
149km |
24bn |
|
Nairobi – Naivasha SGR Section 2A |
2019 |
Ongoing |
120km |
172bn |
Source:Kenya Railway Corporation
Other upcoming projects include:
- Naivasha - Kisumu (Section 2B)
- Upgrading of Nairobi Railway Station
- Rehabilitation and Remodeling of Kenya Railway passenger sleeper coaches
- Installation of Commissioning integrated parking system to all the passenger stations
- Water
The main sources of water in the Nairobi Metropolitan Area include piped water, water vendors and boreholes. According to research by the Water Services Regulatory Board (WASREB) 2018, the average rate of access to piped water in the Nairobi Metropolitan Area stood at 59% with Nairobi having the highest coverage at 81%. However, access to piped water in Nairobi’s satellite towns mainly in Kajiado and Machakos Counties still remains low at 42% and 48%, respectively. This has created opportunities for the private sector to invest in other water sources such as water vendors and drilling boreholes to supplement the inadequate and inconsistent water supply to several satellite towns.
|
Nairobi Metropolitan Water Coverage Summary 2018 |
|
|
County |
Water Coverage |
|
Nairobi |
81% |
|
Kiambu |
75% |
|
Murang'a |
47% |
|
Kajiado |
42% |
|
Machakos |
48% |
|
Average |
59% |
Source: Water Services Regulatory Board 2018
The main water service providers for Nairobi and its surrounding areas include:
|
No. |
Water Service Provider |
Jurisdiction |
|
1 |
Nairobi City Water and Sewerage Company |
Nairobi CBD and its environs |
|
2 |
Runda Water Company |
Runda area |
|
3 |
Kiambu Water and Sanitation Company |
Kiambu Township and its environs |
|
4 |
Ruiru – Juja Water & Sewerage Company Ltd |
Ruiru and Juja Towns and its environs |
|
5 |
Oloolaiser Water & Sewerage Co. Ltd |
Kajiado Township and its environs |
|
6 |
Kikuyu Water Company |
Kikuyu Township and its environs |
|
7 |
Karuri Water and Sanitation Company |
Karuri Township, Kiambu county and its environs |
|
8 |
Murang’ a Water and Sanitation Company |
Murang’a County |
|
9 |
Mavoko Water and Sewerage Company (MAVWASCO) |
Syokimau,Mlolongo, Athiriver, Kinanie and Chumvi |
Source: Water Services Regulatory Board
In order to meet the rising demand of water services by the growing population, the government has facilitated several water service projects. Some of the proposed projects include:
- Gatamathi And Kahuti Water Supply Project in Murang’a County,
- Ruiru-Juja / Greater Githurai Water Supply System in Kiambu County,
- Mwala Cluster & Machakos Water Supply Works in Machakos County,
- Kiserian – Ongata Rongai Water Supply System in Kajiado County.
Other projects include:
|
Completed, Ongoing & Proposed Water Water Projects |
|||||
|
No. |
Projects |
Region |
Status |
Timeline (Year) |
Value (Kshs) |
|
1 |
Eastern Transmission (Kiambu-Embakasi) Pipeline |
Kiambu/Nairobi |
Completed |
2018 |
2,012m |
|
2 |
Ruiru II Dam |
Kiambu |
Completed |
2018 |
21,391m |
|
3 |
Construction of Augmentation Works for Theta Dam |
Kiambu |
Completed |
2018 |
67m |
|
4 |
Karemenu Dam |
Kiambu |
Ongoing |
2020 |
24,000m |
|
5 |
Limuru Water Supply Project |
Nairobi |
Ongoing |
2018 |
71m |
|
6 |
Construction of the Western Transmission (Kabete-Uthiru-Karen) Pipeline |
Nairobi |
Ongoing |
2018 |
1,085m |
|
7 |
Kahuti Community Water Supply Project |
Murang'a |
Ongoing |
2018 |
63m |
|
8 |
Mavoko Water Supply Project |
Machakos |
Ongoing |
2019 |
25,000m |
|
9 |
Extension of 250mm diameter mainline from Kenol to Makuyu |
Murang'a |
Ongoing |
2018 |
125m |
|
10 |
Upgrading the sections of Kenol and Kabati |
Murang'a |
Ongoing |
2018 |
7m |
|
11 |
Construction of 315mm Diameter mainline from Wanyaga intake to Mungaria tank |
Murang'a |
Proposed |
2019 |
170m |
|
12 |
Construction of 500mm diameter main from Kinyona intake works to New Mariira Tank |
Murang'a |
Proposed |
2021 |
500m |
Source: Athi Water Services Board
d. Sewerage
Sewerage connectivity in the Nairobi Metropolitan area and nationally still remains poor, with statistics from the World Health Organization showing that only 3% of Kenya's population had a sewer line connection by 2016. Nairobi City currently has 162.7Km of sewer lines covering its area of 695 SQKM. The existing sewer infrastructure in Nairobi serves areas such as Kilimani, Kileleshwa, and the CBD, leaving a majority of the city residents who live in low-end areas such as in the informal settlements with no access to sewer lines.
The situation is similar in other parts of the metropolitan area, with Kiambu County having only 11km of sewer line serving its total area of 2,543.4 SQKM, while Mavoko sub-county currently has only 31.1km of sewer lines serving its 963 SQKM total jurisdiction. Kajiado County also suffers from the same predicament, with none of its towns having sewerage connections, a situation that in September 2018 led residents of Kitengela to unveil plans to build their own sewer line. In Murang’a County, only Murang’a town has access to a sewer, with other towns such as Kangema, Kenol and Maragua lacking sewer connectivity.
A comparison of sewerage coverage according to counties in the Nairobi Metropolitan Area is as shown below;
|
Sewerage Coverage in Nairobi Metropolitan Area |
|
|
County |
Sewer Coverage (%) |
|
Nairobi |
50% |
|
Machakos |
17% |
|
Kiambu |
15% |
|
Murang’a |
3% |
|
Kajiado |
0% |
|
Average |
17% |
Source: Water Services Regulatory Board
Due to the inadequate sewer coverage, majority of residents rely on septic tanks and other forms of improved sanitation such as pit latrines and bio-digesters.
With the growing population, and urbanization particularly in satellite towns in Kiambu, Machakos and Kajiado Counties, concerted efforts have been made to improve sewer connectivity, with various projects being initiated mainly by the Athi Water and Sewerage Services Board.
|
Ongoing & Proposed Sewerage Projects in Nairobi Metropolitan Area |
||||||
|
Project |
County |
Areas of coverage |
Length(km) |
Value Kshs ‘Mn’ |
Tender Award Date |
|
|
Kikuyu water & sewerage project |
Kiambu |
Kikuyu, Waithaka |
45.0 |
635 |
15th Aug 2018 |
|
|
River Kibarage trunk sewer |
Nairobi/Kiambu |
|
0.9 |
73 |
16th Feb 2018 |
|
|
Ruiru |
Kiambu |
Wembley, Gitambaya, Ruiru town, Muthura, Gatongora and Kiwanja |
56.0 |
280 |
8th Feb 2018 |
|
|
Enhancement of Nairobi, Gitathuru, Ngong and Mathare River |
Nairobi/Kajiado/ Kiambu |
|
0.9 |
77 |
16th Feb 2018 |
|
|
Kiambu and Ruaka* |
Kiambu |
Ruaka, Ndenderu, Muchatha, Kirigiti, Thindigua, Kiamumbi |
53.0 |
|
|
|
|
Kiserian sewerage project |
kajiado |
|
2.0 |
709 |
17th Nov 2014 |
|
|
Ruai Outfall Trunk Sewer |
Kiambu |
Ruai, Dandora, Githurai, Mwiki |
9.0 |
|||
|
Gatharaini North Trunk Sewer* |
Kiambu |
Muiruri Estate, Gatharani North, Mwiki |
9.3 |
|||
|
Gatharaini South Trunk Sewer* |
Kiambu |
Kasarani Stadium area, ICIPE, Safari Park, Thome Estate |
8.2 |
|||
|
Clay Works Trunk Sewer* |
Kiambu |
Allsops, KBL, Garden Estate, Ridgeways |
3.0 |
|||
|
Ruaraka Trunk Sewer* |
Nairobi/Kiambu |
|
3.3 |
|||
|
Machakos Sewer line |
Machakos |
Machakos |
60.0 |
Yet to be awarded |
||
|
Muranga Sewer |
Muranga |
Kenol, Maragua, Kiriaini, Kangema and Kangari |
|
4000 |
Yet to be awarded |
|
|
*Value of project to be established |
|
|||||
Source: Athi Water Services Board
A summary of the ongoing and planned projects per county is as below, with Kiambu and Machakos Counties having the largest share of proposed sewer projects at 65.5% and 23.9%, respectively;
|
Ongoing and Planned sewerage projects in Nairobi Metropolitan area |
||
|
County |
Length (Km) |
Percentage of sewer Coverage |
|
Kiambu |
164.2 |
65.5% |
|
Machakos |
60.0 |
23.9% |
|
Nairobi |
24.4 |
9.7% |
|
Kajiado |
2.0 |
0.8% |
|
Muranga* |
0.0 |
0.0% |
|
Total |
250.6 |
100% |
|
*Length of sewer line to be confirmed |
||
Source: Water Services Regulatory Board
Kiambu County has the largest share of proposed sewer projects at 65.5% attributable to the low sewer connectivity in the area coupled with the high population growth in its fast-growing towns such as Ruaka, Ruiru and Kikuyu, thus necessitating an improvement in sewer connectivity.
Generally, the Nairobi Metropolitan Area is continuously expanding and the population growing, thus the need to improve the sewerage system. The ongoing and planned sewerage systems, apart from improving sanitation and hygiene, are expected to reduce construction costs for developers as they eliminate need for septic tanks, bio digesters and other forms of sanitation.
e. Electricity
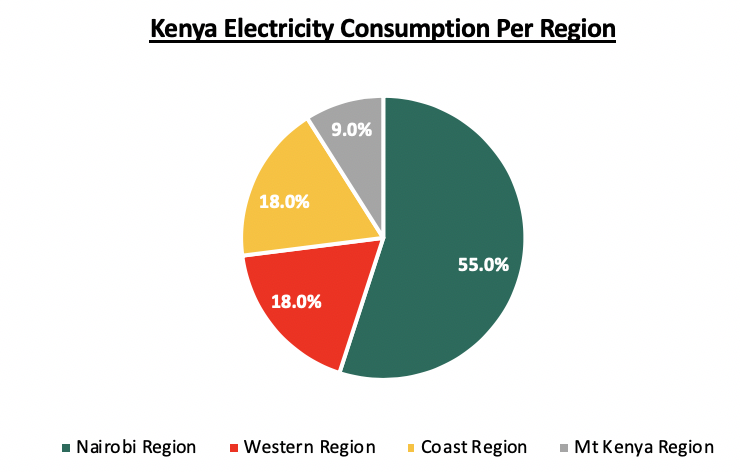
According to the Kenya Power Financial Report 2017, the Nairobi Metropolitan Area consumes more than 50.0% of Kenya’s electricity supply. This is largely a result of the industrial nature of the capital city with majority of Kenya’s manufacturing industries based in Nairobi in areas such as the Industrial Area and along Mombasa Road, and its satellite towns such as Ruiru and Thika. Furthermore, in addition to being the main commercial hub in Kenya, Nairobi is regarded as one of the key regional hubs in the continent, and thus it hosts several local and international firms. Key business nodes include Upperhill, Central Business District, Westlands and Kilimani areas. According to Kenya Power, Nairobi Region that includes Nairobi, Kiambu, Machakos, Makueni and Kajiado, recorded the highest electricity consumption in 2017, accounting for 55.0% of the total Kenya Power purchases.
Source: Kenya Power
The Kenya Power and Lighting Company Limited (KPLC) is the sole distributor and transmitter of electricity in Kenya while KETRACO (Kenya Electricity Transmission Company) is the authority responsible for design, operating and maintenance of transmission lines and power stations. While the government is the main controller of the aforementioned companies, we have seen increased involvement of the private sector in the production of electricity.
The key firms that undertake generation of electricity include:
- Kenya Electricity Generating Company Limited (KenGen),
- Independent Power Producers (IPPs) such as IberAfrica, Or-power4 Inc., Imenti, Thika Power, Golf Power, Triumph Generating Company, and Gikira Small Hydro,
- External sources such as Uganda Electricity Transmission Company Limited (UETCL) and Tanzania Electric Supply Company Limited (TANESCO).
Electricity Access
According to a KNBS and SID International’s National Inequality Survey carried out in 2013, 39.5% of Nairobi Metropolitan Area residents use electricity as a source of lighting, in comparison to the national average of 22.3%. Nairobi County had the highest access to electricity with 72.1% of the population relying on the utility for lighting in comparison to other counties such as Murang’a, which had the least electricity penetration of 13.8%.
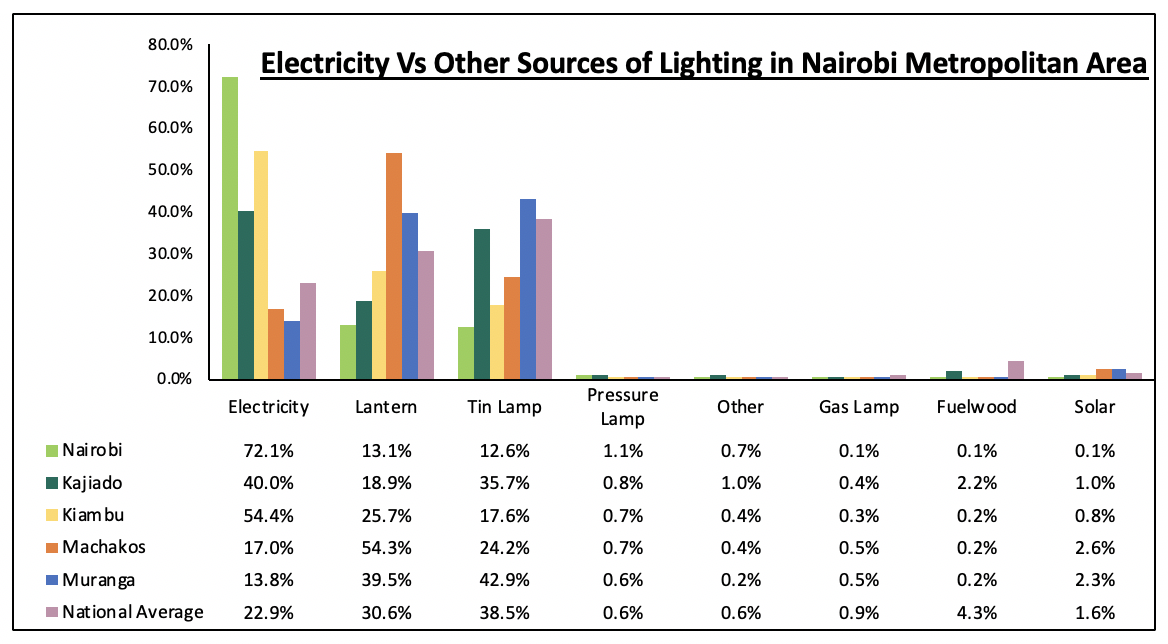
Source: KNBS/SID International
Key to note, however, is that electricity penetration has significantly improved over the past five years. According to Kenya Power, the number of customers was 6.5 mn as at March 2018 compared to 2.3 mn customers in March 2013, a 5-year CAGR of 23.6%. This represents an electricity access rate of 72.6%, which is a 50.3% points’ growth from the 22.3% recorded in 2013. This has been achievable through the rigorous efforts to improve electricity access to Kenya as a whole.
In line with its economic development strategies, the government has embarked on various programs aimed at promoting electricity access and they include:
- Least Cost Power Development Plan: The aim is to guide energy sector stakeholders on how to meet the energy needs of the nation for subsistence and development at least cost to the economy and the environment,
- Last Mile Project: The aim is to increase electricity access to Kenyans and is implemented by the Kenya Power. Under this project, the entity will maximize the utilization of the 40,000 existing distribution transformers spread across the country as well as installation of new transformers, while Rural Electrification Authority will focus on expansion of the low voltage network lines to improve reticulation in rural areas,
- Kenya Electricity Expansion Project (KEEP): The aim is to enhance the electricity network, establish new primary substations and upgrade works on existing ones in identified locations countrywide,
- Global Partnership for Output Based Aid project: The partnership between the Government of Kenya and the World Bank aims at providing safe, legal and quality power supply to people living in informal settlements at subsidized costs,
- Nairobi City Centre Network Upgrade and Reinforcement Project: The government aims at improving the quality of power supplied in the city and its environs. In line with this, earlier this year, the President of Kenya launched the Nairobi City Centre 220/66kV Gas Insulated station (GIS) sub-station that is set to boost the county’s Bulk Power supply system. The Kshs 13.0 bn project serves the Industrial Area, Mombasa Road, Upperhill, Central Business District, and Kilimani areas; providing industries and investors with reliable and uninterrupted power supply.
In response to the high demand for electricity, the government has also put in place other projects, with most pending financing partners. According to the KPLC Grid Plan for 2016 - 2021, there are Kshs 201.7 bn worth of planned transmission projects with a due date of 2021, where 30.8% of these, worth Kshs 62.0 bn, will be within the Nairobi Metropolitan Area.
|
Ongoing Transmission Projects at Preparation & Financing Stage |
|||||
|
Planned Projects |
Project Details |
Cost (Kshs) |
|||
|
Ngong - Magadi |
84km, 132KV double circuit transmission line, |
2.3 bn |
|||
|
Silali/Baringo - Rongai |
180km 400kV double circuit line |
6.6 bn |
|||
|
Menengai - Rongai |
33km 400V double circuit line |
3.5 bn |
|||
|
Uplands (Limuru) substation |
132/33KV Substation |
0.8 bn |
|||
|
Kamburu – Embu - Thika |
196km 220kV Line, with one substation in Thika |
6.8 bn |
|||
|
Gilgil – Thika – Nairobi East - Konza |
205km 400kV double circuit line, with substations in, Thika and Kangundo |
10.3 bn |
|||
|
Isinya - Konza |
45km 400kV double circuit line, with substation in Konza |
4.7 bn |
|||
|
Murang'a |
33/11kv Primary Substation in Murang’a |
454,545 |
|||
|
Konza-Nairobi East |
52km, 400kV double circuit line |
5.2 bn |
|||
|
Nairobi Ring |
220 KV Ring around Nairobi Metropolitan Area |
20.0 bn |
|||
|
Suswa - Ngong |
40km, 220kV double circuit line |
1.9 bn |
|||
|
Total |
62.0 bn |
||||
Source: Kenya Power
With these projects, the government aims to achieve universal electricity connectivity as part of the Millennium Development Goals, while also enabling the economic plans such as the Government’s Big 4 Agenda on housing and manufacturing.
f. Airports
The Nairobi Metropolitan Area is mainly served by two major airports, the Jomo Kenyatta International Airport (JKIA), located along Mombasa Road, with a capacity of 7.5 mn passengers annually and 43 aircraft, and the Wilson Airport, located along Lang’ata Road, and has a capacity of approximately 120,000 passengers and 33 small-scale aircraft. However, the region also boasts of other airstrips which mainly serve specific entities as shown below:
|
Other Airports/Airstrips Within Nairobi Metropolitan Area |
|
|
Name |
Serves: |
|
Amboseli Airport |
Amboseli National Park |
|
Ol Kiombo Airstrip |
Maasai Mara |
|
Musiara Airstrip |
Maasai Mara |
|
Kichwa Tembo |
Maasai Mara |
|
Orly/Olooitikoshi Airport |
Kajiado County |
|
Keerok Airport |
Keerok lodge and environs |
|
Moi Airbase/Eastleigh Airport |
Kenya Air Force |
|
Mara Serena Airstrip |
Maasai Mara-Lewa Downs/Nanyuki/Samburu |
Source: Online Sources
The Kenya Airports Authority oversees the aviation infrastructure whereas the Kenya Civil Aviation Authority is mandated to regulate and operate the aviation system.
Wilson Airport, a domestic flights airport, serves local airlines such as Fly-SAX, Silverstone, Safarilinks, and AirKenya Express with destinations served from the Airport including Maasai Mara, Mombasa, Amboseli, Lamu, Kilimanjaro Diani, Lokichogio and Nanyuki. On the other hand, JKIA is vital to Kenya’s economy due to its significant contribution to the nation’s tourism and hotel industry, as more than 50.0% of the country’s international arrivals arrive through the busy airport. In 2017, 59.6% of international arrivals to Kenya passed through the JKIA, and this trend is set to continue, especially given the ongoing infrastructural developments at the airport meant to enhance its capacity and efficiency.
Source: KNBS
Planned Developments
Various improvements have seen the Jomo Kenyatta International Airport increase in size and capacity over the years to become the largest and busiest airport in East and Central Africa, and one of the most renowned in Africa. According to online sources, the airport is set for an expansion from the current 25,662 SQM to approximately 55,222 SQM, with the government’s planned expansion strategy - the JKIA Airfield Expansion Project - which was set to commence in 2018 (although it is still in the planning stage) at a cost of Kshs 22.0 bn. This will see the airport’s terminals increased as well as construction of a second runway.
The presence of an international standards airport, the Jomo Kenyatta International Airport, boosts Nairobi’s status as a regional hub thus contributing to its economic growth. The airport currently operates approximately 43 passenger airlines and 25 cargo airlines. (Currently, there are no expansion plans for Wilson Airport)
The expansion plans for JKIA are set to increase the airport’s passenger capacity by a 15-year CAGR of 10.4% from 5.5 mn in 2010 to 24.2 mn in 2025.
|
JKIA Passenger Traffic |
||||||||
|
Year |
2010 |
2011 |
2012 |
2013 |
2014 |
2015 |
2020 F |
2025 F |
|
Number of Passengers |
5,480,188 |
6,849,035 |
8,247,618 |
8,914,851 |
9,518,627 |
10,519,835 |
16,606,754 |
24,246,405 |
|
% Increase |
|
25.0% |
20.4% |
8.1% |
6.8% |
10.5% |
57.9% |
46.0% |
|
· Key to note, however, is that despite the projections, JKIA has not quite met its target as it currently has a capacity of 7.5 mn compared to the projected 12.0 mn |
||||||||
Source: KAA
III. Impact of Infrastructure on Real Estate
Infrastructural development plays a key role in the development of the economy as a whole through enhancing connectivity and the creation of a better operating environment for individuals and businesses alike. We look at the impact of infrastructure on the real estate sector, particularly in the Nairobi Metropolitan Area;
A. Increased Real Estate Development Projects
Infrastructural development opens up previously inaccessible areas and improves connectivity thus making areas more attractive for investment. The completion of the Thika Super-highway in 2012, for instance, led to an influx of residential and commercial developments in areas such as Kasarani, Thika, Ruiru and Juja. Since then we have seen the springing up of several shopping malls as real estate investors and retailers sought to tap into a growing middle class around the area. From our analysis, through the development of malls such as the Garden City, the Thika Road Mall and Juja City Mall, the mall supply along the Thika Superhighway has grown at a CAGR of 27.7% from 0.3-mn sqft in 2013 to 1.3 mn sqft as at 2018.
Source: Cytonn Research
Similar effects have also been witnessed elsewhere, with the construction of the Northern Bypass opening up areas such as Ruaka, Marurui and Membley, leading to sprouting of several residential projects and key commercial developments such as the 0.7 mn SQFT Two Rivers Mall along the route.
B. Increased Value of Properties
Investment in infrastructure results in increased demand for property, which then causes an increase in property prices. Completion of the Thika Superhighway led to opening up of areas such as Thika Town, Juja and Ruiru, leading to significant increases in land prices. For instance, Juja experienced an increase in land prices from Kshs 3.0 mn per acre in 2011 to Kshs 9.0 mn in 2016, attributable to the improved accessibility into the area facilitated by the highway. With the completion of the Northern Bypass, land prices in Ruaka appreciated by 15.7% from an average of Kshs 40.0 mn per acre in 2011 to Kshs 83.0 mn per acre in 2016, on account of increased demand for property in the area.
Below is an analysis of changes in land prices in areas along major roads constructed between 2009-2012 in the Nairobi Metropolitan Area;
|
Changes in Land Prices along Major Road Developments |
|||||||
|
Road Development |
Start |
Completion |
Location |
Average Price -2011(Mn) |
Average Price-2014 (Mn) |
Average Price-2016 (Mn) |
Price Appreciation (5-year CAGR) |
|
Thika Superhighway |
2009 |
2012 |
Juja |
3 |
7 |
9 |
24.6% |
|
Ruiru |
7 |
15 |
19 |
22.1% |
|||
|
Thika |
5 |
7 |
8 |
9.9% |
|||
|
Kasarani |
32 |
51 |
60 |
13.4% |
|||
|
Kahawa |
33 |
51 |
60 |
12.7% |
|||
|
Muthaiga |
125 |
197 |
9.5% |
||||
|
Average |
|
|
|
|
|
|
15.4% |
|
Eastern Bypass |
2009 |
2012 |
Utawala |
6 |
9 |
11 |
12.9% |
|
Ruai |
8 |
12 |
13 |
10.2% |
|||
|
Ruiru |
7 |
15 |
19 |
22.1% |
|||
|
Average |
|
|
|
|
|
|
15.1% |
|
Northern Bypass |
2009 |
2012 |
Ruaka |
40 |
58 |
83 |
15.7% |
|
Ridgeways |
24 |
51 |
62 |
20.9% |
|||
|
Runda |
33 |
58 |
67 |
15.2% |
|||
|
Average |
|
|
|
|
|
|
17.3% |
|
Grand Average |
|
|
|
|
|
|
15.8% |
Source: Cytonn Research
Land in areas along major highways registered consistent price appreciation, with an average 5-Year CAGR of 15.8%, signaling increased demand for the properties as a result of infrastructural development.
Installation of sewer lines also results in increased development as it allows for densification, given that developers are then better able to sufficiently cater for the sanitation needs of the numerous families in a single facility. In Nairobi, most sewered areas such as Kilimani, Upperhill and the CBD have allowance for high-rise developments and thus attract higher property value with an average price of Kshs 510 mn per acre compared to low rise areas such as Runda, Spring Valley, Karen and Ridgeways with an average price of Kshs 85.5 mn per acre.
C. Reduced Development Costs
According a Centre for Affordable Housing Finance in Africa report, infrastructural costs in Kenya account for approximately 25.6% of construction costs. By providing infrastructure, therefore, the government provides an impetus for real estate developers to develop more affordable units, as the cost of construction reduces considerably. With the expected roll out of affordable housing projects in the Nairobi Metropolitan Area, in areas such as Ngara, Jogoo Road, Mavoko and Shauri Moyo, the commitment of the government to provide on-site and off-site infrastructure, will therefore act as an incentive for private developers to participate.
From the above points, it is evident that infrastructure, particularly, transport routes are vital for the growth of the real estate market. Investors are therefore likely to align their projects with infrastructural projects given the expected benefits including higher demand, price appreciation and savings on construction costs.
IV. Conclusion - Recommended Areas for Real Estate Investment
To gauge investment opportunities based on infrastructure, we looked at the key infrastructural sectors weighting them in terms of importance, as follows:
- Roads – Accessibility of an area is the most important factor in real estate, especially for homebuyers and commercial real estate investors. Thus, the county with the highest road coverage got the highest weight, and vice versa,
- Water – its reliable availability is one of the key factors that homebuyers look for when investing in a home. It is also vital for commercial activities and therefore, the more connected an area, the more reliable water supply is and thus, the higher the weight,
- Sewer Connectivity – The county with the most sewer coverage got the highest weight, and vice versa,
- Number of railway stations – This plays a significant role in pulling real estate clients as it provides an alternative means of transport to the commonly used roads. However, an area has to have a railway station for this to be effective, thus, the region with the highest number of railway stations got the highest weight,
- Proximity to airports – This is especially crucial for commercial real estate. The proximity to the Jomo Kenyatta Airport, therefore, gave more weight compared to regions that are more than 20 Km away from an airport
In terms of infrastructure supply, Nairobi County offers the best investment opportunity due to presence of relatively good coverage of all infrastructure sub-sectors, in comparison to other counties. The investment opportunity within the county is thus in areas along Ngong Road, which is currently being upgraded, such as Kilimani, Race Course, and, Karen. These areas also have relatively sufficient water and sewerage coverage while also being in close proximity to the JKIA and Wilson Airport.
The ranks are as shown below:
(The points are 0-5, with 5 being the highest and 0 the lowest)
|
Recommended Areas for Real Estate Investment 2018 |
||||||||
|
Weights: |
20% |
20% |
25% |
25% |
5% |
5% |
|
|
|
County |
Completed Roads |
Planned Roads |
Water |
Sewer Coverage |
Railway Stations |
Airport Proximity |
Total Marks |
Rank |
|
Nairobi |
5 |
5 |
5 |
5 |
5 |
5 |
5.0 |
1 |
|
Kiambu |
4 |
3 |
4 |
4 |
3 |
3 |
3.7 |
2 |
|
Machakos |
2 |
4 |
3 |
3 |
4 |
4 |
3.1 |
3 |
|
Murang’a |
3 |
2 |
2 |
1 |
0 |
1 |
1.8 |
4 |
|
Kajiado |
1 |
1 |
1 |
2 |
0 |
3 |
1.3 |
5 |
|
In summary, the best areas for investment are: · Nairobi offers the best investment opportunity due to a high paved road coverage within the county, relatively sufficient water coverage, relatively high sewer connectivity, a high number of railway stations compared to other counties, and presence of airports. In Nairobi, we recommend areas along Ngong Road, which is currently being upgraded, such as Kilimani, Upperhill, Race Course, and, Karen. These areas also have relatively sufficient water and sewerage coverage (Kilimani & Upperhill) while also having easy access to the JKIA and Wilson Airport, · This was followed by Kiambu, where the investment opportunity is in areas like Thika, Ruiru, and Kikuyu which carry majority of the county’s infrastructural projects, · For Machakos, areas to invest in are Athi River, Syokimau and Mlolongo, and areas in close proximity to the upcoming Konza due to the incoming infrastructure aimed at supporting the ICT park |
||||||||
In conclusion, the presence and quality of infrastructure, that is, transportation and utilities, is one of the most important factors influencing real estate investments, and the country’s economy as a whole. We, therefore, expect the infrastructural development to remain a top priority for the government in line with its Big Four Agenda to improve the housing deficit and scale up the manufacturing sector. However, due to the current unfavorable financial environment, we expect to see a rise in private investments into this segment of the economy as a way of bridging the financing gap, especially in the energy and road sectors, which provide a ready niche for private investors.
Disclaimer: The Cytonn Weekly is a market commentary published by Cytonn Asset Managers Limited, an Affiliate of Cytonn Investments Management Plc that is regulated by the Capital Markets Authority. However, the views expressed in this publication are those of the writers where particulars are not warranted. This publication, which is in compliance with Section 2 of the Capital Markets Authority Act Cap 485A, is meant for general information only and is not a warranty, representation, advice or solicitation of any nature. Readers are advised in all circumstances to seek the advice of a registered investment advisor.

- Talk to us
- Kenya
- P.O Box 20695 - 00200, Nairobi, Kenya
- Cell +254709101200
- Tel +254709101200
- WhatsApp +254741676635
- United States
- +254709101200
- DOWNLOAD OUR APP
-


- Kenya
- 8th Floor, Pinetree Plaza, Kaburu Drive, Ngong Road, Nairobi, Kenya
- USA
- Suite 1150, 1775 Eye Street NW, USA, Washington DC 20006, USA
- Investments
- High Yield
- Private Equity
- Real Estate
- Real Estate
- RiverRun Estates
- Cytonn Towers
- The Ridge
- Taraji Heights
- The Alma