Nairobi Metropolitan Area Land Report 2020 & Cytonn Weekly#28/2020
By Cytonn Research Team, Jul 12, 2020
Executive Summary
Fixed Income
During the week, T-bills remained oversubscribed, with the subscription rate coming in at 358.2% up from 317.4% the previous week. The oversubscription can be attributed to increased liquidity in the money market with the average interbank rate coming in at 1.9% from 3.0% recorded the previous week. The yields on the 91-day, 182-day, and 364-day papers declined by 27.2 bps, 28.9 bps, and 6.9 bps, respectively, to 6.3%, 6.8%, and 7.7%;
Equities
During the week, the equities market was on a downward trajectory, with NASI, NSE 20 and NSE 25 recording declines of 5.2%, 2.3% and 4.0%, respectively, taking their YTD performance to losses of 20.4%, 28.4%, and 24.6%, for NASI, NSE 20 and NSE 25, respectively. The NASI performance was driven by losses recorded by large-cap stocks, with the highest declines being recorded in Safaricom, ABSA, SCBK and Equity Group, which lost by 7.3%, 5.5%, 4.6% and 3.0%, respectively. During the week, Mortgage financier HF Group announced it was seeking to raise Kshs 1.0 bn additional tier II capital (supplementary component of a bank’s capital.) Similarly, Bank of Africa disclosed it had sold part of its office space to Saham Insurance in FY’2019 for Kshs 100.2 mn, in a bid to remain compliant to CBK’s regulations that stipulates a bank’s investment in land and buildings as a share of core capital should not exceed 20.0%;
Real Estate
During the week, the National Government, through the Ministry of Transport, Infrastructure, Housing, Urban Development and Public Works, issued a decree that all affordable housing development projects under the nation’s Big 4 Agenda will be required to meet the International Finance Corporation’s (IFC) Excellence in Design for Greater Efficiencies (EDGE) green buildings standard. In the hospitality sector, global hotel groups, Accor Hotels and Radisson Hotel Group announced that they would continue with their expansion plans in Kenya and the African region as a whole, despite the slowdown in the hospitality sector due to the COVID-19 pandemic. Under statutory review, the Nairobi Metropolitan Services (NMS) established a new urban planning technical committee to handle building plans approvals approximately 2 months after the disbandment of the Nairobi City County Pre-Technical Committee and the Nairobi City County Urban Planning Technical Committee;
Focus of the Week
This week, we focus on the land sector within the Nairobi Metropolitan Area where we highlight the land sector’s performance based on annual capital appreciation, identify factors driving and likely to shape the sector, and conclude with an outlook for the sector, as well as investment opportunity recommendation. Overall, the land sector recorded an 8-year CAGR of 13.5% with the 2019/2020 annual capital appreciation at 1.5%, compared to the (0.3%) recorded in 2018/2019, attributed to increased demand for land mainly in the low rise residential areas and satellite towns. Asking land prices in low rise residential areas recorded a 3.8% capital appreciation y/y, attributed to the availability of development land in these areas. Additionally, people are attracted to these suburbs as they are sparsely populated, thus offering exclusivity and privacy. Unserviced land in satellite towns such as Ruaka also recorded a capital appreciation of 3.8% y/y, attributable to the growing demand for land in these areas fueled by the demand for housing by the growing working population as the areas act as Nairobi’s dormitory, coupled by the improving infrastructure.
- Weekly Rates:
- Cytonn Money Market Fund closed the week at a yield of 10.54%. To invest, just dial *809#;
- Cytonn High Yield Fund closed the week at a yield of 13.43% p.a. To invest, email us at sales@cytonn.com;
- Phase 1 of The Alma is now 100% sold with early buyers having achieved up to 55% capital appreciation. We are now running promotions:
- For Phase 2: Buy a unit in Phase 2 with a 15-year payment plan and 0% deposit;
- For Phase 1: Get a 10% rent discount on units we manage for investors;
- For inquiries, please email us on clientservices@cytonn.com;
- For an exclusive tour of Cytonn’s real estate developments, visit: Sharp Investor's Tour and for more information, email us at sales@cytonn.com;
- We continue to offer Wealth Management Training daily, from 9:00 am to 11:00 am, through our Cytonn Foundation. The training aims to grow financial literacy among the general public. To register for any of our Wealth Management Training, click here;
- For Pension Scheme Trustees and members, we shall be having different industry players talk about matters affecting Pension Schemes and the pensions industry at large. Join us every Wednesday from 9:00 am to 11:00 am for in-depth discussions on matters pension;
- If interested in our Private Wealth Management Training for your employees or investment group, please get in touch with us through wmt@cytonn.com;
- For recent news about the company, see our news section here;
- We have 10 investment-ready projects, offering attractive development and buyer targeted returns. See further details here: Summary of Investment-ready Projects.
Money Markets, T-Bills & T-Bonds Primary Auction:
During the week, T-bills remained oversubscribed, with the subscription rate coming in at 358.2% up from 317.4% the previous week. The highest subscription rate was on the 91-day paper which rose to 948.1% from 511.3% recorded the previous week. The subscription for the 182-day paper also increased to 273.7% from 267.5% recorded the previous week, while the subscription of the 364-day paper declined to 206.7% from 289.8% recorded the previous week. The oversubscription is partly attributable to increased liquidity in the money market with the average interbank rate coming in at 1.9% from 3.0% recorded the previous week and the interbank volumes declining to 3.8 bn from 4.1 bn the previous week. Liquidity was mainly supported by government payments and maturing TADs of KES 125.4bn. Banks continue to prefer government securities as opposed to lending as their holdings in bills and bonds increased to 54.9% from 53.3% recorded the previous week. The yields on the 91-day, 182-day, and 364-day papers declined by 27.2 bps, 28.9 bps, and 6.9 bps respectively to 6.3%, 6.8%, and 7.7%. The acceptance rate declined to 53.8%, from 57.6% recorded the previous week, with the government accepting Kshs 46.2 bn of the Kshs 86.0 bn worth of bids received, higher than the weekly offered amount of Kshs 24.0 bn.
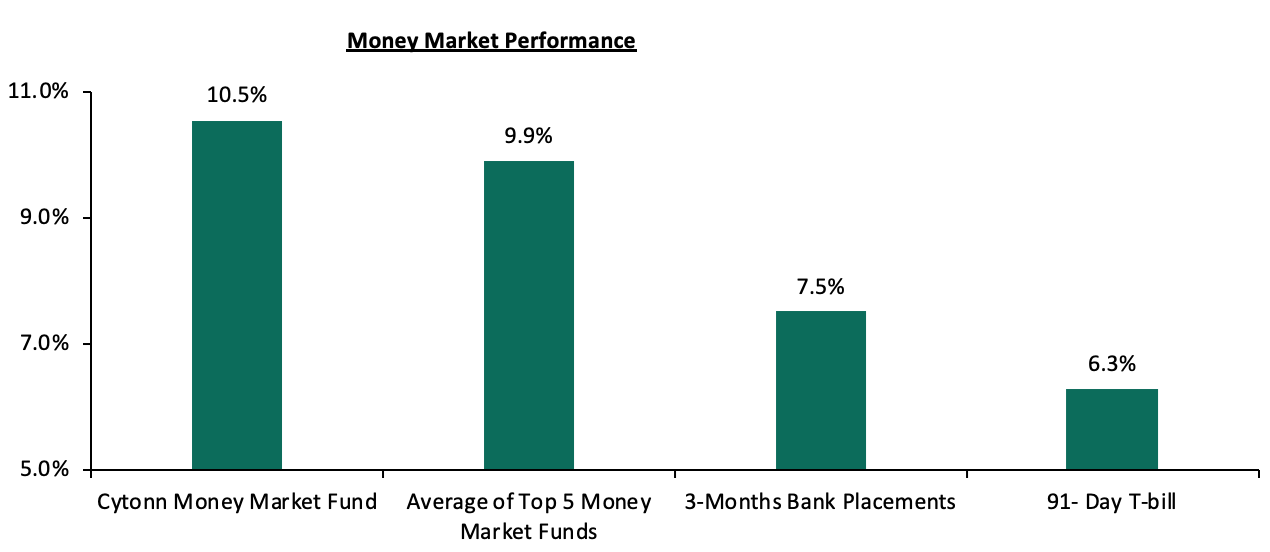
In the money markets, 3-month bank placements ended the week at 7.5% (based on what we have been offered by various banks), while the yield on the 91-day T-bill declined by 0.3% points to close the week at 6.3%, from 6.5% recorded the previous week. The average yield of Top 5 Money Market Funds remained unchanged at 9.9% similar to what was recorded the previous week. The yield on the Cytonn Money Market declined by 0.1% points to close at 10.5% from 10.6% recorded the previous week.
Liquidity:
During the week, liquidity in the money market increased leading to a decrease in the average interbank rate to 1.9% from 3.0% recorded the previous week while the average interbank volumes decreased by 7.3% to Kshs 3.8 bn, from Kshs 4.1 bn recorded the previous week. Liquidity was mainly supported by government payments and maturing Term Auction Deposits (TADs) of KES 125.4bn (TADs are used when the securities held by the CBK for Repo purposes are exhausted or when CBK considers it desirable to offer longer tenor options). As per the Central Bank of Kenya, commercial banks’ excess reserves came in at Kshs 29.8 bn in relation to the 4.25% cash CRR. The favorable liquidity since March 2020 has also partly been attributable to the reduction of the Cash Reserve Ratio (CRR) to 4.25%, from 5.25% previously, by the Monetary Policy Committee (MPC) during its March 2020 sitting, consequently freeing up Kshs 35.3 bn in form of additional liquidity to commercial banks for onward lending to distressed borrowers during the COVID-19 pandemic.
Kenya Eurobonds:
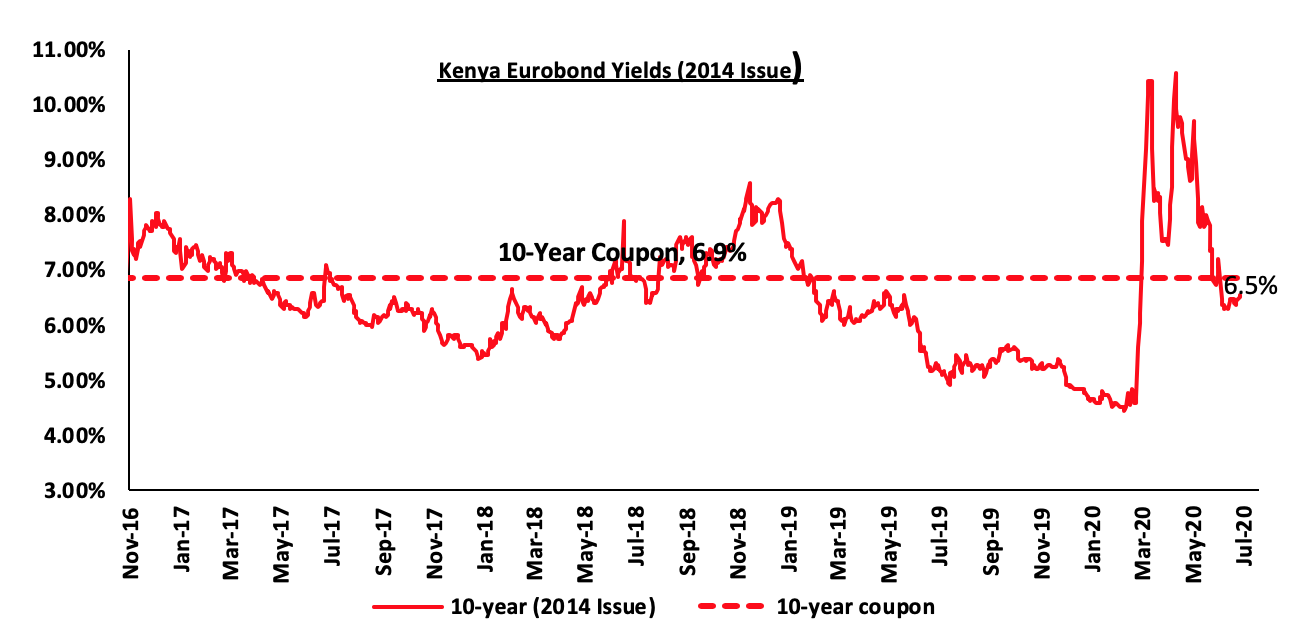
According to Reuters, the yield on the 10-year Eurobond issued in June 2014 increased by 0.1% points during the week to close at 6.5% from 6.4% recorded the previous week.
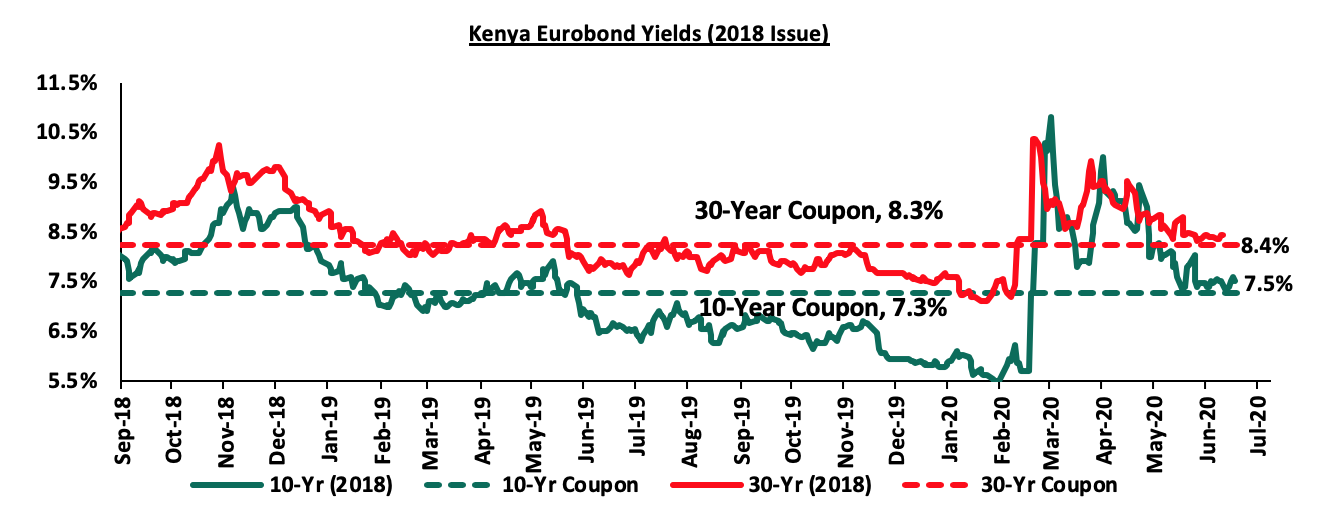
The yields on the 10-year Eurobond issued in 2018 increased by 0.1% points to close at 7.5% from 7.4% recorded the previous week. The yield on the 30-year Eurobonds issued in 2018 remained unchanged at 8.4% similar to what was recorded the previous week.
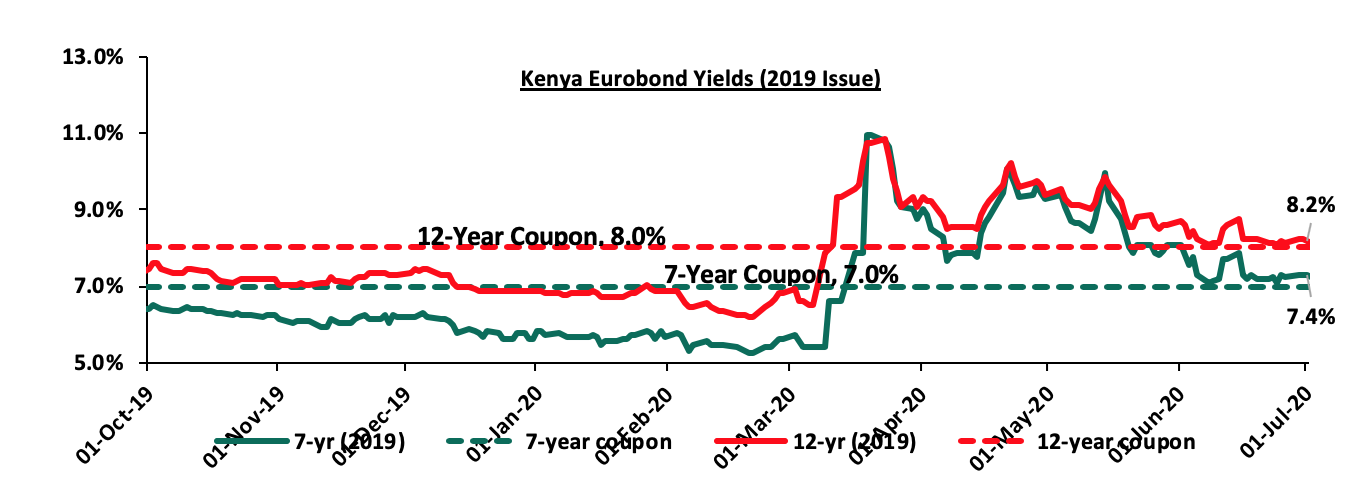
The yields on the 7-year Eurobond and 12-year Eurobond issued in 2019 increased by 0.2% points and 0.1% points, respectively to 7.4% and 8.2% from 7.2% and 8.1% recorded the previous week, respectively.
Kenya Shilling:
During the week, the Kenya Shilling depreciated by 0.2% against the US Dollar to close the week at Kshs 106.9, from Kshs 106.7, recorded the previous week, which traders attributed to increased dollar demand from the energy sector and general merchants as businesses reopen following recent easing of movement restrictions. The demand was, however, weighed down by the inflows from the horticulture exports. On an YTD basis, the shilling has depreciated by 5.5% against the dollar, in comparison to the 0.5% appreciation in 2019. We expect continued pressure on the shilling due to:
- Demand from merchandise and energy sector importers as they beef up their hard currency positions amid a slowdown in foreign dollar currency inflows, and,
- Subdued diaspora remittances evidenced by the 9.0% decline to USD 208.2 mn in April 2020, from USD 228.8 seen the previous month, mainly due to the decline in economic activities globally, coupled with increased prices of household items leading to lower disposable income. In terms of y/y performance, diaspora remittances declined by 15.1% to USD 208.2 mn in April 2020 down from USD 245.4 mn recorded in April 2019. Key to note, the Central Bank of Kenya (CBK) expects a 12.0% decline in remittances in 2020.
The shilling is however expected to be supported by:
- High levels of forex reserves, currently at USD 9.7 bn (equivalent to 5.8-months of import cover), above the statutory requirement of maintaining at least 4.0-months of import cover, and the EAC region’s convergence criteria of 4.5-months of import cover.
Weekly Highlight
During the week, the Kenya National Bureau of Statistics (KNBS) in conjunction with the Ministry of Treasury and National Planning released wave 2 of the Survey on Socio-Economic Impact of COVID-19 on Household Report. The Government of Kenya established a National Coordination Committee on the Response to the Corona Virus Pandemic (NCCRCP) to respond to the crisis and help cushion Kenyans against the adverse effects of the Coronavirus pandemic. The National Economic and Business Response Working Group conducted a Household Economic Impact aimed at providing data that would facilitate the formulation of appropriate strategies to respond to the socio-economic effects of the pandemic. Data for the second wave of the survey was collected between 30th May 2020 and 6th June 2020. The objective of the survey was to include an assessment of the impact of COVID-19 on health, labor market, transport, and housing. The major highlights from the report were;
- 0% of the respondents were unable to pay rent for the month of May 2020 with a majority pointing towards reduced income as the main reason for this. The temporary closure of businesses or the delayed income earnings among the employed and self-employed were also major reasons as to why households were unable to meet their rent arrears. On the other hand, only 0.7% of the respondents had received a waiver/ relief in terms of rent from their landlords while 6.0% had received a partial waiver for the month of May 2020,
- 1% of respondents claimed that they had food stock with 78.8% claiming that they had witnessed an increase in the price of food commodities during the period of the survey,
- To mitigate financial distress, 41.9% of the respondents claimed they had cut their spending and focused on only getting the necessities with 16.5% taking credit facilities to cope with financial distress, and,
- In terms of loan renegotiation, 52.7% of participants with a loan had failed to renegotiate their loans, 23.1% had unsuccessfully renegotiated their loans and the remaining 24.1% had managed to successfully renegotiate their loans.
The findings in this survey are in line with the economic conditions expectations as locally, most businesses are struggling to meet their expenses amid the subdued revenues. The pandemic has affected key industries in the country such as tourism and the hospitality industry leading to near closure of the sectors thus causing massive layoffs, effectively reducing people’s purchasing power. Businesses, as well as individuals, may also find it hard to access credit facilities from financial institutions given the high risk.
Rates in the fixed income market have remained relatively stable as the government rejects expensive bids. We believe that the uncertainty affecting the global financial markets brought about by the novel Coronavirus will make it harder for the government to access foreign debt, and might result in investors attaching a high-risk premium on the country. As a result of depressed revenue collection with the revenue target for FY’2020/2021 at Kshs 1.9 tn, we expect a higher budget deficit, which the Treasury estimates at 7.5% of GDP, creating uncertainty in the interest rate environment as additional borrowing from the domestic market will be required to plug in the deficit. Owing to this uncertain environment, our view is that investors should be biased towards short-term fixed income securities to reduce duration risk.
Markets Performance
During the week, the equities market was on a downward trajectory, with NASI, NSE 20 and NSE 25 recording declines of 5.2%, 2.3% and 4.0%, respectively, taking their YTD performance to losses of 20.4%, 28.4%, and 24.6%, for NASI, NSE 20 and NSE 25, respectively. The NASI performance was driven by losses recorded by large-cap stocks, with the highest declines being recorded in Safaricom, ABSA, SCBK and Equity Group, which lost by 7.3%, 5.5%, 4.6%, and 3.0%, respectively.
Equities turnover rose by 178.4% during the week to USD 40.1 mn, from USD 14.4 mn recorded the previous week, taking the YTD turnover to USD 850.7 mn. Foreign investors remained net sellers during the week, with a net selling position of USD 18.8 mn, from a net selling position of USD 4.3 mn recorded the previous week, taking the YTD net selling position to USD 234.0 mn.
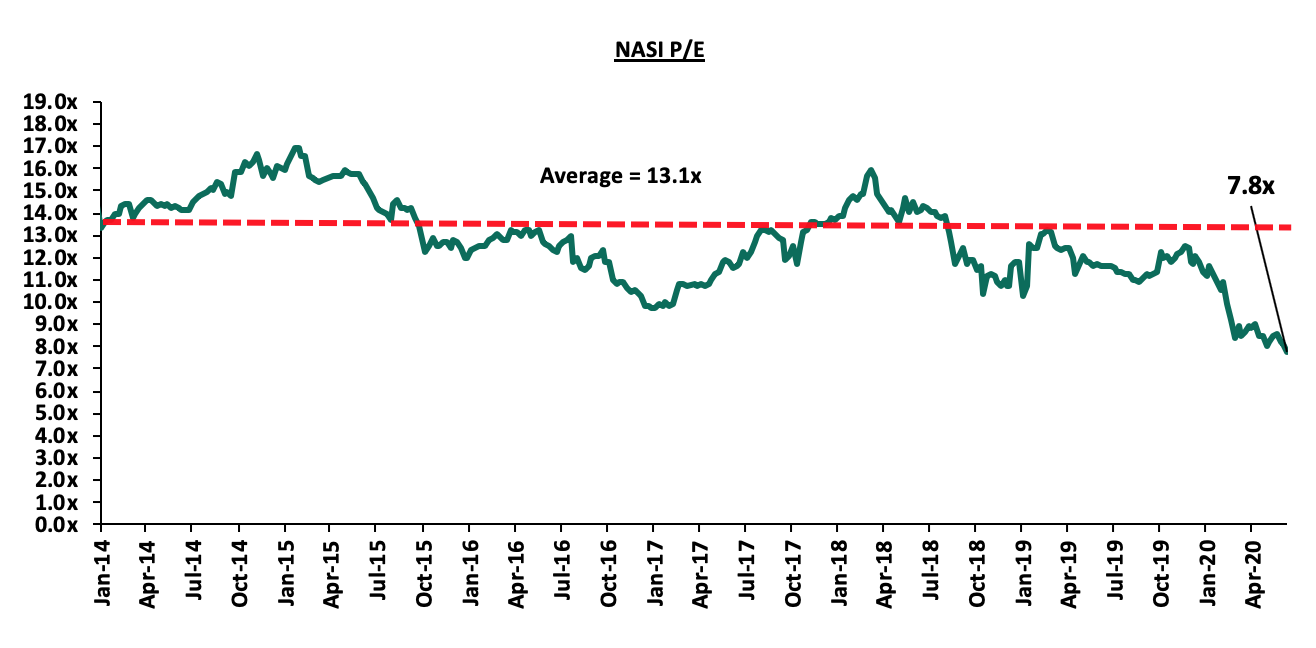
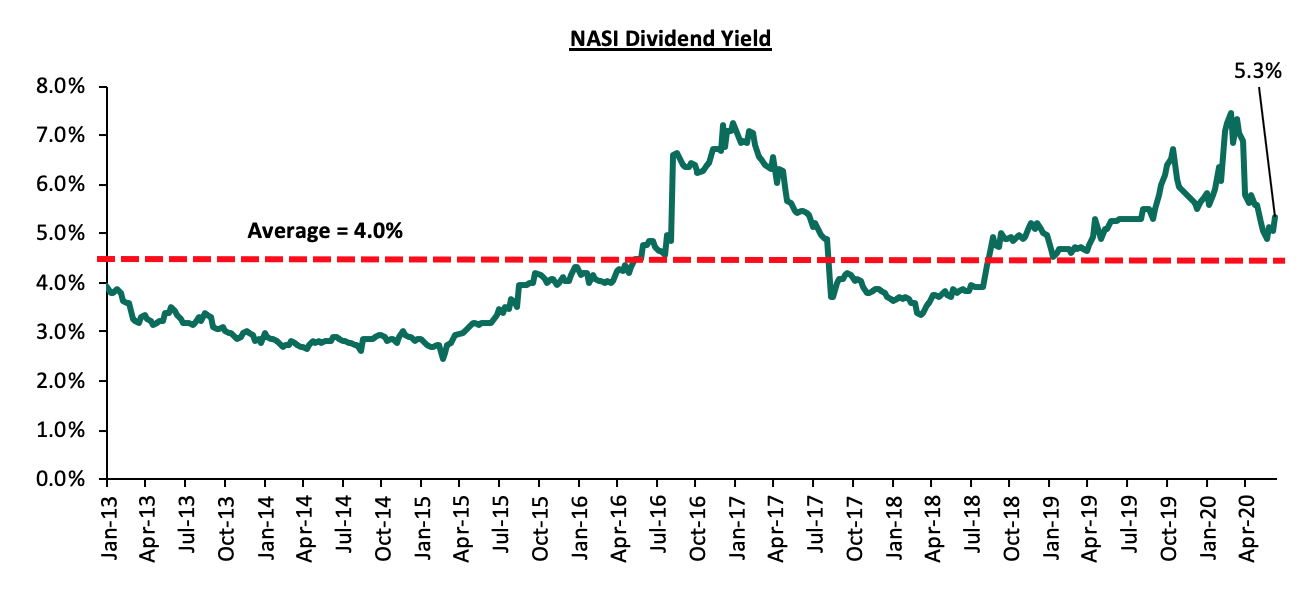
The market is currently trading at a price to earnings ratio (P/E) of 7.8x, 30.5% below the historical average of 13.1x. The average dividend yield is currently at 5.3%, an increase from the 5.1% recorded the previous week and 1.3% points above the historical average of 4.0%. The increase in dividend yield is mainly attributable to price declines recorded by most stocks during the week. With the market trading at valuations below the historical average, we believe there are pockets of value in the market for investors with higher risk tolerance and are willing to wait out the pandemic. The current P/E valuation of 7.8x is 3.0% below the most recent valuation trough of 8.0x experienced in the last week of May 2020. The charts below indicate the historical P/E and dividend yields of the market.
Weekly Highlight
During the week, Mortgage financier HF Group announced it was seeking to raise Kshs 1.0 bn additional tier II capital (a supplementary component of a bank’s capital) as part of its measures to inject liquidity into the bank, in a bid to remain compliant with the Central Bank’s Capital Adequacy requirements, with the additional capital expected to help take the bank’s Capital Adequacy ratios back to compliance. Similarly, Bank of Africa made public in its FY’2019 annual report it had sold part of its office space to Saham Insurance for Kshs 100.2 mn, bringing the total office disposal to Kshs 479.9 mn over the last 2 years. This is in a bid to remain compliant to CBK’s regulations that stipulate a bank’s investment in land and buildings as a share of core capital should not exceed 20.0%. In FY’2019, the ratio stood at 67.3%, with the bank’s investments in land and building coming in at Kshs 1.8 bn, against a core capital of Kshs 2.7 bn. The lender also received additional liquidity of Kshs 1.5 bn as tier I capital (capital that is used by banks to function on a regular basis) from its parent company in a bid to boost its capital adequacy ratios. The table below highlights the Capital Adequacy ratios of the two banks;
|
Capital Adequacy Ratios |
HF Group |
BOA |
|
Q1'2020 |
Q1'2020 |
|
|
Core Capital/Total Liabilities |
14.4% |
3.4% |
|
Minimum Statutory ratio |
8.0% |
8.0% |
|
Excess |
6.4% |
(4.6%) |
|
Core Capital/Total Risk-Weighted Assets |
12.4% |
4.5% |
|
Minimum Statutory ratio |
10.5% |
10.5% |
|
Excess |
1.9% |
(6.0%) |
|
Total Capital/Total Risk Weighted Assets |
13.7% |
7.4% |
|
Minimum Statutory ratio |
14.5% |
14.5% |
|
Excess |
(0.8%) |
(7.1%) |
|
Liquidity Ratio |
21.3% |
66.2% |
|
Minimum Statutory ratio |
20.0% |
20.0% |
|
Excess |
1.3% |
46.2% |
|
Adjusted Core Capital/Total Liabilities |
13.9% |
5.6% |
|
Adjusted Core Capital/Total RWA |
12.2% |
7.5% |
|
Adjusted Total Capital/Total RWA |
13.4% |
10.4% |
Key take-outs:
HF Group:
- In Q1’2020, HF Group was sufficiently capitalized with a core capital to risk-weighted assets ratio of 12.4%, 1.9% points above the statutory requirement of 10.5%,
- Total capital to total risk-weighted assets however came in at 13.7%, which is 0.8% points below the statutory requirement of 14.5%. Key to note, the core capital ratio is crucial in assessing an institution’s ability to absorb losses before becoming insolvent and putting depositors’ funds at risk.
In our view, HF Group still has a long way to go as a conventional bank, though it has recorded commendable performance with the bank beginning to show signs of profitability. The bank will ultimately have to adjust their business model, or couple up with a stronger bank with a sizeable asset base and a strong deposit gathering capability, in an effort to capitalize on HF’s strength in mortgages and real estate development.
Bank of Africa:
- In Q1’2020, the lender was in breach of all CBK’s capital adequacy ratios, with the bank’s core capital to risk-weighted assets ratio coming in at 4.5%, 6.0% points below the statutory requirement of 10.5%,
- Total capital to total risk-weighted assets ratio stood at 7.4%, 7.1% points, below the statutory requirement of 14.5%.
In our view, the liquidity injection will boost the bank’s capital position and enhance compliance with the capital adequacy ratios; however, the bank will remain in breach of the rule governing investments in land and buildings and their ability to absorb losses before becoming insolvent remains a risk.
The ongoing pandemic has caused unprecedented levels of stress to the banking sector, which has resulted in various banks taking various actions such as suspending or reducing dividend payments and abandoning various expansion deals, which is the case with Equity bank, in a bid to preserve their capital positions. In our view, we expect continued efforts by banks to preserve capital to enable them to withstand the risk of increased Non-Performing Loans (NPLs) necessitated by the current tough operating environment.
Universe of Coverage:
|
Company |
Price at 03/07/2020 |
Price at 10/07/2020 |
w/w change |
YTD Change |
Year Open |
Target Price* |
Dividend Yield |
Upside/ Downside** |
P/TBv Multiple |
Recommendation |
|
Diamond Trust Bank*** |
70.0 |
70.0 |
0.0% |
(35.8%) |
109.0 |
175.0 |
3.9% |
153.9% |
0.4x |
Buy |
|
Kenya Reinsurance |
2.2 |
2.0 |
(9.9%) |
(34.0%) |
3.0 |
4.6 |
5.5% |
135.5% |
0.2x |
Buy |
|
KCB Group*** |
35.1 |
34.1 |
(2.9%) |
(36.9%) |
54.0 |
56.2 |
10.3% |
75.3% |
0.9x |
Buy |
|
I&M Holdings*** |
49.4 |
49.0 |
(0.7%) |
(9.3%) |
54.0 |
76.3 |
5.2% |
60.9% |
0.8x |
Buy |
|
Co-op Bank*** |
12.2 |
11.9 |
(2.9%) |
(27.5%) |
16.4 |
18.0 |
8.4% |
60.3% |
1.0x |
Buy |
|
Equity Group*** |
32.9 |
31.9 |
(3.0%) |
(40.5%) |
53.5 |
50.7 |
0.0% |
59.2% |
1.2x |
Buy |
|
ABSA Bank*** |
10.1 |
9.5 |
(5.5%) |
(28.8%) |
13.4 |
13.2 |
11.6% |
50.5% |
1.3x |
Buy |
|
Jubilee Holdings |
250.0 |
229.0 |
(8.4%) |
(34.8%) |
351.0 |
334.8 |
3.9% |
50.1% |
0.9x |
Buy |
|
Stanbic Holdings |
80.3 |
79.0 |
(1.6%) |
(27.7%) |
109.3 |
111.2 |
8.9% |
49.7% |
1.0x |
Buy |
|
Sanlam |
13.7 |
13.5 |
(1.1%) |
(21.5%) |
17.2 |
18.4 |
0.0% |
36.3% |
1.3x |
Buy |
|
NCBA*** |
26.5 |
26.4 |
(0.4%) |
(28.4%) |
36.9 |
35.6 |
0.9% |
35.8% |
0.8x |
Buy |
|
Standard Chartered*** |
169.3 |
161.5 |
(4.6%) |
(20.2%) |
202.5 |
202.7 |
7.7% |
33.3% |
1.5x |
Buy |
|
Liberty Holdings |
8.0 |
7.9 |
(2.2%) |
(24.1%) |
10.4 |
9.8 |
0.0% |
25.1% |
0.7x |
Buy |
|
Britam |
7.6 |
7.0 |
(7.9%) |
(22.2%) |
9.0 |
7.6 |
3.6% |
12.1% |
0.7x |
Accumulate |
|
CIC Group |
2.3 |
2.3 |
(0.4%) |
(16.0%) |
2.7 |
2.1 |
0.0% |
(6.7%) |
0.8x |
Sell |
|
HF Group |
4.5 |
4.5 |
(0.9%) |
(30.3%) |
6.5 |
4.0 |
0.0% |
(11.1%) |
0.2x |
Sell |
|
*Target Prices as per Cytonn Analyst estimates **Upside/ (Downside) is adjusted for Dividend Yield ***Companies in which Cytonn and/or its affiliates are invested in |
||||||||||
We are “Neutral” on equities for investors because, despite the sustained price declines, which have seen the market P/E decline to below its historical average presenting investors with attractive valuations in the market, the economic outlook remains grim.
- Residential Sector
During the week, the Principal Secretary of the State Department of Housing and Urban Development of the Ministry of Transport, Infrastructure, Housing, Urban Development and Public Works, Mr. Charles Hinga issued a decree that all affordable housing development projects under the nation’s Big 4 Agenda will be required to meet the International Finance Corporation’s (IFC) Excellence in Design for Greater Efficiencies (EDGE) green buildings standard. EDGE is a green building certification system that enables design teams and project owners to assess the most cost effective ways to incorporate energy and water-saving options into their buildings and is an innovation of IFC, a member of the World Bank Group. For a building to attain the standard, it has to use 20.0% less energy, less water and less embodied energy in materials compared to a regular building as estimated within the EDGE software. In light of the same, in January this year, Acorn Group, a local real estate developer, listed Kenya’s first green bond on the Nairobi Securities Exchange (NSE), a 5-year Kshs 4.3 bn green bond intended to finance the developer’s EDGE-certified sustainable and climate-resilient student accommodation in Kenya. The move signals the National Government’s intent of reducing the country’s carbon emissions by 30.0% by 2030 where it seeks to implement green buildings amongst other measures such as the expansion of geothermal, solar, and, wind energy production. We thus expect the new requirements will guide the designing and construction works by developers looking to venture into affordable housing with the aim of reducing or eliminating negative impacts on the environment, by adopting measures such as using less water, energy or natural resources.
- Hospitality Sector
During the week, global hotel groups, Accor Hotels and Radisson Hotel Group announced that they would continue with their expansion plans in Kenya and the African region as a whole despite the slump in the sector due to the COVID-19 pandemic. Radisson Group plans to set up its 4th hotel in the country, The Radisson RED (the completion date and location are still unknown), a smart hotel that targets tech savvy and young people. Similarly, Accor Hotels plans to open its 7th hotel in Kenya in 2021, a 105 room hotel dubbed ‘The MGallery’ that will be located in Gigiri, Nairobi.
|
Hotels Operated By Accor Hotels and Radisson Hotel Group in Kenya |
|||
|
Name |
Owner |
Location |
Rooms |
|
Park Inn by Radisson |
Radisson Group |
Westlands |
140 |
|
Radisson Blu Hotel & Residence |
Radisson Group |
Arboretum |
122 |
|
Radisson Blu Hotel |
Radisson Group |
Upper Hill |
271 |
|
Pullman Hotel |
Accor Hotels |
Westlands |
340 |
|
Ibis Styles Hotel |
Accor Hotels |
Westlands |
277 |
|
Movenpick Hotel and Residences |
Accor Hotels |
Westlands |
276 |
|
Hotel Fairmont The Norfolk |
Accor Hotels |
Harry Thuku Rd, Nairobi |
170 |
|
Fairmont Mara Safari Club in |
Accor Hotels |
Maasai Mara, Narok |
51 |
|
Fairmount Mount Kenya Safari Club |
Accor Hotels |
Nanyuki |
110 |
The announcement affirms Kenya’s hospitality sector’s attractiveness to global investors driven by; (i) heightened security, (ii) recognition of Kenya as a regional hub, (iii) relaxation of travel advisories by governments of key tourism markets, and (iv) political stability that has prevailed in the country. According to the Kenya National Bureau of Statistics (KNBS) Economic Survey 2020, international visitor arrivals increased slightly by 0.4% from 2.03 mn in 2018 to 2.04 mn in 2019 while international and local conferences held increased by 6.9% and 14.4%, respectively to 218 and 4,743 in 2019 from 204 and 4,147 in 2018.
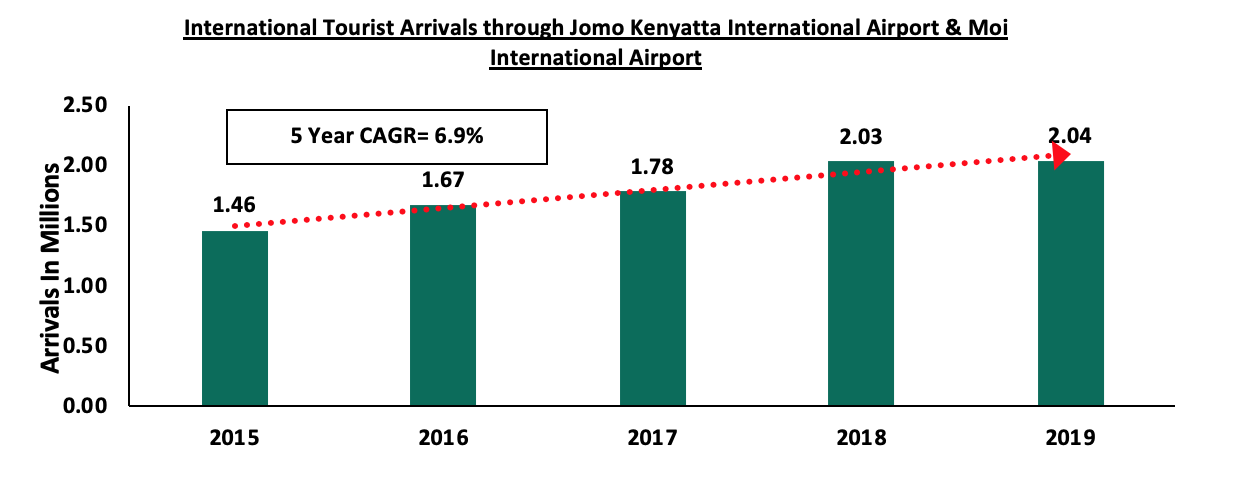
Source: KNBS
Despite the continued growth in tourist arrivals over the past 5 years, the numbers are expected to drop in 2020, due to the COVID-19 pandemic. We expect the hospitality sector to recover gradually supported by various National Government measures such as the gradual easing of movement restrictions which will see domestic flights resume operations on 15th July and international flights expected to resume on August 1st.
- Statutory Review
During the week, Nairobi Metropolitan Services (NMS) established a new urban planning technical committee to handle building plans approvals in Nairobi County. This comes approximately two months after the disbandment of the Nairobi City County Pre-Technical Committee and the Nairobi City County Urban Planning Technical Committee by NMS director-general Mohammed Badi, citing corruption by its officials which led to delays in issuance of approvals. The new committee will process development permits issued as from March 18, 2020. Currently, processing of construction permits in Kenya can take as long as two years, and the lack of improvements of the administration system has continued to cripple the ease of doing business in the construction industry. Delays in the approval system ultimately lead to unnecessarily high development costs for private developers thus pushing away potential investors. According to the Kenya National Bureau of Statistics (KNBS) Economic Survey 2020, the value of building plans approved in the Nairobi County Government decreased by 1.3% from Kshs 210.3 bn in 2018 to Kshs 207.6 bn in 2019, attributed to delayed issuance of approvals by the county government due to downtimes faced by the e-permit systems and the disbandment of the technical committee in charge of approving the permits. However, in January and February this year, the value of building plans approved by the Nairobi County was Kshs 42.0 bn and Kshs 54.9 bn, respectively, 139.9% and 460.4% higher than Kshs 17.5 bn and Kshs 9.8 bn recorded in January and February last year, respectively. This was attributed to the introduction of a weekly plan by the county government aimed at clearing a seven month backlog of pending building approvals that had accumulated in 2019 after the suspension of some planning department officials. We therefore expect the formation of the new committee will speed up approval processes by the county thus clearing the current backlog of pending building plans as well as encouraging both local and foreign investment into the county’s real estate sector which will in turn spur the sector’s growth.
We expect the real estate sector to record activities as the economy cautiously reopens following the COVID-19 closures, supported by the continued investor confidence in the hospitality sector’s resilience and the expeditious processing of building plan approvals in Nairobi County with the establishment of a new urban planning technical committee.
In June 2019, we published the Cytonn H1’2019 Market Review which highlighted the land sector’s performance in the Nairobi Metropolitan Area. According to the report, the land sector recorded a 0.5% y/y decline in asking prices, 4.3% points lower than the 3.8% growth rate in 2017/18, attributed to an overall slowdown in real estate investment during the year. Despite the rest of the zones recording a decline in asking prices, unserviced land in satellite towns such as Ruiru and Limuru registered a 3.9% annual capital appreciation on average during the year, attributed to the relatively high demand for land in these areas fueled by the affordable housing initiative which has been a key focus sector by both the government and private sector players.
This week, we update that report with 2019/2020 research data, highlighting the land sector’s performance in the Nairobi Metropolitan Area based on annual capital appreciation, identify market trends and the investment opportunity. In this topical, we shall cover:
- Introduction to the land sector in the Nairobi Metropolitan Area,
- Performance summary in 2020 based on zones and locations,
- Summary and the investment opportunity in the sector, and
- Conclusion and outlook for the sector.
- Introduction to the land Sector in the Nairobi Metropolitan Area
The land sector within the Nairobi Metropolitan Area recorded several activities in 2019/2020 despite an overall slowdown in real estate development activities, attributed to a tough economic environment, and an existing oversupply of space within the commercial sector and the high end residential market. During the period under review, transactions in the land sector were driven by;
- Increased focus on the affordable housing initiative by both the government and private sector developers. This has generated increased real estate activities especially in satellite towns where land is available in bulk and at affordable prices thus increasing demand for development class real estate,
- Development of infrastructure which has opened up new areas for development leading to increased demand for development land,
- Positive demographics with a relatively high population growth rate and urbanization rate of 2.5% and 4.3% respectively, against a global average of 1.2% and 2.0%, and a rising middle class with increasing purchasing power creating sustained demand for development land, and,
- Reduced supply of development land at affordable prices in areas close to the Nairobi CBD resulting in demand for the same in satellite towns.
Despite the above drivers, the sector was constrained by;
- Inadequate infrastructure leading to the growth of informal settlements such as slums, making land less preferred by investors especially in the urban areas in the wake of high urbanisation,
- Inaccessibility to loans mainly due to low-income levels that cannot service the loans, the high interest rates and deposit requirements which lock out many borrowers. This has continued to cripple real estate development as it has resulted in low demand for property including land, and,
- Reduced real estate development activities in the wake of the COVID-19 pandemic which has resulted in the disruption of construction materials supply chains and constrained development funding as investors adopt a wait and see attitude given the uncertainties in the market.
Some of the factors likely to shape the sector include;
- Digitization of the Lands Ministry- In May 2020, the Ministry Of Lands and Physical Planning issued a notice to the public inviting them for public participation on the regulatory impact statement for the proposed Land Transactions (Electronic) Regulations 2020. If approved, the regulations will guide land processes in the country. We expect this to boost the real estate sector through faster land transactions thus reducing delays experienced by developers during the pre-construction period,
- Government Land Repossession- In a bid to streamline the land sector in Kenya, the government is in the process of reclaiming all unclaimed and grabbed land in areas such as Kariobangi and Ngong , which is set to increase security in the fraud-ridden sector, and
- Implementation of Land Management Reforms- Earlier this year, The National Land Commission (NLC) and the Institution of Surveyors of Kenya (ISK) agreed to form a joint team that will spearhead land reforms especially in the areas of research, land management, women land rights, compulsory land acquisition and compensation among others.
- Performance Summary in 2019/20 Based on Zones and Locations
For our analysis, we classified the various nodes based on the zoning regulations and locations as below;
- High Rise Residential Areas: These are areas characterized by high rise residential developments mainly apartments and include: Kileleshwa, Dagoretti, Githurai, Embakasi, and Kasarani,
- Low Rise Residential Areas: These are areas zoned for low rise residential developments, mainly villas, townhouses and maisonettes and include; Kitisuru, Runda, Ridgeways, Karen and Spring Valley,
- Commercial Zones: These are areas characterized by commercial office buildings in Kilimani, Westlands, Riverside and Upperhill,
- Satellite Towns: Land in the area was categorized into serviced (site and service schemes) and unserviced land.
In 2019/2020, the land sector recorded an 8-year CAGR of 13.5% and an annual capital appreciation of 1.5%, compared to the (0.3%) recorded in 2018/2019, attributed to increased demand for land mainly in the low rise residential areas and satellite towns. Asking land prices in low rise residential areas recorded a 3.8% capital appreciation y/y, attributed to the availability of development land in these areas. Additionally, people are attracted to these areas as they are sparsely populated, thus offering exclusivity and privacy. Unserviced land in satellite towns such as Ruaka also recorded a capital appreciation of 3.8% y/y, attributable to the growing demand for land in these areas fueled by the demand for housing by the growing working population as the areas act as Nairobi’s dormitory, coupled by the improving infrastructure.
The summary of the performance is as shown below;
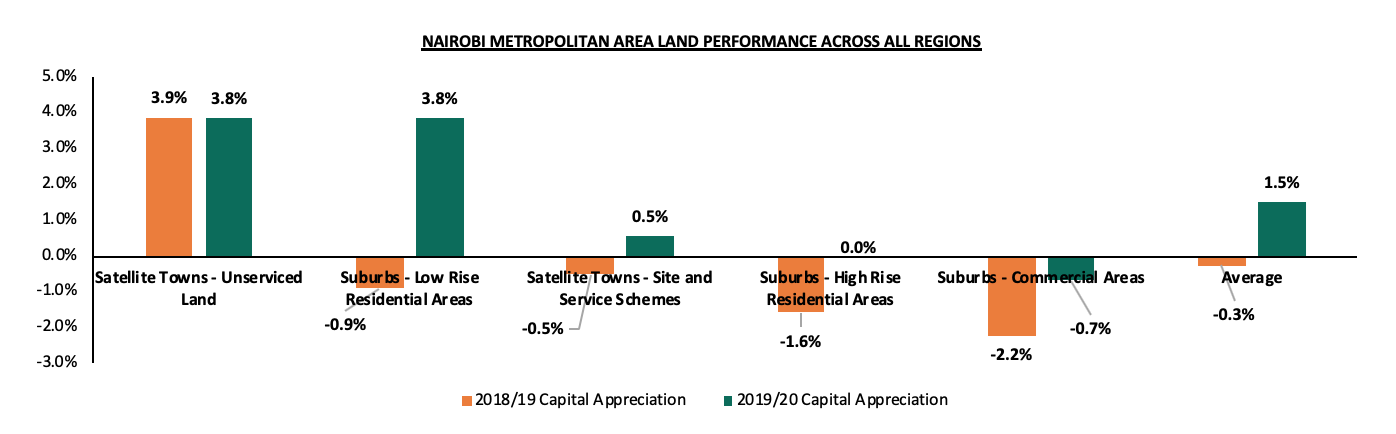
Source: Cytonn Research
All values in Kshs unless stated otherwise
|
SUMMARY OF THE LAND PERFORMANCE ACROSS ALL REGIONS |
||||||||||
|
Location |
*Price in 2011 |
*Price in 2015 |
*Price in 2016 |
*Price in 2017 |
*Price 2018/19 |
*Price 2019/20 |
8- Year CAGR |
2018/19 Capital Appreciation |
2019/20 Capital Appreciation |
∆ in capital appreciation |
|
Satellite Towns - Unserviced Land |
9m |
17m |
22m |
23m |
24m |
25m |
15.8% |
3.9% |
3.8% |
(0.1%) |
|
Nairobi Suburbs - Low Rise Residential Areas |
36m |
68m |
79m |
82m |
81m |
84m |
11.3% |
(0.9%) |
3.8% |
4.8% |
|
Satellite Towns - Site and Service Schemes |
8m |
15m |
18m |
15m |
15m |
15m |
15.1% |
(0.5%) |
0.5% |
1.0% |
|
Nairobi Suburbs - High rise Residential Areas |
52m |
92m |
111m |
117m |
117m |
116m |
11.0% |
(1.6%) |
0.0% |
1.5% |
|
Nairobi Suburbs - Commercial Areas |
145m |
359m |
422m |
433m |
421m |
419m |
14.5% |
(2.2%) |
(0.7%) |
1.5% |
|
Average |
13.5% |
(0.3%) |
1.5% |
1.8% |
||||||
|
*Asking land prices
|
||||||||||
Source: Cytonn Research
- Satellite Towns-Unserviced Land
Asking land prices for unserviced land in satellite towns such as Ruiru, Limuru and Utawala, recorded a capital appreciation of 3.8% y/y, a marginal decline of 0.1% points from the 3.9% recorded in 2018/19. The relatively high capital appreciation is supported by the high demand for development land fuelled by; i) affordability in comparison to Nairobi’s suburbs, and ii) improving infrastructures such as sewerage systems and roads in areas such as Ruaka and Ruiru.
All values in Kshs unless stated otherwise
|
Land Price Performance- Unserviced Land in Satellite Towns in Nairobi Metropolitan Area 2019/20 |
||||||||||
|
Location |
*Price in 2011 |
*Price in 2015 |
*Price in 2016 |
*Price in 2017 |
Price 2018/19* |
*Price 2019/20 |
8- year CAGR |
2018/19 Capital Appreciation |
2019/20 Capital Appreciation |
∆ in capital appreciation |
|
Satellite Towns - Unserviced Land |
||||||||||
|
Ruiru |
7m |
15m |
19m |
20m |
21m |
22m |
16.5% |
6.5% |
6.2% |
(0.3%) |
|
Ruaka |
40m |
58m |
74m |
77m |
80m |
84m |
9.8% |
4.0% |
5.2% |
1.2% |
|
Utawala |
6m |
9m |
10m |
11m |
12m |
12m |
9.7% |
5.6% |
4.1% |
(1.4%) |
|
Athi River |
2m |
3m |
4m |
4m |
4m |
4m |
10.1% |
3.1% |
3.4% |
0.3% |
|
Juja |
3m |
7m |
9m |
10m |
10m |
10m |
15.3% |
1.0% |
3.4% |
2.4% |
|
Limuru |
5m |
13m |
17m |
20m |
20m |
21m |
18.4% |
4.5% |
2.9% |
(1.7%) |
|
Ongata Rongai |
2m |
10m |
18m |
18m |
18m |
19m |
31.2% |
2.2% |
1.6% |
(0.7%) |
|
Average |
9m |
17m |
22m |
23m |
24m |
25m |
15.8% |
3.9% |
3.8% |
(0.1%) |
|
*Asking land prices
|
||||||||||
Source: Cytonn Research
- Nairobi Suburbs- Low Rise Residential Areas
Low-rise residential areas such as Karen and Runda recorded an average capital appreciation of 3.8% y/y, compared to the 0.9% y/y price correction recorded in 2018/19. The improved performance is attributed to a growing demand for development land supported by the resilience of the detached units residential market within the nodes evidenced by the 0.3% annual price appreciation in H1’2020, in addition to the relative affordability of land at approximately Kshs 84.2mn per acre as compared to the high-rise nodes, selling at Kshs 115.6 mn per acre on average. Additionally, family units are attracted to these areas as they are sparsely populated, thus offering exclusivity and privacy.
All values in Kshs unless stated otherwise
|
Land Price Performance- Low Rise Residential Areas in Nairobi Metropolitan Area 2019/20 |
||||||||||||
|
Location |
*Price in 2011 |
*Price in 2015 |
*Price in 2016 |
*Price in 2017 |
*Price 2018/19 |
*Price 2019/20 |
8- Year CAGR |
2018/*19 Capital Appreciation |
2019/20 Capital Appreciation |
∆ in capital appreciation |
||
|
Low Rise Residential Areas |
||||||||||||
|
Karen |
25m |
40m |
46m |
52m |
53m |
56m |
10.7% |
3.4% |
5.6% |
2.2% |
||
|
Spring Valley |
64m |
131m |
147m |
154m |
148m |
156m |
11.7% |
(4.1%) |
5.4% |
9.5% |
||
|
Runda |
33m |
58m |
67m |
68m |
68m |
70m |
9.8% |
0.2% |
3.3% |
3.1% |
||
|
Kitisuru |
32m |
59m |
70m |
70m |
71m |
73m |
10.8% |
0.8% |
3.0% |
2.2% |
||
|
Ridgeways |
24m |
51m |
62m |
68m |
65m |
66m |
13.5% |
(4.9%) |
1.8% |
6.7% |
||
|
Average |
36m |
68m |
79m |
82m |
81m |
84m |
11.3% |
(0.9%) |
3.8% |
4.8% |
||
|
*Asking land prices
|
||||||||||||
Source: Cytonn Research
- Satellite Towns- Site and Service Schemes
Site and service schemes recorded a 0.5% annualized capital appreciation, compared to the 0.5% y/y price correction in 2018/19. The capital appreciation is attributed to increased demand driven by the relatively affordable land at approximately Kshs 15 mn asking land price per acre and provision of infrastructure by the developers. Compared to unserviced land in the same areas, the asking price of serviced land recorded a slower appreciation due to decreased demand as buyers are not willing to pay a premium for the services provided, thus opt for unserviced land.
All values in Kshs unless stated otherwise
|
Land Price Performance- Serviced Land -Satellite Towns in Nairobi Metropolitan Area 2019/20 |
||||||||||
|
Location |
*Price in 2011 |
*Price in 2015 |
*Price in 2016 |
*Price in 2017 |
*Price 2018/19 |
*Price 2019/20 |
8- Year CAGR |
2018/19 Capital Appreciation |
2019/20 Capital Appreciation |
∆ in capital appreciation |
|
Site and service schemes |
||||||||||
|
Ruiru |
8m |
18m |
19m |
21m |
23m |
24m |
17.5% |
8.1% |
5.8% |
(2.2%) |
|
Athi River |
2m |
11m |
13m |
13m |
12m |
12m |
25.6% |
(7.3%) |
3.5% |
10.8% |
|
Ruai |
8m |
12m |
13m |
15m |
14m |
14m |
7.4% |
(9.4%) |
1.0% |
10.4% |
|
Thika |
5m |
7m |
8m |
10m |
10m |
10m |
9.0% |
1.7% |
0.5% |
(1.2%) |
|
Syokimau-Mlolongo |
3m |
12m |
12m |
12m |
12m |
12m |
18.0% |
3.5% |
(3.8%) |
(7.3%) |
|
Ongata Rongai |
7m |
16m |
19m |
19m |
19m |
18m |
12.9% |
0.4% |
(3.8%) |
(4.3%) |
|
Average |
8m |
15m |
18m |
15m |
15m |
15m |
15.1% |
(0.5%) |
0.5% |
(2.2%) |
|
*Asking land prices
|
||||||||||
- Nairobi Suburbs- High Rise Residential Areas
Asking land prices in high-rise residential areas stagnated, compared to a 1.6% price correction in 2018/19. The stagnation in asking land prices is attributed to reduced demand for development land given the reduced development activities due to the relatively high land prices averaging at approximately Kshs 116 mn per acre, compared to low rise residential areas and unserviced land in satellite towns averaging at Kshs 84 mn and Kshs 25 mn, respectively, in the wake of an economic slowdown in addition to the existing oversupply of residential units in the high-end market segment.
All values in Kshs unless stated otherwise
|
Land Price Performance- High Rise Residential Areas in Nairobi Metropolitan Area 2019/20 |
||||||||||
|
Location |
*Price in 2011 |
*Price in 2015 |
*Price in 2016 |
*Price in 2017 |
*Price 2018/19 |
*Price 2019/20 |
8- Year CAGR |
2018/19 Capital Appreciation |
2019/20 Capital Appreciation |
∆ in capital appreciation |
|
High Rise Residential Areas |
||||||||||
|
Kasarani |
32m |
51m |
60m |
64m |
61m |
65m |
9.2% |
(3.6%) |
5.7% |
9.3% |
|
Dagoretti |
28m |
81m |
95m |
99m |
100m |
103m |
17.8% |
1.5% |
2.5% |
1.0% |
|
Githurai |
21m |
37m |
45m |
46m |
45m |
44m |
10.2% |
(0.9%) |
(1.4%) |
(0.5%) |
|
Kileleshwa |
149m |
227m |
286m |
306m |
311m |
303m |
9.3% |
1.8% |
(2.6%) |
(4.4%) |
|
Embakasi |
33m |
61m |
69m |
70m |
66m |
63m |
8.5% |
(6.7%) |
(4.4%) |
2.3% |
|
Average |
52m |
92m |
111m |
117m |
117m |
116m |
11.0% |
(1.6%) |
0.0% |
1.6% |
|
*Asking land prices
|
||||||||||
Source: Cytonn Research
- Nairobi Suburbs- Commercial Zones
Commercial zones recorded a 0.7% y/y correction in asking land prices, 1.5% points lower than the 2.2% correction recorded in 2018/19. We attribute this to the decreased demand for development land in the sub-markets given the relatively high asking land prices of Kshs 419 mn per acre on average thus developers are not able to achieve favorable returns from the investments, in addition to the existing oversupply of commercial office and retail spaces which stand at 5.2 mn SQFT and 2.8 mn SQFT, respectively, as at 2019.
All values in Kshs unless stated otherwise
|
Land Price Performance- Commercial Zones in Nairobi Metropolitan Area 2019/20 |
||||||||||
|
Location |
*Price in 2011 |
*Price in 2015 |
*Price in 2016 |
*Price in 2017 |
*Price 2018/19 |
*Price 2019/20 |
8- Year CAGR |
2018/*19 Capital Appreciation |
2019/20 Capital Appreciation |
∆ in capital appreciation |
|
Commercial Zones |
||||||||||
|
Upper Hill |
200m |
450m |
512m |
510m |
488m |
506m |
12.3% |
(4.4%) |
3.8% |
8.1% |
|
Kilimani |
114m |
294m |
360m |
387m |
403m |
398m |
16.9% |
4.1% |
(1.2%) |
(5.3%) |
|
Westlands |
150m |
350m |
453m |
474m |
430m |
421m |
13.8% |
(9.3%) |
(1.9%) |
7.4% |
|
Riverside |
116m |
343m |
362m |
361m |
363m |
351m |
14.8% |
0.7% |
(3.3%) |
(4.0%) |
|
Average |
145m |
359m |
422m |
433m |
421m |
419m |
14.5% |
(2.2%) |
(0.7%) |
1.5% |
|
*Asking land price *Key to note the Nairobi CBD was exempted from the list of submarkets within the commercial zones, due to unavailability of undeveloped land for sale
|
||||||||||
Source: Cytonn Research
- Summary and Investment Opportunity in the Sector
Ruiru, Kasarani, Karen, Spring Valley and Ruaka are among the best performing submarkets in terms of capital appreciation, recording annual rates of more than 5.0% in 2019/20, while Ruiru offers site and service investors the highest expected returns averaging 5.8%.
The table below summarizes the performance of the various areas:
|
Summary and Conclusions- y/y Capital Appreciation Nairobi Metropolitan Area |
|
|
Land Appreciation |
|
|
2019-2020 |
Areas |
|
>5.0% |
Ruiru, Kasarani, Karen, Spring Valley, Ruaka |
|
1.0%- 4.9% |
Dagoretti, Runda, Kitisuru, Ridgeways, Utawala, Athi River, Juja, Limuru, Ongata Rongai, Upper Hill |
|
<1.0% |
Githurai, Embakasi, Kileleshwa, Kilimani, Westlands, Riverside |
|
Site and Service Capital Appreciation |
|
|
2019-2020 |
Areas |
|
>5.0% |
Ruiru |
|
1.0%- 4.9% |
Athi River, Ruai |
|
<1.0% |
Thika, Syokimau- Mlolongo, Ongata Rongai |
Source: Cytonn Research
Investment Opportunity
Given the above performance of the various areas, the investment opportunity in the land sector lies in sub-markets such as Karen, Spring Valley and Kasarani which recorded relatively high annualized capital appreciation of 5.6%, 5.4% and 5.7%, respectively, and satellite towns such as Ruiru and Ruaka for unserviced land, and Ruiru for site and service schemes which were the best performing sub-markets with average annualized capital appreciation of 6.2%, 5.2%, and 5.8%, respectively, supported by a growing demand for development land by the growing middle class and improving infrastructure.
- Conclusion and Outlook for the Sector
|
Indicator |
2019 Projections |
2020 Projections |
2019 Outlook |
2020 Outlook |
|
Infrastructure Development |
It was expected that the continued infrastructural development supported by the 2018/2019 national budget allocation of Kshs 418.8 bn, would open up areas for development and translate to an increase in land value. |
Despite the reduced allocation on development expenditure, we expect continued commitment by the government to its infrastructure developmental agenda, thus opening up areas for development thus boosting land value. For the 2020/2021 budget, the infrastructure sector budget allocation stands at Kshs 172.4 bn 58.8% lower than the previous allocation and we expect this to slowdown infrastructural development works. |
Positive |
Neutral |
|
Legal Reforms |
The digitization of the land ministry was expected to enhance transparency and efficiency of land transactions hence reduced transaction cost |
We expect reforms such as the recent amendment of the Business Laws Act to allow for online assessment, payment, and franking of stamp duty; allowance for the use of electronic signatures in the execution of land documents such as title deeds, lease agreements, land rates clearance and transfer, and the general digitalization of the lands ministry will enhance the ease of doing business within the land sector |
Positive |
Positive |
|
Credit Supply |
It was expected that the low credit supply given the interest rate cap would continue hindering access to funds reducing both development and off take of real estate. |
We expect constrained credit supply to cripple real estate development activities, as financiers such as banks aim to limit exposure amidst increasing loan deferrals and defaults, in the wake of an economic slowdown attributed to the ongoing COVID-19 pandemic. |
Negative |
Negative |
|
Real Estate Activities |
We expected decreased real estate development activities attributed to the existing space supply in the commercial office and retail sectors and the unmatched demand and supply in the residential sector. However, we expected continued focus on the affordable housing initiative by both the government and private developers. |
We expect the real estate sector to record a slowdown in development activities attributed to the current global and local economy slowdown and the existing oversupply of space in select sectors namely commercial office, retail and high-end residential markets. However, we expect the sector to improve significantly towards the end of 2020 once economic activity regains momentum. |
Neutral |
Neutral |
|
Performance |
We expected the growth of asking land prices to be fuelled by the demand for development land, improving infrastructure and demographics despite the reduced real estate activities in the NMA |
Despite the current slowdown in real estate development activities, we expect the performance of the land sector to be cushioned by; (i) the growing demand for development land, especially in the satellite towns as developers, strive to drive the government’s Big Four government agenda on the provision of affordable housing, (ii) improving infrastructure such as the ongoing construction of the Western bypass, and (iii) increased demand for development land by the growing middle income population. |
Neutral |
Neutral |
With 1 positive, 1 negative, and 3 neutral factors from our analysis, we have a neutral outlook for the land sector, with a bias to positive supported by the high demand for development land boosted by affordability in satellite towns, availability of development land and the improving infrastructure. However, we expect the COVID-19 pandemic to continue impacting on real estate development activities thus a resultant sluggish growth in land value going forward.
Disclaimer: The views expressed in this publication are those of the writers where particulars are not warranted. This publication is meant for general information only and is not a warranty, representation, advice, or solicitation of any nature. Readers are advised in all circumstances to seek the advice of a registered investment advisor.

- Talk to us
- Kenya
- P.O Box 20695 - 00200, Nairobi, Kenya
- Cell +254709101200
- Tel +254709101200
- WhatsApp +254741676635
- United States
- +254709101200
- DOWNLOAD OUR APP
-


- Kenya
- 8th Floor, Pinetree Plaza, Kaburu Drive, Ngong Road, Nairobi, Kenya
- USA
- Suite 1150, 1775 Eye Street NW, USA, Washington DC 20006, USA
- Investments
- High Yield
- Private Equity
- Real Estate
- Real Estate
- RiverRun Estates
- Cytonn Towers
- The Ridge
- Taraji Heights
- The Alma