Nairobi Metropolitan Area (NMA) Land Report 2022, & Cytonn Weekly #28/2022
By Research Team, Jul 17, 2022
Executive Summary
Fixed Income
During the week, T-bills remained oversubscribed, with the overall subscription rate coming in at 105.8%, a slight increase from the 102.5% recorded the previous week. The increase in the subscription rate was partly attributable to investors’ preference for the shorter dated papers as they sought to avoid duration risk coupled with ample liquidity in the money market with the average interbank rates declining to 5.6% from 5.8% recorded the previous week. Investors’ preference for the shorter 91-day paper persisted, with the paper receiving bids worth Kshs 13.2 bn against the offered Kshs 4.0 bn, translating to a subscription rate of 329.8%, a significant increase from the 276.0% recorded the previous week. The subscription rate for the 364-day paper also increased to 71.1% from 51.2% while that of the 182-day paper declined to 50.9% from 84.3% recorded the previous week. The yields on the government papers were on an upward trajectory, with the yields on the 364-day, 182-day and the 91-day papers increasing by 0.6 bps, 5.2 bps and 8.1 bps to 10.0%, 9.3% and 8.2%, respectively;
Also during the week, the Energy and Petroleum Regulatory Authority (EPRA) released their monthly statement on the maximum retail prices in Kenya effective 15th July 2022 to 14th August 2022, highlighting that fuel prices remained unchanged at Kshs 159.1 per litre for Super Petrol, Kshs 140.0 per litre for Diesel and Kshs 127.9 per litre for Kerosene;
Equities
During the week, the equities market recorded mixed performance, with NASI and NSE 25 gaining by 5.1% and 1.5%, respectively, while NSE 20 declined by 0.6%, taking their YTD performance to losses of 14.8%, 12.1% and 14.4%, for NASI, NSE 20 and NSE 25, respectively. The equities market performance was mainly driven by gains recorded by large-cap stocks such as Safaricom, BAT and Bamburi which recorded gains of 11.5%, 2.2% and 1.0%, respectively. The gains were however weighed down by losses recorded by banking stocks such as KCB Group, Co-operative Bank, Equity Group and ABSA Bank of 4.6%, 3.9%, 3.2% and 3.1%, respectively;
Real Estate
During the week, The Northern Corridor Transit and Transport Coordination Authority (NCTTCA), an intergovernmental body comprised of Kenya, Uganda, Rwanda, Burundi, South Sudan and the Democratic Republic of Congo (DRC), announced plans to open up additional transit routes within East Africa. Also in listed Real Estate, ICEA Lion Management announced that its listed Property fund, ILAM Fahari I-REIT’s restructuring proposal is under review by the Capital Market’s Authority’s (CMA), awaiting approval. Additionally, the Fahari I-REIT closed the week trading at an average price of Kshs 6.4 per share. This represented a 6.7% Week-to-Date (WTD) increase while on a Year-to-Date (YTD) basis, the share price performance was flat;
Focus of the Week
This week we will focus on the Nairobi Metropolitan Area Real Estate land sector by discussing its overall performance overtime, as well as the factors affecting its performance and then give our conclusion and outlook for the sector. The NMA land sector recorded an improvement in performance with the average annual price appreciation coming in at 3.2% in FY 2021/22, 1.7% points higher than the 1.5% appreciation recorded in FY’2020/21. The performance represented a 10-year price appreciation CAGR of 11.4%, with the average selling price for land coming in at Kshs 126.8 mn in FY’2021/22, from Kshs 47.5 mn in 2011. This signifies the continued rise in the demand for development land mainly driven by rapid population and urbanization growth rate, coupled with rapid infrastructure developments opening up areas for property investments;
Investment Updates:
- Weekly Rates:
- Cytonn Money Market Fund closed the week at a yield of 10.50%. To invest, dial *809# or download the Cytonn App from Google Play Store or Apple App Store;
- Cytonn High Yield Fund closed the week at a yield of 13.93% p.a. To invest, email us at sales@cytonn.com and to withdraw the interest, dial *809# or download the Cytonn App from Google Play Store or Apple App Store;
- On our fortnightly Twitter Spaces session, we had a discussion on “A Winning C.V” which was moderated by Peter Kagwi, Assistant Manager, HR & Business Administration, at Cytonn Investments. The panelist was Joan, a Career Coach. Listen to the conversation here,
- We continue to offer Wealth Management Training every Wednesday and every third Saturday of the month, from 9:00 am to 11:00 am, through our Cytonn Foundation. The training aims to grow financial literacy among the general public. To register for any of our Wealth Management Trainings, click here;
- If interested in our Private Wealth Management Training for your employees or investment group, please get in touch with us through wmt@cytonn.com;
- Any CHYS and CPN investors still looking to convert are welcome to consider one of the five projects currently available for assignment, click here for the latest term sheet;
- Cytonn Insurance Agency acts as an intermediary for those looking to secure their assets and loved ones’ future through insurance namely; Motor, Medical, Life, Property, WIBA, Credit and Fire and Burglary insurance covers. For assistance, get in touch with us through insuranceagency@cytonn.com;
- Cytonnaire Savings and Credit Co-operative Society Limited (SACCO) provides a savings and investments avenue to help you in your financial planning journey. To enjoy competitive investment returns, kindly get in touch with us through clientservices@cytonn.com;
Real Estate Updates:
- For an exclusive tour of Cytonn’s real estate developments, visit: Sharp Investor's Tour, and for more information, email us at sales@cytonn.com;
- Phase 3 of The Alma is now ready for occupation. To rent please email properties@cytonn.com;
- We have 8 investment-ready projects, offering attractive development and buyer targeted returns; See further details here: Summary of Investment-ready Projects;
- For Third Party Real Estate Consultancy Services, email us at rdo@cytonn.com;
- For recent news about the group, see our news section here;
Hospitality Updates:
- We currently have promotions for Staycations. Visit cysuites.com/offers for details or email us at sales@cysuites.com;
Money Markets, T-Bills Primary Auction:
During the week, T-bills remained oversubscribed, with the overall subscription rate coming in at 105.8%, a slight increase from the 102.5% recorded the previous week. The increase in the subscription rate was partly attributable to investors’ preference for the shorter dated papers as they sought to avoid duration risk coupled with ample liquidity in the money market with the average interbank rates declining to 5.6% from 5.8% recorded the previous week. Investors’ preference for the shorter 91-day paper persisted, with the paper receiving bids worth Kshs 13.2 bn against the offered Kshs 4.0 bn, translating to a subscription rate of 329.8%, a significant increase from the 276.0% recorded the previous week. The subscription rate for the 364-day paper also increased to 71.1% from 51.2% while that of the 182-day paper declined to 50.9% from 84.3% recorded the previous week. The yields on the government papers were on an upward trajectory, with the yields on the 364-day, 182-day and the 91-day papers increasing by 0.6 bps, 5.2 bps and 8.1 bps to 10.0%, 9.3% and 8.2%, respectively. The government accepted a total of Kshs 25.3 bn worth of bids out of the Kshs 25.4 bn worth of bids received, translating to an acceptance rate of 99.8%.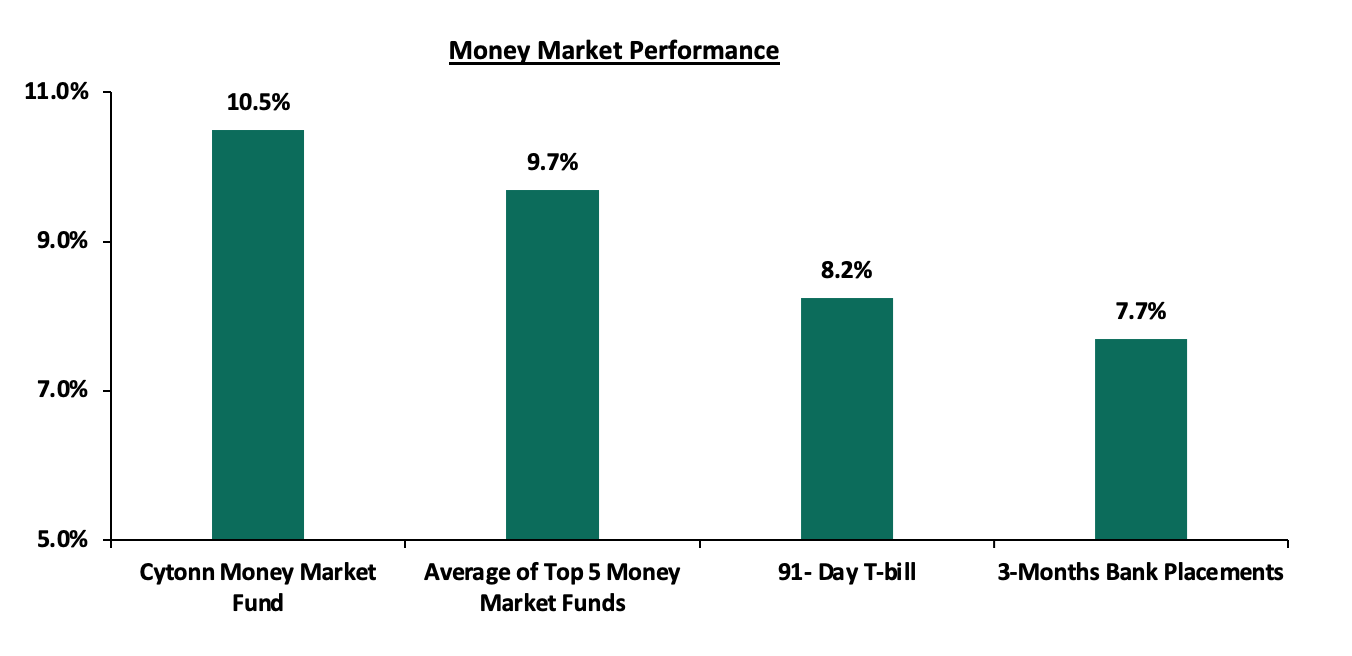
In the money markets, 3-month bank placements ended the week at 7.7% (based on what we have been offered by various banks), while the yield on the 91-day T-bill increased by 8.1 bps to 8.2%. The average yield of the Top 5 Money Market Funds and the Cytonn Money Market Fund remained relatively unchanged at 9.7% and 10.5% respectively, as was recorded last week.
The table below shows the Money Market Fund Yields for Kenyan Fund Managers as published on 15th July 2022:
|
Money Market Fund Yield for Fund Managers as published on 15th July 2022 |
||
|
Rank |
Fund Manager |
Effective Annual Rate |
|
1 |
Cytonn Money Market Fund |
10.5% |
|
2 |
Zimele Money Market Fund |
9.9% |
|
3 |
Sanlam Money Market Fund |
9.5% |
|
4 |
Madison Money Market Fund |
9.3% |
|
5 |
Nabo Africa Money Market Fund |
9.3% |
|
6 |
Apollo Money Market Fund |
9.2% |
|
7 |
NCBA Money Market Fund |
9.2% |
|
8 |
Dry Associates Money Market Fund |
9.1% |
|
9 |
CIC Money Market Fund |
9.0% |
|
10 |
Co-op Money Market Fund |
8.9% |
|
11 |
Old Mutual Money Market Fund |
8.8% |
|
12 |
GenCap Hela Imara Money Market Fund |
8.7% |
|
13 |
ICEA Lion Money Market Fund |
8.5% |
|
14 |
Orient Kasha Money Market Fund |
8.4% |
|
15 |
AA Kenya Shillings Fund |
7.9% |
|
16 |
British-American Money Market Fund |
7.4% |
Source: Business Daily
Liquidity:
During the week, liquidity in the money markets eased, with the average interbank rate declining to 5.6% from 5.8% recorded the previous week, partly attributable to government payments which offset tax remittances. The average interbank volumes traded increased by 41.8% to Kshs 29.2 bn from Kshs 20.6 bn recorded the previous week.
Kenya Eurobonds:
During the week, the yields on all Eurobonds were on an upward trajectory, partly attributable to the heightened perceived risk by investors, stemming from increasing inflationary pressures, local currency depreciation as well as the heated political environment. The yield on the 10-year Eurobond issued in 2014 recorded the highest increase having increased by 3.9% points to 21.6%, from 17.7%, recorded the previous week. The table below shows the summary of the performance of the Kenyan Eurobonds as of 14th July 2022;
|
Kenya Eurobonds Performance |
||||||
|
2014 |
2018 |
2019 |
2021 |
|||
|
Date |
10-year issue |
10-year issue |
30-year issue |
7-year issue |
12-year issue |
12-year issue |
|
03-Jan-22 |
4.4% |
8.1% |
8.1% |
5.6% |
6.7% |
6.6% |
|
08-Jul-22 |
17.7% |
15.2% |
14.1% |
17.1% |
14.1% |
13.4% |
|
11-Jul-22 |
18.4% |
15.4% |
14.3% |
17.2% |
14.4% |
13.7% |
|
12-Jul-22 |
19.3% |
15.7% |
14.5% |
18.0% |
14.7% |
13.9% |
|
13-Jul-22 |
20.4% |
16.3% |
15.0% |
18.7% |
15.0% |
14.4% |
|
14-Jul-22 |
21.6% |
16.6% |
16.0% |
19.5% |
15.3% |
15.4% |
|
Weekly Change |
3.9% |
1.4% |
1.9% |
2.4% |
1.2% |
2.0% |
|
Y/Y Change |
18.3% |
11.2% |
8.6% |
14.1% |
9.0% |
9.1% |
|
YTD Change |
17.2% |
8.6% |
7.9% |
13.9% |
8.6% |
8.8% |
Source: Central Bank of Kenya (CBK)
Kenya Shilling:
During the week, the Kenyan shilling depreciated by 0.2% against the US dollar to close the week at Kshs 118.3, from Kshs 118.1 recorded the previous week, partly attributable to increased dollar demand from the oil and energy sectors against a slower supply of hard currency. On a year to date basis, the shilling has depreciated by 4.5% against the dollar, higher than the 3.6% depreciation recorded in 2021. We expect the shilling to remain under pressure in 2022 as a result of:
- High global crude oil prices on the back of persistent supply chain bottlenecks further exacerbated by the Russian-Ukrainian geopolitical pressures at a time when demand is picking up with the easing of COVID-19 restrictions and as economies continue to recover. Key to note, risks abound the recovery following the resurgence of COVID-19 infections in the country and the country’s trading partners,
- Increased demand from merchandise traders as they beef up their hard currency positions in anticipation for increased demand as economies gradually recover,
- An ever-present current account deficit due to an imbalance between imports and exports, with Kenya’s current account deficit estimated to come in at 5.3% of GDP in the 12 months to May 2022 compared to the 5.0% for a similar period in 2021. The wider deficit reflects a higher import bill, particularly for petroleum products, with the imports for Q1’2022 increasing by 14.5%, 5.7% points higher than the 8.8% increase in exports, and,
- The aggressively growing government debt, with Kenya’s public debt having increased at a 10-year CAGR of 19.8% to Kshs 8.5 tn in April 2022, from Kshs 1.4 tn in April 2011 thus putting pressure on forex reserves to service some of the public debt. It is worth noting that the average GDP growth over the same period has been 3.9%, an indicator that the increase in debt is not translating into GDP growth.
The shilling is however expected to be supported by:
- High Forex reserves currently at USD 8.0 bn (equivalent to 4.6-months of import cover), which is above the statutory requirement of maintaining at least 4.0-months of import cover, and the EAC region’s convergence criteria of 4.5-months of import cover. In addition, the reserves were boosted by the USD 750.0 mn World Bank loan facility received in March 2022 and are expected to be boosted further by the expected USD 244.0 mn from the International Monetary Fund (IMF), and,
- Improving diaspora remittances evidenced by a 6.6% y/y increase to USD 326.1 mn as of June 2022, from USD 305.9 mn recorded over the same period in 2021 which has continued to cushion the shilling against further depreciation. In the recently released June 2022 diaspora remittances figures, US remained the largest source of remittances to Kenya accounting for 59.0% in the period.
Weekly Highlight:
- Fuel Prices
During the week, the Energy and Petroleum Regulatory Authority (EPRA) released their monthly statement on the maximum retail prices in Kenya effective 15th July 2022 to 14th August 2022. Notably, fuel prices remained unchanged at Kshs 159.1 per litre for Super Petrol, Kshs 140.0 per litre for Diesel and Kshs 127.9 per litre for Kerosene. The performance in fuel prices was attributable to:
- The fuel subsidy program under the Petroleum Development Levy which resulted in subsidies of Kshs 50.7 on Super Petrol, Kshs 53.7 on Diesel and Kshs 53.2 on Kerosene during the month,
- The decline in the Free on Board (FOB) price of Murban crude oil in June 2022 by 7.1% to USD 104.5 per barrel, from USD 112.5 per barrel in May 2022, and,
- Elimination of suppliers margins of Kshs 6.3 on Super Petrol, Kshs 5.5 on Diesel and Kshs 7.7 on Kerosene since October 2021.
However, the average landed costs of Super Petrol, Diesel and Kerosene increased by 19.0%, 2.2% and 6.8% to USD 1042.9 per cubic meter, USD 1019.3 per cubic meter, and USD 967.4 in June 2022, from USD 876.1 per cubic meter, USD 997.4 per cubic meter, and USD 905.6 per cubic meter in May 2022. Additionally, the Kenyan shilling depreciated by 1.4% to Kshs 118.5 in June 2022, from Kshs 116.9 in May 2022.
Global fuel prices have remained high since the beginning of the year, having recorded a 34.1% increase to USD 104.4 per barrel as of 13th July 2022, from USD 77.9 per barrel recorded on 3rd January 2022. The increase was primarily driven by persistent supply chain constraints worsened by the geopolitical pressures occasioned by the Russian invasion of Ukraine. However, Kenyans have not felt the full impact of fuel price increases, owing to the National Treasury's fuel subsidy program. Notably, the government has allocated a total of Kshs 101.9 bn so far to the fuel subsidy programme surpassing the Kshs 100.0 bn that was expected to cover both FY’2021/2022 and FY’22022/2023, after which the National Treasury announced an additional presidential subsidy worth Kshs 16.7 bn. As such, we maintain our view that the fuel subsidy program remains unsustainable and will still be depleted should the average landed costs of fuel continue to rise. Additionally, we expect the government to gradually adjust domestic fuel prices to progressively eliminate the need for fuel subsidy as the programme continues to increase the government’s expenditure.
Rates in the Fixed Income market have remained relatively stable due to the relatively ample liquidity in the money market. The government is 34.5% behind its prorated borrowing target of Kshs 24.0 bn having borrowed Kshs 15.7 bn of the Kshs 581.7 bn borrowing target for the FY’2022/2023. We expect sustained gradual economic recovery as evidenced by the revenue collections of Kshs 2.0 tn during the FY’2021/2022, which was equivalent to 102.8% of the prorated revenue collection target. Additionally, despite the projected high budget deficit of 8.1% and the affirmation of the `B+’ rating with negative outlook by Fitch Ratings, we believe that the support from the IMF and World Bank will mean that the interest rate environment will remain stable since the government is not desperate for cash. Owing to this, our view is that investors should be biased towards short-term fixed-income securities to reduce duration risk.
Market Performance:
During the week, the equities market recorded mixed performance, with NASI and NSE 25 gaining by 5.1% and 1.5%, respectively, while NSE 20 declined by 0.6%, taking their YTD performance to losses of 14.8%, 12.1% and 14.4%, for NASI, NSE 20 and NSE 25, respectively. The equities market performance was mainly driven by gains recorded by large-cap stocks such as Safaricom, BAT and Bamburi which recorded gains of 11.5%, 2.2% and 1.0%, respectively. The gains were however weighed down by losses recorded by banking stocks such as KCB Group, Co-operative Bank, Equity Group and ABSA Bank of 4.6%, 3.9%, 3.2% and 3.1%, respectively.
During the week, equities turnover declined by 51.9% to USD 11.0 mn from USD 22.9 mn recorded the previous week, taking the YTD turnover to USD 506.8 mn. Additionally, foreign investors remained net sellers, with a net selling position of USD 3.9 mn, from a net selling position of USD 7.3 mn recorded the previous week, taking the YTD net selling position to USD 119.2 mn.
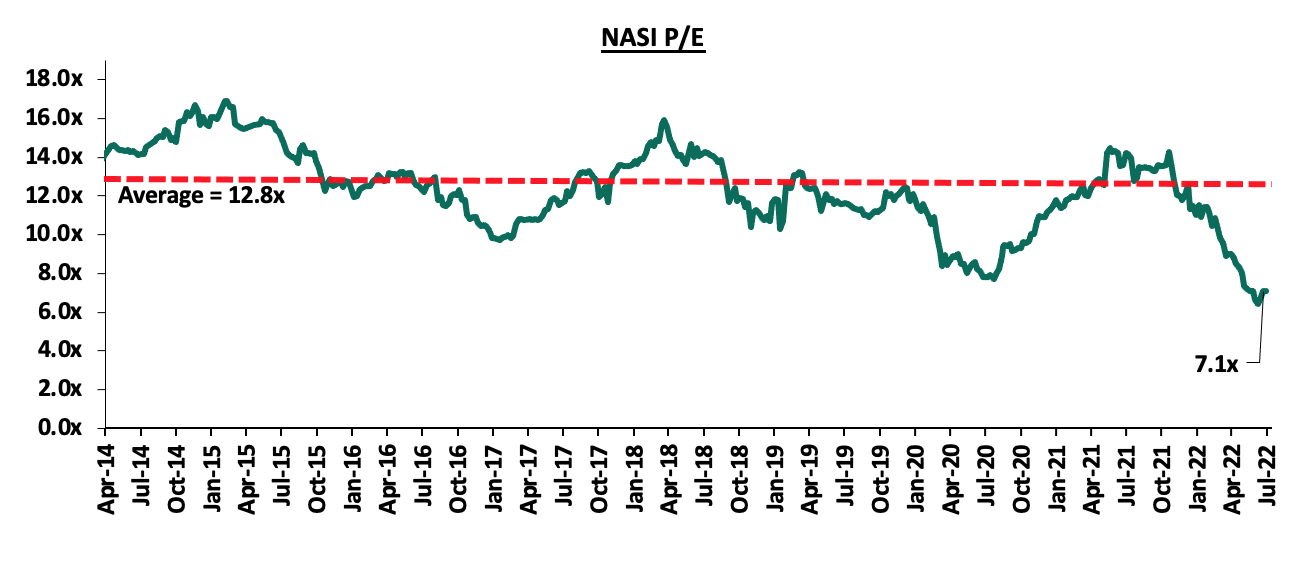
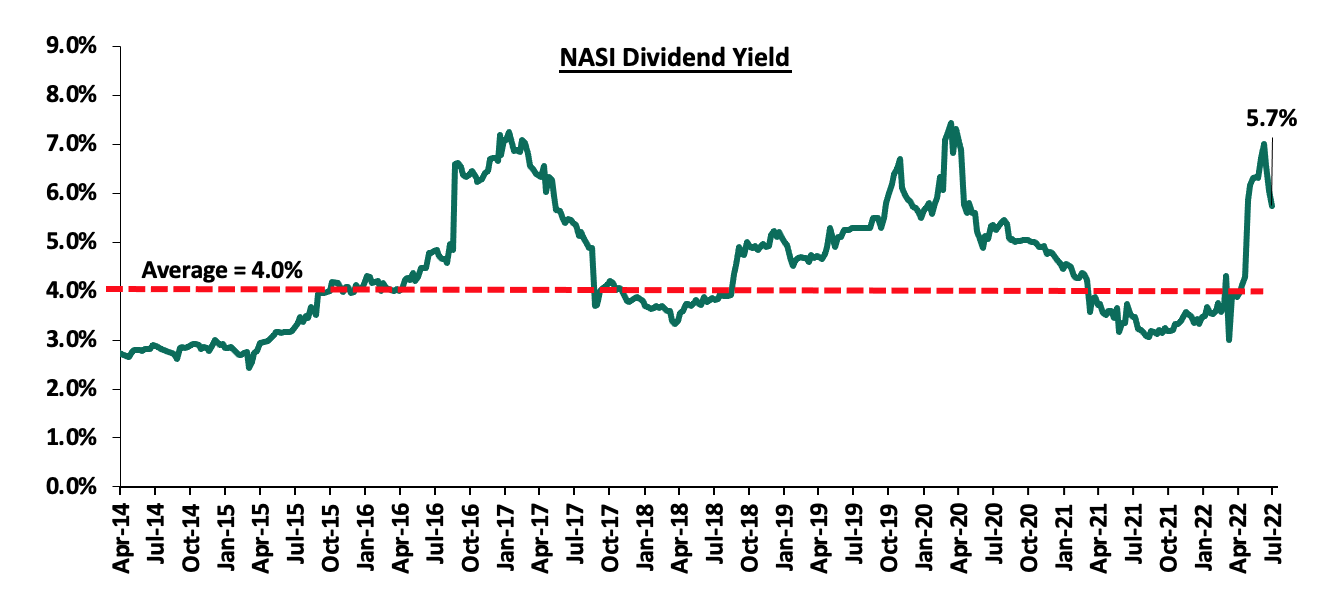
The market is currently trading at a price to earnings ratio (P/E) of 7.1x, 44.7% below the historical average of 12.8x, and a dividend yield of 5.7%, 1.7% points above the historical average of 4.0%. Key to note, NASI’s PEG ratio currently stands at 0.9x, an indication that the market is undervalued relative to its future growth. A PEG ratio greater than 1.0x indicates the market may be overvalued while a PEG ratio less than 1.0x indicates that the market is undervalued.
The charts below indicate the historical P/E and dividend yields of the market;
Cytonn coverage:
|
Company |
Price as at 08/07/2022 |
Price as at 15/07/2022 |
w/w change |
YTD Change |
Target Price* |
Dividend Yield |
Upside/ Downside** |
P/TBv Multiple |
Recommendation |
|
Jubilee Holdings |
250.0 |
248.8 |
(0.5%) |
(21.5%) |
379.4 |
5.6% |
58.2% |
0.5x |
Buy |
|
Kenya Reinsurance |
2.1 |
2.1 |
1.5% |
(8.7%) |
3.2 |
4.8% |
56.9% |
0.2x |
Buy |
|
Liberty Holdings |
5.7 |
5.3 |
(5.7%) |
(24.4%) |
7.8 |
0.0% |
46.1% |
0.4x |
Buy |
|
Sanlam |
11.0 |
11.0 |
0.0% |
(4.8%) |
15.9 |
0.0% |
44.5% |
1.2x |
Buy |
|
I&M Group*** |
17.0 |
17.0 |
0.0% |
(20.6%) |
22.3 |
8.8% |
40.0% |
0.5x |
Buy |
|
Co-op Bank*** |
11.5 |
11.1 |
(3.9%) |
(15.0%) |
14.1 |
9.0% |
36.7% |
0.8x |
Buy |
|
KCB Group*** |
42.4 |
40.5 |
(4.6%) |
(11.2%) |
52.2 |
7.4% |
36.5% |
0.8x |
Buy |
|
ABSA Bank*** |
11.2 |
10.9 |
(3.1%) |
(7.7%) |
13.6 |
10.1% |
35.5% |
1.1x |
Buy |
|
NCBA*** |
24.0 |
24.1 |
0.2% |
(5.5%) |
29.1 |
12.5% |
33.5% |
0.6x |
Buy |
|
Stanbic Holdings |
99.0 |
90.0 |
(9.1%) |
3.4% |
109.8 |
10.0% |
32.0% |
0.8x |
Buy |
|
Diamond Trust Bank*** |
50.5 |
50.0 |
(1.1%) |
(16.1%) |
62.4 |
6.0% |
30.9% |
0.2x |
Buy |
|
Equity Group*** |
46.0 |
44.6 |
(3.2%) |
(15.5%) |
54.4 |
6.7% |
28.8% |
1.1x |
Buy |
|
Britam |
6.0 |
6.0 |
(0.3%) |
(20.9%) |
7.7 |
0.0% |
28.8% |
1.0x |
Buy |
|
Standard Chartered*** |
133.5 |
130.8 |
(2.1%) |
0.6% |
137.0 |
10.7% |
15.5% |
1.0x |
Accumulate |
|
CIC Group |
2.1 |
2.1 |
0.0% |
(4.1%) |
2.1 |
0.0% |
1.0% |
0.7x |
Lighten |
|
HF Group |
3.7 |
3.5 |
(7.5%) |
(9.2%) |
2.8 |
0.0% |
(18.8%) |
0.2x |
Sell |
|
Target Price as per Cytonn Analyst estimates **Upside/ (Downside) is adjusted for Dividend Yield ***For Disclosure, these are stocks in which Cytonn and/or its affiliates are invested in |
|||||||||
We are “Neutral” on the Equities markets in the short term due to the current adverse operating environment and huge foreign investor outflows, and, “Bullish” in the long term due to current cheap valuations and expected global and local economic recovery.
With the market currently trading at a discount to its future growth (PEG Ratio at 0.9x), we believe that investors should reposition towards value stocks with strong earnings growth and that are trading at discounts to their intrinsic value. We expect the current high foreign investors sell-offs, the upcoming Kenyan general elections and the slow vaccine rollout to continue weighing down the economic outlook in the short term.
- Infrastructure Sector
During the week, the Northern Corridor Transit and Transport Coordination Authority (NCTTCA), an intergovernmental body comprised of Kenya, Uganda, Rwanda, Burundi, South Sudan and the Democratic Republic of Congo (DRC), announced plans to open up additional transit routes within East Africa. The targeted routes in the Northern Corridor which will cover approximately 12,707 Km in length, include Lwakhakha, Nadapal and Todonyang in Kenya-Uganda, Kenya-South Sudan, Kenya-Uganda-Ethiopia borders, respectively. Upon the completion of the new transit routes, they are expected to;
- Decongest the Malaba and Busia border stations due to reduced traffic snarl-ups,
- Increase cargo haulage and reduce backlog at the border points,
- Boost cargo flow to South Sudan, Northern Uganda and parts of North Eastern DRC, and,
- Improve accessibility, efficiency and business along the corridor hence support property prices.
The Kenyan infrastructure sector continues to witness rapid developments aimed at improving connectivity and the economic performance. Other ongoing and completed projects in the country include but not limited to; i) the Lamu Port-South Sudan-Ethiopia Transport (LAPSSET) corridor whose first 3 berths are complete, ii) Nairobi Commuter Rail project, iii) Nairobi-Nakuru Highway project, iv) Standard Gauge Railway Phase 2A, and, v) the Nairobi Western Bypass. We expect continued infrastructural development in the country given that infrastructure is a key factor in improving connectivity as well as boosting performance of Real Estate market. This will be supported by governments’ aggressiveness in implementing projects through various strategies such as; Public-Private Partnerships (PPPs) and Joint Ventures(JVs), floating of infrastructure bonds in order to raise construction funds, and, high priority in the budget allocations. Notably, the sector was allocated Kshs 212.5 bn in the FY’2022/2023 Budget estimates, a 16.4% increase from the Kshs 182.5 bn budgetary allocation in the FY’2021/2022 budget. The graph below shows the budget allocation to the infrastructure sector over last ten fiscal years;
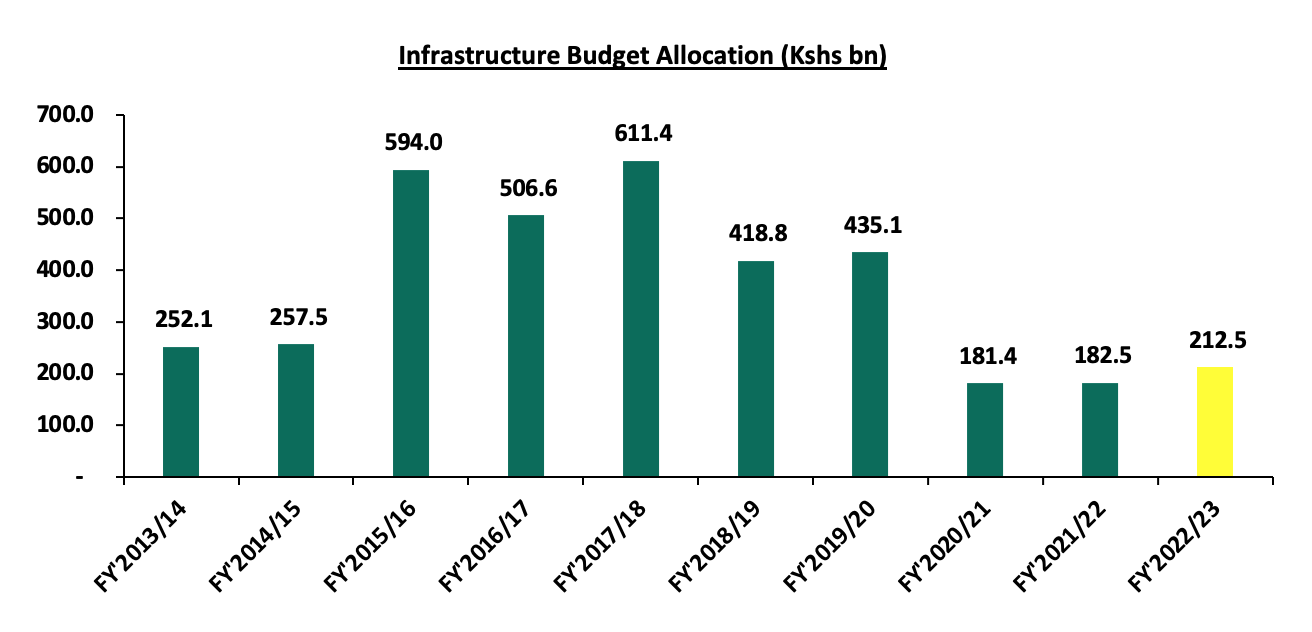
Source: The National Treasury of Kenya
- Listed Real Estate
- ILAM Fahari I-REIT Restructuring Proposal
During the week, ICEA Lion Management announced that its listed Property fund, ILAM Fahari I-REIT’s restructuring proposal is under review by the Capital Market’s Authority’s (CMA), awaiting approval. As highlighted in the ILAM Fahari Earnings Note, FY’2021, the REIT recorded a net loss of Kshs 124.0 mn, a significant decline from a net profit of Kshs 148.0 mn in 2020, occasioned by high total operating expenses which grew by 8.0% to Kshs 107.5 mn in FY’2021, from Kshs 99.3 mn in FY’2020. The performance was as a result of the fund manager’s decision to temporarily reduce their management fees by 10.0% to cushion investors from the impact of the COVID-19 pandemic. Additionally, ILAM Fahari, recorded lower rental income following Tuskys supermarket eviction at Greenspan Mall due to payment default. The graph below shows the ILAM Fahari I-REIT earnings in the last five years;
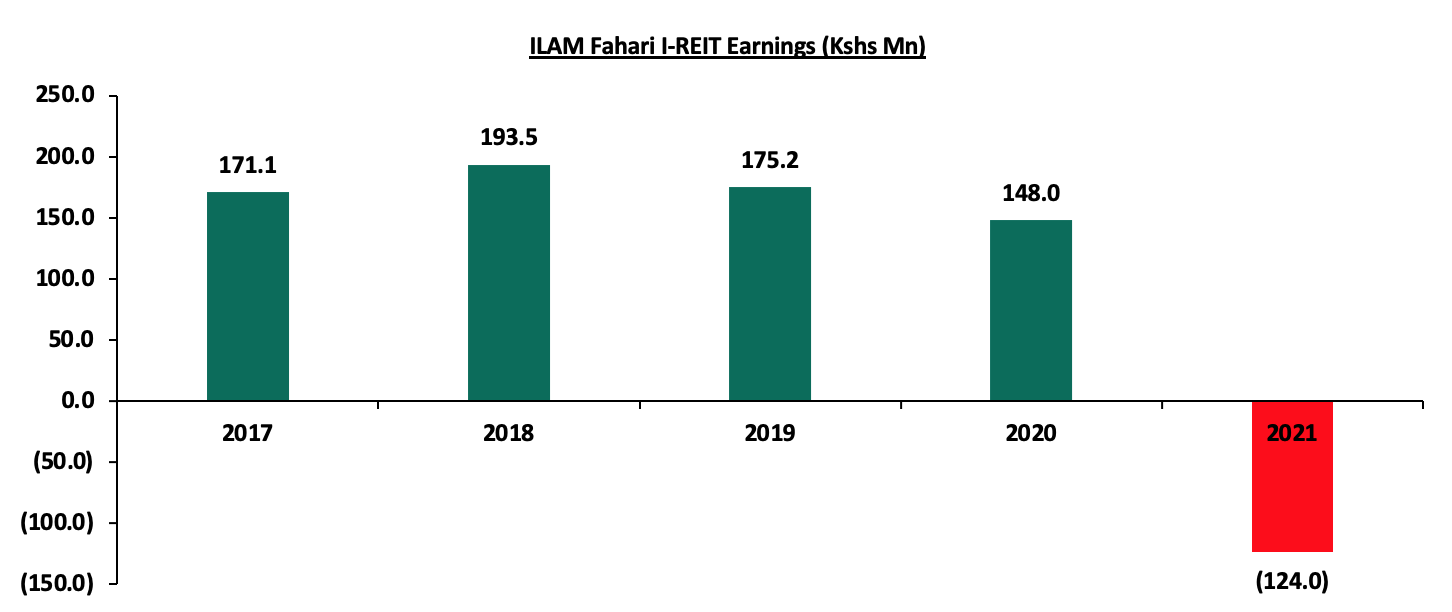
In our view, the restructuring if approved will boost the fund manager’s ability to meet financial liabilities as well as improve its performance in the coming years. We also expect increased rental income after the fund manager on-boarded Naivas Limited as the replacement anchor tenant at Nairobi’s Greenspan Mall in August 2021 and it began its operations in February 2022.
- ILAM Fahari I-REIT Performance
In the Nairobi Stock Exchange, the ILAM Fahari I-REIT closed the week trading at an average price of Kshs 6.4 per share. This represented a 6.7% Week-to-Date (WTD) increase while on a Year-to-Date (YTD) basis, the share price performance was flat. On Inception-to-Date (ITD) basis, the REIT’s performance continues to be weighed down having realized a 68.0% decline from the inception price of Kshs 20.0. The graph below shows Fahari I-REIT’s performance from November 2015 to 15th July 2022:
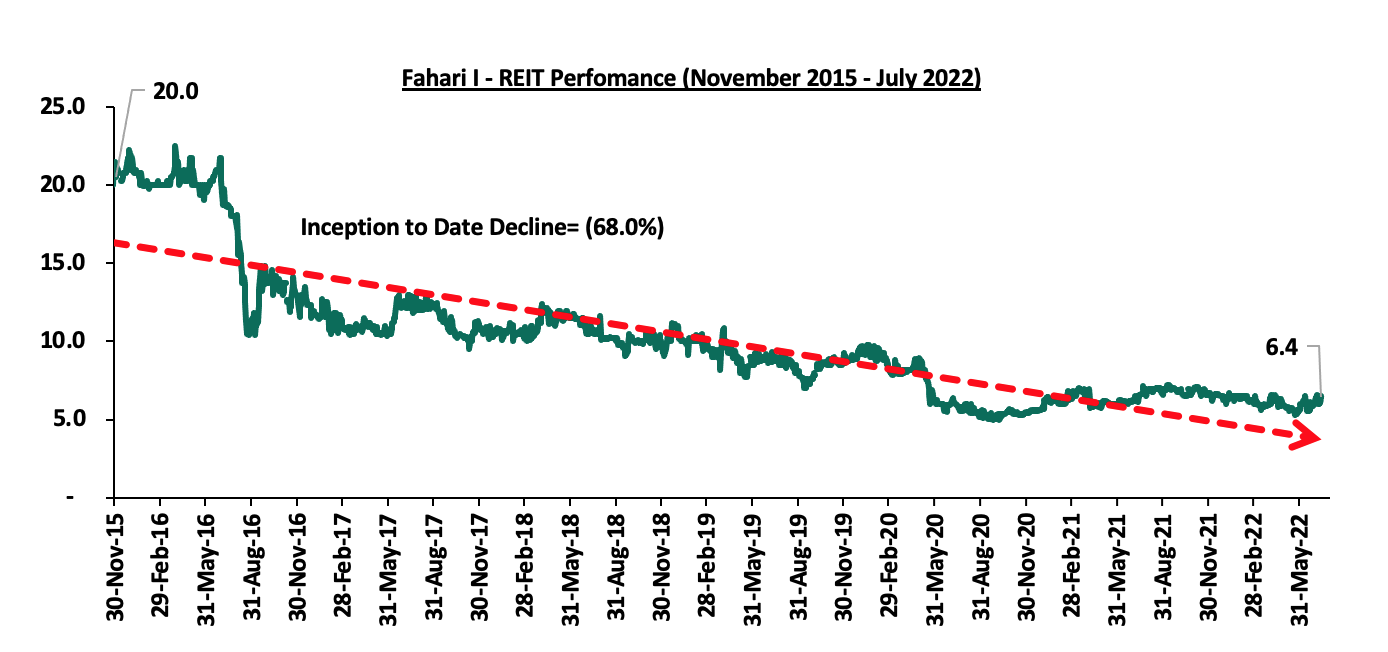
We expect Kenya’s property market to continue being shaped by government’s focus on infrastructural development across the country. However, setbacks such as negative performance of the ILAM Fahari I-REIT is expected to continue weighing down the overall investments in REITs.
In July 2021, we released the Nairobi Metropolitan Area Land Report 2021, which highlighted that the NMA land sector recorded an average annual price appreciation of 1.5% in 2020/21, with asking prices averaging at Kshs 125.5 mn, thereby realizing a 10-year capital appreciation CAGR of 10.2% from Kshs 47.5 mn recorded in 2011. The performance was mainly driven by the increased demand for land in low rise areas which recorded the highest annualized capital appreciation of 4.5% compared to a market average of 1.5%. Land prices in the commercial areas of the NMA registered the highest price correction declining by 3.6%. This was attributed to; i) their unaffordability, with average prices coming in at Kshs 404.4 mn compared to a market average of Kshs 125.5 mn, and, ii) limited development activities in the Real Estate commercial office sector resulting from oversupply of spaces thus some developers halting operations as they awaited the absorption of the existing spaces.
This week, we update our report by discussing the overall performance of the Nairobi Metropolitan Area (NMA) overtime, as well as the factors affecting the performance of the sector and then give our conclusion and outlook for the sector. We shall focus on;
- Introduction to the Nairobi Metropolitan Area (NMA) Land Sector,
- NMA Land Sector Performance 2022 Based on Various Locations,
- Summary and investment opportunity in the sector, and,
- Conclusion and Outlook for the Sector.
Section I: Introduction to the Nairobi Metropolitan Area (NMA) Land Sector
The Nairobi Metropolitan Area (NMA) land sector has continued to be resilient in its overall performance, evidenced by an improvement in performance in the past despite setbacks such as the COVID-19 pandemic, and an oversupply in select Real Estate sectors such as the commercial office and retail sectors that weigh down demand for land in the commercial zones of the NMA. Some of the factors that supported the performance of the sector in 2021/22 include;
- Rapid Infrastructure Developments: The government of Kenya continued to rapidly initiate and implement various infrastructure projects aimed at improving the economy’s performance. This in turn also boosted the performance of the Real Estate land sector through increased demand and uptake, given that infrastructure is a key element in the performance of land, and property market as a whole. Some of the projects that were completed include; the 27.1 Km Nairobi Expressway, and, 3.5 Km Mugi Road among many others, whereas the projects in the pipeline include; Athi River Machakos Turn Off, ii) Western By Pass, and, iii) Nairobi Bulk Water Supply Project, among many others,
- Positive Demographics: This is evidenced by Kenya’s relatively high urbanization and population growth rates of 4.0% p.a and 2.2% p.a, respectively, against the global average of 1.8% p.a and 1.0% p.a, respectively, as at 2021, which in turn drove the demand for development land,
- Continued Focus on the Affordable Housing Initiative: The Affordable Housing initiative continues to take shape in the country particularly in Nairobi and its environs. Consequently, the demand for development land has increased, with some of the ongoing projects being; Athi River Waterfront project, Pangani Affordable Housing Project, and, River Estate project in Ngara, among many others,
- Increased Demand for Land in the NMA satellite towns: Inadequate land within Nairobi has driven developers to source for development land in the satellite towns of Nairobi thus boosting their performance. Demand for land in the satellite towns has also been fueled by the affordability of land in the areas, compared to Nairobi suburbs, and,
- Recovery of the Economy: This has boosted the purchasing power of people following the onset of the pandemic that strained the economy, as various people lost their jobs or their business’ performance dwindled.
Contrary to the aforementioned supporting factors, the sector’s optimum performance was still weighed down by;
- Inadequate Infrastructure in some areas: Despite government’s efforts to implement and conclude infrastructure projects, there are areas with inadequate infrastructure such as water, roads, and sewer thus the optimum demand for land in these areas is affected,
- High Construction Costs: Increase in the cost of construction has led to some developers withholding or stalling their development projects due to the high cost of construction materials. This in turn has trickled down to the demand for land which is weighed down due to withheld development plans by developers, and,
- Oversupply in Select Real Estate Sectors: These sectors include the commercial office and retail sectors with oversupply of space at 6.7 mn SQFT and 3.0 mn SQFT in the NMA, respectively. With this, some developers have had to halt their development plans as they await absorption of their existing spaces.
Despite the challenges affecting the sector, some of the factors that are likely to shape it going forward include;
- Digitization of Land Records: President Uhuru Kenyatta launched the National Land Information Management System (NLIMS) in April 2021, marking the culmination of years of digitization of land records in Kenya. This was in order to curb fraud cases and ease land transaction processes, and,
- Land Reform Policies: These include regulations such as the Draft National Land Surveying and Mapping Policy, 2021 which was introduced in order to guide the practice of land surveying and mapping in various sectors of the economy, thus easing land transactions in the country. However, the 15.0% increase in the Capital Gains Tax (CGT) on transfer or sale of property by an individual or company, which was initiated in June 2022 is expected to discourage some potential property buyers from purchasing property such as land due to the high transaction costs involved.
Section II: NMA Land Sector Performance 2022 Based on Various Locations
For the analysis, we conducted research on various major towns within the NMA and classified them as follows;
- High Rise Residential Areas: They comprise of areas such as Dagoretti, Githurai, Embakasi, and Kasarani, and are majorly characterized by the numerous high-rise buildings such as the apartments found within,
- Low Rise Residential Areas: These are areas which generally consist of low-rise buildings such as the bungalows, maisonettes and villas. They include; Kitisuru, Runda, Ridgeways, Kileleshwa, Karen and Spring Valley,
- Commercial Zones: They comprise of areas such as Kilimani, Westlands, Riverside and Upperhill, and are popular because of the numerous commercial office buildings that they have, and,
- Satellite Towns: Land in the area was categorized into serviced (site and service schemes) and unserviced land. It comprises of areas such as Syokimau, Ruiru, Juja, Thika, Rongai, Athi River, and, Limuru.
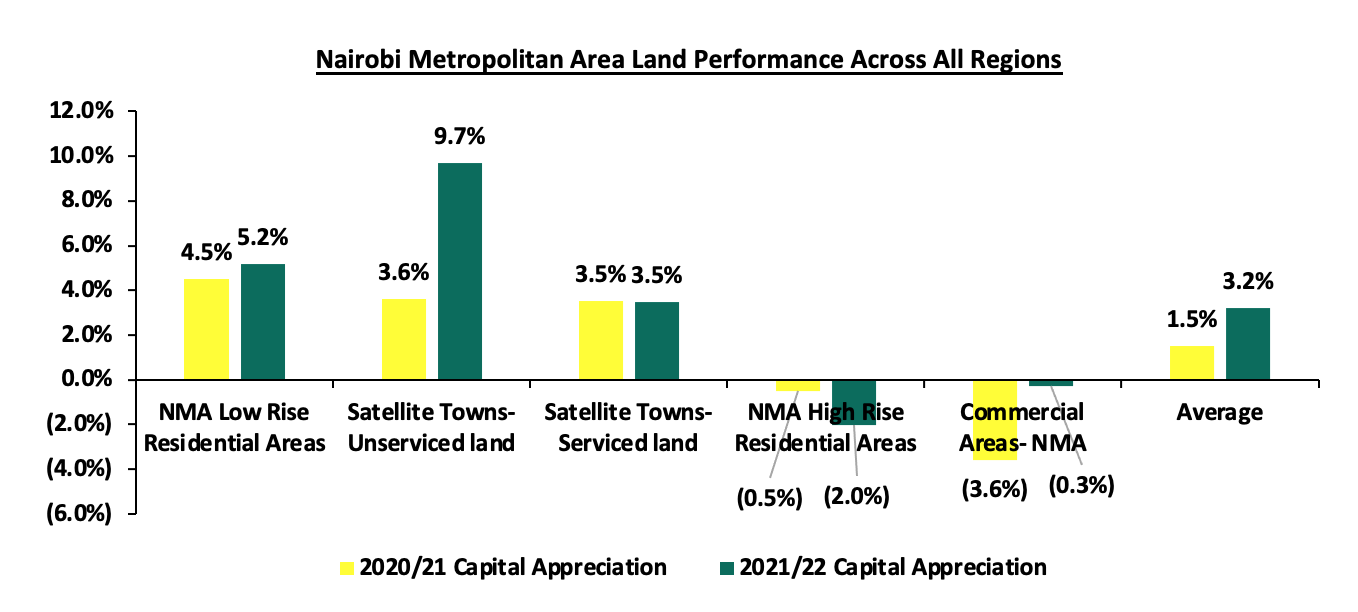
The NMA land sector recorded an improvement in performance with the average annual price appreciation coming in at 3.2% in FY 2021/22, 1.7% points higher than 1.5% appreciation recorded in FY’2020/21. The performance represented a 10-year price appreciation CAGR of 11.4%, with the average selling price for land coming in at Kshs 126.8 mn in FY’2021/22, from Kshs 47.5 mn in 2011. This signifies the continued rise in the demand for development land mainly driven by; i) rapid population and urbanization growth rates, ii) rapid infrastructure developments opening up areas for property investments, and, iii) growing popularity of the affordable housing initiative fueling demand for land particularly in the satellite towns of Nairobi. The summary of the performance is as shown below;
The table below shows the performance summary of the NMA land sector based on the average asking prices, CAGR and capital appreciation;
All values in Kshs mn unless stated otherwise
|
Summary of the Land Performance Across All regions in Nairobi Metropolitan Area |
||||||||||||
|
Location |
*Price in 2011 |
*Price in 2015 |
*Price in 2016 |
*Price in 2017 |
*Price 2018/19 |
*Price 2019/20 |
*Price 2020/21 |
*Price 2021/22 |
10-Year CAGR |
2020/21 Capital Appreciation |
2021/22 Capital Appreciation |
∆ in capital appreciation |
|
Satellite Towns-Unserviced land |
4.2 |
9.5 |
12.8 |
13.8 |
14.2 |
14.7 |
15.2 |
17.0 |
14.9% |
3.6% |
9.7% |
6.1% |
|
NMA Low Rise Residential Areas |
54.5 |
94.3 |
113.0 |
119.7 |
119.3 |
120.7 |
123.8 |
130.5 |
10.0% |
4.5% |
5.2% |
3.8% |
|
Satellite Towns-Serviced land |
5.5 |
12.7 |
14.0 |
15.0 |
15.0 |
15.0 |
15.7 |
16.1 |
12.3% |
3.5% |
3.5% |
0.0% |
|
Commercial Areas- NMA |
145.0 |
359.3 |
421.8 |
433.0 |
421.0 |
419.0 |
404.6 |
403.4 |
11.0% |
(3.6%) |
(0.3%) |
3.6% |
|
NMA High Rise Residential Areas |
28.5 |
57.5 |
65.0 |
69.8 |
68.0 |
68.8 |
68.4 |
67.0 |
8.6% |
(0.5%) |
(2.0%) |
(4.6%) |
|
Average |
47.5 |
106.7 |
125.3 |
130.3 |
127.5 |
127.6 |
125.8 |
126.8 |
11.4% |
1.5% |
3.2% |
1.7% |
Source: Cytonn Research
Performance per node:
- Satellite Towns-Unserviced Land
Unserviced land in the satellite towns of Nairobi recorded an average annualized capital appreciation of 9.7%, with Ruiru being the best performing node with a YoY capital appreciation of 19.1% attributed to; i) adequate infrastructural developments such Thika Superhighway, ii) proximity to amenities such as Spur Mall, Ruiru Sports Club, and, Kenyatta University, among others, and, iii) positive demographics fueling demand. On the other hand, Rongai and Athi River recorded price corrections of 0.7% and 2.7% to Kshs 18.9 mn and Kshs 4.4 mn, respectively, from Kshs 19.0 mn and Kshs 4.5 mn, respectively, as a result of a slight decline in the demand for land in the areas.
All values in Kshs mn unless stated otherwise
|
Land Performance-Satellite Towns in Nairobi Metropolitan Area- Unserviced Land |
||||||||||||
|
Location |
*Price in 2011 |
*Price in 2015 |
*Price in 2016 |
*Price in 2017 |
*Price 2018/19 |
*Price 2019/20 |
*Price 2020/21 |
*Price 2021/22 |
10-Year CAGR |
2020/21 Capital Appreciation |
2021/22 Capital Appreciation |
∆ in capital appreciation |
|
Ruiru |
7.0 |
15.0 |
19.0 |
20.0 |
21.0 |
22.0 |
23.6 |
28.1 |
14.9% |
6.9% |
19.1% |
12.2% |
|
Juja |
3.0 |
7.0 |
9.0 |
10.0 |
10.0 |
10.0 |
10.6 |
12.2 |
15.0% |
5.5% |
14.8% |
9.3% |
|
Utawala |
6.0 |
9.0 |
10.0 |
11.0 |
12.0 |
12.0 |
12.4 |
14.1 |
8.9% |
3.2% |
13.8% |
10.6% |
|
Limuru |
5.0 |
13.0 |
17.0 |
20.0 |
20.0 |
21.0 |
21.2 |
24.1 |
17.0% |
1.0% |
13.8% |
12.8% |
|
Ongata Rongai |
2.0 |
10.0 |
18.0 |
18.0 |
18.0 |
19.0 |
19.0 |
18.9 |
25.2% |
0.0% |
(0.7%) |
(0.7%) |
|
Athi River |
2.0 |
3.0 |
4.0 |
4.0 |
4.0 |
4.0 |
4.5 |
4.4 |
8.1% |
5.1% |
(2.7%) |
(7.8%) |
|
Average |
4.2 |
9.5 |
12.8 |
13.8 |
14.2 |
14.7 |
15.2 |
17.0 |
14.9% |
3.6% |
9.7% |
6.1% |
Source: Cytonn Research
- Nairobi Suburbs - Low Rise Residential Areas
Low-rise residential areas of Nairobi suburbs registered a 10-year CAGR of 10.0%, with asking prices coming in at Kshs 130.5 mn in FY2021/22 from the Kshs 54.5 mn recorded in 2011, whereas average YoY capital appreciation came in at 5.2% in FY’2021/22. These areas continue to remain attractive to investors due to; i) their serene environments attracting demand particularly from the high-end income earners, ii) privacy enhanced by the sparse population, iii) relatively affordable prices at Kshs 95.4 mn per acre compared to the high-rise areas averaging at Kshs 133.7 mn per acre.
In terms of performance per node, Ridgeways was the best performing with an average price appreciation of 15.5%, 10.3% points higher than the market average of 5.2% due to; i) its exclusivity driving demand for residential development land, ii) availability of development land, iii) ample infrastructure servicing the area such as Kiambu and Ridgeways Roads among others, iv) proximity to adequate amenities such as Ridgeways Mall, and Kigwa Ridge School among others, and, v) strategic location as it’s connected to high end areas like Muthaiga, and Garden Estate hence attracting investments.
All values is Kshs unless stated otherwise
|
Land Performance-Low Rise Residential Areas in Nairobi Metropolitan Area |
||||||||||||
|
Location |
*Price in 2011 |
*Price in 2015 |
*Price in 2016 |
*Price in 2017 |
*Price 2018/19 |
*Price 2019/20 |
*Price 2020/21 |
*Price 2021/22 |
10-Year CAGR |
2020/21 Capital Appreciation |
2021/22 Capital Appreciation |
∆ in capital appreciation |
|
Ridgeways |
24.0 |
51.0 |
62.0 |
68.0 |
65.0 |
66.0 |
68.8 |
81.4 |
13.0% |
4.0% |
15.5% |
11.5% |
|
Kitisuru |
32.0 |
59.0 |
70.0 |
70.0 |
71.0 |
73.0 |
77.9 |
90.3 |
10.9% |
6.3% |
13.7% |
7.4% |
|
Runda |
33.0 |
58.0 |
67.0 |
68.0 |
68.0 |
70.0 |
74.3 |
81.7 |
9.5% |
3.8% |
9.0% |
5.2% |
|
Karen |
25.0 |
40.0 |
46.0 |
52.0 |
53.0 |
56.0 |
59.6 |
62.0 |
9.5% |
5.1% |
3.8% |
(1.3%) |
|
Kileleshwa |
149.0 |
227.0 |
286.0 |
306.0 |
311.0 |
303.0 |
300.9 |
305.8 |
7.5% |
(0.7%) |
1.6% |
2.3% |
|
Spring Valley |
64.0 |
131.0 |
147.0 |
154.0 |
148.0 |
156.0 |
161.0 |
161.7 |
9.7% |
3.1% |
0.4% |
(2.7%) |
|
Average |
54.5 |
94.3 |
113.0 |
119.7 |
119.3 |
120.7 |
123.8 |
130.5 |
10.0% |
4.5% |
5.2% |
3.8% |
Source: Cytonn Research
- Satellite Towns - Serviced Land
Serviced land in the satellite towns of Nairobi recorded an average annualized capital appreciation of 3.5% with Syokimau being the best performing area recording an average annualized capital appreciation of 17.5%. This was mainly driven by; i) its strategic location along the recently completed Nairobi Expressway project promoting investments, ii) presence of the commuter train station making it easier for people to navigate various areas whilst avoiding traffic along the busy Mombasa Road, iii) relatively affordable land prices which came in at Kshs 13.9 mn per acre against the market average of Kshs 16.1 mn per acre, and iv) presence of a growing middle income class driving demand for land investments. On the other hand, Ruai recorded a price correction of 13.9% attributed to reduced demand of land as investors focused on areas witnessing more Real Estate related activities.
|
Land Performance-Satellite Towns in Nairobi Metropolitan Area- Serviced Land |
||||||||||||
|
Location |
*Price in 2011 |
*Price in 2015 |
*Price in 2016 |
*Price in 2017 |
*Price 2018/19 |
*Price 2019/20 |
*Price 2020/21 |
*Price 2021/22 |
10-Year CAGR |
2020/21 Capital Appreciation |
2021/22 Capital Appreciation |
∆ in capital appreciation |
|
Syokimau-Mlolongo |
3.0 |
12.0 |
12.0 |
12.0 |
12.0 |
12.0 |
11.8 |
13.9 |
16.5% |
(1.4%) |
17.5% |
18.9% |
|
Thika |
5.0 |
7.0 |
8.0 |
10.0 |
10.0 |
10.0 |
10.4 |
11.6 |
8.8% |
3.5% |
11.5% |
8.0% |
|
Ruiru-Juja |
8.0 |
18.0 |
19.0 |
21.0 |
23.0 |
24.0 |
25.3 |
25.9 |
12.4% |
5.2% |
2.2% |
(3.0%) |
|
Ongata Rongai |
7.0 |
16.0 |
19.0 |
19.0 |
19.0 |
18.0 |
20.0 |
20.4 |
11.3% |
8.9% |
1.8% |
(7.1%) |
|
Athi River |
2.0 |
11.0 |
13.0 |
13.0 |
12.0 |
12.0 |
13.1 |
13.3 |
20.9% |
8.7% |
1.6% |
(7.1%) |
|
Ruai |
8.0 |
12.0 |
13.0 |
15.0 |
14.0 |
14.0 |
13.5 |
11.6 |
3.8% |
(3.6%) |
(13.9%) |
(10.3%) |
|
Average |
5.5 |
12.7 |
14.0 |
15.0 |
15.0 |
15.0 |
15.7 |
16.1 |
12.3% |
3.5% |
3.5% |
0.0% |
Source: Cytonn Research
- Nairobi Suburbs - Commercial Zones
Land in the commercial zones realized a price correction of 0.3% in their asking prices which came in at Kshs 403.4 mn in H1’2022, from the Kshs 404.6 mn that was recorded in H1’2021. Riverside and Westlands were the best performing nodes with capital appreciations of 2.2% and 1.1%, respectively, due to increased demand for development land in the areas driven by; their close proximity to the Nairobi CBD, presence of various international organizations, and, infrastructure developments such as the Riverside Drive and Nairobi Expressway promoting accessibility. Some of the ongoing projects in these areas include: The Cube and Sandalwood commercial office projects both located in Riverside, and, One Principal Place and the Piano commercial office projects both located in Westlands. On the other hand, Upper hill and Kilimani realized price corrections of 3.2% and 0.3%, respectively, due to declined demand for development resulting from expensive land in the area.
All values in Kshs mn unless stated otherwise
|
Land Performance-Commercial Zones in Nairobi Metropolitan Areas |
||||||||||||
|
Location |
*Price in 2011 |
*Price in 2015 |
*Price in 2016 |
*Price in 2017 |
*Price 2018/19 |
*Price 2019/20 |
*Price 2020/21 |
*Price 2021/22 |
10-Year CAGR |
2020/21 Capital Appreciation |
2021/22 Capital Appreciation |
∆ in capital appreciation |
|
Riverside |
116.0 |
343.0 |
362.0 |
361.0 |
363.0 |
351.0 |
335.7 |
343.1 |
11.5% |
(4.6%) |
2.2% |
6.8% |
|
Westlands |
150.0 |
350.0 |
453.0 |
474.0 |
430.0 |
421.0 |
413.6 |
418.3 |
10.8% |
(1.8%) |
1.1% |
2.9% |
|
Kilimani |
114.0 |
294.0 |
360.0 |
387.0 |
403.0 |
398.0 |
381.7 |
380.4 |
12.8% |
(4.3%) |
(0.3%) |
4.0% |
|
Upper Hill |
200.0 |
450.0 |
512.0 |
510.0 |
488.0 |
506.0 |
487.3 |
471.9 |
9.0% |
(3.8%) |
(3.2%) |
0.6% |
|
Average |
145.0 |
359.3 |
421.8 |
433.0 |
421.0 |
419.0 |
404.6 |
403.4 |
11.0% |
(3.6%) |
(0.3%) |
3.6% |
Source: Cytonn Research
- Nairobi Suburbs – High Rise Residential Areas
The asking prices for land in the high-rise residential areas of the NMA recorded an overall 2.0% price correction, with prices coming in at Kshs 67.0 mn in FY’2021/22 from Kshs 68.4 mn that was realized in FY’2020/21. The decline in performance was mainly driven by the reduced demand for land in these areas, as a result of the inadequate land for development.
All values in Kshs mn unless stated otherwise
|
Land Performance-High Rise Residential Areas in Nairobi Metropolitan Area |
||||||||||||
|
Location |
*Price in 2011 |
*Price in 2015 |
*Price in 2016 |
*Price in 2017 |
*Price 2018/19 |
*Price 2019/20 |
*Price 2020/21 |
*Price 2021/22 |
10-Year CAGR |
2020/21 Capital Appreciation |
2021/22 Capital Appreciation |
∆ in capital appreciation |
|
Dagoretti |
28.0 |
81.0 |
95.0 |
99.0 |
100.0 |
103.0 |
95.2 |
95.2 |
13.0% |
(3.3%) |
0.0% |
3.3% |
|
Embakasi |
33.0 |
61.0 |
60.0 |
70.0 |
61.0 |
63.0 |
67.2 |
66.9 |
7.3% |
6.3% |
(0.5%) |
(6.8%) |
|
Kasarani |
32.0 |
51.0 |
60.0 |
64.0 |
66.0 |
65.0 |
67.7 |
66.9 |
7.7% |
3.9% |
(1.2%) |
(5.1%) |
|
Githurai |
21.0 |
37.0 |
45.0 |
46.0 |
45.0 |
44.0 |
43.5 |
39.1 |
6.4% |
(1.2%) |
(11.2%) |
(10.0%) |
|
Average |
28.5 |
57.5 |
65.0 |
69.8 |
68.0 |
68.8 |
68.4 |
67.0 |
8.6% |
(0.5%) |
(2.0%) |
(4.6%) |
Source: Cytonn Research
Section III: Summary and Investment Opportunity in the Sector
The table below summarizes the performance of the various areas:
|
Summary and Conclusions- y/y Capital Appreciation Nairobi Metropolitan Area |
|
|
Unserviced Land Capital Appreciation |
|
|
FY’2021/22 |
Areas |
|
>5.0% |
Ruiru, Juja, Kitisuru, Runda, Ridgeways, Limuru, Utawala |
|
1.0%- 4.9% |
Kileleshwa, Riverside, Westlands, Karen |
|
0.0% |
Dagoretti |
|
<1.0% |
Embakasi, Kasarani, Githurai, Kilimani, Upper Hill, Spring Valley, Rongai, Athi River |
|
Site and Service Capital Appreciation |
|
|
FY’2021/22 |
Areas |
|
>5.0% |
Syokimau-Mlolongo, Thika |
|
1.0%- 4.9% |
Ruiru-Juja, Rongai, Athi River |
|
<1.0% |
Ruai, |
Source: Cytonn Research
Investment Opportunity
- Satellite Towns (Unserviced land)- The investment opportunity in this segment lies in Ruiru, and Juja, submarkets which registered the highest YoY capital returns at 19.1% and 14.8%, respectively, against a market average of 9.7%. The remarkable performance was mainly driven by i) the availability of adequate infrastructure promoting investment opportunities such as Thika superhighway, ii) relatively affordable land prices, and, iii) the increased demand for land to develop student housing facilities as these areas host various institutions such as the Zetech College, Kenyatta University, and, the Jomo Kenyatta University among many others,
- Low Rise Residential Areas- The investment opportunity in this segment lies in Ridgeways and Kitisuru which recorded the highest annual capital appreciations of 15.5% and 13.7%, respectively, against the market average of 5.2%. The performance was driven by the relatively high demand resulting from their exclusivity, prime locations attracting high net worth investments, availability of development land, and, adequate infrastructure and amenities such as the Kigwa, Ridgeways, and, Kitisuru roads,
- Satellite Towns (Serviced Land)- Syokimau/Mlolongo and Thika present the best investment opportunity having recorded capital appreciations of 17.5% and 11.5%, respectively, against the 3.5% market average. The performance was supported by; i) rapid demand driven by the existing growing middle income class earners, ii) availability of major infrastructure developments such as the commuter train station in Syokimau, Thika Superhighway, and Nairobi Expressway among others, iii) availability of ample amenities such as water and electricity, and, iv) relatively affordable land prices,
- Commercial Zones- Riverside and Westlands present the best investment opportunity in this segment having registered a 2.2% and 1.1% increase in prices in FY’2021/22, respectively, driven by; adequate infrastructure opening areas for investments such as the Nairobi Expressway, adequate amenities such as the GTC Mall among others, and, their close proximity to Nairobi’s Central Business District (CBD), and,
- High Rise Residential Areas- Dagoretti presents the better investment opportunity in this segment with a stable performance having maintained its FY’2020/21 performance, compared to other areas such as Embakasi, Kasarani, and Githurai which recorded price corrections of 0.5%, 1.2%, and, 11.2%, respectively.
Section IV: Conclusion and Outlook for the Sector
|
Indicator |
2021 Projections |
2022 Projections |
2021 Outlook |
2022 Outlook |
|
Infrastructure Development |
|
|
Positive |
Positive |
|
Legal Reforms |
|
|
Positive |
Positive |
|
Credit Supply |
|
|
Negative |
Negative |
|
Real Estate Activities |
|
|
Neutral |
Neutral |
|
Land Sector Performance |
|
|
Positive |
Positive |
We have three positive outlooks; for infrastructure development, legal reforms and land sector performance, one neutral outlook for Real Estate activities and one negative outlook for credit supply thereby bringing our overall outlook for the sector to POSITIVE. We expect the performance to be further boosted by factors driving demand for development land such as; i) Increased infrastructure developments, ii) Roll out of numerous affordable housing projects, iii) Affordability of land in the satellite towns, and, iii) Rapid urbanization and population growth rates at 4.0% p.a and 2.2% p.a, respectively, against the global average of 1.8% p.a and 1.0% p.a, respectively.
Disclaimer: The views expressed in this publication are those of the writers where particulars are not warranted. This publication, which is in compliance with Section 2 of the Capital Markets Authority Act Cap 485A, is meant for general information only and is not a warranty, representation, advice or solicitation of any nature. Readers are advised in all circumstances to seek the advice of a registered investment advisor.

- Talk to us
- Kenya
- P.O Box 20695 - 00200, Nairobi, Kenya
- Cell +254709101200
- Tel +254709101200
- WhatsApp +254741676635
- United States
- +254709101200
- DOWNLOAD OUR APP
-


- Kenya
- 8th Floor, Pinetree Plaza, Kaburu Drive, Ngong Road, Nairobi, Kenya
- USA
- Suite 1150, 1775 Eye Street NW, USA, Washington DC 20006, USA
- Investments
- High Yield
- Private Equity
- Real Estate
- Real Estate
- RiverRun Estates
- Cytonn Towers
- The Ridge
- Taraji Heights
- The Alma