Nairobi Metropolitan Area (NMA) Commercial Office Report 2024, & Cytonn Weekly #11/2024
By Research Team, Mar 17, 2024
Executive Summary
Fixed Income
During the week, T-bills were undersubscribed, with the overall undersubscription rate coming in at 93.5%, a reversal from the oversubscription rate of 174.2% recorded the previous week. Investors’ preference for the shorter 91-day paper persisted, with the paper receiving bids worth Kshs 14.1 bn against the offered Kshs 4.0 bn, translating to an oversubscription rate of 351.4%, lower than the oversubscription rate of 515.5% recorded the previous week. The subscription rates for the 182-day paper and 364-day paper decreased significantly to 36.0% and 47.7% respectively from 100.6% and 111.3% respectively recorded the previous week. The government accepted a total of Kshs 19.8 bn worth of bids out of Kshs 22.4 bn of bids received, translating to an acceptance rate of 88.5%. The yields on the government papers continued to rise, with the yields on the 364-day, 182-day, and 91-day papers increasing by 0.4 bps, 4.2 bps, and 3.8 bps to 17.0%, 16.9%, and 16.7%, respectively;
During the week, the Energy and Petroleum Regulatory Authority (EPRA) released their monthly statement on the maximum retail fuel prices in Kenya, effective from 15th March 2024 to 14th April 2024. Notably, the maximum allowed price for Super Petrol, Diesel and Kerosene decreased by Kshs 7.2, Kshs 5.1, and Kshs 4.5 each respectively, and will retail at Kshs 199.2, Kshs 190.4, and Kshs 188.7 per litre respectively from the February 2024 prices of Kshs 206.4, Kshs 195.5 and Kshs 193.2 respectively;
During the week, the National Treasury gazetted the revenue and net expenditures for the eighth month of FY’2023/2024, ending 29th February 2024, highlighting that the total revenue collected as at the end of February 2024 amounted to Kshs 1,424.9 bn, equivalent to 55.3% of the revised estimates of Kshs 2,576.8 bn for FY’2023/2024 and is 82.9% of the prorated estimates of Kshs 1,717.8 bn;
Ghanaian authorities and international bondholders are poised to engage in crucial talks this week to navigate the complexities of restructuring approximately USD 13.0 bn of defaulted global debt. This effort marks the start of formal talks to restructure Ghana’s debt to private international bondholders;
Equities
During the week, the equities market was on an upward trajectory, with NSE 10 gaining the most by 7.9%, while NASI, NSE 25, and NSE 20 gained by 7.3%, 7.0%, and 5.2% respectively, taking the YTD performance to gains of 10.7%, 8.5%, 13.2%, and 14.3% for NASI, NSE 20, NSE 25, and NSE 10 respectively. The equities market performance was driven by gains recorded by large-cap stocks such as KCB Group, SCBK, and Co-operative Bank of 15.9%, 12.6%, and 10.6% respectively. The gains were, however, weighed down by losses recorded by large-cap stocks such as Stanbic Bank and BAT of 1.5% and 0.3% respectively;
During the week, Standard Chartered Bank released their FY’2023 financial results, highlighting that Core earnings per share (EPS) grew by 16.4% to Kshs 36.6, from Kshs 31.5 in FY’2022, driven by the 22.8% growth in total operating income to Kshs 41.7 bn, from Kshs 34.0 bn in FY’2022;
Real Estate
During the week, the Kenya National Bureau of Statistics (KNBS) released the Leading Economic Indicators (LEI) January 2024 Report which highlighted that on a year-on-year (y/y) basis, the number of international arrivals recorded a 25.6% increase to 1,505,876 persons in 2023, compared to 1,198,727 persons recorded in 2022. However, on a quarter-on-quarter (q/q) basis, the performance represented an 11.5% decrease to 399,302 persons in Q4’2023, from 451,441 persons recorded in Q3’2023. Additionally, in the month of January, the number of arrivals stood at 134,665 persons. The performance represented an 18.1% increase, compared to 114,048 persons recorded during a similar period in 2023;
In the residential sector, Kiambu County initiated a Kshs 1.0 bn infrastructure development plan aimed at upgrading slums as part of phase two of the Kenya Informal Settlement Improvement Project (KISIP). This initiative will be carried out through a partnership with the State Department of Housing and Urban Development. Additionally, President William Ruto laid the foundation for the Talai Ainamoi Affordable Housing Project in Ainamoi Constituency, Kericho County. The project will be constructed on a 5-acre piece of land in the first phase and will incorporate 320 housing units;
On the Unquoted Securities Platform, Acorn D-REIT and I-REIT traded at Kshs 24.4 and Kshs 21.7 per unit, respectively, as of 15th March 2024. The performance represented a 22.0% and 8.3% gain for the D-REIT and I-REIT, respectively from the Kshs 20.0 inception price;
Focus of the Week
In 2023, we published the Nairobi Metropolitan Area Commercial Office Report 2023 themed ‘Persisting Tenant’s Market’. The report provided an in-depth analysis of the sector's performance in 2022, along with insights into future prospects and investment opportunities. According to the report, the sector experienced notable improvements, with average rental yields reaching 7.6% in 2022, up by 0.3% points from the 7.3% recorded in 2021, attributable to increased occupancy and rental rates. Occupancy rates also saw a significant uptick, rising by 1.8% points to reach 79.4% in 2022, compared to 77.6% in 2021. Despite some firms continuing to adopt work-from-home policies, the demand for office space remained robust as more firms resumed full operations. Asking rents and prices increased to an average of Kshs 96 and Kshs 12,223 per SQFT respectively in 2022, from Kshs 94 and Kshs 12,106 per SQFT, respectively, recorded in 2021. Moreover, the market was characterized by an oversupply of 5.8 mn SQFT in office spaces, which persisted and restrained the sector's overall performance. However, this was an improvement from the 6.7 mn SQFT oversupply in 2021 attributable to heightened demand for physical office spaces, with many businesses returning to full office operations and others opting for a hybrid work policy following the transition from remote work. In 2024, we update our previous research with the Commercial Office Report 2024 themed ‘Shifting Landscapes’, in order to determine the market’s performance and analyse the ongoing trends;
Investment Updates:
- Weekly Rates:
- Cytonn Money Market Fund closed the week at a yield of 17.03% p.a. To invest, dial *809# or download the Cytonn App from Google Play store here or from the Appstore here;
- We continue to offer Wealth Management Training every Monday, from 10:00 am to 12:00 pm. The training aims to grow financial literacy among the general public. To register for any of our Wealth Management Trainings, click here;
- If interested in our Private Wealth Management Training for your employees or investment group, please get in touch with us through wmt@cytonn.com;
- Cytonn Insurance Agency acts as an intermediary for those looking to secure their assets and loved ones’ future through insurance namely; Motor, Medical, Life, Property, WIBA, Credit and Fire and Burglary insurance covers. For assistance, get in touch with us through insuranceagency@cytonn.com;
- Cytonn Asset Managers Limited (CAML) continues to offer pension products to meet the needs of both individual clients who want to save for their retirement during their working years and Institutional clients that want to contribute on behalf of their employees to help them build their retirement pot. To more about our pension schemes, kindly get in touch with us through pensions@cytonn.com;
Real Estate Updates:
- For more information on Cytonn’s real estate developments, email us at sales@cytonn.com;
- Phase 3 of The Alma is now ready for occupation and the show house is open daily. To join the waiting list to rent, please email properties@cytonn.com;
- For Third Party Real Estate Consultancy Services, email us at rdo@cytonn.com;
- For recent news about the group, see our news section here;
Hospitality Updates:
- We currently have promotions for Staycations. Visit cysuites.com/offers for details or email us at sales@cysuites.com;
Money Markets, T-Bills Primary Auction:
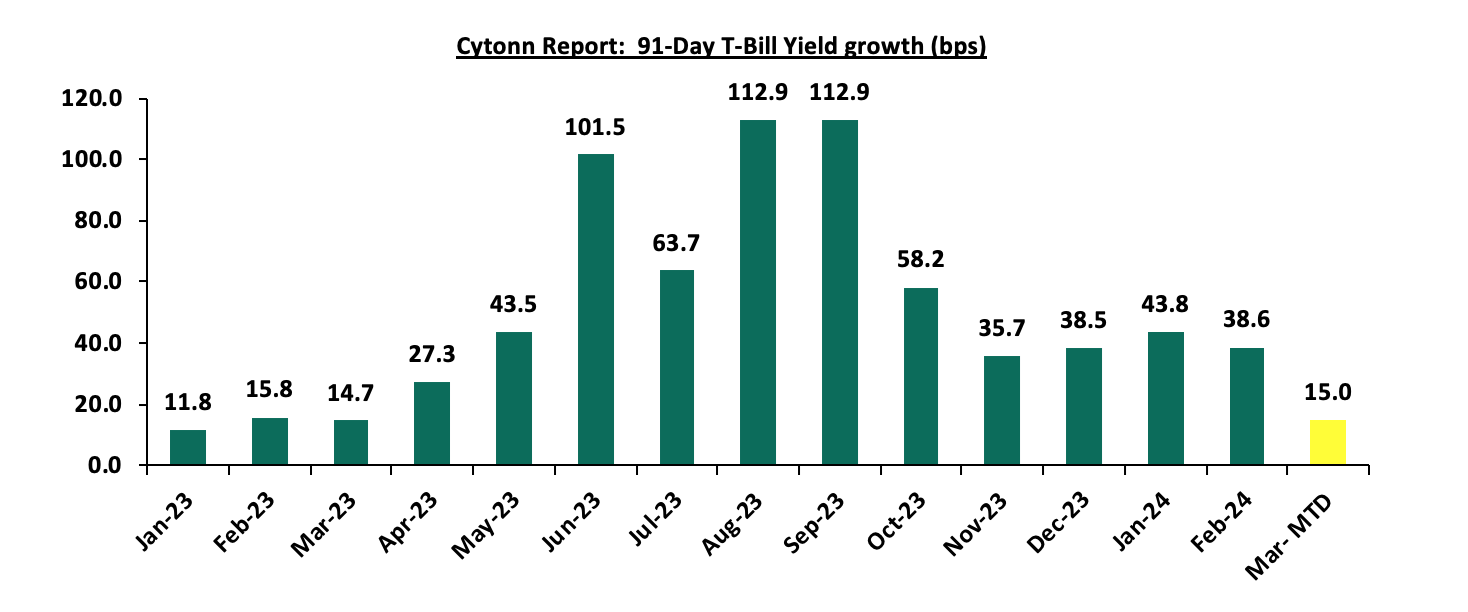
During the week, T-bills were undersubscribed, with the overall undersubscription rate coming in at 93.5%, a reversal from the oversubscription rate of 174.2% recorded the previous week. Investors’ preference for the shorter 91-day paper persisted, with the paper receiving bids worth Kshs 14.1 bn against the offered Kshs 4.0 bn, translating to an oversubscription rate of 351.4%, lower than the oversubscription rate of 515.5% recorded the previous week. The subscription rates for the 182-day paper and 364-day paper decreased significantly to 36.0% and 47.7% respectively from 100.6% and 111.3% respectively, recorded the previous week. The government accepted a total of Kshs 19.8 bn worth of bids out of Kshs 22.4 bn of bids received, translating to an acceptance rate of 88.5%. The yields on the government papers continued to rise, with the yields on the 364-day, 182-day, and 91-day papers increasing by 0.4 bps, 4.2 bps, and 3.8 bps to 17.0%, 16.9%, and 16.7%, respectively. The chart below shows the yield growth rate for the 91-day paper over the period:
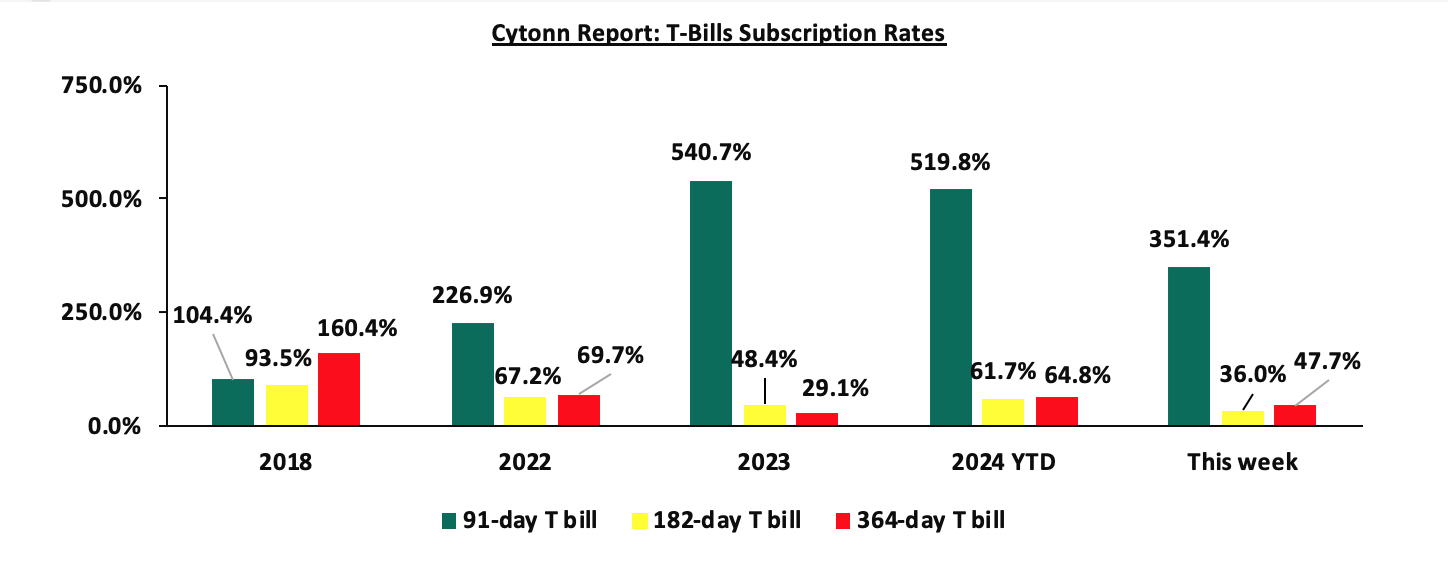
The chart below compares the overall average T-bill subscription rates obtained in 2018, 2022, 2023, and 2024 Year-to-date (YTD) and this week:
Money Market Performance:
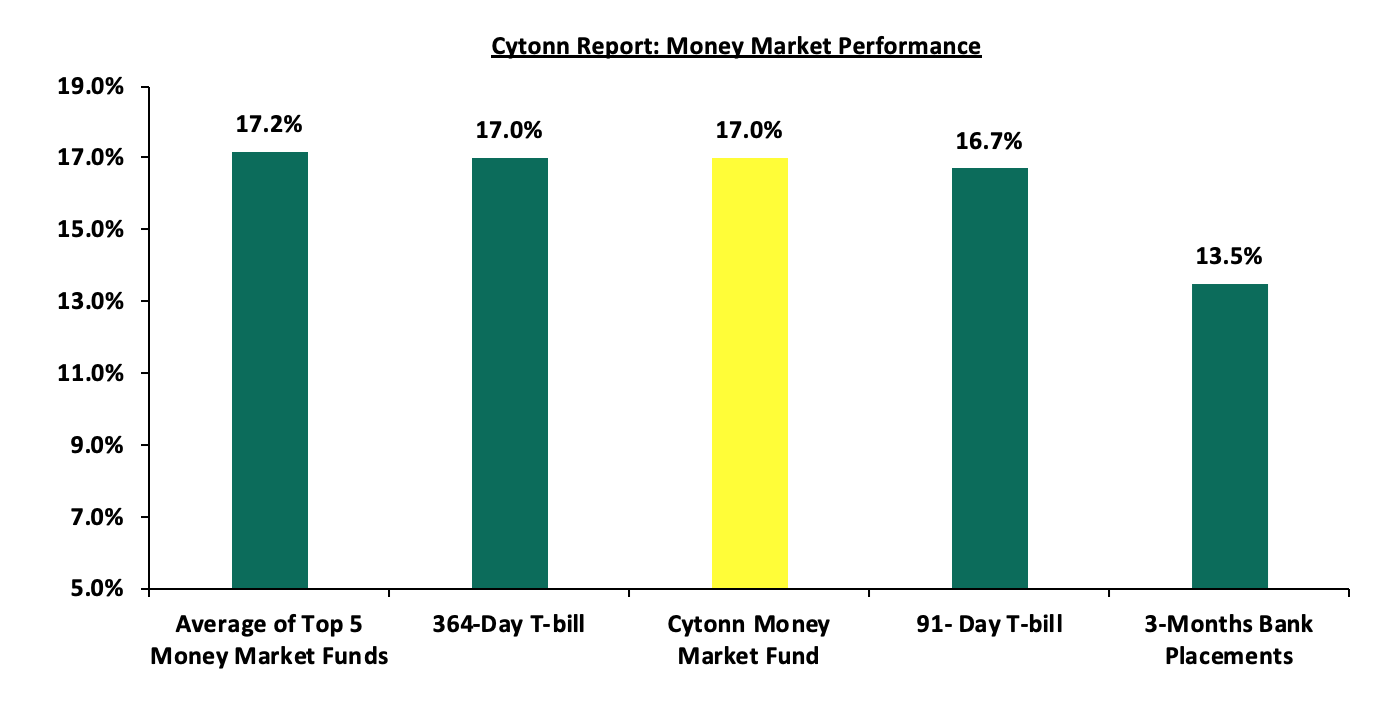
In the money markets, 3-month bank placements ended the week at 13.5% (based on what we have been offered by various banks), and the yields on the 364-day and 91-day papers increased by 0.4 bps and 3.8 bps to 17.0% and 16.7%, respectively. The yields of the Cytonn Money Market Fund increased marginally by 5.0 bps to 17.0% from the 16.9% recorded the previous week, while the average yields on the Top 5 Money Market Funds increased marginally by 4.4 bps to 17.2% from the 17.1% recorded the previous week.
The table below shows the Money Market Fund Yields for Kenyan Fund Managers as published on 15th March 2024:
|
Cytonn Report: Money Market Fund Yield for Fund Managers as published on 15th March 2024 |
||
|
Rank |
Fund Manager |
Effective Annual Rate |
|
1 |
Etica Money Market Fund |
17.8% |
|
2 |
Lofty-Corban Money Market Fund |
17.7% |
|
3 |
Cytonn Money Market Fund (Dial *809# or download the Cytonn App) |
17.0% |
|
4 |
Nabo Africa Money Market Fund |
16.7% |
|
5 |
GenAfrica Money Market Fund |
16.7% |
|
6 |
Apollo Money Market Fund |
15.9% |
|
7 |
Enwealth Money Market Fund |
15.9% |
|
8 |
Kuza Money Market fund |
15.8% |
|
9 |
Madison Money Market Fund |
15.5% |
|
10 |
Mali Money Market Fund |
15.4% |
|
11 |
Co-op Money Market Fund |
15.1% |
|
12 |
Jubilee Money Market Fund |
15.1% |
|
13 |
Absa Shilling Money Market Fund |
14.9% |
|
14 |
KCB Money Market Fund |
14.8% |
|
15 |
AA Kenya Shillings Fund |
14.8% |
|
16 |
GenCap Hela Imara Money Market Fund |
14.8% |
|
17 |
Sanlam Money Market Fund |
14.5% |
|
18 |
Mayfair Money Market Fund |
14.5% |
|
19 |
Equity Money Market Fund |
13.9% |
|
20 |
Orient Kasha Money Market Fund |
13.8% |
|
21 |
Dry Associates Money Market Fund |
13.6% |
|
22 |
Old Mutual Money Market Fund |
13.4% |
|
23 |
CIC Money Market Fund |
12.7% |
|
24 |
ICEA Lion Money Market Fund |
12.3% |
|
25 |
British-American Money Market Fund |
10.0% |
Source: Business Daily
Liquidity:
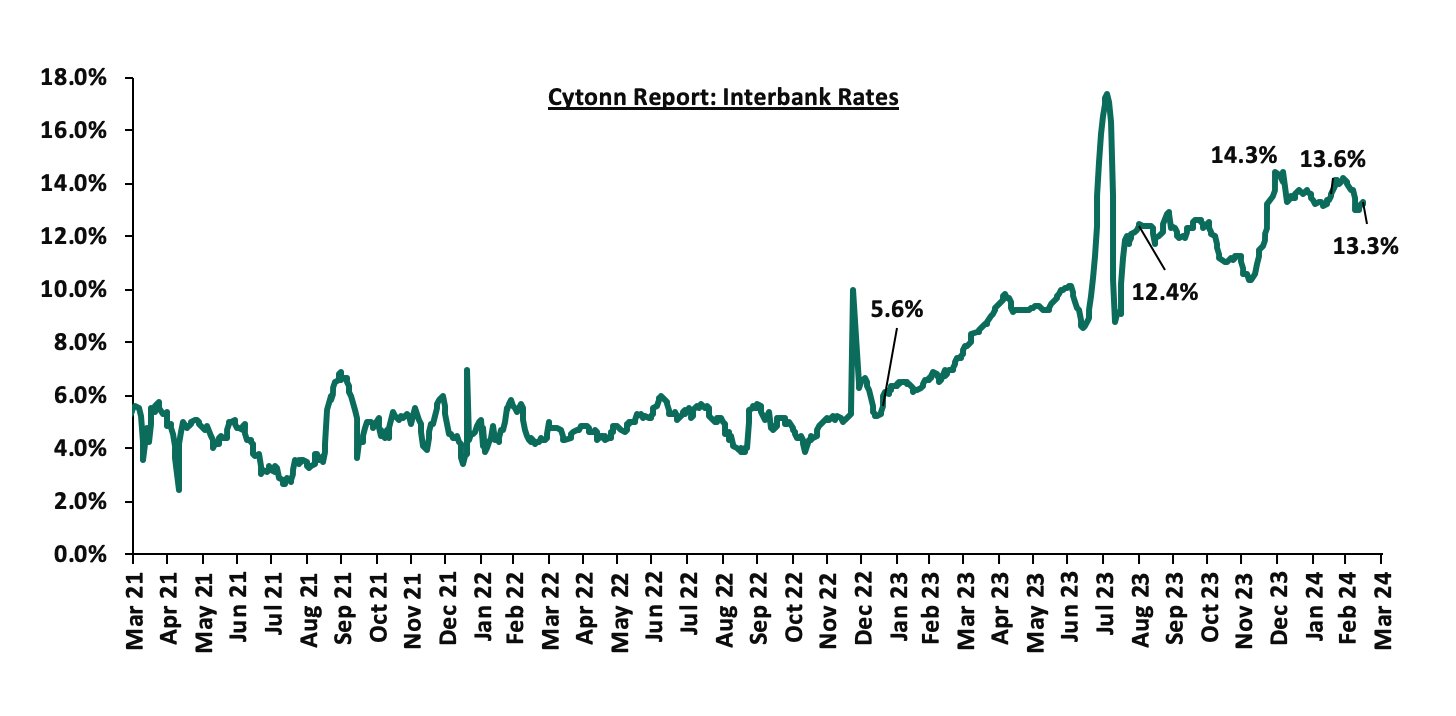
During the week, liquidity in the money markets eased, with the average interbank rate decreasing by 36.8 bps to 13.2% from 13.6% recorded the previous week, partly attributable to government payments that offset tax remittances. The average interbank volumes traded increased significantly by 45.3% to Kshs 29.9 bn from Kshs 20.5 bn recorded the previous week. The chart below shows the interbank rates in the market over the years:
Kenya Eurobonds:
During the week, the yields on Kenya’s Eurobonds recorded mixed performance, with the yields on the 10-year Eurobond issued in 2018 decreasing the most by 15.2 bps to 9.1% from 9.2% recorded the previous week, while the yields on the recent 6-year issue increased marginally by 2.7 bps, to remain relatively unchanged at 9.5%. The table below shows the summary of the performance of the Kenyan Eurobonds as of 14th March 2024;
|
Cytonn Report: Kenya Eurobonds Performance |
||||||
|
|
2018 |
2019 |
2021 |
2024 |
||
|
Tenor |
10-year issue |
30-year issue |
7-year issue |
12-year issue |
12-year issue |
6-year issue |
|
Amount Issued (USD) |
1.0 bn |
1.0 bn |
0.9 bn |
1.2 bn |
1.0 bn |
1.5 bn |
|
Years to Maturity |
4.0 |
24.0 |
3.2 |
8.2 |
10.3 |
6.0 |
|
Yields at Issue |
7.3% |
8.3% |
7.0% |
7.9% |
6.2% |
10.4% |
|
01-Jan-24 |
9.8% |
10.2% |
10.1% |
9.9% |
9.5% |
|
|
01-Mar-24 |
9.5% |
10.3% |
9.2% |
9.9% |
9.8% |
9.8% |
|
07-Mar-24 |
9.2% |
10.2% |
8.9% |
9.7% |
9.6% |
9.5% |
|
08-Mar-24 |
9.0% |
10.0% |
8.6% |
9.5% |
9.5% |
9.5% |
|
11-Mar-24 |
9.2% |
10.1% |
8.8% |
9.6% |
9.6% |
9.5% |
|
12-Mar-24 |
9.2% |
10.2% |
8.9% |
9.7% |
9.7% |
9.6% |
|
13-Mar-24 |
9.0% |
10.1% |
8.8% |
9.6% |
9.5% |
9.4% |
|
14-Mar-24 |
9.1% |
10.1% |
8.9% |
9.6% |
9.6% |
9.5% |
|
Weekly Change |
(0.2%) |
(0.1%) |
(0.1%) |
(0.0%) |
- |
0.0% |
|
MTD Change |
(0.5%) |
(0.3%) |
(0.4%) |
(0.3%) |
(0.3%) |
(0.4%) |
|
YTD Change |
(0.9%) |
(0.1%) |
(1.3%) |
(0.3%) |
0.0% |
9.4% |
Source: Central Bank of Kenya (CBK) and National Treasury
Kenya Shilling:
During the week, the Kenya Shilling gained against the US Dollar by 5.4%, to close at Kshs 135.1, from Kshs 142.8 recorded the previous week. On a year-to-date basis, the shilling has appreciated by 13.9% against the dollar, a contrast to the 26.8% depreciation recorded in 2023.
We expect the shilling to be supported by:
- Diaspora remittances standing at a cumulative USD 4,330.0 mn in the 12 months to February 2024, 7.5% higher than the USD 4,026.0 mn recorded over the same period in 2023, which has continued to cushion the shilling against further depreciation. In the January 2024 diaspora remittances figures, America remained the largest source of remittances to Kenya accounting for 54.0% in the period, and,
- The tourism inflow receipts which came in at USD 333.9 mn in 2023, a 24.6% increase from USD 268.1 mn inflow receipts recorded in 2022, and owing to tourist arrivals that improved by 30.7% to 192,000 in the 12 months to December 2023, from 161,000 recorded during a similar period in 2022.
The shilling is however expected to remain under pressure in 2024 as a result of:
- An ever-present current account deficit which came at 3.5% of GDP in Q3’2023 from 6.4% recorded in a similar period in 2022,
- The need for government debt servicing, continues to put pressure on forex reserves given that 67.5% of Kenya’s external debt was US Dollar denominated as of September 2023, and,
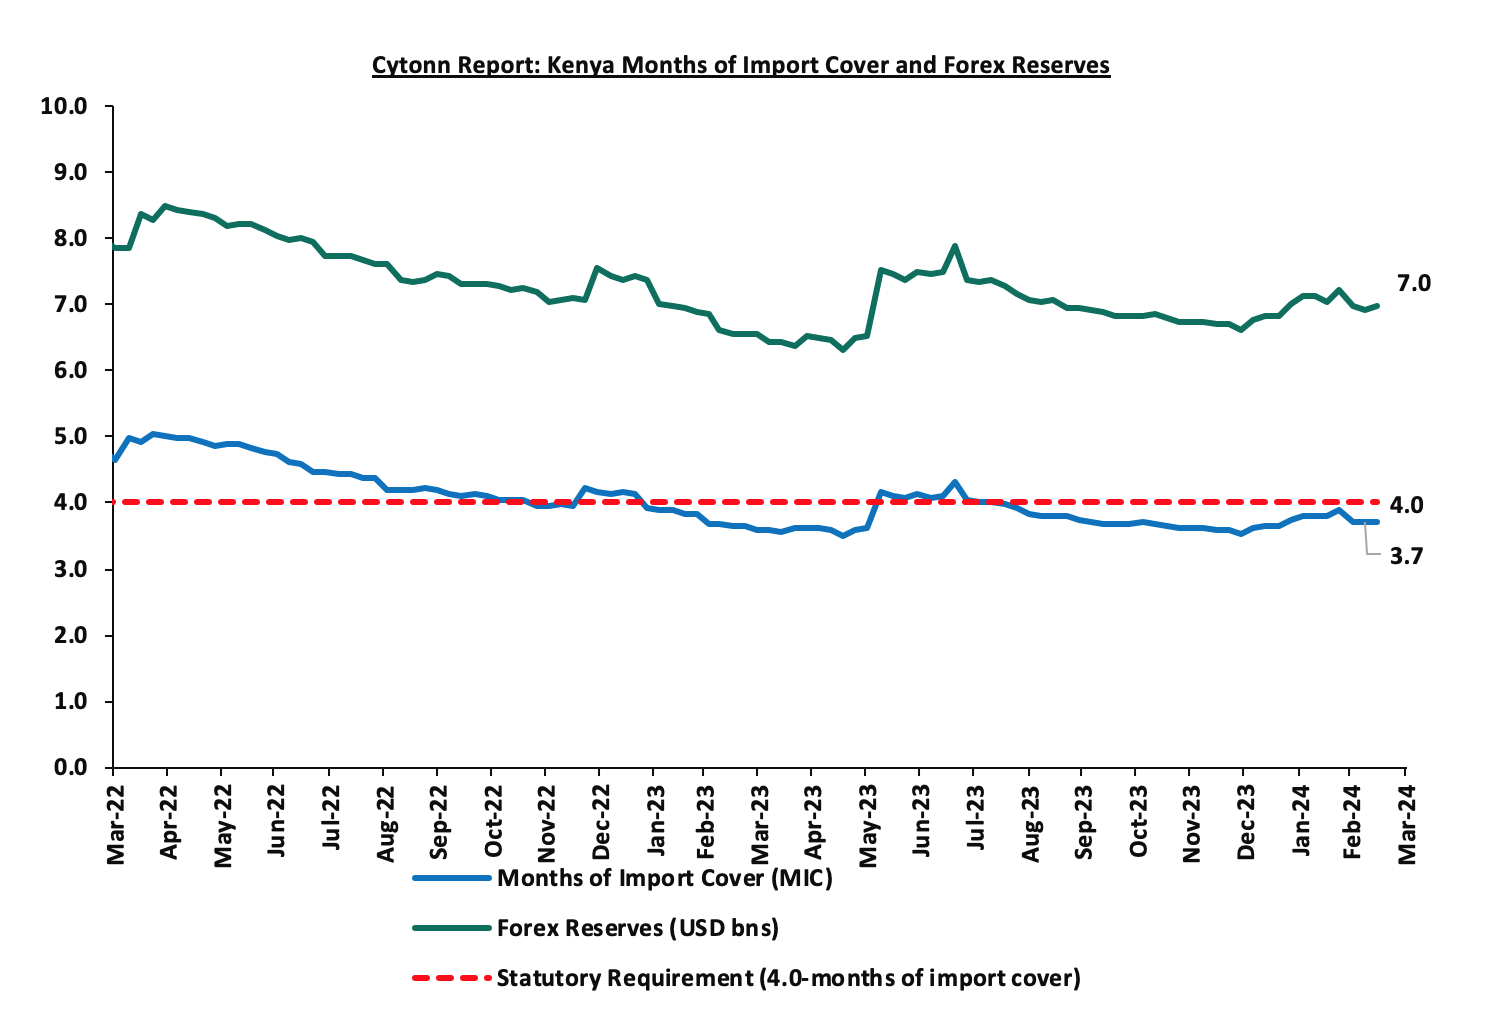
- Dwindling forex reserves, currently at USD 7.0 bn (equivalent to 3.7 months of import cover), which is below the statutory requirement of maintaining at least 4.0 months of import cover.
Key to note, Kenya’s forex reserves increased by 0.8% during the week to USD 7.0 bn from the USD 6.9 bn recorded the previous week, equivalent to 3.7 months of import cover, which remained relatively unchanged from the previous week, and remained below the statutory requirement of maintaining at least 4.0 months of import cover. The chart below summarizes the evolution of Kenya's months of import cover over the years:
Weekly Highlights
- Fuel Prices effective 15th March 2024 to 14th April 2024
During the week, the Energy and Petroleum Regulatory Authority (EPRA) released their monthly statement on the maximum retail fuel prices in Kenya, effective from 15th March 2024 to 14th April 2024. Notably, the maximum allowed price for Super Petrol, Diesel and Kerosene decreased by Kshs 7.2, Kshs 5.1, and Kshs 4.5 each respectively, and will retail at Kshs 199.2, Kshs 190.4, and Kshs 188.7 per litre respectively, from the February 2024 prices of Kshs 206.4, Kshs 195.5 and Kshs 193.2 respectively.
Other key take-outs from the performance include;
- The average landing costs per cubic meter for Super Petrol and Kerosene increased by 5.6% and 1.7% respectively to USD 703.5 and USD 730.4 in February 2024, from USD 666.2 and USD 718.5 respectively in January 2024, while Diesel decreased by 0.8% to USD 722.5 in February 2024 from USD 728.0 in January 2024, and,
- The Kenyan shilling gained against the US Dollar by 10.0% to Kshs 148.0 in February 2024, compared to the mean monthly exchange rate of Kshs 164.4 recorded in January 2024.
We note that fuel prices in the country have decreased, largely attributed to the government's efforts to stabilize pump prices through the petroleum pump price stabilization mechanism. This has so far expended Kshs 9.9 bn in the FY2023/24 to cushion the increases applied to the petroleum pump prices, coupled with the ongoing appreciation of the Kenyan Shilling against the dollar and other major currencies. Nevertheless, fuel prices in the country remain under pressure from the high taxation of petroleum products as provided in the Finance Act 2023. We project that fuel prices will drop in the coming months as a result of the government's efforts to mitigate the cost of petroleum through the pump price stabilization mechanism coupled with the expected further strengthening of the Kenyan Shilling against the United States Dollar, adding to the 13.9% year-to-date gain to Kshs 135.1 from Kshs 157.0 recorded at the beginning of the year.
- February 2024 Exchequer Highlight
The National Treasury gazetted the revenue and net expenditures for the eighth month of FY’2023/2024, ending 29th February 2024. Below is a summary of the performance:
|
Cytonn Report: FY'2023/2024 Budget Outturn - As at 29th February 2024 |
||||||
|
Amounts in Kshs bns unless stated otherwise |
||||||
|
Item |
12-months Original Estimates |
Revised Estimates |
Actual Receipts/Release |
Percentage Achieved of the Revised Estimates |
Prorated |
% achieved of the Prorated |
|
Opening Balance |
|
|
2.6 |
|
|
|
|
Tax Revenue |
2,495.8 |
2,495.83 |
1,374.0 |
55.1% |
1,663.9 |
82.6% |
|
Non-Tax Revenue |
75.3 |
80.9 |
48.3 |
59.7% |
54.0 |
89.5% |
|
Total Revenue |
2,571.2 |
2,576.8 |
1,424.9 |
55.3% |
1,717.8 |
82.9% |
|
External Loans & Grants |
870.2 |
849.8 |
474.2 |
55.8% |
566.5 |
83.7% |
|
Domestic Borrowings |
688.2 |
851.9 |
545.6 |
64.0% |
567.9 |
96.1% |
|
Other Domestic Financing |
3.2 |
3.2 |
3.5 |
111.1% |
2.1 |
166.6% |
|
Total Financing |
1,561.6 |
1,704.9 |
1,023.3 |
60.0% |
1,136.6 |
90.0% |
|
Recurrent Exchequer issues |
1,302.8 |
1,360.1 |
808.6 |
59.4% |
906.7 |
89.2% |
|
CFS Exchequer Issues |
1,963.7 |
2,078.8 |
1,267.0 |
60.9% |
1,385.9 |
91.4% |
|
Development Expenditure & Net Lending |
480.8 |
457.2 |
156.9 |
34.3% |
304.8 |
51.5% |
|
County Governments + Contingencies |
385.4 |
385.4 |
206.1 |
53.5% |
256.9 |
80.2% |
|
Total Expenditure |
4,132.7 |
4,281.6 |
2,438.5 |
57.0% |
2,854.4 |
85.4% |
|
Fiscal Deficit excluding Grants |
1,561.6 |
1,704.9 |
1,013.6 |
59.5% |
1,136.6 |
89.2% |
|
Total Borrowing |
1,558.4 |
1,701.7 |
1,019.8 |
59.9% |
1,134.4 |
89.9% |
Amounts in Kshs bns unless stated otherwise
The Key take-outs from the release include;
- Total revenue collected as at the end of February 2024 amounted to Kshs 1,424.9 bn, equivalent to 55.3% of the revised estimates of Kshs 2,576.8 bn for FY’2023/2024, and is 82.9% of the prorated estimates of Kshs 1,717.8 bn. Cumulatively, tax revenues amounted to Kshs 1,374.0 bn, equivalent to 55.1% of the revised estimates of Kshs 2,495.8 bn and 82.6% of the prorated estimates of Kshs 1,663.9 bn,
- Total financing amounted to Kshs 1,023.3 bn, equivalent to 60.0% of the revised estimates of Kshs 1,704.9 bn and is equivalent to 90.0% of the prorated estimates of Kshs 1,136.6 bn. Additionally, domestic borrowing amounted to Kshs 545.6 bn, equivalent to 64.0% of the revised estimates of Kshs 851.9 bn and is 96.1% of the prorated estimates of Kshs 567.9 bn,
- The total expenditure amounted to Kshs 2,438.5 bn, equivalent to 57.0% of the revised estimates of Kshs 4,281.6 bn, and is 85.4% of the prorated target expenditure estimates of Kshs 2,854.4 bn. Additionally, the net disbursements to recurrent expenditures came in at Kshs 808.6 bn, equivalent to 59.4% of the revised estimates of Kshs 1,360.1 and 89.2% of the prorated estimates of Kshs 906.7 bn,
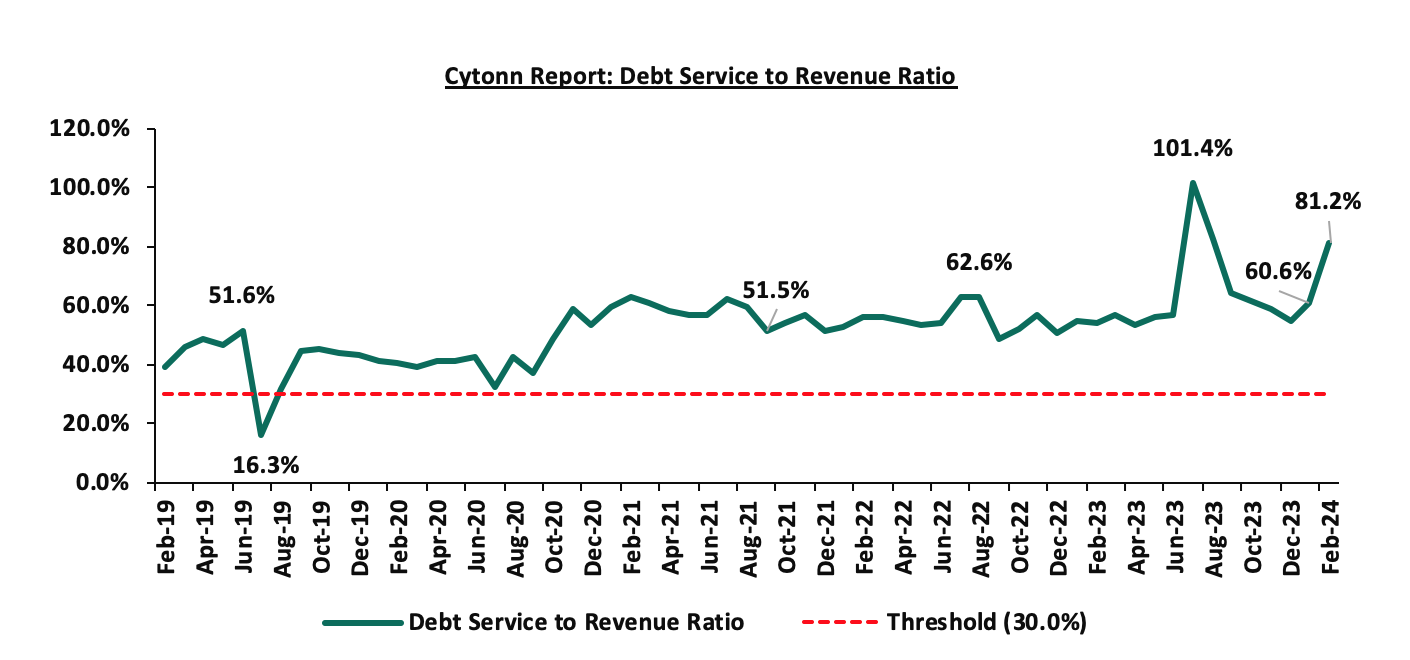
- Consolidated Fund Services (CFS) Exchequer issues came in at Kshs 1,267.0 bn, equivalent to 60.9% of the revised estimates of Kshs 2,078.8 bn, and are 91.4% of the prorated amount of Kshs 1,385.9 bn. The cumulative public debt servicing cost amounted to Kshs 1,157.4 bn which is 62.0% of the revised estimates of Kshs 1,866.0 bn, and is 93.0% of the prorated estimates of Kshs 1,244.0 bn. Additionally, the Kshs 1.157.4 bn debt servicing cost is equivalent to 81.2% of the actual revenues collected as at the end of February 2024. The chart below shows the debt serving to revenue ratio;
- Total Borrowings as at the end of February 2024 amounted to Kshs 1,019.8 bn, equivalent to 59.9% of the revised estimates of Kshs 1,701.7 bn for FY’2023/2024 and are 89.9% of the prorated estimates of Kshs 1,134.4 bn. The cumulative domestic borrowing of Kshs 851.9 bn comprises of Net Domestic Borrowing at Kshs 471.4 bn and Internal Debt Redemptions (Rollovers) of Kshs 380.5 bn.
The government has been unable to meet its prorated revenue targets for the eight months of the FY’2023/2024, mainly on the back of the tough economic situation exacerbated by the elevated inflationary pressure that despite decreasing by 0.6% points in February to 6.3% from the 6.9% recorded in January, still remains on the upper bound of the CBK target of within a range of 2.5% -7.5%. Additionally, the revenue collection continues to be impeded by the high cost of living, despite the improvement in the business environment with the PMI coming in at 51.8 in February, above the contraction zone. In light of this, the government is yet to fully benefit from the strategies put in place to improve revenue collection such as expanding the revenue base, sealing tax leakages, and suspension of tax relief payments. We anticipate that the performance of revenue collection in the coming months will be largely determined by how soon the country’s business environment stabilizes, which is expected to be supported by the ongoing strengthening of the Shilling having gained by 10.7% against the dollar in the month of February.
- Ghana’s USD 13.0 bn Debt Restructuring Talks
Ghanaian authorities and international bondholders are poised to engage in crucial talks this week to navigate the complexities of restructuring approximately USD 13.0 bn of defaulted global debt. This effort marks the start of formal talks to restructure Ghana’s debt to private international bondholders.
Key to note, Ghana defaulted on most of its overseas debt in December 2022 after debt servicing costs soared which led to the restructuring of its local debt under the Domestic Debt Exchange programme (DDEP). The program involved the exchange of the local currency-denominated bonds as of 1st December 2022 with new bonds maturing in 2027, 2029, 2032, and 2037, with the annual coupons for the new bonds set at 0.0%, in 2023, 5.0% in 2024, and 10.0% from 2025 till maturity. Further, the country has been struggling to reach a deal with private holders of about USD 13.0 bn in international bonds
Ghana's journey towards debt restructuring commenced over a year ago, in alignment with the directives of the International Monetary Fund. The country reached a staff level agreement with the IMF in December 2022 for a USD 3.0 bn credit facility under the ECF program. However, this agreement came with conditions on a number of economic conditions which led the government to announce a suspension of payments on selected external debt instruments affecting some of its Eurobond issues. Key to note, the IMF approved a USD 3.0 bn ECF arrangement in May 2023, allowing for immediate disbursement of USD 0.3 bn to support the economy.
These drastic reforms saw S&P Global downgrade the country’s credit rating to “Selective Default” in December 2022. In February 2023, Fitch Ratings downgraded the country’s Long-Term Foreign-Currency (LTFC) Issuer Default Rating (IDR) to 'RD' (Restricted Default) from 'C', and maintained the same rating in November 2023 an indication of the continuing debt crisis.
In January 2024, Ghana reached a deal to restructure USD 5.4 bn of loans with its bilateral creditors Following an agreement under the Group of 20 Common Framework for Debt Treatment which was key to unlocking new International Monetary Fund (IMF) financing and will allow Ghana to access another USD 0.6 bn under its USD 3.0 bn bailout program.
Attention has now shifted towards finalizing terms with Eurobond investors with the aim of ensuring the equitable treatment of all creditors, as stipulated by the guiding principles of the framework. Notably, in October 2023, Ghana had submitted debt restructuring scenarios to bondholders which would include a haircut of 30% to 40% on principal, a coupon of not more than 5.0%, and a final maturity of not more than 20 years. As Ghana and its bondholders embark on this pivotal phase of debt restructuring talks, the international financial community remains attentive, recognizing the significance of finding sustainable solutions for the country's economic stability and growth.
Rates in the Fixed Income market have been on an upward trend given the continued high demand for cash by the government and the occasional liquidity tightness in the money market. The government is 6.3% ahead of its prorated net domestic borrowing target of Kshs 338.0 bn, having a net borrowing position of Kshs 359.4 bn out of the domestic net borrowing target of Kshs 471.4 bn for the FY’2023/2024. Therefore, we expect a continued upward readjustment of the yield curve in the short and medium term, with the government looking to maintain the fiscal surplus through the domestic market. Owing to this, our view is that investors should be biased towards short-term fixed-income securities to reduce duration risk.
Market Performance:
During the week, the equities market was on an upward trajectory, with NSE 10 gaining the most by 7.9%, while NASI, NSE 25, and NSE 20 gained by 7.3%, 7.0%, and 5.2% respectively, taking the YTD performance to gains of 10.7%, 8.5%, 13.2%, and 14.3% for NASI, NSE 20, NSE 25, and NSE 10 respectively. The equities market performance was driven by gains recorded by large-cap stocks such as KCB Group, SCBK, and Co-operative Bank of 15.9%, 12.6%, and 10.6% respectively. The gains were, however, weighed down by losses recorded by large-cap stocks such as Stanbic Bank and BAT of 1.5% and 0.3% respectively.
During the week, equities turnover decreased significantly by 267.5% to USD 19.8 mn from USD 5.4 mn recorded the previous week, taking the YTD total turnover to USD 75.7 mn. Foreign investors became net buyers for the first time in nine weeks with a net buying position of USD 0.5 mn, from a net selling position of USD 0.5 mn recorded the previous week, taking the YTD foreign net selling position to USD 8.0 mn.
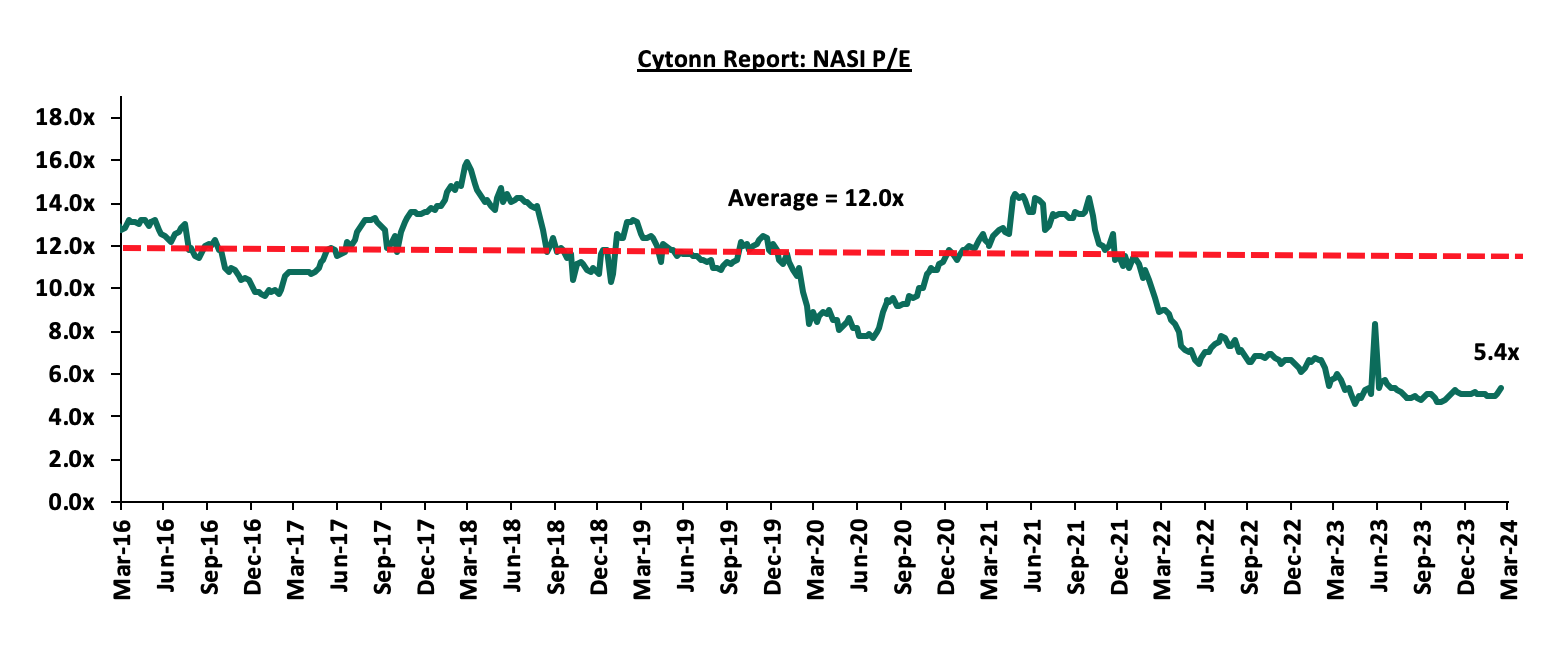
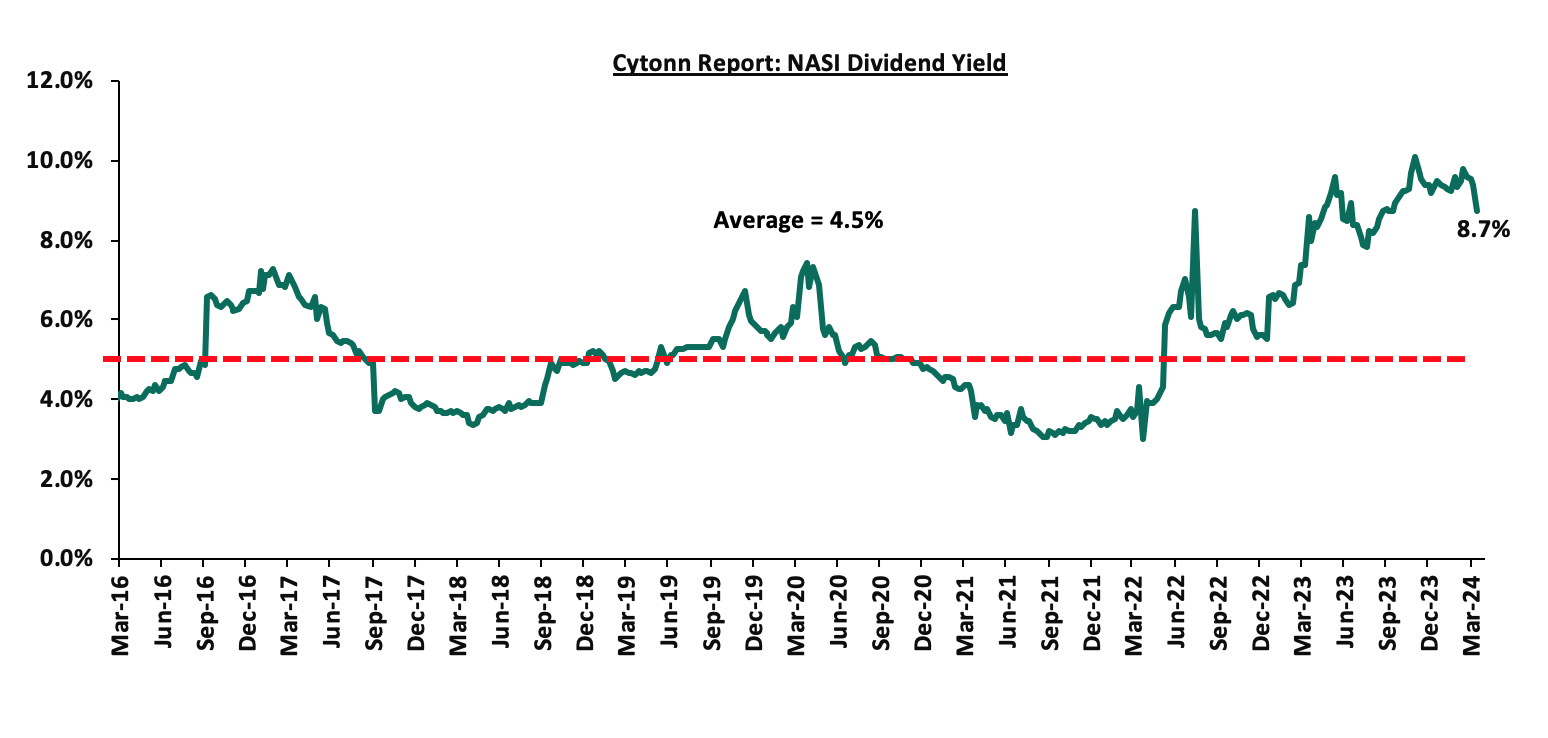
The market is currently trading at a price-to-earnings ratio (P/E) of 5.4x, 55.0% below the historical average of 12.0x. The dividend yield stands at 8.7%, 4.2% points above the historical average of 4.5%. Key to note, NASI’s PEG ratio currently stands at 0.7x, an indication that the market is undervalued relative to its future growth. A PEG ratio greater than 1.0x indicates the market is overvalued while a PEG ratio less than 1.0x indicates that the market is undervalued. The charts below indicate the historical P/E and dividend yields of the market;
Universe of Coverage:
|
Cytonn Report: Equities Universe of Coverage |
|||||||||||
|
Company |
Price as at 08/03/2024 |
Price as at 15/03/2024 |
w/w change |
m/m change |
YTD Change |
Year Open 2024 |
Target Price* |
Dividend Yield |
Upside/ Downside** |
P/TBV Multiple |
Recommendation |
|
Sanlam |
7.0 |
7.0 |
(0.6%) |
(3.1%) |
16.3% |
6.0 |
10.3 |
0.0% |
47.4% |
2.0x |
Buy |
|
Jubilee Holdings |
189.8 |
190.0 |
0.1% |
2.2% |
2.7% |
185.0 |
260.7 |
6.3% |
43.5% |
0.3x |
Buy |
|
Kenya Reinsurance |
2.0 |
1.9 |
(2.5%) |
8.2% |
4.3% |
1.9 |
2.5 |
10.4% |
40.4% |
0.2x |
Buy |
|
KCB Group*** |
20.7 |
24.0 |
15.9% |
3.0% |
9.3% |
22.0 |
31.2 |
8.3% |
38.3% |
0.4x |
Buy |
|
Diamond Trust Bank*** |
47.9 |
49.3 |
3.0% |
(1.5%) |
10.2% |
44.8 |
58.5 |
10.1% |
28.8% |
0.2x |
Buy |
|
NCBA*** |
39.7 |
41.6 |
4.7% |
4.1% |
6.9% |
38.9 |
48.3 |
10.2% |
26.5% |
0.8x |
Buy |
|
Equity Group*** |
40.0 |
42.6 |
6.5% |
6.4% |
24.6% |
34.2 |
48.7 |
9.4% |
23.7% |
0.9x |
Buy |
|
Stanbic Holdings |
119.8 |
118.0 |
(1.5%) |
(1.6%) |
11.3% |
106.0 |
132.8 |
13.0% |
25.6% |
0.8x |
Buy |
|
I&M Group*** |
18.1 |
19.9 |
9.9% |
6.0% |
14.0% |
17.5 |
22.1 |
11.3% |
22.4% |
0.5x |
Buy |
|
Standard Chartered*** |
162.5 |
183.0 |
12.6% |
0.3% |
14.2% |
160.3 |
194.0 |
15.8% |
21.9% |
1.2x |
Buy |
|
ABSA Bank*** |
13.0 |
14.0 |
8.1% |
9.8% |
21.2% |
11.6 |
15.6 |
9.6% |
21.1% |
1.1x |
Buy |
|
CIC Group |
2.1 |
2.2 |
6.8% |
1.0% |
(3.9%) |
2.3 |
2.5 |
5.9% |
19.5% |
0.7x |
Accumulate |
|
Britam |
4.7 |
5.2 |
10.6% |
(12.3%) |
1.2% |
5.1 |
6.0 |
0.0% |
14.8% |
0.7x |
Accumulate |
|
Co-op Bank*** |
12.7 |
14.1 |
10.6% |
7.4% |
23.8% |
11.4 |
13.8 |
10.7% |
8.9% |
0.7x |
Hold |
|
Liberty Holdings |
5.5 |
5.5 |
0.0% |
10.0% |
42.5% |
3.9 |
5.9 |
0.0% |
7.6% |
0.4x |
Hold |
|
HF Group |
4.1 |
4.2 |
2.7% |
6.7% |
21.7% |
3.5 |
3.9 |
0.0% |
(7.1%) |
0.2x |
Sell |
|
Target Price as per Cytonn Analysts’ estimates **Upside/ (Downside) is adjusted for Dividend Yield ***For Disclosure, these are stocks in which Cytonn and/or its affiliates are invested in |
|||||||||||
Weekly Highlights:
- Earnings Release
During the week, Standard Chartered Bank released their FY’2023 financial results. Below is a summary of the performance;
|
Balance Sheet |
FY'2022 (Kshs bn) |
FY'2023 (Kshs bn) |
y/y change |
|
Net Loans and Advances |
139.4 |
163.2 |
17.0% |
|
Kenya Government Securities |
105.7 |
69.6 |
(34.2%) |
|
Total Assets |
381.3 |
429.0 |
12.5% |
|
Customer Deposits |
278.9 |
342.9 |
22.9% |
|
Deposits Per Branch |
7.7 |
10.7 |
38.3% |
|
Total Liabilities |
325.1 |
367.4 |
13.0% |
|
Shareholders' Funds |
56.1 |
61.5 |
9.6% |
|
Key Ratios |
FY'2022 |
FY'2023 |
y/y change |
|
Loan to Deposit ratio |
50.0% |
47.6% |
(2.4%) |
|
Government Securities to Deposits ratio |
37.9% |
20.3% |
(17.6%) |
|
Return on Average Equity |
22.1% |
23.5% |
1.5% |
|
Return on Average Assets |
3.4% |
3.4% |
0.0% |
|
Dividend yield |
15.4% |
15.8% |
2.8% |
|
Income Statement |
FY'2022 (Kshs bn) |
FY'2023 (Kshs bn) |
y/y change |
|
Net interest Income |
22.2 |
29.3 |
32.0% |
|
Net non-interest income |
11.8 |
12.4 |
5.5% |
|
Total Operating income |
34.0 |
41.7 |
22.8% |
|
Loan loss provision |
1.3 |
3.4 |
154.4% |
|
Total Operating expenses |
16.9 |
22.1 |
30.7% |
|
Profit before tax |
17.1 |
19.7 |
15.0% |
|
Profit after tax |
12.1 |
13.8 |
14.7% |
|
Core EPS |
31.5 |
36.6 |
16.4% |
|
Income Statement Ratios |
FY'2022 |
FY'2023 |
y/y change |
|
Yield from interest-earning assets |
8.0% |
9.1% |
1.1% |
|
Cost of funding |
1.2% |
1.0% |
(0.2%) |
|
Net Interest Margin |
7.0% |
8.3% |
1.3% |
|
Net Interest Income as % of operating income |
65.4% |
70.3% |
4.9% |
|
Non-Funded Income as a % of operating income |
34.6% |
29.7% |
(4.9%) |
|
Cost to Income Ratio |
49.7% |
52.9% |
3.2% |
|
Cost to Income without LLP |
45.8% |
44.8% |
(1.0%) |
|
Cost to Assets |
4.3% |
4.6% |
0.3% |
|
Capital Adequacy Ratios |
FY'2022 |
FY'2023 |
% points change |
|
Core Capital/Total Liabilities |
15.1% |
14.9% |
(0.2%) |
|
Minimum Statutory ratio |
8.0% |
8.0% |
|
|
Excess |
7.1% |
6.9% |
(0.2%) |
|
Core Capital/Total Risk Weighted Assets |
15.4% |
17.8% |
2.4% |
|
Minimum Statutory ratio |
10.5% |
10.5% |
|
|
Excess |
4.9% |
7.3% |
2.4% |
|
Total Capital/Total Risk Weighted Assets |
17.3% |
17.8% |
0.6% |
|
Minimum Statutory ratio |
14.5% |
14.5% |
|
|
Excess |
2.8% |
3.3% |
0.6% |
|
Liquidity Ratio |
71.9% |
66.7% |
(5.2%) |
|
Minimum Statutory ratio |
20.0% |
20.0% |
|
|
Excess |
51.9% |
46.7% |
(5.2%) |
Key Take-Outs:
- Strong earnings growth - Core earnings per share (EPS) grew by 16.4% to Kshs 36.6, from Kshs 31.5 in FY’2022, driven by the 22.8% growth in total operating income to Kshs 41.7 bn, from Kshs 34.0 bn in FY’2022,
- Improved asset quality – The bank’s gross NPL ratio decreased to 9.7% in FY’2023 from 14.2% in FY’2022, attributable to 23.7% decrease in Gross non-performing loans to Kshs 17.2 bn, from Kshs 22.6 bn in FY’2022, compared to the 11.4% increase in gross loans to Kshs 177.2 bn, from Kshs 159.1 bn recorded in FY’2022,
- Improved Lending – The bank’s loan book increased by 17.0% to Kshs 163.2 bn, from Kshs 139.4 bn in FY’2022, compared to the 34.2% decline in government securities to Kshs 69.6 bn, from Kshs 105.7 bn in FY’2022, highlighting the bank’s strategy to increase lending through digital transformation, while at the same time managing its non-performing loan book, and,
- Increased dividends – Dividends paid increased by 31.8% to Kshs 29.0 in FY’2023, from Kshs 22.0 in FY’2022 translating to a dividend yield of 15.8% in 2023 compared to a dividend yield of 15.4% in 2022.
For a more detailed analysis, please see the Standard Chartered Bank FY’2023 Earnings Note
Asset Quality:
The table below shows the asset quality of listed banks that have released their FY’2023 results using several metrics:
|
Cytonn Report: Listed Banks Asset Quality in FY’2023 |
||||||
|
|
FY'2023 NPL Ratio* |
FY'2022 NPL Ratio** |
% point change in NPL Ratio |
FY'2023 NPL Coverage* |
FY'2022 NPL Coverage** |
% point change in NPL Coverage |
|
Stanbic Bank |
9.5% |
11.2% |
(1.7%) |
70.4% |
63.1% |
7.4% |
|
Standard Chartered Bank Kenya |
9.7% |
14.2% |
(4.5%) |
81.6% |
87.1% |
(5.6%) |
|
Mkt Weighted Average* |
9.6% |
11.7% |
(2.1%) |
77.0% |
67.4% |
9.6% |
|
*Market cap weighted as at 15/03/2024 |
||||||
|
**Market cap weighted as at 20/04/2023 |
||||||
Key take-outs from the table include;
- Asset quality for the listed banks that have released improved during FY’2023, with the market-weighted average NPL ratio declining by 2.1% points to 9.6% from 11.7% in FY’2022, and,
- Market-weighted average NPL Coverage for the listed banks increased by 9.6% points to 77.0% in FY’2023 from 67.4% recorded in FY’2022. The increase was attributable to Stanbic Holding’s NPL coverage ratio increasing by 7.4% points to 70.4% from 63.1% in FY’2022. The performance was however weighed down by Standard Chartered Bank’s NPL Coverage ratio decreasing by 5.6% to 81.6% from 87.1% in FY’2022.
Summary Performance
The table below shows the performance of listed banks that have released their FY’2023 results using several metrics:
|
Cytonn Report: Listed Banks Performance in FY’2023 |
|||||||||||||
|
Bank |
Core EPS Growth |
Interest Income Growth |
Interest Expense Growth |
Net Interest Income Growth |
Net Interest Margin |
Non-Funded Income Growth |
NFI to Total Operating Income |
Growth in Total Fees & Commissions |
Deposit Growth |
Growth in Government Securities |
Loan to Deposit Ratio |
Loan Growth |
Return on Average Equity |
|
Stanbic Holdings |
34.2% |
48.0% |
71.7% |
35.4% |
7.9% |
19.3% |
37.9% |
31.9% |
17.3% |
(27.4%) |
78.7% |
10.4% |
18.6% |
|
Standard Chartered Bank Kenya |
16.4% |
27.0% |
(6.9%) |
32.0% |
8.3% |
5.5% |
29.7% |
33.1% |
22.9% |
(34.2%) |
47.6% |
17.0% |
23.5% |
|
FY'23 Mkt Weighted Average* |
23.6% |
35.5% |
25.1% |
33.3% |
8.1% |
11.1% |
33.1% |
32.6% |
20.6% |
(31.4%) |
60.2% |
14.3% |
21.5% |
|
FY'22 Mkt Weighted Average* |
26.6% |
19.7% |
20.1% |
19.2% |
7.2% |
31.6% |
37.7% |
13.8% |
13.7% |
3.1% |
71.8% |
18.1% |
21.8% |
|
*Market cap weighted as at 15/03/2024 |
|||||||||||||
|
**Market cap weighted as at 20/04/2023 |
|||||||||||||
Key take-outs from the table include:
- The listed banks recorded a 23.6% growth in core Earnings per Share (EPS) in FY’2023, compared to the weighted average growth of 26.6% in FY’2022, an indication of declined performance attributable to the tough operating environment experienced during the year,
- Non-Funded Income grew by 11.1% compared to market-weighted average growth of 31.6% in FY’2022, despite the increased revenue diversification efforts by the banks, and,
- The Banks recorded a deposit growth of 20.6%, higher than the market-weighted average deposit growth of 13.7% in FY’2022.
We are “Neutral” on the Equities markets in the short term due to the current tough operating environment and huge foreign investor outflows, and, “Bullish” in the long term due to current cheap valuations and expected global and local economic recovery. With the market currently being undervalued for its future growth (PEG Ratio at 0.6x), we believe that investors should reposition towards value stocks with strong earnings growth and that are trading at discounts to their intrinsic value. We expect the current high foreign investors’ sell-offs to continue weighing down the equities outlook in the short term.
- Industry Report
During the week, the Kenya National Bureau of Statistics (KNBS) released the Leading Economic Indicators (LEI) January 2024 Report which highlighted the performance of major economic indicators. Key highlights related to the Real Estate sector include;
- In the month of December 2023, the number of international arrivals recorded stood at 143,942 persons, compared to 128,716 persons recorded during a similar period in 2022. On a year-on-year (y/y) basis, the performance represented a 25.6% increase to 1,505,876 persons in 2023, compared to 1,198,727 persons recorded in 2022. On a quarter-on-quarter (q/q) basis, the performance represented a 11.5% decrease to 399,302 persons in Q4’2023, from 451,441 persons recorded in Q3’2023. Additionally, the number of arrivals recorded for the month of January 2024 stood at 134,665 persons, a 6.4% decrease from 143,942 persons recorded in December 2023. On a year-on-year (y/y) basis, the performance represented a 18.1% increase, compared to 114,048 persons recorded during a similar period in 2023. The improved performance is attributable to; i) creation of specialized offerings like cruise tourism, adventure tourism, cultural, and sports tourism, ii) expanded global promotion of Kenya's tourism by the Ministry of Tourism and Kenya Tourism Board, utilizing platforms like Magical Kenya, iii) various initiatives to boost local and regional tourism, and iv) the alignment of marketing strategies by the tourism board to focus on both emerging and established source markets. The chart below shows the number of international arrivals in Kenya between Q1’2021 and January 2024;
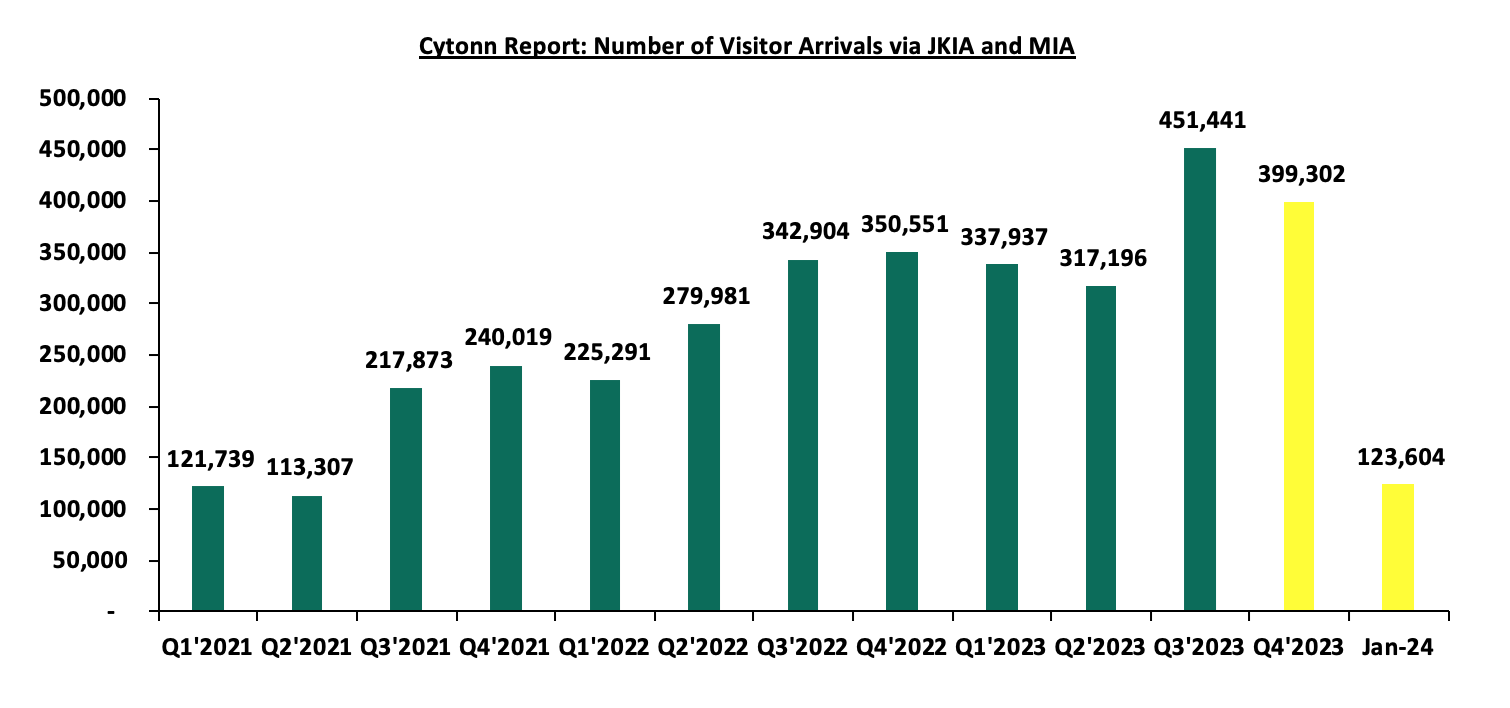
Source: Kenya National Bureau of Statistics (KNBS)
- Residential Sector
- Kenya Informal Settlement Improvement Project Phase Two
During the week, Kiambu County initiated a Kshs 1.0 bn infrastructure development plan aimed at upgrading slums as part of phase two of the Kenya Informal Settlement Improvement Project (KISIP). This initiative will be carried out through a partnership with the State Department of Housing and Urban Development. The plan encompasses various enhancements such as the issuance of over 7,000 title deeds, the paving of roads, the construction of walkways and stormwater drains, and the installation of floodlights, solar street lighting, and sewerage lines. Among the informal settlements set to benefit from this project are Umoja, Kiangombe, Matharau, Fort Jesus in Ruiru, Bosnia in Githurai (now known as Riverside), Misri, and Lame in Limuru, Kiamburi in Kikuyu, and Kanjeru in Kabete.
Furthermore, Kshs 150.0 mn has been allocated for the densely populated Kiandutu slum in Thika, focusing on the paving of roads, the construction of walkways, a social hall, drainage systems, and high mast floodlights. The County Government intends to distribute integrated solar PV street lights and expand the coverage of tarmac roads. Additionally, the project aims to aid in the provision of public toilets and to establish a sports centre.
Upon the projects’ completion, residents will experience improved living conditions due to enhanced infrastructure and increased land tenure security. Moreover, the initiative will generate job opportunities for residents and foster further investment opportunities within the county.
- Launch of Talai Ainamoi Affordable Housing Project
During the week, President William Ruto laid the foundation for the Talai Ainamoi Affordable Housing Project in Ainamoi Constituency, Kericho County. The project will be constructed on a 5-acre piece of land in the first phase and will incorporate 320 housing units broken down as follows; 60 Social Housing Units, 160 Affordable Housing Units, and 100 Market Rate Housing Units. Additionally, the project is set to employ 2000 individuals from the area and have a partnership with the local Jua Kali sector. The tables below provide a summary of the unit types, sizes, and prices for social housing units, affordable housing units, and market-rate housing units respectively;
|
Cytonn Report: Talai Ainamoi Affordable Housing Project-Social Housing Units |
||||
|
Typology |
Size (SQM) |
Price (Kshs in mns) |
Price per SQM |
Monthly Payment |
|
2-bedroom |
30 |
1.2 |
42,000 |
4,800 |
|
3-bedroom |
40 |
1.6 |
42,000 |
6,400 |
|
Average |
35 |
1.4 |
42,000 |
5,600 |
Source: Online Research
|
Cytonn Report: Talai Ainamoi Affordable Housing Project-Affordable Housing Units |
||||
|
Typology |
Size (SQM) |
Price (Kshs in mns) |
Price per SQM |
Monthly Payment |
|
Studio |
20 |
0.9 |
48,000 |
5,200 |
|
2-bedroom |
40 |
1.6 |
42,000 |
6,400 |
|
3-bedroom |
60 |
1.9 |
32,000 |
10,400 |
|
Average |
40 |
1.5 |
40,667 |
7,333 |
Source: Online Research
|
Cytonn Report: Talai Ainamoi Affordable Housing Project-Market Rate Housing Units |
||||
|
Typology |
Size (SQM) |
Price (Kshs in mns) |
Price per SQM |
Monthly Payment |
|
2-bedroom |
60 |
4.3 |
72,000 |
31,300 |
|
3-bedroom |
80 |
5.7 |
72,000 |
41,800 |
|
Average |
70 |
5.0 |
72,000 |
36,550 |
Source: Online Research
Going forward, we expect to witness the launch of more Affordable Housing Programs as the government endeavours to address the housing deficit in the country. These projects are poised to create direct employment opportunities for the youth, as well as those already in the Jua Kali sector, stimulate economic activities, improve the quality of living, and increase homeownership across the country
- Real Estate Investments Trusts (REITs)
On the Unquoted Securities Platform, Acorn D-REIT and I-REIT traded at Kshs 24.4 and Kshs 21.7 per unit, respectively, as of 15th March 2024. The performance represented a 22.0% and 8.3% gain for the D-REIT and I-REIT, respectively, from the Kshs 20.0 inception price. The volumes traded for the D-REIT and I-REIT came in at 12.3 mn and 30.7 mn shares, respectively, with a turnover of Kshs 257.5 mn and Kshs 633.8 mn, respectively, since inception in February 2021.
REITs offer a range of advantages such as tax advantages, diversified asset portfolios, and consistent long-term returns. However, the continuous deterioration in the performance of the Kenyan REITs and restructuring of their business portfolio is hampering major investments that had previously been made. The other general challenges include; i) minimum investment thresholds of Kshs 5.0 mn, which continue to constrain the Kenyan REITs market's performance, ii) lengthy approval processes for establishing REITs, iii) high minimum capital requirements for trustees, set at Kshs 100.0 mn, and iv) limited understanding of the investment vehicle among investors.
Going forward, we expect to witness ongoing expansion within the Real Estate sector, driven by various factors such as; i) heightened government initiatives in the Affordable Housing Program, ii) expanded infrastructure projects undertaken by the government, iii) increase in the number of international arrivals and, iv) a sustained demand for residential housing fuelled by a relatively high population growth rates of 1.9% and urbanization rate of 3.7% which are above global averages. However, we anticipate that the sector's growth may be constrained by the challenging macroeconomic conditions prevailing, as well as by rising costs of key construction materials and a lack of comprehensive understanding regarding Real Estate Investment Trusts (REITs).
In 2023, we published the Nairobi Metropolitan Area Commercial Office Report 2023 themed ‘Persisting Tenant’s Market’. The report provided an in-depth analysis of the sector's performance in 2022, along with insights into future prospects and investment opportunities. According to the report, the sector experienced notable improvements, with average rental yields reaching 7.6% in 2022, up by 0.3% points from the 7.3% recorded in 2021, attributable to increased occupancy and rental rates. Occupancy rates also saw a significant uptick, rising by 1.8% points to reach 79.4% in 2022, compared to 77.6% in 2021. Despite some firms continuing to adopt work-from-home policies, the demand for office space remained robust as more firms resumed full operations. Asking rents and prices increased to an average of Kshs 96 and Kshs 12,223 per SQFT respectively in 2022, from Kshs 94 and Kshs 12,106 per SQFT, respectively, recorded in 2021. Moreover, the market was characterized by an oversupply of 5.8 mn SQFT in office spaces, which persisted and restrained the sector's overall performance. However, this was an improvement from the 6.7 mn SQFT oversupply in 2021 attributable to heightened demand for physical office spaces, with many businesses returning to full office operations and others opting for a hybrid work policy following the transition from remote work. Additionally, factors such as ongoing economic recovery and a peaceful post-election period contributed to this trend.
This week, we update our previous research with the Commercial Office Report 2024 themed ‘Shifting Landscapes’, in order to determine the market’s performance and analyse the ongoing trends, by looking at the following:
- Overview of the Commercial Office Sector,
- Commercial Office Supply in the Nairobi Metropolitan Area,
- Commercial Office Performance, by Location and by Grades, and,
- Office Market Outlook and the Investment Opportunity in the Sector.

Disclaimer: The views expressed in this publication are those of the writers where particulars are not warranted. This publication, which is in compliance with Section 2 of the Capital Markets Authority Act Cap 485A, is meant for general information only and is not a warranty, representation, advice or solicitation of any nature. Readers are advised in all circumstances to seek the advice of a registered investment advisor

- Talk to us
- Kenya
- P.O Box 20695 - 00200, Nairobi, Kenya
- Cell +254709101200
- Tel +254709101200
- WhatsApp +254741676635
- United States
- +254709101200
- DOWNLOAD OUR APP
-


- Kenya
- 8th Floor, Pinetree Plaza, Kaburu Drive, Ngong Road, Nairobi, Kenya
- USA
- Suite 1150, 1775 Eye Street NW, USA, Washington DC 20006, USA
- Investments
- High Yield
- Private Equity
- Real Estate
- Real Estate
- RiverRun Estates
- Cytonn Towers
- The Ridge
- Taraji Heights
- The Alma