Nairobi Metropolitan Area (NMA) Serviced Apartments Report 2021, & Cytonn Weekly #44/2021
By Research Team, Nov 7, 2021
Executive Summary
Fixed Income
During the week, T-bills recorded an oversubscription, with the overall subscription rate coming in at 131.1%, an increase from the 66.0% recorded the previous week. The 364-day paper recorded the highest subscription rate, receiving bids worth Kshs 19.2 bn against the offered Kshs 10.0 bn, translating to a subscription rate of 192.4%, an increase from the 57.9% recorded the previous week. The increased interest in the 364-day paper is partly attributable to investors’ preference for holding onto the longer-dated paper since it now offers a better risk adjusted return. The subscription rate for the 182-day and 91-day papers increased to 87.9% and 85.9%, from 74.2% and 66.0%, respectively. The yields on the 91-day, 182-day and 364-day papers increased by 5.7 bps, 6.8 bps and 13.5 bps, to 7.1%, 7.6% and 8.6%, respectively. The government accepted all the Kshs 31.5 bn worth of bids received, translating to an acceptance rate of 100.0%;
During the week, Stanbic Bank released its monthly Purchasing Manager’s Index (PMI) highlighting that the index for the month of October increased to 51.4 from 50.4 recorded in September 2021, an indication that business activities in the country strengthened and new business continued to grow during the month of October. Also during the week, the International Monetary Fund (IMF) and the Kenyan authorities reached a staff level agreement on the second review of the 38-month Extended Fund Facility (EFF) and Extended Credit Facility (ECF) - funded program. Additionally, the Kenya Revenue Authority (KRA) released the Revenue Performance as of October 2021, highlighting that the cumulative Total Revenue collected for the current fiscal year was Kshs 631.1 bn, against the target of Kshs 603.9 bn, representing an out-performance rate of 104.5%;
Equities
During the week, the equities market was on a downward trajectory, with NASI, NSE 20 and NSE 25 declining by 3.9%, 0.6% and 2.4%, respectively, taking their YTD performance to gains of 12.4%, 4.1% and 10.2% for NASI, NSE 20 and NSE 25, respectively. The equities market performance was driven by losses recorded by large cap stocks such as Safaricom and Diamond Trust Bank (DTB-K) of 6.1% and 3.0%, respectively. The decline was however mitigated by gains recorded by stocks such as EABL, ABSA and Equity which gained by 1.8%, 0.5% and 0.4%, respectively. During the week, MTN Uganda announced that it had received a no objection from Kenya’s Capital Markets Authority for marketing its Initial Public Offer (IPO) in Kenya, following the opening of the IPO in Uganda on 11th October 2021;
Real Estate
During the week, Unity Homes, a Kenyan-British housing developer began the construction of 640- two- and three-bedroom apartments dubbed Unity East at Tatu City in Ruiru. In the retail sector, Chandarana Foodplus, a local retailer opened a new outlet at new Golden Life Mall in Nakuru, bringing its total operational outlets countrywide to 22. In the infrastructure sector, Transport Cabinet Secretary, Hon. James Macharia, commissioned the construction of the 54.0 Km Mto Mwagodi-Mbale-Wundanyi-Bura road. In the listed real estate, ILAM Fahari I-REIT closed the week trading at Kshs 7.1 per share, a 6.0% WTD and 22.4% YTD increase from Kshs 6.7 and Kshs 5.8 per share, respectively;
Focus of the Week
This week, we focus on the hospitality sector where we update our Nairobi Metropolitan Area Serviced Apartments Report 2020 topical, by covering the state of serviced apartments market in 2021. We shall look into the sector’s key drivers and challenges, current and incoming supply, performance, and, conclude by pointing out the investment opportunity as at 2021. Overall, serviced apartments within the Nairobi Metropolitan Area (NMA) recorded an average rental yield of 5.5% in 2021, 1.5% points higher than the 4.0% recorded in 2020. This is attributable to the increase in monthly charges per SQM by 0.7% to Kshs 2,549 in 2021 from Kshs 2,533 recorded in 2020. Average occupancies also increased by 13.5% points to 61.5% in 2021 from 48.0% in recorded in 2020;
Investment Updates:
- Weekly Rates:
- Cytonn Money Market Fund closed the week at a yield of 10.66%. To invest, just dial *809#;
- Cytonn High Yield Fund closed the week at a yield of 13.99% p.a. To invest, email us at sales@cytonn.com and to withdraw the interest you just dial *809#;
- We continue to offer Wealth Management Training Monday through Saturday, from 9:00 am to 11:00 am, through our Cytonn Foundation. The training aims to grow financial literacy among the general public. To register for any of our Wealth Management Trainings, click here;
- If interested in our Private Wealth Management Training for your employees or investment group, please get in touch with us through wmt@cytonn.com;
- Any CHYS and CPN investors still looking to convert are welcome to consider one of the five projects currently available for conversion, click here for the latest conversion term sheet;
- Cytonn Insurance Agency acts as an intermediary for those looking to secure their assets and loved ones’ future through insurance namely; Motor, Medical, Life, Property, WIBA, Credit and Fire and Burglary insurance covers. For assistance, get in touch with us through insuranceagency@cytonn.com;
- Cytonnaire Savings and Credit Co-operative Society Limited (SACCO) provides a savings and investments avenue to help you in your financial planning journey. To enjoy competitive investment returns, kindly get in touch with us through clientservices@cytonn.com;
Real Estate Updates:
- For an exclusive tour of Cytonn’s real estate developments, visit: Sharp Investor's Tour, and for more information, email us at sales@cytonn.com;
- Phase 3 of The Alma is now ready for occupation. To rent please email properties@cytonn.com;
- We have 8 investment-ready projects, offering attractive development and buyer targeted returns; See further details here: Summary of Investment-ready Projects;
- For recent news about the group, see our news section here;
Hospitality Updates:
- We currently have promotions for Staycations. Visit cysuites.com/offers for details or email us at sales@cysuites.com;
- Share a meal with a friend during the Sunday Brunch at The Hive Restaurant at Cysuites Hotel and Apartment. Every Sunday from 11.00 AM to 4.00 PM at a price of Kshs 2,500 for Adults and Kshs 1,500 for children under 12 years;
Kenya’s 2022 Election Campaign Promises Tracker
Election Watch:
Kenya’s next Presidential Elections are set to be held in August 2022 and with less than a year left, we have seen the political temperatures in the country continue to rise. During the week, One Kenya Alliance launched their 2022 Draft Manifesto indicating that the party intended to repay all of Kenya’s debt within two years. This follows other economic campaign promises made by other politicians as they campaign for the next general elections. We have been analyzing these promises and the impact they will have on the economy. To read more on the same, click here;
During the week, T-bills recorded an oversubscription, with the overall subscription rate coming in at 131.1%, an increase from the 66.0% recorded the previous week. The 364-day paper recorded the highest subscription rate, receiving bids worth Kshs 19.2 bn against the offered Kshs 10.0 bn, translating to a subscription rate of 192.4%, an increase from the 57.9% recorded the previous week. The increased interest in the 364-day paper is partly attributable to investors’ preference for holding onto the longer-dated paper since it now offers a better risk adjusted return. The subscription rate for the 182-day and 91-day papers increased to 87.9% and 85.9%, from 74.2% and 66.0%, respectively, recorded the previous week. The yields on the 91-day, 182-day and 364-day papers increased by 5.7 bps, 6.8 bps and 13.5 bps, to 7.1%, 7.6% and 8.6%, respectively. The government accepted all the Kshs 31.5 bn worth of bids received, translating to an acceptance rate of 100.0%.
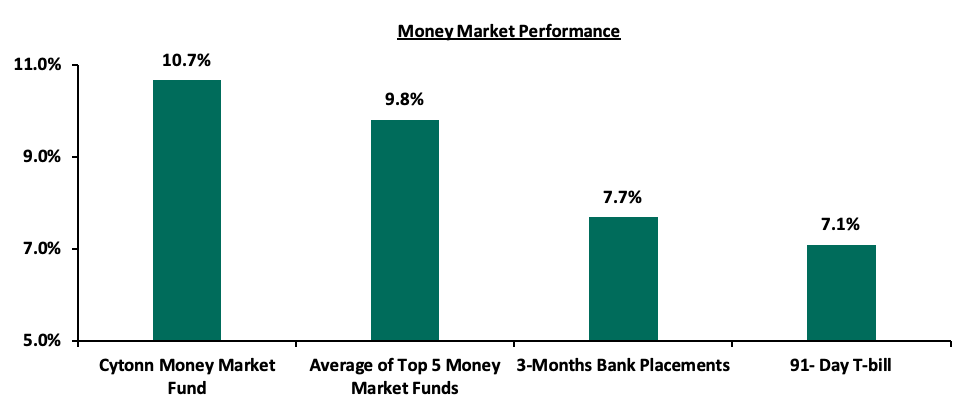
In the money markets, 3-month bank placements ended the week at 7.7% (based on what we have been offered by various banks), while the yield on the 91-day T-bill increased by 5.7 bps to 7.1%. The average yield of the Top 5 Money Market Funds remained relatively unchanged at 9.8% while the yield on the Cytonn Money Market Fund increased by 0.1% points to 10.7%, from 10.6% recorded the previous week.
The table below shows the Money Market Fund Yields for Kenyan Fund Managers as published on 5th November:
|
|
Money Market Fund Yield for Fund Managers as published on 5th November 2021 |
|
|
Rank |
Fund Manager |
Effective Annual Rate |
|
1 |
Cytonn Money Market Fund |
10.66% |
|
2 |
Zimele Money Market Fund |
9.91% |
|
3 |
Nabo Africa Money Market Fund |
9.70% |
|
4 |
Sanlam Money Market Fund |
9.36% |
|
5 |
Madison Money Market Fund |
9.25% |
|
6 |
CIC Money Market Fund |
9.05% |
|
7 |
Apollo Money Market Fund |
8.95% |
|
8 |
Co-op Money Market Fund |
8.75% |
|
9 |
GenCapHela Imara Money Market Fund |
8.75% |
|
10 |
Dry Associates Money Market Fund |
8.61% |
|
11 |
British-American Money Market Fund |
8.47% |
|
12 |
Orient Kasha Money Market Fund |
8.38% |
|
13 |
NCBA Money Market Fund |
8.34% |
|
14 |
ICEA Lion Money Market Fund |
8.33% |
|
15 |
Old Mutual Money Market Fund |
7.42% |
|
16 |
AA Kenya Shillings Fund |
6.33% |
Source: Business Daily
Liquidity:
During the week, liquidity in the money market eased, with the average interbank rate decreasing to 4.7%, from 4.9% recorded the previous week, partly attributable to government payments which offset tax remittances. The average interbank volumes traded declined by 49.1% to Kshs 5.2 bn, from Kshs 10.2 bn recorded the previous week.
Kenya Eurobonds:
During the week, the yields on Eurobonds recorded mixed performance, with the 10-year bond issued in 2014 and the 30-year bond issued in 2018 increasing by 0.2% points and 0.1% points to 3.8% and 7.9%, respectively. On the other hand, the yields on the 10-year bond issued in 2018, the 7-year issued in 2019 and 12-year bonds issued in 2019 and 2021 remained relatively unchanged at 5.8%, 5.4%, 6.8% and 6.6%, respectively. Below is a summary of the performance:
|
Kenya Eurobond Performance |
||||||
|
|
2014 |
2018 |
2019 |
2021 |
||
|
Date |
10-year issue |
10-year issue |
30-year issue |
7-year issue |
12-year issue |
12-year issue |
|
31-Dec-20 |
3.9% |
5.2% |
7.0% |
4.9% |
5.9% |
- |
|
29-Oct-21 |
3.7% |
5.7% |
7.9% |
5.5% |
6.7% |
6.5% |
|
28-Oct-21 |
3.7% |
5.7% |
7.9% |
5.5% |
6.8% |
6.6% |
|
1-Nov-21 |
3.8% |
5.8% |
7.9% |
5.5% |
6.8% |
6.7% |
|
2-Nov-21 |
3.8% |
5.8% |
7.9% |
5.5% |
6.7% |
6.6% |
|
3-Nov-21 |
3.9% |
5.8% |
7.9% |
5.5% |
6.8% |
6.6% |
|
4-Nov-21 |
3.8% |
5.8% |
7.9% |
5.4% |
6.8% |
6.6% |
|
Weekly Change |
0.2% |
0.0% |
0.1% |
0.0% |
0.0% |
0.0% |
|
M/m Change |
0.1% |
0.0% |
0.1% |
-0.1% |
0.0% |
0.1% |
|
YTD Change |
(0.1%) |
0.6% |
0.9% |
0.5% |
0.9% |
- |
Kenya Shilling:
During the week, the Kenyan shilling depreciated by 0.3% against the US dollar to close the week at Kshs 111.5, from Kshs 111.2 recorded the previous week, mainly attributable to increased dollar demand from commodity and energy sector importers outweighing the supply of dollars from exporters. On a YTD basis, the shilling has depreciated by 2.2% against the dollar, in comparison to the 7.7% depreciation recorded in 2020. We expect the shilling to remain under pressure for the remainder of 2021 as a result of:
- Rising uncertainties in the global market due to the Coronavirus pandemic, which has seen investors continue to prefer holding their investments in dollars and other hard currencies and commodities,
- Increased demand from merchandise traders as they beef up their hard currency positions in anticipation for more trading partners reopening their economies globally, and,
- Rising global crude oil prices on the back of supply constraints at a time when demand is picking up with the easing of COVID-19 restrictions and as economies reopen.
The shilling is however expected to be supported by:
- The Forex reserves, currently at USD 9.1 bn (equivalent to 5.5-months of import cover), which is above the statutory requirement of maintaining at least 4.0-months of import cover, and the EAC region’s convergence criteria of 4.5-months of import cover. In addition, the reserves were boosted by the USD 1.0 bn proceeds from the Eurobond issued in July, 2021 coupled with the USD 407.0 mn IMF disbursement and the USD 130.0 mn World Bank loan financing received in June, 2021, and,
- Improving diaspora remittances evidenced by an 18.8% y/y increase to USD 309.8 mn in September 2021, from USD 260.7 mn recorded over the same period in 2020, which has continued to cushion the shilling against further depreciation.
Weekly Highlight:
- Stanbic Bank’s Monthly Purchasing Manager’s Index (PMI)
During the week, Stanbic Bank released its monthly Purchasing Manager’s Index (PMI) highlighting that the index for the month of October increased to 51.4 from 50.4 recorded in September 2021, an indication that business activities in the country strengthened and new business continued to grow. Notably, this is the highest PMI recorded in the five months leading to October 2021, attributable to a moderate improvement in business conditions and a significant increase in new business volumes on the back of increased customer spending. There was an increase in output levels and new orders but demand fell in sectors such as agriculture and construction, with the manufacturing sector remaining unchanged. Additionally, the rate of employment also increased, following the increased work backlogs that necessitated an increase of staff levels. The chart below summarizes the evolution of the PMI over the last 24 months:
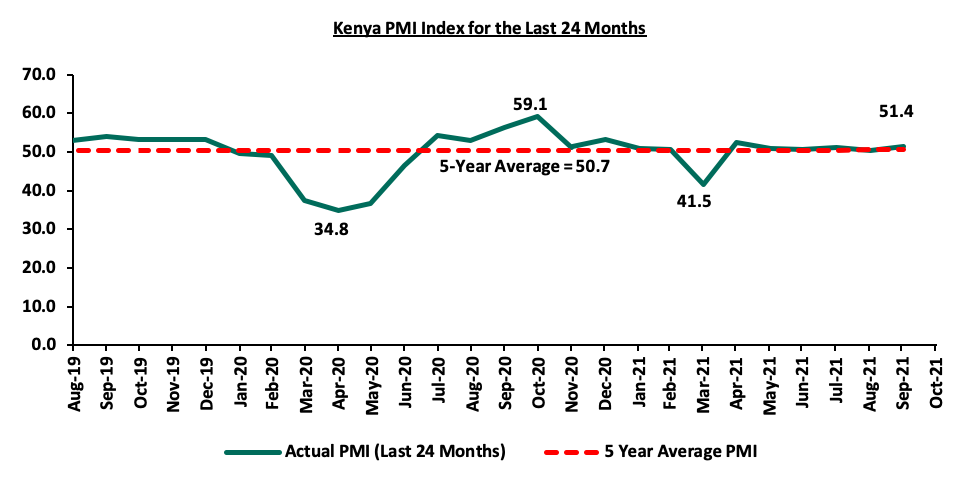
*** Key to note, a reading above 50.0 signals an improvement in business conditions, while readings below 50.0 indicate a deterioration
Despite the increase of the PMI index reading for the month of October 2021, we maintain a cautious outlook in the short-term owing to the increasing cost pressures, high cost of living and the rising political pressures. However, we continue to monitor the economic impact of the recent easing of lockdown restrictions which had adversely affected the business environment. We expect the lifting of the dusk to dawn curfew that has been in place since March 2020 to boost economic recovery since local businesses will use this opportunity to maximize production as well as boost sales volumes as they recover from the negative effects of the pandemic. The existence and emergence of new COVID-19 variants, especially the Delta variant, which is more easily transmissible, still poses economic uncertainty as it may lead to another wave of infections and consequently tighter restrictions that will negatively affect the general business environment.
- IMF Review on Kenya’s Extended Fund Facility and Extended Credit Facility
During the week, the International Monetary Fund (IMF) and the Kenyan authorities reached a staff level agreement on the second review of the 38-month Extended Fund Facility (EFF) and Extended Credit Facility (ECF) - funded program. IMF noted that subject to the completion of the review by the IMF Board, Kenya would access approximately USD 264.0 mn (Kshs 29.5 bn), bringing the total support from IMF to Kenya to USD 984.0 mn (Kshs 109.8 bn) in 2021. The agreement comes on the back of the Kenya’s continuing economic recovery from the COVID-19 pandemic coupled with the improving revenue performance. We believe that the program will continue supporting Kenya’s COVID-19 response as well as support the government’s fiscal consolidation efforts that were clouded following the pandemic. Additionally, we believe that the switch from expensive commercial debts to concessional loans will help save on the cost of borrowing since such loans have more favourable terms and conditions than those offered by the commercial finance markets including the lower interest rate and deferred or income-contingent repayments.
- October Revenue Performance
During the week, the Kenya Revenue Authority (KRA) released the Revenue Performance as of October 2021, highlighting that the cumulative Total Revenue collected for the current fiscal year was Kshs 631.1 bn, against the target of Kshs 603.9 bn, representing an out-performance rate of 104.5%. For the month of October 2021, KRA collected Kshs 154.4 bn, against the target of Kshs 142.3 bn, recording an outperformance rate of 108.5%. The outperformance is mainly attributable to;
- Enhanced compliance enforcement efforts and the implementation of new tax measures, focused on ensuring that that non-compliant taxpayers pay their due taxes,
- Improved business environment due to relaxation of COVID-19 containment measures. On 20th October 2021, the government lifted the nationwide night curfew that had been in place since March 2020, allowing businesses to extend working hours and resume night operations, and,
- Improving Macro-Economic environment with Gross Domestic Product expected to grow by 5.3% in FY’2021/2022 compared to a contraction of 0.3% in 2020.
The outperformance witnessed in October 2021 continues the positive trend in revenue collection seen in the first four months of FY’2021/2022, with the monthly average revenue collection at Kshs 157.8 bn. We expect a continued revenue outperformance in the medium term, partly attributable to the expanded tax base coupled with the expected economic recovery. However, we note that historically, KRA has always fallen short of its revenue collection target save for FY’2020/2021 whereby it recorded a 101.0% outperformance as highlighted in our Cytonn Weekly #27/2021. Given the recent easing of lockdown restrictions in the country, we expect KRA to collect more as the economy bounces back to its pre-pandemic levels. However, the ongoing pandemic still remains a threat and creates an air of uncertainty, that is, if infections were to spike and lockdown measures reinstated, the government would likely struggle to sustain the current revenue performance.
Rates in the fixed income market have remained relatively stable due to the sufficient levels of liquidity in the money markets despite the huge debt appetite by the government. The government is 16.4% ahead of its prorated borrowing target of Kshs 240.6 bn having borrowed Kshs 280.1 bn of the Kshs 658.5 bn borrowing target for the FY’2021/2022. We expect a gradual economic recovery going into FY’2021/2022 as evidenced by KRAs collection of Kshs 631.1 bn in revenues during the first four months of the current fiscal year, which is equivalent to 104.5% of the prorated revenue collection target. However, despite the projected high budget deficit of 7.5% and the lower credit rating from S&P Global to 'B' from 'B+', we believe that the monetary support from the IMF and World Bank will mean that the interest rate environment may stabilize since the government will not be desperate for cash.
Markets Performance
During the week, the equities market was on a downward trajectory, with NASI, NSE 20 and NSE 25 declining by 3.9%, 0.6% and 2.4%, respectively, taking their YTD performance to gains of 12.4%, 4.1% and 10.2% for NASI, NSE 20 and NSE 25, respectively. The equities market performance was driven by losses recorded by large cap stocks such as Safaricom and Diamond Trust Bank (DTB-K) of 6.1% and 3.0%, respectively. The decline was however mitigated by gains recorded by stocks such as EABL, ABSA and Equity which gained by 1.8%, 0.5% and 0.4%, respectively.
During the week, equities turnover declined by 5.7% to USD 16.5 mn, from USD 17.5 mn recorded the previous week, taking the YTD turnover to USD 1.0 bn. Foreign investors remained net sellers, with a net selling position of USD 0.3 mn, from a net selling position of USD 1.9 mn recorded the previous week, taking the YTD net selling position to USD 28.4 mn.
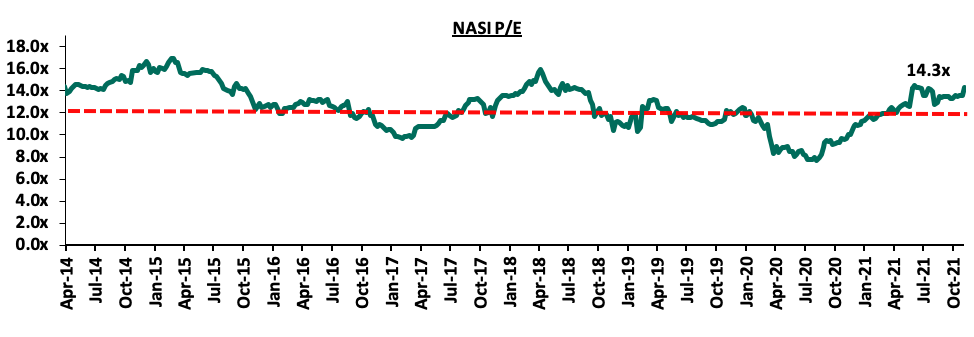
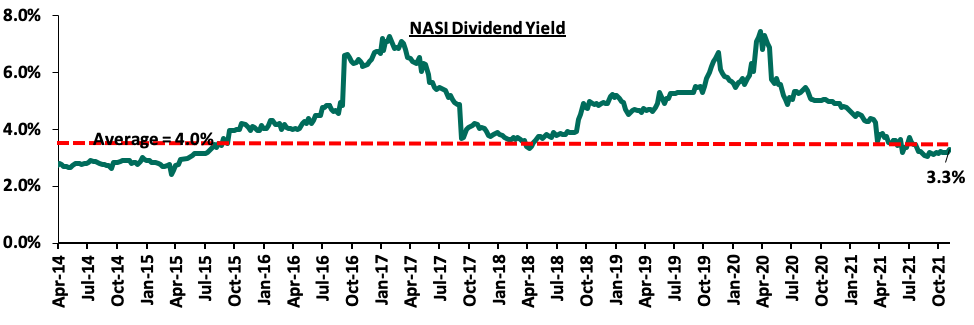
The market is currently trading at a price to earnings ratio (P/E) of 14.3x, 10.4% above the historical average of 12.9x, and a dividend yield of 3.3%, 0.7% points below the historical average of 4.0%. Key to note, NASI’s PEG ratio currently stands at 1.6x, an indication that the market is trading at a premium to its future earnings growth. Basically, a PEG ratio greater than 1.0x indicates the market may be overvalued while a PEG ratio less than 1.0x indicates that the market is undervalued. Excluding Safaricom, which is currently 61.7% of the market, the market is trading at a P/E ratio of 12.2x and a PEG ratio of 1.4x. The current P/E valuation of 14.3x is 85.5% above the most recent trough valuation of 7.7x experienced in the first week of August 2020. The charts below indicate the historical P/E and dividend yields of the market.
Weekly Highlight:
During the week, MTN Uganda announced that it had received a no objection from Kenya’s Capital Markets Authority for marketing its Initial Public Offer (IPO) in Kenya, following the opening of the IPO in Uganda on 11th October 2021. The MTN Uganda IPO is expected to close on 22nd November 2021 and the listing of MTN Uganda shares on the Uganda Stock Exchange (USE) will commence on 6th December 2021. The telco is selling 4.5 bn ordinary shares to the public, which represents 20.0% of the company’s 22.4 bn shares. MTN International will remain the highest shareholders with 76.0% of the total shares while Charles Mbire will hold 4.0% of the shares. MTN Uganda is currently selling the shares at Ushs 200 per share, equivalent to Kshs 6.3 per share. At the price of Ushs 200 (Kshs 6.3), MTN Uganda is trading at an estimated price to book multiple of 6.0x, compared to Safaricom which is trading at price to book multiple of 13.4x, presenting better value for investors. The IPO is open to Ugandan investors, Kenyans and citizens from other East African Countries. Investors can apply for at least of 500 shares which will cost a minimum of Ushs 100,000 (Kshs 3,139) per investor. Additionally, all East African investors who apply for the shares will receive 5 bonus shares for every 100 shares they are allocated.
To increase participation and ease the application process, MTN has embraced use of an online portal and MyMTN app through which investors across East Africa can apply for the IPO. Kenyan investors are required to open a Securities Central Depository (SCD) account at the Uganda Securities Exchange (USE) to apply for the MTN Uganda IPO through the online platforms. Although MTN Uganda has plans to expand in East Africa having listed on Rwanda Securities Exchange, the firm is not planning to cross-list with Nairobi Securities Exchange (NSE) in the near future as anticipated.
Uganda has a population of around 45.7 mn people with a mobile penetration of 68.0% as at June 2021, compared to Kenya, which has mobile penetration rate of 132.2% as at 31st March 2021 according to the Communications Authority of Kenya. We believe that this regional cross-border IPO will provide Kenyan investors a wider scope of investment opportunities and will set standards for East Africa’s Capital Market participation in regional cross-border offerings within a structured framework.
Universe of coverage:
|
Company |
Price as at 29/10/2021 |
Price as at 05/11/2021 |
w/w change |
YTD Change |
Year Open 2021 |
Target Price* |
Dividend Yield |
Upside/ Downside** |
P/TBv Multiple |
Recommendation |
|
I&M Group*** |
21.5 |
21.8 |
1.4% |
(51.5%) |
44.9 |
32.0 |
10.3% |
57.5% |
0.6x |
Buy |
|
Kenya Reinsurance |
2.4 |
2.3 |
(4.1%) |
0.4% |
2.3 |
3.1 |
8.6% |
42.2% |
0.2x |
Buy |
|
NCBA*** |
24.1 |
24.1 |
0.0% |
(9.4%) |
26.6 |
31.0 |
6.2% |
34.9% |
0.6x |
Buy |
|
ABSA Bank*** |
10.2 |
10.3 |
0.5% |
7.7% |
9.5 |
13.8 |
0.0% |
34.6% |
1.2x |
Buy |
|
KCB Group*** |
44.0 |
43.5 |
(1.0%) |
13.3% |
38.4 |
53.4 |
2.3% |
25.1% |
0.9x |
Buy |
|
Co-op Bank*** |
12.5 |
12.5 |
0.0% |
(0.4%) |
12.6 |
14.1 |
8.0% |
20.8% |
0.9x |
Buy |
|
Standard Chartered*** |
130.0 |
129.8 |
(0.2%) |
(10.2%) |
144.5 |
145.4 |
8.1% |
20.2% |
1.0x |
Buy |
|
Diamond Trust Bank*** |
58.8 |
57.0 |
(3.0%) |
(25.7%) |
76.8 |
67.3 |
0.0% |
18.1% |
0.3x |
Accumulate |
|
Stanbic Holdings |
94.0 |
87.0 |
(7.4%) |
2.4% |
85.0 |
96.6 |
4.4% |
15.4% |
0.8x |
Accumulate |
|
Equity Group*** |
49.7 |
49.9 |
0.4% |
37.7% |
36.3 |
57.5 |
0.0% |
15.2% |
1.4x |
Accumulate |
|
Liberty Holdings |
8.0 |
7.5 |
(6.3%) |
(2.6%) |
7.7 |
8.4 |
0.0% |
12.0% |
0.6x |
Accumulate |
|
Sanlam |
11.5 |
12.4 |
7.8% |
(4.6%) |
13.0 |
12.4 |
0.0% |
0.0% |
1.1x |
Sell |
|
Jubilee Holdings |
360.0 |
343.8 |
(4.5%) |
24.7% |
275.8 |
330.9 |
2.6% |
(1.1%) |
0.7x |
Sell |
|
Britam |
8.0 |
7.8 |
(1.8%) |
11.7% |
7.0 |
6.7 |
0.0% |
(14.3%) |
1.4x |
Sell |
|
HF Group |
3.8 |
3.8 |
0.3% |
21.7% |
3.1 |
3.1 |
0.0% |
(18.8%) |
0.2x |
Sell |
|
CIC Group |
2.6 |
2.4 |
(6.3%) |
13.7% |
2.1 |
1.8 |
0.0% |
(25.0%) |
0.8x |
Sell |
|
Target Price as per Cytonn Analyst estimates **Upside/ (Downside) is adjusted for Dividend Yield ***For Disclosure, these are stocks in which Cytonn and/or its affiliates are invested in Key to note, I&M Holdings YTD share price change is mainly attributable to the counter trading ex-bonus issue |
||||||||||
We are “Neutral” on the Equities markets in the short term. With the market currently trading at a premium to its future growth (PEG Ratio at 1.6x), we believe that investors should reposition towards companies with a strong earnings growth and are trading at discounts to their intrinsic value. We expect the discovery of new COVID-19 variants coupled with slow vaccine rollout in developing economies to continue weighing down the economic outlook. On the upside, we believe that the recent relaxation of lockdown measures in the country will lead to improved investor sentiments in the economy.
- Residential Sector
During the week, Unity Homes, a Kenyan-British housing developer began the construction of 640- two- and three-bedroom apartments dubbed Unity East at Tatu City in Ruiru. The move by the developer comes immediately after the completion of Unity West phase one project comprising of 384- two bedroom units which is also located in Tatu City, and Unity Gardens project in Eldoret comprising of 250 homes completed in 2020. Below is the summary of the sales prices of the Unity East units with an expected completion date of November 2023;
|
Tatu City’s Unity East Development |
|||
|
Typology |
Unit size (SQM) |
Unit Price (Kshs mn) |
Price per SQM(Kshs) |
|
2 |
75 |
6.5 |
86,667 |
|
3 |
150 |
13.0 |
86,667 |
|
Average |
113 |
9.8 |
86,667 |
Source: Cytonn Research
In terms of performance, according to the Cytonn Q3’2021 Markets Review, Ruiru recorded the highest annualized uptake at 20.7% against market average of 16.5%, signifying high demand for housing units in the area. Additionally, total returns in Ruiru came in at 6.1%, a 0.3% points higher than the market average and signifying the investment opportunity. The decision by Unity Developers to maintain Ruiru as its project destination is supported by; i) ease of accessibility facilitated by roads such as the Thika Superhighway and Eastern Bypass, ii) availability of amenities such as the Spur Mall and Kenyatta University among others, and iii) high demand for housing necessitated by Ruiru’s high population growth rate at 4.6%, against Kenya’s 2.3%.
The table below shows the market performance of apartments within satellite towns in Q3’2021;
(All values in Kshs unless stated otherwise)
|
Lower Mid- End Satellite Towns Apartments Performance-Q3’2021 |
||||||||
|
Area |
Price per SQM Q3'2021 Average |
Rent per SQM Q3'2021 Average |
Occupancy Q3'2021 Average |
Uptake Q3'2021 Average |
Annual Uptake Q3'2021 Average |
Rental Yield Q3'2021 Average |
Price Appreciation Q3’2021 Average |
Total Returns Q3’2021 Average |
|
Rongai |
97,664 |
344 |
86.5% |
89.3% |
19.6% |
5.6% |
2.1% |
7.7% |
|
Thindigua |
94,549 |
468 |
80.5% |
88.8% |
21.1% |
5.1% |
2.3% |
7.4% |
|
Kikuyu |
82,114 |
460 |
74.8% |
82.4% |
18.3% |
5.0% |
2.3% |
7.4% |
|
Ngong |
63,446 |
346 |
73.7% |
74.5% |
12.2% |
5.0% |
2.1% |
7.1% |
|
Ruaka |
107,629 |
522 |
92.4% |
84.1% |
23.8% |
5.5% |
1.1% |
6.6% |
|
Ruiru |
89,249 |
493 |
84.3% |
82.1% |
20.7% |
5.6% |
0.5% |
6.1% |
|
Syokimau |
64,953 |
334 |
84.2% |
81.3% |
11.9% |
5.5% |
(1.8%) |
3.7% |
|
Kitengela |
59,394 |
242 |
93.0% |
83.1% |
10.0% |
4.7% |
(1.3%) |
3.4% |
|
Athi River |
58,769 |
353 |
70.0% |
89.0% |
10.9% |
5.7% |
(2.7%) |
3.0% |
|
Average |
79,752 |
396 |
82.2% |
83.8% |
16.5% |
5.3% |
0.5% |
5.8% |
Source; Cytonn Research
We expect the residential sector to record increased activities driven by continued focus by developers on the lower mid-end market segments, fuelled by positive demographics necessitating more demand for housing units in the country.
- Retail Sector
During the week, Chandarana Foodplus, a local retailer opened a new outlet at new Golden Life Mall in Nakuru, bringing its total operational outlets countrywide to 22. The move comes barely three months after the retailer opened a new outlet in Eldoret. The retailer also announced plans to open an additional outlet in Malindi Mall, signifying its aggressive expansion strategy. The decision to open the new outlet in Nakuru is supported by; i) Strategic location of the mall along the Great North Road promoting accessibility, ii) increased demand evidenced by Nakuru’s high population growth rate at 3.2%, a 0.9% points higher than Kenya’s growth rate at 2.3%, and, iii) Nakuru’s low rental rates of Kshs 59.0 per SQFT, which is lower than the market’s average price of Kshs 118.0 per SQFT as at the end of Q3’2021. The table below shows a summary of the performance of the retail sector in key urban cities in Kenya;
|
Summary of Retail Performance in Key Urban Cities in Kenya 2021 |
|||
|
Region |
Rent (Kshs) 2021 |
Occupancy Rate 2021 |
Rental yield 2021 |
|
Mount Kenya |
128 |
81.7% |
7.9% |
|
Nairobi |
168 |
75.8% |
7.5% |
|
Mombasa |
119 |
77.6% |
6.8% |
|
Kisumu |
101 |
74.6% |
6.4% |
|
Eldoret |
131 |
80.8% |
6.3% |
|
Nakuru |
59 |
80.0% |
6.1% |
|
Average |
118 |
78.4% |
6.8% |
Source: Cytonn Research 2021
The table below shows the summary of the number of stores of the Key local and international retailer supermarket chains in Kenya;
|
Main Local and International Retail Supermarket Chains |
|||||||||
|
Name of Retailer |
Category |
Highest number of branches that have ever existed as at FY’2018 |
Highest number of branches that have ever existed as at FY’2019 |
Highest number of branches that have ever existed as at FY’2020 |
Number of branches opened in 2021 |
Closed branches |
Current number of Branches |
Number of branches expected to be opened |
Projected number of branches FY’2021 |
|
Naivas |
Local |
46 |
61 |
69 |
8 |
0 |
77 |
4 |
81 |
|
QuickMart |
Local |
10 |
29 |
37 |
9 |
0 |
46 |
0 |
46 |
|
Chandarana |
Local |
14 |
19 |
20 |
1 |
0 |
22 |
1 |
23 |
|
Carrefour |
International |
6 |
7 |
9 |
5 |
0 |
16 |
0 |
16 |
|
Cleanshelf |
Local |
9 |
10 |
11 |
1 |
0 |
12 |
0 |
12 |
|
Tuskys |
Local |
53 |
64 |
64 |
0 |
61 |
3 |
0 |
3 |
|
Game Stores |
International |
2 |
2 |
3 |
0 |
0 |
3 |
0 |
3 |
|
Uchumi |
Local |
37 |
37 |
37 |
0 |
35 |
2 |
0 |
2 |
|
Choppies |
International |
13 |
15 |
15 |
0 |
13 |
2 |
0 |
2 |
|
Shoprite |
International |
2 |
4 |
4 |
0 |
4 |
0 |
0 |
0 |
|
Nakumatt |
Local |
65 |
65 |
65 |
0 |
65 |
0 |
0 |
0 |
|
Total |
257 |
313 |
334 |
24 |
178 |
183 |
5 |
188 |
|
Source: Online Search
We expect the continued aggressive expansion by local and international retailers to cushion the performance of the retail sector in the near term. This will be supported by; i) the reopening of the economy which is expected to enhance a favorable environment for doing businesses, ii) changing consumer tastes and preferences, and, iii) positive demographics evidenced by Kenya’s relatively high urbanization and population growth rates of 4.0% p.a and 2.3% p.a, against the global average of 1.9% p.a and 1.1% p.a, respectively. However, the performance of the retail sector is expected to be negatively impacted by the oversupply in the retail market at 3.0 mn SQFT in the Nairobi Metropolitan Area (NMA) and 1.7 mn SQFT in Kenya’s retail market, and, the continued focus on e-commerce.
- Infrastructure
During the week, Transport Cabinet Secretary, Hon. James Macharia commissioned the construction of the 54.0 Km Mto Mwagodi-Mbale-Wundanyi-Bura road. The upgrading of the road to bitumen standard is to be done through Kenya Rural Roads Authority (KeRRA) at a cost of Kshs 2.2 bn. The project is expected to be completed by the end of 2024. Upon completion, the road will; i) ease transportation of goods to various areas such as Mwatate and Wundanyi constituencies, ii) open up surrounding areas for investments thereby boosting property prices, and, iii) promote tourism activities by enhancing ease of access to tourist destinations such as the Taita Hills.
The government continues to initiate and implement infrastructure projects evidenced by the numerous ongoing projects like the Nairobi Expressway, Western Bypass, and, the Nairobi Commuter Rail project, among others. We expect more developments in the sector supported by the additional 0.6% budget allocation to Kshs 182.5 bn for the FY’2021/2022, from Kshs 181.4 bn in FY’2020/2021, coupled by the government’s initiative to develop quality and adequate roads aiming to make Kenya an intra-regional hub for trade in East Africa. The graph below shows the budget allocation to the infrastructure sector over the last nine financial years:
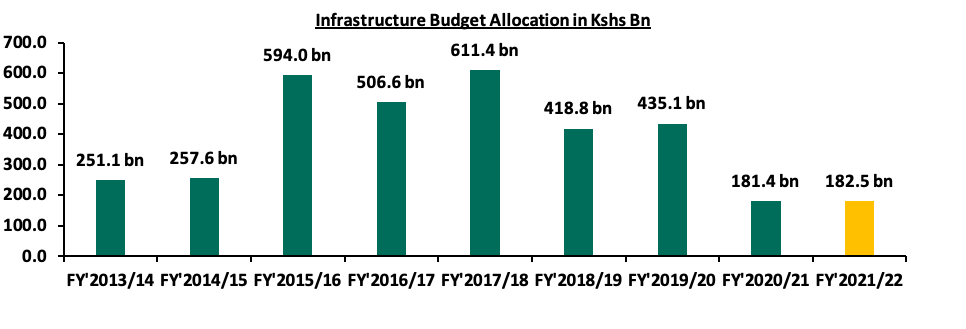
Source: National Treasury
- Listed Real Estate
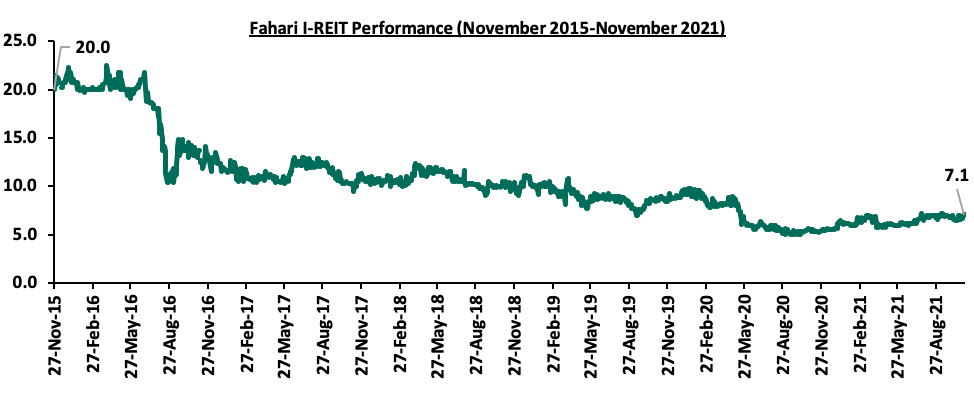
ILAM Fahari I-REIT closed the week trading at Kshs 7.1 per share, a 6.0% WTD and 22.4% YTD increase from Kshs 6.7 and Kshs 5.8 per share, respectively. On inception to date basis, the share price is still generally low having begun trading in November 2015 at Kshs 20.0, representing a 64.5% decline. We therefore expect the REIT’s performance to continue being on a downward trajectory mainly attributed to a general lack of knowledge on the financing instrument, coupled with the general lack of interest of the REIT by investors, and a high minimum investments amounts set at Kshs 5.0 mn discouraging those interested in investing in it. The graph below shows the REIT’s performance from November 2015 to November 2021:
We expect the real estate sector in Kenya to continue registering more activities supported by increased activities in the residential sector, aggressive expansion by local retailers, and, continued implementation of infrastructural projects opening up areas for real estate investments. However, the low performance of the REIT sector is expected to slightly impede performance of the real estate sector.
In 2020, we published the Nairobi Metropolitan Area Serviced Apartments Report 2020, which highlighted that serviced apartment’s average rental yield declined by 3.6% points to 4.0%, from the 7.6% recorded in 2019. This was attributed to declines in monthly charges per SQM to Kshs 2,533, from Kshs 2,806 recorded in 2019, coupled with declines in occupancy levels to 48.0%, from 79.4% recorded in 2019. The decline in performance was attributable to reduced demand for hospitality facilities and services, due to the COVID-19 pandemic which saw the government ban all international flights and local flights into Mombasa and Nairobi, among other restrictive measures aimed at curbing the spread of the Coronavirus. This year, we update our report by focusing on;
- Overview of the Kenyan Hospitality Sector
- Introduction to Serviced Apartments,
- Supply and Distribution of Serviced Apartments within the NMA,
- Performance of Serviced Apartments in the NMA,
- Serviced Apartments Performance by Node
- Comparative Analysis- 2020/2021 Market Performance
- Performance per Typology
- Recommendation and Outlook.
Section I: Overview of the Kenyan Hospitality Sector
The hospitality sector has been on a recovery path in 2021, as evidenced by the increasing number of hotels in operation, hotel bookings and bed occupancies during the year. In 2020, the hospitality sector was among the worst hit sectors by the COVID-19 pandemic following the international travel ban, lockdowns and social distancing measures put in place to curb the spread of the virus. These measures led to the decline in hotel bookings and occupancies, and, the closure of many hospitality-affiliated businesses. However, according to the Central Bank of Kenya Monetary Policy Committee Hotels Survey-September 2021, the number of hotels in operation have improved over the last few months coming in at 96.0% in September 2021 from 81.0% in April 2021.
The graph below shows the overall percentage of the number of operating hotels in Kenya from June 2020 to September 2021;
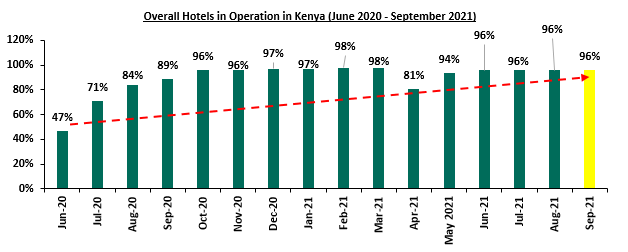
Source: Central Bank of Kenya
Consequently, the average bed occupancy in September 2021 was at 38.0%, 8.0% points increase from 30.0% recorded in July 2021, attributable to the lifting of the travel restrictions, coupled with the gradual recovery of the economy which has seen hotels and other institutions operating in the hospitality industry resume operations. The graph below highlights the hotel bed occupancy rates in Kenya between June 2020 and September 2021;
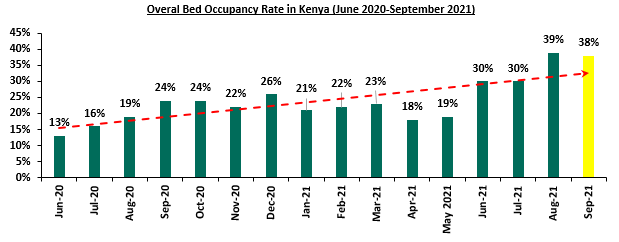
Source: Central Bank of Kenya
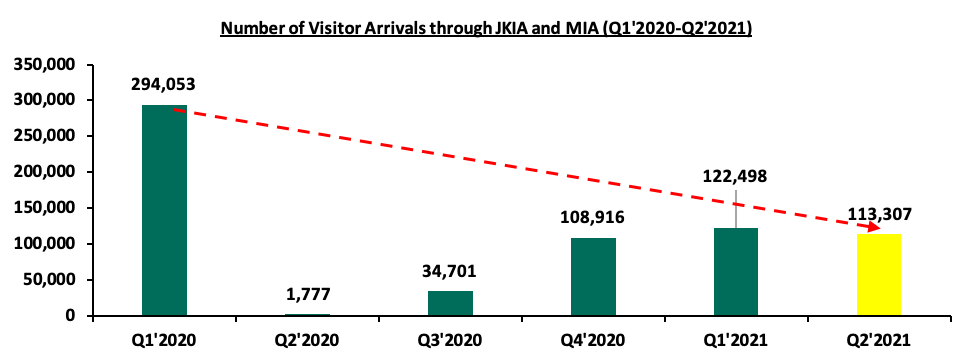
In terms of quarterly analysis, international arrivals through Jomo Kenyatta International Airport (JKIA) and Moi International Airport (MIA) registered an improvement to 113,307 visitors in Q2’2021 from 1,177 visitors in Q2’2020. This is as a result of the ease of the pandemic restrictions and lockdowns, coupled with the aggressive efforts by the Ministry of Tourism to market the Kenyan hospitality sector to international markets. However, the number of visitor arrivals through the two airports recorded a decline of 7.5% to 113,307 persons in Q2’2021 from 122,498 persons in Q1’2021. The decline in the number of international arrivals was largely attributed to the level four travel advisory alert initiated by the United States of America (USA) and United Kingdom (UK) listing Kenya on its “Red-List” as a high risk country in April 2021, due to the rise in number of COVID-19 cases. This consequently caused a drop in the number of international arrivals to Kenya as the two countries are regarded as key source markets of tourists in Kenya. The ‘UK Red-List’ was however dropped in October 2021.
For the month of July, according to the latest Kenya National Bureau of Statistics Leading Economic Indicators August 2021, the number of international visitors arriving through Jomo Kenyatta (JKIA) and Moi International Airports (MIA) increased by 42.2% to 69,025 persons in July 2021 from 48,532 persons in June 2021. The total number of international arrivals passing through JKIA and MIA from January to July was 304,371 persons, which was a 4.6% increase from the 291,024 persons over the same period in 2020.
The graph below shows the number of international arrivals in Kenya between Q1’2020 and Q2’2021;
Source: Kenya National Bureau of Statistics
Some of the factors that continue to cushion the hospitality sector include;
- Relaxation of COVID-19 Measures: The relaxation of travel advisories from countries such as the UK, who have since removed Kenya from the Red-List to Green, and the easing of social distancing measures, are factors expected to lead to the reopening of Kenya’s key tourism markets,
- Hospitality Sector Support Events: The Ministry of Tourism has organized events such as the World Rally Championship (WRC) expected to be hosted in Kenya annually until 2026, and the World Under 21 Athletics Championships which were held at Moi International Sports centre in August 2021. These events continue to boost visitor arrivals, hotel bookings and the general performance of the hospitality industry,
- Mass COVID-19 Vaccination: Vaccination against COVID-19 has boosted travel confidence into the country for both holiday and business reasons. This is evidenced by the aforementioned increase in the number of operating hotels which have improved over the last few months, coming in at 96.0% in September 2021, from 81.0% recorded in April 2021,
- Positive Hospitality Sector Accolades: In October 2021, World Travel Awards (WTA), a global institution that acknowledges, rewards and celebrates excellence across all sectors of the tourism industry yearly, announced the 28th World Travel Awards On the African level, Nairobi was voted as Africa’s leading business travel destination supported by availability of conferencing facilities such as KICC, top rated accommodation facilities, infrastructure, and a stable political and Macro-Economic environment. This, among other key notable awards indicates continued confidence in Kenya’s hospitality industry despite the impact of the COVID-19 pandemic, and,
- Aggressive Local and International Marketing of Kenya’s Hospitality Industry: On the local level, the hospitality sector players have employed measures such as price discounts in order to attract more local clientele as future travel uncertainties continue to cloud the international clientele. This has had a huge effect on numbers since local guests continued to account for majority of clientele population at 5% for accommodation and 78.9% for restaurant services between August and September 2021, which was an increase from 62.0% and 68.7%, respectively, recorded in the pre-COVID period. This is according to the Monetary Policy Committee Hotels Survey-September 2021. The Ministry of Tourism has also embarked on an ambitious plan to market Kenya as a desirable tourist destination in the international markets through the Magical Kenya Platform, with activities currently underway in the Ukraine and other countries.
The graph below highlights the percentages of local and foreign clients served in hotels in Kenya between June 2021 and September 2021;
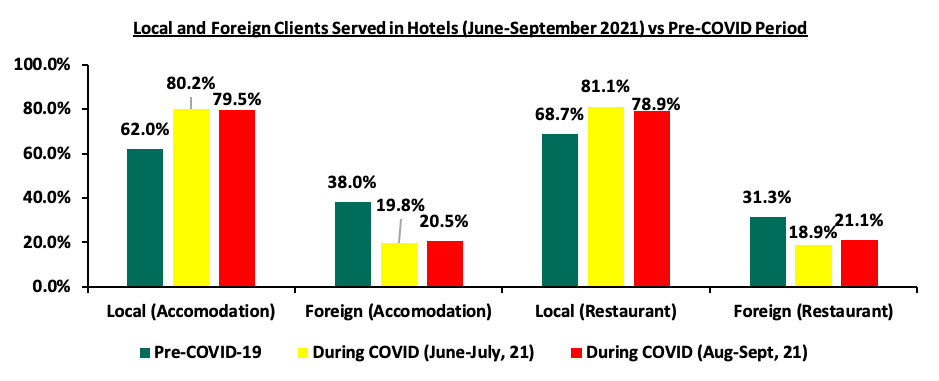
Source: Central Bank of Kenya
Nevertheless, the sector continues to face challenges among them;
- Overreliance on Meetings, Incentives, Conferences and Events (MICE): Since the onset of the pandemic, most people have had to shift from physical to online meetings. Even when the COVID-19 measures were partly lifted, these facilities could not hold to capacity. This has led to the rise of e-conferencing and online meeting platforms such as Google Meet and Zoom, thereby reducing the need for physical space,
- COVID-19 Pandemic: Despite the improved performance of the hospitality sector, we expect the sector to return to pre-COVID normalcy levels by 2024. With the emergence of new COVID-19 strains and most economies currently in the third wave of the pandemic, we expect delays in the hospitality sector recovery, as countries impose more restrictions with new developments in regard to COVID-19,
- Reduced Private Sector Lending: Given the elevated credit risk associated with lending to the private sector, we have seen most lenders continue to lend cautiously given the high loan default rates. According to Central Bank of Kenya (CBK), the tourism, restaurant and hotel industry recorded gross non-performing loans worth Kshs 16.3 bn in Q1’2021, which was a 7.2% increase from Kshs 15.2 bn as recorded in Q4'2020. The market has thus slowed down as a result of the conservative underwriting approach, and,
- Budget Cuts: The budgetary allocation for the tourism sector decreased by 11.3% from Kshs 20.4 bn in FY’2020/21 to Kshs 18.1 bn in FY’2021/22, as the government looks to shift allocations towards Covid-19 recovery measures such as medical supplies. This is expected to slow down the hospitality sector development and operational activities due to limited funds.
Section II: Introduction to Serviced Apartments
To update our 2020 topical, we embarked on an analysis of serviced apartments in the Nairobi Metropolitan Region. A serviced apartment is a type of furnished apartment available for short term or long-term stays, which provides amenities for daily use and housekeeping services all included in the rental charges. The serviced apartments provide facilities much like the traditional hotels, however, they have added space, convenience and privacy just like a home so that the occupants get the feel of a “home away from home”.
The advantages of a serviced apartment include;
- Extra room services such as laundry services and general housekeeping are offered as opposed to traditional hotels,
- Some serviced apartments are designed to resemble the culture of some specific areas. They are usually blended to reflect different tastes and preferences as opposed to an ordinary hotel room,
- Serviced apartments offer a “home far from home” feel compared to hotels since they have more utilities,
- Ease of integration, as the concept provides guests with a chance to integrate with the larger community as they are located within or in close proximity to other residential developments, and,
- For investors, serviced apartments can easily be converted into furnished or normal apartments in the case where the former is not performing well.
Section III: Supply and Distribution of Serviced Apartments in the Nairobi Metropolitan Area
The number of serviced apartments within the Nairobi Metropolitan Area (NMA) increased by a 7-Year CAGR of 8.5% to 6,044 apartments in 2021, from 3,414 apartments in 2015, with one of the key facilities coming into the market this year being 250-room Skynest Serviced Apartments, located in Westlands and the 160-room Habitat Residences located in Kilimani. Spring Valley also debuted the 40-room Elsie Ridge which has been completed this year. In terms of distribution, Westlands and Kilimani have the largest market share of serviced apartments within the Nairobi Metropolitan Area, at 37.9% and 24.3%, respectively. This is attributed to the attractiveness of the areas due to; i) their proximity to the Nairobi CBD and other major business nodes such as Upperhill, ii) relatively good infrastructure promoting connectivity to other key areas, iii) concentration of international organizations such as the United Nations and various Embassies, and, iv) availability of social amenities such as shopping malls within the areas.
The table below indicates the serviced apartments market share in the Nairobi Metropolitan Area;
|
Nairobi Metropolitan Area (NMA) Serviced Apartments Market Share 2021 |
|
|
Area |
Percentage Market Share |
|
Westlands & Parklands |
37.9% |
|
Kilimani |
24.3% |
|
Kileleshwa & Lavington |
15.5% |
|
Upperhill |
9.7% |
|
Limuru Road |
6.8% |
|
CBD |
2.9% |
|
Thika Road |
1.9% |
|
Spring Valley |
1.0% |
|
Total |
100.0% |
Source: Online Research
For the projects in the pipeline, the Nairobi Metropolitan Area currently has 5 serviced apartments or hotels with serviced apartments’ concepts in the pipeline. Some of these key development include;
|
Name |
Location |
Number of Rooms |
Estimated Completion Date |
|
9 Oak |
Kilimani |
120 |
2022 |
|
JW Marriot |
Westlands |
350 |
2022 |
|
Avic |
Westlands |
51 |
2022 |
|
Grand Hyatt |
Westlands |
225 |
2022 |
|
Britam |
Kilimani |
163 |
2022 |
|
Total |
|
909 |
|
Source: Online Research
Section IV: Performance of Serviced Apartments in the Nairobi Metropolitan Area
For the purpose of this report, we tracked the performance of serviced apartments in 7 nodes within the Nairobi Metropolitan Area and compared this to the performance to 2020. The key metrics we looked at include:
- Charged Rates: This is the amount guests pay for an apartment in a specific market, on a daily basis, weekly and/or monthly. This forms the basis for evaluating the rental income investors are likely to gain from investing in serviced apartment,
- Occupancy Rates: This measures the number of apartments that are inhabited of the total available, in order to inform on the expected rental yield of the developments, and,
- Rental Yields: This refers to the measure of return on the real estate investment, from the rental income collected annually. The rental yield informs potential investors on the return they are likely to get from a property and hence the time it will take an investor to recoup the money invested. To calculate this, we have estimated annual income from monthly revenues having deducted operational costs assumed to be at 40.0% of revenues.
To estimate the investment value, we have calculated development cost per SQM by factoring in land costs based on the location, construction costs, equipping costs, professional fees and other development-related costs. The formula to calculate rental yield is as follows;
Rental Yield= Monthly Rent per SQM x Occupancy Rate x (1-40.0% operational cost) x 12 months Development Cost per SQM *
Key to note is that depending on the actual incurred land cost, plot ratios, the level of finishing and equipping, investors will generally incur varying costs. On performance, we will start by covering the performance by the node during the year, compare this with 2020 performance, then cover the performance by typology;
- Serviced Apartments Performance by Node
From our research and analysis, serviced apartments within the NMA recorded an average rental yield of 5.5% in 2021, 1.5% points higher than the 4.0% recorded in 2020. This is attributed to the increase in monthly charges per SQM by 0.7% to Kshs 2,549, from Kshs 2,533 recorded in 2020. Average occupancy also increased by 13.5% points to 61.5% in 2021, from the 48.0% recorded in 2020. The performance improvement is attributable to increased demand for hospitality facilities and services as a result of the reopening of the economy, the return of international flights, and focused marketing of serviced apartments to local clients. Most serviced apartments have also been issuing discounts to attract and maintain clients. Westlands and Kileleshwa were the best performing nodes in 2021, with a rental yield of 8.3% and 6.4%, respectively compared to the market average of 5.5%. Thika Road was the least performing node with a rental yield of 3.5%, 2.0% points lower than the market average of 5.5% and we attribute this to the this relatively low charge rates for apartments within the area given its unpopularity, the significant distance from main commercial zones, in addition to security concerns as the area is not mapped within the UN Blue Zone.
The table below shows a summary of the performance of the various nodes within the NMA;
|
2021 NMA Serviced Apartments Performance per Node |
||||||||||||
|
Average Unit Sizes (SQM) |
Monthly Charge/Unit (Kshs) |
|
||||||||||
|
Node |
Studio |
1 Bed |
2 Bed |
3 Bed |
Studio |
1 Bed |
2 Bed |
3 bed |
Occupancy |
Monthly Charge/ SQM (Kshs) |
Devt Cost/SQM (Kshs) |
Rental Yield |
|
Westlands |
37 |
57 |
87 |
114 |
175,000 |
208,410 |
262,639 |
300,000 |
68.8% |
3,568 |
209,902 |
8.3% |
|
Kileleshwa & Lavington |
38 |
91 |
128 |
166 |
120,000 |
218,500 |
296,667 |
440,000 |
57.1% |
2,571 |
206,132 |
6.4% |
|
Kilimani |
47 |
75 |
114 |
193 |
155,340 |
252,750 |
319,872 |
380,143 |
60.0% |
2,815 |
202,662 |
5.8% |
|
Limuru Road |
44 |
52 |
79 |
116 |
119,000 |
187,636 |
217,500 |
240,000 |
60.5% |
2,853 |
231,715 |
4.9% |
|
Nairobi CBD |
51 |
82 |
85 |
119 |
67,500 |
132,500 |
215,714 |
409,000 |
66.6% |
2,176 |
224,571 |
4.9% |
|
Upperhill |
- |
95 |
119 |
195 |
- |
216,667 |
290,000 |
393,333 |
61.1% |
2,109 |
209,902 |
4.5% |
|
Thika Road |
- |
70 |
101 |
145 |
- |
100,000 |
193,333 |
280,000 |
56.4% |
1,748 |
200,757 |
3.5% |
|
Average |
43 |
75 |
102 |
150 |
127,368 |
188,066 |
256,532 |
348,925 |
61.5% |
2,549 |
212,234 |
5.5% |
|
High |
51 |
95 |
128 |
195 |
175,000 |
252,750 |
319,872 |
440,000 |
68.8% |
3,568 |
231,715 |
8.3% |
|
Low |
37 |
52 |
79 |
114 |
67,500 |
100,000 |
193,333 |
240,000 |
56.4% |
1,748 |
200,757 |
3.5% |
|
· Overall, average occupancy for serviced apartments in the NMA increased by 13.5% points to 61.5% in 2021, from the 48.0% recorded in 2020 |
||||||||||||
Source: Cytonn Research 2021
- Comparative Analysis- 2020/2021 Market Performance
Overall, serviced apartments’ year on year performance improved, with the occupancy rates increasing by 13.5% points to 61.5%, from 48.0% recorded in 2020. The monthly charges per SQM increased by 0.7% to Kshs 2,549 in 2021 from Kshs 2,533 recorded in 2020. The average rental yield increased by 1.5% points to 5.5% in 2021, from 4.0% recorded in 2020. This is mainly attributable to an increase in the number of local and international tourist arrivals following the lift of travel bans by countries such as the UK. This led to increased number of hotel bookings, occupancies and operational hotels during the period. The increase in the number of tourists is attributable to the; i) aggressive local marketing through price discounts, and, international marketing through the Magical Kenya platform in countries such as the Ukraine, ii) positive accolades for the Kenyan hospitality sector, iii) the return of international flights which had stalled from COVID-19 operational guidelines, and, iv) the mass vaccination currently underway in the country boosting confidence in the sector;
The table below shows the comparative analysis between 2020 and 2021;
All values in Kshs unless stated otherwise
|
Comparative Analysis-2020/2021 Market Performance |
|||||||||
|
Node |
Occupancy 2021 |
Occupancy 2020 |
Change in Occupancy |
Monthly Charge/SQM 2021 (Kshs) |
Monthly Charge/SQM 2020 (Kshs) |
% Change in Monthly Charges/SQM |
Rental Yield 2021 |
Rental Yield 2020 |
Change in Rental Yield |
|
Westlands |
68.8% |
49.4% |
19.4% |
3,569 |
3,584 |
(0.4%) |
8.3% |
6.1% |
2.2% |
|
Kileleshwa & Lavington |
57.1% |
48.1% |
9.0% |
2,571 |
2,553 |
0.7% |
6.4% |
4.3% |
2.1% |
|
Nairobi CBD |
66.6% |
42.1% |
24.6% |
2,176 |
2,122 |
2.5% |
4.9% |
2.9% |
2.0% |
|
Kilimani |
60.0% |
48.4% |
11.7% |
2,815 |
2,783 |
1.1% |
5.8% |
4.8% |
1.0% |
|
Thika Road |
56.4% |
48.1% |
8.3% |
1,748 |
1,726 |
1.3% |
3.5% |
2.0% |
1.6% |
|
Upperhill |
61.1% |
48.9% |
12.2% |
2,109 |
2,121 |
(0.6%) |
4.5% |
3.6% |
0.9% |
|
Limuru Road |
60.5% |
51.4% |
9.1% |
2,853 |
2,839 |
0.5% |
4.9% |
4.5% |
0.4% |
|
Average |
61.5% |
48.0% |
13.5% |
2,549 |
2,533 |
0.7% |
5.5% |
4.0% |
1.5% |
|
· Average rental yield increased by 1.5% points to 5.5% in 2021 from 4.0% recorded in 2020. This is mainly attributable to an increase in the number of local and international tourists from the lift of travel bans |
|||||||||
Source: Cytonn Research 2021
- Westlands and Kileleshwa were the best performing nodes with a rental yield of 8.3% and 6.4%, respectively compared to the market average of 5.5%. The submarkets recorded an increase in rental charges by 2.2% and 2.1% points, respectively, compared to an overall market increase of 1.5%. This can be attributed the strategic locations of these areas given its the proximity Nairobi CBD, availability of high quality serviced apartments, ease of accessibility, and proximity to most international organizations hence the demand.
- Performance by Typology
In terms of performance by typology, studio units recorded the highest average rental yield at 6.2%, mainly attributed to the relatively high monthly charges/SQM at Kshs 3,044, compared to 1, 2 and 3 bedroom units at Kshs 2,571, 2,574 and 2,476, respectively. The performance of studio units is also supported by relatively high average occupancy at 62.4% compared to 2 and 3 bedroom units at 57.7% and 57.5%, respectively.
|
Summary per Typology |
||||
|
Typology |
Average Size per SQM |
Monthly Charges per SQM (Kshs) |
Occupancy (%) |
Rental Yield (%) |
|
Studio |
43 |
3,044 |
62.4% |
6.2% |
|
One Bedroom |
75 |
2,571 |
71.4% |
5.9% |
|
Two Bedroom |
102 |
2,574 |
57.7% |
5.6% |
|
Three Bedroom |
150 |
2,476 |
57.5% |
5.1% |
|
Average |
92 |
2,664 |
62.2% |
5.7% |
|
· Studio units recorded the highest average rental yield at 6.2%, mainly attributed to the relatively high monthly charges/SQM at Kshs 3,044, compared to 1, 2 and 3 bedroom units at Kshs 2,571, 2,574 and 2,476, respectively |
||||
Source: Cytonn Research 2021
Section V: Recommendations and Outlook
Having looked at the factors driving the hospitality industry, and specifically the serviced apartments sector, challenges and the current performance, we now conclude with a recommendation of the investment opportunity and outlook.
|
Serviced Apartments Sector Outlook |
||
|
Measure |
Sentiment |
Outlook |
|
Serviced Apartments Performance |
· Serviced apartments in the NMA recorded an average rental yield of 5.5% in 2021, 1.5% points higher than the 4.0% recorded in 2020. Average occupancies also increased by 13.5% points to 61.5% in 2021 from 48.0% in recorded in 2020. · Our outlook is neutral since the sector has not recovered fully from the effects of the COVID-19 pandemic and full recovery to pre-COVID levels is expected by 2024. |
Neutral |
|
International Tourism |
· International arrivals through Jomo Kenyatta International Airport (JKIA) and Moi International Airport (MIA) registered an improvement to 113,307 visitors in Q2’2021 from 1,177 visitors in Q2’2020 This is as a result of the ease of the pandemic restrictions and lockdowns, coupled with the aggressive efforts by the Ministry of Tourism to market the Kenyan hospitality industry as an attractive destination to the rest of the world. · Our outlook is still neutral due to the uncertainties brought about by the possibility of subsequent COVID-19 waves, and drastic measures by key source markets such as the US and the UK in case of developments in regard to the pandemic. |
Neutral |
|
MICE Tourism |
· Kenya has continued to gain popularity as a MICE hub with Kenyatta International Conference Centre (KICC) being recognized as Africa’s leading meeting and conference centre (MICE) in the WTA awards 2021. · Going forward this is expected to be supported by improving infrastructure, and, stable political and macro-economic environment. The wide array of awards indicates continued confidence in Kenya’s hospitality industry despite the impact of COVID-19 pandemic. However, the rise of e-conferencing and online meeting platforms such as Google Meet and Zoom meetings have continued to reduce the need for physical space in conducting meetings. |
Neutral |
|
Supply |
· The number of serviced apartments within the Nairobi Metropolitan Area (NMA) increased by a 7-Year CAGR of 8.5% to 6,044 apartments in 2020, from 3,414 apartments in 2015, with one of the key facilities coming into the market this year being 250-room Skynest Serviced Apartments located in Westlands and the 160-room Habitat Residences located in Kilimani. Spring Valley has also debuted the 40-room Elsie Ridge which was completed this year. · We expect developments in the pipeline to continue adding to the current supply and fostering competition to the benefit of clients |
Neutral |
Given that all our key metrics are neutral, we have a neutral overall outlook for the hospitality sector. Investment opportunity lies in Westlands and Kileleshwa were the best performing nodes with a rental yield of 8.3% and 6.4%, respectively, compared to the market average of 5.5%.
Disclaimer: The views expressed in this publication are those of the writers where particulars are not warranted. This publication, which is in compliance with Section 2 of the Capital Markets Authority Act Cap 485A, is meant for general information only and is not a warranty, representation, advice or solicitation of any nature. Readers are advised in all circumstances to seek the advice of a registered investment advisor.

- Talk to us
- Kenya
- P.O Box 20695 - 00200, Nairobi, Kenya
- Cell +254709101200
- Tel +254709101200
- WhatsApp +254741676635
- United States
- +254709101200
- DOWNLOAD OUR APP
-


- Kenya
- 8th Floor, Pinetree Plaza, Kaburu Drive, Ngong Road, Nairobi, Kenya
- USA
- Suite 1150, 1775 Eye Street NW, USA, Washington DC 20006, USA
- Investments
- High Yield
- Private Equity
- Real Estate
- Real Estate
- RiverRun Estates
- Cytonn Towers
- The Ridge
- Taraji Heights
- The Alma