Nairobi Metropolitan Area (NMA) Serviced Apartments Report 2022, & Cytonn Weekly #47/2022
By Research, Nov 27, 2022
Executive Summary
Fixed Income
During the week, T-bills remained oversubscribed, albeit at a lower rate, with the overall subscription rate declining to 113.4%, from the 170.8% recorded the previous week. The lower subscription is partly attributable to tightened liquidity in the money market with the average interbank rate increasing to 4.8% from 4.4% recorded the previous week. Investor’s preference for the shorter 91-day paper persisted, with the paper receiving bids worth Kshs 12.7 bn against the offered Kshs 4.0 bn, translating to a subscription rate of 316.8%, down from 406.3% recorded the previous week. The subscription rates for the 364-day and 182-day papers declined to 76.9% and 68.5% from 89.5% and 158.0%, respectively, recorded the previous week. The yields on the government papers were on an upward trajectory, with the yields on the 364-day, 182-day and 91-day papers increasing by 3.8 bps, 1.2 bps and 4.6 bps to 10.2%, 9.7% and 9.2%, respectively. In the Primary Bond Market, government re-opened two bonds in the primary market, FXD1/2008/20 and FXD1/2022/25, with effective tenors of 5.6 years and 24.9 years, respectively, in a bid to raise Kshs 40.0 bn for budgetary support. Further, the government is seeking to raise Kshs 87.8 bn in a switch auction of three Treasury Bills issues Nos. 2494/91, 2454/182 and 2380/360 and T-Bond issue No. FXD1/2021/2, with an infrastructure bond, IFB1/2022/6;
We are projecting the y/y inflation rate for November 2022 to fall within the range of 9.7%-10.1%, mainly driven by high fuel and increasing food prices. Additionally, the Monetary Policy Committee (MPC) met on November 23rd 2022 to review the outcome of its previous policy decisions and recent economic developments. In line with our expectation, the MPC increased the CBR rate, albeit by 50.0 bps against our projected 25.0 bps, to 8.75% from the previous 8.25%;
Additionally, according to Ghana’s Ministry of Finance, Ghana’s Public Debt stood at USD 54.5 bn, equivalent to 77.5% of GDP as of May 2022 with external debt to GDP at 39.9% while that of the domestic debt at 37.5%. As such, the country is expected to be under high debt distress and this has been exacerbated by the high level of inflation which is at an all-time high of 40.4%, coupled with continued depreciation of the Cedi;
Equities
During the week, the equities market was on a downward trajectory, with NASI, NSE 20 and NSE 25 declining by 1.3%, 0.8%, and 0.7%, respectively, taking YTD performance to losses of 23.8%, 13.7% and 17.3% for NASI, NSE 20 and NSE 25, respectively. The equities market performance was mainly driven by losses recorded by stocks such as KCB Group, Bamburi, Safaricom and Equity Group of 3.1%, 2.6%, 2.4% and 1.8% respectively. The losses were however mitigated by gains recorded by banking stocks such as NCBA Group, Co-operative Bank, and Standard Chartered Bank by of 7.4%, 3.7% and 3.1% respectively;
Additionally, during the week, six listed banks released released their Q3’2022 financial results all recording an increase in their core earnings per share. NCBA Group, Standard Chartered Bank and Stanbic Holdings recorded an increase in their Core earnings per share of 96.2%, 37.1% and 36.8%, respectively. Similarly, Equity Group, I&M Group and Diamond Trust Bank (DTB-K) recorded an increase in their Core earnings per share of 27.9%, 25.1% and 21.1%, respectively;
Real Estate
During the week, the national government, through the Permanent Secretary for State Department for Housing and Urban Development, Charles Hinga, announced plans to commence the construction of 42,000 affordable housing units within the next two months. Additionally, Shelter Afrique, a Pan-African development financier based in Nairobi’s Upperhill District, recently approved an additional 5-year corporate loan worth Kshs 1.6 bn towards Nigeria’s Mixta Real Estate Plc, to finance the construction of housing projects in Cote d’Ivoire, Senegal and Morocco. In the infrastructure sector, African Infrastructure Investment Managers (AIIM), one of Africa’s leading infrastructure private equity managers, committed Kshs 4.1 bn to Kenya’s Road Annuity Programme for the development of road infrastructure in the country to be done through the AIIM’s pan African AIIF4 Fund;
In the statutory reviews, Nairobi City Hall issued a notice on the increment of land rates to 0.115% of the current value of undeveloped land in Nairobi County based on the 2019 Draft Valuation roll, from 1st January 2023, in line with the Nairobi City Finance Act 2022. In the Real Estate Investment Trusts (REITs) segment, Fahari I-REIT closed the week trading at an average price of Kshs 6.3 per share on the Nairobi Stock Exchange, a 4.0% decline from Kshs 6.6 per share recorded the previous week, while Acorn D-REIT and I-REIT closed the week trading at Kshs 23.8 and Kshs 20.9 per unit respectively, on the Unquoted Securities Platform as at 11th November 2022, a 19.2% and 4.4% gain for the D-REIT and I-REIT, respectively, from the Kshs 20.0 inception price;
Focus of the Week
In 2021, we published the Nairobi Metropolitan Area (NMA) Serviced Apartments Report 2021, which highlighted that serviced apartment’s in the NMA recorded an average rental yield of 5.5% which was 1.5% points higher than the 4.0% recorded in 2020. The improvement in performance was mainly driven by increased demand for hospitality facilities and services as a result of the reopening of the economy. This week, we update our report using 2022 market research data, in which we discuss and determine the progress, performance, and investment opportunities for serviced apartments in the NMA. In terms of performance, the average rental yield for serviced apartments within the NMA increased by 0.7% points to 6.2% in 2022 from 5.5% in 2021. The improvement in performance was primarily on the back of improved occupancy rates and monthly charges by 4.3% points and 4.4%, to 65.8% and Kshs 2,976 per SQM, respectively, in 2022;
Investment Updates:
- Weekly Rates:
- Cytonn Money Market Fund closed the week at a yield of 10.71%. To invest, dial *809# or download the Cytonn App from Google Playstore here or from the Appstore here;
- Cytonn High Yield Fund closed the week at a yield of 13.94% p.a. To invest, email us at sales@cytonn.com and to withdraw the interest, dial *809# or download the Cytonn App from Google Playstore here or from the Appstore here;
- We continue to offer Wealth Management Training every Wednesday and every third Saturday of the month, from 9:00 am to 11:00 am, through our Cytonn Foundation. The training aims to grow financial literacy among the general public. To register for any of our Wealth Management Trainings, click here;
- If interested in our Private Wealth Management Training for your employees or investment group, please get in touch with us through wmt@cytonn.com;
- Any CHYS and CPN investors still looking to convert are welcome to consider one of the five projects currently available for assignment, click here for the latest term sheet;
- Cytonn Insurance Agency acts as an intermediary for those looking to secure their assets and loved ones’ future through insurance namely; Motor, Medical, Life, Property, WIBA, Credit and Fire and Burglary insurance covers. For assistance, get in touch with us through insuranceagency@cytonn.com;
- Cytonnaire Savings and Credit Co-operative Society Limited (SACCO) provides a savings and investments avenue to help you in your financial planning journey. To enjoy competitive investment returns, kindly get in touch with us through clientservices@cytonn.com;
Real Estate Updates:
- For an exclusive tour of Cytonn’s real estate developments, visit: Sharp Investor's Tour, and for more information, email us at sales@cytonn.com;
- Phase 3 of The Alma is now ready for occupation and the show house is open daily. To rent please email properties@cytonn.com;
- We have 8 investment-ready projects, offering attractive development and buyer targeted returns; See further details here: Summary of Investment-ready Projects;
- For Third Party Real Estate Consultancy Services, email us at rdo@cytonn.com;
- For recent news about the group, see our news section here;
Hospitality Updates:
- We currently have promotions for Staycations. Visit cysuites.com/offers for details or email us at sales@cysuites.com
During the week, T-bills remained oversubscribed, albeit at a lower rate, with the overall subscription rate declining to 113.4%, from the 170.8% recorded the previous week. The lower subscription is partly attributable to tightened liquidity in the money market with the average interbank rate increasing to 4.8% from 4.4% recorded the previous week. Investor’s preference for the shorter 91-day paper persisted, with the paper receiving bids worth Kshs 12.7 bn against the offered Kshs 4.0 bn, translating to a subscription rate of 316.8%, down from 406.3% recorded the previous week. The subscription rates for the 364-day and 182-day papers declined to 76.9% and 68.5% from 89.5% and 158.0%, respectively recorded the previous week. The yields on the government papers were on an upward trajectory, with the yields on the 364-day, 182-day and 91-day papers increasing by 3.8 bps, 1.2 bps and 4.6 bps to 10.2%, 9.7% and 9.2%, respectively.
In the Primary Bond Market, the government is seeking to raise Kshs 87.8 bn to meet upcoming domestic maturities through a switch auction of three Treasury Bills issues No. 2494/91, 2454/182 and 2380/360 and T-Bond issue No. FXD1/2021/002, with an infrastructure bond, IFB1/2022/6. Key to note, this will see the conversion of the short-term securities into a longer-term bond, easing the Government’s maturities payments pressures. The sale period ends on 30th November 2022 and the coupon rate will be market determined. Given the ample liquidity in the market, the attractive tax-free nature of the infrastructure bond and high interest rates currently offered in the market, we expect the bond to be oversubscribed. The bond of similar tenor is currently trading in the secondary market at a yield of 12.3%, as such, our recommended bidding range for the bond is 12.5%-13.0%.
Further, the CBK re-opened two bonds in the primary market, FXD1/2008/20 and FXD1/2022/25, with effective tenors of 5.6 years and 24.9 years, respectively, in a bid to raise Kshs 40.0 bn for budgetary support. The coupon rates are 13.8% for FXD1/2008/20 and 14.2% for FXD1/2022/25. We expect investors to prefer the bonds especially the longer dated one as a result of the search for higher yields. The bonds are currently trading in the secondary market at yields of 13.4% and 14.1%, for FXD1/2008/20 and FXD1/2022/25, respectively, and as such, our recommended bidding range for the two bonds are: 13.6%-13.9% for FXD1/208/20 and 14.0%-14.4% for FXD1/2022/25. The period of the sale runs until 6th December 2022.
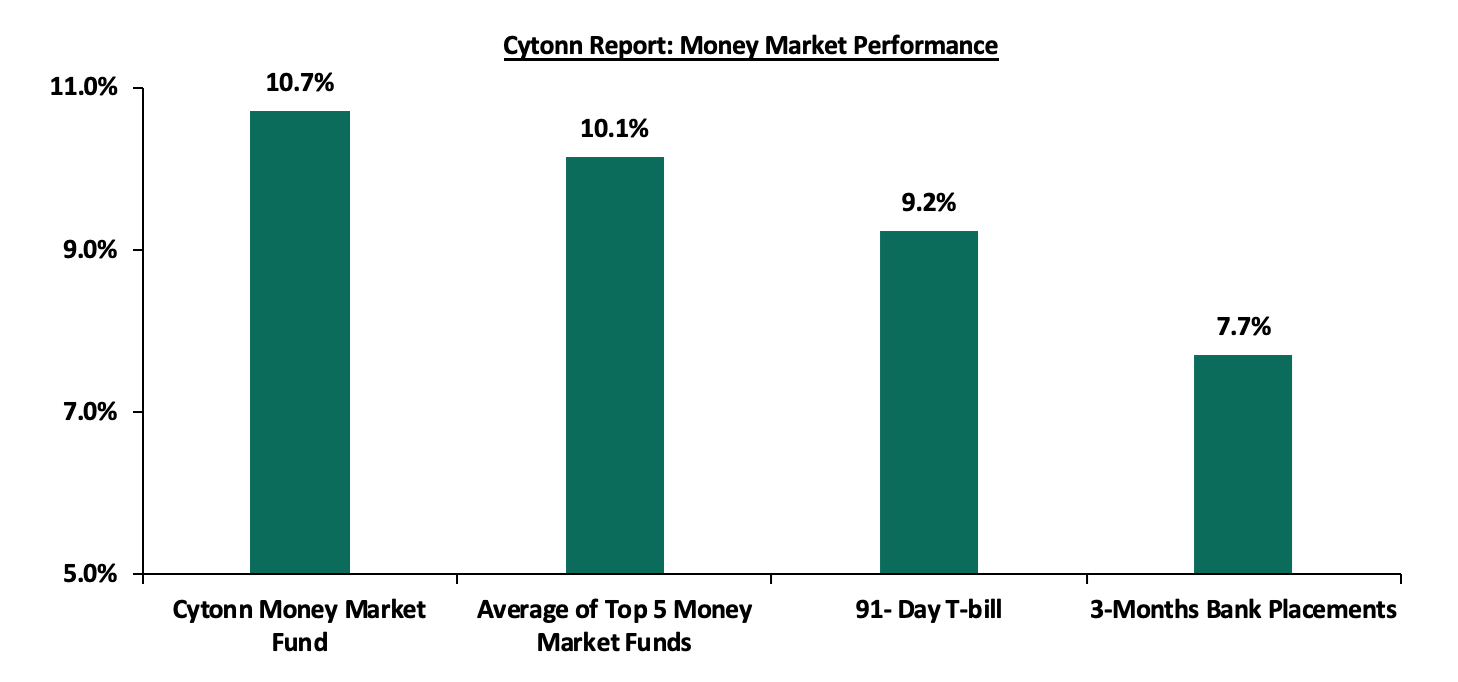
In the money markets, 3-month bank placements ended the week at 7.7% (based on what we have been offered by various banks), while the yield on the 91-day T-bill increased by 4.6 bps to 9.2%. The average yield of the Top 5 Money Market Funds and the Cytonn Money Market Fund remained unchanged at 10.1% and 10.7%, respectively.
The table below shows the Money Market Fund Yields for Kenyan Fund Managers as published on 25th November 2022:
|
Cytonn Report: Money Market Fund Yield for Fund Managers as published on 25th November 2022 |
||
|
Rank |
Fund Manager |
Effective Annual Rate |
|
1 |
GenCap Hela Imara Money Market Fund |
10.8% |
|
2 |
Cytonn Money Market Fund |
10.7% |
|
3 |
Zimele Money Market Fund |
9.9% |
|
4 |
NCBA Money Market Fund |
9.7% |
|
5 |
Sanlam Money Market Fund |
9.7% |
|
6 |
Madison Money Market Fund |
9.4% |
|
7 |
Dry Associates Money Market Fund |
9.4% |
|
8 |
Nabo Africa Money Market Fund |
9.3% |
|
9 |
Apollo Money Market Fund |
9.3% |
|
10 |
Old Mutual Money Market Fund |
9.2% |
|
11 |
Co-op Money Market Fund |
9.2% |
|
12 |
CIC Money Market Fund |
9.1% |
|
13 |
British-American Money Market Fund |
9.0% |
|
14 |
AA Kenya Shillings Fund |
8.7% |
|
15 |
ICEA Lion Money Market Fund |
8.6% |
|
16 |
Orient Kasha Money Market Fund |
8.6% |
|
17 |
Absa Shilling Money Market Fund |
7.6% |
|
18 |
Equity Money Market Fund |
5.4% |
Source: Business Daily
Liquidity:
During the week, liquidity in the money markets tightened, with the average interbank rate increasing to 4.8% from 4.4% recorded the previous week, partly attributable to tax remittances that offset government payments. The average interbank volumes traded declined by 0.7% to Kshs 21.0 bn from Kshs 21.1 bn recorded the previous week.
Kenya Eurobonds:
During the week, the yields on Eurobonds were on an upward trajectory, an indication of increasing risk concerns over the economy. The yield on the 10-year Eurobond issued in 2014 increased the most by 1.4% points to 12.8% from 11.4% recorded in the previous week. The table below shows the summary of the performance of the Kenyan Eurobonds as of 25th November 2022;
|
Cytonn Report: Kenya Eurobond Performance |
||||||
|
|
2014 |
2018 |
2019 |
2021 |
||
|
Date |
10-year issue |
10-year issue |
30-year issue |
7-year issue |
12-year issue |
12-year issue |
|
3-Jan-22 |
4.4% |
8.1% |
8.1% |
5.6% |
6.7% |
6.6% |
|
31-Oct-22 |
15.6% |
13.9% |
13.2% |
14.7% |
14.1% |
12.7% |
|
17-Nov-22 |
11.4% |
10.2% |
10.9% |
10.5% |
10.6% |
9.7% |
|
18-Nov-22 |
12.3% |
10.5% |
11.1% |
11.0% |
10.7% |
9.9% |
|
21-Nov-22 |
12.7% |
10.6% |
11.1% |
11.5% |
10.9% |
10.2% |
|
22-Nov-22 |
13.0% |
10.7% |
11.2% |
11.2% |
10.9% |
10.0% |
|
23-Nov-22 |
12.8% |
10.4% |
11.0% |
11.0% |
10.8% |
9.9% |
|
24-Nov-22 |
12.8% |
10.4% |
11.0% |
11.0% |
10.8% |
9.9% |
|
Weekly Change |
1.4% |
0.2% |
0.1% |
0.5% |
0.2% |
0.2% |
|
MTD Change |
(2.8%) |
(3.4%) |
(2.2%) |
(3.7%) |
(3.4%) |
(2.8%) |
|
YTD Change |
8.4% |
2.4% |
2.9% |
5.4% |
4.1% |
3.3% |
Source: Central Bank of Kenya (CBK)
Kenya Shilling:
During the week, the Kenyan shilling depreciated by 0.2% against the US dollar to close the week at Kshs 122.3, from Kshs 122.0 recorded the previous week, partly attributable to increased dollar demand from importers, especially oil and energy sectors against a slower supply of hard currency. On a year to date basis, the shilling has depreciated by 8.1% against the dollar, higher than the 3.6% depreciation recorded in 2021. We expect the shilling to remain under pressure in 2022 as a result of:
- High global crude oil prices on the back of persistent supply chain bottlenecks coupled with high demand,
- An ever-present current account deficit estimated at 5.3% of GDP in the 12 months to September 2022, same as what was recorded in a similar period in 2021,
- The need for Government debt servicing which continues to put pressure on forex reserves given that 68.1% of Kenya’s External debt was US Dollar denominated as of July 2022, and,
- A continued hike in the USA Fed interest rates in 2022 to a range of 3.75%-4.00% in November 2022 has strengthened the dollar against other currencies by causing capital outflows from other global emerging markets.
The shilling is however expected to be supported by:
- Improved diaspora remittances standing at a cumulative USD 4.0 bn as of October 2022, representing an 11.1% y/y increase from USD 3.6 bn recorded over the same period in 2021, and,
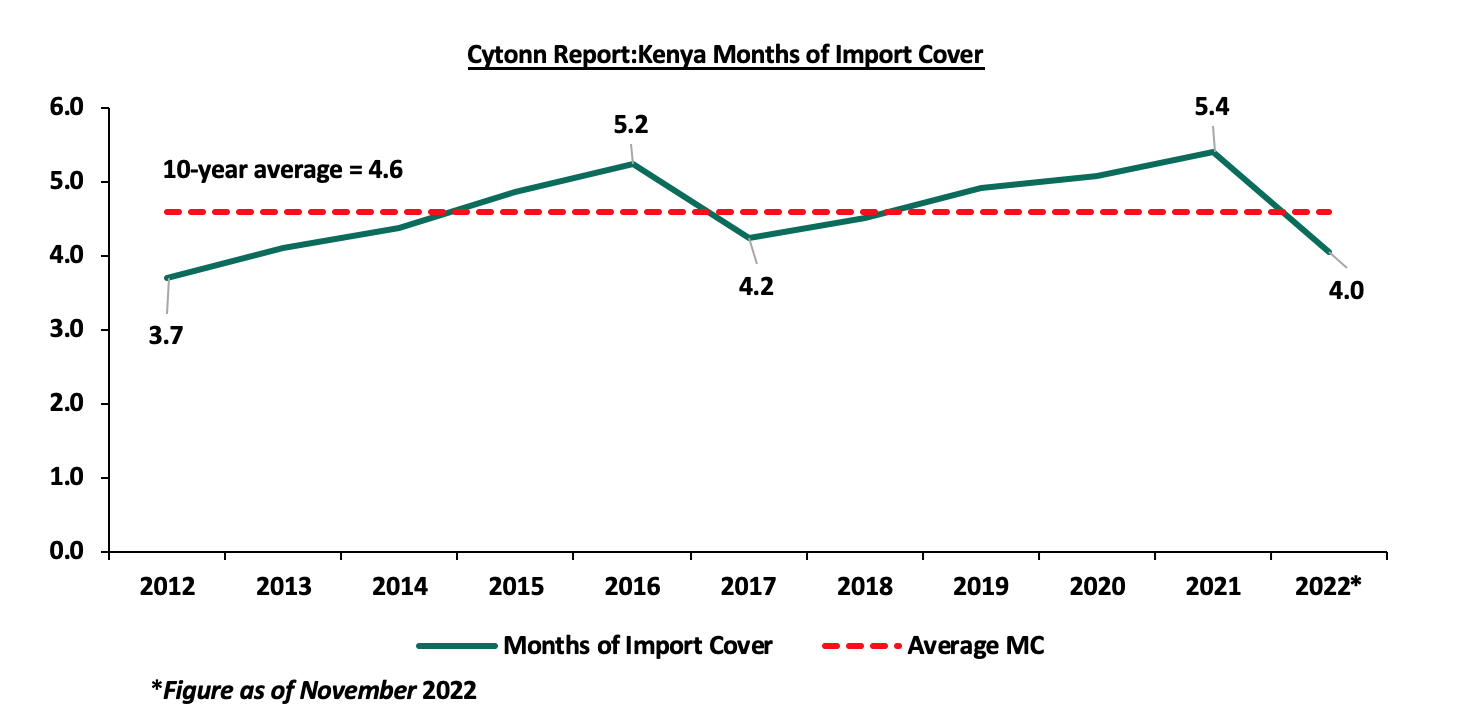
- Sufficient Forex reserves currently at USD 7.0 bn (equivalent to 4.0 months of import cover), which is currently at par with the statutory requirement of maintaining at least 4.0-months of import cover. However, it’s important to note that Forex reserves have dropped by 19.6% YTD from USD 8.8 bn. The chart below summarizes the evolution of Kenya months of import cover over the last 10 years;
Weekly Highlights:
- November 2022 Inflation Projection
We are projecting the y/y inflation rate for November 2022 to fall within the range of 9.7%-10.1%, mainly on the back of;
- High fuel prices: The fuel prices for the period between 14th November 2022 to 15th December 2022 for Super petrol, Diesel and Kerosene declined slightly by Kshs 1.0 to Kshs 179.3 per litre, Kshs 162.0 per litre and Kshs 145.9 per litre from Kshs 178.3 per litre, Kshs 163.0 per litre and Kshs 146.9 per litre, respectively. This translated to a decline of 0.7% for Kerosene and 0.6% for both Super petrol and Diesel. However, the fuel prices remain high and are expected to remain elevated due to partial removal of the fuel subsidy program by the new regime coupled with the global supply constraints. Given that fuel is a major input to most sectors, we expect the high prices to weigh on the inflation basket in the short term, and,
- Increasing food prices: This was evidenced by the 15.8% y/y increase in the prices of food & non-alcoholic beverages as of October 2022 due to increased costs of production, uneven weather patterns and drought affecting food production. Given that the index constitutes 32.9% of the inflation basket, we expect the prevailing high food prices to exert pressure on the inflation rate.
In our view, we expect the inflationary pressures to remain high mainly due to the high fuel and food prices. We also expect food prices to remain elevated for the short term, given the uneven weather patterns and drought. Notably, the Monetary Policy Committee raised the Central Bank Rate to 8.75%, from the previous 8.25% with the aim of anchoring the inflation rate which has continued to increase over the last ten months. Despite the MPC increase, we still believe that the inflationary pressures are due to external shocks and a decline is largely pegged on how soon global supply chains stabilize.
- November 2022 MPC Meeting
The Monetary Policy Committee (MPC) met on November 23rd 2022 to review the outcome of its previous policy decisions and recent economic developments, and to decide on the direction of the Central Bank Rate (CBR). In line with our expectation, the MPC increased the CBR rate, albeit by 50.0 bps to 8.75% from the previous 8.25%, higher than our projections of a 25.0 bps hike to 8.50. Below are some of the key highlights from the meeting:
- The overall inflation rose to 9.6% in October 2022 from 9.2% in September mainly attributable to food and oil prices which rose by 15.8% and 12.6% in October from 15.5% and 11.7% in September, respectively. We expect the Inflation rates to remain high in the short term as the new administration continues to do away with fuel subsidy program and adjust domestic fuel prices to ease pressure on expenditure,
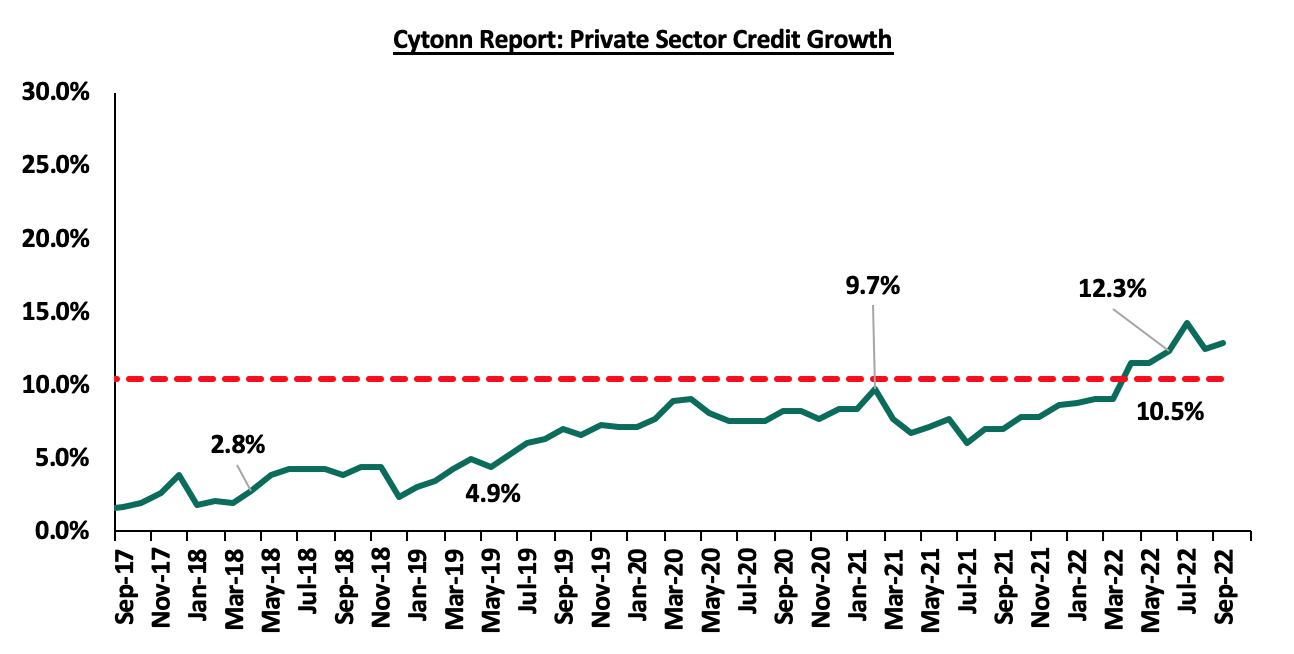
- Private sector credit growth continues to recover, having grown by 12.3% in October 2022, as compared to 7.8% in the same period last year. The key sectors that experienced increased lending were manufacturing (17.5%), trade (15.3%), business services (13.2%) and consumer durables (14.0%). The chart below shows the movement of the private sector credit growth of the last five years:
Source: CBK
- The recently released GDP data by Kenya National Bureau of Statistics (KNBS) on the Q2’ 2022 Gross Domestic Product Report, indicate that the Kenyan economy recorded a 5.2% growth in Q1’2022, down from the 11.0% growth recorded in Q2’2021 indicating continued economic recovery. The growth was mainly driven by strong activity in transport and storage, wholesale and retail trade, information and communication, real estate and financial and insurance,
- The CBK foreign exchange reserves, which currently stand at USD 7.0 mn (4.0 months of import cover), continue to provide adequate cover and a buffer against any short-term shocks in the foreign exchange market,
- The current account deficit to GDP is estimated at 5.3% in the 12 months to September 2022, a 0.3% point lower than the 5.6% that was recorded in a similar period in 2021. Exports of goods remained strong, growing by 13.9% in the 12 months to September 2022 compared to similar period in 2021. Receipts from tea and manufactured goods exports increased by 15.9% and 26.0%, respectively. The increase in tea exports reflects improved prices as a result of improved demand from traditional markets. Key to note, imports of goods increased by 18.0% in 12 months to September 2022 compared to 12.6% for the same period in 2021, and,
- The Committee noted the ongoing implementation of the FY2022/23 Government Budget, especially the strong tax revenue collection reflecting enhanced tax administration efforts and increased economic activities under the new administration. Key to note, the government is also working on a supplementary budget
The MPC noted the sustained inflationary pressures, the elevated global risks and their potential impact on the domestic economy and decided to tighten the monetary policy in order to anchor inflationary expectations. The 50.0 bps increase was also driven by the developments in the global economy with countries such as USA and Eurozone hiking their rates and leading to capital outflows from emerging markets. However, we expect that the inflation rate will remain above the CBK’s target range of 2.5%-7.5% mainly attributable to the elevated food and fuel prices which are the largest contributors to core inflation. Going forward, the committee will continue to monitor the situation and meet again in January 2023, but remains ready to re-convene earlier if necessary.
- Ghana’s Debt Distress
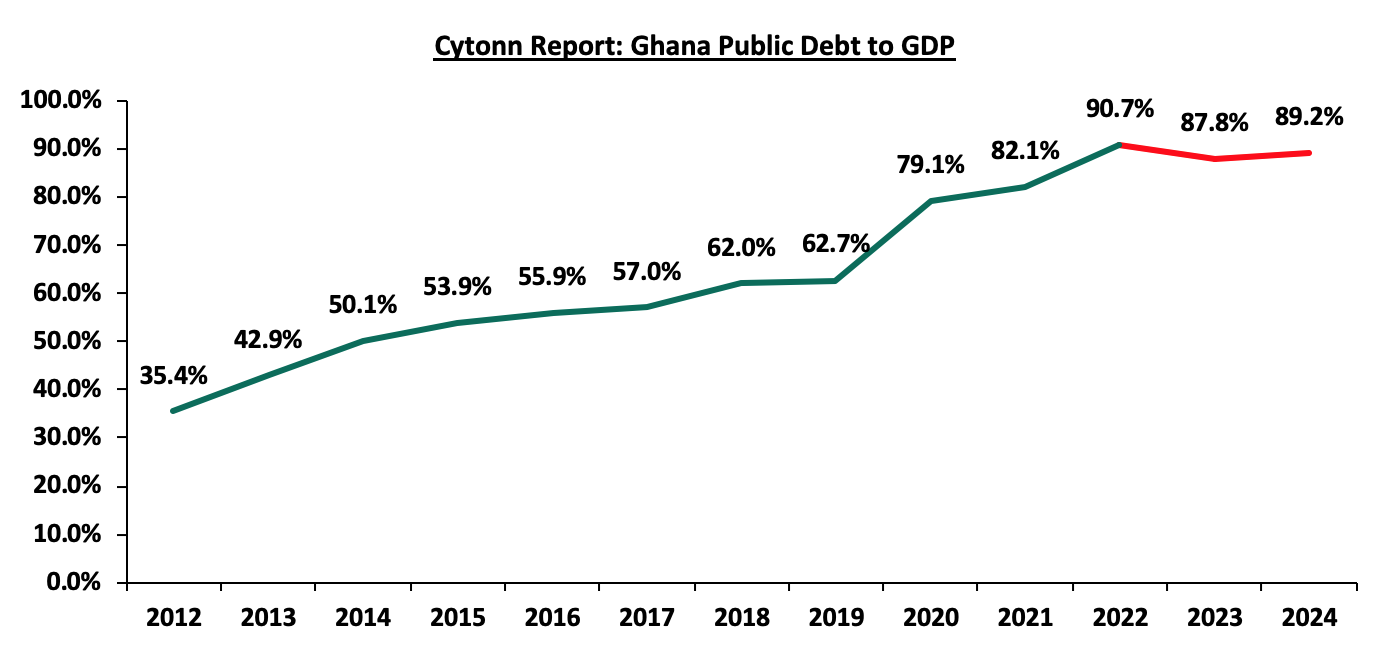
According to the Ghana’s Ministry of Finance, Ghana’s Public Debt stood at USD 54.5 bn, equivalent to 77.5% of GDP as at May 2022 with external debt to GDP at 39.9% while that of the domestic debt at 37.5%. The debt service to revenue ratio as of 2021 stood at 47.8%. According to International Monetary Fund (IMF), the government’s debt to GDP is projected at 90.7% for 2022 which is 40.7% points above the IMF’s threshold of 50.0% for developing countries. The increase in debt to GDP is largely linked to the cedi depreciation, review of payment terms for some loans as well as continued borrowing by the government. As such, the country is expected to be under high debt distress and this has been exacerbated by the high level of inflation which is at an all-time high of 40.4%, coupled with continued depreciation of the cedi, having depreciated by 135.8% to 14.5 cedis in November 2022 from 6.2 cedis in January. Below is a chart showing Ghana’s 10-year debt to GDP levels;
Source: IMF
In the month of October, Ghana’s delegation and IMF team held a discussion on the post COVID-19 economic growth and associated policies to restore macroeconomic stability and lay foundation for a stronger economy. Ghana’s economic situation is evidenced by downgrades by rating agencies such as Moody and Fitch. Key to note, Moody’s downgraded Ghana to Caa2 from Caa1 and placed it under review as a result of tough macroeconomic environment and high debt distress leading to high chances of default. Additionally, Fitch downgraded Ghana to CC from CCC due to the potential debt restructuring as among the conditions set by the IMF. The forex reserves have also declined by 20.8% to USD 7.7 bn in June 2022 (equivalent to 3.4 months of import cover) from USD 9.7 bn (equivalent to 4.4 months of import cover) in same period last year further putting pressure on the Cedi. For Ghana to qualify for IMF’s USD 3.0 bn assistance, the country will need to take steps to restructure its debt to restore debt sustainability. In aligning with IMF’s conditions, Ghana has proposed certain measures to manage its debt levels as explained below;
- International bondholders – International bondholders to get a 30.0% haircut on the bond’s principal and forego some interest payments to ensure debt sustainability,
- Domestic bondholders – The finance ministry is proposing to have the domestic bondholders to forego some interest payments. Further, the government is proposing to have domestic bondholders to switch their existing bonds for a new bond offering no coupon in the first year, 5% in the second and 10% in the third, and,
- Foreign bonds – The government is also looking to suspend coupons on foreign bonds for at least three years.
Ghana’s public debt crisis highlights the risks associated in the accumulation of public debt that is not being matched by economic growth in the Sub-Saharan Africa region. Key to note, public debt has been increasing steadily in Sub-Saharan Africa escalated by the increasing spending and reduced revenue collection during the COVID-19 pandemic. According to the IMF Regional Economic Outlook for Sub-Saharan Region, at least one-third of the region’s economies have debt levels above 70.0% of the GDP resulting to 19 of the region’s 35 low-income nations to be in debt distress or at a high risk of such. As such, more than half of the countries in the region are expected to undertake some fiscal consolidation measures which are expected to narrow the region’s deficit bringing the region’s average debt to an estimate of 55.0% of the GDP. Going forward, Sub Saharan African countries facing debt distress will need to optimize revenue mobilization strategies, prioritize spending where possible and ensuring efficiency in public spending. Besides consolidation, countries should develop medium term strategies to ensure debt management, diversification of financing sources and having effective debt-resolution mechanisms such as the G20 Common Framework.
Rates in the Fixed Income market have remained relatively stable due to the relatively ample liquidity in the money market. The government is 4.4% ahead of its prorated borrowing target of Kshs 238.1 bn having borrowed Kshs 248.6 bn of the Kshs 581.7 bn borrowing target for the FY’2022/2023. We expect sustained gradual economic recovery as evidenced by the revenue collections of Kshs 636.4 bn in the FY’2022/2023, equivalent to a 29.7% of its target of Kshs 2.1 tn. Despite the performance, we believe that the projected budget deficit of 6.2% is relatively ambitious given the downside risks and deteriorating business environment occasioned by high inflationary pressures. We however expect the support from the IMF and World Bank to finance some of the government projects and thus help maintain a stable interest rate environment since the government is not desperate for cash. Owing to this, our view is that investors should be biased towards short-term fixed-income securities to reduce duration risk.
Market Performance:
During the week, the equities market was on a downward trajectory, with NASI, NSE 20 and NSE 25 declining by 1.3%, 0.8%, and 0.7%, respectively, taking YTD performance to losses of 23.8%, 13.7% and 17.3% for NASI, NSE 20 and NSE 25, respectively. The equities market performance was mainly driven by losses recorded by stocks such as KCB Group, Bamburi, Safaricom and Equity Group of 3.1%, 2.6%, 2.4% and 1.8% respectively. The losses were however mitigated by gains recorded by banking stocks such as NCBA Group, Cooperative Bank, and Standard Chartered Bank by of 7.4%, 3.7 and 3.1% respectively.
During the week, equities turnover declined by 28.2% to USD 11.5 mn from USD 16.0 mn recorded the previous week, taking the YTD turnover to USD 750.6 mn. Additionally, foreign investors remained net sellers, with a net selling position of USD 3.9 mn, from a net selling position of USD 1.8 mn recorded the previous week, taking the YTD net selling position to USD 186.9 mn.
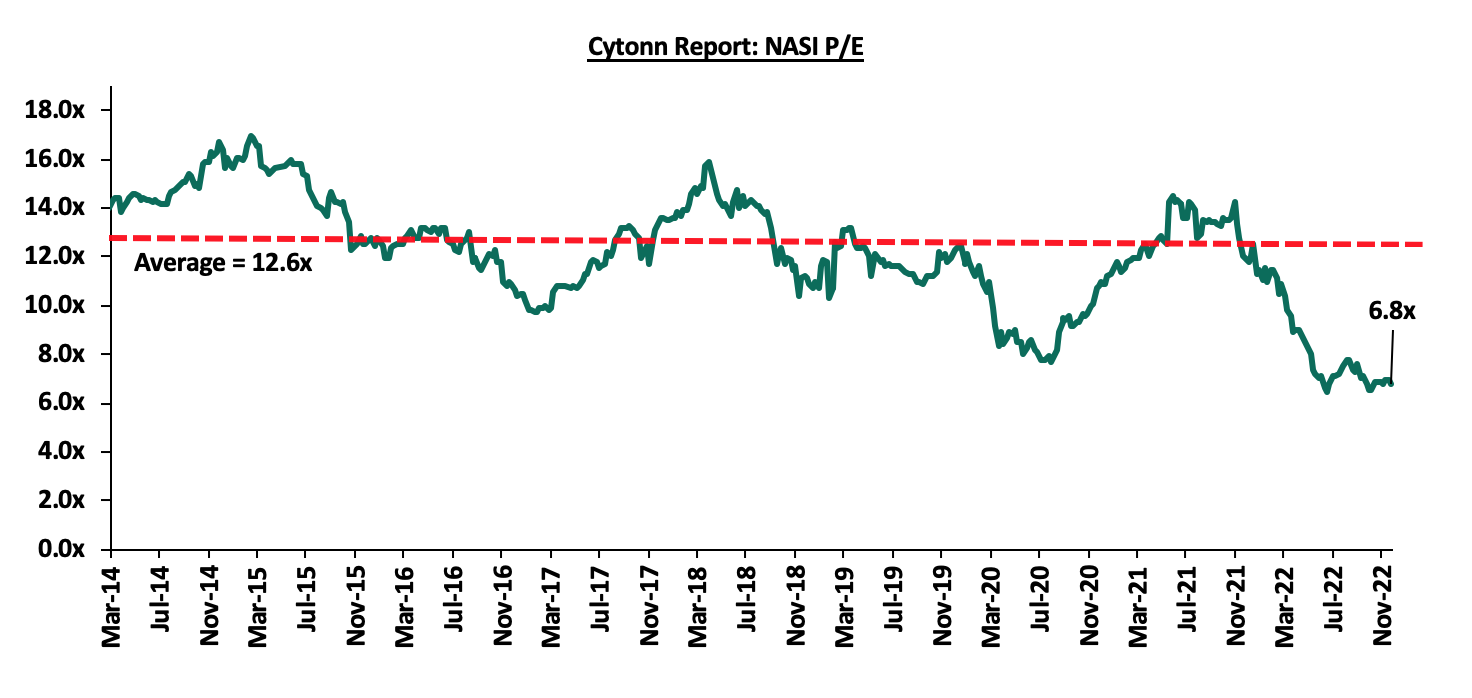
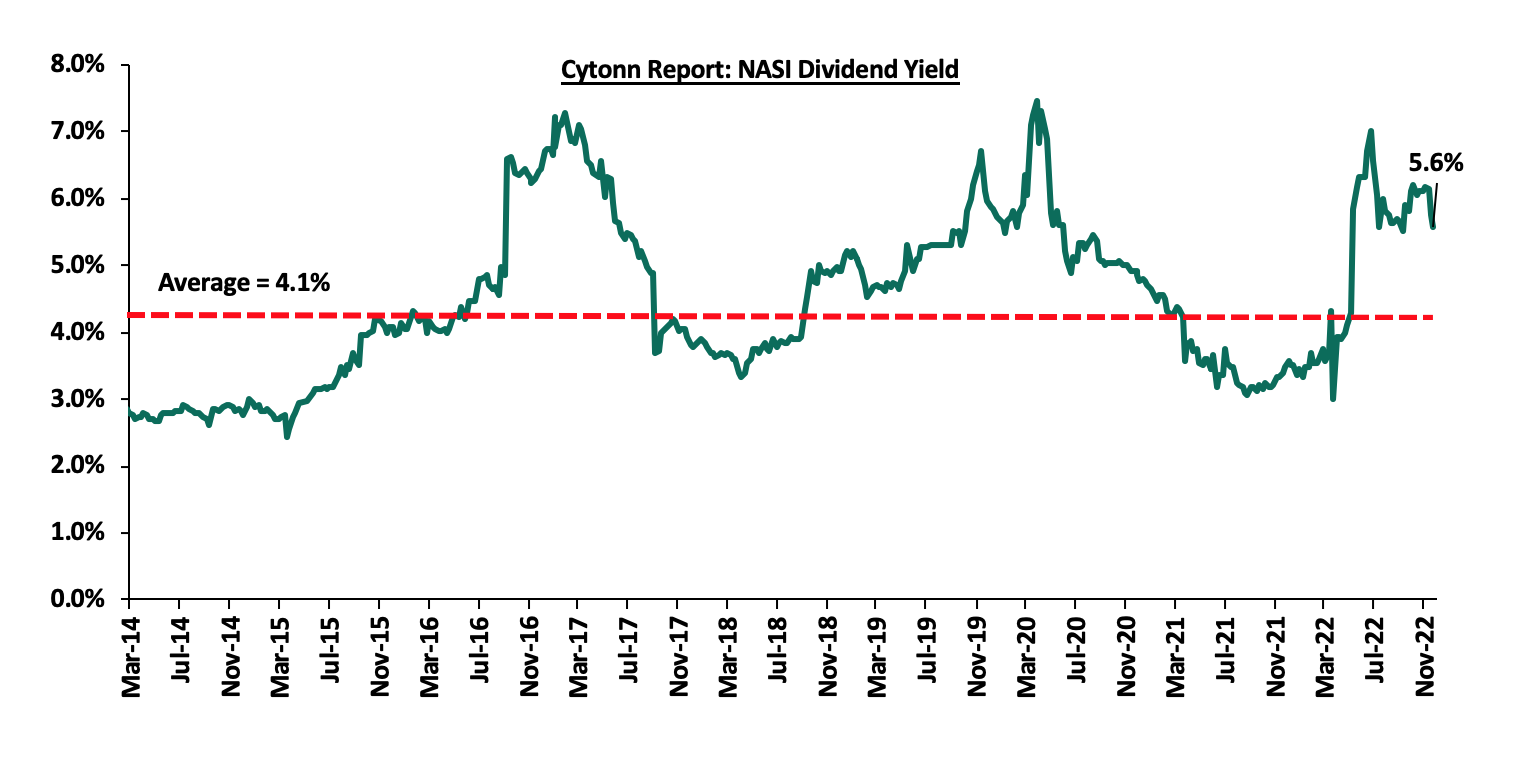
The market is currently trading at a price to earnings ratio (P/E) of 6.8x, 46.3% below the historical average of 12.6x, and a dividend yield of 5.6%, 1.5% points above the historical average of 4.1%. Key to note, NASI’s PEG ratio currently stands at 0.9x, an indication that the market is undervalued relative to its future growth. A PEG ratio greater than 1.0x indicates the market may be overvalued while a PEG ratio less than 1.0x indicates that the market is undervalued. The charts below indicate the historical P/E and dividend yields of the market;
Weekly Highlights:
Earnings Release
During the week, Equity Group, NCBA Group, Standard Chartered Bank Kenya, I&M Group, Stanbic Holdings Plc, and Diamond Trust Bank Kenya (DTB-K) Ltd released their Q3’2022 financial results. Below is a summary of their performance;
- Equity Group
|
Balance Sheet Items (Kshs bn) |
Q3’2021 |
Q3’2022 |
y/y change |
|
Government Securities |
233.2 |
233.0 |
(0.1%) |
|
Net Loans and Advances |
559.0 |
673.9 |
20.6% |
|
Total Assets |
1,184.3 |
1,363.7 |
15.2% |
|
Customer Deposits |
875.1 |
1,007.3 |
15.1% |
|
Deposits per Branch |
2.6 |
2.8 |
9.6% |
|
Total Liabilities |
1,020.9 |
1,209.7 |
18.5% |
|
Shareholders’ Funds |
156.3 |
147.5 |
(5.6%) |
|
Balance Sheet Ratios |
Q3’2021 |
Q3’2022 |
% points y/y change |
|
Loan to Deposit Ratio |
63.9% |
66.9% |
3.0% |
|
Return on average equity |
22.2% |
31.3% |
9.1% |
|
Return on average assets |
3.0% |
3.7% |
0.7% |
|
Income Statement (Kshs bn) |
Q3’2021 |
Q3’2022 |
y/y change |
|
Net Interest Income |
48.5 |
59.8 |
23.4% |
|
Net non-Interest Income |
32.0 |
42.2 |
32.0% |
|
Total Operating income |
80.5 |
102.1 |
26.9% |
|
Loan Loss provision |
(5.1) |
(9.7) |
87.9% |
|
Total Operating expenses |
(43.8) |
(57.7) |
31.7% |
|
Profit before tax |
36.6 |
44.3 |
21.0% |
|
Profit after tax |
26.9 |
34.4 |
27.9% |
|
Core EPS |
7.1 |
9.1 |
27.9% |
|
Income Statement Ratios |
Q3’2021 |
Q3’2022 |
% points y/y change |
|
Yield from interest-earning assets |
9.6% |
10.1% |
0.5% |
|
Cost of funding |
2.8% |
2.9% |
0.1% |
|
Cost of risk |
6.4% |
9.5% |
3.1% |
|
Net Interest Margin |
7.0% |
7.3% |
0.3% |
|
Net Interest Income as % of operating income |
60.3% |
58.6% |
(1.7%) |
|
Non-Funded Income as a % of operating income |
39.7% |
41.4% |
1.7% |
|
Cost to Income Ratio |
54.5% |
56.6% |
2.1% |
|
Cost to Income Ratio without LLP |
48.1% |
47.1% |
(1.0%) |
|
Cost to Assets |
3.7% |
3.8% |
0.1% |
|
Capital Adequacy Ratios |
Q3’2021 |
Q3’2022 |
% Points Change |
|
Core Capital/Total Liabilities |
15.3% |
16.9% |
1.6% |
|
Minimum Statutory ratio |
8.0% |
8.0% |
0.0% |
|
Excess |
7.3% |
8.9% |
1.6% |
|
Core Capital/Total Risk Weighted Assets |
13.5% |
16.1% |
2.6% |
|
Minimum Statutory ratio |
10.5% |
10.5% |
0.0% |
|
Excess |
3.0% |
5.6% |
2.6% |
|
Total Capital/Total Risk Weighted Assets |
16.8% |
20.7% |
3.9% |
|
Minimum Statutory ratio |
14.5% |
14.5% |
0.0% |
|
Excess |
2.3% |
6.2% |
3.9% |
|
Liquidity Ratio |
59.5% |
51.8% |
(7.7%) |
|
Minimum Statutory ratio |
20.0% |
20.0% |
0.0% |
|
Excess |
39.5% |
31.8% |
(7.7%) |
|
Adjusted core capital/ total deposit liabilities |
15.3% |
16.9% |
1.6% |
|
Adjusted core capital/ total risk weighted assets |
13.5% |
16.1% |
2.6% |
|
Adjusted total capital/ total risk weighted assets |
16.8% |
20.7% |
3.9% |
Key take-outs from the earnings release include;
- Earnings Growth: Core earnings per share increased by 27.9% to Kshs 9.1 in Q3’2022, from Kshs 7.1 recorded in Q3’2021, higher than our projections of a 24.2% increase to Kshs 8.8. The performance was driven by a 26.9% growth in total operating income to Kshs 102.1 bn, from Kshs 80.5 bn in Q3’2021 higher than our projections of 17.1%. However, the performance was weighed down by the 31.7% growth in total operating expenses to Kshs 57.7 bn, from Kshs 43.8 bn in Q3’2021,
- The Group’s diversification strategy deemed profitable - The Group’s geographical diversification strategy has continued to emerge as a net positive, with the bank’s various subsidiaries in Uganda, DRC, Rwanda, Tanzania, and South Sudan cumulatively contributing 32.0% to the bank’s total profitability and 42.0% to the group’s total asset base. Cumulatively, the group’s subsidiaries, excluding Equity Bank Kenya Ltd, recorded an 71.9% growth in their Profit after Tax (PAT) to Kshs 11.0 bn, from Kshs 6.4 bn in Q3’2021, with the Equity BCDC in DRC recording a 113.7% growth in PAT to Kshs 4.7 bn from Kshs 2.2 bn in Q3’2021, mainly driven by favorable operating business environment coupled with low banking penetration which providing more opportunities for profitability. However, concerns remain high on the high NPL levels in the group’s Tanzanian subsidiary of 23.1% and we expect the group to improve its credit assessment in the country to bring down the high NPL ratio,
- Increased Provisioning – The Group increased its Loans Loss Provision (LLPs) by 87.9% to Kshs 9.7 bn in Q3’2022, from Kshs 5.1 bn recorded in Q3’2021 aimed at mitigating increased credit risk on the back of the elevated inflationary pressures. Additionally, the NPL coverage increased to 63.0%, from 60.6% in Q3’2021 as a result of a 5.9% increase in general provisions to Kshs 28.6 bn from Kshs 27.0 bn in Q3’2021. We expect the high provisioning to cushion the Group against high credit risk on the tough operating business environment which has curtailed recovery in some sectors locally and the high NPL ratios in some of the group’s subsidiaries,
- Improved efficiency levels – The group’s cost to income ratio without LLP improved, declining by 1.0% to 47.1%, from 48.1% in Q3’2021, an indication of improved efficiency,
- Increased Lending – Q3’2022 was characterized by a 20.6% growth in loans with investments in government securities declining by 0.1%, highlighting the Group’s strategy to increase lending despite the tough operating business environment. Notably, the Group diversified risk by extending credit to various sectors in the economy with high lending recorded in sectors such as personal household, trade and real estate at 23.0%, 22.0% and 14.0%, respectively. Additionally, 43.0% of the Group’s loan book comprised of Loans extended to Small and Medium Enterprises (SMEs) operating in sectors such as real estate, trade and agriculture among others which we expect to support their recovery from the effect of the pandemic.
For a comprehensive analysis, please see our Equity Group’s Q3’2022 Earnings Note
- NCBA Group
|
Balance Sheet Items (Kshs bn) |
Q3'2021 |
Q3'2022 |
y/y change |
|
Net Loans and Advances |
238.2 |
266.1 |
11.7% |
|
Government Securities |
189.6 |
206.8 |
9.1% |
|
Total Assets |
562.6 |
595.4 |
5.8% |
|
Customer Deposits |
447.6 |
462.1 |
3.2% |
|
Deposits per branch |
5.0 |
4.4 |
(12.5%) |
|
Total Liabilities |
487.7 |
514.5 |
5.5% |
|
Shareholders’ Funds |
74.8 |
80.9 |
8.1% |
|
Balance Sheet Ratios |
Q3'2021 |
Q3'2022 |
% points change |
|
Loan to Deposit Ratio |
53.2% |
57.6% |
4.4% |
|
Return on average equity |
13.8% |
21.2% |
7.4% |
|
Return on average assets |
1.8% |
2.8% |
1.0% |
|
Income Statement (Kshs bn) |
Q3'2021 |
Q3'2022 |
y/y change |
|
Net Interest Income |
20.2 |
23.2 |
15.1% |
|
Net non-Interest Income |
16.1 |
22.5 |
40.1% |
|
Total Operating income |
36.3 |
45.8 |
26.2% |
|
Loan Loss provision |
9.2 |
8.3 |
(9.2%) |
|
Total Operating expenses |
24.7 |
26.9 |
8.9% |
|
Profit before tax |
11.1 |
18.2 |
64.5% |
|
Profit after tax |
6.5 |
12.8 |
96.2% |
|
Core EPS |
4.0 |
7.8 |
96.2% |
|
Income Statement Ratios |
Q3'2021 |
Q3'2022 |
% points change |
|
Yield from interest-earning assets |
10.0% |
10.1% |
0.1% |
|
Cost of funding |
4.1% |
4.4% |
0.3% |
|
Net Interest Spread |
5.9% |
5.7% |
(0.2%) |
|
Net Interest Margin |
6.1% |
6.0% |
(0.1%) |
|
Cost of Risk |
25.3% |
18.2% |
(7.1%) |
|
Net Interest Income as % of operating income |
55.7% |
50.8% |
(4.9%) |
|
Non-Funded Income as a % of operating income |
44.3% |
49.2% |
4.9% |
|
Cost to Income Ratio |
68.0% |
58.7% |
(9.3%) |
|
Cost to Income Ratio without LLP |
42.7% |
40.5% |
(2.2%) |
|
Capital Adequacy Ratios |
Q3'2021 |
Q3'2022 |
% points change |
|
Core Capital/Total Liabilities |
16.8% |
16.9% |
0.1% |
|
Minimum Statutory ratio |
8.0% |
8.0% |
|
|
Excess |
8.8% |
8.9% |
0.1% |
|
Core Capital/Total Risk Weighted Assets |
19.0% |
18.4% |
(0.6%) |
|
Minimum Statutory ratio |
10.5% |
10.5% |
|
|
Excess |
8.5% |
7.9% |
(0.6%) |
|
Total Capital/Total Risk Weighted Assets |
19.1% |
18.4% |
(0.7%) |
|
Minimum Statutory ratio |
14.5% |
14.5% |
|
|
Excess |
4.6% |
3.9% |
(0.7%) |
|
Liquidity Ratio |
61.7% |
55.6% |
(6.1%) |
|
Minimum Statutory ratio |
20.0% |
20.0% |
|
|
Excess |
41.7% |
35.6% |
(6.1%) |
|
Adjusted core capital/ total deposit liabilities |
17.5% |
17.5% |
(0.1%) |
|
Adjusted core capital/ total risk weighted assets |
19.8% |
19.0% |
(0.9%) |
|
Adjusted total capital/ total risk weighted assets |
19.9% |
19.0% |
(0.8%) |
Key take-outs from the earnings release include;
- Earnings Growth: Core earnings per share rose by 96.2% to Kshs 7.8, from Kshs 4.0 in Q3’2021, higher than our expectations of a 60.5% increase to Kshs 6.4. The performance was driven by the 26.2% growth in total operating income to Kshs 45.8 bn, from Kshs 36.3 bn in Q3’2021, which outpaced the 8.9% growth in total operating expenses to Kshs 26.9 bn, from Kshs 24.7 bn in Q3’2021,
- Improvement in Asset Quality - The group’s asset quality improved, with the gross non-performing loans ratio declining to 12.6% from 17.0% recoded in Q3’2021, attributable to gross non-performing loans declining by 20.9% to Kshs 36.4 bn from Kshs 46.0 bn recorded in Q3’2021. This follows the bank’s announcement to write off more than Kshs 5.5 bn of the non-performing loans under its digital lending platforms, a move in line with the Central Bank of Kenya credit repair framework which will see mobile phone digital borrowers removed from negative listing on credit reference bureaus, and,
- Significant increase in Non-Funded Income – The banks NFI recorded a y/y increase of 40.1% to Kshs 22.5 bn in Q3’2022, mainly attributable to a significant increase in Foreign Exchange income by 162.9% to Kshs 9.2 bn, from Kshs 3.5 bn recorded in Q3’2022.
- Decline in Deposits per Branch – As part of the Group’s growth strategy to increase its footprint in the market, there was an increase in the number of branches by 8 branches to 105 branches in Q3’2022 from 97 branches in Q3’2021. As such, this resulted to a 4.6% decline in deposits per branch to Kshs 4.4 bn in Q3’2022, from Kshs 4.6 bn in Q3’2021.
For a comprehensive analysis, please see our NCBA Group’s Q3’2022 Earnings Note
- Standard Chartered Bank Kenya
|
Balance Sheet Items (Kshs bn) |
Q3'2021 |
Q3'2022 |
y/y change |
|
Net loans |
131.7 |
136.1 |
3.3% |
|
Government Securities |
99.0 |
112.0 |
13.2% |
|
Total Assets |
330.7 |
366.1 |
10.7% |
|
Customer Deposits |
258.4 |
286.1 |
10.7% |
|
Deposits per Branch |
7.2 |
13.0 |
81.2% |
|
Total Liabilities |
277.6 |
310.6 |
11.9% |
|
Balance Sheet Ratios |
Q3'2021 |
Q3'2022 |
% y/y change |
|
Loan to deposit ratio |
51.0% |
47.6% |
(3.4%) |
|
Return on Average Equity |
14.5% |
21.0% |
6.5% |
|
Return on Average Assets |
2.3% |
3.3% |
1.0% |
|
Income Statement (Kshs bn) |
Q3'2021 |
Q3'2022 |
y/y change |
|
Net Interest Income |
14.7 |
15.8 |
7.3% |
|
Net non-Interest Income |
7.6 |
8.8 |
16.1% |
|
Total Operating income |
22.3 |
24.6 |
10.3% |
|
Loan Loss provision |
2.7 |
0.6 |
(76.8%) |
|
Total Operating expenses |
13.4 |
12.3 |
(8.3%) |
|
Profit before tax |
8.9 |
12.3 |
38.2% |
|
Profit after tax |
6.4 |
8.7 |
37.1% |
|
Core EPS |
16.8 |
23.1 |
37.1% |
|
Income Statement Ratios |
Q3'2021 |
Q3'2022 |
y/y change |
|
Yield from interest-earning assets |
8.0% |
7.3% |
(0.7%) |
|
Cost of funding |
1.5% |
1.1% |
(0.4%) |
|
Net Interest Spread |
6.5% |
6.2% |
(0.3%) |
|
Net Interest Margin |
6.7% |
6.3% |
(0.4%) |
|
Cost of Risk |
12.0% |
2.5% |
(9.5%) |
|
Net Interest Income as % of operating income |
66.1% |
64.3% |
(1.8%) |
|
Non-Funded Income as a % of operating income |
33.9% |
35.7% |
1.8% |
|
Cost to Income Ratio |
60.1% |
49.9% |
(10.2%) |
|
Capital Adequacy Ratios |
Q3'2021 |
Q3'2022 |
% points change |
|
Core Capital/Total Liabilities |
16.2% |
14.5% |
(1.7%) |
|
Minimum Statutory ratio |
8.0% |
8.0% |
|
|
Excess |
8.2% |
6.5% |
(1.7%) |
|
Core Capital/Total Risk Weighted Assets |
15.6% |
15.4% |
(0.2%) |
|
Minimum Statutory ratio |
10.5% |
10.5% |
|
|
Excess |
5.1% |
4.9% |
(0.2%) |
|
Total Capital/Total Risk Weighted Assets |
17.7% |
17.7% |
(0.0%) |
|
Minimum Statutory ratio |
14.5% |
14.5% |
|
|
Excess |
3.2% |
3.2% |
(0.0%) |
|
Liquidity Ratio |
67.4% |
71.9% |
4.5% |
|
Minimum Statutory ratio |
20.0% |
20.0% |
|
|
Excess |
47.4% |
51.9% |
4.5% |
|
Adjusted core capital/ total deposit liabilities |
16.2% |
14.5% |
(1.7%) |
|
Adjusted core capital/ total risk weighted assets |
15.6% |
15.5% |
(0.2%) |
|
Adjusted total capital/ total risk weighted assets |
17.7% |
17.7% |
- |
Key take-outs from the earnings release include;
- Earnings Growth: Core earnings per share rose by 37.1% to Kshs 23.1, from Kshs 16.8 in Q3’2021, lower than our expectations of a 50.1% increase to Kshs 25.2, with the variance stemming from the 10.3% increase in total operating income, which was lower than our projection of a 27.5% increase. The performance was driven by the 10.3% growth in total operating income to Kshs 24.6 bn, from Kshs 22.3 bn in Q3’2021, coupled with an 8.3% decline in total operating expenses to Kshs 12.3 bn, from Kshs 13.4 bn in Q3’2021,
- Deterioration of the Asset Quality - The group’s asset quality deteriorated slightly, with the NPL ratio increasing to 15.4% in Q3’2022, from 15.3% in Q3’2021. The decline in asset quality was attributable to the faster 4.4% increase on gross non-performing loans as compared to the 3.4% growth in gross loans. This is despite the easing credit risk in the country with the banking sector Gross NPL ratio easing slightly to 13.8% in October from 14.2% in August 2022. Key to note, on a q/q basis, Standard Chartered Bank’s Asset quality remained unchanged at 15.4% recorded in Q2’2022,
- Cautious Lending – Q3’2022 was characterized by a faster 16.4% growth in government securities as compared to the 3.3% rise in net loans, highlighting the bank preference to government lending in light of the high credit risks among corporate and individuals in the economy.
For a comprehensive analysis, please see our Standard Chartered Bank Kenya’s Q3’2022 Earnings Note
- I&M Group
|
Balance Sheet Items (Kshs bn) |
Q3'2021 |
Q3'2022 |
y/y change |
|
Government Securities |
117.5 |
114.4 |
(2.6%) |
|
Net Loans and Advances |
207.6 |
231.2 |
11.4% |
|
Total Assets |
399.1 |
428.7 |
7.4% |
|
Customer Deposits |
288.7 |
308.0 |
6.7% |
|
Deposits per Branch |
3.2 |
3.7 |
14.4% |
|
Total Liabilities |
326.9 |
355.2 |
8.7% |
|
Shareholders’ Funds |
68.0 |
68.4 |
0.6% |
|
Balance Sheet Ratios |
Q3'2021 |
Q3'2022 |
y/y change |
|
Loan to Deposit Ratio |
71.9% |
75.1% |
3.2% |
|
Return on average equity |
14.3% |
13.9% |
(0.4%) |
|
Return on average assets |
2.5% |
2.3% |
(0.2%) |
|
Income Statement (Kshs bn) |
Q3'2021 |
Q3'2022 |
y/y change |
|
Net Interest Income |
14.0 |
16.2 |
15.6% |
|
Non-Interest Income |
6.2 |
8.8 |
43.0% |
|
Total Operating income |
20.2 |
25.0 |
24.0% |
|
Loan Loss provision |
(2.8) |
(3.6) |
27.5% |
|
Total Operating expenses |
(12.5) |
(14.9) |
19.1% |
|
Profit before tax |
8.1 |
10.4 |
28.9% |
|
Profit after tax |
5.7 |
7.2 |
25.1% |
|
Earnings per share (Kshs) |
3.5 |
4.3 |
25.1% |
|
Income Statement Ratios |
Q3'2021 |
Q3'2022 |
Y/Y Change |
|
Yield from interest-earning assets |
9.8% |
10.5% |
0.7% |
|
Cost of funding |
4.0% |
4.2% |
0.2% |
|
Net Interest Spread |
5.8% |
6.3% |
0.5% |
|
Net Interest Income as % of Total Income |
69.3% |
64.6% |
(4.7%) |
|
Non-Funded Income as a % of Total Income |
30.7% |
35.4% |
4.7% |
|
Cost to Income |
62.1% |
59.7% |
(2.4%) |
|
Cost to Income Ratio without provisions |
48.1% |
45.3% |
(2.8%) |
|
Cost to Assets |
2.4% |
2.6% |
0.2% |
|
Net Interest Margin |
6.0% |
6.6% |
0.6% |
|
Capital Adequacy Ratios |
Q3'2021 |
Q3'2022 |
% points change |
|
Core Capital/Total deposit Liabilities |
20.3% |
20.7% |
0.4% |
|
Minimum Statutory ratio |
8.0% |
8.0% |
0.0% |
|
Excess |
12.3% |
12.7% |
0.4% |
|
Core Capital/Total Risk Weighted Assets |
15.9% |
15.3% |
(0.7%) |
|
Minimum Statutory ratio |
10.5% |
10.5% |
0.0% |
|
Excess |
5.4% |
4.8% |
(0.7%) |
|
Total Capital/Total Risk Weighted Assets |
20.7% |
20.1% |
(0.6%) |
|
Minimum Statutory ratio |
14.5% |
14.5% |
0.0% |
|
Excess |
6.2% |
5.6% |
(0.6%) |
|
Liquidity Ratio |
49.4% |
46.6% |
2.8% |
|
Minimum Statutory ratio |
20.0% |
20.0% |
0.0% |
|
Excess |
29.4% |
26.6% |
(2.8%) |
|
Adjusted Core Capital/Total Deposit Liabilities |
20.4% |
20.7% |
0.3% |
|
Adjusted Core Capital/Total Risk Weighted Assets |
16.0% |
15.3% |
(0.7%) |
|
Adjusted Total Capital/Total Risk Weighted Assets |
20.7% |
20.1% |
(0.6%) |
Key take-outs from the earnings release include;
- Earnings Growth: Core earnings per share increased by 25.1% to Kshs 4.3 in Q3’2022, from Kshs 3.5 in Q3’2021, higher than our projections of a 18.7% increase to Kshs 4.1. The performance was driven by a 24.0% increase in total operating income to Kshs 25.0 bn in Q3’2022, from Kshs 20.2 bn in Q3’2021, which outpaced the 19.1% increase in the total operating expenses to Kshs 14.9 bn in Q3’2022, from Kshs 12.5 bn in Q3’2021,
- Improvement in Asset Quality – The group’s asset quality improved, with the NPL ratio reducing to 9.5% in Q3’2022, from 10.2% in Q3’2021, owing to the 11.4% growth in gross loans to Kshs 231.2 bn, from Kshs 207.6 bn in Q3’2021, which outpaced the 4.2% increase in gross non-performing loans. The improved asset quality was attributable to the continued economic recovery which has seen more business pick up given that the group’s loan book constituted 71.0% and 19.0% corporate and business loans respectively as of Q3’2022. The group has also embarked on proactive credit management strategies that have seen increased loan repayments,
- Increase in Non-Funded Income- Non-Funded Income increased by 43.0% to Kshs 8.8 bn in Q3’2022, from Kshs 6.2 bn in Q3’2021, mainly driven by a 219.6% increase in the foreign exchange trading income to Kshs 3.8 bn in Q3’2022 from Kshs 1.2 bn in Q3’2021 due to increased foreign exchange trading margins. Additionally, fees and commissions from loans and advances increased by 17.1% to Kshs 1.6 bn, from Kshs 1.4 bn in Q3’2021 in tandem with a 14.5% increase in Net loans and advances to Kshs 18.5 bn, from Kshs 16.2 bn in Q3’2021. I&M Group’s total fees and commissions increased by 26.0% to Kshs 4.3 bn in Q3’2022, from Kshs 4 bn in Q3’2021, and,
- Improved Efficiency - The group enhanced their efficiency levels evidenced by an improvement in Cost to Income Ratio (CIR) improving to 59.7% in Q3’2022, from 62.1% in Q3’2021 owing to the 24.0% increase in the total operating income which outpaced the 19.1% increase in the total operating expenses. Without LLP, the Cost to Income ratio improved as well to 45.3%, from 48.1% in Q3’2021.
For a comprehensive analysis, please see our I&M Kenya’s Q3’2022 Earnings Note
- Stanbic Holdings Plc
|
Balance Sheet |
Q3'2021 |
Q3'2022 |
y/y change |
|
Net Loans and Advances |
176.6 |
236.9 |
34.1% |
|
Government Securities |
45.6 |
63.0 |
38.3% |
|
Total Assets |
295.0 |
371.4 |
25.9% |
|
Customer Deposits |
212.9 |
267.3 |
25.6% |
|
Deposits per Branch |
8.5 |
10.7 |
25.6% |
|
Total Liabilities |
250.3 |
321.0 |
28.3% |
|
Shareholders' Funds |
44.7 |
50.4 |
12.6% |
|
Balance Sheet Ratios |
Q3'2021 |
Q3'2022 |
% point change |
|
Loan to Deposit ratio |
83.0% |
88.6% |
5.7% |
|
Return on average equity |
27.3% |
25.1% |
(2.2%) |
|
Return on average assets |
3.7% |
3.4% |
(0.3%) |
|
Income Statement (Kshs bn) |
Q3'2021 |
Q3'2022 |
y/y change |
|
Net interest Income |
10.0 |
12.7 |
26.8% |
|
Net non-interest income |
7.5 |
10.3 |
37.5% |
|
Total Operating income |
17.5 |
23.0 |
31.4% |
|
Loan loss provision |
(1.5) |
(2.9) |
88.7% |
|
Total Operating expenses |
(10.5) |
(13.3) |
27.2% |
|
Profit before tax |
7.0 |
9.7 |
37.7% |
|
Profit after tax |
5.1 |
7.0 |
36.8% |
|
Core EPS |
12.9 |
17.7 |
36.8% |
|
Income Statement Ratios |
Q3'2021 |
Q3'2022 |
y/y change |
|
Yield from interest-earning assets |
6.6% |
6.4% |
(0.2%) |
|
Cost of funding |
2.9% |
3.0% |
0.1% |
|
Net Interest Margin |
6.2% |
5.6% |
(0.6%) |
|
Net Interest Income as % of operating income |
57.4% |
55.4% |
(2.0%) |
|
Non-Funded Income as a % of operating income |
42.6% |
44.6% |
2.0% |
|
Cost to Income Ratio |
59.8% |
57.9% |
(1.9%) |
|
CIR without LLP |
51.1% |
45.4% |
(5.7%) |
|
Cost to Assets |
3.0% |
2.8% |
(0.2%) |
|
Capital Adequacy Ratios |
Q3'2021 |
Q3'2022 |
% points change |
|
Core Capital/Total Liabilities |
19.5% |
17.2% |
(2.3%) |
|
Minimum Statutory ratio |
8.0% |
8.0% |
|
|
Excess |
11.5% |
9.2% |
(2.3%) |
|
Core Capital/Total Risk Weighted Assets |
15.5% |
13.4% |
(2.1%) |
|
Minimum Statutory ratio |
10.5% |
10.5% |
|
|
Excess |
5.0% |
2.9% |
(2.1%) |
|
Total Capital/Total Risk Weighted Assets |
17.5% |
16.2% |
(1.3%) |
|
Minimum Statutory ratio |
14.5% |
14.5% |
|
|
Excess |
3.0% |
1.7% |
(1.3%) |
|
Liquidity Ratio |
44.2% |
39.9% |
(4.3%) |
|
Minimum Statutory ratio |
20.0% |
20.0% |
|
|
Excess |
24.2% |
19.9% |
(4.3%) |
|
Adjusted Core Capital/Total Deposit Liabilities |
19.6% |
17.2% |
(2.4%) |
|
Adjusted Core Capital/Total Risk Weighted Assets |
15.6% |
13.4% |
(2.2%) |
|
Adjusted Total Capital/Total Risk Weighted Assets |
17.6% |
16.2% |
(1.4%) |
Key take-outs from the earnings release include;
- Earnings Growth: Core earnings per share rose by 36.8% to Kshs 17.7, from Kshs 12.9 in Q3’2021, higher than our expectations of an 18.5% increase to Kshs 15.3. The performance was driven by the 31.4% growth in total operating income to Kshs 23.0 bn, from Kshs 17.5 bn in Q3’2021, which outpaced the 27.2% growth in total operating expenses to Kshs 13.3 bn, from Kshs 10.5 bn in Q3’2021, and,
- Increased Provisioning – On the back of high credit risk, which has seen the bank’s gross non-performing loans increasing by 18.0% to Kshs 25.6 bn in Q3’2022, from Kshs 21.7 bn in Q3’2021, the banks increased its provisions holdings to cover for the anticipated losses in the future, with its provisions increasing by 35.6% to Kshs 11.1 bn from Kshs 8.2 bn recorded in Q3’2021. Consequently, the gross non-performing loan coverage increased to 63.4%, from 54.9% recorded in Q3’2021.
For a comprehensive analysis, please see our Stanbic Holdings Plc’s Q3’2022 Earnings Note
- Diamond Trust Bank-Kenya
|
Balance Sheet Items (Kshs bn) |
Q3'2021 |
Q3'2022 |
y/y change |
|
Government Securities |
115.1 |
135.1 |
17.4% |
|
Net Loans and Advances |
205.6 |
243.7 |
18.5% |
|
Total Assets |
434.4 |
507.5 |
16.8% |
|
Customer Deposits |
323.7 |
359.7 |
11.1% |
|
Deposits per Branch |
2.5 |
2.7 |
9.4% |
|
Total Liabilities |
359.9 |
429.5 |
19.3% |
|
Shareholders’ Funds |
67.5 |
70.1 |
3.9% |
|
Balance Sheet Ratios |
Q3'2021 |
Q3'2022 |
y/y change |
|
Loan to Deposit Ratio |
63.5% |
67.7% |
4.2% |
|
Return on average equity |
6.8% |
8.0% |
1.2% |
|
Return on average assets |
1.1% |
1.2% |
0.1% |
|
Income Statement (Kshs bn) |
Q3'2021 |
Q3'2022 |
y/y change |
|
Net Interest Income |
14.7 |
16.8 |
14.1% |
|
Non-Interest Income |
4.8 |
6.9 |
43.5% |
|
Total Operating income |
19.5 |
23.7 |
21.3% |
|
Loan Loss provision |
3.1 |
4.0 |
30.5 |
|
Total Operating expenses |
12.1 |
14.7 |
21.5% |
|
Profit before tax |
7.4 |
8.9 |
20.2% |
|
Profit after tax |
5.2 |
6.3 |
21.1% |
|
Earnings per share (Kshs) |
18.6 |
22.5 |
21.1% |
|
Income Statement Ratios |
Q3'2021 |
Q3'2022 |
Y/Y Change |
|
Yield from interest-earning assets |
9.5% |
9.7% |
0.2% |
|
Cost of funding |
3.1% |
3.2% |
0.1% |
|
Net Interest Spread |
6.4% |
6.5% |
0.1% |
|
Net Interest Income as % of Total Income |
75.5% |
71.0% |
(4.5%) |
|
Non-Funded Income as a % of Total Income |
24.5% |
29.0% |
4.5% |
|
Cost to Income |
62.0% |
62.1% |
0.1% |
|
Cost to Income Ratio without provisions |
46.3% |
45.2% |
(1.1%) |
|
Cost to Assets |
4.7% |
4.8% |
0.1% |
|
Net Interest Margin |
5.5% |
5.7% |
0.2% |
|
Capital Adequacy Ratios |
Q3'2021 |
Q3'2022 |
% points change |
|
Core Capital/Total deposit Liabilities |
22.2% |
21.9% |
(0.3%) |
|
Minimum Statutory ratio |
8.0% |
8.0% |
|
|
Excess |
14.2% |
13.9% |
(0.3%) |
|
Core Capital/Total Risk Weighted Assets |
20.7% |
20.0% |
(0.7%) |
|
Minimum Statutory ratio |
10.5% |
10.5% |
|
|
Excess |
10.2% |
9.5% |
(0.7%) |
|
Total Capital/Total Risk Weighted Assets |
22.1% |
21.1% |
(1.0%) |
|
Minimum Statutory ratio |
14.5% |
14.5% |
|
|
Excess |
7.6% |
6.6% |
(1.0%) |
|
Liquidity Ratio |
60.1% |
60.5% |
0.4% |
|
Minimum Statutory ratio |
20.0% |
20.0% |
|
|
Excess |
40.1% |
40.5% |
0.4% |
|
Adjusted Core Capital/Total Deposit Liabilities |
22.3% |
21.8% |
(0.5%) |
|
Adjusted Core Capital/Total Risk Weighted Assets |
20.9% |
20.0% |
(0.9%) |
|
Adjusted Total Capital/Total Risk Weighted Assets |
22.2% |
21.1% |
(1.1%) |
Key take-outs from the earnings release include;
- Earnings Growth: Core earnings per share increased by 21.1% to Kshs 22.5 in Q3’2022, from Kshs 18.6 in Q3’2021, higher than our projections of 15.2% increase to Kshs 21.4. The performance was driven by a 21.3% increase in total operating income to Kshs 23.7 bn in Q3’2022, from Kshs 19.5 bn in Q3’2021. However, this increase in total operating income was weighed down by the 21.5% increase in the total operating expenses to Kshs 14.7 bn in Q3’2022, from Kshs 12.1 bn in Q3’2021,
- Deteriorating Asset Quality – The group’s asset quality deteriorated, with the NPL ratio increasing to 12.7% in Q3’2022, from 11.9% in Q3’2021, owing to the 28.1% growth in gross non-performing loans, which outpaced the 18.5% increase in net loans and advances to Kshs 243.7 bn, from Kshs 205.6 bn in Q3’2021. The increase in NPLs can be attributed to the increase in credit risk in the Kenya’s banking sector, with sector’s gross NPLs to gross loans ratio increasing to 14.7% in Q2’2022 from 14.0% in Q1’2022.
For a comprehensive analysis, please see our DTB-K’s Q3’2022 Earnings Note
Asset Quality
The table below is a summary of the asset quality for the listed banks that have released their Q3’2022 results
|
Cytonn Report: Listed Banking sector Asset Quality |
||||||
|
Bank |
Q3'2021 NPL Ratio** |
Q3'2022 NPL Ratio* |
Q3'2021 NPL Coverage** |
Q3'2022 NPL Coverage* |
% point change in NPL Ratio |
% point change in NPL Coverage |
|
Equity Group |
9.5% |
9.5% |
60.6% |
63.0% |
- |
2.4% |
|
I&M Holdings |
10.2% |
9.5% |
70.6% |
75.4% |
(0.7%) |
4.8% |
|
Stanbic Bank |
11.5% |
10.1% |
54.9% |
63.4% |
(1.4%) |
8.5% |
|
NCBA Group |
17.0% |
12.7% |
70.2% |
65.3% |
(4.3%) |
(4.9%) |
|
Diamond Trust Bank |
11.9% |
12.7% |
40.0% |
45.2% |
0.8% |
5.2% |
|
Co-operative Bank of Kenya |
14.6% |
14.0% |
65.5% |
69.3% |
(0.6%) |
3.8% |
|
Standard Chartered Bank Kenya |
15.3% |
15.4% |
82.8% |
82.4% |
0.1% |
(0.4%) |
|
KCB |
13.7% |
17.8% |
63.4% |
52.8% |
4.1% |
(10.6%) |
|
Mkt Weighted Average |
12.6% |
12.9% |
64.6% |
64.0% |
0.3% |
(0.6%) |
|
*Market cap weighted as at 25/11/2022 |
||||||
|
**Market cap weighted as at 10/12/2021 |
||||||
Key take-outs from the table include;
- Asset quality for the listed banks that have released deteriorated during the period, with the weighted average NPL ratio increasing by 0.3% points to a market cap weighted average of 12.9%, from an average of 12.6% in Q3’2021. This is mainly skewed by a deterioration in KCB’s NPL ratio to 17.8% in Q3’2022 from 14.0% in Q3’2021, following reclassification of 9 large accounts as NPLs in H1’2022 and,
- NPL Coverage for the listed banks declined to a market cap weighted average of 64.0% in Q3’2022, from 64.6% recorded in Q3’2021, mainly skewed by reduced NPL coverage by KCB Group and DTB-K following NPLs growth outpacing provisions growth.
Summary performance
The table below highlights the performance of the listed banks, showing the performance using several metrics, and the key take-outs of the performance;
|
Cytonn Report: Listed Banking Sector Performance Q3’2022 |
|||||||||||||
|
Bank |
Core EPS Growth |
Interest Income Growth |
Interest Expense Growth |
Net Interest Income Growth |
Net Interest Margin |
Non-Funded Income Growth |
NFI to Total Operating Income |
Growth in Total Fees & Commissions |
Deposit Growth |
Growth in Government Securities |
Loan to Deposit Ratio |
Loan Growth |
Return on Average Equity |
|
NCBA Group |
96.2% |
13.3% |
10.8% |
15.1% |
6.0% |
40.1% |
49.2% |
5.2% |
3.2% |
9.1% |
57.6% |
11.7% |
21.2% |
|
Co-op Bank |
47.0% |
10.5% |
7.2% |
11.7% |
8.2% |
28.3% |
38.6% |
31.7% |
4.9% |
(5.7%) |
77.6% |
9.4% |
22.5% |
|
Standard Chartered |
37.1% |
4.1% |
(12.6%) |
7.3% |
6.3% |
16.1% |
35.7% |
-13.4% |
10.7% |
13.2% |
47.6% |
3.3% |
21.0% |
|
Stanbic Holdings |
36.8% |
3.1% |
19.2% |
26.8% |
5.6% |
37.5% |
44.6% |
8.1% |
25.6% |
38.3% |
88.6% |
34.1% |
25.1% |
|
Equity Group |
27.9% |
25.6% |
31.3% |
23.6% |
7.3% |
32.0% |
41.4% |
28.6% |
15.1% |
(0.1%) |
66.9% |
20.6% |
31.3% |
|
I&M Holdings |
25.1% |
17.3% |
20.0% |
15.6% |
6.6% |
43.0% |
35.4% |
26.0% |
6.7% |
(2.6%) |
75.1% |
11.4% |
13.9% |
|
KCB |
21.4% |
13.6% |
28.4% |
9.1% |
8.1% |
30.2% |
33.2% |
17.3% |
7.4% |
6.9% |
80.1% |
16.4% |
22.6% |
|
DTB-K |
21.1% |
15.4% |
17.2% |
43.5% |
5.7% |
43.5% |
29.0% |
24.5% |
11.1% |
17.4% |
67.7% |
18.5% |
8.0% |
|
Q3'22 Mkt Weighted Average* |
36.9% |
15.5% |
19.5% |
16.7% |
7.2% |
31.6% |
39.1% |
18.6% |
10.7% |
5.8% |
70.3% |
16.1% |
24.4% |
|
Q3'21 Mkt Weighted Average** |
102.0% |
15.9% |
14.9% |
16.9% |
7.3% |
14.3% |
35.2% |
11.1% |
14.3% |
11.7% |
69.7% |
12.4% |
18.7% |
|
*Market cap weighted as at 25/11/2022 |
|||||||||||||
|
**Market cap weighted as at 10/12/2021 |
|||||||||||||
Key take-outs from the table include:
- The listed banks recorded a 36.9% weighted average growth in core Earnings per Share (EPS), compared to a weighted average increase of 102.0% in Q3’2021,
- The Banks recorded a weighted average deposit growth of 10.7%, slower than the 14.3% growth recorded in Q3’2021, an indication of reduced investment risk in the business environment,
- Interest income grew by 15.5%, compared from a growth of 15.9% recorded in Q3’2021, with Net Interest Margin (NIM) standing at 7.2%, 0.1% points lower than the 7.3% recorded in Q3’2021, and,
- Non-Funded Income grew by 31.6%, compared to the 14.3% growth recorded in Q3’2021, pointing to increased revenue diversification efforts by the banking sector.
Universe of coverage:
|
Company |
Price as at 18/11/2022 |
Price as at 25/11/2022 |
w/w change |
YTD Change |
Target Price* |
Dividend Yield |
Upside/ Downside** |
P/TBv Multiple |
Recommendation |
|
Jubilee Holdings |
187.8 |
200.0 |
6.5% |
(36.9%) |
305.9 |
0.5% |
53.5% |
0.4x |
Buy |
|
KCB Group*** |
38.8 |
37.6 |
(3.1%) |
(17.5%) |
53.5 |
2.7% |
44.9% |
0.6x |
Buy |
|
Liberty Holdings |
4.8 |
4.8 |
(0.2%) |
(31.9%) |
6.8 |
0.0% |
40.3% |
0.4x |
Buy |
|
Kenya Reinsurance |
1.8 |
1.9 |
2.2% |
(18.3%) |
2.5 |
5.3% |
39.6% |
0.2x |
Buy |
|
Equity Group*** |
46.8 |
46.0 |
(1.8%) |
(12.9%) |
59.7 |
6.5% |
36.4% |
1.1x |
Buy |
|
Sanlam |
9.0 |
8.8 |
(2.7%) |
(24.2%) |
11.9 |
0.0% |
36.0% |
0.9x |
Buy |
|
Co-op Bank*** |
12.0 |
12.5 |
3.7% |
(4.2%) |
15.6 |
8.0% |
33.3% |
0.7x |
Buy |
|
Diamond Trust Bank*** |
47.4 |
47.0 |
(0.8%) |
(21.0%) |
59.5 |
6.4% |
33.0% |
0.2x |
Buy |
|
I&M Group*** |
17.0 |
17.0 |
0.0% |
(20.6%) |
20.5 |
8.8% |
29.6% |
0.4x |
Buy |
|
ABSA Bank*** |
11.7 |
11.7 |
(0.4%) |
(0.9%) |
14.9 |
1.7% |
29.6% |
1.0x |
Buy |
|
Britam |
5.8 |
5.5 |
(4.8%) |
(27.0%) |
7.1 |
0.0% |
29.0% |
0.9x |
Buy |
|
CIC Group |
1.9 |
1.9 |
1.1% |
(12.0%) |
2.3 |
0.0% |
21.5% |
0.7x |
Buy |
|
Stanbic Holdings |
97.5 |
95.0 |
(2.6%) |
9.2% |
99.9 |
9.5% |
14.6% |
0.7x |
Accumulate |
|
NCBA*** |
30.6 |
32.9 |
7.4% |
29.1% |
35.2 |
6.1% |
13.1% |
0.8x |
Accumulate |
|
Standard Chartered*** |
138.8 |
143.0 |
3.1% |
10.0% |
155.0 |
4.2% |
12.6% |
0.9x |
Accumulate |
|
HF Group |
3.0 |
3.2 |
5.0% |
(17.1%) |
3.5 |
0.0% |
11.1% |
0.2x |
Accumulate |
|
*Target Price as per Cytonn Analyst estimates **Upside/ (Downside) is adjusted for Dividend Yield ***For Disclosure, these are stocks in which Cytonn and/or its affiliates are invested in |
|||||||||
We are “Neutral” on the Equities markets in the short term due to the current adverse operating environment and huge foreign investor outflows, and, “Bullish” in the long term due to current cheap valuations and expected global and local economic recovery.
With the market currently trading at a discount to its future growth (PEG Ratio at 0.9x), we believe that investors should reposition towards value stocks with strong earnings growth and that are trading at discounts to their intrinsic value. We expect the current high foreign investors sell-offs to continue weighing down the economic outlook in the short term.
- Residential Sector
- Government to begin construction of 42,000 affordable housing units in the next 60 days
During the week, the national government, through the Permanent Secretary for State Department for Housing and Urban Development, Charles Hinga, announced plans to commence the construction of 42,000 affordable housing units within the next two months. The projects will be developed in:
- Makongeni, Nairobi County, which will host 30,000 units whose ground-breaking will be on 6th December 2022,
- Starehe, Nairobi county which will host 2,470 units,
- Shauri Moyo, Nairobi County, which will host 1,728 units,
- Ruiru, Kiambu County, which will host 1,200 units, and,
- Mavoko, Machakos County, which will host 5,360 units.
The decision comes a time when Kenya, through the current administration, is enhancing its prioritization of delivering approximately 200,000 decent housing units annually to the low and middle-income earners at low costs through Affordable Housing Programme. The drive is expected to consequently reduce the housing deficit, which currently stands at 2.0 mn units. The initiative has gained traction in the country with some the projects in the pipeline outlined in the table below;
|
Cytonn Report: Summary of Notable Ongoing Affordable Housing Projects in The Nairobi Metropolitan Area |
|||
|
Name |
Developer |
Location |
Number of Units |
|
Pangani Affordable Housing Program |
National Government and Tecnofin Kenya Limited |
Pangani |
1,562 |
|
River Estate Affordable Housing Program |
National Government and Edderman Property Limited |
Ngara |
2,720 |
|
Park Road Affordable Housing Program |
National Housing Corporation |
Ngara |
1,370 |
|
Mukuru Affordable Housing Program |
National Housing Corporation |
Mukuru kwa Njenga, Enterprise Road |
15,000 |
Source: Boma Yangu Portal
In addition to the above, there also exist several projects initiated by private developers to hasten the program such as;
|
Cytonn Report: Summary of Notable Ongoing Affordable Housing Projects in The Nairobi Metropolitan Area |
|||
|
Name |
Developer |
Location |
Number of Units |
|
Samara Estate |
Skymore Pine Limited |
Ruiru |
1,824 |
|
Moke Gardens |
Moke Gardens Real Estate |
Athi River |
30,000 |
|
Habitat Heights |
Afra Holding Limited |
Mavoko |
8,888 |
|
Tsavo Apartments |
Tsavo Real Estate |
Embakasi, Riruta,Thindigua, Roysambu and Rongai |
3,200 |
|
Unity West |
Unity Homes |
Tatu City |
3,000 |
|
RiverView |
Karibu Homes |
Athi River |
561 |
Source: Boma Yangu Portal
We expect a similar trend to continue shaping the performance of residential sector by improving the living standards of the majority of the population across the country in a bid to provide decent housing units at low costs. However, in as much as the program is gaining momentum, it is still faced with a couple of challenges with the major one being financing of the developments hence weighing down its optimum performance as majority of the projects have been stalling. As such, the initiative needs well-articulated strategies on financing, planning and developments, and with increased partnership with the private sector, as well as providing accurate and sufficient information to tenants and investors, for it to work optimally, as highlighted in our recent Affordable Housing in Kenya topical. We expect financing to remain a challenge until such time that the return expectations to investors to these projects become clear.
- Shelter Afrique approves Kshs 1.6 bn corporate loan to Mixta Real Estate Firm
Shelter Afrique, a Pan-African development financier based in Nairobi’s Upperhill District, recently approved an additional 5-year corporate loan worth Kshs 1.6 bn towards Nigeria’s Mixta Real Estate Plc, to finance the construction of housing projects in Cote d’Ivoire, Senegal and Morocco. This comes after the Lagos-based property firm, which has successfully developed more than 13,500 residential and retail units across 8 countries in Africa, was awarded a similar amount in March 2021 by Shelter Afrique. Additionally, Shelter Afrique also financed Mixta projects through a Kshs 732.6 mn corporate loan in 2014, granted to develop 130 apartments within 13 blocks in Lagos. The table below provides a breakdown of housing developments in the three countries;
|
Cytonn Report: Housing Development in Cote d’Ivoire, Senegal and Morocco by Mixta Real Estate |
||
|
Country |
Number of Houses |
Selling Prices of the units in Kshs (mn) |
|
Cote d’Ivoire |
365 |
5.5 |
|
Senegal |
162 |
4.3 - 6.3 |
|
Morocco |
371 |
3.2 |
|
Total |
898 |
|
Source: Online Research
We expect the lending decisions on affordable housing projects across Africa by the lender to boost both local and foreign investors’ confidence into Africa’s property market, with the most recent being the approval of a Kshs 2.2 bn corporate loan in September 2022 towards Maison Super Development (MSD) firm to finance the construction of three ongoing projects in the Democratic Republic of Congo (DRC). The financier also announced plans in February 2022 to issue an East African bond in the Kenyan Capital Market through the NSE, to raise USD 500.0 mn (Kshs 56.9 bn) for financing upcoming affordable housing projects within East Africa with the main focus being on Kenyan market. The move will also promote the continued efforts to raise funds for housing projects from regional local currency bonds and uplift access to affordable housing, which has witnessed improved activities and developments in several African countries like Kenya amid recovery of their economic status after the COVID-19 pandemic.
- Infrastructure Sector
During the week, African Infrastructure Investment Managers (AIIM), one of Africa’s leading infrastructure private equity managers, committed Kshs 4.1 bn to Kenya’s Road Annuity Programme for the development of road infrastructure in the country to be done through the AIIM’s pan African AIIF4 Fund. The Roads Annuity Fund programme was established in 2015 under the Public Finance Management Regulations to ease pressure on the exchequer, by providing capital to pave approximately 10,000 Km of roads through Public Private Partnerships (PPPs). In turn, the programme enabled the government to meet its annuity payment obligations for the development and maintenance of roads. To boost investments into the annuity roads programme, the government divided Kenya’s road network into investable lots that investors could acquire.
AIIM has already acquired lots 15 and 18 of the roads programme that had in 2015 been tendered and awarded to two Construction firms, which it will also partner with namely; Portuguese construction firm Mota-Engil, and Lee construction consortium by the Kenya Urban Roads Authority (KURA), as well as financing partners in Stanbic Bank and Multilateral Investment Guarantee Agency (MIGA). Upon completion, they are expected to spur Real Estate sector performance by; i) better linking regional communities to neighboring markets and the national transport networks, ii) facilitating more efficient logistics and consequently foster economic growth, iii) opening up new markets for development thereby increasing property investments, and, iv) boosting property prices hence facilitating improved returns.
Additionally, we expect the move by AIIM to; i) set precedence to private sector developers and investors to invest in the development of Kenya’s road infrastructure, and, ii) boost private sector developers and investors’ confidence in Public Private Partnerships (PPPs). Additionally, this will also boost Kenya’s infrastructure sector performance which has witnessed numerous developments and growth over the past 10 years owing to government’s continuous efforts to deliver on the same through other various strategies such as; i) the floating of infrastructure bonds to raise funds for construction, ii) project partnerships such as joint ventures, iii) debt financing, and, iv) yearly budgetary allocations, with the infrastructure sector having been allocated Kshs 212.5 bn in the FY’2022/23 budget statement. Some of the ongoing projects include; Thika-Garissa highway, Nairobi-Suguta-Maralal road, Kisumu-Kakamega highway, and, Mbita-Kiabuya-Magunga-Sori road projects.
- Statutory Reviews
During the week, Nairobi City Hall issued a notice on the increment of land rates to 0.115% of the current value of undeveloped land in Nairobi County based on the 2019 Draft Valuation roll, from 1st January 2023, in line with the Nairobi City Finance Act 2022. However, all persons/entities who had objected the 2019 Valuation roll shall pay the old rates pending hearing and determination of their respective objections. The statutory review will apply to residential, commercial, and, agricultural land based on the current unimproved site value as follows;
- A charge of 0.115% on residential, commercial and agricultural plots,
- A flat rate charge of Kshs 2,560 on land not exceeding 0.1 HA,
- A flat charge of Kshs 3,200 on land greater than 0.1 HA but not exceeding 0.2 HA,
- A flat charge of Kshs 4,000 on land greater than 0.1 HA but not exceeding 0.4 HA,
- A flat charge of Kshs 4,800 on land exceeding 0.4 HA.
The new rates come as a departure from the current rate of 25.0% of the undeveloped land based on the 1980 Valuation roll. On the other hand, exemption will be made on land whose current rate exceeds the new rate, whereby the current rate, based on the 1980 Valuation roll will apply. However, if the new rate is more than double the current rates, then double the current rate will be applied. The Nairobi County government targets to collect approximately Kshs 6.0 bn in land rate within the coming year, from the Kshs 2.8 bn collected in FY’2021, against a target of Kshs 5.0 bn. The new rates will also allow the County government to reap more from the continuous appreciation of land prices within Nairobi County.
We expect the statutory review to, i) provoke landowners and landlords to demand higher prices and rents within Nairobi County, in a bid to recover the additional costs from the higher rates set to be charged by the Nairobi County government, ii) provide an incentive to land owners to develop their parcels of land and discourage land speculation, and, iii) increase the cost of owning land, which will make it more difficult for people to buy land or keep up with their mortgage repayments leading to an increase in credit default rates.
- Real Estate Investment Trusts (REITs)
In the Nairobi Stock Exchange, ILAM Fahari I-REIT closed the week trading at an average price of Kshs 6.3 per share. The performance represented a 4.0% Week-to-Date (WTD) and 1.9% Year-to-Date (YTD) decline from the Kshs 6.6 and Kshs 6.4 per share, respectively. Additionally, the performance also represented a 68.5% Inception-to-Date (ITD) decline from Kshs 20.0. The graph below shows Fahari I-REIT’s performance from November 2015 to 25th November 2022:
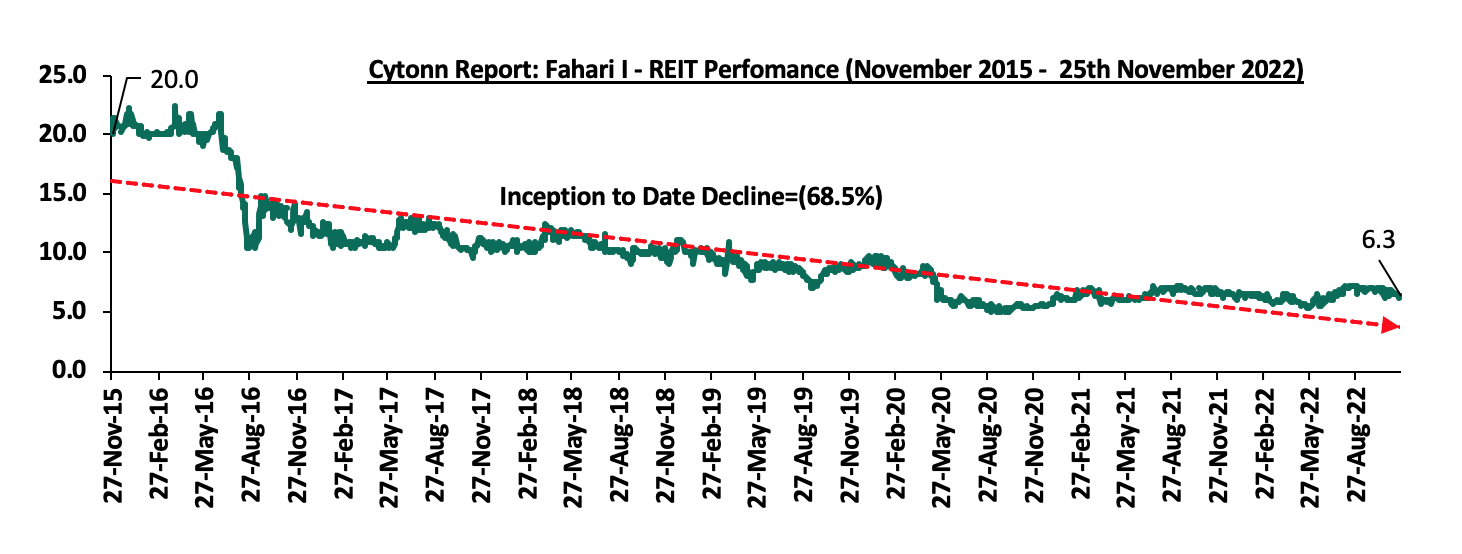
In the Unquoted Securities Platform, Acorn D-REIT and I-REIT closed the week at Kshs 23.8 and Kshs 20.9 per unit, respectively, as at 11th November 2022. The performance represented a 19.2% and 4.4% gain for the D-REIT and I-REIT, respectively, from the Kshs 20.0 inception price. The volumes traded for the D-REIT and I-REIT came in at 5.5 mn and 14.9 mn shares, respectively, with a turnover of Kshs 116.9 mn and Kshs 308.8 mn, respectively, since its Inception in February 2021.
We expect Kenya’s Real Estate sector performance to be on an upward trajectory supported by; i) increased financing towards the residential sector, ii) continued efforts by the government to provide affordable housing to citizens, iii) improved infrastructure across the country, and, iv) increased land rates that will incentivize land owners to develop their land parcels. However, the performance of the Real state sector in Kenya is expected to be weighed down by; i) rising construction costs amid inflationary pressures in the economy, ii) increased cost of owning land due to increased rates, and, iii) low investor appetite in listed Real Estate due to high investment amounts and inadequate investor appetite to it.
In 2021, we published the Nairobi Metropolitan Area Serviced Apartments Report 2021, which highlighted that serviced apartment’s average rental yield grew by 1.5% points to 5.5%, from the 4.0% recorded in 2020. This was attributed to an increase in monthly charges per SQM by 0.7% to Kshs 2,549, from Kshs 2,533 recorded in 2020, coupled with an increase in occupancy levels by 13.5% to 61.5%, from 48.0% recorded in 2020. The improvement in performance was attributable to increased demand for hospitality facilities and services as a result of the reopening of the economy, the return of international flights, and the improved rent collection amounts by serviced apartments that had previously been issuing discounts to attract and maintain clients. This year, we update our report using 2022 market research data and by focusing on;
- Overview of the Kenyan Hospitality Sector,
- Introduction to Serviced Apartments,
- Supply and Distribution of Serviced Apartments within the NMA,
- Performance of Serviced Apartments in the NMA,
- Serviced Apartments Performance by Node
- Comparative Analysis- 2021/2022 Market Performance
- Performance per Typology
- Recommendation and Outlook.
Section I: Overview of the Kenyan Hospitality Sector
In 2022, the hospitality sector displayed a remarkable improvement in terms of activity and overall performance when compared to 2021, after having been one of the worst hit economic sectors by the pandemic. The improvement in performance was mainly on the back of a number of factors including but not limited to; increase in number of visitor arrivals into Kenya following the removal of all travel restrictions, government's commitment to marketing and developing the sector, and, the increasing number of Kenyans travelling domestically. Additionally, Central Bank of Kenya’s Monetary Policy Committee Hotels Survey-July 2022 report highlighted that out of the 80 hotels sampled around the country, all 80 of them were operating in Q2’2022, up from 90.3% and 39.0% over the same period in 2021 and 2020, respectively. The survey established that normalcy in the level of operations in most hotels around the country had returned to pre-COVID-19 levels, signaling the continued recovery of the sector. The graph below shows the overall percentage of the number of operating hotels in Kenya from Q1’2020 to Q2’2022;
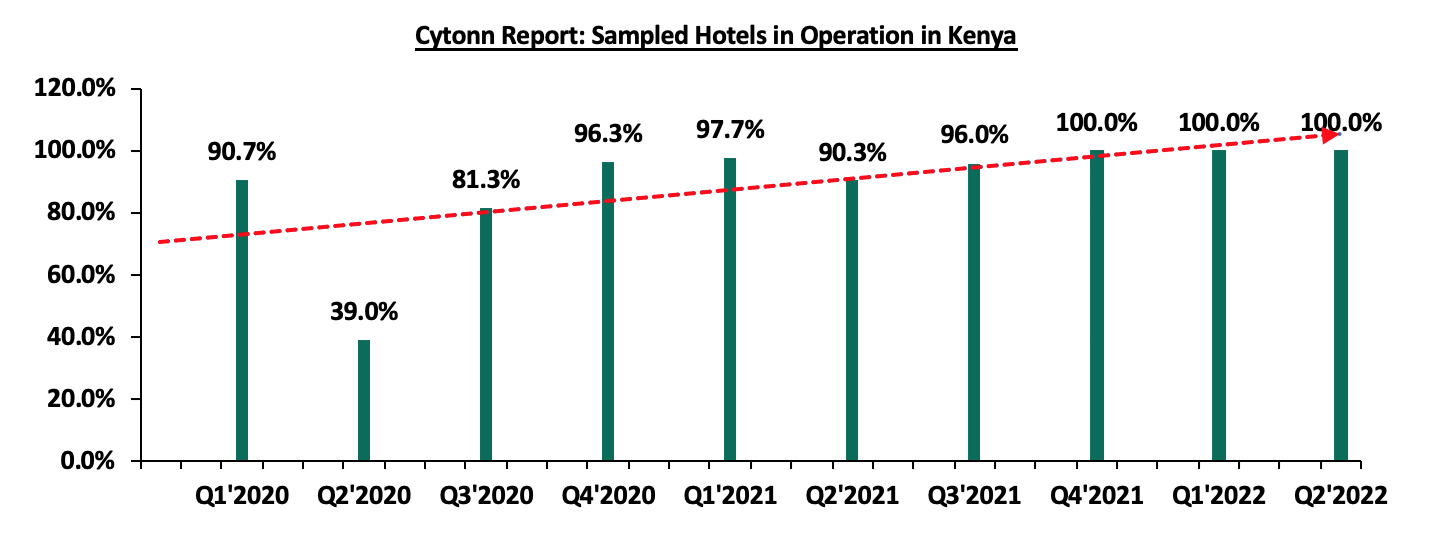
Source: Central Bank of Kenya
Consequently, the average bed occupancy rates increased by 35.7% points to 58.0% in Q2’2022 from 22.3% recorded a similar period in 2021. The graph below highlights the hotel bed occupancy rates in Kenya between Q1’2020 and Q2’2022;
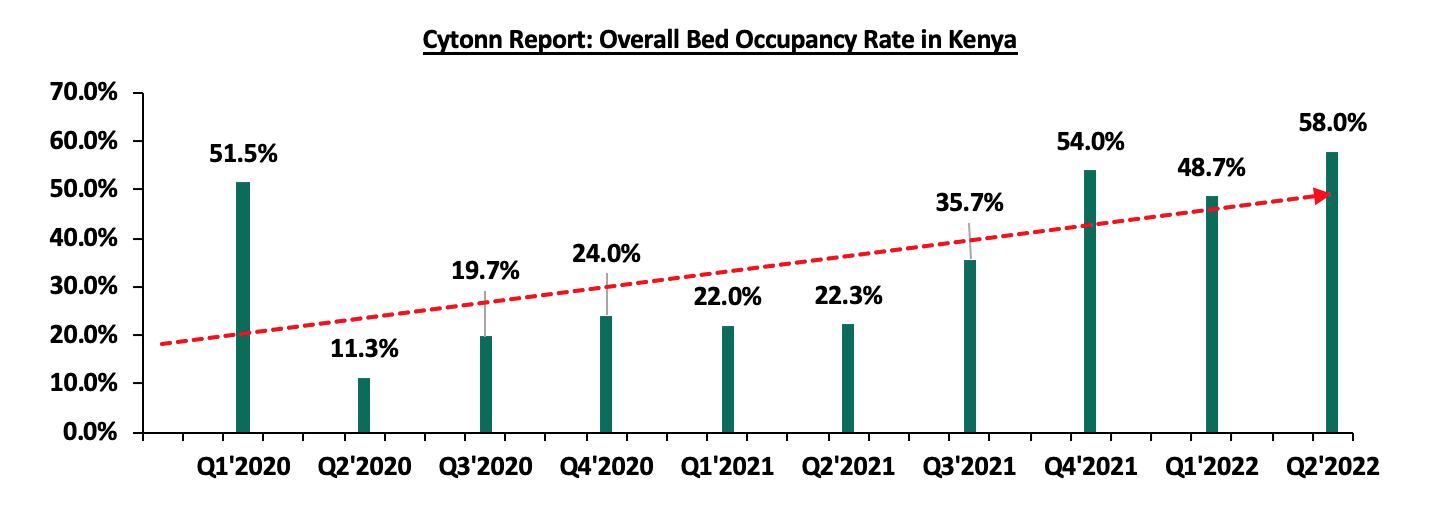
Source: Central Bank of Kenya
In terms of international arrivals, Kenya National Bureau of Statistics’ Leading Economic Indicators - August 2022 report highlights that Jomo Kenyatta International Airport (JKIA) and Moi International Airport (MIA) registered a significant increase of 147.1% to 279,981 visitors in Q2’2022 from 113,307 visitors in Q2’2021. This is as a result of the retraction of all pandemic-related restrictions and lockdowns, coupled with the aggressive efforts by the Ministry of Tourism to market the Kenyan hospitality sector to international markets, despite external shocks like the turmoil in Ukraine.
For the month of August, the number of international visitors arriving through Jomo Kenyatta (JKIA) and Moi International Airports (MIA) declined by 12.1% to 102,139 persons in August 2022 from 116,189 persons in July 2022 mainly as a result of uncertainty emanating from the heated political temperatures during the General Elections period. Nonetheless, the total number of international arrivals through JKIA and MIA from January 2022 to August 2022 was 723,630 persons, which was a significant 89.1% increase from the 382,619 persons over the same period in 2021. The graph below shows the number of international arrivals in Kenya between Q1’2020 and Q2’2022;
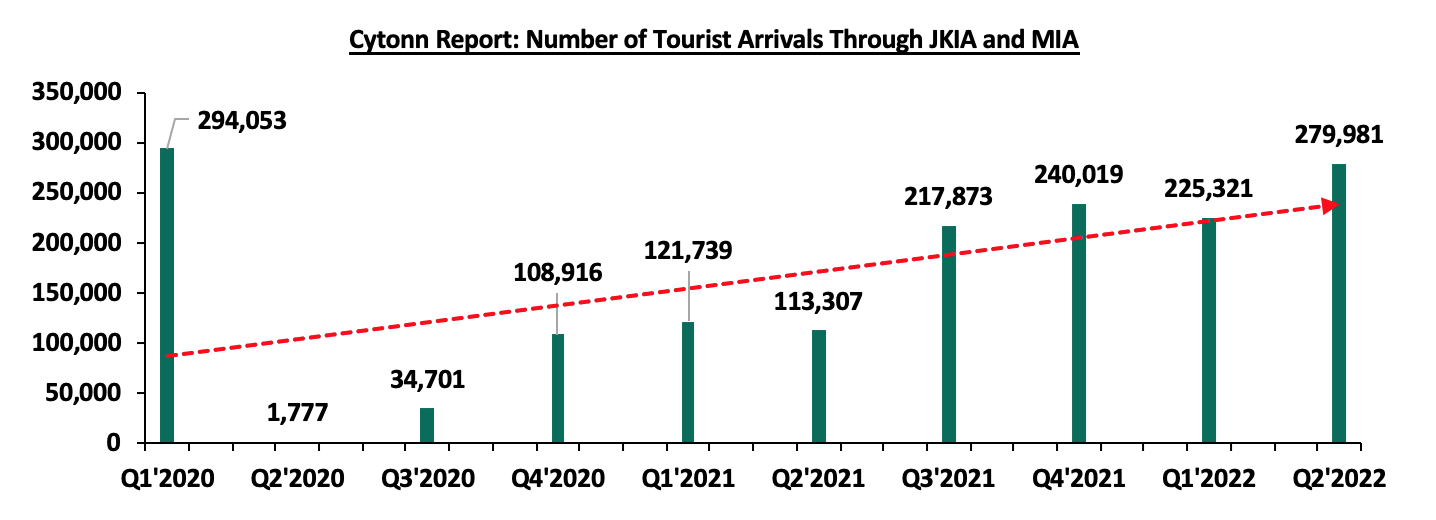
Source: Kenya National Bureau of Statistics
Some of the factors that continue to cushion the hospitality sector include;
- Retraction of all Travel Restrictions: The easing of COVID-19 pandemic prevention measures such as curfew and travel restrictions put in place both domestically and overseas, and relaxation of various travel advisories against the country contributed to the reopening of Kenya’s key tourism markets. This in turn triggered the recovery of the industry with tourist arrivals coming at 279,981 persons in Q2’2022, compared to 113,307 persons in Q2’2021 and 1,777 persons in Q2’2020,
- Peaceful Post-Electioneering Period: In spite of the uncertain political environment in the run up to the August 2022 General Elections, the country remained calm post-election. Additionally, Kenya had a smooth government transition leading to a stable business environment which promoted various activities such as the World Travel Awards – Africa and Indian Ocean Gala Ceremony that was held at the KICC in October 2022,
- World Famous Tourist Attractions: Kenya is home to 6 unique world heritage sites identified by the United Nations Educational Scientific and Cultural Organization (UNESCO) which include; Kenya’s Lake System, Lake Turkana National Park, Mijikenda Kaya Forests, Mount Kenya National Park, Lamu Old Town, and, Fort Jesus. These world heritage sites have been identified because of their cultural, historical, natural and archaeological value, thereby attracting numerous tourists from across the globe,
- Hospitality Sector Events: Kenya has continued to host various events such as the World Rally Championship (WRC) held in 2021 and 2022, and still expected to be hosted annually until 2026, and the World Under 21 Athletics Championships which were held at Moi International Sports centre in August 2021. These events continue to boost visitor arrivals, hotel bookings and the general performance of the hospitality industry,
- Positive Accolades for the Hospitality Industry: In the 29th World Travel Awards, Nairobi was voted as Africa’s leading business travel destination, with Kenya being voted Africa’s leading destination. This was supported by the presence of renowned conferencing centers such as the KICC, prestigious lodging options such as Fairmont The Norfolk, a stable business environment, favorable infrastructure, numerous historical sites, and a rich cultural heritage. The award which is the fourth consecutively per year signifies the continued confidence in the country as a hospitality destination. Other accolades won by Kenya during the year include; Africa’s leading MICE destination in the 3rd Annual World MICE Awards, and various other awards for hotels and facilities in the 16th World Luxury Hotel Awards 2022,
- Aggressive Local and International Marketing of Kenya’s Hospitality Industry: In a bid to remain competitive and attract more tourists, the industry has seen aggressive marketing initiatives both locally and internationally by industry players through various marketing strategies such as the annual Magical Kenya Travel Expo held in the KICC and organized by the Kenya Tourism Board. These strategies seek to solidify Kenya's position as a leading hospitality destination through showcasing various destinations, hospitality facilities and fostering various partnerships among industry players,
- Sustained Economic Recovery: The recovery of the economy after the wane of the COVID-19 pandemic slowdown has seen the reinstatement of hotels within the year that had previously shut down business. These include; The Mount Kenya Safari Club, Fairmont The Norfolk, and, Radisson Blu – Upperhill hotels which had exited the market, as the hospitality sector was one of the most impacted by pandemic restrictions. In terms of performance, the Accommodation and Restaurant services sector contribution to Gross Domestic Product (GDP) recorded a 22.0% y/y growth in Q2’2022, from the 90.1% and 56.2% growth recorded in Q2’2021 and Q1’2022, respectively. The slow growth mainly driven by the persistent inflationary pressures that has seen food inflation increase to 12.8% in Q2’2022 from 9.2% in Q1’2022. However, the sector’s performance continues to be cushioned by the rising tourism activities, and,
- Regional Expansion Drive through Mergers and Acquisitions: The hospitality sector has seen various mergers and acquisitions, signifying investor appetite and confidence in a bid to gain market dominance coupled by the recovery of the sector away from the pandemic lockdowns. During the year; Kasada Hospitality Fund purchased Crowne Plaza Hotel located in Nairobi’s Upperhill District for Kshs 4.6 bn, Maanzoni Lodges purchased Nairobi’s 680-Hotel for an estimated Kshs 1.2 bn, and Actis Limited completed the purchase of Fairview Hotel in Nairobi, City Lodge Hotel in Two Rivers, and, Town Lodge Hotel in Upperhill from South Africa City Lodge Hotel Group at a cost of Kshs 1.0 bn. These expansionary efforts are expected to further cushion the performance of the sector.
Nevertheless, the sector continues to face challenges, mainly;
- Increased Cost of Operation: One of the most significant challenges is the elevated cost of doing business for establishments in the sector. This is due to a number of factors, including the high cost of inputs caused by elevated inflationary pressures, coupled with continued depreciation of the Kenyan shilling against the dollar. On a year to date basis, the Kenyan shilling has depreciated by 8.1% against the dollar, higher than the 3.6% depreciation recorded in 2021. As a result, the prices of crucial products such as fuel, wheat and cooking oil have increased thereby reducing profit margins for hotels in the sector,
- Lack of Proactive Reputational Management: During crises, Kenya is vulnerable to travel warnings advising against travel into the country, which lead to reduced international arrivals. Additionally, there is currently no dedicated strategy by the government to preemptively manage this reputational risk in existence. As a result, the hospitality industry may continue to face setbacks when foreign governments issue these advisories,
- Stiff Competition: The continued expansion by players on the back of recovery of the sector has led to an increase in the number of hotels, serviced apartments, and firms in the market, which has caused stiff competition as each tries to garner a larger share of the market while maintaining dominance. This has led to a need to offer more attractive terms to customers such as by lowering prices in order to fill existing units and spending more on advertisement efforts, thereby weighing down their profitability, and,
- Increased Credit Risk: According to the latest Quarterly Economic Review Q2’2022 Report by Central Bank of Kenya (CBK), the sector’s credit risk has remained elevated, evidenced by the 6.1% increase in gross NPLs to Kshs 20.9 bn from Kshs 19.7 bn in Q1’2022. On an annual basis, the gross NPLs increased by 28.2% from Kshs 16.3 bn in 2021. Consequently, most lenders continue to lend cautiously to the sector because of increased credit risks thus slowing down the sector’s growth.
Section II: Introduction to Serviced Apartments
To bring up to date our 2021 topical, we ventured into an analysis of serviced apartments in the Nairobi Metropolitan Area. A serviced apartment is a type of furnished apartment available for short term or long-term stays. Individuals, hotels or companies rent them on a daily, weekly or monthly basis with housekeeping charges and amenities typically available in traditional hotels such as fully equipped kitchens, washers and dryers, and separate bedrooms. The serviced apartments thus offer added space, convenience and privacy just like a home, and more flexible for business travelers who need to book accommodations at the last minute. The advantages of a serviced apartment include;
- Serviced apartments offer extra services like cleaning, maintenance, staffed service, delivery of shopping goods, and chauffeur driven arrivals which are not available in some hotels. These make them more advantageous for guests who want to avoid the hassle of doing house chores during their stay,
- Serviced apartments are designed to be more appealing to a wider range of people by incorporating different preferences and tastes into their design and match the culture of specific regions. This makes them more versatile and accommodating than a typical hotel room,
- Serviced apartments are commonly located within or in close proximity to other residential developments, making it easier for guests to integrate with the wider community,
- With access to almost everything they need, clients feel at ease and relaxed during their stay as serviced apartments provide more utilities and amenities, offering a “home-from-home” feel compared to hotels, and,
- Serviced apartments offer a more attractive investment option and greater flexibility to investors than hotels do. They can be converted into furnished or normal apartments if they are not performing well.
Section III: Supply and Distribution of Serviced Apartments in the Nairobi Metropolitan Area
The number of serviced apartments within the Nairobi Metropolitan Area (NMA) increased by a 7-Year CAGR of 9.3% to 6,377 apartments in 2022, from 3,414 apartments in 2015. The key facilities brought into the market this year included the 162-room Somerset Westview Serviced Apartments and 120-room 9 Oak Residences located in Kilimani. Westlands also debuted the 51-room JW Marriot Serviced Apartments which is located in the Global Trade Centre and developed by Avic International.
In terms of distribution, Westlands and Kilimani have the largest market share of serviced apartments within the Nairobi Metropolitan Area, at 33.7% and 29.2%, respectively. This is attributed to the attractiveness of the areas due to;
- Their strategic locations near the Nairobi CBD and to other upscale business nodes such as Upperhill and Spring Valley among others,
- Relatively better infrastructure such as Nairobi Expressway promoting direct connectivity to and from the Jomo Kenyatta International Airport (JKIA), and other major roads easing accessibility from other key areas,
- Growth in presence of international organizations seeking to enhance regional presence in Africa such as the Price Water Coopers Kenya Headquarters, United Nations agencies, and various Embassies, thus providing the customer base enhancing demand for the serviced apartments,
- Availability of sufficient social amenities such as shopping malls, and well organized delivery service companies within the areas, and,
- Presence of prime serviced apartments fetching higher rents and rental yields thus increasing investors’ confidence for the regions.
The table below indicates the serviced apartment’s market share in the Nairobi Metropolitan Area;
|
Cytonn Report: Nairobi Metropolitan Area (NMA) Serviced Apartments Market Share 2022 |
|
|
Area |
Percentage Market Share |
|
Westlands |
33.7% |
|
Kilimani |
29.2% |
|
Kileleshwa & Lavington |
12.4% |
|
Upperhill |
7.9% |
|
Limuru Road |
7.8% |
|
CBD |
4.5% |
|
Thika Road |
4.5% |
|
Total |
100.0% |
Source: Online Research
For the projects in the pipeline, the Nairobi Metropolitan Area currently has approximately 4 serviced apartments or hotels with serviced apartments’ concepts in the pipeline. Some of these key development include;
|
Cytonn Report: NMA Serviced Apartments Projects in the Pipeline 2022 |
|||
|
Name |
Location |
Number of Rooms |
Estimated Completion Date |
|
Grand Hyatt |
Westlands |
225 |
2023 |
|
Britam Properties |
Kilimani |
163 |
2023 |
|
MGallery |
Gigiri |
105 |
2023 |
|
Somerset Rosslyn |
Rosslyn |
162 |
2023 |
|
Total |
|
655 |
|
Source: Online Research
Section IV: Performance of Serviced Apartments in the Nairobi Metropolitan Area
In the development of the report, the performance of seven nodes within the Nairobi Metropolitan Area was tracked, and compared to the performance in 2021, with emphasis on the following metrics;
- Charged Rates: It is the daily, weekly and monthly rates that are charged to guests for serviced apartments in specific markets. This which form the basis for evaluation of the likely rental income to be received by investors in serviced apartments,
- Occupancy Rates: It measures the number of inhabited apartments as a percentage of the total number of units available. It also guides in determining the expected rental yields for various developments, and,
- Rental Yields: It measures the Real Estate investment return from the annualized collected rental income. It provides investors with an estimate of the returns expected from the property, as well as the time it will take to recover the investment. In the calculation of rental yields, we estimate annual income from monthly revenues and deduct operational costs (assumed as 40.0% of revenues).
In the estimations for the investment value, we have calculated development costs per SQM through factoring in land costs (location-based), costs of construction, equipping costs, professional fees and other costs relating to development. The formula thus used in the calculation rental yields is as follows;
Rental Yield= Monthly Rent per SQM x Occupancy Rate x ( 1 - 40.0% operational cost ) x 12 months
Development Cost per SQM*
It is important to note that investors will generally incur varying costs depending on the actual land costs incurred, the plot ratios, and the level of finishing and equipping. In analyzing performance, we will start by the node during the year, followed by a comparison with 2021 then the performance by typology will then be covered;
- Serviced Apartments Performance by Node
The average rental yield for serviced apartments within the NMA increased by 0.7% points to 6.2% in 2022 from 5.5% in 2021, with Westlands and Kilimani being the best performing nodes, with rental yields of 9.3% and 7.2% respectively compared to the market average of 6.2%. The performance was attributed to, i) proximity to the CBD, ii) presence of high quality serviced apartments available in the nodes which attract premium rates, iii) the ease of accessing the areas through well-developed infrastructure road networks, and, iv) the proximity to international organization offered by the apartments, all of which drive the demand for serviced apartments in the nodes. On the other hand, Thika Road was the least performing node, with an average rental yield of 4.2%, 2.0% points lower than the market average of 6.2%. The performance was ascribed to, i) the relatively low charge rates for apartments in the node, ii) the low demand for its serviced apartments caused by their unpopularity, iii) the long commute to main commercial zones, and, iv) security concerns surrounding the area, given that it is not mapped within the UN Blue Zone. The table below highlights the performance of the various nodes within the NMA;
|
Cytonn Report: NMA Serviced Apartments Performance per Node - 2022 |
||||||||
|
Node |
Studio |
1 Bed |
2 Bed |
3 bed |
Monthly Charge/ |
Occupancy |
Devt Cost/SQM (Kshs) |
Rental Yield |
|
SQM (Kshs) |
||||||||
|
Westlands |
193,633 |
284,376 |
343,828 |
353,350 |
3,916 |
70.7% |
209,902 |
9.3% |
|
Kilimani |
173,062 |
248,122 |
287,174 |
449,987 |
2,937 |
69.3% |
202,662 |
7.2% |
|
Kileleshwa & Lavington |
150,000 |
250,000 |
417,593 |
498,803 |
2,811 |
66.3% |
206,132 |
6.6% |
|
Limuru Road |
145,713 |
308,725 |
327,424 |
344,500 |
2,976 |
60.6% |
231,715 |
5.8% |
|
Nairobi CBD |
171,000 |
162,680 |
271,707 |
268,620 |
2,348 |
66.2% |
224,571 |
5.2% |
|
Upperhill |
201,533 |
347,950 |
554,800 |
2,225 |
65.4% |
209,902 |
5.0% |
|
|
Thika Road |
82,381 |
208,088 |
295,000 |
1,800 |
62.1% |
200,757 |
4.2% |
|
|
Average |
166,682 |
219,688 |
314,823 |
395,008 |
2,716 |
65.8% |
212,234 |
6.2% |
Source; Cytonn Research 2022
- Comparative Analysis- 2021/2022 Market Performance
The performance of the serviced apartments improved y/y, with the occupancy rates coming in at 65.8%, a 4.3% points increase from the 61.5% recorded in 2021. The monthly charges for 2022 increased to Kshs 2,716 per SQM from Kshs 2,549 per SQM recorded in 2021, representing a 6.6% increase. Consequently, the average rental yield increased to 6.2% in 2022, a 0.7% points increase from the 5.5% recorded in 2021. The improvement in performance was primarily on the back of; i) economic recovery especially for the services and accommodation sector, ii) an increase in both local and international tourist arrivals into the country resulting in an increase in occupancies as well as the number of hotels in operation during the period, iii) the intensive marketing of Kenya’s tourism market through platforms such as the Magical Kenya platform among others, iv) the increased operation of multinationals in the city who prefer to host their employees in serviced apartments, and, v) the rising preference by various guests for extended stay options within the city. The table below shows the comparative analysis between 2021 and 2022;
|
All values in Kshs unless stated otherwise |
|||||||||
|
Cytonn Report: Comparative Analysis-2021/2022 Market Performance |
|||||||||
|
Node |
Monthly Charge/SQM 2021 |
Occupancy 2021 |
Rental Yield 2021 |
Monthly Charge/SQM 2022 |
Occupancy 2022 |
Rental Yield 2022 |
Change in Monthly Charges/SQM |
Change in Occupancy |
Change in Rental Yield |
|
Westlands |
3,569 |
68.8% |
8.3% |
3,916 |
70.7% |
9.3% |
9.7% |
1.9% |
1.0% |
|
Kilimani |
2,815 |
60.0% |
5.8% |
2,937 |
69.3% |
7.2% |
4.3% |
9.3% |
1.4% |
|
Kileleshwa & Lavington |
2,571 |
57.1% |
6.4% |
2,811 |
66.3% |
6.6% |
9.3% |
9.2% |
0.2% |
|
Limuru Road |
2,853 |
60.5% |
4.9% |
2,976 |
60.6% |
5.8% |
4.3% |
0.1% |
0.9% |
|
Nairobi CBD |
2,176 |
66.6% |
4.9% |
2,348 |
66.2% |
5.2% |
7.9% |
(0.4%) |
0.3% |
|
Upperhill |
2,109 |
61.1% |
4.5% |
2,225 |
65.4% |
5.0% |
5.5% |
4.3% |
0.5% |
|
Thika Road |
1,748 |
56.4% |
3.5% |
1,800 |
62.1% |
4.2% |
3.0% |
5.7% |
0.7% |
|
Average |
2,549 |
61.5% |
5.5% |
2,716 |
65.8% |
6.2% |
6.3% |
4.3% |
0.7% |
Source; Cytonn Research 2022
Section V: Recommendations and Outlook
After looking at the various factors driving the hospitality industry and with a particular focus on the serviced apartments sector, including challenges and current performance, we conclude with a recommendation of existing investment opportunities in the sector, and outlook as depicted below;
|
|
Cytonn Report: Serviced Apartments Sector Outlook |
|
|
Measure |
Sentiment |
Outlook |
|
Serviced Apartments Performance |
|
Positive |
|
International Tourism |
|
Neutral |
|
MICE Tourism |
|
Neutral |
|
Supply |
|
Neutral |
Given that majority of our key metrics are neutral, we have a NEUTRAL overall outlook for the hospitality sector. The Investment opportunity lies in Westlands, Kilimani, and Kileleshwa-Lavington which performed the best among all the nodes, with rental yields of 9.3%, 7.2% and 6.6% respectively, compared to the market average of 6.2%.

- Talk to us
- Kenya
- P.O Box 20695 - 00200, Nairobi, Kenya
- Cell +254709101200
- Tel +254709101200
- WhatsApp +254741676635
- United States
- +254709101200
- DOWNLOAD OUR APP
-


- Kenya
- 8th Floor, Pinetree Plaza, Kaburu Drive, Ngong Road, Nairobi, Kenya
- USA
- Suite 1150, 1775 Eye Street NW, USA, Washington DC 20006, USA
- Investments
- High Yield
- Private Equity
- Real Estate
- Real Estate
- RiverRun Estates
- Cytonn Towers
- The Ridge
- Taraji Heights
- The Alma