
Navigating Markets in an Era of Geopolitical Fragmentation, &Cytonn Weekly #29/2026
By Research Team, Jul 26, 2026
Executive Summary
Fixed Income
During the week, T-bills were oversubscribed for the eighth consecutive week, with the overall subscription rate coming in at 137.5% albeit lower than the subscription rate of 157.2%, recorded the previous week. Investors’ preference for the shorter 91-day paper persisted, with the paper receiving bids worth Kshs 22.1 bn against the offered Kshs 8.0 bn, translating to a subscription rate of 275.7%, lower than the the subscription rate of 304.4% recorded the previous week. The subscription rate for the 364-day paper increased to 48.8% from 45.1% recorded the previous week, while that of the 182-day paper decreased to 115.6% from 151.5% recorded the previous week. The government accepted a total of Kshs 29.3 bn worth of bids out of Kshs 38.5 bn bids received, translating to an acceptance rate of 76.0%. The yields on the government papers were on a downward trajectory with the yields on the 91-day paper decreased the most by 1.7 bps to 8.78% from 8.80% recorded the previous week. The yields on the 182-day papers decreased by 1.5 bps to 8.97% from 8.95% recorded the previous week. Moreover, the yields on the 364-day papers decreased by 0.5 bps to remain unchanged from the 9.04% recorded the previous week;
During the week, the Central Bank of Kenya released the auction results for the re-opened treasury bonds FXD1/2019/020 and FXD1/2022/025 with tenors to maturities of 12.8 years and 21.4 years respectively and fixed coupon rates of 12.9% and 14.2% respectively. The bonds were oversubscribed, with the overall subscription rate coming in at 214.8%, receiving bids worth Kshs 85.9 bn against the offered Kshs 40.0 bn. The government accepted bids worth Kshs 63.3 bn, translating to an acceptance rate of 73.6%. The weighted average yield for the accepted bids for the FXD1/2019/020 and FXD1/2022/025 came in at 13.9% and 14.4% respectively. Notably, the 13.9% and 14.4% yields on FXD1/2019/020 and FXD1/2022/025 were both higher than the 13.2% and 13.8% recorded at the last reopening in May 2026 and January 2026 respectively. With the Inflation rate at 6.4% as of June 2026, the real returns of the FXD1/2019/020 and FXD1/2022/025 are 7.5% and 8.0%. Given the 10.0% withholding tax on the bonds, the tax equivalent yields for shorter term bonds with 15.0% withholding tax are 13.7% and 15.0% for the FXD1/2019/020 and FXD1/2022/025 respectively;
We are projecting the y/y inflation rate for July 2026 will remain within the range of 6.2% - 6.6%;
Equities
During the week, the equities market was on an upward trajectory, with NSE 10, NSE 20, NSE 25 and NASI gaining by 1.2%, 1.0%, 0.9% and 0.8% respectively, taking the YTD performance to gains of 27.3%, 26.9%, 26.5% and 24.6% respectively for NSE 20, NSE 10, NSE 25 and NASI respectively. The week-on-week equities market performance was mainly driven by gains recorded by large cap stocks such as EABL, Diamond Trust Bank and KCB of 7.3%, 3.1% and 2.2% respectively. However, the performance was weighed down by losses recorded by large cap stocks such as Stanbic, Absa Bank and Standard Chartered Bank of 1.2%,1.0% and 0.8% respectively;
During the week, the banking sector index increased marginally by 0.6% to 265.9 from the 264.2 recorded the previous week. This is attributable to gains recorded by large cap stocks such as Diamond Trust Bank, KCB and NCBA of 3.1%, 2.2% and 1.1% respectively. However, the performance was weighed down by losses recorded by large cap stocks such as Stanbic, Absa Bank and Standard Chartered Bank of 1.2%, 1.0% and 0.8% respectively;
During the week, British American Tobacco Kenya Plc released their H1’2026 financial results, recording a 3.1% increase in Profits after Tax (PAT) to Kshs 3.1 bn, from Kshs 3.0 bn recorded in H1’2025. mainly attributed to the 4.6% increase in net revenue to Kshs 12.3 bn in H1’2026 from Kshs 11.7 bn in H1’2025, coupled with a 40.2% increase in Finance income to 0.14 bn in H1’2026 from Kshs 0.10 bn in H1’2025. The performance was, however, weighed down by a 6.8% increase in cost of operations to Kshs 8.0 bn from Kshs 7.5 bn in H1’2025;
During the week, Nedbank Group announced the results of its offer to acquire a 66.0% stake in NCBA Group, with total acceptances reaching 1.3 bn shares, equivalent to an acceptance rate of 79.9% of NCBA's issued ordinary shares, well above the targeted acquisition. The acceptances comprised 920.7 mn shares tendered under shareholders' pro rata entitlement, representing 55.9% of NCBA's issued shares, and a further 395.7 mn shares submitted as excess applications, equivalent to 24.0% of the issued shares;
Real Estate
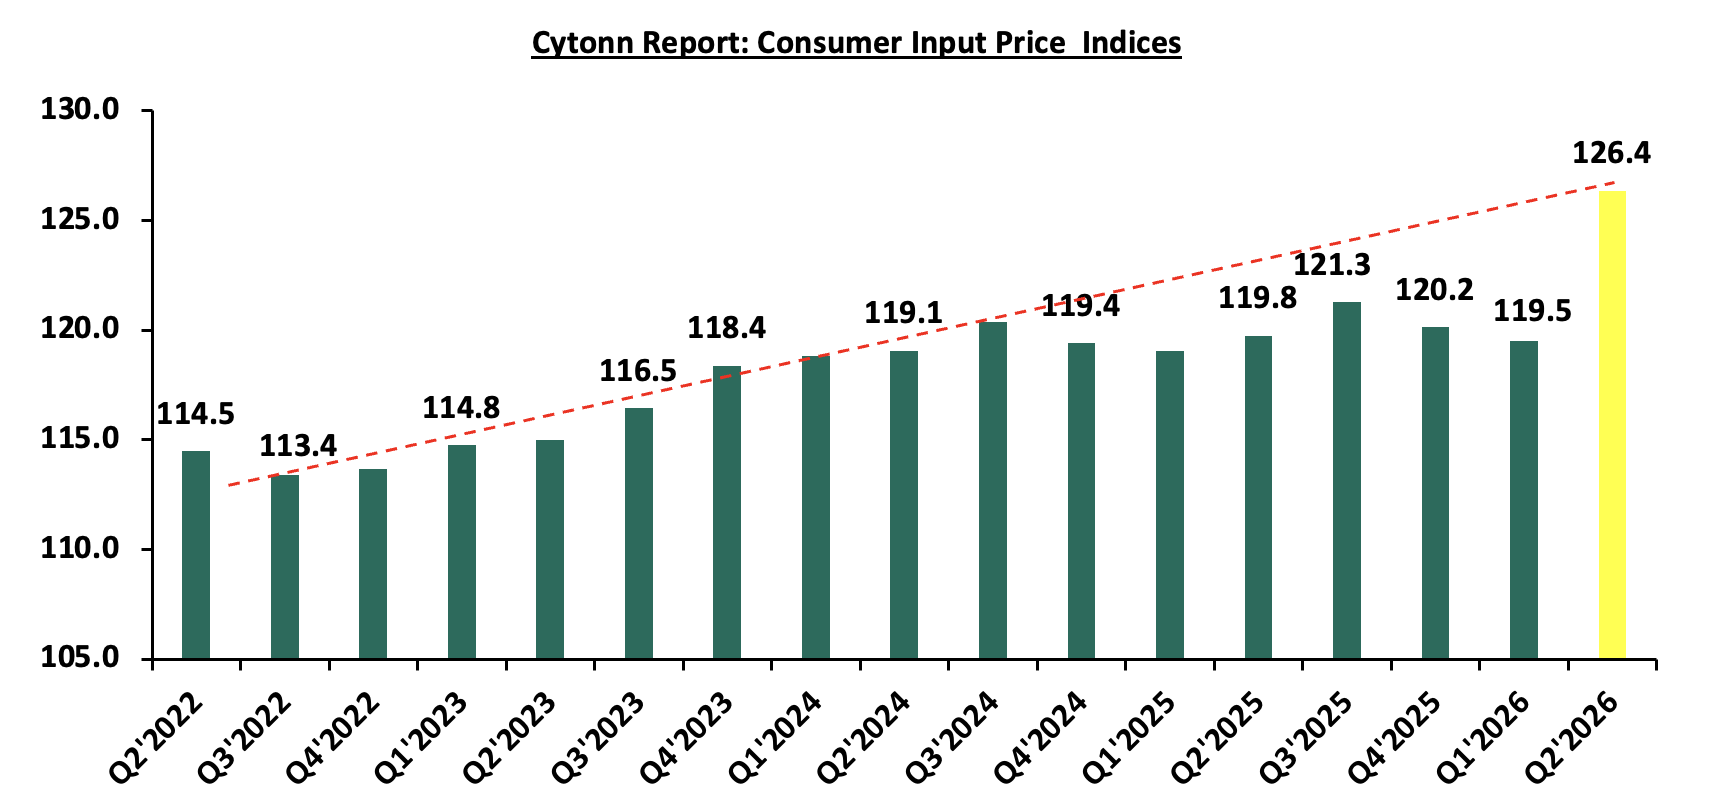
During the week, the Kenya National Bureau of Statistics released their Q2’2026 construction input price indices report that showed the cost of construction in Kenya increasing significantly with a 5.7% rise in the Construction Input Price Index (CIPI) to 126.4 from 119.5 in Q1’2026, the highest quarterly increase since late 2022;
During the week, Nairobi County approved the implementation framework for Phase I of the Nairobi Metropolitan Mass Rapid Transit System (NMRTS), paving the way for the city's first underground railway. The initial phase will run beneath the Central Business District (CBD) before extending to Eastlands, with the aim of easing traffic congestion, reducing travel times and improving connectivity through integrated transit terminals that link rail services, pedestrians and other modes of transport;
During the week, the Kenya National Highways Authority (KeNHA) announced plans to upgrade 25 new feeder roads connected to the 16.5 km Nairobi Western Bypass in Kiambu County to bitumen standards, with the aim of improving accessibility and easing movement within the surrounding areas;
During the week, the government revised its plans for the Nairobi–Mombasa highway by opting to expand the existing 461.0 km A8 road into a minimum four-lane, access-controlled toll highway under a Public-Private Partnership (PPP), replacing the earlier proposal to construct a new expressway;
On the Unquoted Securities Platform Acorn D-REIT and I-REIT traded at Kshs 29.6 and Kshs 23.8 per unit, respectively, as per the last updated data on 17th July 2026. The performance represented a 48.0% and 18.8% gain for the D-REIT and I-REIT, respectively, from the Kshs 20.0 inception price. The volumes traded for the D-REIT and I-REIT came in at 13.5 mn and 43.3 mn shares, respectively. Additionally, ILAM Fahari I-REIT traded at Kshs 13.8 per share as of 17th July 2026, representing a 31.0% loss from the Kshs 20.0 inception price. The volume traded to date came in at 1.2 mn shares for the I-REIT;
Digital Payments:
During the week, American Express reported its Q2’2026 financial results, beating Wall Street earnings expectations with diluted earnings per share (EPS) of USD 4.5 against consensus estimates of USD 4.4 and a 11.0% increase from USD 4.1 in the same period last year. Total net revenue reached USD 19.6 bn, reflecting a 10.0% year-over-year expansion driven by double-digit growth in card fees and resilient premium consumer spending;
During the week, Mastercard Incorporated announced major enhancements to its enterprise Virtual Card Number (VCN) platform, Mastercard In Control, integrating issuer-enforced spend controls, embedded payments infrastructure, and unified single-API integration. Additionally, Mastercard partnered with Intuit to roll out a dedicated small-business card directly integrated with QuickBooks to automate bookkeeping and liquidity management;
During the week, digital asset infrastructure firm Circle executed strategic partnerships in South Korea, signing Memorandums of Understanding (MOUs) with Kakao Group and Toss Bank. The collaborations focus on evaluating blockchain-based payment rails and integrating USD Coin (USDC) into Asian digital ecosystems to streamline cross-border settlement and localized payment infrastructure;
During the week, Block, Inc. announced a restaurant software expansion, deploying its Square multi-location management software, integrated POS hardware, and kitchen display systems across Dimassi’s Mediterranean Buffet’s 24-location portfolio;
The digital payment stocks we track (AXP, Visa, Mastercard, Circle, Block, and PayPal) are currently trading at an average P/E of 25.5x, implying that investors are pricing in strong future earnings growth expectations and are willing to pay a significant premium for current earnings, which may also suggest that valuations may be stretched relative to near-term fundamentals;
FOTW: Navigating Markets in an Era of Geopolitical Fragmentation
This week, we turn our focus to Navigating Markets in an Era of Geopolitical Fragmentation. Geopolitical fragmentation is not simply the splitting of the global economy into competing blocs but a redistribution of economic risk and opportunity based on each actor's structural flexibility, where diversified, multi-aligned players capture disproportionate advantage and single-dependency players absorb disproportionate cost. The global economic landscape is undergoing a structural shift away from integrated global supply chains toward fragmented trade blocs, heightened sanctions regimes and protectionist industrial policies. Driven by intensifying US-China strategic competition, ongoing regional conflicts especially in the Middle East and shifting national security priorities, fragmentation is reshaping international capital flows, trade corridors, and financial stability. For African and Kenyan investors, geopolitical fragmentation is reshaping the global distribution of economic risks and opportunities, with the predominant impact being higher trade costs, greater financial market volatility, and increased uncertainty. These dynamics are increasingly reflected in tariff schedules, Eurobond yields, the Shilling, and portfolio flows.
Investment Updates:
-
Weekly Rates: Cytonn Money Market Fund closed the week at a yield of 11.35% p.a. To invest, dial *809# or download the Cytonn App from Google Play store here or from the Appstore here;
-
We continue to offer Wealth Management Training every Tuesday, from 7:00 pm to 8:00 pm. The training aims to grow financial literacy among the general public. To register for any of our Wealth Management Trainings, click here. If interested in our Private Wealth Management Training for your employees or investment group, please get in touch with us through wmt@cytonn.com;
-
Cytonn Insurance Agency acts as an intermediary for those looking to secure their assets and loved ones’ future through insurance namely; Motor, Medical, Life, Property, WIBA, Credit and Fire and Burglary insurance covers. For assistance, get in touch with us through insuranceagency@cytonn.com;
-
Cytonn Asset Managers Limited (CAML) continues to offer pension products to meet the needs of both individual clients who want to save for their retirement during their working years and Institutional clients that want to contribute on behalf of their employees to help them build their retirement pot. To more about our pension schemes, kindly get in touch with us through pensions@cytonn.com;
Hospitality Updates:
-
We currently have promotions for Staycations. Visit cysuites.com/offers for details or email us at sales@cysuites.com;
Money Markets, T-Bills Primary Auction:
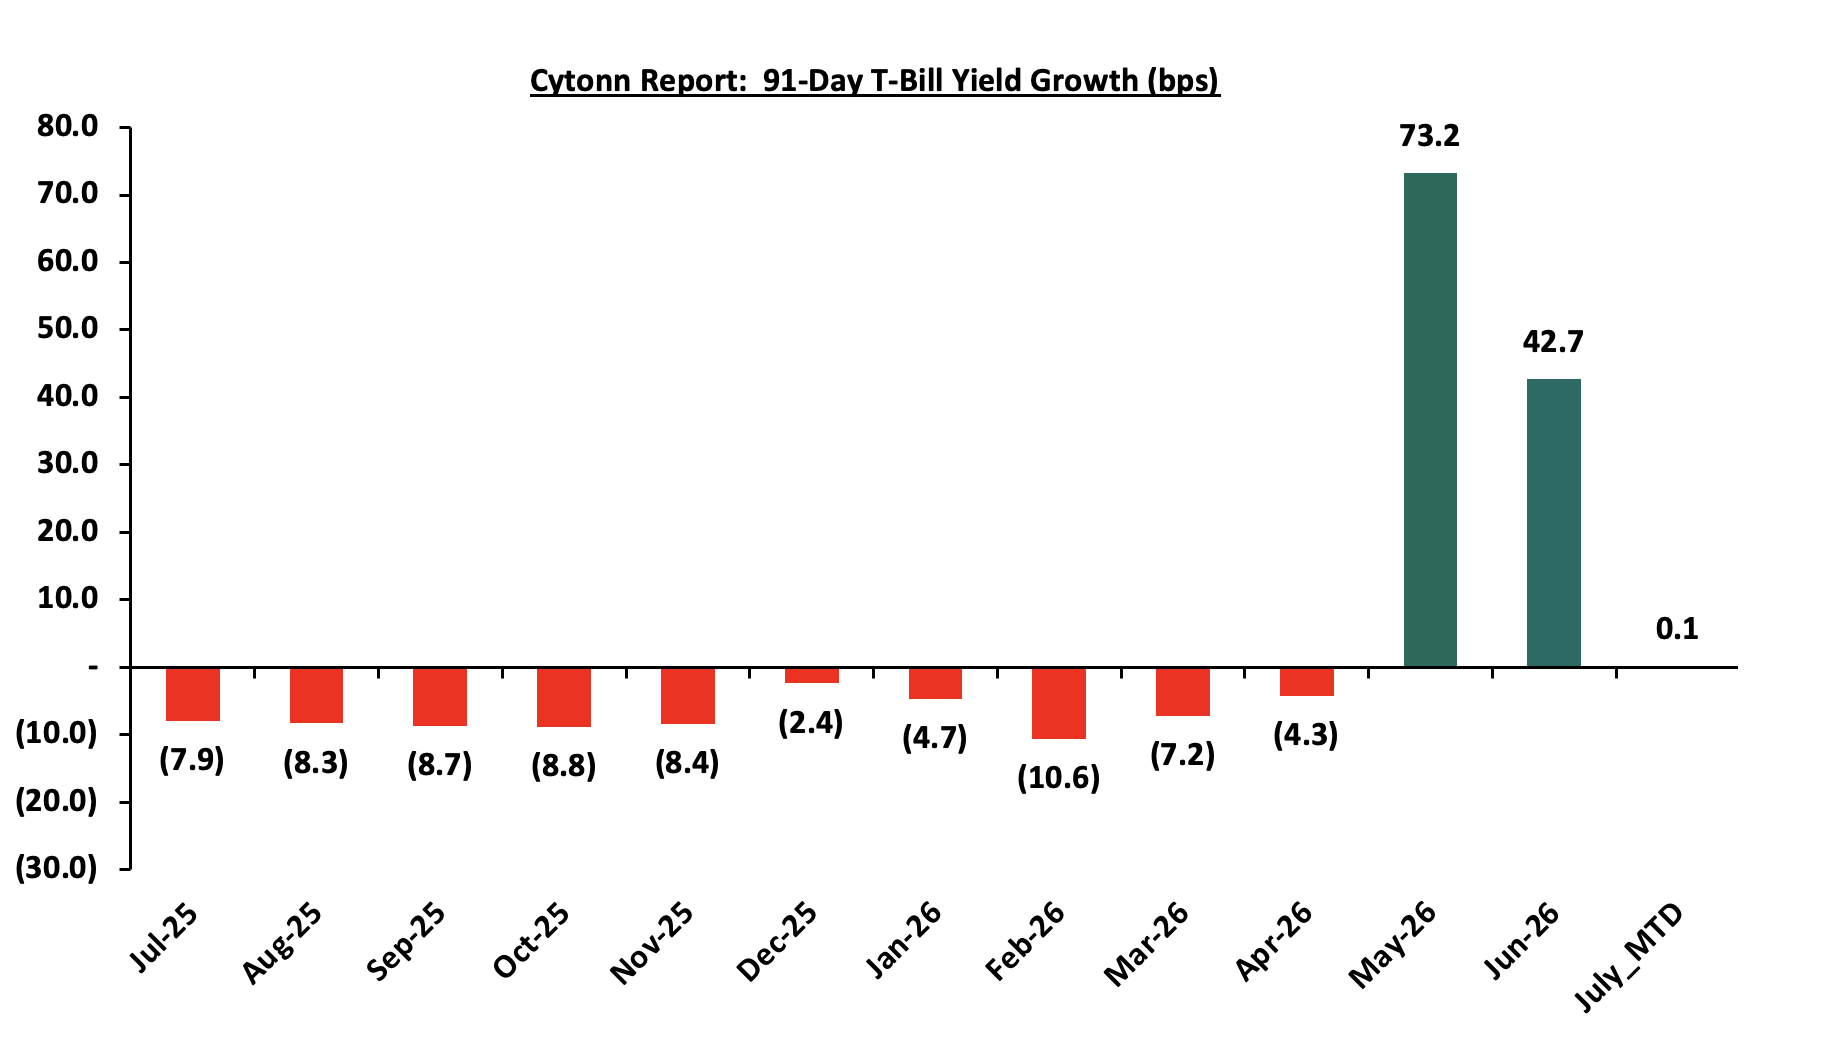
This week, T-bills were oversubscribed for the eighth consecutive week, with the overall subscription rate coming in at 137.5% lower than the subscription rate of 157.2%, recorded the previous week. Investors’ preference for the shorter 91-day paper persisted, with the paper receiving bids worth Kshs 22.1 bn against the offered Kshs 8.0 bn, translating to a subscription rate of 275.7%, lower than the the subscription rate of 304.4% recorded the previous week. The subscription rate for the 364-day paper increased to 48.8% from 45.1% recorded the previous week, while that of the 182-day paper decreased to 115.6% from 151.5% recorded the previous week. The government accepted a total of Kshs 29.3 bn worth of bids out of Kshs 38.5 bn bids received, translating to an acceptance rate of 76.0%. The yields on the government papers were on a downward trajectory with the yields on the 91-day paper decreased the most by 1.7 bps to 8.78% from 8.80% recorded the previous week. The yields on the 182-day papers decreased by 1.5 bps to 8.97% from 8.95% recorded the previous week. Moreover, the yields on the 364-day papers decreased by 0.5 bps to remain unchanged from the 9.04% recorded the previous week. The chart below shows the yield growth rate for the 91-day paper from July 2025 to date:
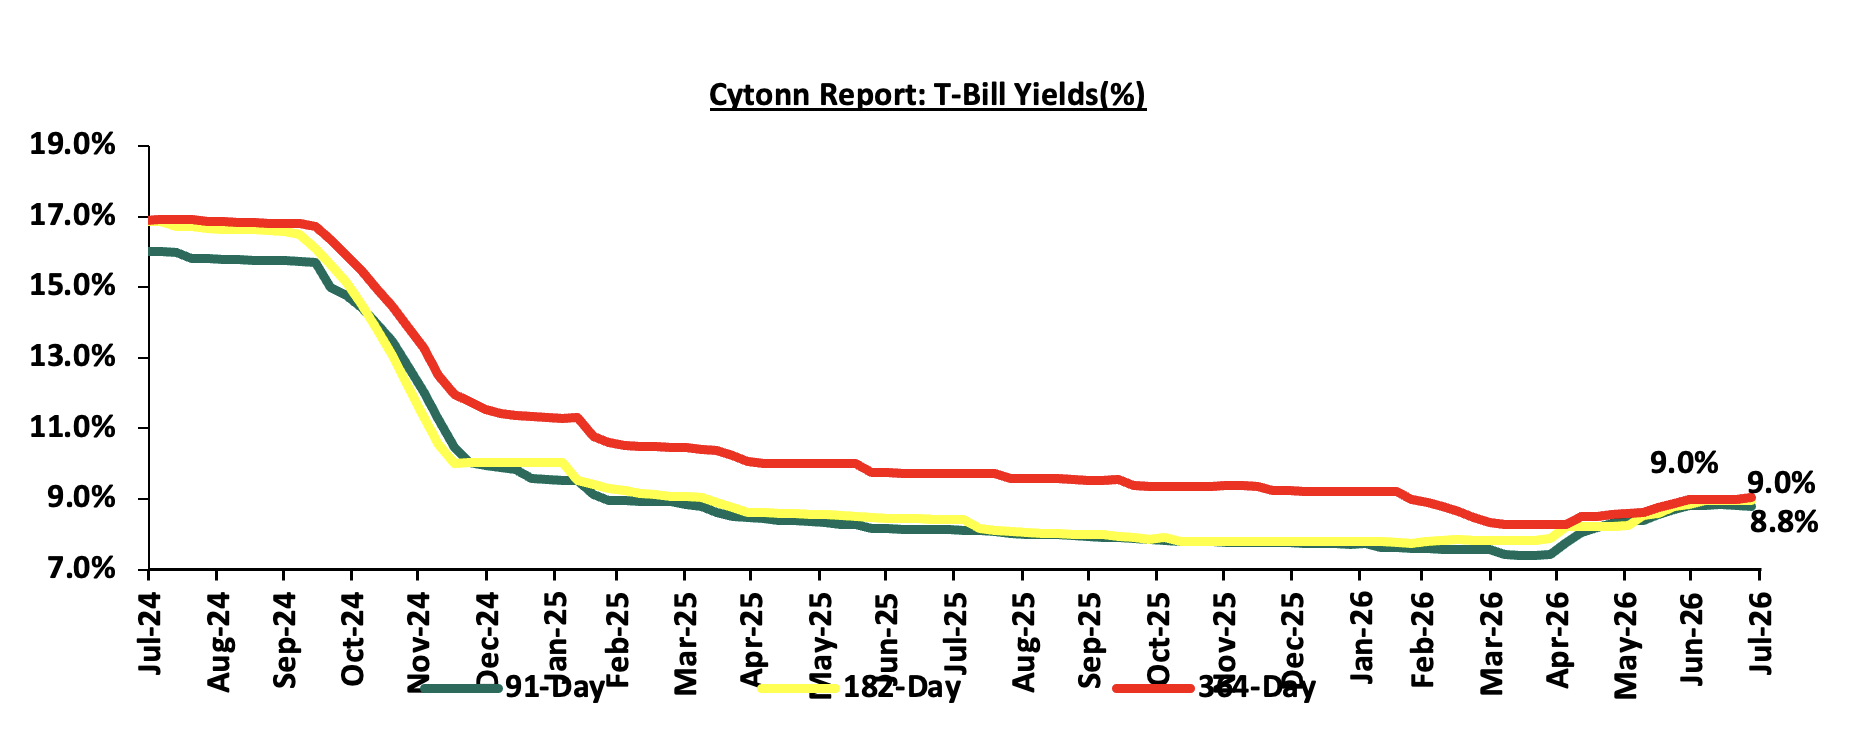
The chart below shows the performance of the 91-day, 182-day and 364-day papers from July 2024 to July 2026:
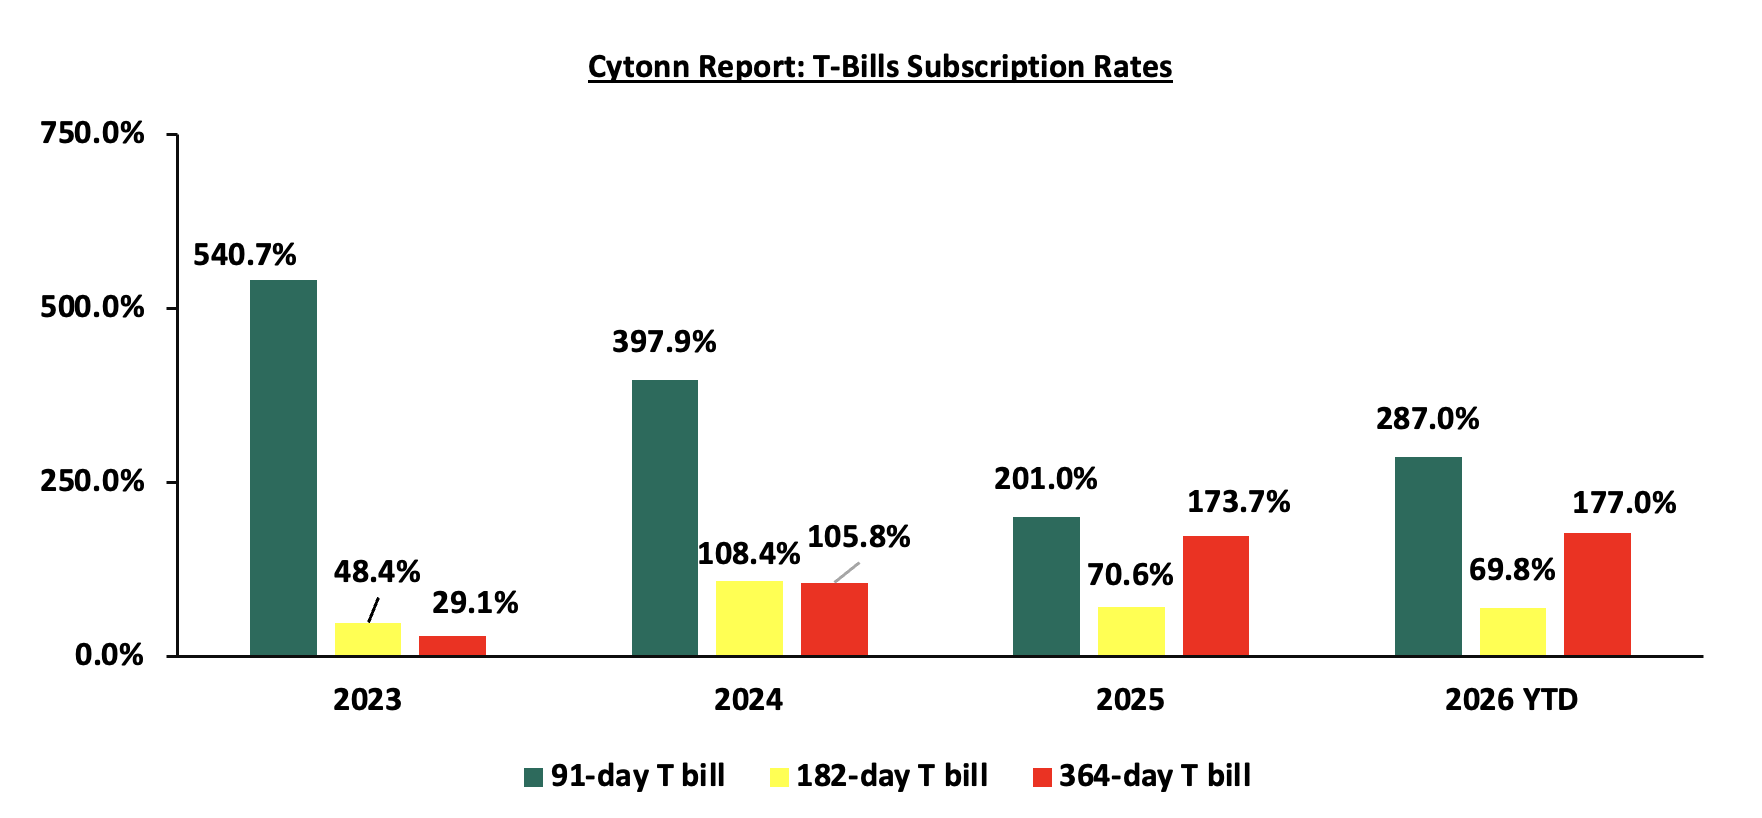
The chart below compares the overall average T-bill subscription rates obtained in 2023, 2024, 2025 and 2026 Year-to-date (YTD):
T-Bonds Primary Auction:
During the week, the Central Bank of Kenya released the auction results for the re-opened treasury bonds FXD1/2019/020 and FXD1/2022/025 with tenors to maturities of 12.8 years and 21.4 years respectively and fixed coupon rates of 12.9% and 14.2% respectively. The bonds were oversubscribed, with the overall subscription rate coming in at 214.8%, receiving bids worth Kshs 85.9 bn against the offered Kshs 40.0 bn. The government accepted bids worth Kshs 63.3 bn, translating to an acceptance rate of 73.6%. The weighted average yield for the accepted bids for the FXD1/2019/020 and FXD1/2022/025 came in at 13.9% and 14.4% respectively. Notably, the 13.9% and 14.4% yields on FXD1/2019/020 and FXD1/2022/025 were both higher than the 13.2% and 13.8% recorded at the last reopening in May 2026 and January 2026 respectively. With the Inflation rate at 6.4% as of June 2026, the real returns of the FXD1/2019/020 and FXD1/2022/025 are 7.5% and 8.0%. Given the 10.0% withholding tax on the bonds, the tax equivalent yields for shorter term bonds with 15.0% withholding tax are 13.7% and 15.0% for the FXD1/2019/020 and FXD1/2022/025 respectively.
Money Market Performance:
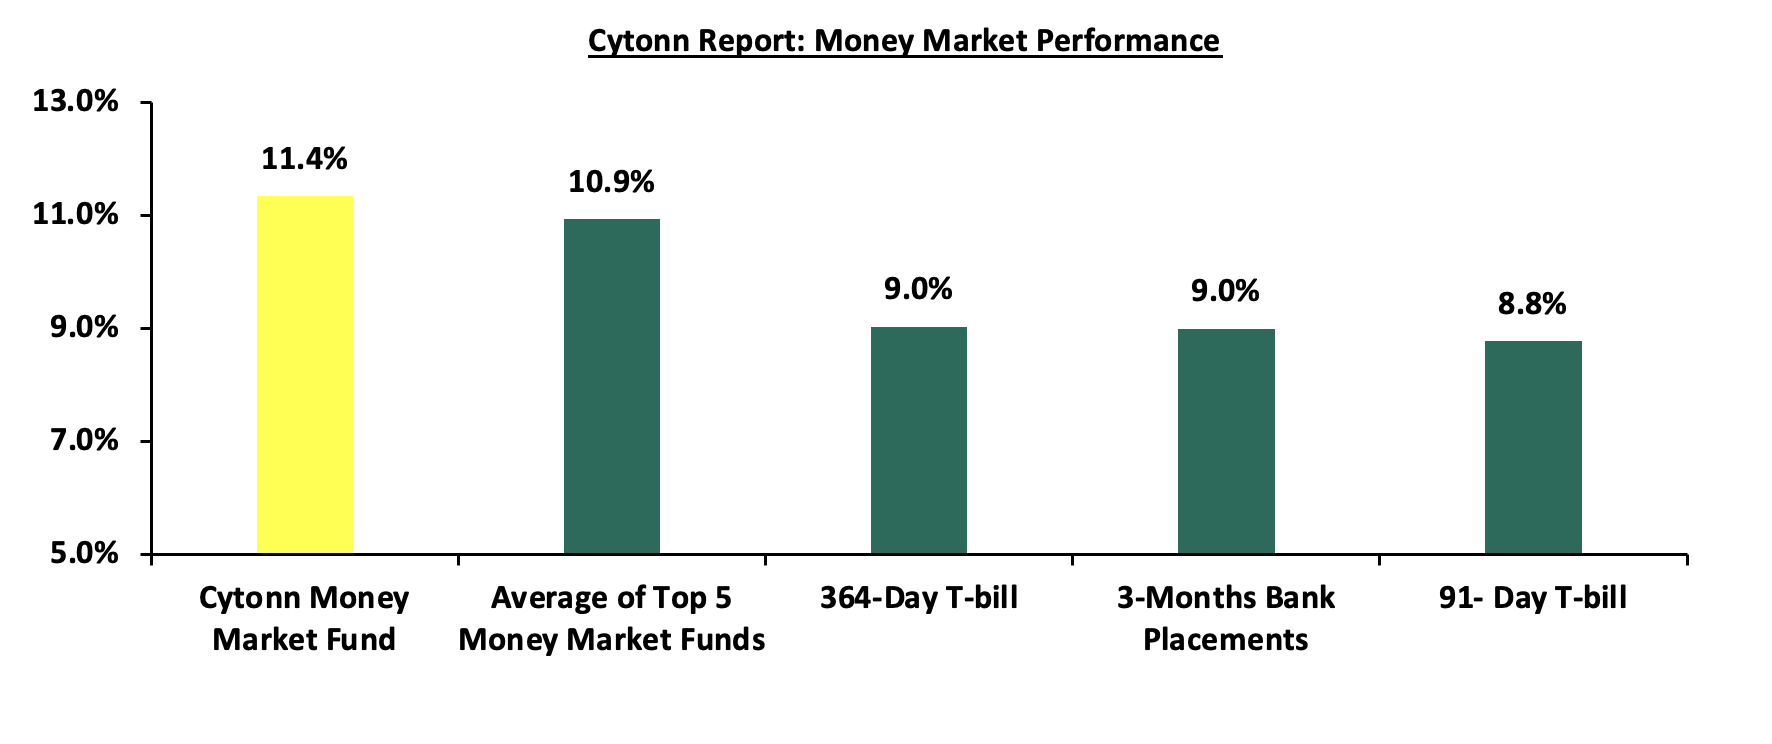
In the money markets, 3-month bank placements ended the week at 9.0% (based on rates offered by various banks). The yield on the 91-day paper decreased by 1.7 bps to 8.78% from 8.80% recorded the previous week, while the yield on 364-day papers decreased by 0.5 bps to remain unchanged from the 9.04% recorded the previous week. The yield on the Cytonn Money Market Fund decreased by 0.3% to 11.4% from 11.7% recorded the previous week, while the average yields on the Top 5 Money Market Funds decreased by 7.2 bps to 10.9% from 11.0% recorded the previous week.
The table below shows the Money Market Fund Yields for Kenyan Fund Managers as published on 24th July 2026:
|
Money Market Fund Yield for Fund Managers as published on 24th July 2026 |
||
|
Rank |
Fund Manager |
Effective Annual Rate |
|
1 |
Nabo Africa Money Market Fund |
11.7% |
|
2 |
Cytonn Money Market Fund (Dial *809# or download Cytonn App) |
11.4% |
|
3 |
Lofty-Corban Money Market Fund |
10.6% |
|
4 |
British-American Money Market Fund |
10.5% |
|
5 |
Enwealth Money Market Fund |
10.5% |
|
6 |
Ndovu Money Market Fund |
10.5% |
|
7 |
Kuza Money Market fund |
10.5% |
|
8 |
Madison Money Market Fund |
10.5% |
|
9 |
Globetec Money Market Fund |
10.4% |
|
10 |
Etica Money Market Fund |
10.3% |
|
11 |
Arvocap Money Market Fund |
10.3% |
|
12 |
Faulu Money Market Fund |
10.3% |
|
13 |
Old Mutual Money Market Fund |
10.2% |
|
14 |
Jubilee Money Market Fund |
10.2% |
|
15 |
Gulfcap Money Market Fund |
10.1% |
|
16 |
Orient Kasha Money Market Fund |
10.0% |
|
17 |
SanlamAllianz Money Market Fund |
9.6% |
|
18 |
GenAfrica Money Market Fund |
9.5% |
|
19 |
KCB Money Market Fund |
9.2% |
|
20 |
Apollo Money Market Fund |
9.2% |
|
21 |
Dry Associates Money Market Fund |
8.9% |
|
22 |
Genghis Money Market Fund |
8.6% |
|
23 |
CIC Money Market Fund |
8.4% |
|
24 |
CPF Money Market Fund |
8.3% |
|
25 |
ICEA Lion Money Market Fund |
8.1% |
|
26 |
Mayfair Money Market Fund |
8.0% |
|
27 |
Co-op Money Market Fund |
8.0% |
|
28 |
Mali Money Market Fund |
8.0% |
|
29 |
Absa Shilling Money Market Fund |
7.3% |
|
30 |
AA Kenya Shillings Fund |
6.2% |
|
31 |
Ziidi Money Market Fund |
6.1% |
|
32 |
Equity Money Market Fund |
5.3% |
|
33 |
Stanbic Money Market Fund |
|
Source: Daily Nation
Liquidity:
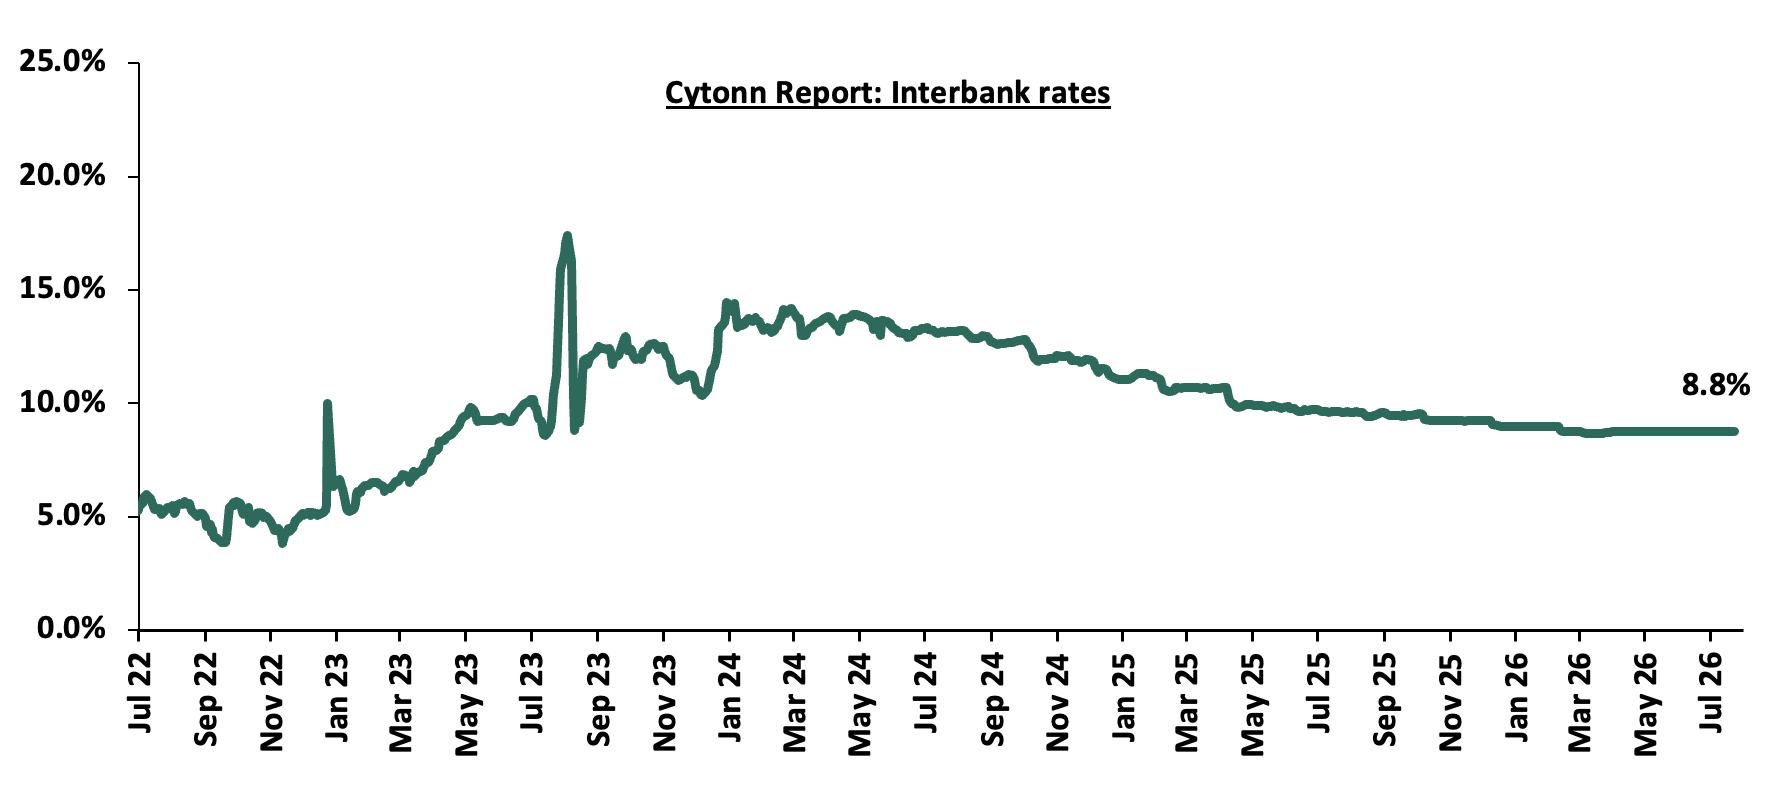
During the week, liquidity in the money markets tightened with the average interbank rate increasing marginally by 0.2 bps to 8.8% from 8.7% recorded last week, partly attributable to government payments that offset tax remittances. The average interbank volumes traded decreased by 51.4% to Kshs 3.7 bn from Kshs 7.6 bn recorded the previous week. The chart below shows the interbank rates in the market over the years:
Kenya Eurobonds:
During the week, the yields on the Eurobonds were on an upward trajectory with the yield on the 13-year Eurobond issued in 2021, increasing the most by 25.0 bps to 8.6% from 8.3% recorded the previous week. The table below shows the summary performance of the Kenyan Eurobonds as of 23rd July 2026
|
Cytonn Report: Kenya Eurobonds Performance |
||||||
|
|
2018 |
2019 |
2021 |
2024 |
||
|
Tenor |
10-year issue |
30-year issue |
12-year issue |
13-year issue |
7-year issue |
|
|
Amount Issued (USD) |
1.0 bn |
1.0 bn |
1.0 bn |
1.5 bn |
1.5 bn |
|
|
Years to Maturity |
2.5 |
22.5 |
8.8 |
5.5 |
10.5 |
|
|
Yields at Issue |
7.3% |
8.3% |
6.2% |
10.4% |
9.9% |
|
|
2-Jan-26 |
6.1% |
8.8% |
7.2% |
7.8% |
7.1% |
|
|
2-Jul-26 |
6.8% |
8.8% |
7.6% |
8.0% |
7.1% |
|
|
16-Jul-26 |
7.0% |
8.9% |
7.9% |
8.3% |
7.6% |
|
|
17-Jul-26 |
7.0% |
8.9% |
8.0% |
8.4% |
7.6% |
|
|
20-Jul-26 |
7.0% |
8.9% |
7.9% |
8.4% |
7.6% |
|
|
21-Jul-26 |
7.0% |
9.0% |
8.0% |
8.4% |
7.7% |
|
|
22-Jul-26 |
7.1% |
9.0% |
8.0% |
8.5% |
7.7% |
|
|
23-Jul-26 |
7.1% |
9.1% |
8.1% |
8.6% |
7.8% |
|
|
Weekly Change |
0.1% |
0.1% |
0.2% |
0.3% |
0.2% |
|
|
MTD Change |
0.3% |
0.3% |
0.5% |
0.6% |
0.7% |
|
|
YTD Change |
1.0% |
0.2% |
0.9% |
0.8% |
0.7% |
|
Source: Central Bank of Kenya (CBK) and National Treasury
Kenya Shilling:
During the week, the Kenya Shilling depreciated against the US Dollar by 17.8 bps to Kshs 129.5 from Kshs 129.3 recorded the previous week. On a year-to-date basis, the shilling has depreciated by 37.2 bps against the dollar, as compared to the 22.9 bps appreciation recorded in 2025.
We expect the shilling to be supported by:
-
Diaspora remittances standing at a cumulative USD 4,960.4 mn in the twelve months to June 2026, slightly lower than the USD 5,084.1 mn recorded over the same period in 2025. These have continued to cushion the shilling against further depreciation. In the June 2026 diaspora remittances figures, North America remained the largest source of remittances to Kenya accounting for 50.8% in the period,
-
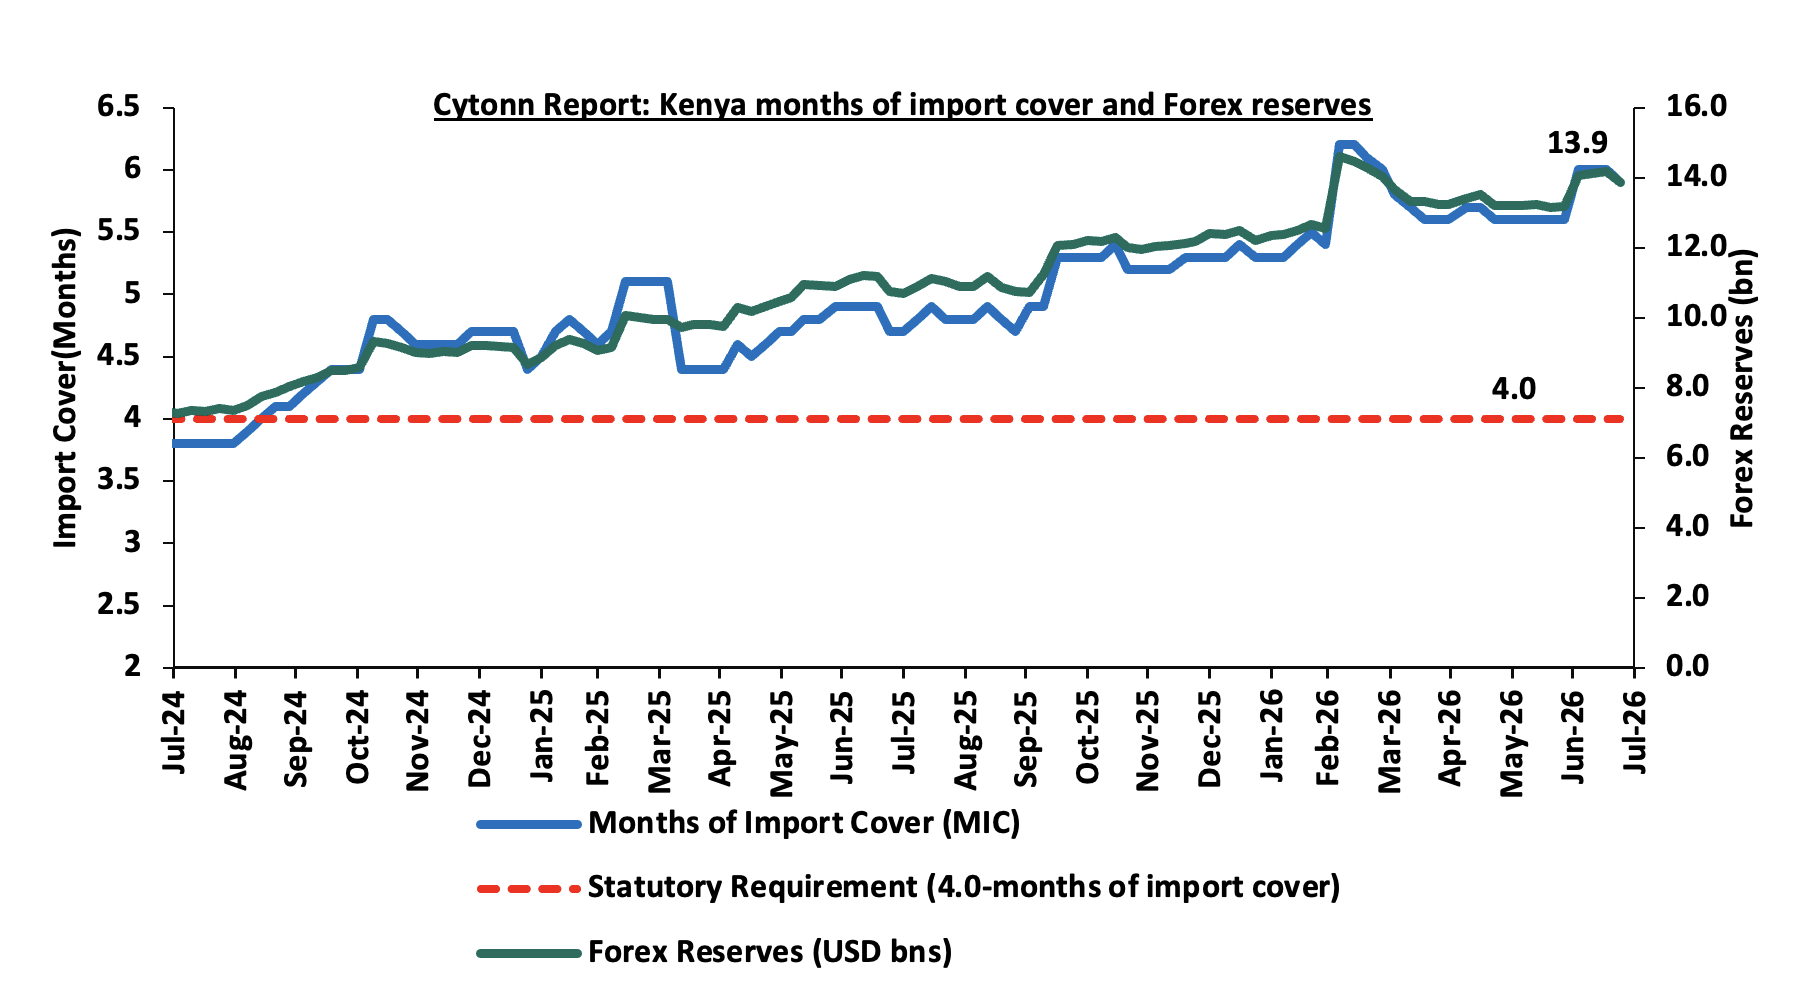
Improved forex reserves currently at USD 13.9 bn (equivalent to 5.9-months of import cover), which is above the statutory requirement of maintaining at least 4.0-months of import cover and above the EAC region’s convergence criteria of 4.5-months of import cover.
The shilling is however expected to remain under pressure in 2026 as a result of:
-
An ever-present current account deficit which is estimated at 2.6% of GDP in the 12 months to April 2026 compared to 1.7 percent of GDP in a similar period in 2025 and,
-
The need for government debt servicing, continues to put pressure on forex reserves given that 53.0% of Kenya’s external debt is US Dollar-denominated as of December 2025
Kenya’s forex reserves decreased by 2.2% during the week to USD 13.9 bn from USD 14.2 bn recorded the previous week, equivalent to 5.9 months of import cover, and above the statutory requirement of maintaining at least 4.0-months of import cover.
The chart below summarizes the evolution of Kenya's months of import cover over the years:
Weekly Highlights
-
July 2026 Inflation Projection
We are projecting the y/y inflation rate for July 2026 will remain within the range of 6.2%- 6.6%, mainly on the back of:
-
Stable Fuel Prices in July 2026 - The Energy and Petroleum Regulatory Authority (EPRA) released their monthly statement on the maximum retail fuel prices in Kenya, effective from 15th July 2026 to 14th August 2026. Notably, the maximum allowed prices for Super Petrol, Diesel and Kerosene remain unchanged at Kshs 214.0, Kshs 222.9 and Kshs 191.4 per litre respectively. This stability in fuel prices may help elevate inflationary pressure, given fuel's significant role in transportation and production costs across the economy.
-
Maintaining the Central Bank Rate (CBR) at 8.75% - The MPC's decision to hold the CBR at 8.75% since the February 2026 cut maintained through April and June signals a policy stance that has paused easing rather than resumed loosening. With no fresh rate cuts feeding new demand-side pressure into the economy, the disinflationary momentum built through 2025's tightening cycle remains intact, giving room for headline inflation to continue easing toward the 6.2%-6.4% range we project for July.
We, however expect the inflation to be supported by:
-
Rising Fuel and Forex Adjustment Charges on Electricity: In July 2026 electricity prices increased on the back of a rise in fuel cost charges and forex adjustment charges. EPRA set the Fuel Energy Cost Charge at Ksh 3.20 per kWh, up from Ksh 3.14 in June 2026, while the Foreign Exchange Fluctuation Adjustment more than doubled to Ksh 1.48 per kWh from Ksh 0.72, alongside a newly introduced Inflation Adjustment of Ksh 0.48 per kWh running through December 2026. With electricity a direct input into production and distribution costs, this pass-through works against the disinflationary pull from stable fuel prices and the paused CBR, and is a key reason we hold our July projection at 6.2%–6.4%.
-
Depreciation of the Kenya Shilling against the US Dollar- The Kenya Shilling recorded a 3.1 bps month-to-date depreciation as of 25th July to Kshs 129.53 from Kshs 129.49 recorded at the beginning of the month. This depreciation in the exchange rate could tighten inflationary pressures, making imported goods more expensive
Going forward, we expect inflationary pressures to remain within the CBK's target range of 2.5%–7.5%, with headline inflation projected to come in at the 6.2%-6.6% range in July 2026. This is supported by the CBR holding at 8.75% since February 2026 through the April and June 2026 meetings, which has kept borrowing costs, and the demand pressure that comes with them, in check. Fuel prices have also been on a downward trend, with landing costs for Diesel, Kerosene and Super Petrol declining in both May and June 2026, keeping pump prices unchanged in July and limiting the pass-through into transport and production costs. This is offset somewhat by the recent rise in electricity tariffs, where higher fuel and forex adjustment charges have pushed up production and distribution costs. On balance, the combination of a stable rate environment, declining fuel costs, and rising electricity charges supports our July inflation projection of 6.2%-6.6%.
Rates in the fixed income market have been on an upward trend, reversing the sharp declines seen through the CBK's easing cycle. The shift has been driven by the CBK's decision to pause its rate-cutting cycle, alongside a resurgence in inflation. The government is 110.5% ahead of its prorated net domestic borrowing target of Kshs 73.6 bn, having a net borrowing position of Kshs 154.9 bn (inclusive of T-bills). We expect investors to maintain a preference for short to medium-term papers as they monitor the pace of government issuance and the path of inflation before committing further out on the curve, with the yield curve likely to remain under upward pressure rather than stabilize, at least until the inflation trajectory becomes clearer.
Market Performance:
During the week, the equities market was on an upward trajectory, with NSE 10, NSE 20, NSE 25 and NASI gaining by 1.2%, 1.0%,0.9% and 0.8% respectively, taking the YTD performance to gains of 27.3%, 26.9%, 26.5% and 24.6% respectively for NSE 20, NSE 10, NSE 25 and NASI respectively. The week-on-week equities market performance was mainly driven by gains recorded by large cap stocks such as EABL, Diamond Trust Bank and KCB of 7.3%, 3.1% and 2.2% respectively. However, the performance was weighed down by losses recorded by large cap stocks such as Stanbic, Absa Bank and Standard Chartered Bank of 1.2%,1.0% and 0.8% respectively;
During the week, the banking sector index increased marginally by 0.6% to 265.9 from the 264.2 recorded the previous week. This is attributable to gains recorded by large cap stocks such as Diamond Trust Bank, KCB and NCBA of 3.1%, 2.2% and 1.1% respectively. However, the performance was weighed down by losses recorded by large cap stocks such as Stanbic, Absa Bank and Standard Chartered Bank of 1.2%, 1.0% and 0.8% respectively.
During the week, equities turnover increased by 65.1% to USD 30.7 mn from USD 18.6 mn recorded the previous week, taking the YTD total turnover to USD 2,581.1 mn. Foreign investors remained net sellers for the second consecutive week with a net selling position of USD 7.5 mn, from a net selling position of USD 2.3 mn recorded the previous week, taking the YTD foreign net selling position to USD 85.7 mn, compared to a net selling position of USD 92.9 mn recorded in 2025.
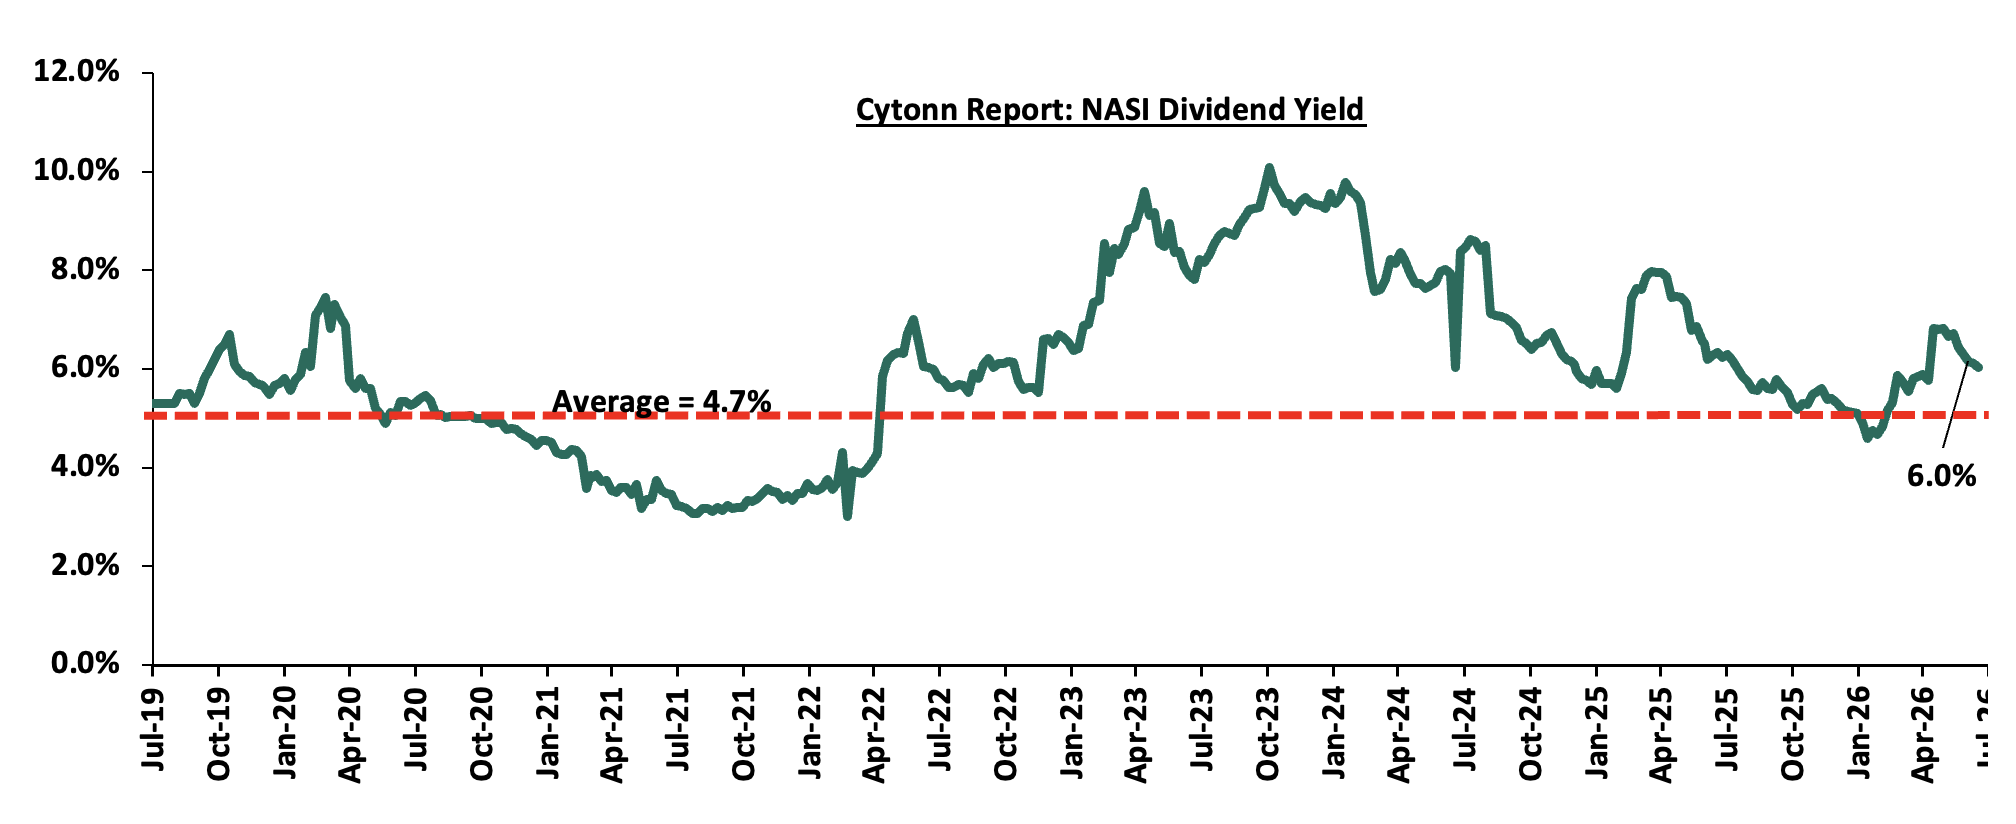
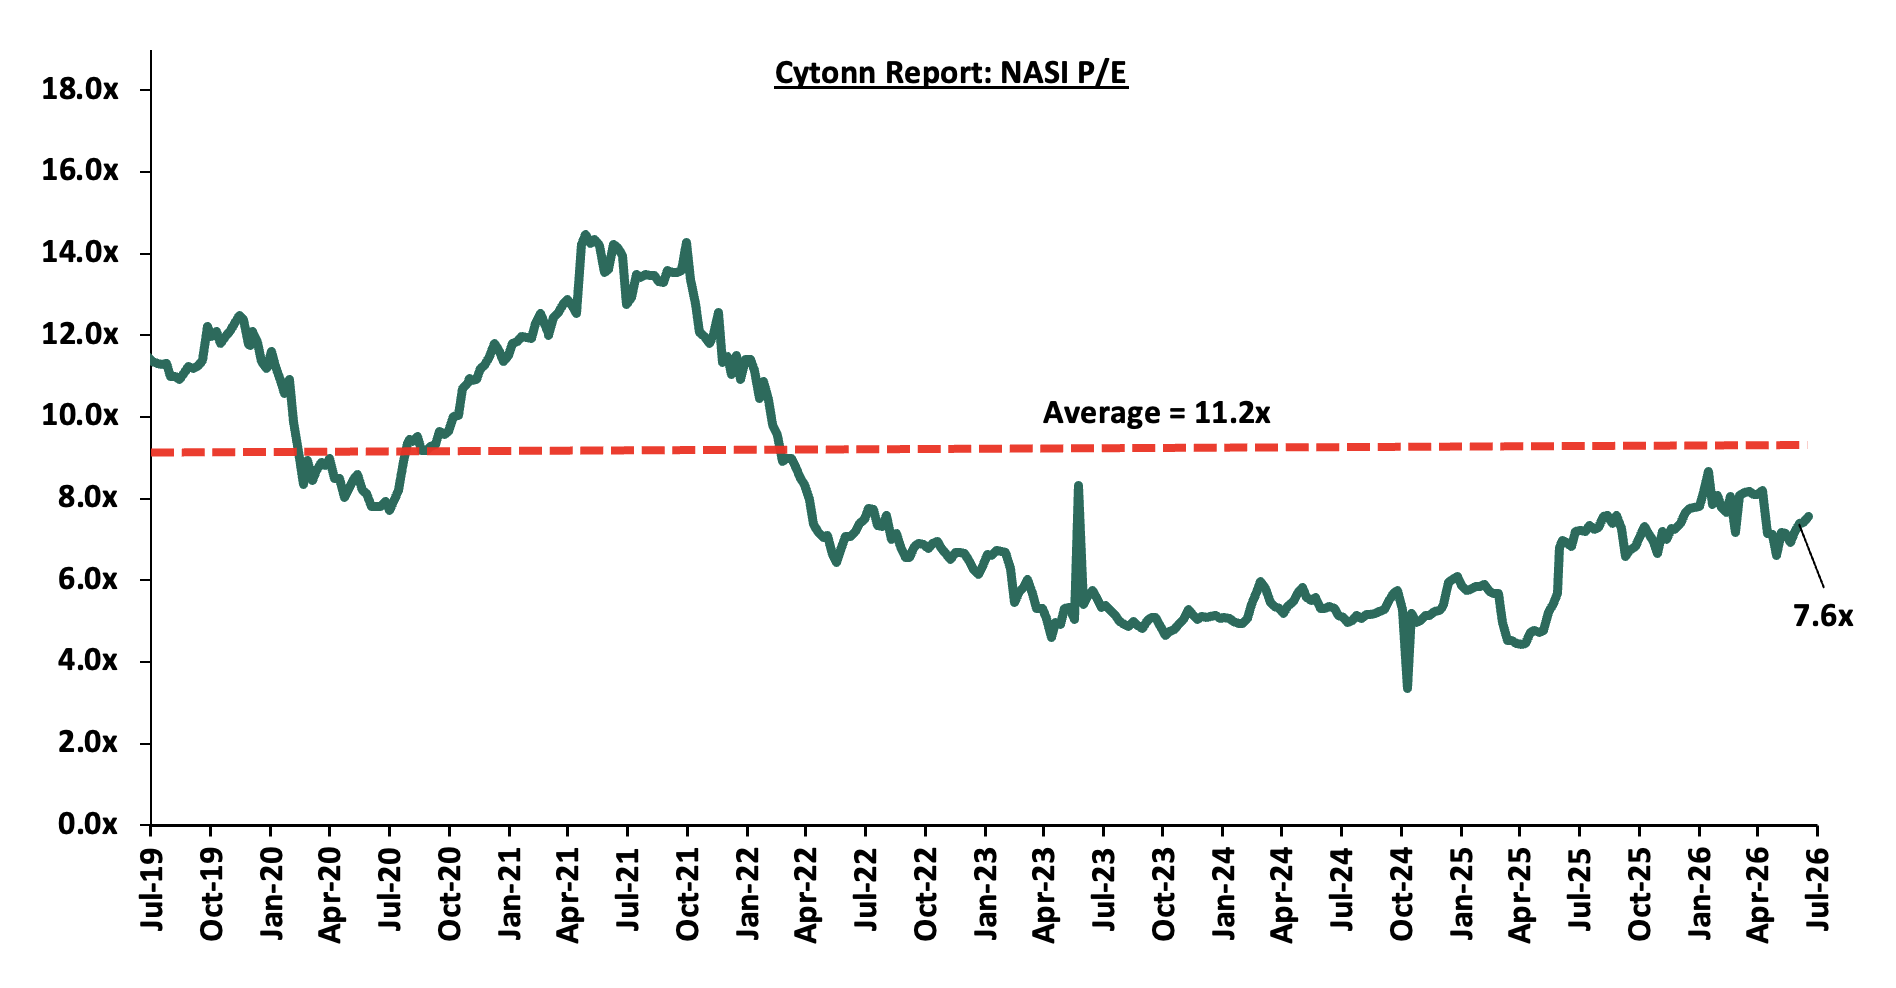
The market is currently trading at a price to earnings ratio (P/E) of 7.6x, 32.5% below the historical average of 11.2x, and a dividend yield of 6.0%, 1.3% points above the historical average of 4.7%. Key to note, NASI’s PEG ratio currently stands at 0.9x, an indication that the market is slightly undervalued relative to its future growth. A PEG ratio greater than 1.0x indicates the market may be overvalued while a PEG ratio less than 1.0x indicates that the market is undervalued.
The charts below indicate the historical P/E and dividend yields of the market:
Universe of Coverage:
|
Cytonn Report: Equities Universe of Coverage |
|||||||||||
|
Company |
Price as at 17/07/2027 |
Price as at 24/07/2026 |
w/w change |
m/m change |
YTD Change |
Year Open 2026 |
Target Price* |
Dividend Yield |
Upside/ Downside** |
P/TBv Multiple |
Recommendation |
|
NCBA |
88.8 |
89.8 |
1.1% |
0.3% |
5.6% |
85.0 |
108.9 |
7.9% |
29.3% |
1.2x |
Buy |
|
ABSA Bank |
33.4 |
33.0 |
(1.0%) |
3.0% |
32.8% |
24.9 |
36.8 |
6.2% |
17.9% |
1.8x |
Accumulate |
|
Diamond Trust Bank |
146.3 |
150.8 |
3.1% |
4.0% |
31.4% |
114.8 |
161.4 |
6.0% |
13.1% |
0.4x |
Accumulate |
|
Standard Chartered Bank |
337.0 |
334.3 |
(0.8%) |
2.0% |
11.5% |
299.8 |
345.8 |
9.3% |
12.7% |
2.1x |
Accumulate |
|
Co-op Bank |
35.3 |
35.0 |
(0.7%) |
2.0% |
46.4% |
23.9 |
36.9 |
7.1% |
12.6% |
1.3x |
Accumulate |
|
Jubilee Holdings |
380.5 |
375.5 |
(1.3%) |
4.1% |
16.4% |
322.5 |
407.5 |
4.0% |
12.5% |
0.5x |
Accumulate |
|
Britam |
18.4 |
16.5 |
(10.1%) |
31.5% |
82.1% |
9.1 |
18.5 |
0.0% |
11.8% |
1.2x |
Accumulate |
|
Stanbic Holdings |
295.5 |
292.0 |
(1.2%) |
4.2% |
47.7% |
197.8 |
300.3 |
7.7% |
10.5% |
1.7x |
Accumulate |
|
KCB Group |
80.8 |
82.5 |
2.2% |
4.8% |
25.5% |
65.8 |
83.9 |
8.5% |
10.2% |
0.8x |
Accumulate |
|
CIC Group |
4.6 |
4.7 |
2.4% |
3.1% |
3.1% |
4.5 |
5.0 |
2.8% |
8.8% |
1.2x |
Hold |
|
Equity Group |
86.5 |
87.0 |
0.6% |
8.7% |
29.9% |
67.0 |
87.5 |
6.6% |
7.2% |
1.1x |
Hold |
|
I&M Group |
68.0 |
67.8 |
(0.4%) |
(2.5%) |
58.3% |
42.8 |
67.9 |
5.5% |
5.8% |
1.1x |
Hold |
|
Family Bank |
25.0 |
27.7 |
10.6% |
14.3% |
53.6% |
18.0 |
27.6 |
4.3% |
4.2% |
1.4x |
Lighten |
|
*Target Price as per Cytonn Analyst estimates **Upside/ (Downside) is adjusted for Dividend Yield ***Dividend Yield is calculated using FY’2025 Dividends |
|||||||||||
Weekly Highlights
-
BAT H1’2026 Financial Results
During the week, British American Tobacco Kenya Plc released their H1’2026 financial results, recording a 3.1% increase in Profits after Tax (PAT) to Kshs 3.1 bn, from Kshs 3.0 bn recorded in H1’2025. The increase in PAT was mainly attributed to the 4.6% increase in net revenue to Kshs 12.3 bn in H1’2026 from Kshs 11.7 bn in H1’2025, coupled with a 40.2% increase in Finance income to 0.14 bn in H1’2026 from Kshs 0.10 bn in H1’2025. The performance was, however, weighed down by a 6.8% increase in cost of operations to Kshs 8.0 bn from Kshs 7.5 bn in H1’2025. The tables below show the breakdown of BAT’s H1’2026 financial performance:
|
Cytonn Report: British American Tobacco (BAT) Summarized Income Statement |
|||
|
Income Statement |
H1'2025 |
H1'2026 |
Y/Y Change |
|
Kshs (bn) |
Kshs (bn) |
||
|
Gross Sales including Indirect Taxes |
18.5 |
19.0 |
2.6% |
|
Excise Duty and Value-Added Taxes |
(6.8) |
(6.7) |
(1.0%) |
|
Net Revenue |
11.7 |
12.3 |
4.6% |
|
Cost of operations |
(7.5) |
(8.0) |
6.8% |
|
Profit from operations |
4.2 |
4.3 |
0.8% |
|
Net Finance Costs/Income |
0.10 |
0.14 |
40.2% |
|
Profit Before Income Tax |
4.3 |
4.4 |
1.7% |
|
Income Tax Expenses |
(1.3) |
(1.3) |
(1.5%) |
|
Profit After Tax |
3.0 |
3.1 |
3.1% |
|
Dividend Per Share (Kshs) |
10.0 |
10.0 |
0.0% |
|
Annualized Dividend Yield |
5.3% |
3.5% |
(1.8%) |
|
Dividend Payout |
33.5% |
32.5% |
(1.0%) |
|
Earnings Per Share (Kshs) |
29.8 |
30.8 |
3.1% |
Source: British American Tobacco (BAT) Kenya Plc HY’2026 Financial Report
|
Cytonn Report: British American Tobacco Plc (BAT) Summarized Balance Sheet |
|||
|
Balance Sheet |
H1'2025 |
H1'2026 |
Y/Y Change |
|
Kshs (bn) |
Kshs (bn) |
||
|
Current Assets |
13.3 |
10.9 |
(18.1%) |
|
Non-Current Assets |
9.7 |
9.4 |
(3.2%) |
|
Total Assets |
23.1 |
20.3 |
(11.8%) |
|
Current Liabilities |
6.3 |
5.9 |
(7.8%) |
|
Non-Current Liabilities |
1.94 |
1.92 |
(1.2%) |
|
Total Liabilities |
8.3 |
7.8 |
(6.2%) |
|
Total Equity |
14.8 |
12.6 |
(14.9%) |
Source: British American Tobacco (BAT) Kenya Plc HY’2026 Financial Report
Key take outs from the financial performance include;
-
Net Revenue increased by 4.6% to Kshs 12.3 bn in H1’2026 from Kshs 11.7 bn in H1’2025, mainly attributed to a 2.6% increase in gross sales to Kshs 19.0 bn from Kshs 18.5 bn recorded in H1’2026.
-
Net finance income increased significantly by 40.2% to a net finance income of Kshs 0.14 bn in H1’2026, from a net finance income of Kshs 0.10 bn in H1’2025. This was largely attributable to Kenyan Shilling stability against the US Dollar and prudent cash management.
-
Cost of operations increased by 6.8% to Kshs 8.0 bn in H1’2026, from Kshs 7.5 bn in H1’2025, mainly attributed to higher sales volumes, effective cost management and productivity initiatives implemented during the period.
-
The Group’s balance sheet position deteriorated, with total assets decreasing by 11.8% to Kshs 20.3 bn in H1’2026, from Kshs 23.1 bn in H1’2025. This can be attributed to a 18.1% decrease in current assets to Kshs 10.9 bn from Kshs 13.3 bn in H1’2025, coupled with a 3.2% decrease in Non-current assets to Kshs 9.4 bn from Kshs 9.7 bn in H1’2025.
-
The Group’s Total liabilities also decreased by 6.2% to Kshs 7.8 bn from Kshs 8.3 bn in H1’2025. This can be attributed to a 7.8% decrease in current liabilities to Kshs 5.9 bn from Kshs 6.3 bn in H1’2025, coupled with a 1.2% marginal decrease in non-current liabilities to Kshs 1.92 bn from Kshs 1.94 bn in H1’2025.
-
Earnings per share increased by 3.1% to Kshs 30.8 in H1’2026, from Kshs 29.8 in H1’2025, reflecting enhanced profitability per unit of shareholding. The strong improvement in EPS was largely driven by the significant increase in net earnings during the period, supported by reduced finance cost and effective cost management. The rise in EPS signals improved shareholder value generation and reinforces the Group’s underlying financial strength in the face of a complex operating environment.
-
The Board of Directors declared an interim dividend of Kshs 10.0 translating to a 1.8% decrease in annualized dividend yield to 3.5% in H1’2026 from 5.3% in H1’2025, and a 1.0% decrease in dividend payout ratio to 32.5% in H1’2026 from 33.5% in H1’2025.
BAT recorded a 3.1% increase in Profits after Tax (PAT) to Kshs 3.1 bn, from Kshs 3.0 bn recorded in H1’2025. The increase in PAT was mainly attributed to the 4.6% increase in net revenue to Kshs 12.3 bn in H1’2026 from Kshs 11.7 bn in H1’2025, coupled with a 40.2% increase in Finance income to 0.14 bn in H1’2026 from Kshs 0.10 bn in H1’2025. The performance was, however, weighed down by a 6.8% increase in cost of operations to Kshs 8.0 bn from Kshs 7.5 bn in H1’2025. Despite the improved earnings, BAT continues to operate in a challenging environment marked by regulatory uncertainty and escalating tax pressures. Notably, the continued ban on modern oral nicotine pouches in the local market has prevented the Group from fully utilizing its Nairobi-based manufacturing facility. As a result, the company is considering offers for the disposal of related machinery to safeguard shareholder value and optimize asset use. In line with its strong liquidity position, the Board of Directors declared an interim dividend of Kshs 10.0 translating to a 1.8% decrease in annualized dividend yield to 3.5% in H1’2026 from 5.3% in H1’2025, and a 1.0% decrease in dividend payout ratio to 32.5% in H1’2026 from 33.5% in H1’2025, reflecting enhanced value delivered to shareholders during the period.
Looking ahead, profit margins remain under pressure due to persistent regulatory hurdles and rising operational costs. Nevertheless, the Group’s disciplined cost management, prudent financial strategy, and active regulatory engagement, especially in the modern oral nicotine segment, are expected to cushion the impact of these challenges. Furthermore, the Group’s consistent dividend policy is likely to bolster investor confidence in the stock despite prevailing macroeconomic headwinds
-
NCBA Group Plc – Nedbank Group Offer Results
During the week, Nedbank Group announced the results of its offer to acquire a 66.0% stake in NCBA Group, with total acceptances reaching 1.3 bn shares, equivalent to an acceptance rate of 79.9% of NCBA's issued ordinary shares, well above the targeted acquisition. The acceptances comprised 920.7 mn shares tendered under shareholders' pro rata entitlement, representing 55.9% of NCBA's issued shares, and a further 395.7 mn shares submitted as excess applications, equivalent to 24.0% of the issued shares. The strong uptake marks a key milestone in the transaction, reflecting broad shareholder willingness to participate in the offer. Launched in April 2026, the offer allowed shareholders to tender 66.0% of their holdings while submitting excess applications for additional shares, subject to allocation. The offer received total acceptances equivalent to 79.9% of NCBA's issued ordinary shares, exceeding the targeted 66.0% acquisition and resulting in an effective subscription rate of 121.1% relative to the shares sought by Nedbank. Following the scaling and allocation process, Nedbank is expected to acquire approximately 1.1 bn shares, representing the intended 66.0% stake, while the remaining 34.0% will continue to be held by other shareholders.
|
NCBA shareholding |
|||||
|
Before |
After |
||||
|
Name of Shareholder |
Number of shares |
% Shareholding |
Name of Shareholder |
Number of shares |
% Shareholding |
|
First Chartered Securities Limited |
246,149,354 |
14.90% |
Nedbank Group Limited |
1,087,362,891 |
66.0% |
|
Enke Investments Limited |
217,497,023 |
13.20% |
First Chartered Securities Limited |
83,690,780 |
5.08% |
|
D&M Management Services LLP |
190,707470 |
11.58% |
Enke Investments Limited |
73,948,988 |
4.49% |
|
Brookshire Limited |
142,142,031 |
8.63% |
D&M Management Services LLP |
64,644,224 |
3.92% |
|
Westpoint Nominees Limited |
126,661,231 |
7.69% |
Brookshire Limited |
48,328,291 |
2.93% |
|
Yana Investments Limited |
89,069,204 |
5.41% |
Westpoint Nominees Limited |
43,064,819 |
2.61% |
|
Kahuho Holdings Limited |
67,602,884 |
4.10% |
Yana Investments Limited |
30,283,529 |
1.84% |
|
Rivel Kenya Limited |
64,206,673 |
3.90% |
Kahuho Holdings Limited |
22,984,981 |
1.40% |
|
Makimwa Consultants Limited |
48,587,307 |
2.95% |
Rivel Kenya Limited |
21,830,269 |
1.33% |
|
Kestrel Capital Nominee Services Limited |
26,000,000 |
1.58% |
Makimwa Consultants Limited |
16,519,684 |
1.00% |
|
Others |
428,896,355 |
26.02% |
Others |
154,861,077 |
9.40% |
|
Total |
1,647,519,532 |
100.00% |
Total |
1,647,519,532 |
100.00% |
Key highlights include:
-
The total acceptances reached 1.3 bn shares, equivalent to 79.9% of NCBA's issued ordinary shares. This comprised 920.7 mn shares tendered under shareholders' pro rata entitlement, representing 55.9% of the issued shares, and a further 395.7 mn shares, equivalent to 24.0%, submitted through excess applications.
-
The offer was oversubscribed, with an effective subscription rate of 121.1% following shareholder acceptances above the targeted acquisition of 66.0% of NCBA's issued ordinary shares.
-
Nedbank is expected to acquire approximately 1.1 bn shares, representing the intended 66.0% controlling stake in NCBA, while the remaining 34.0% would continue to be held by other shareholders.
-
The transaction obtained most of the required regulatory approvals, with the remaining approvals expected by the end of the third quarter of 2026. Settlement would take place once all outstanding conditions have been fulfilled or waived.
-
NCBA would remain listed on the Nairobi Securities Exchange upon completion of the transaction, as the bank would continue to satisfy the minimum public shareholding requirements for listing.
We expect the successful close of the offer period to pave the way for the transaction's completion once the remaining regulatory approvals are obtained, with implementation likely by the end of the third quarter of 2026. We also expect the transaction to reinforce the growing momentum in merger and acquisition activity within Kenya's banking sector, as strategic investors increasingly pursue acquisitions of established financial institutions to accelerate regional expansion. The transaction also comes at a time when Absa Group is pursuing an offer to increase its shareholding in Absa Bank Kenya, signaling renewed confidence by regional banking groups in Kenya's banking industry. We expect this trend to support further consolidation within the sector, strengthen competition through enhanced capitalization and operational efficiencies, and increase foreign strategic investment as institutions seek scale, broader regional footprints and improved shareholder value.
We maintain a “cautiously optimistic” short-term outlook supported primarily earnings-led attractive valuations, despite rising yields on short-term government papers, which increase competition for capital by drawing investors towards risk-free government securities, as well as heightened geopolitical risks such as Iran war that may weigh on investor sentiment, and, “neutral” in the long term as persistent foreign investor outflows continue to constrain market liquidity and limit broad-based market re-rating. With the market currently trading at a discount to its future growth (PEG Ratio at 0.9x), where performance will be driven by company-specific fundamentals rather than general market direction, we believe that investors should reposition towards value stocks exhibiting strong earnings growth, attractive dividend yields, solid balance sheets, sustainable competitive advantages and trading at compelling discounts to their intrinsic value. While foreign investor sell-offs are expected to continue exerting pressure in the near term, we believe this will create selective entry opportunities for long-term investors.
-
Industry Report
-
KNBS Q2’2026 Construction Input Price Indices
During the week, the Kenya National Bureau of Statistics released their Q2’2026 construction input price indices report that showed the cost of construction in Kenya increased significantly with a 5.7% rise in the Construction Input Price Index (CIPI) to 126.4 from 119.5 in Q1’2026, the highest quarterly increase since late 2022. The increase was largely driven by higher fuel, transport and construction material costs, alongside rising labour expenses. Prices of key inputs such as cement, concrete, asphalt, paints and electrical fittings all increased, while cement consumption also grew, indicating that developers continued with ongoing projects despite the higher construction costs. The chart below shows the Construction Input Price Indices from Q2’ 2022 to Q2’2026
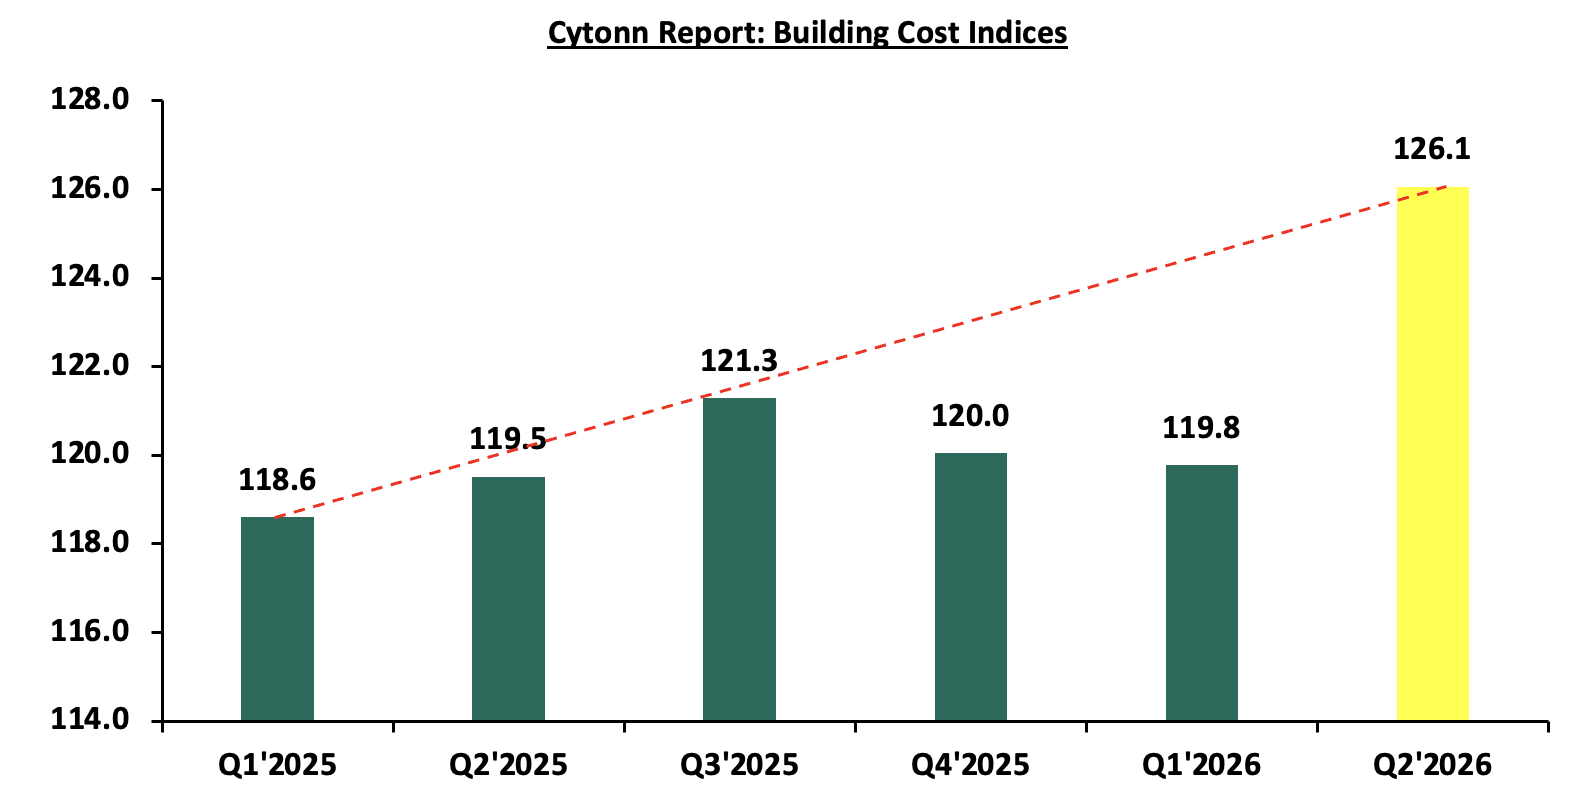
Meanwhile, the building cost indices increased by 5.3% to 126.1 in Q2’2026 from 119.8 in Q1’2026. The increase was driven by higher prices across major inputs such as fuel, construction materials and labour. The chart below shows the Building Cost Indices from Q1’ 2025 to Q2’2026.
The increase in construction input costs is likely to place upward pressure on property development costs, potentially leading to higher prices for residential and commercial developments as developers seek to protect their margins. Rising building costs may also delay the launch of new projects or slow construction activity, particularly for cost-sensitive developments. However, the continued growth in cement consumption and building approvals suggests that demand for Real Estate remains resilient, supporting ongoing investment despite the challenging cost environment.
-
Infrastructure Sector
-
Upgrade of Nairobi-Western Bypass Road
During the week, the Kenya National Highways Authority (KeNHA) announced plans to upgrade 25 new feeder roads connected to the 16.5 km Nairobi-Western Bypass in Kiambu County to bitumen standards, with the aim of improving accessibility and easing movement within the surrounding areas. The roads, which link key residential and commercial centres along the bypass, will enhance connectivity between the Western Bypass and local communities. The four-lane dual carriageway forms part of Nairobi's ring road network, connecting the Southern Bypass at Gitaru to the Northern Bypass in Ruaka through Wangige, Kihara and Ndenderu. It complements other major transport corridors, including the Southern, Northern and Eastern bypasses, as well as the Nairobi Expressway, all of which are intended to ease congestion and improve transport efficiency across the Nairobi Metropolitan Area.
The continued expansion of road infrastructure is expected to have a positive impact on Kenya's Real Estate sector, particularly in Kiambu County and the wider Nairobi Metropolitan Area. Improved accessibility typically enhances the attractiveness of previously underserved locations, supporting higher demand for residential, commercial and mixed-use developments while increasing land values over time. Better transport links also reduce commuting times, making satellite towns more appealing to homebuyers, businesses and investors. As connectivity improves, developers are likely to accelerate projects along these transport corridors, reinforcing infrastructure development as a key driver of property market growth and long-term investment potential.
-
Government Unveils New Plan to Upgrade Nairobi–Mombasa Highway to Four Lanes
During the week, the government revised its plans for the Nairobi–Mombasa highway by opting to expand the existing 461.0 km A8 road into a minimum four-lane, access-controlled toll highway under a Public-Private Partnership (PPP), replacing the earlier proposal to construct a new expressway. The government has already received bids for a transaction advisor who will review the project's technical and financial feasibility and guide the procurement of a private investor.
The change follows the rejection of the proposal by US-based Everstrong Capital after the government identified weaknesses in its financial structure, technical capacity and overall viability. Authorities also cited the high cost of acquiring land for a new corridor, which could have increased toll charges, while the withdrawal of a key consortium partner further weakened the project's financial and technical standing. The government will instead upgrade the existing highway, reducing land acquisition costs, shortening implementation timelines and preserving local connectivity through service roads and interchanges.
The expansion of the Nairobi–Mombasa highway is expected to positively impact the Real Estate sector by improving connectivity between key towns and economic hubs along the corridor. Better transport infrastructure is likely to increase demand for residential, commercial, industrial and logistics developments, while supporting higher land values and attracting private investment. Additionally, the use of the existing corridor reduces speculative land buying and displacement risks, promoting more sustainable property market growth in the long term.
-
First Underground Railway line approval by Nairobi County connecting CBD to Eastlands
During the week, Nairobi County approved the implementation framework for Phase I of the Nairobi Metropolitan Mass Rapid Transit System (NMRTS), paving the way for the city's first underground railway. The initial phase will run beneath the Central Business District (CBD) before extending to Eastlands, with the aim of easing traffic congestion, reducing travel times and improving connectivity through integrated transit terminals that link rail services, pedestrians and other modes of transport. Future phases are expected to extend the network to Westlands, Ngong Road and Lang'ata, creating a more comprehensive public transport system integrated with the Bus Rapid Transit (BRT) network. While the project has received county approval, details on its financing, implementation timeline and construction costs are yet to be disclosed, with public participation and stakeholder consultations expected before construction begins.
The planned underground railway is expected to positively impact Nairobi's Real Estate sector by enhancing accessibility and connectivity across key residential and commercial locations. Improved transport infrastructure typically increases demand for developments located near transit stations, supporting higher property values and encouraging transit-oriented mixed-use projects. In addition, improved mobility is likely to attract more private investment, stimulate commercial activity and unlock development opportunities in areas that will benefit from the expanded transport network.
-
Real Estate Investments Trusts
-
REITs Weekly Performance
On the Unquoted Securities Platform Acorn D-REIT and I-REIT traded at Kshs 29.6 and Kshs 23.8 per unit, respectively, as per the last updated data on 17th July 2026. The performance represented a 48.0% and 18.8% gain for the D-REIT and I-REIT, respectively, from the Kshs 20.0 inception price. The volumes traded for the D-REIT and I-REIT came in at 13.5 mn and 43.3 mn shares, respectively. Additionally, ILAM Fahari I-REIT traded at Kshs 13.8 per share as of 17th July 2026, representing a 31.0% loss from the Kshs 20.0 inception price. The volume traded to date came in at 1.2 mn shares for the I-REIT, REITs offer various benefits, such as tax exemptions, diversified portfolios, and stable long-term profits. However, the ongoing decline in the performance of Kenyan REITs and the restructuring of their business portfolios are hindering significant previous investments. Additional general challenges include:
-
Insufficient understanding of the investment instrument among investors leading to a slower uptake of REIT products,
-
Lengthy approval processes for REIT creation,
-
High minimum capital requirements of Kshs 100.0 mn for REIT trustees compared to Kshs 10.0 mn for pension funds Trustees, essentially limiting the licensed REIT Trustee to banks only
-
The rigidity of choice between either a D-REIT or and I-REIT forces managers to form two REITs, rather than having one Hybrid REIT that can allocate between development and income earning properties
-
Limiting the type of legal entity that can form a REIT to only a trust company, as opposed to allowing other entities such as partnerships, and companies,
-
We need to give time before REITS are required to list – they would be allowed to stay private for a few years before the requirement to list given that not all companies maybe comfortable with listing on day one, and,
-
Minimum subscription amounts or offer parcels set at Kshs 0.1 mn for D-REITs and Kshs 5.0 mn for restricted I-REITs. The significant capital requirements still make REITs relatively inaccessible to smaller retail investors compared to other investment vehicles like unit trusts or government bonds, all of which continue to limit the performance of Kenyan REITs.
We expect the performance of Kenya's Real Estate sector to remain resilient, supported by several factors including: i) Upgrading of Nairobi-Western Bypass by setting 25 new feeder roads, ii) Upgrading Nairobi–Mombasa Highway to Four Lanes, iii) Construction of Underground Railway line connecting CBD to Eastlands. However, challenges such the weak investor appetite in listed REITs like ILAM Fahari I-REIT and high capital requirements will continue to constrain the sector's optimal performance.
Digital Payments Weekly Highlights
-
American Express Reports Strong Q2’2026 Earnings
During the week, American Express reported its second-quarter 2026 financial results on July 24, beating Wall Street earnings expectations driven by resilient premium cardholder spending and growing card fee revenues. The card issuer posted diluted earnings per share (EPS) of USD 4.5 beating consensus estimates of USD 4.4 per share and posting a 11.0% increase from USD 4.1 per share in the same period last year, alongside total revenue of USD 19.6 bn. Management highlighted four consecutive quarters of double-digit revenue growth and maintained its full-year profit outlook while choosing to reinvest top-line outperformance back into long-term growth initiatives and customer acquisition. This report reinforces American Express's competitive positioning, demonstrating how a premium-focused, closed-loop network model allows the firm to sustain steady top-line momentum and manage credit risk efficiently in a shifting macroeconomic environment.
-
Mastercard Enhances Virtual Card Platform & Unveils QuickBooks SME Card
During the week, Mastercard Incorporated announced major enhancements to its enterprise payment ecosystem, upgrading its Mastercard In Control Virtual Card Number (VCN) platform while launching a new co-branded business credit card in partnership with Intuit QuickBooks. The upgraded VCN platform introduces issuer-enforced security guardrails, embedded payments connectivity, and single-API access designed to automate commercial B2B procurement and eliminate manual expense reconciliation. Simultaneously, the new QuickBooks credit card embeds spend management tools directly into Intuit's accounting software, enabling real-time bookkeeping, working capital visibility, and tailored cash-back rewards for small business owners. By standardizing commercial payment workflows and embedding financial tools directly into software platforms, Mastercard strengthens its B2B payment rails, driving higher corporate spending volumes while locking in commercial relationships across both mid-market enterprises and small business networks.
-
Circle Partners with Kakao Group and Toss Bank to Expand Asian Infrastructure
During the week, stablecoin issuer Circle executed strategic partnerships with major South Korean technology platform Kakao Group and digital banking provider Toss Bank to advance blockchain payment systems across Asia. Under the Memorandums of Understanding (MOUs), Circle will collaborate with Kakao and Toss to integrate USD Coin (USDC) and Circle’s global payment networks into localized digital finance applications, evaluating onchain settlement efficiency, instant cross-border remittances, and mobile merchant acceptance. Circle explicitly noted that while it will support domestic bank-led won stablecoin initiatives through technology sharing, its primary focus remains expanding the global distribution and utility of USDC within compliant, high-volume Asian financial corridors. This expansion strategy allows Circle to deepen its international footprint, positioning USDC as core settlement infrastructure for Asia-Pacific cross-border commerce.
-
Block’s Square Ecosystem Secures Enterprise Multi-Location Restaurant Expansion
During the week, Block, Inc. announced a commercial expansion for its Square ecosystem, partnering with multi-unit restaurant operator Dimassi’s Mediterranean Buffet to deploy Square software and hardware across its 24-location footprint. The implementation leverages Square’s full-stack enterprise suite including point-of-sale hardware, kitchen display systems, automated inventory tracking, and centralized team management software to streamline operations and reduce guest checkout latency. This roll-out highlights Block’s success in moving upmarket from micro-merchants into multi-location food and beverage chains, driving higher Gross Payment Volume (GPV) and expanding recurring software subscription revenues for its square merchant division.
-
Digital Payments Stock Performance
The table below presents a snapshot of NYSE-listed digital payments stocks, covering Visa, Mastercard, American Express (AXP), Circle, Block and PayPal.X
| Cytonn Report: Digital Payments NYSE stock perfomance | ||||||
| Company | Year Open 2026 | Price 7/17/2026 | Price 7/24/2027 | w/w change | YTD change | P/E |
| American Express | 372.7 | 355.4 | 326.2 | (8.2%) | (12.5%) | 25.4X |
| Visa | 346.5 | 358.6 | 355.7 | (0.8%) | 2.7% | 17.9X |
| Mastercard | 563.1 | 543.6 | 539.7 | (0.7%) | (4.2%) | 33.6X |
| Circle | 83.5 | 60.5 | 62.4 | 3.1% | (25.3%) | 34.3X |
| Block | 65.2 | 79.9 | 77.2 | (3.5%) | 18.4% | 32.0X |
| Paypal Holdings | 58.1 | 56.6 | 56.2 | (0.7%) | (3.4%) | 10.1X |
| Average |
|
|
|
|
| 25.5X |
Source: Visa, AXP, Circle, Mastercard, Block and Paypal financials. NYSE
The stocks are currently trading at an average P/E multiple of 25.5x, indicating that investors are pricing in strong future earnings growth and are prepared to pay a substantial premium for current earnings. This also suggests that valuations may be stretched relative to near-term fundamentals.
We expect the global digital payments sector to continue evolving toward greater payment sovereignty, digital infrastructure modernization, and reduced reliance on traditional card-based payment networks as governments and financial institutions increasingly prioritize control over domestic payment ecosystems. Recent developments, particularly the European Central Bank’s progress toward launching the Digital Euro, signal a growing global shift toward central bank-backed digital payment infrastructure aimed at enhancing financial resilience, improving transaction efficiency, and strengthening monetary independence in an increasingly digital economy. This trend is likely to accelerate competition between public-sector digital currencies and established private payment networks such as Visa Inc. and Mastercard Incorporated, while driving broader innovation across digital finance infrastructure. However, despite these favorable long-term structural tailwinds, valuations within the sector remain relatively elevated, with the companies under coverage currently trading at an average P/E of 25.5x, suggesting that a significant portion of future growth expectations may already be priced in. As such, we expect near-term performance to remain sensitive to regulatory developments, execution risk, and the pace at which both incumbents and emerging digital payment infrastructure providers adapt to the rapidly changing payments landscape.

- Talk to us
- Kenya
- P.O Box 20695 - 00200, Nairobi, Kenya
- Cell +254709101200
- Tel +254709101200
- WhatsApp +254741676635
- United States
- +254709101200
- DOWNLOAD OUR APP
-


- Kenya
- 8th Floor, Pinetree Plaza, Kaburu Drive, Ngong Road, Nairobi, Kenya
- USA
- Suite 1150, 1775 Eye Street NW, USA, Washington DC 20006, USA
- Investments
- High Yield
- Private Equity
- Real Estate
- Real Estate
- RiverRun Estates
- Cytonn Towers
- The Ridge
- Taraji Heights
- The Alma