
Q2’2026 Unit Trust Funds Performance Review, & Cytonn Weekly #36.2026
By Research Team, Sep 13, 2026
Executive Summary
Fixed Income
During the week, T-bills were oversubscribed for the sixth consecutive week, with the overall subscription rate coming in at 198.2% lower than the subscription rate of 200.9%, recorded the previous week. Investors’ preference for the shorter 91-day paper persisted, with the paper receiving bids worth Kshs 29.6 bn against the offered Kshs 8.0 bn, translating to a subscription rate of 369.8%, albeit lower than the subscription rate of 428.1%, recorded the previous week. The subscription rate for the 182-day paper decreased to 129.7% from 197.7% recorded the previous week, while that of the 364-day paper increased significantly to 129.6% from 22.4% recorded the previous week. The government accepted a total of Kshs 53.3 bn worth of bids out of Kshs 55.5 bn bids received, translating to an acceptance rate of 96.0%. The yields on government papers remained broadly stable during the week, with the yields on the 91-day, 182-day, and 364-day papers all remaining relatively unchanged at 8.8%, 8.9% and 9.1%, respectively, recorded the previous week;
During the week, the Central Bank of Kenya released the auction results for the switch treasury bonds from FXD1/2013/015, with a tenor to maturity of 1.4 years and a fixed coupon rate of 11.3% to FXD4/2019/010 with tenors to maturities of 3.2 years and a fixed coupon rate of 12.3%. This marks the first switch involving the bond, following the switch to FXD4/2019/010. The bond was oversubscribed, with the overall subscription rate coming in at 135.2%, receiving bids worth Kshs 13.5 bn against the offered Kshs 10.0 bn. The government accepted bids worth Kshs 11.0 bn, translating to an acceptance rate of 81.5%. The weighted average yield for the accepted bids for the FXD4/2019/010 came in at 11.1%. With the Inflation rate at 6.6% as of August 2026, the real returns of the FXD4/2019/010 is 4.5%. Given the 10.0% withholding tax on the bonds, the tax equivalent yields for shorter term bonds with 15.0% withholding tax is 11.8% for the FXD4/2019/010;
Also, the government announced a prospectus for the re-opened 20-year and 30-year fixed coupon Treasury bonds, FXD1/2019/020 and FXD1/2026/030, seeking to raise Kshs 60.0 bn for budgetary support. FXD1/2019/020 carries a fixed coupon rate of 12.9% and a remaining tenor of 12.6 years to maturity, while FXD1/2026/030 carries a fixed coupon rate of 12.5% and a remaining tenor of 29.6 years to maturity. The period of sale opened on 8th September 2026 and closes on 16th September 2026, with the auction and settlement dates set for 16th and 21st September 2026, respectively. Our recommended bidding range for FXD1/2019/020 is 12.8% - 13.3%, while that for FXD1/2026/030 is 13.3% - 13.8%, guided by prevailing yields on comparable tenors on the NSE yield curve as at 11th September 2026;
Equities
During the week, the equities market was on a downward trajectory, with NASI, NSE 10, NSE 20 and NSE 25 declining by 4.1%, 4.0%, 3.6% and 3.5% respectively taking the YTD performance to gains of 38.2%, 37.4%, 35.9% and 30.6% respectively for NSE 20, NSE 10, NSE 25 and NASI respectively. The week-on-week equities market performance was mainly driven by losses recorded by large cap stocks such as Safaricom, Absa Bank, and KCB of 6.5%, 4.1% and 4.1% respectively. However, the performance was supported by gains recorded by large cap stocks such as Stanbic Bank of 1.2%;
During the week, the banking sector index decreased by 3.3% to 289.7 from the 299.6 recorded the previous week. This is attributable to losses recorded by large cap stocks such as Absa Bank, KCB and DTB-K of 4,1%, 4.1% and 3.8% respectively. However, the performance was supported by gains recorded by large cap stocks such as Stanbic Bank of 1.2%;
During the week, Kenya Electricity Generating Company (KenGen), released its FY'2026 financial results for the period ended 30th June 2026, recording a profit after tax of Kshs 10.4 bn, a 1.2% decrease from the Kshs 10.5 bn recorded in FY’2025;
During the week, Britam Holdings Plc completed a Kshs 5.9 bn reduction of its share premium account, eliminating the accumulated losses that have barred the insurer from paying dividends for six years;
Real Estate
During the week, Artesano Investment Limited, Gulf Hotels Group, Silva Gigiri Limited and Season Global Limited announced plans to invest Kshs 5.5 bn in hospitality developments in Nairobi's Gigiri neighborhood, expected to add a combined 587 accommodation units to the area. The developments include a Kshs 593.4 mn, 11-storey hotel by Artesano Investment Limited, comprising 152 accommodation units, as well as the Silva Gigiri Hotel & Residence, a Kshs 3.9 bn joint development by Gulf Hotels Group and Silva Gigiri Limited that will comprise 250 units, including studios, one- and two-bedroom residences and upscale penthouses. In addition, Season Global Limited has lined up a Kshs 1.1 bn hotel development comprising 185 hotel suites;
During the week, the Kenya Tourism Board (KTB) signed a three-year partnership with international luxury lifestyle and culture brand Tatler Africa to promote Kenya as a leading luxury tourism destination and strengthen its position within the international luxury travel ecosystem. The partnership will see Kenya host the inaugural Tatler Best Africa awards on 8th October 2026, providing a platform to showcase the country’s premium tourism and hospitality offerings to an international audience;
On the Unquoted Securities Platform Acorn D-REIT and I-REIT traded at Kshs 29.7 and Kshs 24.4 per unit, respectively, as per the last updated data on 11th September 2026. The performance represented a 48.5% and 22.0% gain for the D-REIT and I-REIT, respectively, from the Kshs 20.0 inception price. Additionally, ILAM Fahari I-REIT traded at Kshs 20.5 per share as of 11th September 2026, representing a 2.5% gain from the Kshs 20.0 inception price;
Digital Payments
During the week, Visa Inc. announced a new approach to onchain credit that combines VisaNet settlement data with blockchain lending infrastructure to provide working capital for stablecoin-linked card programmes and fintechs, supporting the expansion of onchain lending beyond crypto markets into everyday payment activity;
During the week, Mastercard announced a USD 500.0 mn global settlement exposure facility in partnership with the International Finance Corporation (IFC), designed to enable financial institutions in emerging markets to participate more seamlessly in the Mastercard network and expand access to digital payments and financial services;
During the week, Circle Internet Group Inc. announced a definitive agreement to acquire Singapore-based cross-border payments infrastructure provider Tazapay, bringing more than USD 25.0 bn in annualized payment volume, over 60 banking and fintech partners and local payout rails across more than 100 markets into Circle’s payments ecosystem;
During the week, American Express Canada was ranked the number one credit card issuer for customer satisfaction in the JD Power 2026 Canada Credit Card Satisfaction Study, while its Cobalt Card retained the top position among annual-fee cards for the third consecutive year, reinforcing Amex’s premium customer proposition and differentiated membership model;
The digital payment stocks we track (AXP, Visa, Mastercard, Circle, Block, and PayPal) are currently trading at an average forward P/E of 24.1x, reflecting continued confidence in the networks' resilient earnings growth and payment-volume trends, tempered by rising client incentives and operating costs specifically at the card networks;
Focus of the Week
Following the release of the Capital Markets Authority (CMA) Quarterly CIS Report – Q2’2026, we examine the performance of Unit Trust Funds for the period ended 30th June 2026. These funds have seen consistent growth in total Assets Under Management (AUM) and are one of the preferred investment choices in Kenya. Additionally, we will delve into the performance of Money Market Funds, which are a sub-set of Unit Trust Funds.
Investment Updates:
-
Weekly Rates: Cytonn Money Market Fund closed the week at a yield of 11.1% p.a. To invest, dial *809# or download the Cytonn App from Google Play store here or from the Appstore here;
-
We continue to offer Wealth Management Training every Tuesday, from 7:00 pm to 8:00 pm. The training aims to grow financial literacy among the general public. To register for any of our Wealth Management Trainings, click here. If interested in our Private Wealth Management Training for your employees or investment group, please get in touch with us through wmt@cytonn.com;
-
Cytonn Asset Managers Limited (CAML) continues to offer pension products to meet the needs of both individual clients who want to save for their retirement during their working years and Institutional clients that want to contribute on behalf of their employees to help them build their retirement pot. To more about our pension schemes, kindly get in touch with us through pensions@cytonn.com;
Hospitality Updates:
-
We currently have promotions for Staycations. Visit cysuites.com/offers for details or email us at sales@cysuites.com;
Money Markets, T-Bills Primary Auction:
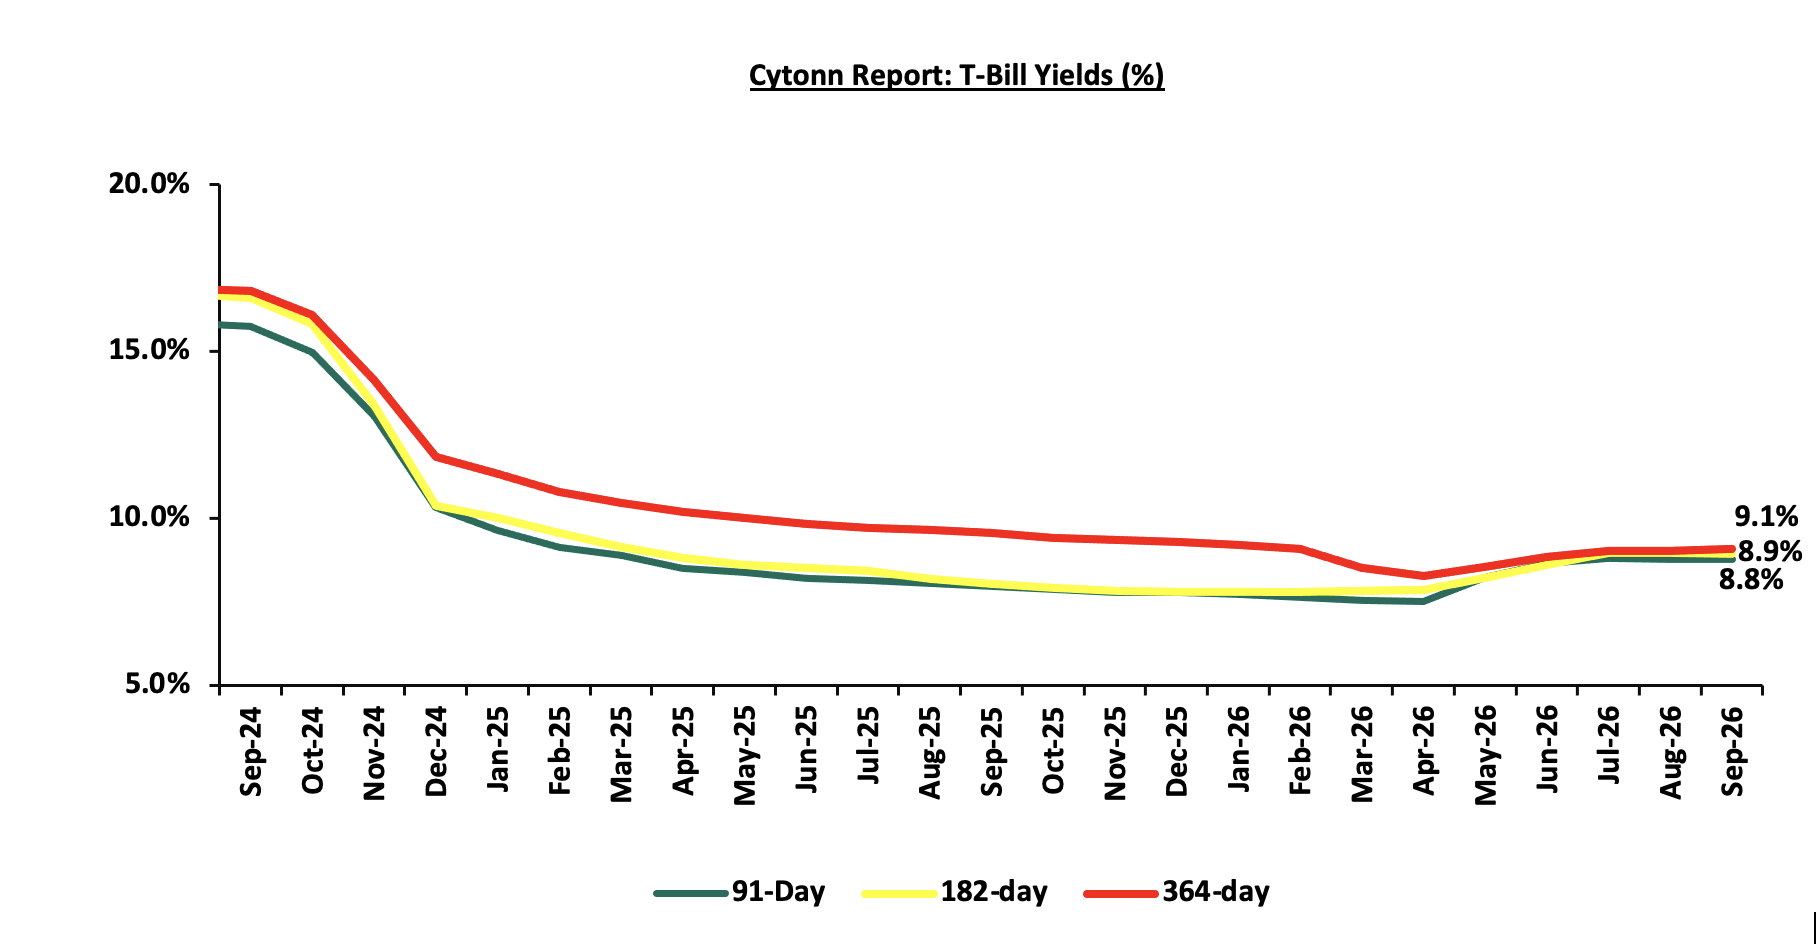
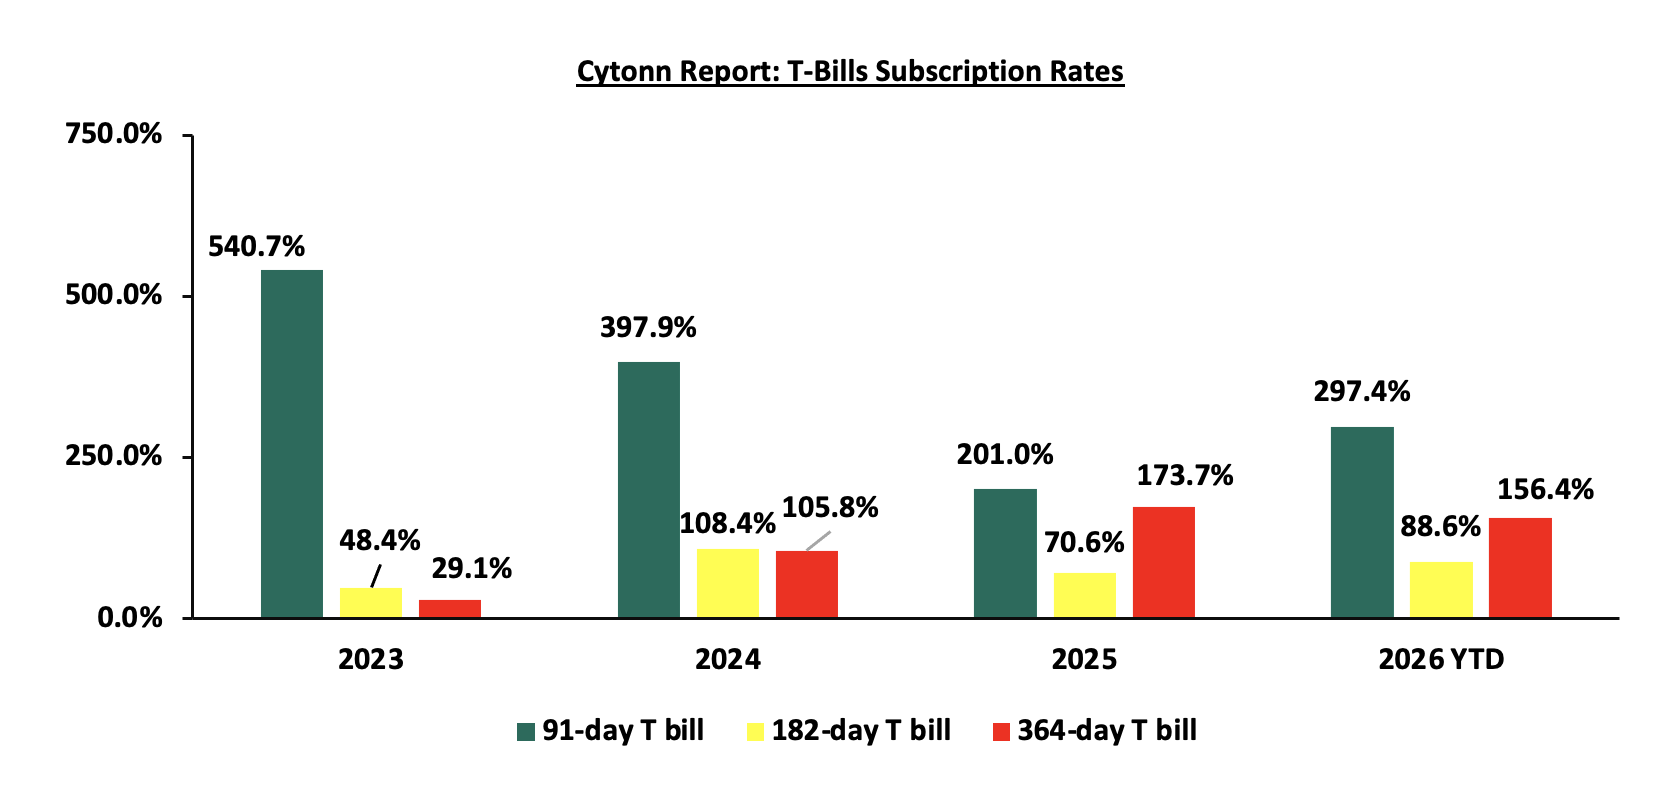
This week, T-bills were oversubscribed for the sixth consecutive week, with the overall subscription rate coming in at 198.2% lower than the subscription rate of 200.9%, recorded the previous week. Investors’ preference for the shorter 91-day paper persisted, with the paper receiving bids worth Kshs 29.6 bn against the offered Kshs 8.0 bn, translating to a subscription rate of 369.8%, lower than the subscription rate of 428.1%, recorded the previous week. The subscription rate for the 182-day paper decreased to 129.7% from 197.7% recorded the previous week, while that of the 364-day paper increased significantly to 129.6% from 22.4% recorded the previous week. The government accepted a total of Kshs 53.3 bn worth of bids out of Kshs 55.5 bn bids received, translating to an acceptance rate of 96.0%. The yields on government papers remained broadly unstable during the week, with the yields on the 91-day, 182-day, and 364-day papers all remaining relatively unchanged at 8.8%, 8.9% and 9.1%, respectively, recorded the previous week.
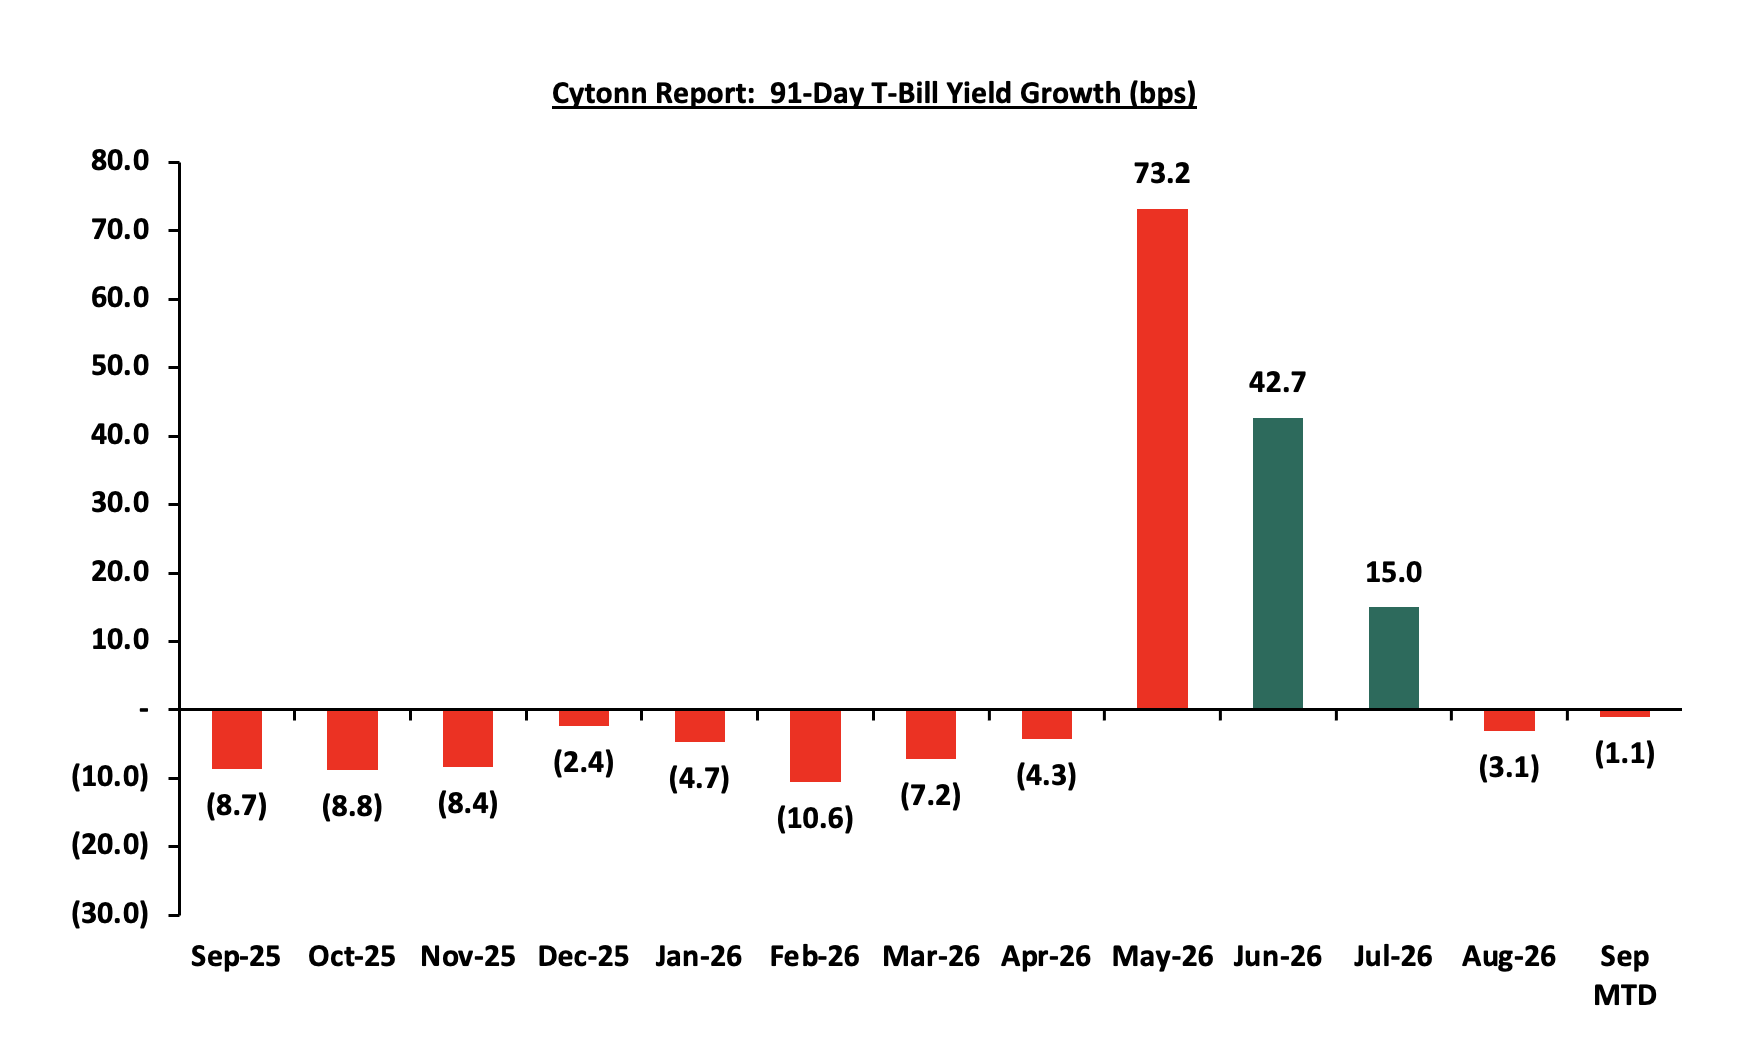
The chart below shows the yield growth rate for the 91-day paper from September 2025 to date:
The chart below shows the performance of the 91-day, 182-day and 364-day papers from September 2024 to September 2026:
The chart below compares the overall average T-bill subscription rates obtained in 2023, 2024, 2025 and 2026 Year-to-date (YTD):
T-Bonds Primary Auction:
The Central Bank of Kenya released the auction results for the switch treasury bonds from FXD1/2013/015, with a tenor to maturity of 1.4 years and a fixed coupon rate of 11.3% to FXD4/2019/010 with tenors to maturities of 3.2 years and a fixed coupon rate of 12.3%. This marks the first switch involving the bond, following the switch to FXD4/2019/010. The bond was oversubscribed, with the overall subscription rate coming in at 135.2%, receiving bids worth Kshs 13.5 bn against the offered Kshs 10.0 bn. The government accepted bids worth Kshs 11.0 bn, translating to an acceptance rate of 81.5%. The weighted average yield for the accepted bids for the FXD4/2019/010 came in at 11.1%. With the Inflation rate at 6.6% as of August 2026, the real returns of the FXD4/2019/010 is 4.5%. Given the 10.0% withholding tax on the bonds, the tax equivalent yields for shorter term bonds with 15.0% withholding tax is 11.8% for the FXD4/2019/010.
Also, the government announced a prospectus for the re-opened 20-year and 30-year fixed coupon Treasury bonds, FXD1/2019/020 and FXD1/2026/030, seeking to raise Kshs 60.0 bn for budgetary support. FXD1/2019/020 carries a fixed coupon rate of 12.9% and a remaining tenor of 12.6 years to maturity, while FXD1/2026/030 carries a fixed coupon rate of 12.5% and a remaining tenor of 29.6 years to maturity. The period of sale opened on 8th September 2026 and closes on 16th September 2026, with the auction and settlement dates set for 16th and 21st September 2026, respectively. Our recommended bidding range for FXD1/2019/020 is 12.8% - 13.3%, while that for FXD1/2026/030 is 13.3% - 13.8%, guided by prevailing yields on comparable tenors on the NSE yield curve as at 11th September 2026.
In the money markets, 3-month bank placements ended the week at 9.0% (based on rates offered by various banks). The yields on the government papers were on a downward trajectory with the yields on the 364- day paper decreasing the most by 0.7 bps to remain unchanged from 9.03% recorded the previous week. Moreover, the yields on the 91-day paper decreased marginally by 0.1 bps to remain relatively unchanged at 8.77% recorded the previous week. The yield on the Cytonn Money Market Fund remain unchanged at 11.08% recorded the previous week, while the average yields on Top 5 Money Market Funds decreased by 1.0 bps to remain relatively unchanged from the 10.81% recorded the previous week.
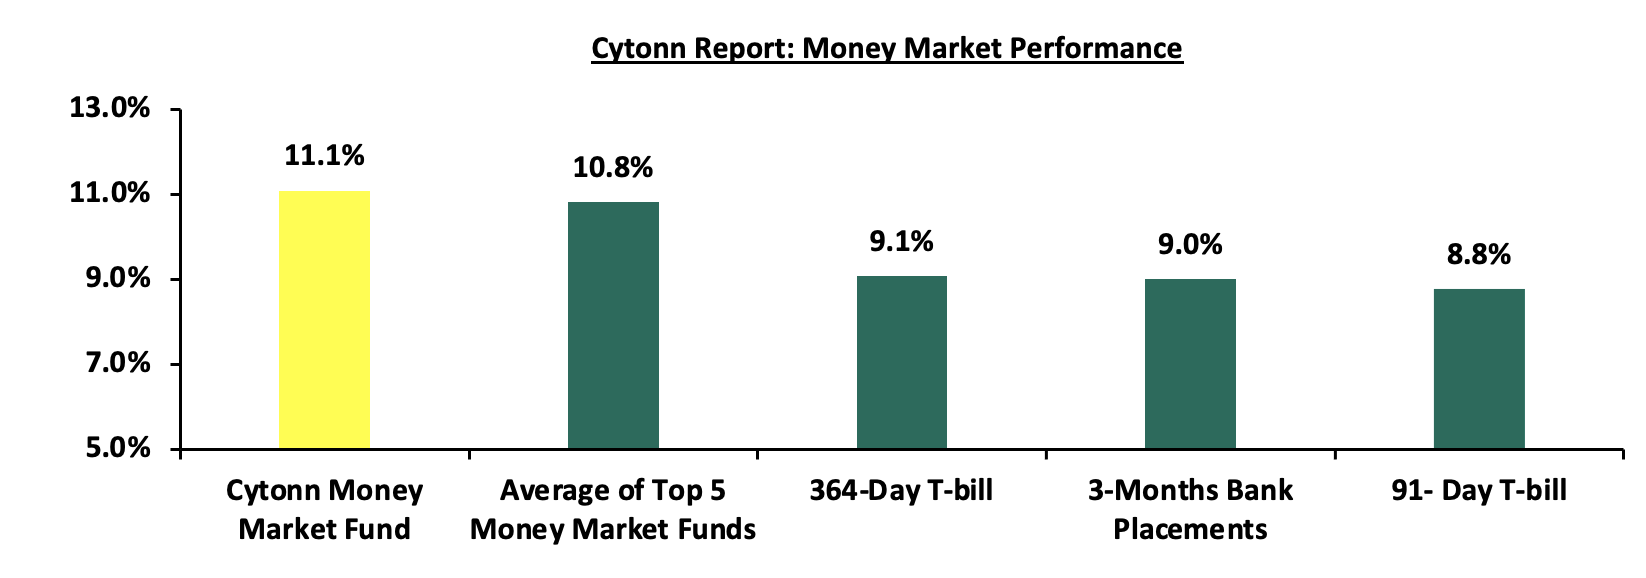
The table below shows the Money Market Fund Yields for Kenyan Fund Managers as published on 11th September 2026
|
Money Market Fund Yield for Fund Managers as published on 11th September 2026 |
||
|
Rank |
Fund Manager |
Effective Annual Rate |
|
1 |
Cytonn Money Market Fund (Dial *809# or download Cytonn App) |
11.1% |
|
2 |
Faulu Money Market Fund |
11.1% |
|
3 |
Lofty-Corban Money Market Fund |
10.7% |
|
4 |
Enwealth Money Market Fund |
10.6% |
|
5 |
Jubilee Money Market Fund |
10.6% |
|
6 |
Madison Money Market Fund |
10.5% |
|
7 |
Ndovu Money Market Fund |
10.5% |
|
8 |
Globetec Money Market Fund |
10.4% |
|
9 |
Old Mutual Money Market Fund |
10.3% |
|
10 |
Kuza Money Market fund |
10.3% |
|
11 |
Rejesha Money Market Fund |
10.3% |
|
12 |
Orient Kasha Money Market Fund |
10.3% |
|
13 |
Arvocap Money Market Fund |
10.3% |
|
14 |
Etica Money Market Fund |
10.2% |
|
15 |
Nabo Africa Money Market Fund |
10.2% |
|
16 |
Gulfcap Money Market Fund |
10.1% |
|
17 |
SanlamAllianz Money Market Fund |
10.0% |
|
18 |
GenAfrica Money Market Fund |
9.9% |
|
19 |
British-American Money Market Fund |
9.8% |
|
20 |
Apollo Money Market Fund |
9.6% |
|
21 |
CPF Money Market Fund |
9.2% |
|
22 |
Genghis Money Market Fund |
9.1% |
|
23 |
Dry Associates Money Market Fund |
9.1% |
|
24 |
KCB Money Market Fund |
8.9% |
|
25 |
CIC Money Market Fund |
8.4% |
|
26 |
AA Kenya Shillings Fund |
8.1% |
|
27 |
Mayfair Money Market Fund |
8.1% |
|
28 |
Mali Money Market Fund |
8.0% |
|
29 |
Co-op Money Market Fund |
7.9% |
|
30 |
ICEA Lion Money Market Fund |
7.8% |
|
31 |
Absa Shilling Money Market Fund |
7.5% |
|
32 |
Ziidi Money Market Fund |
5.9% |
|
33 |
Stanbic Money Market Fund |
5.3% |
|
34 |
Equity Money Market Fund |
|
Source: Business Daily
Liquidity:
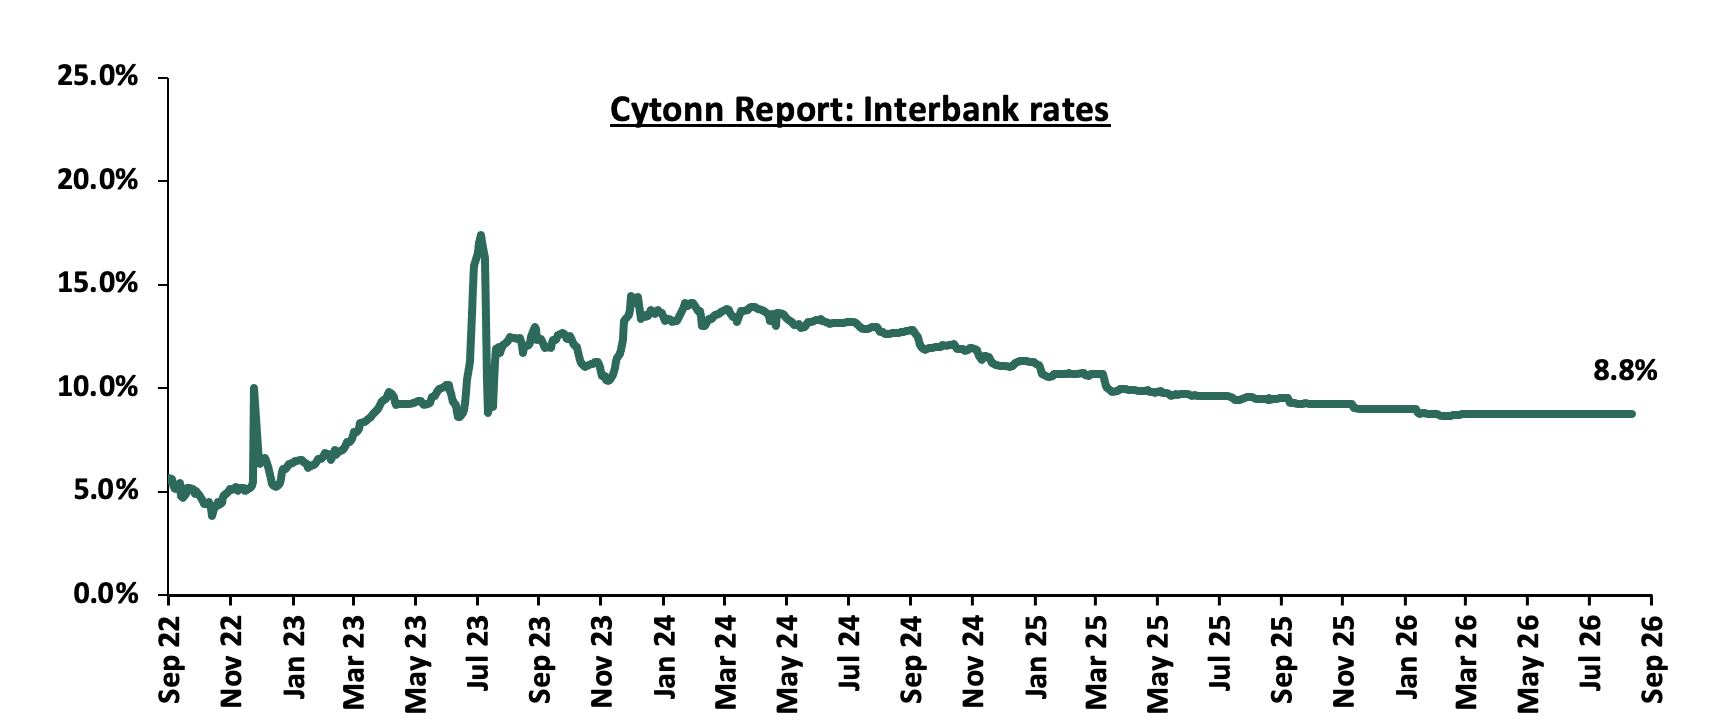
During the week, liquidity in the money markets tightened with the average interbank rate increasing marginally by 0.1 bps relatively unchanged from the 8.8% recorded last week, partly attributable to government payments that offset tax remittances. The average interbank volumes traded increased by 18.1% to Kshs 11.3 bn from Kshs 9.6 bn recorded the previous week. The chart below shows the interbank rates in the market over the years:
Kenya Eurobonds:
During the week, the yields on the Eurobonds were on an upward trajectory with the yield on the 10-year Eurobond issued in 2018, increasing the most by 32.7 bps to 6.7% from 6.4% recorded the previous week. The table below shows the summary performance of the Kenyan Eurobonds as of 10th September 2026:
|
Cytonn Report: Kenya Eurobonds Performance |
||||||
|
2018 |
2019 |
2021 |
2024 |
|||
|
Date |
10-year issue |
30-year issue |
12-year issue |
13-year issue |
7-year issue |
|
|
02-Jan-26 |
6.1% |
8.8% |
7.2% |
7.8% |
7.1% |
|
|
01-Sep-26 |
6.6% |
7.3% |
7.6% |
9.5% |
9.0% |
|
|
03-Sep-26 |
6.4% |
8.9% |
7.4% |
8.0% |
7.2% |
|
|
04-Sep-26 |
6.4% |
9.0% |
7.4% |
8.0% |
7.2% |
|
|
07-Sep-26 |
6.4% |
9.0% |
7.4% |
8.0% |
7.2% |
|
|
08-Sep-26 |
6.6% |
9.0% |
7.4% |
8.0% |
7.2% |
|
|
09-Sep-26 |
6.6% |
9.1% |
7.5% |
8.1% |
7.3% |
|
|
10-Sep-26 |
6.7% |
9.2% |
7.7% |
8.3% |
7.5% |
|
|
Weekly Change |
0.3% |
0.2% |
0.3% |
0.3% |
0.3% |
|
|
MTD Change |
0.2% |
1.9% |
0.1% |
(1.3%) |
(1.5%) |
|
|
YTD Change |
0.7% |
0.3% |
0.5% |
0.4% |
0.4% |
|
Source: Central Bank of Kenya (CBK) and National Treasury
Kenya Shilling:
During the week, the Kenya Shilling appreciated marginally against the US Dollar by 1.5 bps to Kshs 129.45 from 129.47 recorded the previous week. On a year-to-date basis, the shilling has depreciated by 30.9 bps against the dollar, as compared to the 22.9 bps appreciation recorded in 2025.
We expect the shilling to be supported by:
-
Diaspora remittances standing at a cumulative USD 4,986.9 mn in the twelve months to July 2026, slightly lower than the USD 5,079.9 mn recorded over the same period in 2025. These have continued to cushion the shilling against further depreciation. In the July 2026 diaspora remittances figures, North America remained the largest source of remittances to Kenya accounting for 51.6% in the period,
-
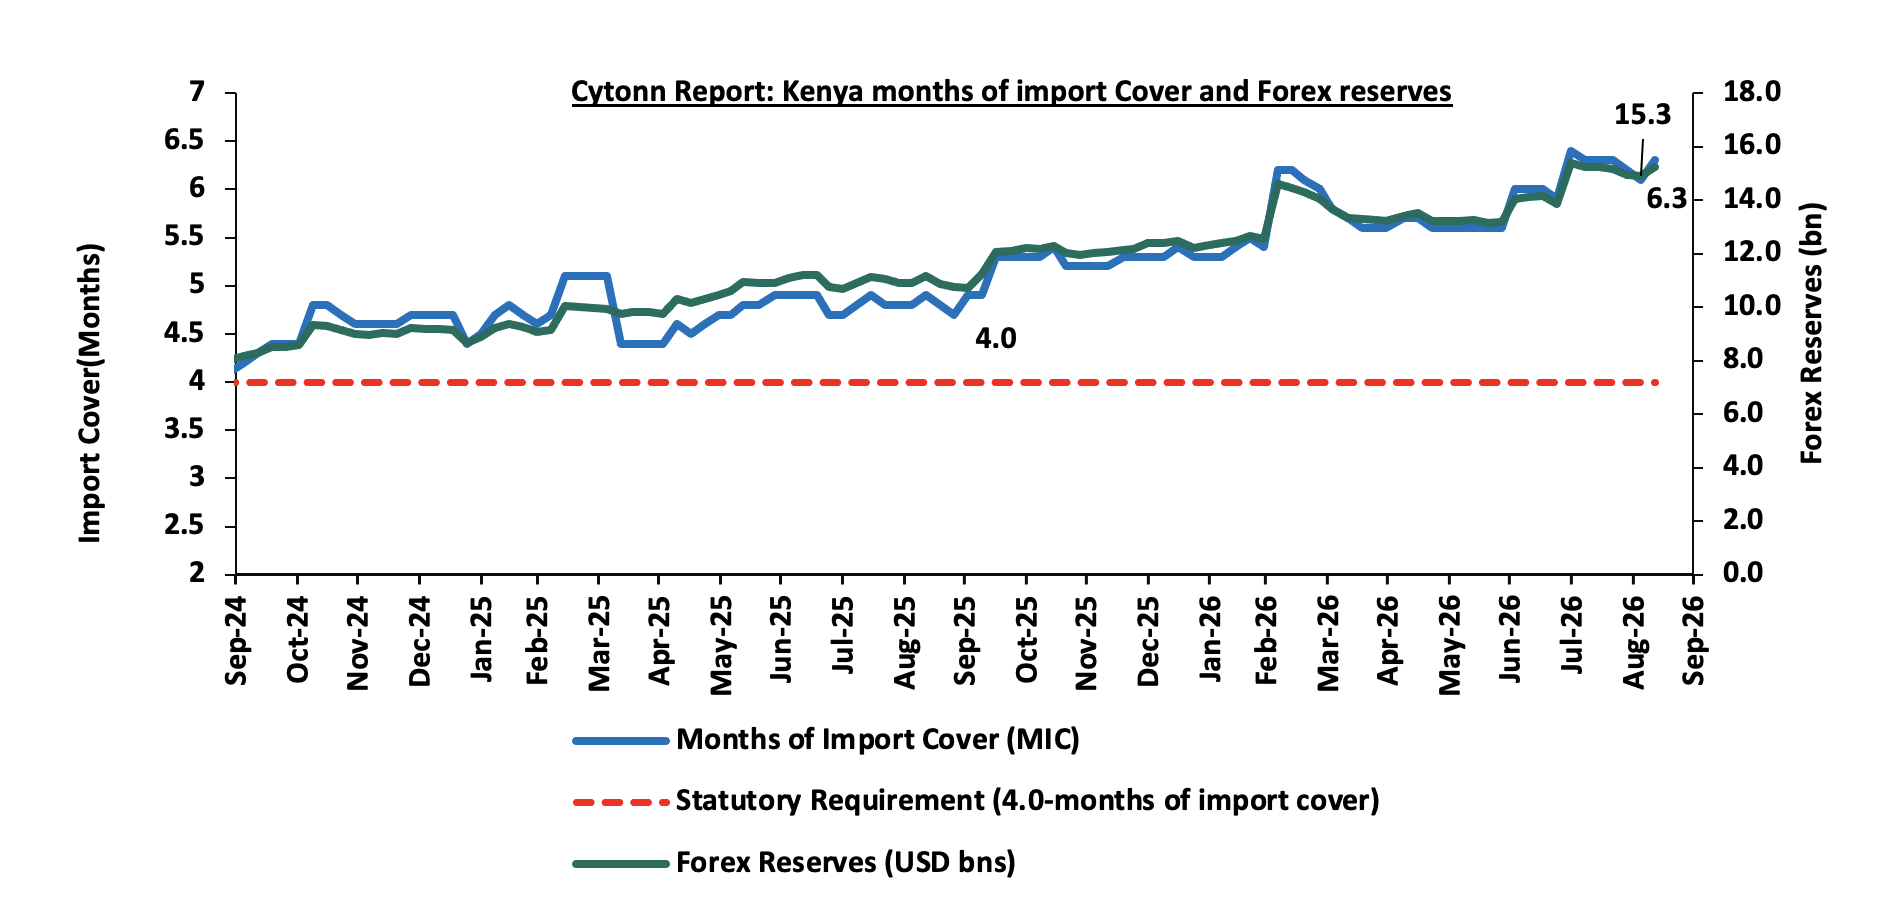
Improved forex reserves currently at USD 15.3 bn (equivalent to 6.3-months of import cover), which is above the statutory requirement of maintaining at least 4.0-months of import cover and above the EAC region’s convergence criteria of 4.5-months of import cover.
The shilling is however expected to remain under pressure in 2026 as a result of:
-
An ever-present current account deficit which widened to 3.0% of GDP in the 12 months to June 2026 compared to 1.9% of GDP in a similar period in 2025 and,
-
The need for government debt servicing, continues to put pressure on forex reserves given that 54.8% of Kenya’s external debt is US Dollar-denominated as of June 2026.
-
Rising geopolitical tensions in the Middle East, which could exert pressure on the shilling through higher global oil prices and increased uncertainty in international markets. Given that Kenya is a net importer of petroleum products, any sustained increase in oil prices would widen the import bill, increase demand for US Dollars, and consequently put depreciation pressure on the shilling
Kenya's forex reserves increased marginally by 2.5% during the week to USD 15.3 bn, from USD 14.9 bn recorded the previous week, equivalent to 6.3 months of import cover, and above the statutory requirement of maintaining at least 4.0-months of import cover. The chart below summarizes the evolution of Kenya's months of import cover over from September 2024 to September 2026:
Rates in the fixed income market have declined MTD, reversing the recent upward trend. The decline comes despite the CBK's decision to pause its rate-cutting cycle at 8.75%, with inflation remaining elevated at 6.6% but within the CBK's target range. The government is 257.8% ahead of its prorated net domestic borrowing target of Kshs 189.4 bn, having a net borrowing position of Kshs 488.3 bn (inclusive of T-bills). We expect investors to maintain a preference for short to medium-term papers as they monitor the pace of government issuance and the path of inflation before committing further out on the curve, with the yield curve likely to remain under upward pressure rather than stabilize, at least until the inflation trajectory becomes clearer.
Market Performance:
During the week, the equities market was on a downward trajectory, with NASI, NSE 10, NSE 20 and NSE 25 declining by 4.1%, 4.0%, 3.6% and 3.5% respectively taking the YTD performance to gains of 38.2%, 37.4%, 35.9% and 30.6% respectively for NSE 20, NSE 10, NSE 25 and NASI respectively. The week-on-week equities market performance was mainly driven by losses recorded by large cap stocks such as Safaricom, Absa Bank, and KCB of 6.5%, 4.1% and 4.1% respectively. However, the performance was supported by gains recorded by large cap stocks such as Stanbic Bank of 1.2%.
During the week, the banking sector index decreased by 3.3% to 289.7 from the 299.6 recorded the previous week. This is attributable to losses recorded by large cap stocks such as Absa Bank, KCB and DTB-K of 4,1%, 4.1% and 3.8% respectively. However, the performance was supported by gains recorded by large cap stocks such as Stanbic Bank of 1.2%.
During the week, equities turnover decreased by 20.7% to USD 51.2 mn from USD 64.6 mn recorded the previous week, taking the YTD total turnover to USD 2,927.6 mn. Foreign investors remained net sellers for the ninth consecutive week with a net selling position of USD 1.0 mn, from a net selling position of USD 11.5 mn recorded the previous week, taking the YTD foreign net selling position to USD 148.9 mn, compared to a net selling position of USD 92.9 mn recorded in 2025.
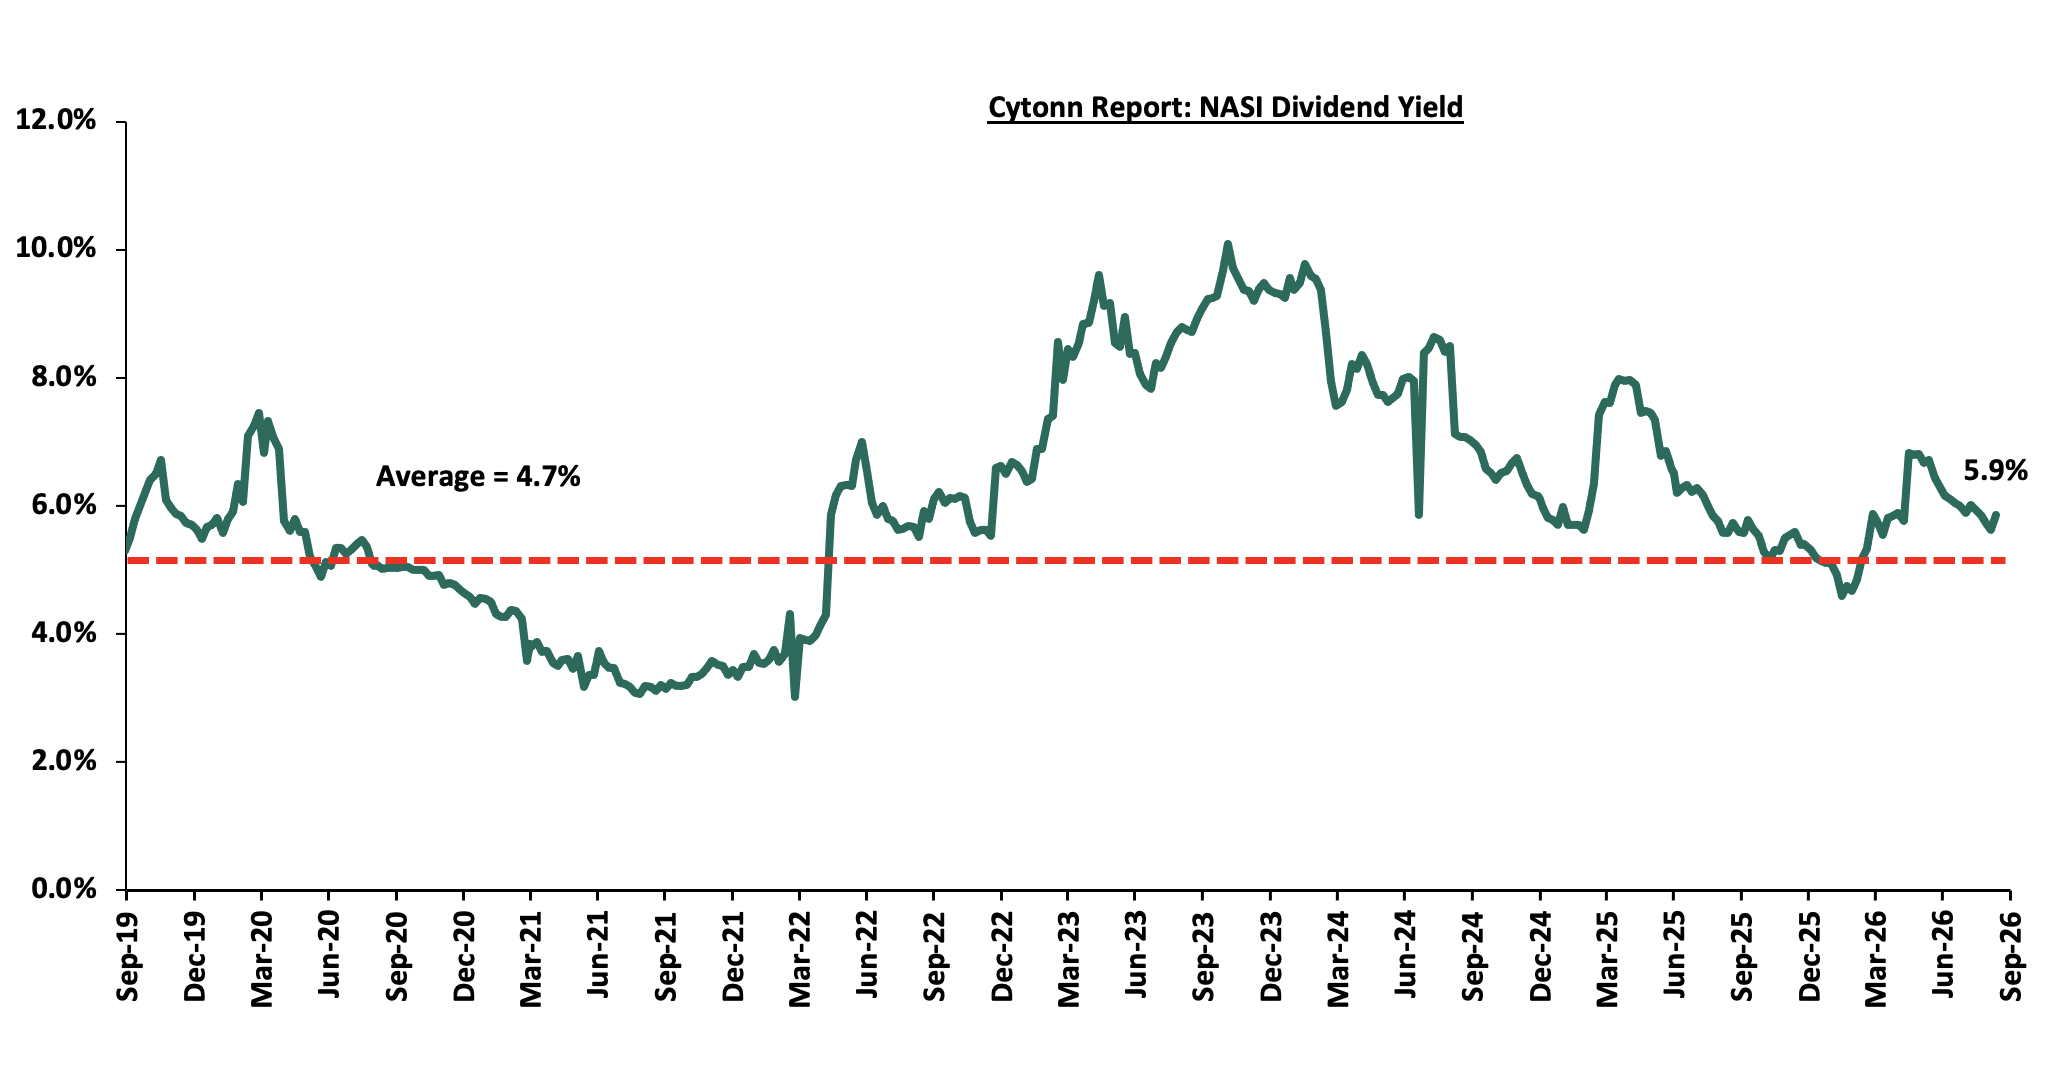
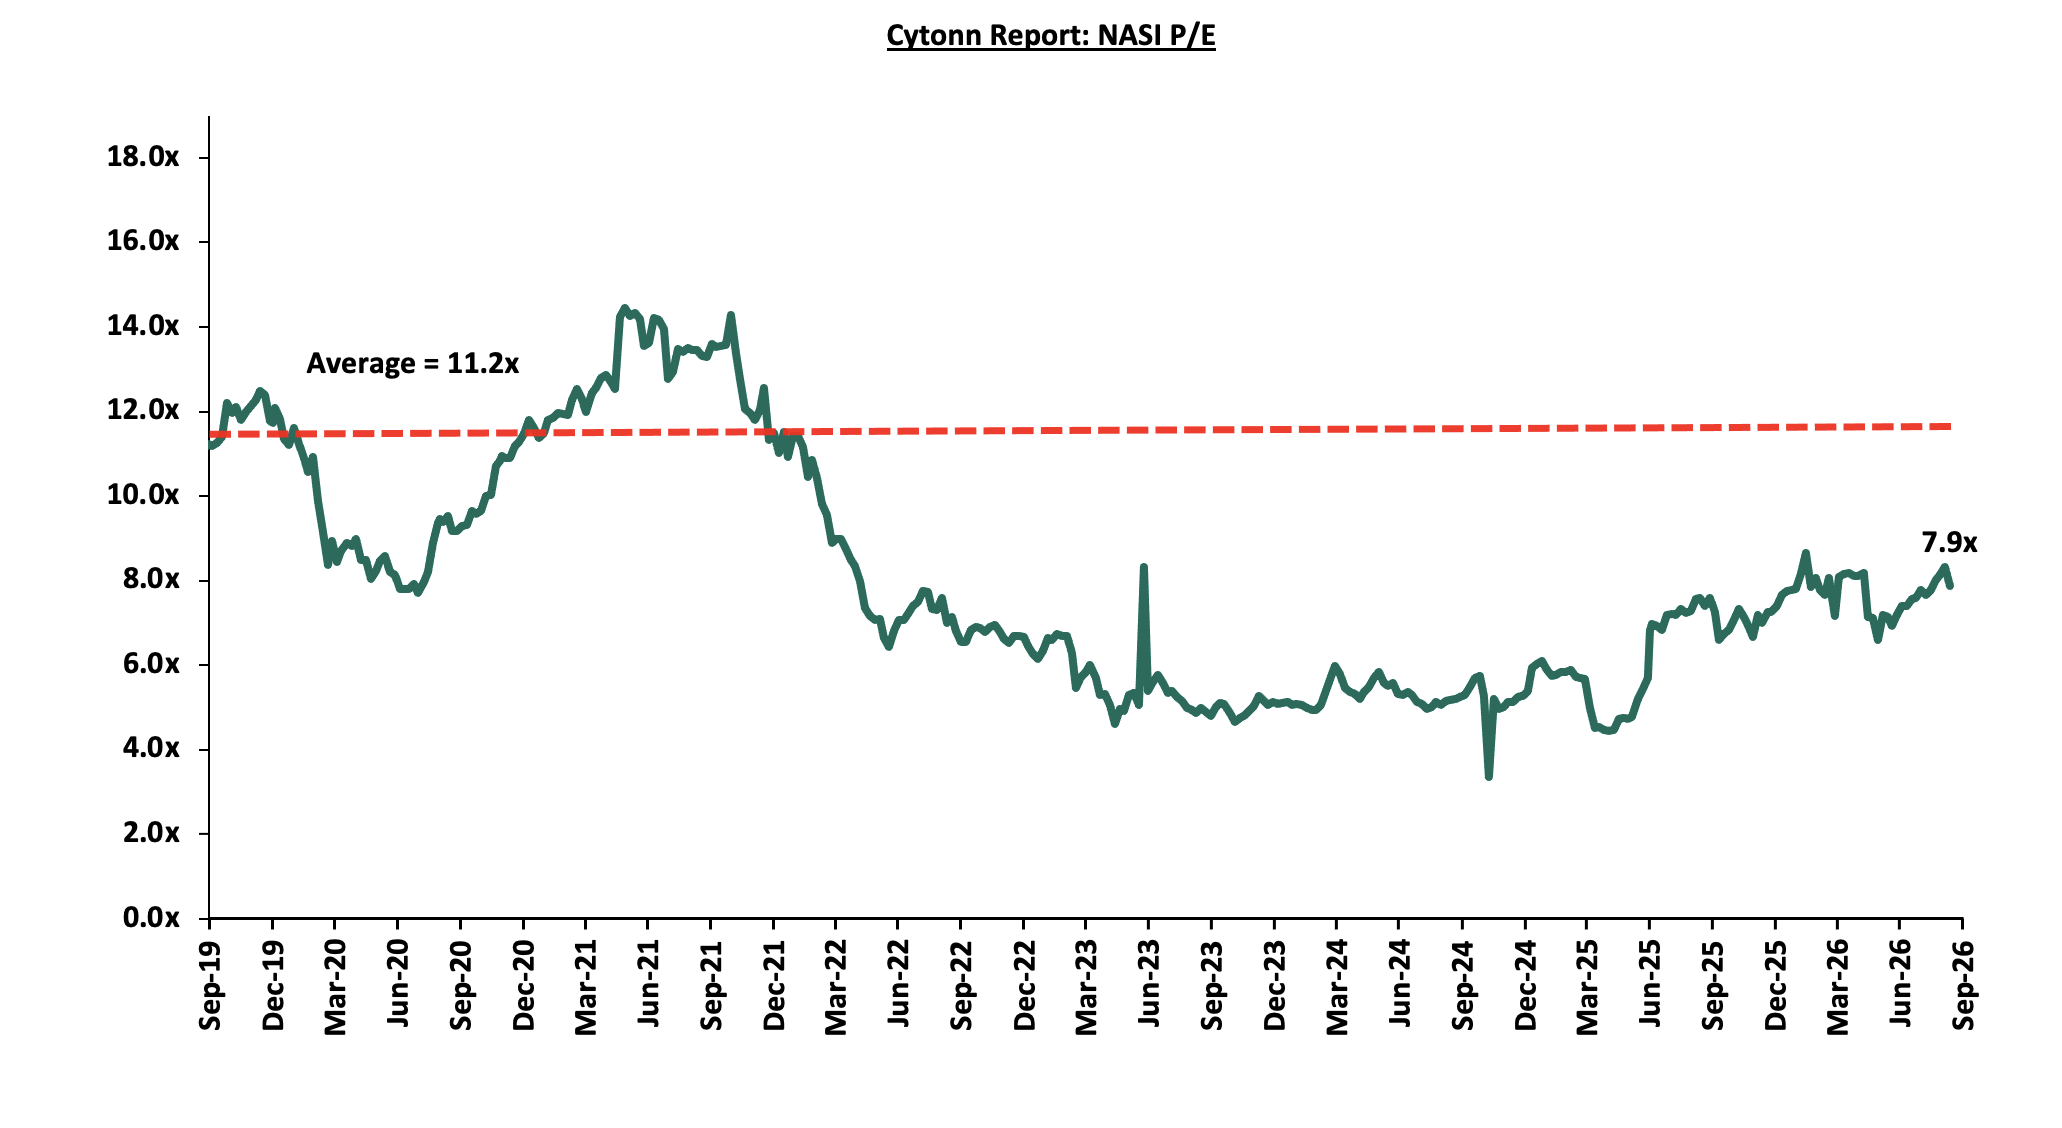
The market is currently trading at a price to earnings ratio (P/E) of 7.9x, 29.7% below the historical average of 11.2x, and a dividend yield of 5.9%, 1.2% points above the historical average of 4.7%. Key to note, NASI’s PEG ratio currently stands at 1.0x, an indication that the market is fairly valued relative to its future growth. A PEG ratio greater than 1.0x indicates the market may be overvalued while a PEG ratio less than 1.0x indicates that the market is undervalued.
The charts below indicate the historical P/E and dividend yields of the market:
Universe of Coverage:
|
Cytonn Report: Equities Universe of Coverage |
|||||||||||
|
Company |
Price as at 04/09/2026 |
Price as at 11/09/2026 |
w/w change |
m/m change |
YTD Change |
Year Open 2026 |
Target Price* |
Dividend Yield |
Upside/ Downside** |
P/TBv Multiple |
Recommendation |
|
Co-op Bank |
38.6 |
37.2 |
(3.6%) |
0.5% |
55.4% |
23.9 |
46.1 |
6.7% |
30.8% |
1.4x |
Buy |
|
NCBA |
92.5 |
90.3 |
(2.4%) |
1.1% |
6.2% |
85.0 |
108.9 |
7.9% |
28.6% |
1.2x |
Buy |
|
Family Bank |
30.4 |
28.9 |
(5.1%) |
(8.3%) |
60.3% |
18.0 |
34.0 |
4.2% |
22.0% |
1.5x |
Buy |
|
KCB Group |
98.0 |
94.0 |
(4.1%) |
0.0% |
43.0% |
65.8 |
104.4 |
7.4% |
18.5% |
1.0x |
Accumulate |
|
ABSA Bank |
35.0 |
33.5 |
(4.1%) |
(2.9%) |
34.8% |
24.9 |
36.8 |
6.1% |
16.1% |
1.8x |
Accumulate |
|
Stanbic Holdings |
279.0 |
282.3 |
1.2% |
0.6% |
42.7% |
197.8 |
300.3 |
7.9% |
14.3% |
1.6x |
Accumulate |
|
Equity Group |
106.0 |
102.0 |
(3.8%) |
8.5% |
52.2% |
67.0 |
108.8 |
5.6% |
12.3% |
1.3x |
Accumulate |
|
CIC Group |
4.7 |
4.6 |
(2.8%) |
(4.4%) |
0.9% |
4.5 |
5.0 |
2.8% |
11.1% |
1.2x |
Accumulate |
|
Standard Chartered Bank |
349.3 |
341.5 |
(2.2%) |
2.9% |
13.9% |
299.8 |
345.8 |
9.1% |
10.3% |
2.1x |
Accumulate |
|
Diamond Trust Bank |
192.5 |
185.3 |
(3.8%) |
(5.0%) |
61.4% |
114.8 |
190.2 |
4.9% |
7.5% |
0.5x |
Hold |
|
I&M Group |
81.8 |
79.3 |
(3.1%) |
(0.3%) |
85.2% |
42.8 |
81.1 |
4.7% |
7.1% |
1.3x |
Hold |
|
Jubilee Holdings |
415.0 |
412.8 |
(0.5%) |
0.7% |
28.0% |
322.5 |
420.5 |
3.6% |
5.5% |
0.6x |
Hold |
|
Britam |
20.4 |
20.9 |
2.5% |
13.0% |
130.7% |
9.1 |
18.5 |
0.0% |
(11.7%) |
1.6x |
Sell |
|
*Target Price as per Cytonn Analyst estimates **Upside/ (Downside) is adjusted for Dividend Yield ***Dividend Yield is calculated using FY’2025 Dividends |
|||||||||||
Weekly Highlights
-
Kenya Electricity Generating Company (KenGen) FY’2026 Financial Performance
During the week, Kenya Electricity Generating Company (KenGen), released its FY'2026 financial results for the period ended 30th June 2026, recording a profit after tax of Kshs 10.4 bn, a 1.2% decrease from the Kshs 10.5 bn recorded in FY’2025, majorly attributable to the 6.8% increase in operating expenses to Kshs 37.5 bn from Kshs 35.1 bn recorded in FY’2025, reflecting cost pressures as well as planned investment in plant maintenance, availability and long-term reliability. The net revenue increased by 6.6% to Kshs 49.5 bn in FY’2026, from Kshs 46.5 bn in FY’2025 mainly driven by the 6.4% increase in topline revenue to Kshs 59.7 bn from Kshs 56.1 bn in FY’2025. However, this was weighed down by a 5.7% increase in reimbursable expenses such as Fuel and Water to Kshs 10.2 bn from Kshs 9.2 bn in FY’2025. Notably, finance costs reduced by 12.1% to Kshs 2.0 bn, from Kshs 2.3 bn in FY’2025, due to continued debt management. The tables below show the breakdown of KenGen’s financial performance;
|
Cytonn Report: Kenya Electricity Generating Company (KenGen) FY'2026 Performance |
|||
|
Income Statement |
FY'2025 Kshs (bn) |
FY'2026 Kshs (bn) |
% Change |
|
Revenue |
56.1 |
59.7 |
6.4% |
|
Fuel & Water Costs |
(9.6) |
(10.2) |
5.7% |
|
Revenue Net Reimbursable Expenses |
46.5 |
49.5 |
6.6% |
|
Other Income |
0.9 |
0.8 |
(8.0%) |
|
Gains/(Losses) on Net Forex & Fair Valuation of Financial assets |
1.5 |
1.4 |
(2.5%) |
|
Operating Expenses |
(35.1) |
(37.5) |
6.8% |
|
Operating Profit |
13.6 |
14.2 |
4.1% |
|
Finance Income |
4.1 |
2.9 |
(30.4%) |
|
Finance Cost |
(2.3) |
(2.0) |
(12.1%) |
|
Profit/(Loss) Before Tax |
15.5 |
15.1 |
(2.7%) |
|
Income Tax |
(5.0) |
(4.7) |
(5.8%) |
|
Profit/(Loss) After Tax |
10.5 |
10.4 |
(1.2%) |
|
Earnings Per Share (Kshs) |
1.6 |
1.6 |
(1.3%) |
|
Dividend Per Share (Kshs) |
0.9 |
0.8 |
(16.7%) |
|
Dividend Payout ratio |
56.6% |
47.8% |
(15.6%) |
|
Dividend Yield |
9.3% |
6.0% |
(35.9%) |
source: Kenya Electricity Generating Company (KenGen) FY’2026 Financial Report,
|
Cytonn Report: Kenya Electricity Generating Company (KenGen) FY'2026 Performance |
|||
|
Balance Sheet |
FY'2025 Kshs (bn) |
FY'2026 Kshs (bn) |
% Change |
|
Non-Current Assets |
452.1 |
449.3 |
(0.6%) |
|
Current Assets |
53.5 |
50.7 |
(5.2%) |
|
Total Assets |
505.6 |
500.1 |
(1.1%) |
|
Non-Current Liabilities |
200.6 |
189.2 |
(5.7%) |
|
Current Liabilities |
20.4 |
20.7 |
1.5% |
|
Total Liabilities |
221.0 |
209.9 |
(5.0%) |
|
Total Equity |
284.5 |
290.1 |
2.0% |
Source: Kenya Electricity Generating Company (KenGen) FY’2026 Financial Report
Key take outs from the financial performance include;
-
Net revenue increased by 6.6% to Kshs 49.5 bn in FY’2026, from Kshs 46.5 bn in FY’2025 mainly driven by the 6.4% increase in topline revenue to Kshs 59.7 bn from Kshs 56.1 bn in FY’2025. However, this was weighed down by a 5.7% increase in reimbursable expenses such as Fuel and Water to Kshs 10.2 bn from Kshs 9.2 bn in FY’2025.
-
Operating profit increased by 4.1% to Kshs 14.2 bn in FY’2026 from Kshs 13.6 bn in FY’2025, largely driven by the 6.6% increase in net revenue to Kshs 49.5 bn in FY’2026, from Kshs 46.5 bn in FY’2025. The performance was however weighed down by a 6.8% increase in expenses to Kshs 37.5 bn in FY’2026 from Kshs 35.1 bn in FY’2025.
-
The balance sheet recorded a marginal contraction, with its total assets declining by 1.1% to Kshs 500.1 bn from Kshs 505.6 bn in FY’2025. This was attributable to a 5.2% decrease in current assets to Kshs 50.7 bn from Kshs 53.5 bn in FY’2025, coupled with a 0.6% decrease in Non-current assets to Kshs 449.3 bn from Kshs 452.1 bn in FY’2025.
-
Total liabilities declined by 5.0% to Kshs 209.9 bn from Kshs 221.0 bn. This is attributable to a 5.7% decrease in Non-current liabilities to Kshs 189.2 bn from Kshs 200.6 bn in FY’2025.
-
However, the current liabilities increased by 1.5% to Kshs 20.7 bn in FY’2026, from Kshs 20.4 bn recorded in FY’2025,
-
Earnings per share decreased by 1.3% to remain relatively unchanged at Kshs 1.6 in FY’2026, mainly due to the marginal 1.2% decrease in the company’s profit after tax to Kshs 10.4 bn in FY’2026 from Kshs 10.5 bn in FY’2025, and,
-
The board of directors recommended a first final dividend for FY’2026 of Kshs 0.75 per share translating to a dividend yield of 6.8%, compared to a dividend yield of 9.1% in FY’ 2025 and a dividend payout ratio of 47.8% in FY’2026 compared to 56.6% in FY’2025.
Going forward, we expect the company’s earnings to be supported by robust profitability, improved efficiency and growth in strategic investments. Beyond electricity generation, KenGen continues to scale complementary revenue streams and commercial opportunities. The KenGen Green Energy Park, its flagship diversification initiative has been gazetted as a Special Economic Zone and Customs Controlled Area, creating a platform for green industrial investment. The Company is also commercialising its world-class geothermal expertise through engagements in markets including Tanzania, Bhutan and Eswatini. Together, these initiatives reinforce KenGen’s position as a leading African renewable-energy company with globally relevant capabilities and a clear pathway to sustainable growth.
-
Britam Uses Share Premium to Clear Accumulated Losses
During the week, Britam Holdings Plc completed a Kshs 5.9 bn reduction of its share premium account, eliminating the accumulated losses that have barred the insurer from paying dividends for six years. The reduction became effective on 7th September 2026, after the Registrar of Companies registered a High Court order confirming the special resolution shareholders passed at the 21st May Annual General Meeting.
Under the Companies Act, a company cannot declare a dividend while it carries accumulated losses, regardless of current profitability. Britam fell into this position in 2020, when it recorded Kshs 9.1 bn loss driven by COVID-19's impact on operations and investments. As a non-operating holding company, Britam had been drawing this down gradually using dividends from its subsidiaries, a pace management said was too slow to clear the deficit.
Share premium, the amount investors pay above a share's nominal value, can be applied to offset accumulated losses as a straightforward reclassification within equity, involving no cash movement, no change in underlying assets, and no dilution to shareholders. The exercise cut Britam's share premium account from Kshs 13.2 bn to Kshs 7.4 bn, following board approval in March, shareholder sign-off in May, High Court confirmation, and final registration with the Registrar of Companies. FY’2025 net profit rose 10.0% to Kshs 5.5 bn, underpinning the profitability needed to sustain payouts once distributable reserves are restored. Britam last paid a dividend of Kshs 0.25 per share in July 2020, and the stock has gained significantly on the prospect of a resumption of dividend payments, recording a year-to-date gain of 130.7% to Kshs 20.9 from Kshs 9.1 recorded at the beginning of the year.
Clearing the accumulated losses does not, however, guarantee a dividend. The Board still has to formally declare one, and management has signalled it also wants to continue strengthening subsidiary balance sheets rather than rush a full payout, suggesting any resumption may be measured rather than an immediate return to pre-2020 payout levels.
We maintain a “cautiously optimistic” short-term outlook supported primarily earnings-led attractive valuations, despite heightened geopolitical risks such as Iran war that may weigh on investor sentiment, and, “neutral” in the long term as persistent foreign investor outflows continue to constrain market liquidity and limit broad-based market re-rating. With the market currently trading at a discount to its future growth (PEG Ratio at 1.0x), where performance will be driven by company-specific fundamentals rather than general market direction, we believe that investors should reposition towards value stocks exhibiting strong earnings growth, attractive dividend yields, solid balance sheets, sustainable competitive advantages and trading at compelling discounts to their intrinsic value. While foreign investor sell-offs are expected to continue exerting pressure in the near term, we believe this will create selective entry opportunities for long-term investors
-
Hospitality
During the week, Artesano Investment Limited, Gulf Hotels Group, Silva Gigiri Limited and Season Global Limited announced plans to invest Kshs 5.5 bn in hospitality developments in Nairobi's Gigiri neighbourhood, expected to add a combined 587 accommodation units to the area. The developments include a Kshs 593.4 mn, 11-storey hotel by Artesano Investment Limited, comprising 152 accommodation units, as well as the Silva Gigiri Hotel & Residence, a Kshs 3.9 bn joint development by Gulf Hotels Group and Silva Gigiri Limited that will comprise 250 units, including studios, one- and two-bedroom residences and upscale penthouses. In addition, Season Global Limited has lined up a Kshs 1.1 bn hotel development comprising 185 hotel suites.
The increased investment in Gigiri is supported by the neighbourhood’s strategic position as a diplomatic and international business hub, hosting the United Nations Office at Nairobi, numerous embassies, international organisations and multinational institutions. The location continues to generate demand for high-quality accommodation from diplomats, business travellers, conference delegates and international visitors, with investors increasingly favouring serviced residences and hotel suites offering extended-stay facilities such as kitchenettes and dedicated workspaces.
We expect continued investment in high-end hospitality assets in strategic nodes such as Gigiri to be supported by rising business and diplomatic activity, international conferences and tourism, although competition from the growing supply of accommodation facilities could weigh on occupancy levels over time.
During the week, the Kenya Tourism Board (KTB) signed a three-year partnership with international luxury lifestyle and culture brand Tatler Africa to promote Kenya as a leading luxury tourism destination and strengthen its position within the international luxury travel ecosystem. The partnership will see Kenya host the inaugural Tatler Best Africa awards on 8th October 2026, providing a platform to showcase the country’s premium tourism and hospitality offerings to an international audience.
The partnership will also support the promotion of Kenya’s diverse premium tourism offerings, including safari, conservation, culture, gastronomy, wellness, fashion, art and sports tourism, while creating opportunities to promote the country’s meetings, incentives, conferences and exhibitions (MICE) segment. In addition, the initiative will incorporate training and knowledge-sharing programmes focused on luxury service standards, destination storytelling, international market expectations and digital communications.
The initiative is expected to enhance the international visibility of Kenya’s hospitality sector and support efforts to attract high-value international visitors, particularly as competition for luxury tourists continues to increase across African destinations. Increased visibility and destination recognition could support demand for high-end hotels, resorts and other hospitality facilities, while also encouraging operators to improve service standards and diversify their premium offerings to meet the expectations of international travellers.
We expect the partnership to support the continued recovery and expansion of Kenya’s hospitality sector by strengthening the country’s positioning in the global luxury tourism market and increasing opportunities to attract high-spending visitors. However, the extent to which this translates into sustained growth in hospitality performance will depend on continued growth in international arrivals, connectivity and investment in quality tourism infrastructure.
-
Real Estate Investments Trusts
-
REITs Weekly Performance
On the Unquoted Securities Platform Acorn D-REIT and I-REIT traded at Kshs 29.7 and Kshs 24.4 per unit, respectively, as per the last updated data on 11th September 2026. The performance represented a 48.5% and 22.0% gain for the D-REIT and I-REIT, respectively, from the Kshs 20.0 inception price. The volumes traded for the D-REIT and I-REIT came in at 13.7 mn and 46.0 mn shares, respectively. Additionally, ILAM Fahari I-REIT traded at Kshs 20.5 per share as of 11th September 2026, representing a 2.5% gain from the Kshs 20.0 inception price, the volume traded came in at 1.2 mn shares. REITs offer various benefits, such as tax exemptions, diversified portfolios, and stable long-term profits. However, the ongoing decline in the performance of Kenyan REITs and the restructuring of their business portfolios are hindering significant previous investments. Additional general challenges include:
-
Insufficient understanding of the investment instrument among investors leading to a slower uptake of REIT products,
-
Lengthy approval processes for REIT creation,
-
High minimum capital requirements of Kshs 100.0 mn for REIT trustees compared to Kshs 10.0 mn for pension funds Trustees, essentially limiting the licensed REIT Trustee to banks only
-
The rigidity of choice between either a D-REIT or and I-REIT forces managers to form two REITs, rather than having one Hybrid REIT that can allocate between development and income earning properties
-
Limiting the type of legal entity that can form a REIT to only a trust company, as opposed to allowing other entities such as partnerships, and companies,
-
We need to give time before REITS are required to list – they would be allowed to stay private for a few years before the requirement to list given that not all companies maybe comfortable with listing on day one, and,
-
Minimum subscription amounts or offer parcels set at Kshs 0.1 mn for D-REITs and Kshs 5.0 mn for restricted I-REITs. The significant capital requirements still make REITs relatively inaccessible to smaller retail investors compared to other investment vehicles like unit trusts or government bonds, all of which continue to limit the performance of Kenyan REITs.
We expect the performance of Kenya’s real estate sector to remain resilient, supported by several factors, including: i) Investors Commit of Kshs 5.5 bn to Luxury Hotel Developments in Gigiri ii) Kenya Tourism Board (KTB) Partnership with Tatler to Promote Kenya’s Luxury Tourism Market. However, weak investor appetite for listed REITs such as ILAM Fahari I-REIT, oversupply in select Real Estate segments, and high capital requirements will continue to constrain the sector’s optimal performance
Digital Payments Weekly Highlights
-
Visa Brings Onchain Lending into Everyday Payments
During the week, Visa Inc. announced a new approach to onchain credit that combines VisaNet settlement data with blockchain lending infrastructure to help stablecoin-linked card programmes and fintechs access working capital. Visa noted that more than USD 694.0 bn in stablecoin-denominated loans have been processed through onchain lending protocols since 2020, while more than 160 stablecoin-linked card programmes currently operate on its network and stablecoin settlement volumes exceeding a USD 20.0 bn annualized run rate. The integration of VisaNet settlement data with onchain lending infrastructure could improve lenders’ ability to assess real-time payment performance and extend financing against settlement receivables, reducing the working-capital constraints faced by rapidly growing payment companies. An early model with Credit Coop has supported more than USD 2.5 bn in cumulative financed settlement volume since 2023, with zero defaults across participating facilities, demonstrating the potential for programmable financing and automated repayment.
-
Mastercard and IFC Launch USD 500.0 Mn Global Settlement Risk Facility
During the week, Mastercard announced the launch of a USD 500.0 mn global settlement exposure facility in partnership with the International Finance Corporation (IFC), a member of the World Bank Group. The facility is designed to enable financial institutions in emerging markets to participate more seamlessly in Mastercard’s payment network by providing cost-effective access to modern payment infrastructure while maintaining strong risk management standards. The initiative initially focuses on emerging markets in Europe and Latin America and builds on Mastercard and IFC’s broader collaboration to expand secure and accessible financial services. The facility addresses a key constraint limiting the expansion of digital payments in emerging markets, where financial institutions can face significant collateral requirements and settlement exposure when scaling payment services. By reducing these barriers, Mastercard can support greater participation by banks and fintechs in its network, expanding transaction volumes and strengthening its position across underserved markets. The partnership also supports broader financial inclusion by enabling small businesses and consumers to participate more actively in the formal digital economy, while potentially creating a scalable risk-sharing model for expanding payment infrastructure in emerging markets.
-
Circle to Acquire Tazapay to Expand Global Cross-Border Payments Infrastructure
During the week, Circle Internet Group Inc. announced a definitive agreement to acquire Singapore-based B2B cross-border payments infrastructure provider Tazapay, subject to customary closing conditions and regulatory approvals, including approval from the Monetary Authority of Singapore. Tazapay brings more than USD 25.0 bn in annualized payment volume, over 60 banking and fintech partners and local payout rails covering more than 100 markets into Circle’s payments ecosystem, with approximately 60.0% of its transaction volume already involving stablecoins. The acquisition strengthens Circle’s ability to originate and terminate USDC-denominated payments across local banking and payout networks, particularly in APAC and emerging markets where cross-border payment infrastructure remains fragmented. By combining Tazapay’s local payment rails and institutional relationships with Circle’s USDC and Circle Payments Network infrastructure, Circle can reduce reliance on traditional correspondent banking channels and accelerate near-instant, 24/7 settlement. The transaction therefore supports Circle’s strategy of positioning USDC as a core payment rail for cross-border commerce while expanding its addressable market beyond stablecoin issuance into end-to-end payment infrastructure.
-
American Express Canada Ranks No. 1 in JD Power 2026 Credit Card Satisfaction Study
During the week, American Express Canada was ranked number one among credit card issuers in the JD Power 2026 Canada Credit Card Satisfaction Study, while the American Express Cobalt Card ranked first among credit cards with an annual fee for the third consecutive year. American Express ranked first across benefits, terms and customer service, while the Cobalt Card achieved the highest score in its segment across benefits, terms, account management and customer service. The company has continued investing in rewards, premium travel benefits, exclusive entertainment and dining experiences, digital services and broader card acceptance across Canada. The recognition reinforces American Express’ differentiated premium positioning and its ability to sustain customer loyalty through a combination of rewards, service and lifestyle benefits rather than competing primarily on transaction pricing. Continued investment in digital experiences and card acceptance can strengthen engagement and spending activity, while the sustained performance of the Cobalt Card supports Amex’s ability to retain higher-value customers within its membership ecosystem. The ranking therefore provides a positive signal for the resilience of Amex’s customer proposition and its broader strategy of monetizing premium card relationships through increased engagement and differentiated benefits.
-
Digital Payments Stock Performance
The table below presents a snapshot of NYSE-listed digital payments stocks, covering Visa, Mastercard, American Express (AXP), Wise Plc, Block and PayPal:
|
Cytonn Report: Digital Payments NYSE Stock Performance |
|||||||
|
Company |
Year Open 2026 |
Price 9/04/2026 |
Price 9/11/2026 |
w/w change |
YTD change |
Forward P/E |
|
|
American Express |
372.7 |
326.2 |
324.7 |
(0.5%) |
(12.9%) |
16.1 x |
|
|
Visa |
346.5 |
375.1 |
370.5 |
(1.2%) |
6.9% |
24.5 x |
|
|
Mastercard |
563.1 |
595.3 |
569.2 |
(4.4%) |
1.1% |
24.5 x |
|
|
Circle |
83.5 |
102.1 |
90.6 |
(11.3%) |
8.5% |
73.5 x |
|
|
Block |
65.2 |
82.8 |
79.2 |
(4.3%) |
21.6% |
15.3 x |
|
|
Paypal Holdings |
58.1 |
55.0 |
53.7 |
(2.3%) |
(7.6%) |
9.2 x |
|
|
Global Payments Inc |
77.0 |
92.5 |
88.3 |
(4.6%) |
14.6% |
5.5 x |
|
|
Average |
|
|
|
|
|
24.1 x |
|
Source: Visa, AXP, Circle, Mastercard, Block and PayPal financials, NYSE, Yahoo finance
The stocks are currently trading at an average forward P/E multiple of 24.1x, reflecting continued confidence in the networks' resilient earnings growth and payment-volume trends, tempered by rising client incentives and operating costs specifically at the card networks.
We expect the global digital payments sector to continue shifting toward greater payment sovereignty and central bank-backed infrastructure. This trend threatens to intensify competition against incumbent card networks like Visa and Mastercard, while opening opportunities for other digital finance players. Despite this competitive risk, the sector trades at an elevated 24.1x average forward P/E, implying markets haven't fully priced in the threat to incumbents. Near-term performance will hinge on regulatory developments and how well both incumbents and new entrants adapt.
Following the release of the Capital Markets Authority (CMA) Quarterly CIS Report – Q2’2026, we examine the performance of Unit Trust Funds for the period ended 30th June 2026. These funds have seen consistent growth in total Assets Under Management (AUM) and are one of the preferred investment choices in Kenya. Additionally, we will delve into the performance of Money Market Funds, which are a sub-set of Unit Trust Funds.
In our previous note on Unit Trust Funds, we looked at the Q1’2026 Unit Trust Funds Performance by Fund Managers, where we highlighted that their AUM stood at Kshs 851.7 bn, a 12.6% growth from Kshs 756.2 bn recorded in Q4’2025. In this note, we focus on the Q2’2026 performance of Unit Trust Funds where we shall analyze the following:
-
Performance of the Unit Trust Funds Industry,
-
Performance of Money Market Funds,
-
Comparing Unit Trust Funds AUM Growth with other Markets, and,
-
Recommendations.
Section I: Performance of the Unit Trust Funds Industry
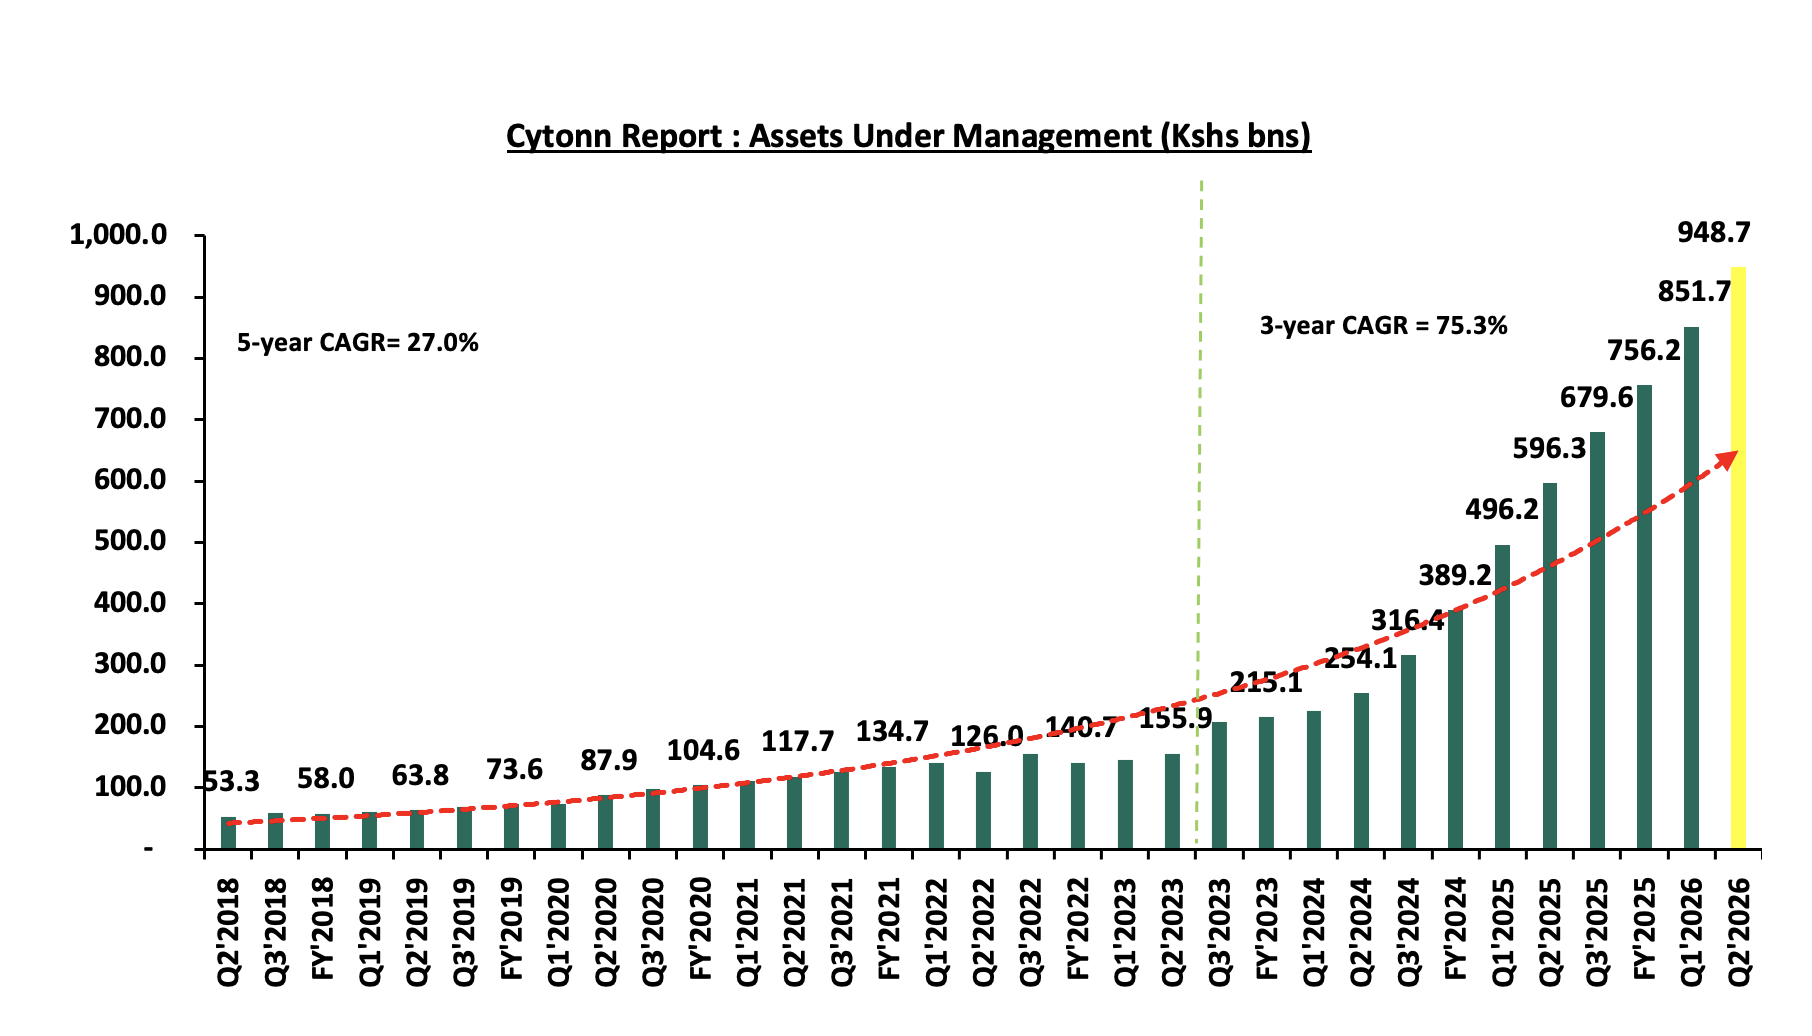
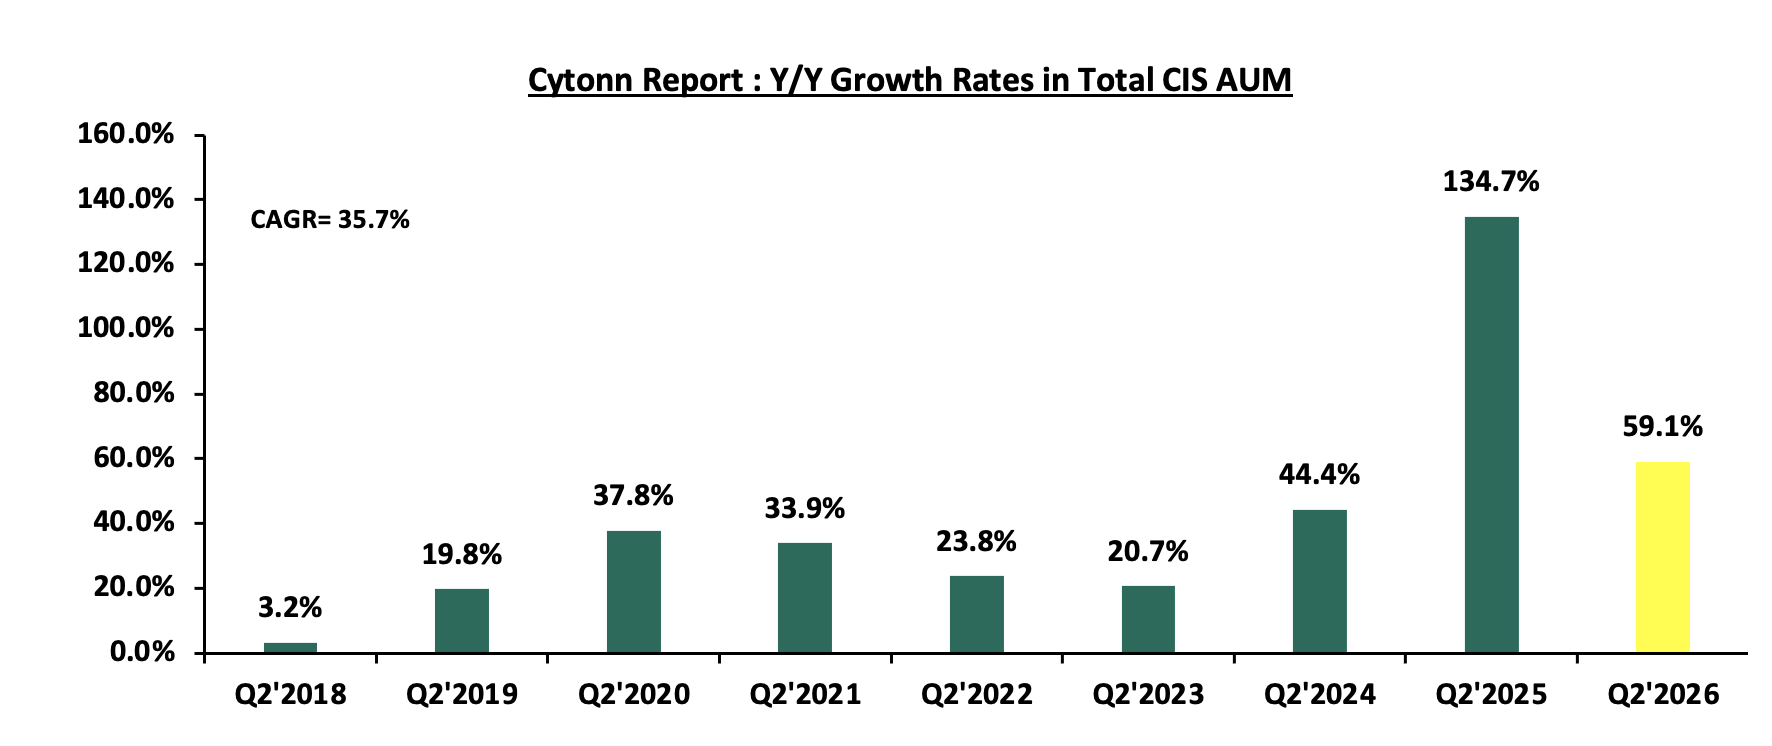
As per the Capital Markets Authority (CMA) Quarterly Collective Investment Schemes (CIS) Report- Q2’ 2026, the industry’s overall Assets under Management (AUM) grew by 11.4 % on a quarter-on-quarter basis to Kshs 948.7 bn at the end of Q2’2026, from Kshs 851.7 bn recorded in Q1’2026. On a y/y basis, the total AUM increased by 59.1%, from Kshs 596.3 bn as at the end of Q2’2025. Key to note, Assets under Management of the Unit Trust Funds have been on an upward trajectory over the last eight years, growing at a 5-year CAGR of 27.0% to Kshs 176.0 bn in Q2’2023, from Kshs 53.3 bn recorded in Q2’2018, and accelerated further at a 3-year CAGR of 75.3% to Kshs 948.7 bn as of Q2’2026 highlighting the rapid expansion and increasing attractiveness of the unit trust funds in Kenya. The chart below shows the growth in Unit Trust Funds’ AUM over the last 8 years:
Source: Capital Markets Authority
The growth can be largely attributed to:
-
Popularity of special funds: The growing popularity of special funds has been a key driver in the expansion of unit trusts, as investors increasingly seek specialized investment solutions tailored to specific sectors, themes, and risk profiles, leading to higher participation and sustained growth in the unit trust industry.
-
Low Investments minimums: Most Unit Trust Funds Collective Investment Schemes (CIS) in the market have relatively low initial investment requirements, typically ranging from Kshs 100.0 to Kshs 10,000.0. This has promoted financial inclusion by enabling small-scale investors to access professionally managed investment opportunities,
-
Diversified product offering: Unit Trust Funds are also advantageous in terms of providing investors with access to a wider range of investment securities through the pooling of funds. This allows for portfolio diversification that might not be achievable individually, helping investors mitigate the risks associated with market volatility in some asset classes,
-
Competitive returns: The positive performance and competitive returns of unit trust funds have been key in attracting investors. As these funds consistently outperform certain traditional investment options, they draw more investors seeking to generate wealth over the long term,
-
Increased product awareness: Investor education efforts, primarily led by the Capital Markets Authority (CMA) and fund managers, have focused on raising awareness about the various products offered by trust funds. This has resulted in a deeper understanding of investment options among the public, boosting their confidence and leading to increased participation. Consequently, the number of investors in collective investment schemes has surged significantly, recording a 68.0% growth to 4.1 million by June 2026, from 2.5 million in June 2025, according to the Capital Markets Authority (CMA) Quarterly Collective Investment Schemes (CIS) Report-Q2’2026,
-
Regulatory Changes: We have had several regulatory changes that have spurred growth in the industry, such as allowing for Special Collective Investments Schemes and expanding eligibility for trustees to include non-bank trustees.
-
Efficiency and High Liquidity: Investments in UTFs are managed as portfolios with various assets, and fund managers maintain a cash buffer. Unit trusts are highly liquid, making it easy to buy and sell units without being dependent on market demand and supply at the time of investment or exit, and,
-
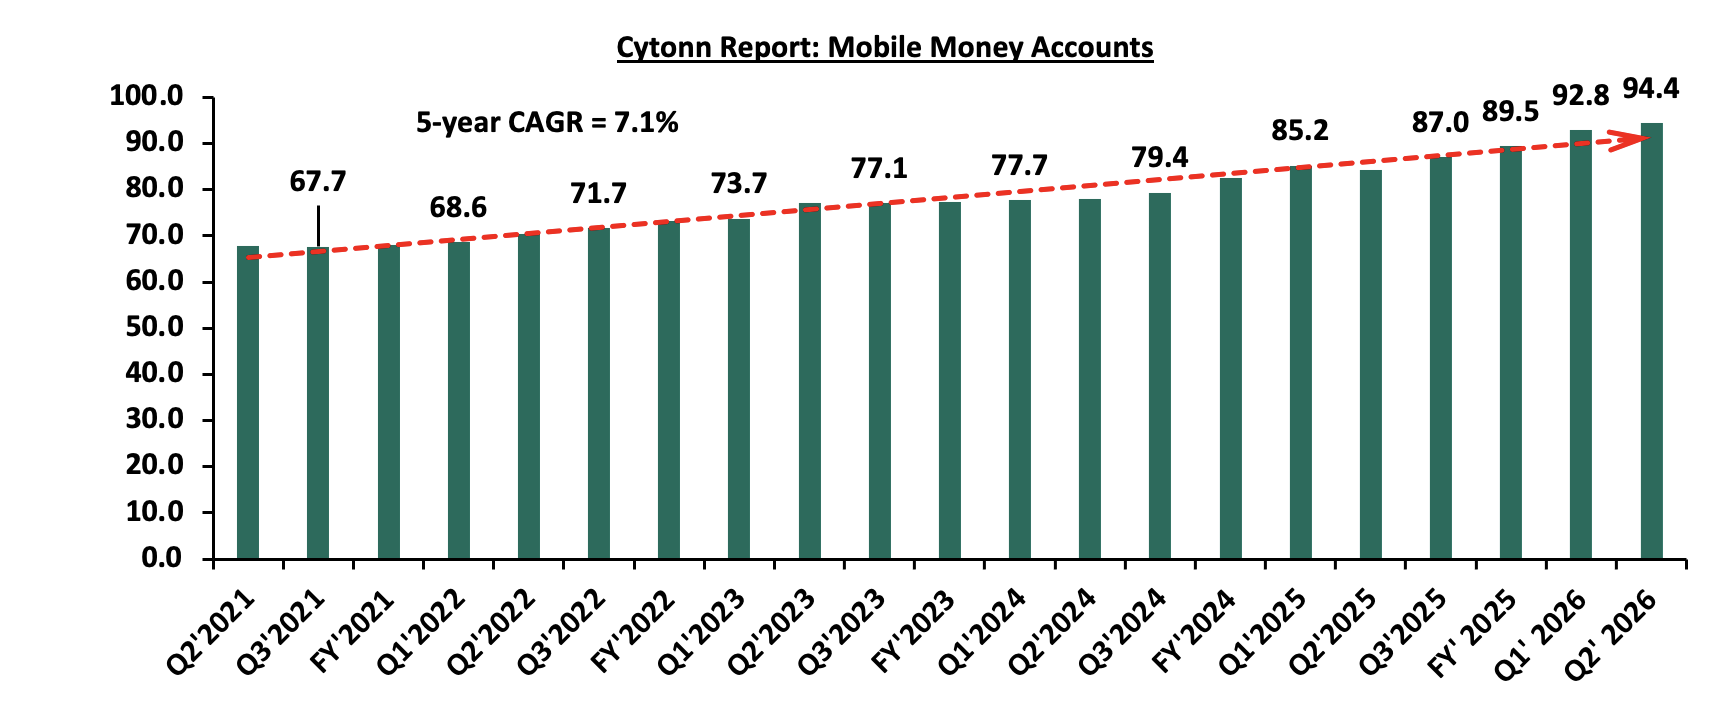
Adoption of Fintech: Digitization and automation within the industry have enhanced ease in cash accessibility, enabling investors to immediately access their investments via mobile payment platforms. According to the Central Bank of Kenya, more individuals are transacting through mobile money services as evidenced by the sustained growth in the total number of registered mobile money accounts. In July 2026, registered mobile money accounts recorded a 12.1% y/y increase to 94.4 mn accounts, from 84.2 mn accounts registered in a similar period in 2025. Notably, the total number of registered mobile money accounts also grew at a 5-year CAGR of 6.8% to 94.4 mn at the end of July 2026, from 67.8 mn recorded at the end of July 2021. The upward trajectory is attributable to Fintech incorporation which has increased the efficiency of processing both payments and investments for fund managers. As a result, Collective Investment Schemes have become more accessible to retail investors.
-
New approvals by CMA: The increase in CIS was partly driven by new approvals and additional funds registered in previous quarters that launched and commenced reporting in Q2’2026, alongside growth in existing CIS. Notably, four CIS reported for the first time during the quarter, namely Spearhead Africa Infrastructure Special Fund, Capital A Unit Trust Scheme, Ziidi Biashara Money Market Fund and Globetec Unit Trust Scheme, with combined AUM of Kshs 3.66 billion as at June 2026. As of 30 June 2026, there were 66 approved CIS comprising 320 funds, of which 47 were active.
Source: Central Bank of Kenya (CBK),
Spread of Investments:
|
Fund |
Q1’2026 (Kshs bn) |
Q2’2026 (Kshs bn) |
q/q Growth (Q1’2025 & Q2’2026) |
Q1’2025 Investment Share |
Q2’2026 Investment Share |
Change in investment share(% points) |
|
|
|
|
|
|
|
|
|
Money Market |
442.2 |
459.9 |
4.0% |
51.9% |
48.5% |
(3.4%) |
|
Special Funds |
203.5 |
252.8 |
24.2% |
23.9% |
26.6% |
2.7% |
|
Fixed Income |
199.0 |
228.1 |
14.6% |
23.4% |
24.0% |
0.7% |
|
Equity Fund |
4.8 |
5.8 |
23.0% |
0.6% |
0.6% |
0.1% |
|
Balanced Fund |
2.2 |
2.1 |
-4.5% |
0.3% |
0.2% |
(0.0%) |
|
Total |
851.7 |
948.7 |
11.4% |
100.0% |
100.0% |
|
Key take-outs from the table above include:
-
Money Market Funds: MMFs remained with the largest investment allocation, coming in at 48.5% in Q2’2026, a deterioration from 59.1% recorded in Q1’2026. However, the amounts invested in MMFs as of 30th June 2026 recorded a 4.0% increase to Kshs 459.2 bn, from Kshs 442.2 bn recorded at the end of Q1’2026. Notably, on a y/y basis the allocation in MMFs has declined by 14.0% points from 62.5% allocation recorded in Q2’2025, while on quarter to quarter basis the allocation in MMFs also declined by 3.4% points to 48.5% in Q2’2026 from 51.9% in Q1’2026, mainly attributable to the diversification of funds into other investment categories, including special funds. Moreover, the top three schemes which include, Sanlam Unit Trust Scheme, Standard Investment Trust Fund and CIC Unit Trust Scheme registered AUM above the 100.0 bn mark. This has led them to have a cumulative market share of 49.1% of the total market AUM. The high percentage of 48.5% in Q2’2026 is an indication of MMFs preference by the majority of investors due to their ease of investing and high liquidity, coupled with high returns during the period,
-
Special Funds recorded a 24.2% q/q growth to Kshs 252.8 bn in Q2’2026, up from Kshs 203.5 bn in Q1’2026, showing consistent growth after a 25.3% growth in Q1’2026 from Q4’2025. Notably, the allocation increased by 2.7% points to 26.6%, from the 23.9% recorded the previous quarter. This is mainly attributable to rising investor preference for specialized and flexible investment solutions.
-
Fixed Income Funds recorded a 14.6% q/q growth to Kshs 228.1 bn in Q2’2026, up from 199.0 bn in Q1’2026 Similarly, the allocation increased by 0.7% points to 24.0%, from the 23.4% recorded the previous quarter. This is mainly attributable to currency appreciation and improved liquidity positions over the period, and,
-
Equity Funds remained unchanged in their investment allocation at 0.6% at the end of Q2’2026, similar to Q1’2026. However, equity funds recorded a 20.8% q/q growth in AUM to Kshs 5.8 bn in Q2’2026, from Kshs 4.8 bn in Q1’2026. The increase in equity funds’ AUM was largely attributable to increased market activity, with the NSE 20 registering a 9.3% q/q gain in Q1’2026, following increased capital gains in major listed companies on the Nairobi Securities Exchange, such as Stanbic, Diamond Trust Bank, and BAT. This growth occurred despite a weakening business environment, with the Purchasing Managers’ Index (PMI) averaging 49.7 in Q2’2026, below the 50.0 threshold that separates expansion from contraction, and 1.5 points lower than the 51.2 average recorded in Q1’2026.
Notably, the overall UTFs portfolio remained predominantly invested in government securities, accounting for the largest share at 41.3% by the end of Q2’2026. Conversely, this represents 5.0% points decrease from the 46.3% allocation in Q1’2026, with the total value increasing by 70.5% to Kshs 391.7 bn in Q2’2026 from Kshs 229.7 billion in Q1’2026. This was followed by Fixed deposits at 24.3% allocation, 5.2% points decrease from 29.5% allocation in Q1’2025 due to the lower deposit rates provided by banking institutions during the period, following a maintenance in Central Bank Rate (CBR) after an easing cycle. The table below represents asset allocations in different asset classes comparing Q2’2025, Q1’2026 and Q2’2026 in the UTF industry.
|
Cytonn Report: Distribution of Unit Trust Funds Investments in terms of Asset Classes (Kshs bn) |
||||||
|
Fund |
Q2'2025 |
Q2'2025 (% of total AUM) |
Q1'2026 |
Q1'2026 (% of total AUM) |
Q2'2026 |
Q2'2026 (% of total AUM) |
|
Government Securities |
244.2 |
40.9% |
229.7 |
46.3% |
391.7 |
41.3% |
|
Fixed Deposits |
210.5 |
35.3% |
146.3 |
29.5% |
230.2 |
24.3% |
|
Offshore Listed Investments |
50.3 |
8.4% |
19.3 |
3.9% |
131.7 |
13.9% |
|
Cash and demand deposits |
58.8 |
9.9% |
72.2 |
14.6% |
126.3 |
13.3% |
|
Unlisted Securities |
17.1 |
2.9% |
13.7 |
2.8% |
39.2 |
4.1% |
|
Listed Securities |
6.2 |
1.0% |
7.2 |
1.4% |
20.7 |
2.2% |
|
Other Collective Investments schemes |
3.1 |
0.5% |
2.3 |
0.5% |
4.7 |
0.5% |
|
Alternative Investments |
4.8 |
0.8% |
4.3 |
0.9% |
4.1 |
0.4% |
|
Offshore Unlisted Investments |
1.5 |
0.2% |
1.3 |
0.3% |
- |
- |
|
Total |
596.3 |
100.0% |
496.2 |
100.0% |
948.7 |
100.0% |
According to the Capital Markets Authority, as of the end of Q2’2026, there were 66 approved Collective Investment Schemes (CISs) in Kenya, up from 62 recorded at the end of Q1’2026. Out of the 66 schemes, 47 of them (equivalent to 71.2%) were active while 19 (28.8%) were inactive. The table below outlines the performance of the Collective Investment Schemes comparing Q1’2026 and Q2’2026:
|
|
Cytonn Report: Assets Under Management (AUM) for the Approved Collective Investment Schemes |
|||||
|
No. |
Collective Investment Schemes
|
Q1'2026 AUM |
Q1’2026 |
Q2'2026 AUM |
Q2’2026 |
AUM Growth |
|
(Kshs mns) |
Market Share |
(Kshs mns) |
Market Share |
Q1'2026 – Q2'2026 |
||
|
1 |
Standard Investment Trust Fund |
153.2 |
16.1% |
188.6 |
19.9% |
23.2% |
|
2 |
Sanlam Unit Trust Scheme |
161.0 |
17.0% |
171.4 |
18.1% |
6.4% |
|
3 |
CIC Unit Trust Scheme |
103.2 |
10.9% |
105.2 |
11.1% |
2.0% |
|
4 |
Britam Unit Trust Scheme |
61.9 |
6.5% |
71.3 |
7.5% |
15.3% |
|
5 |
NCBA Unit Trust Scheme |
54.3 |
5.7% |
50.5 |
5.3% |
(6.9%) |
|
6 |
Old Mutual Unit Trust Scheme |
34.9 |
3.7% |
38.3 |
4.0% |
9.6% |
|
7 |
Jubilee Unit Trust Scheme |
26.9 |
2.8% |
32.9 |
3.5% |
22.2% |
|
8 |
Absa Unit Trust Funds |
29.4 |
3.1% |
31.4 |
3.3% |
6.6% |
|
9 |
Coop Unit Trust Scheme |
25.6 |
2.7% |
27.1 |
2.9% |
6.0% |
|
10 |
KCB Unit Trust Scheme |
22.0 |
2.3% |
26.0 |
2.7% |
18.1% |
|
11 |
Etica Unit Trust Fund |
20.6 |
2.2% |
24.9 |
2.6% |
20.8% |
|
12 |
ICEA Unit Trust Scheme |
23.2 |
2.4% |
23.7 |
2.5% |
2.2% |
|
13 |
Madison Unit Trust Funds |
17.8 |
1.9% |
20.6 |
2.2% |
15.8% |
|
14 |
Ziidi Money Market Fund |
18.2 |
1.9% |
19.9 |
2.1% |
9.2% |
|
15 |
Faida Unit Trust Funds |
15.8 |
1.7% |
19.4 |
2.0% |
23.3% |
|
16 |
Nabo Africa Funds |
13.7 |
1.4% |
14.8 |
1.6% |
8.1% |
|
17 |
11.0 |
1.2% |
14.2 |
1.5% |
28.6% |
|
|
18 |
Dry Associates Unit Trust |
8.4 |
0.9% |
9.7 |
1.0% |
16.0% |
|
19 |
Stanbic Unit Trust Funds |
5.9 |
0.6% |
7.0 |
0.7% |
19.3% |
|
20 |
CPF Unit Trust Scheme |
5.7 |
0.6% |
5.9 |
0.6% |
3.8% |
|
21 |
GenAfrica Unit Trust Scheme |
4.9 |
0.5% |
5.5 |
0.6% |
11.5% |
|
22 |
Lofty Corban Unit Trust Scheme |
5.2 |
0.5% |
5.5 |
0.6% |
5.4% |
|
23 |
Zimele Unit Trust |
5.0 |
0.5% |
5.4 |
0.6% |
8.1% |
|
24 |
Kuza Unit Trust Scheme |
4.3 |
0.5% |
4.7 |
0.5% |
9.1% |
|
25 |
Mayfair Unit Trust Funds |
3.9 |
0.4% |
4.1 |
0.4% |
6.5% |
|
26 |
Apollo Unit Trust Scheme |
3.6 |
0.4% |
3.9 |
0.4% |
10.6% |
|
27 |
Spearhead Africa Infrastructure (Special) Fund |
- |
0.0% |
3.4 |
0.4% |
- |
|
28 |
Cytonn UnitTrust Fund |
3.0 |
0.3% |
3.2 |
0.3% |
7.6% |
|
29 |
Enwealth Unit Trust |
2.0 |
0.2% |
2.2 |
0.2% |
11.6% |
|
30 |
Mali Money Market Fund |
2.2 |
0.2% |
2.2 |
0.2% |
(1.1%) |
|
31 |
Gulfcap Unit Trust Funds |
1.4 |
0.1% |
1.6 |
0.2% |
11.2% |
|
32 |
African Alliance Kenya Unit Trust |
1.6 |
0.2% |
1.3 |
0.1% |
(19.4%) |
|
33 |
Genghis Unit Trust Funds |
0.6 |
0.1% |
0.6 |
0.1% |
(2.7%) |
|
34 |
Orient Unit Trust Scheme |
0.6 |
0.1% |
0.6 |
0.1% |
(3.0%) |
|
35 |
Kibaba Unit Trust Funds |
0.5 |
0.0% |
0.3 |
0.0% |
(30.1%) |
|
36 |
Faulu Unit Trust Scheme |
0.3 |
0.0% |
0.3 |
0.0% |
5.9% |
|
37 |
Taifa Unit Trust Scheme |
0.3 |
0.0% |
0.3 |
0.0% |
6.6% |
|
38 |
Capital A Unit Trust Scheme |
- |
- |
0.2 |
0.0% |
- |
|
39 |
VCG Offshore Opportunities Special Fund |
0.1 |
0.0% |
0.2 |
0.0% |
104.8% |
|
40 |
Ziidi Shariah Money Market Fund |
0.1 |
0.0% |
0.2 |
0.0% |
40.8% |
|
41 |
Equity Investment Bank |
0.1 |
0.0% |
0.1 |
0.0% |
0.7% |
|
42 |
Ziidi Biashara Money Market Fund |
- |
- |
0.0 |
0.0% |
- |
|
43 |
Amana Unit Trust Funds |
0.0 |
0.0% |
0.0 |
0.0% |
17.6% |
|
44 |
XENO Unit Trust Funds |
0.0 |
0.0% |
0.0 |
0.0% |
6.0% |
|
45 |
Wanafunzi Fixed Income Fund |
0.0 |
0.0% |
0.0 |
0.0% |
(18.3%) |
|
46 |
Globetec Unit Trust Scheme |
- |
- |
0.0 |
0.0% |
- |
|
47 |
Jaza Unit Trust Fund |
0.0 |
0.0% |
0.0 |
0.0% |
107.9% |
|
|
Total |
852.1 |
100.0% |
948.7 |
100.0% |
11.3% |
Key take-outs from the above table include:
-
Assets Under Management: Standard Investment Trust Fund recorded a significant milestone during the quarter, overtaking Sanlam to become the largest Unit Trust Fund, accounting for 19.9% of the total market share. Its AUM grew by 23.1% to Kshs 188.6 bn in Q2’2026, from Kshs 153.2 bn in Q1’2026. The strong growth reflects increased investor uptake of the fund and reinforces Standard Investment Trust Fund’s position as a leading player in Kenya’s unit trust market,
-
Growth: In terms of AUM growth, Arvocap Unit trust funds recorded the highest growth of 28.6% with its AUM increasing to Kshs 14.2 bn, from Kshs 11.0 bn in Q1’2026. On the other hand, Kibaba Unit Trust Fund recorded the largest decline with its AUM declining by 30.1% to Kshs 0.3 mn in Q2’2026, from Kshs 0.5 mn in Q1’2026,
-
Market Share: Standard Investment Trust Fund was the largest overall Unit Trust Fund, for the first time in Q2’2026. Market share is an indication of increasing competition as new collective schemes enter the market,
-
19 UTFs remained inactive as at the end of Q2’2026: 19 UTFs remained inactive as at the end of Q2’2026, some of them include Ethical Opportunities Fund, Adam Unit Trust Fund, Masaru Unit Trust Fund, Dyer and Blair Unit Trust Scheme, Diaspora Unit Trust and Amaka Unit Trust remained inactive as at the end of Q2’2026.
Section II: Performance of Money Market Funds and Special Funds
-
Performance of Money Market Funds
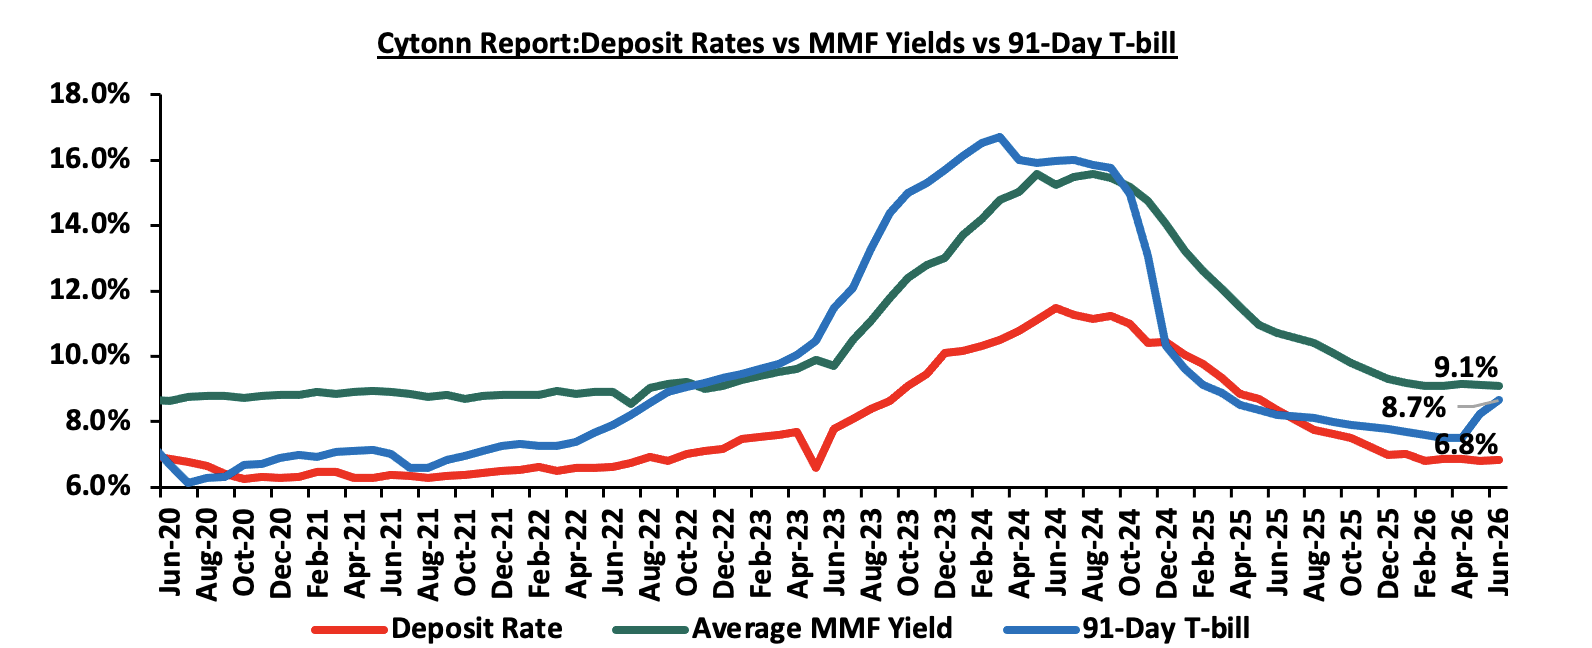
Money Market Funds (MMFs) in Kenya have been growing popularity in Kenya, mainly because they provide higher returns than bank deposits while also offering a high degree of security and liquidity. According to the Central Bank of Kenya data, the weighted average deposit rate in June 2026 decreased to 6.8% from 6.9% recorded in March 2026, lower than the June 2026 average yields of 91-day T-bill of 8.7% and lower than the June 2026 Money Market Fund average yield of at 9.1%. The graph below shows the performance of the Money Market Fund to other short-term financial instruments:
Source: Central Bank of Kenya, Cytonn Research
According to capital markets Collective Investments Schemes (CIS) Regulations 2023, MMFs should be invested in short-term, liquid, interest-bearing securities with a maximum weighted tenor to maturity of 18 months or less. These securities include treasury bills, call deposits, commercial papers, and fixed deposits in commercial banks and deposit-taking institutions, as specified by the Central Bank of Kenya (CBK). Consequently, MMFs are ideal for investors seeking a low-risk investment that ensures capital preservation and liquidity while offering competitive returns. They also serve as a safe haven for investors transitioning from high-risk portfolios to more stable, low-risk options, particularly during periods of market uncertainty.
Money Market Funds in Kenya accounted for Kshs 459.9 bn which makes up 48.5% of all the funds under management by Collective Investment Schemes for Q2’2026. This is 4.0% higher than the Kshs 442.2 bn recorded at the end of Q1’2026.
Money Market funds as an asset class are still below the potential, with Kenya’s MMF assets to GDP coming in at 2.6% as of Q2’2026, which is below the global average MMF assets to GDP ratio of 10.7% as of Q1’2026. More needs to be done to increase the ratio, especially at a time when the government is trying to increase savings to GDP ratio. Notably, the 2.6% Money market AUM to GDP in Kenya represents a marginal 0.1% points increase from the 2.5% figure recorded in Q1’2026. The Money markets remain highly competitive compared to other traditional investment options despite the falling yields. The chart below shows the performance of the Money Market Funds AUM to GDP in the last five years.
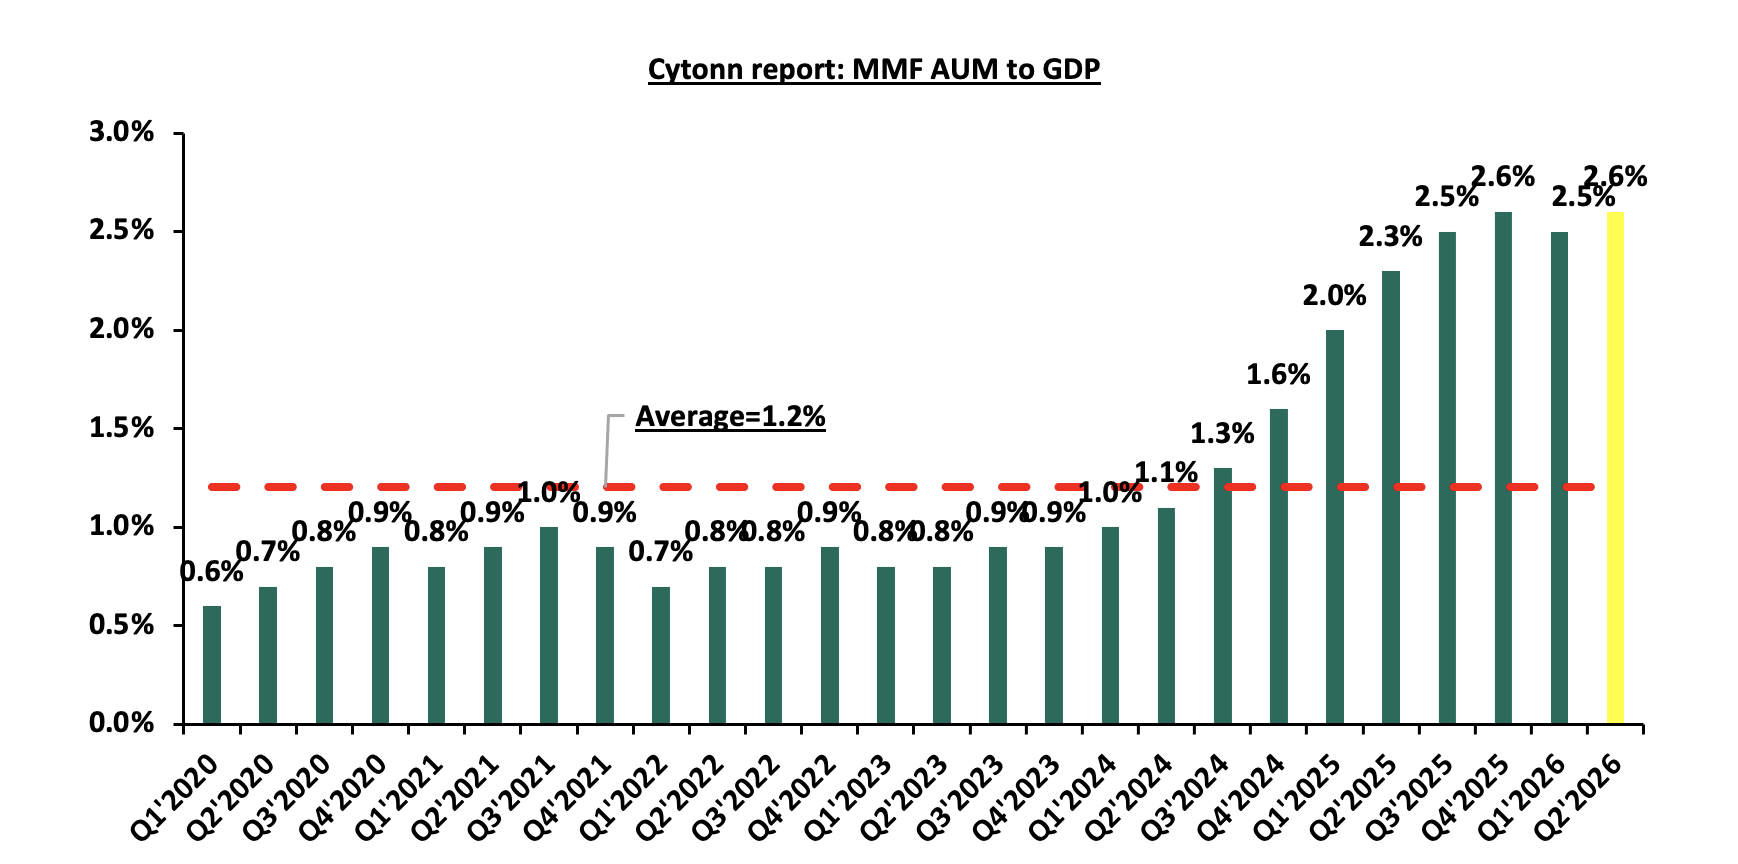
Source: CMA, Central Bank of Kenya
The chart below shows the performance of the Money Market Funds AUM to GDP comparing Kenya to other economies as at Q2’2026:
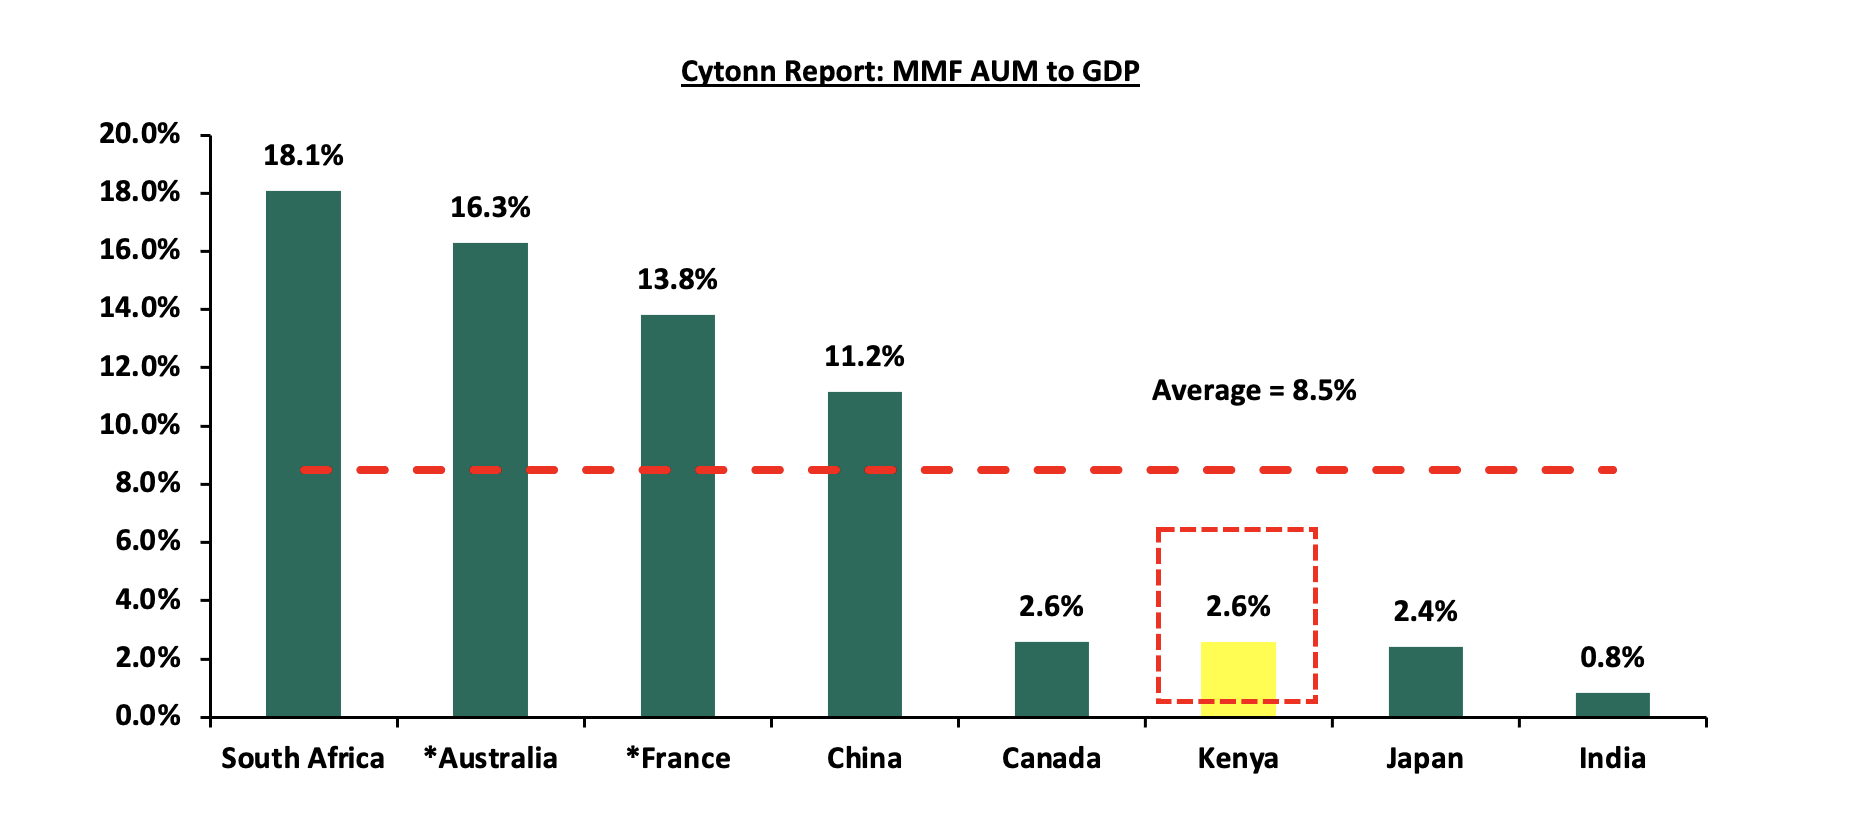
Source: World Bank, CMA, EFAMA
Top Five Money Market Funds by Yields
During the period under review, Cytonn Money Market Fund maintained a strong performance, ranking second among Money Market Funds with an average effective annual yield of 11.9%, outperforming the industry Q2’2026 average of 9.1%;
|
Cytonn Report: Top 5 Money Market Fund Yield in Q2’2026 |
||
|
Rank |
Money Market Fund |
Effective Annual Rate (Average Q2’2026) |
|
1 |
Nabo Africa Money Market Fund |
12.4% |
|
2 |
Cytonn Money Market Fund |
11.9% |
|
3 |
Etica Money Market Fund |
11.5% |
|
4 |
Arvocap Money Market Fund |
10.8% |
|
5 |
Lofty-Corban Money Market Fund |
10.7% |
|
Average of Top 5 Money Market Funds |
11.4% |
|
|
Industry average |
9.1% |
|
Source: Cytonn Research, Daily Nation
-
Performance of Special Funds
Special Funds have emerged as the fastest-growing segment of Kenya's collective investment schemes market, and now rival Fixed Income Funds for the position of second-largest fund category. In Q2'2026, Special Funds' AUM stood at Kshs 252.8 bn, representing 26.6% of total CIS assets under management, up from Kshs 203.5 bn in Q1'2026; a quarter-on-quarter growth of 24.0%, the highest of any fund category, ahead of Equity Funds at 23.0% and Fixed Income Funds at 15.0%.
This growth continues a multi-year trend: Special Funds' share of total CIS AUM has risen steadily from around 5.0-6.0% between 2020 and 2022, to 17.0-20.0% through 2024, and now to 27.0% as of June 2026, even as Money Market Funds' dominance has fallen from over 90.0% in 2020 to 48.5% today. The chart below shows special funds share of total CIS AUM.
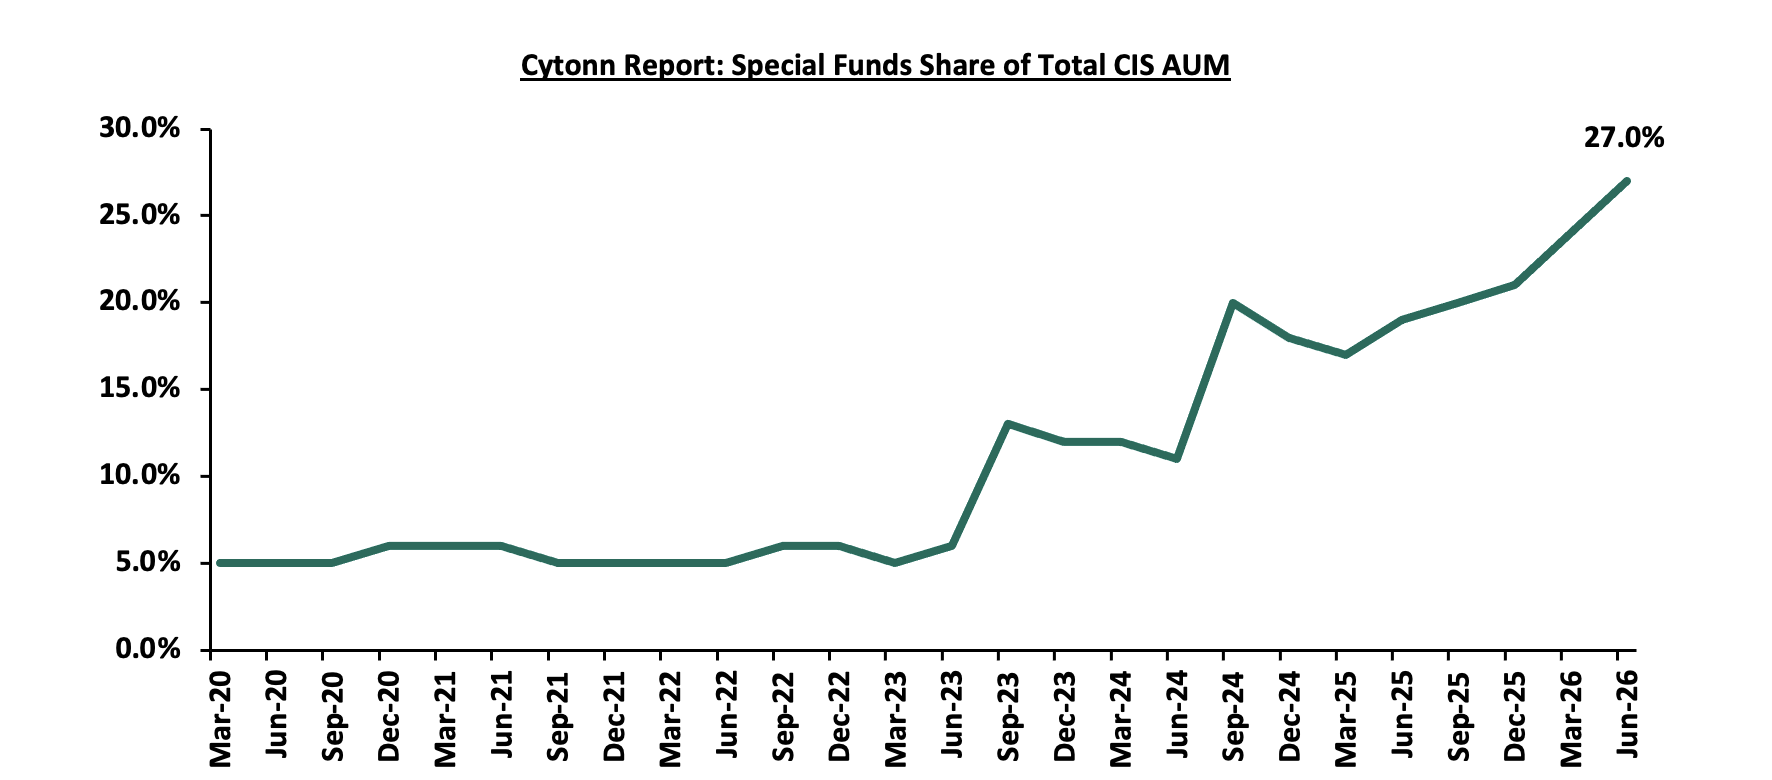
Source: Capital Markets Authority
What distinguishes Special Funds structurally is where the money goes. Under the CIS Regulations 2023, Money Market Funds are confined to short-tenor, domestic, interest-bearing instruments, leaving Special Funds as the primary vehicle through which Kenyan fund managers offer retail and institutional investors exposure to offshore markets and alternative assets. Fully 50.0% of Special Funds' AUM Kshs 126.4 bn is held offshore, versus 13.9% for the CIS industry overall, meaning Special Funds account for 96.0% of all offshore assets and 97.0% of all alternative investments held across the entire Kenyan CIS industry. The chart below shows asset class allocation of special Funds vs Total CIS as of Q2’2026
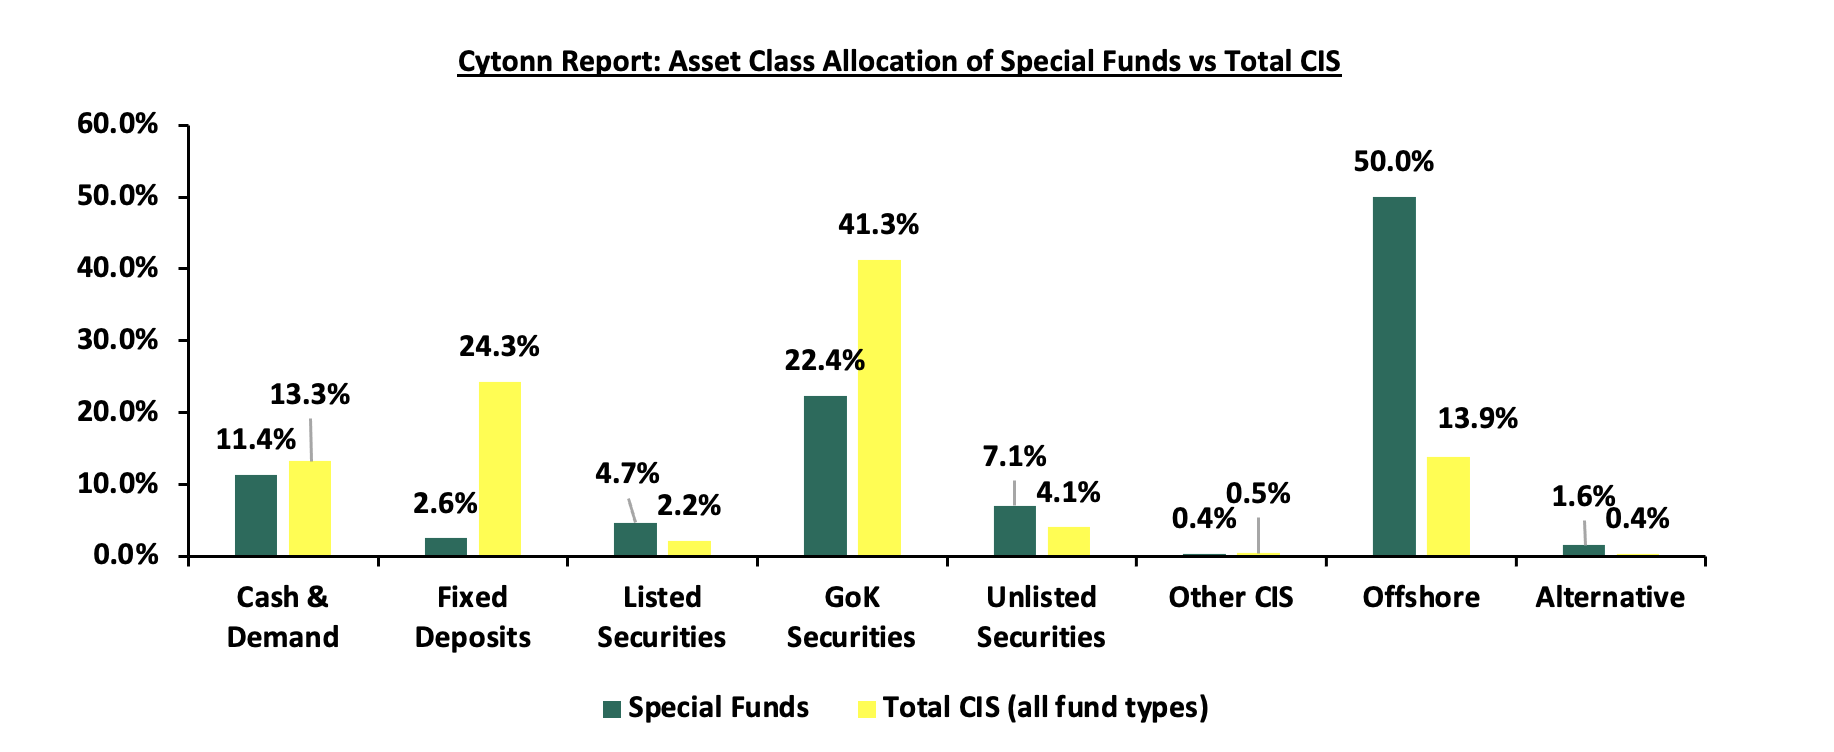
The Special Funds segment remains highly concentrated. Standard Investment Trust Fund's Mansa-X Special Fund (KES) alone commands a 64.8% share of all Special Funds AUM, with its USD variant adding a further 8.1%. Faida's Oak Multi Asset Special KES Fund is the third-largest at 7.5%, followed by Madison Wealth Fund at 4.1% and Britam Special Fixed Income Fund at 2.5%. Four new Special Funds also commenced reporting in Q2'2026, including the Spearhead Africa Infrastructure Special Fund, reflecting continued product innovation by fund managers seeking to diversify beyond traditional money market and fixed income offerings. The table below shows the assets under management for special funds in Kenya;
|
Cytonn Report: Assets Under Management (AUM) for Special Funds |
||||
|
No |
Unit Trust Scheme |
Fund |
Total (Kshs) |
Proportion |
|
1 |
Standard Investment Trust Fund |
Mansa-X Special Fund KES |
163.8 |
64.8% |
|
2 |
Standard Investment Trust Fund |
Mansa-X Special Fund USD |
20.6 |
8.1% |
|
3 |
Faida Unit Trust Funds |
Oak Multi Asset Special KES Fund |
19.0 |
7.5% |
|
4 |
Madison Unit Trust Funds |
Madison Wealth Fund |
10.4 |
4.1% |
|
5 |
Britam Unit Trust Scheme |
Britam Special Fixed Income Fund |
6.4 |
2.5% |
|
6 |
Old Mutual Unit Trust Scheme |
Old Mutual Special Fixed Income |
5.6 |
2.2% |
|
7 |
Etica Unit Trust Fund |
Etica Special Multi Asset Fund |
4.2 |
1.7% |
|
8 |
Standard Investment Trust Fund |
Mansa-X Shariah Special Fund KES |
3.6 |
1.4% |
|
9 |
Spearhead Africa Infrastructure (Special) Fund |
Spearhead Africa Infrastructure (Special) Fund |
3.4 |
1.3% |
|
10 |
Arvocap Unit Trust Funds |
Arvocap Multi-Asset Strategy Special Fund |
2.6 |
1.0% |
|
11 |
NCBA Unit Trust Scheme |
NCBA Global Fixed Income Special (USD) Fund |
1.9 |
0.7% |
|
12 |
NCBA Unit Trust Scheme |
NCBA Global Equity Special (USD) Fund |
1.4 |
0.5% |
|
13 |
Etica Unit Trust Fund |
Etica Special Wealth Fund |
1.1 |
0.4% |
|
14 |
KCB Unit Trust Scheme |
KCB Wealth Special Fund |
0.9 |
0.4% |
|
15 |
Kuza Unit Trust Scheme |
Kuza Momentum Special Fund |
0.9 |
0.4% |
|
16 |
Cytonn Unit Trust Fund |
Cytonn High Yield Special Fund |
0.9 |
0.3% |
|
17 |
Lofty Corban Unit Trust Scheme |
Lofty Corban Private Debt Special Fund |
0.9 |
0.3% |
|
18 |
Arvocap Unit Trust Funds |
Arvocap Global Equity Special Fund |
0.8 |
0.3% |
|
19 |
Arvocap Unit Trust Funds |
Arvocap Africa Equity Special Fund |
0.7 |
0.3% |
|
20 |
Dry Associates Unit Trust |
Dry Associates Special High Yield Fund KES |
0.6 |
0.2% |
|
21 |
Standard Investment Trust Fund |
Mansa-X Shariah Special Fund USD |
0.6 |
0.2% |
|
22 |
Faida Unit Trust Funds |
Oak Multi Asset Special USD Fund |
0.4 |
0.2% |
|
23 |
Sanlam Unit Trust Scheme |
SanlamAllianz Special Fund Sterling Fixed Income Fund |
0.3 |
0.1% |
|
24 |
Kibaba Unit Trust Funds |
Kibaba Multi-Asset Special Fund (KES) |
0.2 |
0.1% |
|
25 |
CIC Unit Trust Scheme |
CIC Special Wealth Fund |
0.2 |
0.1% |
|
26 |
CIC Unit Trust Scheme |
CIC Global Balanced Fund Special Fund |
0.2 |
0.1% |
|
27 |
Arvocap Unit Trust Funds |
Arvocap Eurofix Fixed Income Special Fund |
0.2 |
0.1% |
|
28 |
Gulfcap Unit Trust Funds |
GCIB Multi Asset Special Fund |
0.2 |
0.1% |
|
29 |
VCG Offshore Opportunities Special Fund |
VCG Offshore Multi-Asset Special Fund (USD) |
0.1 |
0.1% |
|
30 |
African Alliance Kenya Unit Trust Scheme |
AA Kenya Special Fund |
0.1 |
0.1% |
|
31 |
VCG Offshore Opportunities Special Fund |
VCG Offshore Fixed Income Special Fund (USD) |
0.1 |
0.0% |
|
32 |
Capital A Unit Trust Scheme |
Capital A Multi Asset Strategy Special Fund (KES) |
0.1 |
0.0% |
|
33 |
Etica Unit Trust Fund |
Etica Special Shariah Fund |
0.1 |
0.0% |
|
34 |
Kibaba Unit Trust Funds |
Kibaba Multi-Asset Special Fund (USD) |
0.1 |
0.0% |
|
35 |
Arvocap Unit Trust Funds |
Arvocap Mabruk Sharia Special Fund |
0.1 |
0.0% |
|
36 |
Arvocap Unit Trust Funds |
Arvocap Global Sharia Special Fund |
0.0 |
0.0% |
|
37 |
Lofty Corban Unit Trust Scheme |
Lofty Corban Global Assets Special Fund |
0.0 |
0.0% |
|
38 |
Gulfcap Unit Trust Funds |
GCIB Shariah Multi Asset Special Fund |
0.0 |
0.0% |
|
39 |
Etica Unit Trust Fund |
Etica Special Shariah Fund USD |
0.0 |
0.0% |
|
40 |
Kuza Unit Trust Scheme |
Kuza Shariah Momentum Fund |
0.0 |
0.0% |
|
41 |
VCG Offshore Opportunities Special Fund |
VCG Diversified Commodities Special Fund (USD) |
0.0 |
0.0% |
|
42 |
VCG Offshore Opportunities Special Fund |
VCG Offshore Money Market Special Fund (USD) |
0.0 |
0.0% |
|
Total Special Funds AUM |
252.8 |
100% |
||
Section III: Comparison between Unit Trust Funds AUM Growth and Other Markets
Unit Trust Funds’ assets recorded a q/q growth of 11.4% in Q2’2026. On the other hand, banks’ deposits recorded a growth of 2.4% in Q2’2026 to Kshs 6.7 tn from the Kshs 6.5 tn recorded in Q1’2026, translating to 1.4% points decline from the 1.6% points increase recorded in Q1’2026. For the Unit Trust Funds, the q/q growth of 11.4% was a decrease of 1.2% points, from the 12.6% growth recorded in Q1’2026. The chart below highlights the quarter-on-quarter AUM growths for Unit Trust Funds AUM vs Listed banks’ deposits growth since 2024:
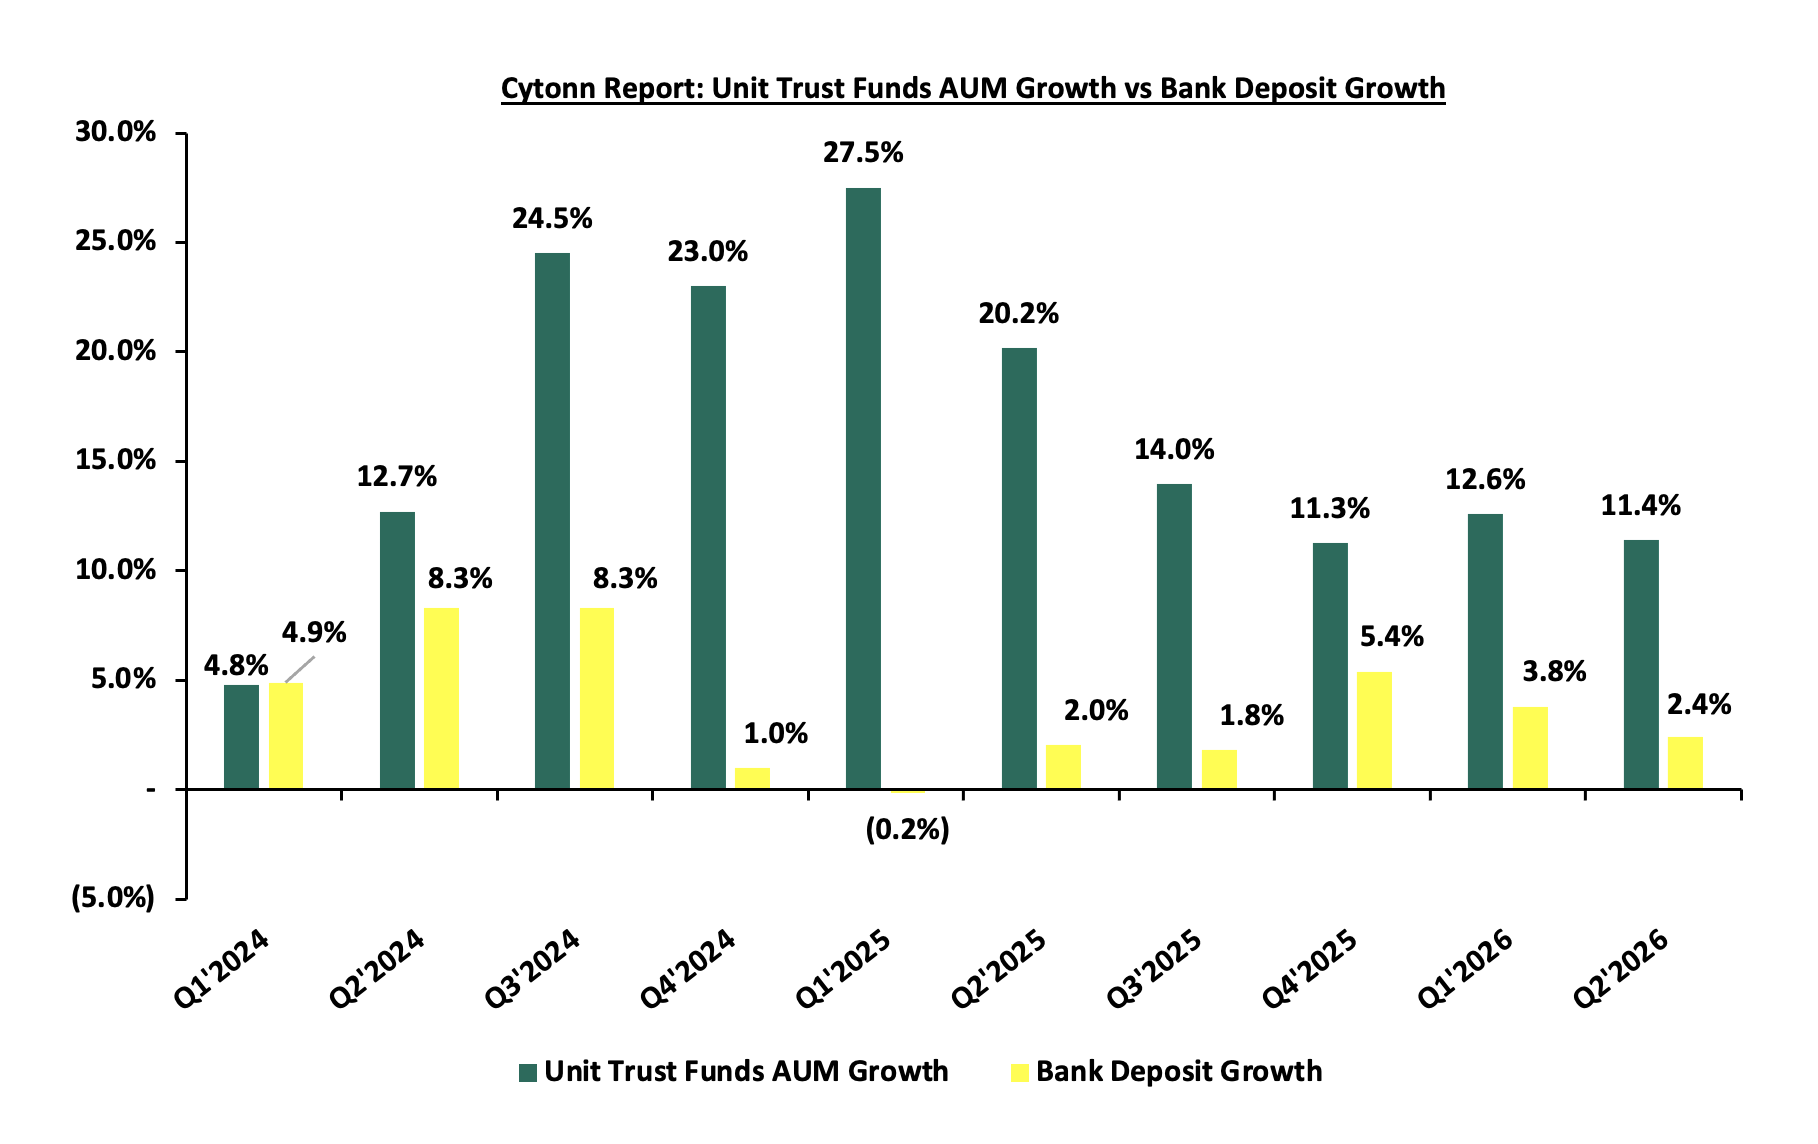
Source: CBK Credit Surveys, CIS Report
We note that there was an 11.4% q/q increase in UTF AUM which can be attributed to the overall growth reported by existing CIS funds as well as additional funds registered by existing umbrella schemes and commenced reporting in Q2’2026. The increase can also be attributed to intensified marketing efforts by the fund managers. The increase was achieved despite relatively lower returns in the collective investment schemes, especially the MMFs. As at June 2026, Money Market Funds offered an average return of 9.1% for Q2’2026, lower than the 9.2% average recorded in Q1’2026, while bank deposits offered an average of 6.8%, lower than the 6.9% average recorded in Q1’2026. We therefore anticipate an expansion in business funding coming from capital markets from the current 5.0%, in the short-term to medium term due to Kenya’s economic growth and improved investor confidence and awareness. World Bank statistics reveal that in efficient economies, only 40.0% of business financing comes from banks, while a significant 60.0% is sourced from Capital markets. However, in Kenya, the scenario is quite different. The World Bank points out that Kenyan businesses depend on banks for a whopping 95.0% of their funding, with only 5.0% being raised from the capital markets.
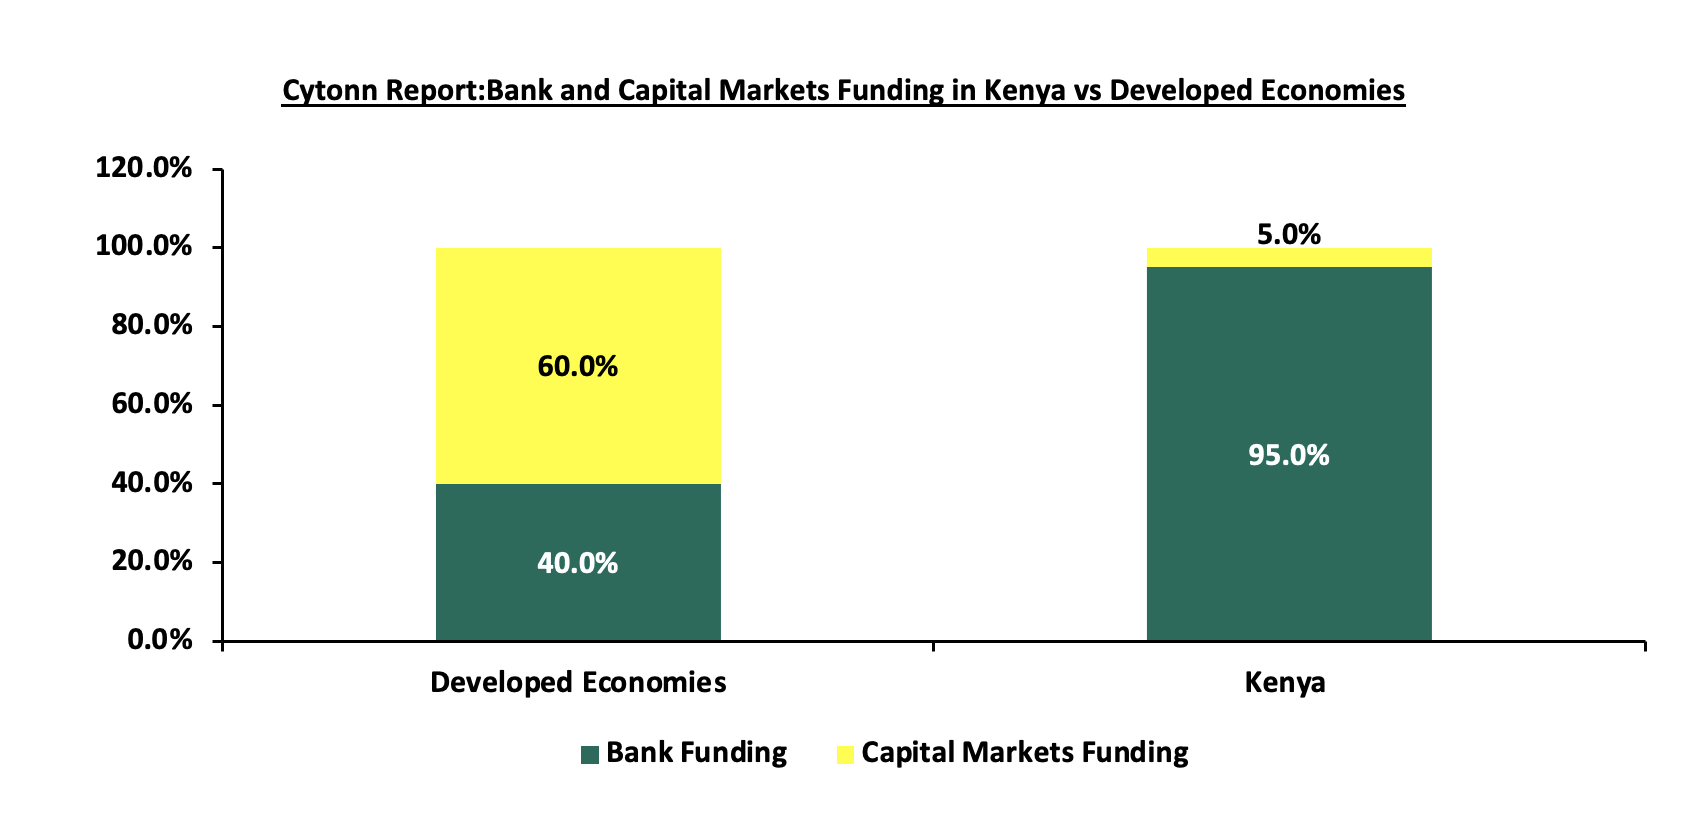
Source: World Bank
Notably, Kenya’s Mutual Funds/UTFs to GDP ratio at the end of Q2’2026 came in at 5.4%, significantly lower compared to an average of 50.8% amongst select global markets an indication of a need to continue enhancing our capital markets. Additionally, Sub-Saharan African countries such as South Africa and Namibia have higher mutual funds to GDP ratios coming in at 61.5% and 43.1%, respectively as of the latest data of 2020, compared to Kenya. The chart below shows select countries’ mutual funds as a percentage of GDP as at June 2026:
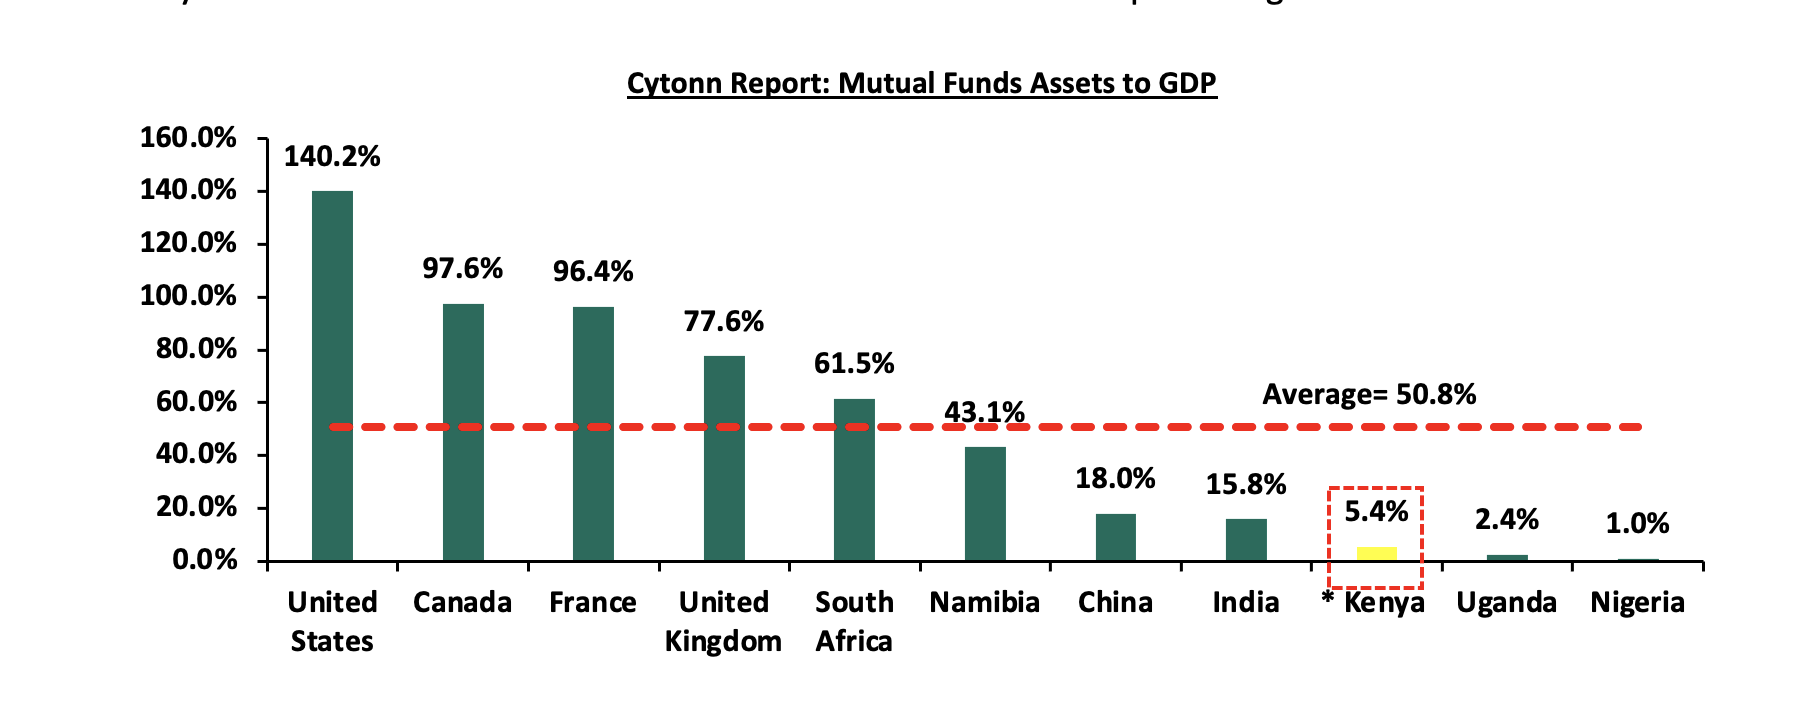
*Data as of June 2026
Source: World Bank Data
In the last five years, the Assets Under Management (AUM) of Unit Trust Funds (UTFs) have shown a remarkable performance, having grown at a 5-year CAGR of 51.8% to Kshs 948.7 bn in Q2’2026, from Kshs 117.7 bn in Q2’2021. However, the industry is still dwarfed when compared to other deposit-taking institutions such as bank deposits, with the entire banking sector deposits coming in at Kshs 6.7 tn as at June 2026 from Kshs 5.8 tn recorded in June 2025. Similarly, the pension industry recorded an increase of 25.1%, to 3.2 tn as of June 2026 from Kshs 2.5 tn recorded in June 2025. Below is a graph showing the sizes of different saving channels and capital market products in Kenya;
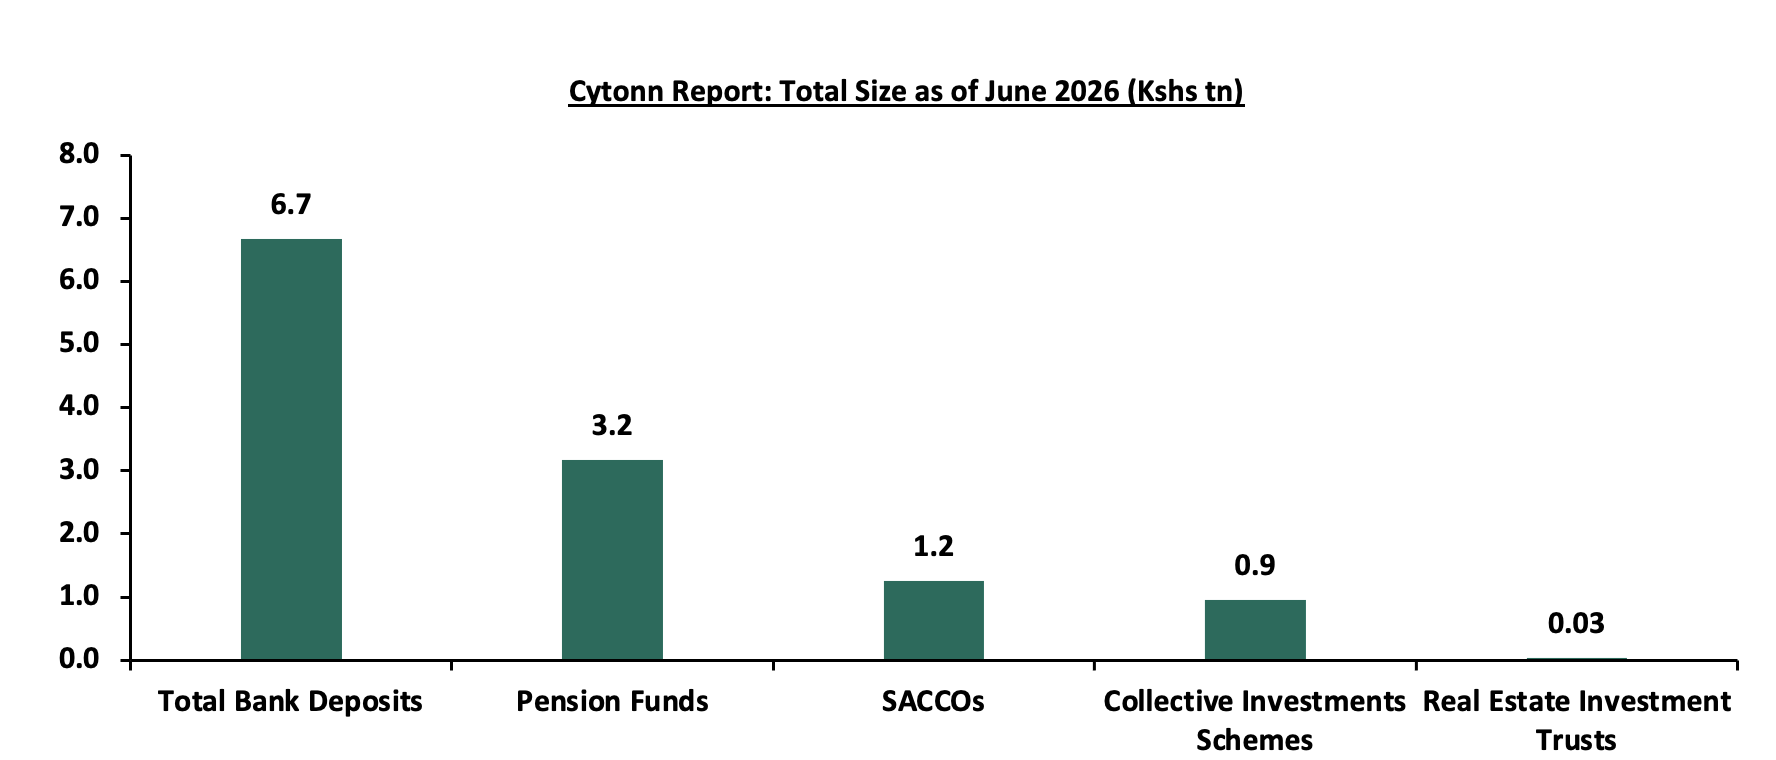
Data as of June 2026
Source: CMA, RBA, CBK, SASRA Reports and REITs Financial Statements
Comparing other Capital Markets products like REITS, Kenya's REIT market faces additional challenges due to its relatively underdeveloped capital markets, especially when compared to countries like South Africa. Currently, there are three listed REITs in Kenya, which are not actively trading. Most property developers in Kenya continue to rely on traditional funding sources, such as banks, unlike in more developed markets.Kenya's REIT market currently comprises five authorized funds, though their market segments and trading status vary considerably. While the sector has expanded significantly in 2026, most REITs continue to trade outside the NSE's main market segment. Until recently, LAPTrust Imara I-REIT was the sole publicly listed REIT in Kenya, trading on the NSE's restricted market sub-segment since its listing. Notably, Imara was structured without a capital raise, distinguishing it from the traditional REIT model. Following the delisting of ILAM Fahari I-REIT in February 2024, Imara retained its status as the country's only listed REIT for over two years. This changed in March 2026 with the listing of ALP Industrial REIT on the NSE's Main Investment Market Segment, marking a significant milestone as the region's first industrial REIT. In June 2026, the market experienced further expansion with the listing of TRIFIC I-REIT, a green-focused, USD-denominated income REIT that successfully closed an oversubscribed Kshs 5.0 billion offering on June 29, 2026. Three additional authorized REITs, ILAM Fahari I-REIT, Acorn I-REIT, and D-REIT remain unlisted and trade exclusively on the NSE's Unquoted Securities Platform (USP), an over-the-counter market. The table below outlines all REITs authorized by the Capital Markets Authority (CMA) in Kenya:
|
Cytonn Report: Authorized REITs in Kenya |
||||||
|
# |
Issuer |
Name |
Type of REIT |
Listing Date |
Market Segment |
Status |
|
1 |
Two Rivers International Finance and Innovation Centre (TRIFIC) Special Economic Zone |
TRIFIC I-REIT |
I-REIT |
June 2026 |
Main Investment Market Segment of the NSE |
Trading |
|
2 |
Africa Logistics Properties |
ALP Industrial REIT |
I-REIT |
March 2026 |
Restricted Market Sub-Segment of the Main Investment Market |
Restricted |
|
3 |
ICEA Lion Asset Management (ILAM) |
Fahari |
I-REIT |
July 2024 |
Unquoted Securities Platform (USP) |
Trading |
|
4 |
Acorn Holdings Limited |
Acorn Student Accommodation (ASA) – Acorn ASA |
I-REIT |
February 2021 |
Unquoted Securities Platform (USP) |
Trading |
|
5 |
Acorn Holdings Limited |
Acorn Student Accommodation (ASA) – Acorn ASA |
D-REIT |
February 2021 |
Unquoted Securities Platform (USP) |
Trading |
|
6 |
Local Authorities Pension Trust (LAPTrust) |
Imara |
I-REIT |
March 2023 |
Restricted Market Sub-Segment of the Main Investment Market |
Restricted |
Source: Nairobi Securities Exchange, CMA
The listed REITs’ capitalization as a percentage of GDP in Kenya stood at 0.2% as of June 2026, compared to 6.7% in Australia and 3.4% in South Africa as of June 2026. This reflects the challenges faced by the Kenya's REIT market, especially when compared to countries like South Africa. Below is a graph showing a comparison of Kenya’s REITs to Market Cap Ratio to that of the US, UK, Australia and South Africa as at June 2026:
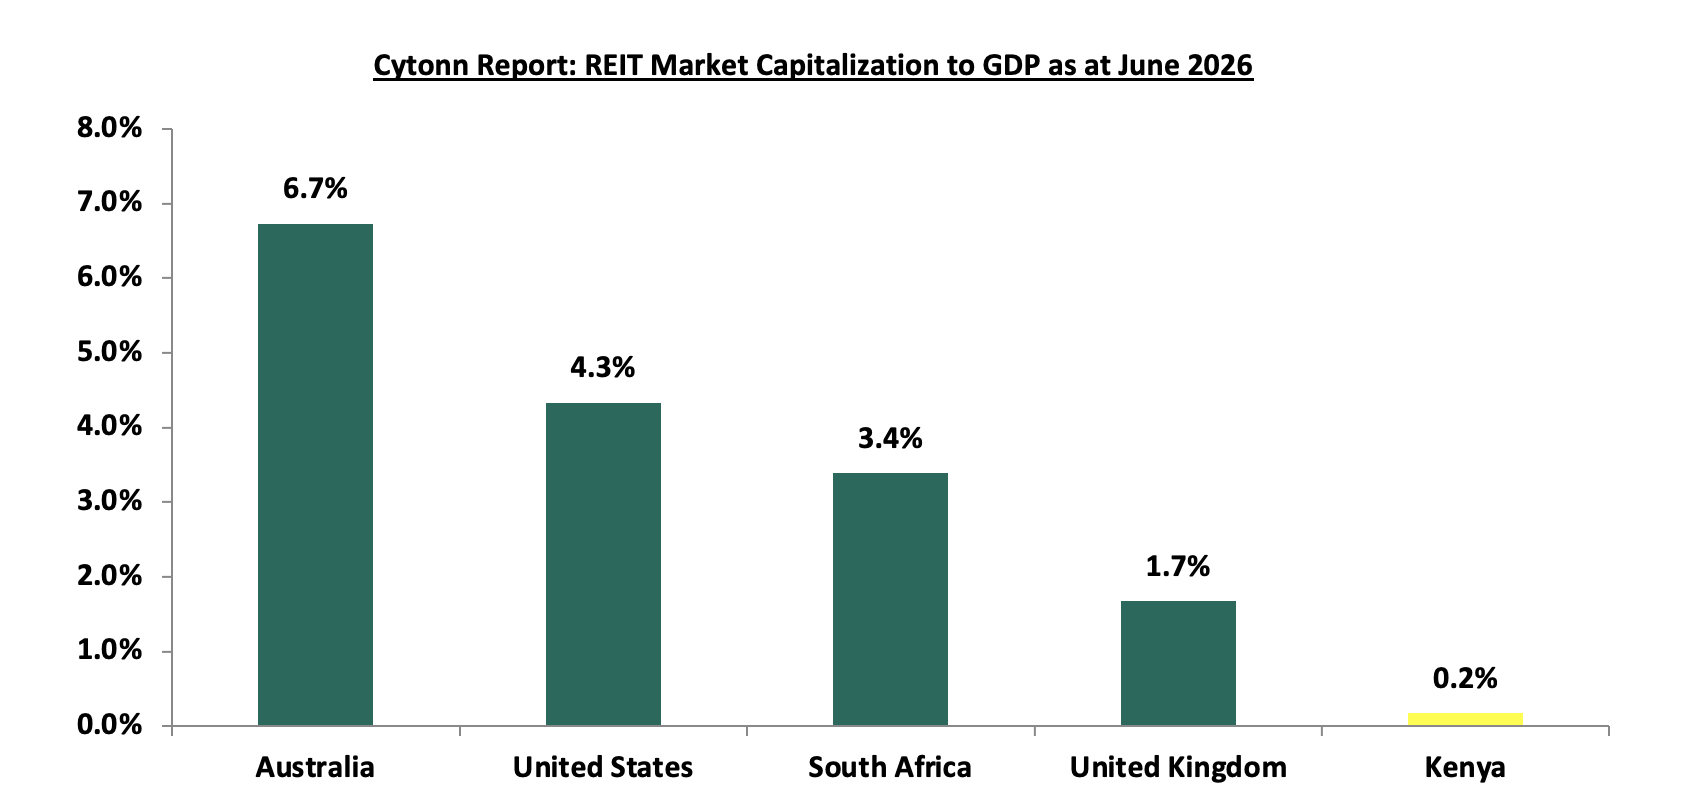
Data as of June 2026
Source: Online Research, Nairobi Securities Exchange (NSE)
Section IV: Recommendations and Conclusion
The Kenyan Collective Investment Schemes (CIS) sector continued to demonstrate strong growth and increasing relevance within the capital markets during Q2’2026. Developments during the quarter point to a sector that is becoming more diverse, accessible and competitive, supported by the expansion of investment products, greater use of digital distribution channels and continued regulatory developments. Going forward, sustaining this growth will require a regulatory and operating environment that encourages innovation while strengthening investor protection, transparency and risk management. To sustain the sector’s expansion and strengthen its contribution to Kenya’s capital markets, we recommend the following:
-
Encourage innovation and diversification of investment products: While the CIS sector has experienced strong growth, there remains significant room for product diversification beyond traditional investment structures. The regulator should continue encouraging the development of alternative and specialized funds such as infrastructure funds, private credit funds, thematic funds, and sector-focused funds. Expanding the range of investment products would provide investors with greater portfolio diversification opportunities while also supporting capital formation in key sectors of the economy.
-
Strengthen the framework for Special and alternative investment funds: The growing prominence of Special Funds and alternative investment products underscores the need for an appropriate regulatory framework that supports innovation while safeguarding investors. Greater emphasis should be placed on transparency around investment strategies, valuation, liquidity, risk and fees, particularly for products with more complex or less liquid underlying assets.
-
Promote competition and a broader range of market participants: The continued entry of new players into the CIS market is positive for innovation and investor choice. The regulator should maintain an enabling environment for new fund managers and other market participants while ensuring consistent regulatory and governance standards. Increased competition should ultimately translate into better products, service quality and value for investors.
-
Strengthen oversight of digital investment channels: The expansion of digital platforms provides an important avenue for widening access to CIS products, particularly among retail investors. As digital distribution grows, regulatory oversight should keep pace with developments in technology, with particular attention to investor protection, disclosure, cybersecurity, operational resilience and the clear allocation of responsibilities between platforms and regulated CIS providers.
-
Strengthen liquidity management and risk-management frameworks: The continued growth and diversification of CIS portfolios increases the importance of effective liquidity and risk management. Fund managers should maintain appropriate liquidity-management frameworks, conduct regular stress testing and ensure that investment strategies remain consistent with the liquidity requirements and redemption terms of individual funds.
-
Enhance investor education and financial literacy: As the range of CIS products and channels through which investors can access them expands, investor education should remain a key priority. Initiatives should increasingly focus on helping investors understand differences in risk, return, liquidity, fees and investment horizons across products. This will support informed decision-making and promote sustainable growth in retail participation.
As Kenya’s financial sector continues to evolve, Unit Trust Funds are becoming an increasingly important channel for mobilizing domestic savings and broadening access to investment opportunities. The continued expansion of investor participation, product offerings and digital distribution highlights the growing role of CIS in deepening Kenya’s capital markets. Policymakers should therefore maintain a balance between encouraging innovation and competition and strengthening investor protection, transparency and risk management. A regulatory environment that supports this balance will be critical to sustaining the sector’s growth, deepening capital markets and attracting a wider pool of local and international investors.
Disclaimer: The views expressed in this publication are those of the writers where particulars are not warranted. This publication is meant for general information only and is not a warranty, representation, advice or solicitation of any nature. Readers are advised in all circumstances to seek the advice of a registered investment advisor.

- Talk to us
- Kenya
- P.O Box 20695 - 00200, Nairobi, Kenya
- Cell +254709101200
- Tel +254709101200
- WhatsApp +254741676635
- United States
- +254709101200
- DOWNLOAD OUR APP
-


- Kenya
- 8th Floor, Pinetree Plaza, Kaburu Drive, Ngong Road, Nairobi, Kenya
- USA
- Suite 1150, 1775 Eye Street NW, USA, Washington DC 20006, USA
- Investments
- High Yield
- Private Equity
- Real Estate
- Real Estate
- RiverRun Estates
- Cytonn Towers
- The Ridge
- Taraji Heights
- The Alma