Sub- Saharan Africa Financial Services Report 2026, &Cytonn Weekly #22/2026
By research team, Jun 7, 2026
Executive Summary
Fixed Income
During the week, T-bills were oversubscribed for the first time in two weeks, with the overall subscription rate coming in at 227.4%, significantly higher than the subscription rate of 69.3%, recorded the previous week. Investors’ preference for the shorter 91-day paper persisted, with the paper receiving bids worth 32.8 bn against the offered Kshs 4.0 bn, translating to a subscription rate of 820.7%, significantly higher than the subscription rate of 352.3%, recorded the previous week. The subscription rate for the 182-day paper significantly increased to 65.3% from 10.5% recorded the previous week, while that of the 364-day paper increased significantly to 153.3% from 14.9% recorded the previous week. The government accepted a total of Kshs 54.55 bn worth of bids out of Kshs 54.58 bn bids received, translating to an acceptance rate of 99.9%. The yields on the government papers were on an upward trajectory with the yields on the 182-day paper increasing the most by 27.5 bps to 8.5% from the 8.3% recorded the previous week. The yields on the 91-day paper increased by 17.0 bps to 8.6% from the 8.4% recorded the previous week, while the yields on the 364-day paper increased by 13.6 bps to 8.8% from the 8.6% recorded the previous week;
During the week, the Central Bank of Kenya released the auction results for the re-opened treasury bonds FXD1/2020/015 and FXD1/2018/025 with tenors to maturities of 8.7 years and 17.1 years respectively and fixed coupon rates of 12.8% and 13.4% respectively. The bonds were undersubscribed, with the overall subscription rate coming in at 86.0%, receiving bids worth Kshs 34.4 bn against the offered Kshs 40.0 bn. The government accepted bids worth Kshs 34.38 bn, translating to an acceptance rate of 99.97%. The weighted average yield for the accepted bids for the FXD1/2020/015 and FXD1/2018/025 came in at 13.3% and 14.2% respectively. Notably, the 13.3% and 14.2% yields on FXD1/2020/015 and FXD1/2018/025 were both higher than the 12.2% and 13.0% recorded at the last reopening on 6th April 2026;
We expect the MPC to maintain the Central Bank Rate (CBR) at 8.75%, with their decision mainly being supported by global monetary policy stance and the need to support the economy;
During the week, Stanbic Bank released its monthly Purchasing Manager’s Index (PMI) indicating that Kenya’s Purchasing Managers’ Index (PMI) declined by 2.8 points to 46.6 in May 2026 from 49.4 in April 2026, signaling the quickest decline in the health of the Kenyan private sector since July 2024, all the while remaining below the 50.0 neutral threshold for the third consecutive month;
Equities
During the week, the equities market was on an upward trajectory, with NSE 25 gaining by 2.3%, NASI by 2.3%, NSE 10 by 2.2% and NSE 20 by 1.3%, taking the YTD performance to gains of 13.3%, 13.1%, 12.3% and 11.5% for NSE 20, NSE 25, NASI and NSE 10 respectively. The week-on-week equities market performance was mainly driven by gains recorded by large cap stocks such as KCB, Stanbic and Equity of 6.0%, 5.8% and 4.0% respectively. However, the performance was weighed down by losses recorded by large cap stocks such as EABL, DTB-K and Coop of 3.0%, 2.9% and 0.5% respectively;
During the week, the banking sector index increased by 1.5% to 239.4 from 235.1 recorded the previous week. This is attributable to gains recorded by large cap stocks such as KCB, Stanbic and Equity of 6.0%, 5.8% and 4.0% respectively. However, the performance was also weighed down by losses recorded by large cap stocks such as Diamond Trust Bank, Coop and Standard Chartered of 3.0%, 0.5% and 0.5% respectively;
Real Estate
During the week, Nairobi hosted a wildlife photography exhibition that underscored the importance of biodiversity conservation, featuring imagery from the documentary “Yellow Sea Wetlands to African Savannas” and marking the second anniversary of the China-Africa Savannahs Biodiversity Conservation Forum;
During the week, Two Rivers announced plans to buy exits from the Real Estate Fund. Investors seeking to exit the Kshs 4.8 bn Two Rivers Income Real Estate Investment Trust (I-REIT) will now have an easier path after Two Rivers partnered with Nabo Capital to establish a dedicated liquidity fund. The fund has been capitalized with Kshs 517.8 mn and is designed to purchase units from investors who wish to sell, helping address the challenge of illiquidity that is common in Real Estate investments;
On the Unquoted Securities Platform Acorn D-REIT and I-REIT traded at Kshs 29.6 and Kshs 23.8 per unit, respectively, as per the last updated data on 5th June 2026. The performance represented a 48.0% and 18.8% gain for the D-REIT and I-REIT, respectively, from the Kshs 20.0 inception price. Additionally, ILAM Fahari I-REIT traded at Kshs 13.8 per share as of 5th June 2026, representing a 31.0% loss from the Kshs 20.0 inception price;
Digital Payments
During the week, MoneyGram announced the launch of its new U.S. dollar-backed stablecoin, MGUSD, marking a major strategic shift for the remittance giant as it moves deeper into blockchain-based payments infrastructure. Built on the Stellar network and issued through Stripe-owned Bridge, MGUSD is designed to support remittances, treasury operations, foreign exchange settlement, and digital dollar storage for consumers in countries with unstable local currencies. The company plans to gradually integrate the stablecoin across its global network of roughly 60 million users, positioning it as a faster and more efficient alternative to traditional cross-border payment systems;
The digital payment stocks we track (AXP, Visa, Mastercard and Circle) are currently trading at an average P/E of 29.0x, implying that investors are pricing in strong future earnings growth expectations and are willing to pay a significant premium for current earnings, which may also suggest that the stocks are richly valued relative to their near-term fundamentals;Bottom of Form
Focus of the Week
Sub-Saharan Africa’s financial services sector has experienced significant structural transformation over the past two decades, evolving from a largely bank-dominated system into a more diversified and digitally enabled ecosystem. Growth has been anchored by rapid mobile money adoption, fintech innovation, and expanding digital payments infrastructure, which have collectively driven substantial gains in financial inclusion across the region. While access to formal financial services has improved markedly, rising from low levels a decade ago to over half of the adult population today, structural gaps persist, particularly in rural and low-income segments. The sector also benefits from strong demographic tailwinds, including a young and growing population, rising urbanization, and expanding intra-regional trade, which continue to support long-term demand for financial services despite an operating environment shaped by inflationary pressures, currency volatility, and periodic policy uncertainty.
Investment Updates:
-
Weekly Rates: Cytonn Money Market Fund closed the week at a yield of 12.05% p.a. To invest, dial *809# or download the Cytonn App from Google Play store here or from the Appstore here;
-
We continue to offer Wealth Management Training every Tuesday, from 7:00 pm to 8:00 pm. The training aims to grow financial literacy among the general public. To register for any of our Wealth Management Trainings, click here. If interested in our Private Wealth Management Training for your employees or investment group, please get in touch with us through wmt@cytonn.com;
-
Cytonn Insurance Agency acts as an intermediary for those looking to secure their assets and loved ones’ future through insurance namely; Motor, Medical, Life, Property, WIBA, Credit and Fire and Burglary insurance covers. For assistance, get in touch with us through insuranceagency@cytonn.com;
-
Cytonn Asset Managers Limited (CAML) continues to offer pension products to meet the needs of both individual clients who want to save for their retirement during their working years and Institutional clients that want to contribute on behalf of their employees to help them build their retirement pot. To more about our pension schemes, kindly get in touch with us through pensions@cytonn.com;
Hospitality Updates:
-
We currently have promotions for Staycations. Visit cysuites.com/offers for details or email us at sales@cysuites.com;
Money Markets, T-Bills Primary Auction:
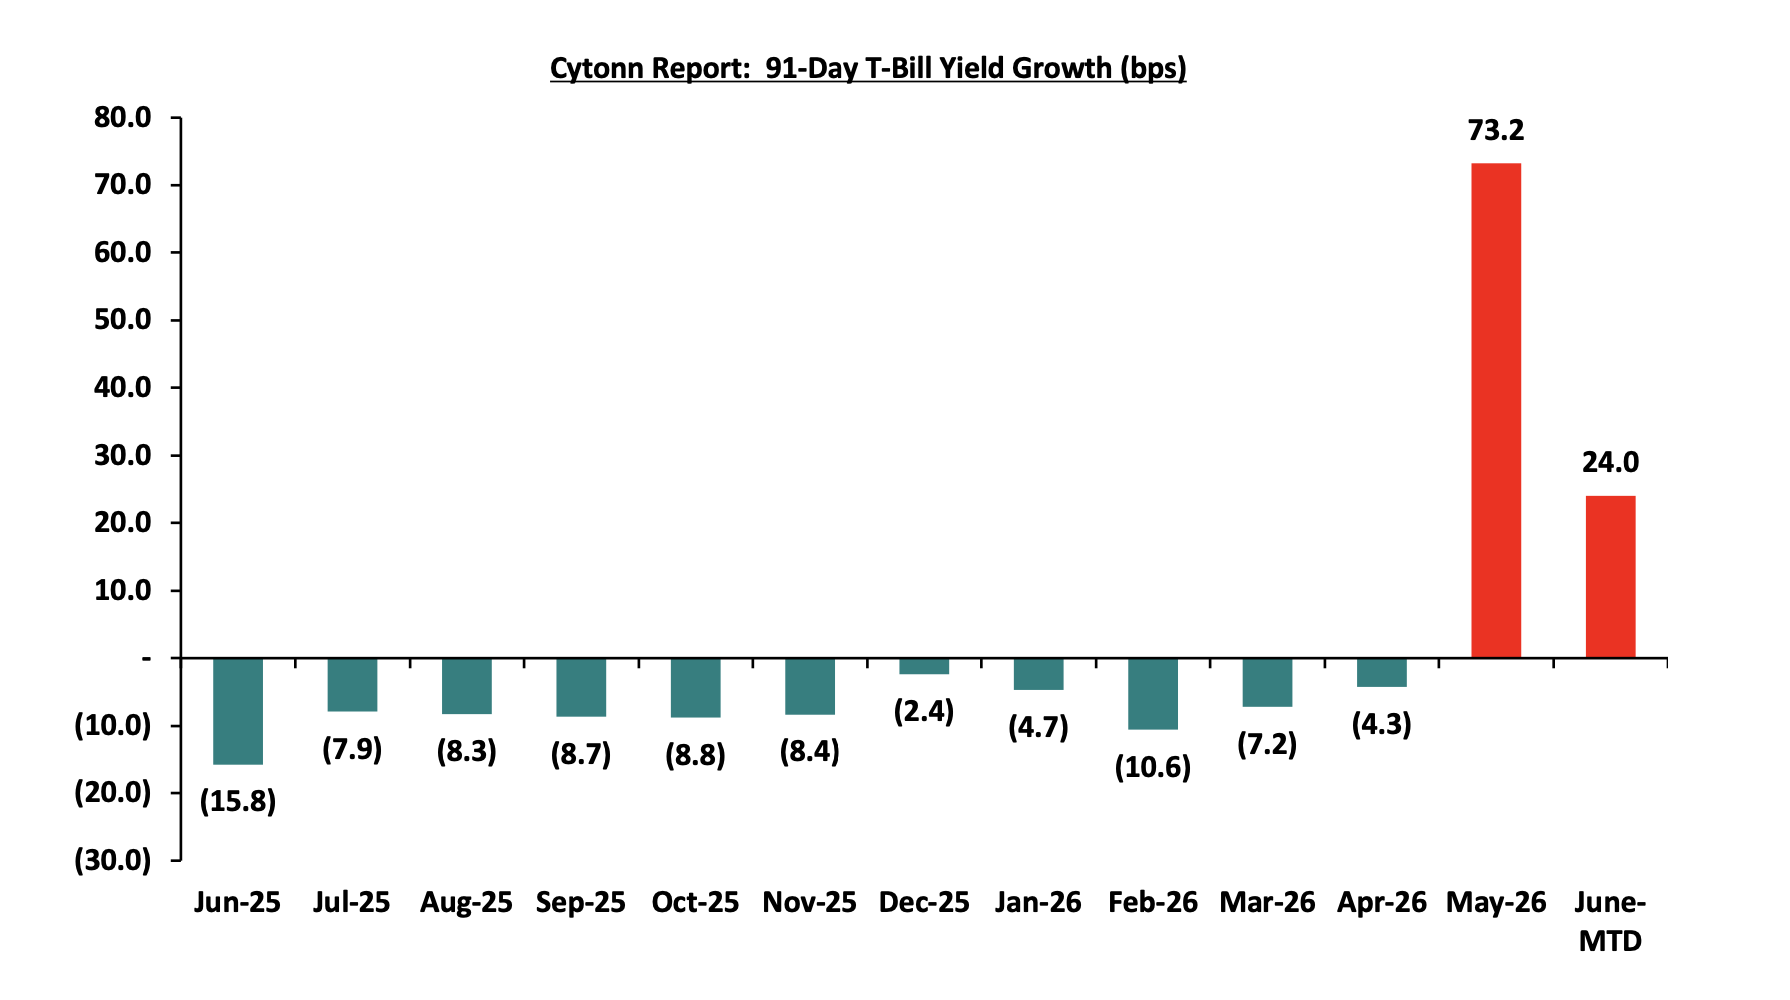
During This week, T-bills were oversubscribed for the first time in two weeks, with the overall subscription rate coming in at 227.4%, significantly higher than the subscription rate of 69.3%, recorded the previous week. Investors’ preference for the shorter 91-day paper persisted, with the paper receiving bids worth 32.8 bn against the offered Kshs 4.0 bn, translating to a subscription rate of 820.7%, significantly higher than the subscription rate of 352.3%, recorded the previous week. The subscription rate for the 182-day paper significantly increased to 65.3% from 10.5% recorded the previous week, while that of the 364-day paper increased significantly to 153.3% from 14.9% recorded the previous week. The government accepted a total of Kshs 54.55 bn worth of bids out of Kshs 54.58 bn bids received, translating to an acceptance rate of 99.9%. The yields on the government papers were on an upward trajectory with the yields on the 182-day paper increasing the most by 27.5 bps to 8.5% from the 8.3% recorded the previous week. The yields on the 91-day paper also increased by 17.0 bps to 8.6% from the 8.4% recorded the previous week, while the yields on the 364-day paper increased by 13.6 bps to 8.8% from the 8.6% recorded the previous week.
The chart below shows the yield growth rate for the 91-day paper from June 2025 to date:
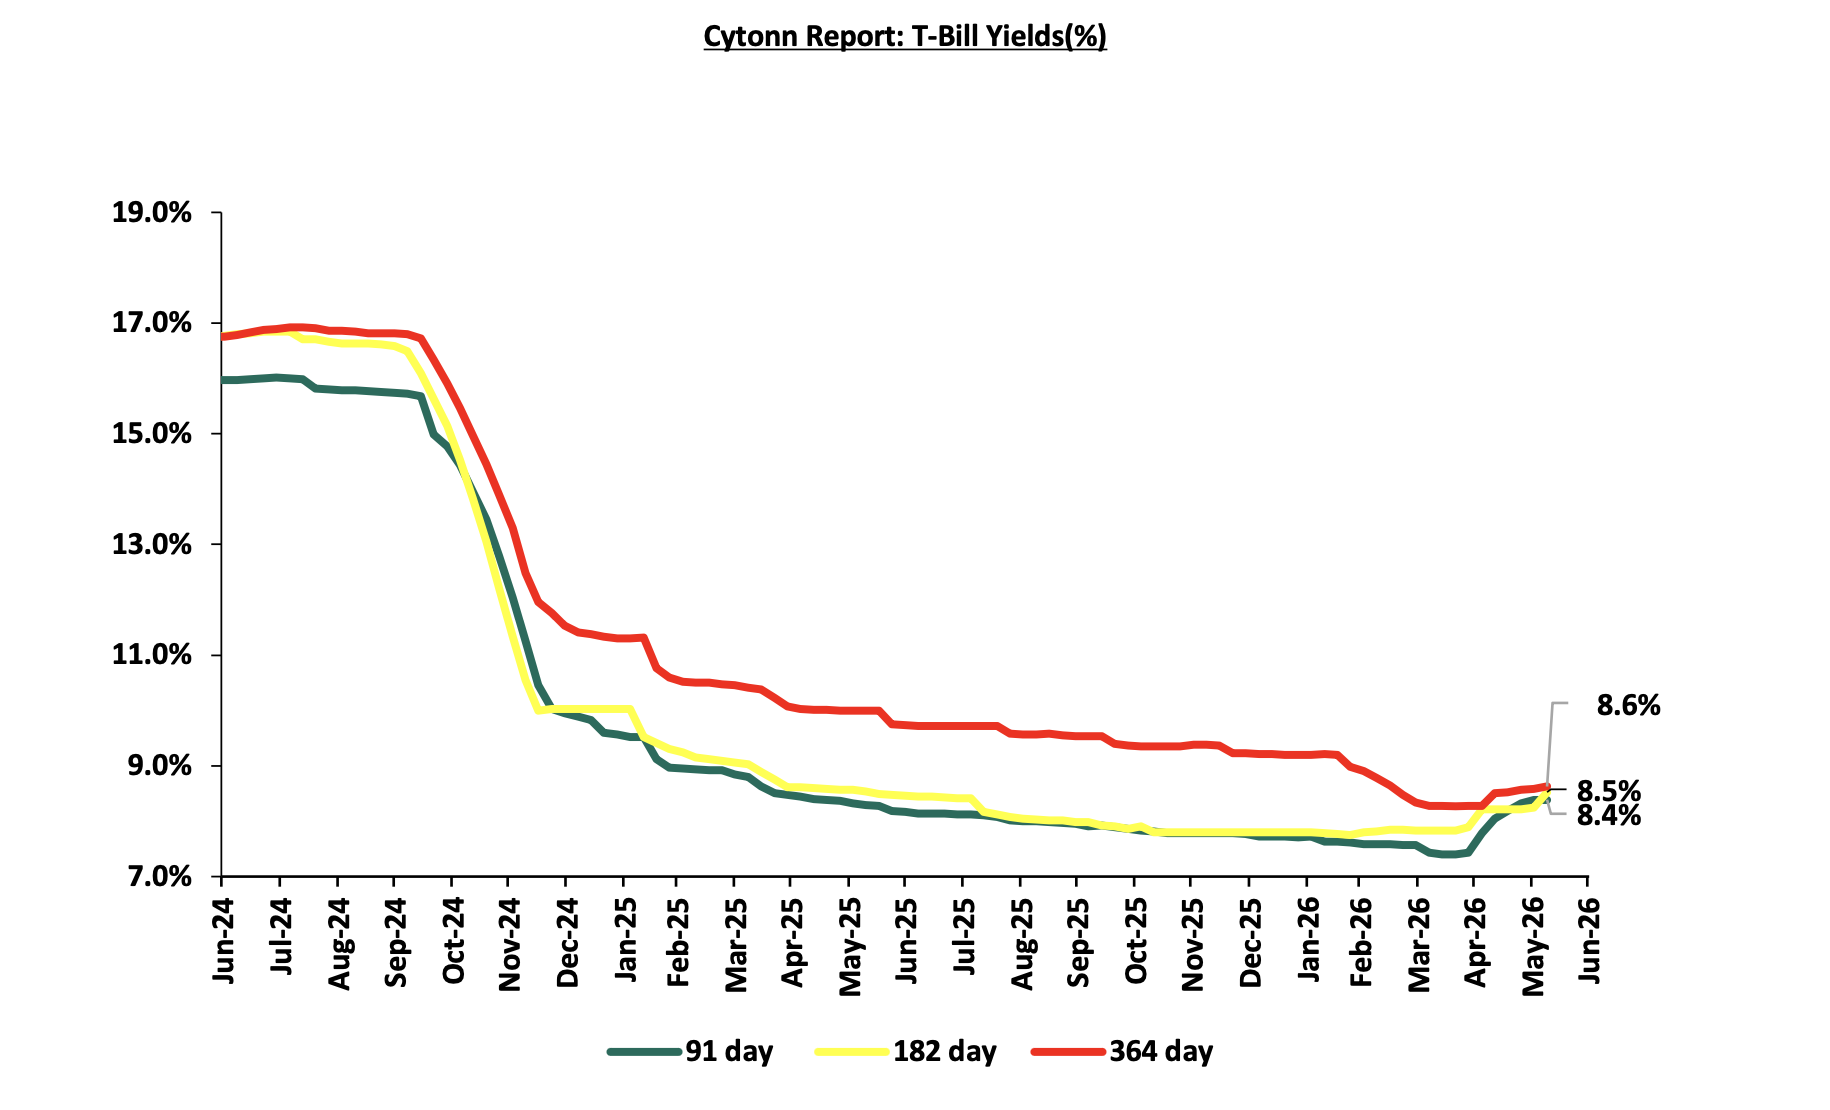
The charts below show the performance of the 91-day, 182-day and 364-day papers from June 2024 to June 2026:
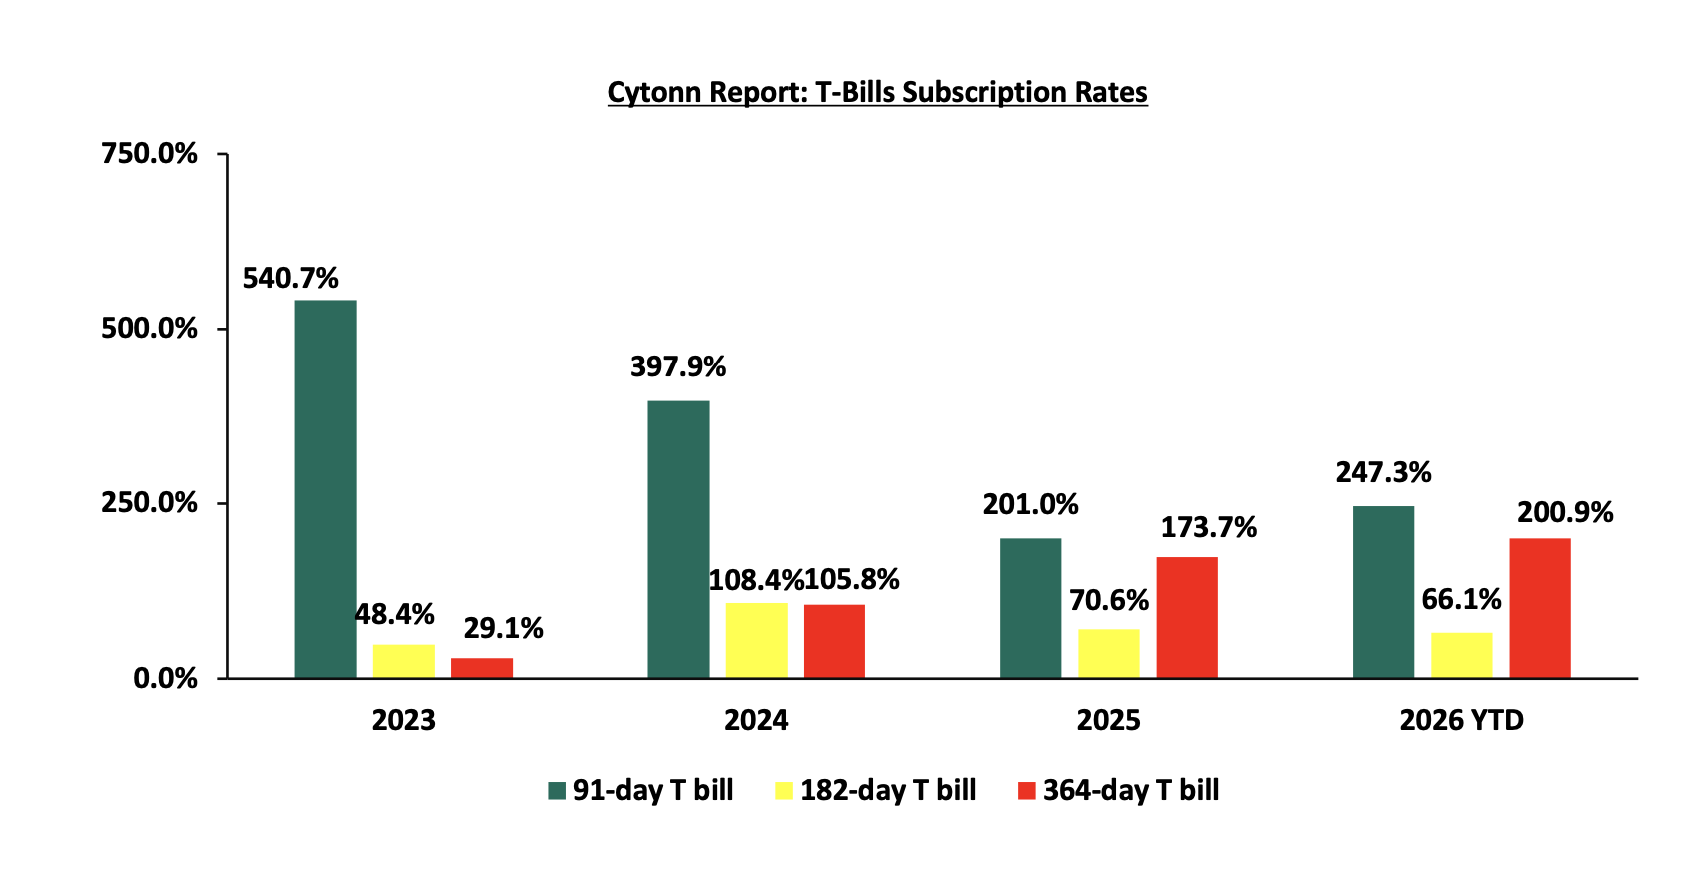
The chart below compares the overall average T-bill subscription rates obtained in 2023,2024, 2025 and 2026 Year-to-date (YTD):
T-Bonds Primary Auction:
During the week, the Central Bank of Kenya released the auction results for the re-opened treasury bonds FXD1/2020/015 and FXD1/2018/025 with tenors to maturities of 8.7 years and 17.1 years respectively and fixed coupon rates of 12.8% and 13.4% respectively. The bonds were undersubscribed, with the overall subscription rate coming in at 86.0%, receiving bids worth Kshs 34.4 bn against the offered Kshs 40.0 bn. The government accepted bids worth Kshs 34.38 bn, translating to an acceptance rate of 99.97%. The weighted average yield for the accepted bids for the FXD1/2020/015 and FXD1/2018/025 came in at 13.3% and 14.2% respectively. Notably, the 13.3% and 14.2% yields on FXD1/2020/015 and FXD1/2018/025 were both higher than the 12.2% and 13.0% recorded at the last reopening in 6th April 2026.
Money Market Performance:
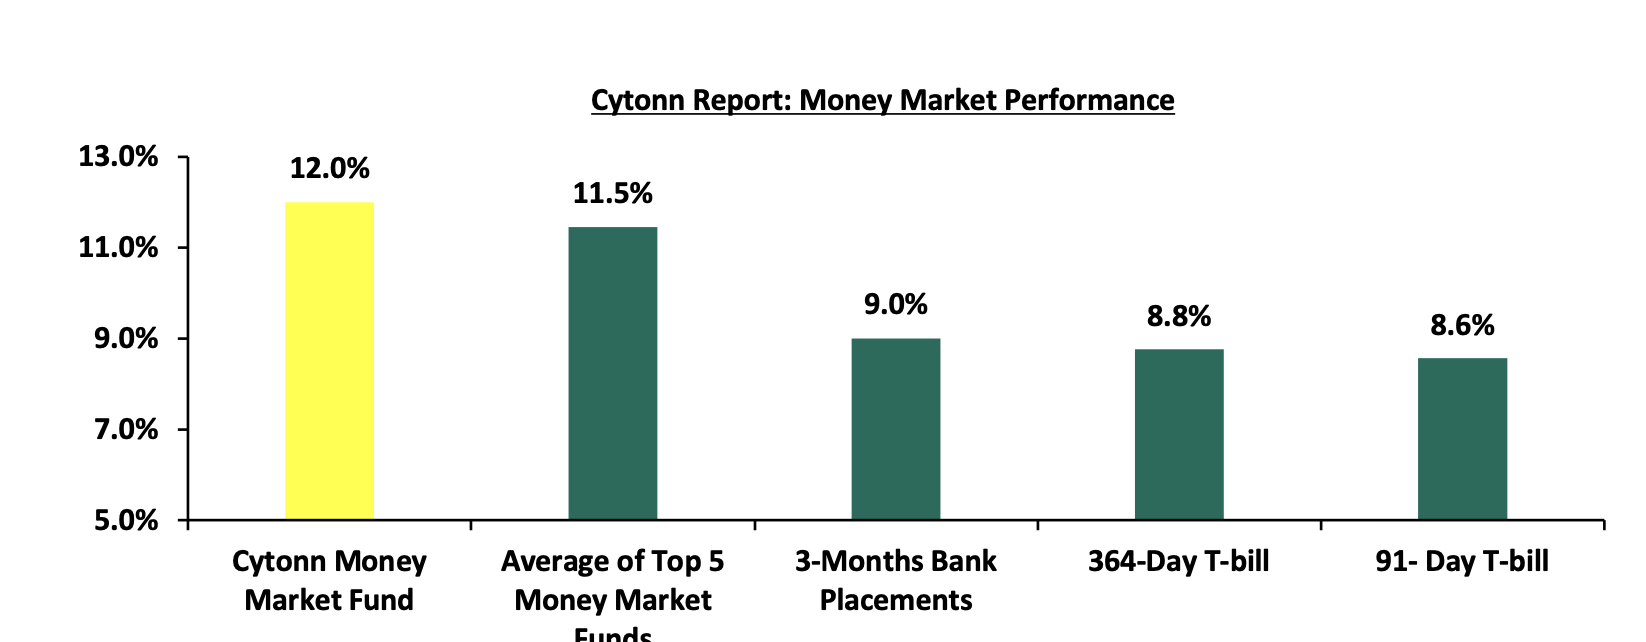
In the money markets, 3-month bank placements ended the week at 9.0% (based on what we have been offered by various banks). The yields on the 91-day paper increased by 17.0 bps to 8.6% from the 8.4% recorded the previous week, while the yields on the 364-day paper increased by 13.6 bps to 8.8% from the 8.6% recorded the previous week and the yield on the Cytonn Money Market Fund decreased by 5.0 bps to 12.0% from the 12.1% recorded the previous week, while the average yields on the Top 5 Money Market Funds increased by 2.0 bps to 11.5% from 11.4% recorded in the previous week.
The table below shows the Money Market Fund Yields for Kenyan Fund Managers as published on 5th June 2026:
|
Money Market Fund Yield for Fund Managers as published on 5th June 2026 |
||
|
Rank |
Fund Manager |
Effective Annual Rate |
|
1 |
Nabo Africa Money Market Fund |
12.8% |
|
2 |
Cytonn Money Market Fund ( Dial *809# or download Cytonn App) |
12.0% |
|
3 |
Etica Money Market Fund |
11.2% |
|
4 |
Lofty-Corban Money Market Fund |
10.7% |
|
5 |
Arvocap Money Market Fund |
10.6% |
|
6 |
Enwealth Money Market Fund |
10.6% |
|
7 |
Faulu Money Market Fund |
10.5% |
|
8 |
Ndovu Money Market Fund |
10.5% |
|
9 |
Kuza Money Market fund |
10.5% |
|
10 |
Orient Kasha Money Market Fund |
10.2% |
|
11 |
Jubilee Money Market Fund |
10.2% |
|
12 |
Old Mutual Money Market Fund |
10.1% |
|
13 |
Gulfcap Money Market Fund |
10.1% |
|
14 |
Madison Money Market Fund |
9.9% |
|
15 |
GenAfrica Money Market Fund |
9.8% |
|
16 |
British-American Money Market Fund |
9.5% |
|
17 |
SanlamAllianz Money Market Fund |
9.1% |
|
18 |
Apollo Money Market Fund |
9.1% |
|
19 |
Dry Associates Money Market Fund |
9.1% |
|
20 |
Genghis Money Market Fund |
8.9% |
|
21 |
KCB Money Market Fund |
8.7% |
|
22 |
CIC Money Market Fund |
8.4% |
|
23 |
CPF Money Market Fund |
8.1% |
|
24 |
Co-op Money Market Fund |
7.9% |
|
25 |
Mali Money Market Fund |
7.9% |
|
26 |
Mayfair Money Market Fund |
7.7% |
|
27 |
ICEA Lion Money Market Fund |
7.6% |
|
28 |
Absa Shilling Money Market Fund |
7.3% |
|
29 |
Ziidi Money Market Fund |
6.1% |
|
30 |
AA Kenya Shillings Fund |
6.0% |
|
31 |
Stanbic Money Market Fund |
5.3% |
|
32 |
Equity Money Market Fund |
|
Source: Business Daily
Liquidity:
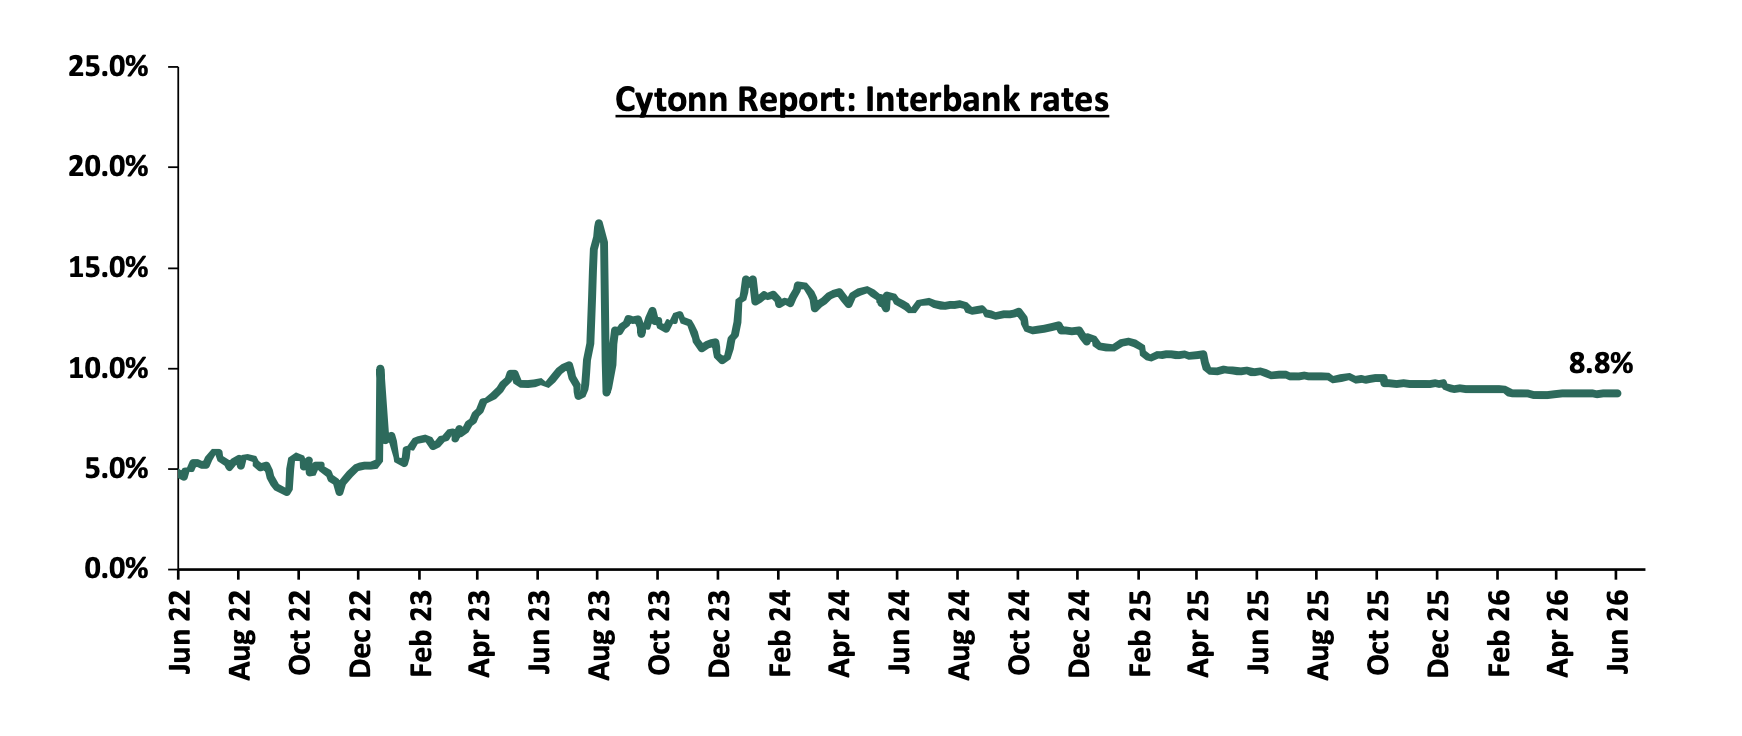
During the week, liquidity in the money markets eased, with the average interbank rate decreasing by 0.1 bps, to remain relatively unchanged from the 8.8% recorded the previous week, partly attributable to government payments that offset tax remittances. The average interbank volumes traded decreased by 42.3% to Kshs 10.7 bn from Kshs 18.6 bn recorded the previous week. The chart below shows the interbank rates in the market over the years:
Kenya Eurobonds:
During the week, the yields on the Eurobonds registered a mixed performance with the yield on the 10-year Eurobond issued in 2018 decreasing the most by 15.0 bps to 7.0% from 7.2% recorded the previous week while the yield on the 30-year Eurobond issued in 2018 increased the most by 2.0 bps to 9.0% from 8.9% recorded the previous week. The table below shows the summary performance of the Kenyan Eurobonds as of 4th June 2026:
|
|
2018 |
2019 |
2021 |
2024 |
||
|
Tenor |
10-year issue |
30-year issue |
12-year issue |
13-year issue |
7-year issue |
|
|
Amount Issued (USD) |
1.0 bn |
1.0 bn |
1.2 bn |
1.0 bn |
1.5 bn |
|
|
Years to Maturity |
2.5 |
22.5 |
6.7 |
8.8 |
5.5 |
|
|
Yields at Issue |
7.3% |
8.3% |
7.9% |
6.2% |
10.4% |
|
|
02-Jan-26 |
6.1% |
8.8% |
7.2% |
7.8% |
7.1% |
|
|
28-May-26 |
7.2% |
8.9% |
7.8% |
8.3% |
7.4% |
|
|
29-May-26 |
7.0% |
8.9% |
7.6% |
8.2% |
7.3% |
|
|
01-Jun-26 |
7.1% |
8.9% |
7.7% |
8.2% |
7.3% |
|
|
02-Jun-26 |
7.0% |
8.9% |
7.6% |
8.2% |
7.2% |
|
|
03-Jun-26 |
6.9% |
8.9% |
7.7% |
8.2% |
7.3% |
|
|
04-Jun-26 |
7.0% |
9.0% |
7.7% |
8.3% |
7.3% |
|
|
Weekly Change |
(0.2%) |
0.0% |
(0.1%) |
(0.0%) |
(0.1%) |
|
|
MTD Change |
(0.1%) |
0.1% |
0.0% |
0.1% |
(0.0%) |
|
|
YTD Change |
1.0% |
0.1% |
0.5% |
0.4% |
0.2% |
|
Source: Central Bank of Kenya (CBK) and National Treasury
Kenya Shilling:
During the week, the Kenya Shilling appreciated by 17.8 bps against the US Dollar, to Kshs 129.3 from the Kshs 129.6 recorded the previous week. On a year-to-date basis, the shilling has depreciated by 20.9 bps against the dollar, as compared to the 22.9 bps appreciation recorded in 2025.
We expect the shilling to be supported by:
-
Diaspora remittances standing at a cumulative USD 5,053.5 mn in the twelve months to April 2026, 1.1% higher than the USD 4,997.2 mn recorded over the same period in 2025. These have continued to cushion the shilling against further depreciation. In the April 2026 diaspora remittances figures, North America remained the largest source of remittances to Kenya accounting for 52.2% in the period, and,
-
Tourism inflows, which strengthened significantly. Tourism receipts reached Kshs 560.0 bn in 2025, up from Kshs 452.2 bn in 2024, representing a 23.9% increase, supported by improved international arrivals through the country’s major airports, and,
-
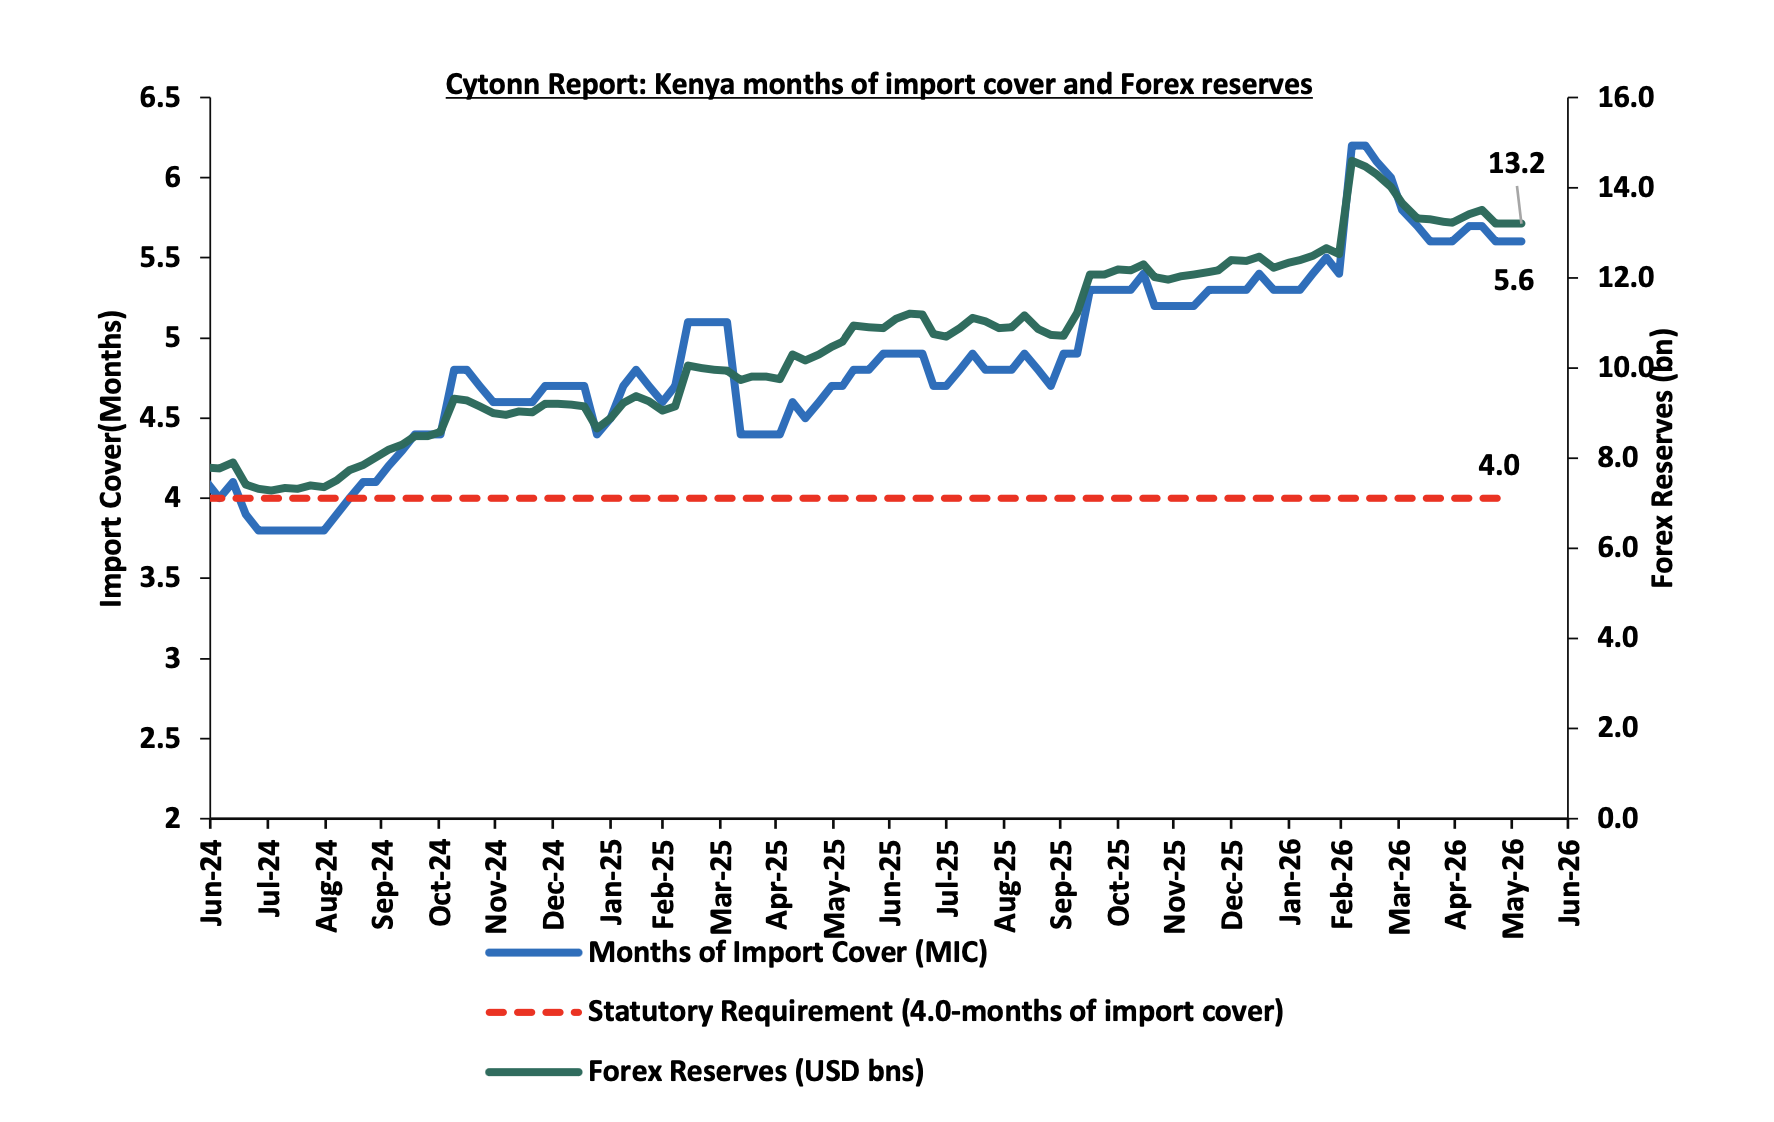
Improved forex reserves currently at USD 13.2 bn (equivalent to 5.6-months of import cover), which is above the statutory requirement of maintaining at least 4.0-months of import cover and above the EAC region’s convergence criteria of 4.5-months of import cover.
The shilling is however expected to remain under pressure in 2026 as a result of:
-
An ever-present current account deficit which came at 2.4% of GDP in the twelve months to February 2026, and,
-
The need for government debt servicing, continues to put pressure on forex reserves given that 52.0% of Kenya’s external debt is US Dollar-denominated as of September 2025.
-
Rising geopolitical tensions in the Middle East, which could exert pressure on the shilling through higher global oil prices and increased uncertainty in international markets. Given that Kenya is a net importer of petroleum products, any sustained increase in oil prices would widen the import bill, increase demand for US Dollars, and consequently put depreciation pressure on the shilling
Kenya’s forex reserves remained relatively unchanged at USD 13.2 bn recorded the previous week, equivalent to 5.6 months of import cover, and above the statutory requirement of maintaining at least 4.0-months of import cover. The chart below summarizes the evolution of Kenya's months of import cover over the years:
Weekly Highlights
-
June 2026 Monetary Policy Committee (MPC) Meeting
We expect the MPC to maintain the Central Bank Rate (CBR) at 8.75%, with their decision mainly being supported by:
-
Global monetary policy stance: The latest meetings confirm that most major economies have opted to hold rates steady in the face of war-driven energy shocks. The US Federal Reserve maintained the federal funds rate at 3.5%-3.75% in April, citing that monetary policy cannot directly offset oil price shocks but must ensure inflation expectations remain anchored. The European Central Bank held its deposit rate at 2.00%, emphasizing caution given energy-driven inflation risks. The Bank of England voted 8-1 to keep its Bank Rate at 3.75%, noting inflation had ticked up to 3.3% but further tightening would not address supply-side pressures. Other central banks such as the Bank of Japan and Swiss National Bank also adopted steady or conditional easing stances. This collective posture underscores that global policy remains cautious, prioritizing stability over aggressive moves, and provides the MPC with room to hold the CBR at 8.75% without risking policy divergence.
-
The need to support the economy: Private sector indicators point to the need for a supportive monetary stance. The Stanbic Bank PMI fell to 46.6 in May 2026, marking a third consecutive month below the neutral 50.0 level and signalling continued deterioration amid weak demand, rising costs, and subdued business confidence. Further tightening would risk deepening the slowdown. At the same time, private sector credit growth improved to 8.1% in March 2026 from 7.4% recorded in February 2026, indicating a gradual recovery in financing activity. However, lending rates remain high at around 14.7%, leaving borrowers sensitive to additional increases. A rate hike could undermine this recovery. Maintaining the policy rate at 8.75% therefore offers the most balanced approach. It supports credit growth and business confidence while allowing the CBK to monitor external risks, particularly energy-driven inflation and exchange rate pressures, without adding strain to an already fragile economy.
-
The continued stability of the Shilling against major currencies: The Kenyan Shilling has remained relatively stable in recent months, supported by foreign exchange reserves at 5.6 months of import cover, comfortably above the statutory minimum of 4.0 months. This stability has provided the MPC with flexibility to maintain the current rate without risking volatility or capital outflows. However, if the shilling were to depreciate further, the import bill would widen significantly given that Kenya’s fuel and most essential imports are dollar denominated. A weaker shilling would therefore amplify inflationary pressures, erode household purchasing power, and strain the current account further widening the import bill. The escalation of the Middle East conflict and elevated global energy prices heighten this risk, as any disruption in supply chains directly feeds into higher import costs. Maintaining the CBR at 8.75% helps anchor investor confidence, preserve currency stability, and mitigate the risk of sharp depreciation. This stance ensures that external buffers remain intact while shielding the economy from the inflationary pass through of a weaker shilling
-
Stanbic Bank’s May 2026 Purchasing Manager’s Index (PMI)
During the week, Stanbic Bank released its monthly Purchasing Manager’s Index (PMI) indicating that Kenya’s Purchasing Managers’ Index (PMI) declined by 2.8 points to 46.6 in May 2026 from 49.4 in April 2026, signaling the quickest decline in the health of the Kenyan private sector since July 2024, all the while remaining below the 50.0 neutral threshold for the third consecutive month. The solid downturn was largely attributed to lower new work intakes and weak demand. Inventory purchases slowed, from being expansive, because of weakening sales, cash flow concerns, and rising costs. Furthermore, inflationary pressures that led to consumer resistance to spend, coupled with rising costs contributed to contractions in new orders and output. Key to note, a PMI reading of above 50.0 indicates an improvement in the business conditions, while readings below 50.0 indicate a deterioration. The chart shows Kenya's Purchasing Manager's Index for the last 24 Months:
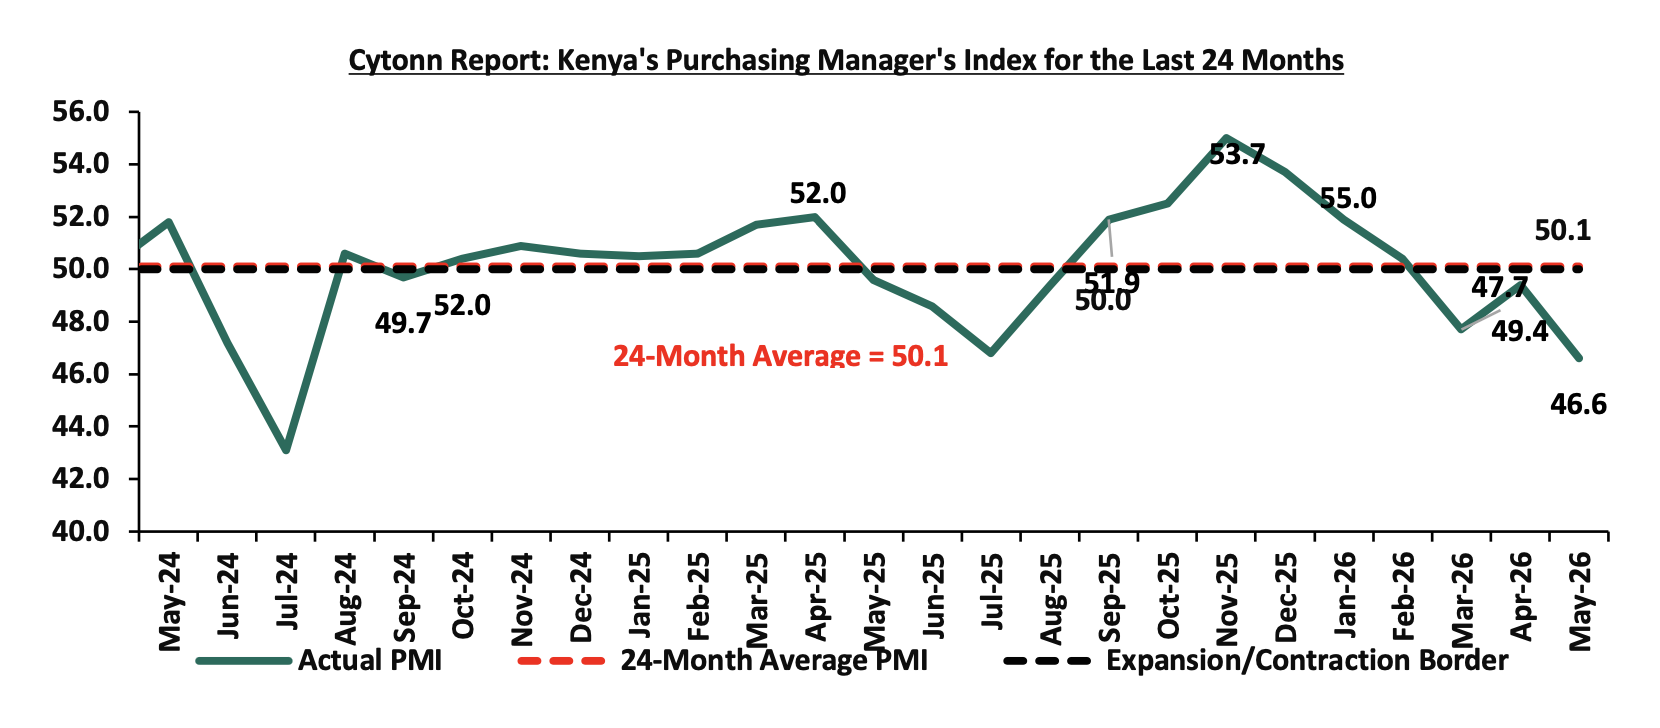
Going forward, the outlook for Kenya's private sector remains under significant pressure, with the May data pointing to a more pronounced deterioration than previously anticipated. The sharp drop in the headline PMI to 46.6 signals that the contraction is deepening rather than stabilizing, driven by a confluence of rising costs and weakening demand. The central concern heading into the third quarter of 2026 is the intensifying cost-demand squeeze: input price inflation at its steepest since November 2023, largely fueled by higher fuel and transportation costs, is eroding consumer purchasing power and dampening new orders at the fastest pace since mid-2025. This is particularly consequential for construction and services sectors, which are contracting on both output and new orders simultaneously. The first decline in employment in 16 months adds a further headwind, as reduced household incomes risk feeding back into weaker consumer spending and prolonging the cycle. Nonetheless, firms remain notably optimistic about the year-ahead outlook, underpinned by planned investment in product diversification and digital expansion, suggesting the private sector views the current downturn as cyclical rather than structural. A meaningful recovery therefore remains possible, contingent on stabilization in fuel prices, resolution of transport sector grievances, and a gradual easing of inflationary pressures that would restore household spending capacity
Rates in the Fixed Income market have been on an upward trend due to tightening liquidity in the money market which has limited the government’s ability to front load its borrowing. The government is 16.0% ahead of its prorated net domestic borrowing target of Kshs 938.2 bn, having a net borrowing position of Kshs 1088.3 bn (inclusive of T-bills). We expect the yield curve to steepen in the short and medium term, driven by the inflationary pressures, with the government looking to increase its domestic borrowing to maintain the fiscal surplus. As such, we expect the yield curve to steepen in the short to medium-term and hence investors are expected to shift towards the short to medium-term papers to lock in the high returns.
Market Performance:
During the week, the equities market was on an upward trajectory, with NSE 25 gaining by 2.3%, NASI by 2.3%, NSE 10 by 2.2% and NSE 20 by 1.3%, taking the YTD performance to gains of 13.3%, 13.1%, 12.3% and 11.5% for NSE 20, NSE 25, NASI and NSE 10 respectively. The week-on-week equities market performance was mainly driven by gains recorded by large cap stocks such as KCB, Stanbic and Equity of 6.0%, 5.8% and 4.0% respectively. However, the performance was weighed down by losses recorded by large cap stocks such as EABL, DTB-K and Co-op of 3.0%, 2.9% and 0.5% respectively.
During the week, the banking sector index increased by 1.5% to 239.4 from 235.1 recorded the previous week. This is attributable to gains recorded by large cap stocks such as KCB, Stanbic and Equity of 6.0%, 5.8% and 4.0% respectively. However, the performance was also weighed down by losses recorded by large cap stocks such as Diamond Trust Bank, Co-op and Standard Chartered of 3.0%, 0.5% and 0.5% respectively.
During the week, equities turnover decreased by 29.5% to USD 26.2 mn from USD 37.2 mn recorded the previous week, taking the YTD total turnover to USD 707.5 mn. Foreign investors became net sellers for the first time in two weeks with a net selling position of USD 1.9 mn, from a net buying position of USD 12.8 mn recorded the previous week, taking the YTD foreign net selling position to USD 83.0 mn, compared to a net selling position of USD 92.9 mn recorded in 2025;
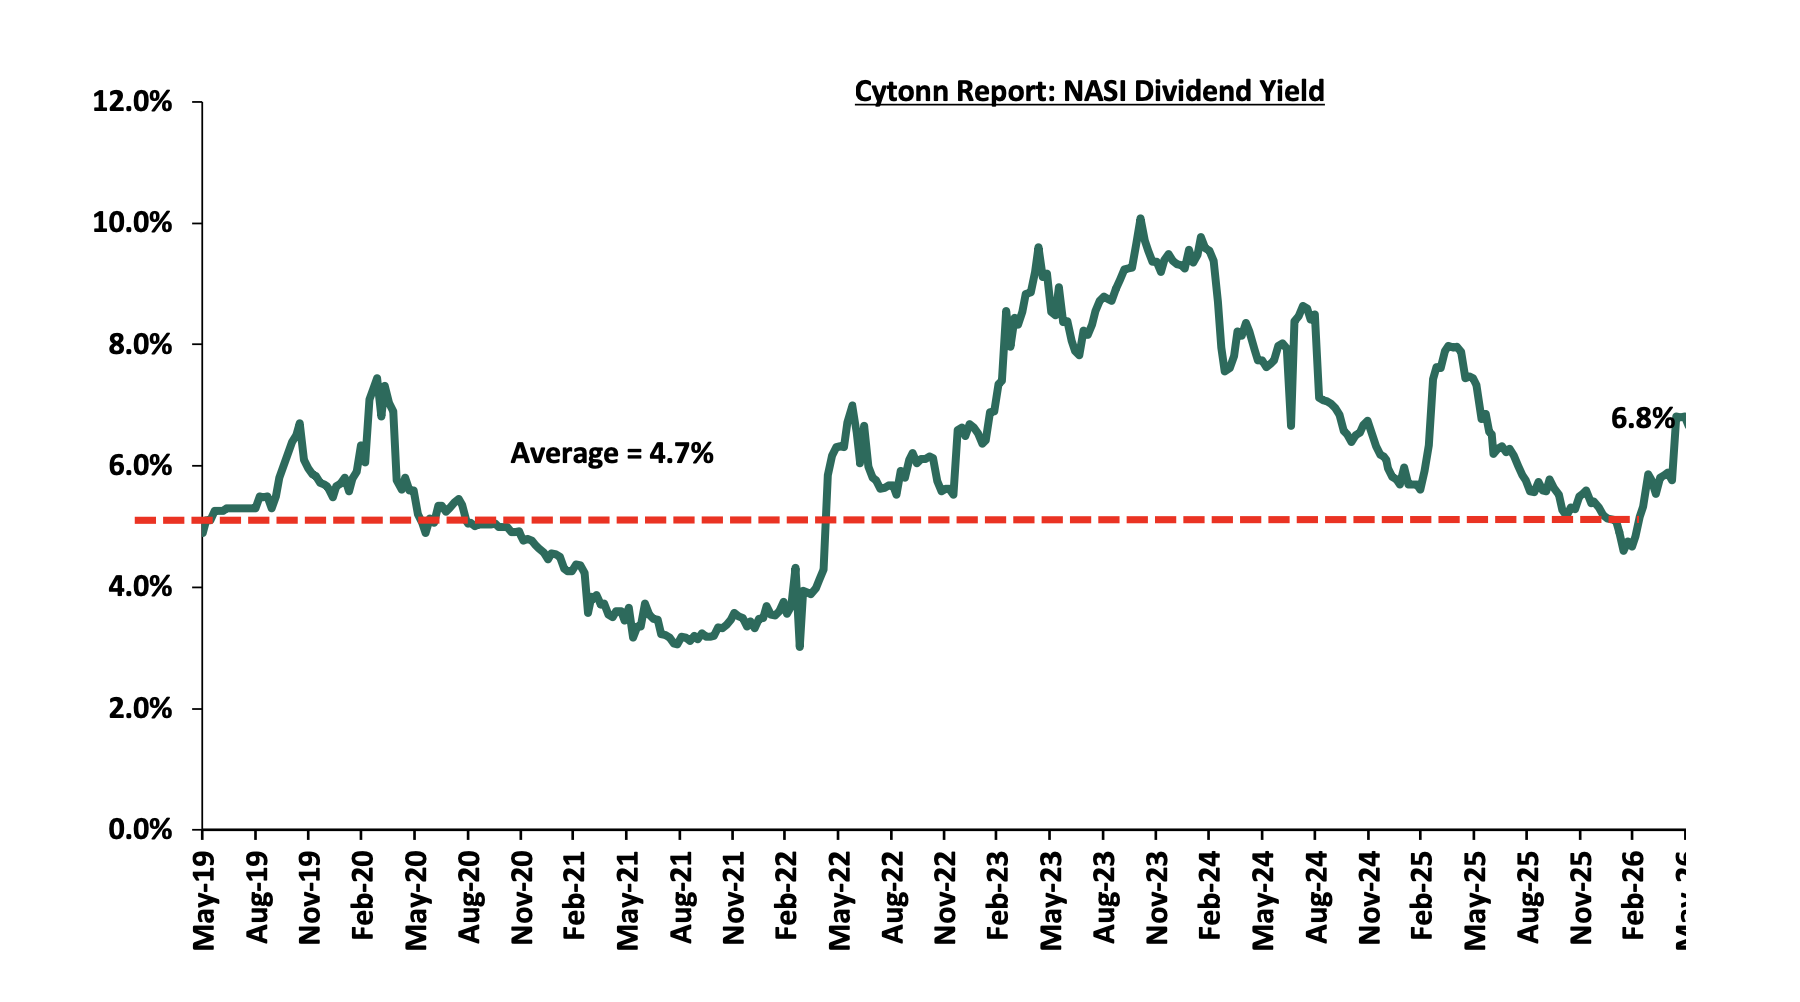
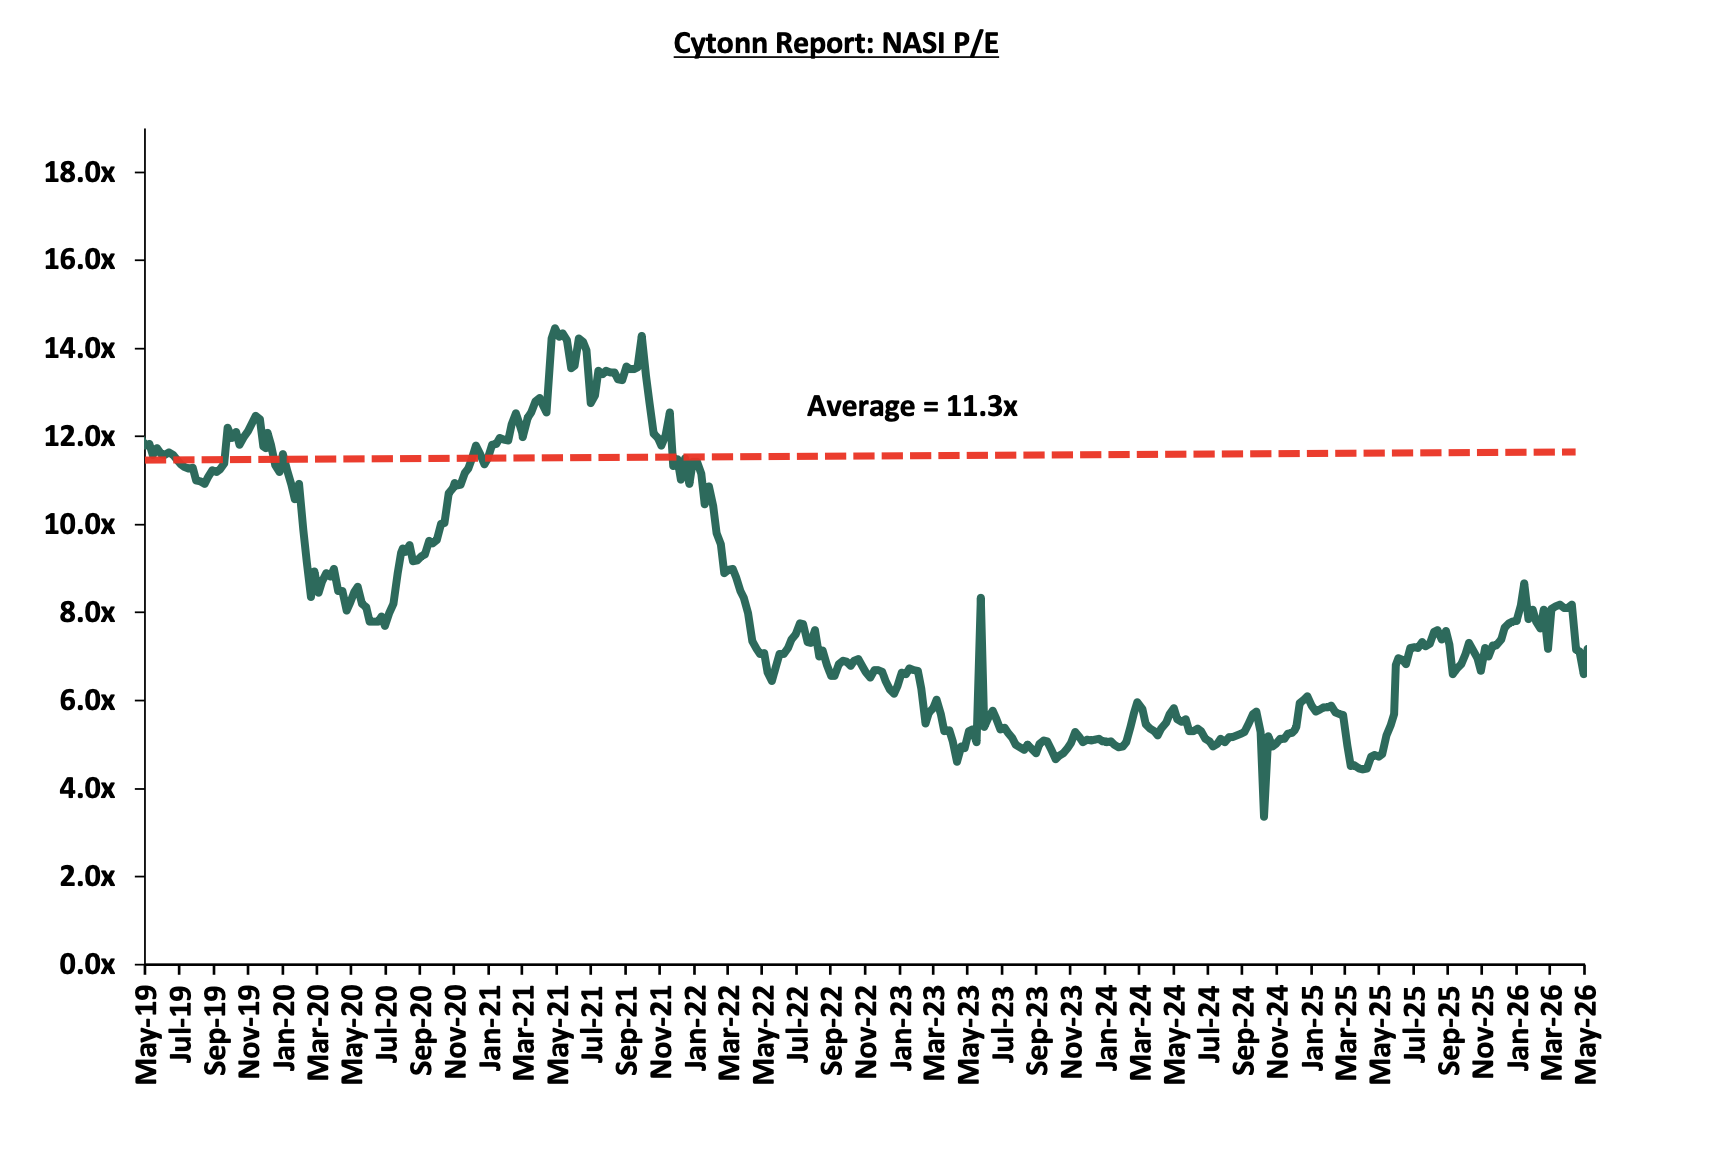
The market is currently trading at a price to earnings ratio (P/E) of 7.2x, 36.2% below the historical average of 11.3x, and a dividend yield of 6.7%, 1.9% points above the historical average of 4.7%. Key to note, NASI’s PEG ratio currently stands at 0.9x, an indication that the market is slightly undervalued relative to its future growth. A PEG ratio greater than 1.0x indicates the market may be overvalued while a PEG ratio less than 1.0x indicates that the market is undervalued;
The charts below indicate the historical P/E and dividend yields of the market:
Universe of Coverage:
|
Cytonn Report: Equities Universe of Coverage |
|||||||||||
|
Company |
Price as at 29/05/2026 |
Price as at 05/06/2026 |
w/w change |
m/m change |
YTD Change |
Year Open 2026 |
Target Price* |
Dividend Yield |
Upside/ Downside** |
P/TBv Multiple |
Recommendation |
|
CIC Group |
4.2 |
4.2 |
0.2% |
(3.0%) |
(7.5%) |
4.5 |
5.5 |
3.1% |
34.0% |
1.1x |
Buy |
|
Diamond Trust Bank |
147.3 |
143.0 |
(2.9%) |
(4.0%) |
24.6% |
114.8 |
175.1 |
6.3% |
28.7% |
0.4x |
Buy |
|
NCBA |
87.3 |
88.3 |
1.1% |
0.0% |
3.8% |
85.0 |
103.3 |
8.0% |
25.1% |
1.2x |
Buy |
|
KCB Group |
66.8 |
70.8 |
6.0% |
6.0% |
7.6% |
65.8 |
81.1 |
9.9% |
24.5% |
0.7x |
Buy |
|
Co-op Bank |
32.1 |
32.0 |
(0.5%) |
8.7% |
33.7% |
23.9 |
37.2 |
7.8% |
24.2% |
1.2x |
Buy |
|
Equity Group |
74.3 |
77.3 |
4.0% |
3.3% |
15.3% |
67.0 |
87.8 |
7.4% |
21.1% |
1.0x |
Buy |
|
ABSA Bank |
28.8 |
29.1 |
1.0% |
3.4% |
16.9% |
24.9 |
31.7 |
7.1% |
16.3% |
1.6x |
Accumulate |
|
I&M Group |
50.8 |
52.5 |
3.4% |
5.1% |
22.7% |
42.8 |
56.7 |
7.1% |
15.1% |
0.8x |
Accumulate |
|
Standard Chartered Bank |
333.3 |
331.8 |
(0.5%) |
(0.9%) |
10.7% |
299.8 |
346.8 |
9.3% |
13.9% |
2.1x |
Accumulate |
|
Stanbic Holdings |
269.5 |
285.0 |
5.8% |
(1.7%) |
44.1% |
197.8 |
297.5 |
7.8% |
12.2% |
1.6x |
Accumulate |
|
Jubilee Holdings |
367.3 |
394.0 |
7.3% |
2.1% |
22.2% |
322.5 |
407.5 |
3.8% |
7.2% |
0.5x |
Hold |
|
Britam |
12.3 |
12.7 |
2.8% |
3.3% |
39.6% |
9.1 |
13.5 |
0.0% |
6.7% |
0.9x |
Hold |
|
*Target Price as per Cytonn Analyst estimates **Upside/ (Downside) is adjusted for Dividend Yield ***Dividend Yield is calculated using FY’2025 Dividends |
|||||||||||
We maintain a “cautiously optimistic” short-term outlook supported primarily earnings-led attractive valuations, despite rising yields on short-term government papers, which increase competition for capital by drawing investors towards risk-free government securities, as well as heightened geopolitical risks such as Iran war that may weigh on investor sentiment, and, “neutral” in the long term as persistent foreign investor outflows continue to constrain market liquidity and limit broad-based market re-rating. With the market currently trading at a discount to its future growth (PEG Ratio at 0.9x), where performance will be driven by company-specific fundamentals rather than general market direction, we believe that investors should reposition towards value stocks exhibiting strong earnings growth, attractive dividend yields, solid balance sheets, sustainable competitive advantages and trading at compelling discounts to their intrinsic value. While foreign investor sell-offs are expected to continue exerting pressure in the near term, we believe this will create selective entry opportunities for long-term investors.
-
Hospitality Sector
During the week, Nairobi hosted a wildlife photography exhibition that underscored the importance of biodiversity conservation, featuring imagery from the documentary “Yellow Sea Wetlands to African Savannas” and marking the second anniversary of the China-Africa Savannahs Biodiversity Conservation Forum. The event brought together conservation experts, government officials, diplomats, scholars, industry leaders, and cultural enthusiasts to advance environmental awareness and sustainable development. The presence of both international and local participants led to increased demand for accommodation across the city, resulting in higher hotel occupancy levels and providing a noticeable boost to Nairobi’s hospitality sector during the exhibition period.
The exhibition further emphasized the importance of enhanced cooperation between China and African countries in biodiversity conservation and ecological restoration, using striking visuals of migratory birds, rare plant species, and coastal ecosystems to strengthen public understanding of environmental protection. Speakers highlighted the role of research, innovation, and practical conservation efforts in addressing climate change, habitat loss, and other environmental challenges, while reaffirming commitments under the Forum on China-Africa Cooperation Beijing Action Plan 2027. Overall, the event not only reinforced environmental and diplomatic collaboration but also contributed to the growth of Nairobi’s hospitality industry through improved hotel occupancy driven by increased event-related travel.
This initiative is expected to have a positive impact on Kenya’s hospitality Real Estate sector by reinforcing the importance of conserving the natural environments that attract both local and international tourists. Increased collaboration in biodiversity conservation and ecological restoration can enhance the appeal of wildlife destinations, supporting demand for hospitality developments such as hotels, lodges, resorts, and eco-tourism facilities. In the long term, stronger environmental stewardship may boost tourism-related investments and contribute to the growth and sustainability of hospitality-focused Real Estate across the country.
-
Real Estate Investments Trusts
-
Two Rivers to buy exits from the Real Estate Fund
During the week, Two Rivers announced plans to buy exits from the Real Estate Fund. Investors seeking to exit the Kshs 4.8 bn Two Rivers Income Real Estate Investment Trust (I-REIT) will now have an easier path after Two Rivers partnered with Nabo Capital to establish a dedicated liquidity fund. The fund has been capitalized with Kshs 517.8 mn and is designed to purchase units from investors who wish to sell, helping address the challenge of illiquidity that is common in Real Estate investments. By providing an immediate counterparty for small-ticket exits, the arrangement reduces the risk of investors being unable to convert their holdings into cash when there are no willing buyers in the market.
The liquidity fund is modeled as a market maker, stepping in to buy units from investors seeking to exit the I-REIT. According to Centum Investments, the approach was informed by its experience in executing share buybacks, including the repurchase of Kshs 10.8 mn shares under a buyback programme that closed on March 31, with 10.6 mn shares acquired between February 2023 and September 2024 and a further 150,800 shares repurchased between October 2024 and March 2026. Centum noted that this mechanism allows investors to sell their units directly back to the fund rather than waiting for other buyers, thereby enhancing market confidence and liquidity. The Two Rivers I-REIT, which has a minimum investment requirement of Kshs 129,463, opened on May 13 and is scheduled to close on June 12, 2026.
This development is likely to have a positive effect on Kenya’s Real Estate sector by making property-backed investments more attractive to a wider pool of investors. The introduction of a liquidity solution addresses one of the key concerns associated with Real Estate funds that is the difficulty of exiting investments quickly. By improving investor confidence and reducing liquidity risk, the initiative could encourage greater participation in Real Estate Investment Trusts, support capital inflows into the sector, and strengthen the growth of professionally managed Real Estate investment vehicles in the Kenyan economy.
-
REITs Weekly Performance
On the Unquoted Securities Platform Acorn D-REIT and I-REIT traded at Kshs 29.6 and Kshs 23.8 per unit, respectively, as per the last updated data on 5th June 2026. The performance represented a 48.0% and 18.8% gain for the D-REIT and I-REIT, respectively, from the Kshs 20.0 inception price. The volumes traded for the D-REIT and I-REIT came in at 13.5 mn and 43.3 mn shares, respectively. Additionally, ILAM Fahari I-REIT traded at Kshs 13.8 per share as of 5th June 2026, representing a 31.0% loss from the Kshs 20.0 inception price. The volume traded to date came in at 1.2 mn shares for the I-REIT, REITs offer various benefits, such as tax exemptions, diversified portfolios, and stable long-term profits. However, the ongoing decline in the performance of Kenyan REITs and the restructuring of their business portfolios are hindering significant previous investments. Additional general challenges include:
-
Insufficient understanding of the investment instrument among investors leading to a slower uptake of REIT products,
-
Lengthy approval processes for REIT creation,
-
High minimum capital requirements of Kshs 100.0 mn for REIT trustees compared to Kshs 10.0 mn for pension funds Trustees, essentially limiting the licensed REIT Trustee to banks only
-
The rigidity of choice between either a D-REIT or and I-REIT forces managers to form two REITs, rather than having one Hybrid REIT that can allocate between development and income earning properties
-
Limiting the type of legal entity that can form a REIT to only a trust company, as opposed to allowing other entities such as partnerships, and companies,
-
We need to give time before REITS are required to list – they would be allowed to stay private for a few years before the requirement to list given that not all companies maybe comfortable with listing on day one, and,
Minimum subscription amounts or offer parcels set at Kshs 0.1 mn for D-REITs and Kshs 5.0 mn for restricted I-REITs. The significant capital requirements still make REITs relatively inaccessible to smaller retail investors compared to other investment vehicles like unit trusts or government bonds, all of which continue to limit the performance of Kenyan REITs.
We expect the performance of Kenya's Real Estate sector to remain resilient, supported by several factors: i) Hosting of China wildlife exhibition in Nairobi, which support the growth of Kenya’s hospitality Real Estate sector by enhancing the attractiveness of tourism destinations through stronger biodiversity conservation and environmental stewardship ii) Two Rivers establishing a dedicated liquidity fund making the property backed investments attractive to investors hence supporting capital inflows in the sector. However, challenges such the weak investor appetite in listed REITs like ILAM Fahari I-REIT and high capital requirements will continue to constrain the sector's optimal performance.
-
MoneyGram launches its own U.S. dollar-backed stablecoin
During the week, MoneyGram announced the launch of its new U.S. dollar-backed stablecoin, MGUSD, marking a major strategic shift for the remittance giant as it moves deeper into blockchain-based payments infrastructure. Built on the Stellar network and issued through Stripe-owned Bridge, MGUSD is designed to support remittances, treasury operations, foreign exchange settlement, and digital dollar storage for consumers in countries with unstable local currencies. The company plans to gradually integrate the stablecoin across its global network of roughly 60 million users, positioning it as a faster and more efficient alternative to traditional cross-border payment systems.
The launch shows a new industry trend where traditional financial and remittance firms are embracing stablecoins not as speculative crypto assets, but as practical payment rails. MoneyGram executives emphasized that blockchain-based settlement can reduce costs, improve transaction speed, and provide continuous 24/7 transfer capability compared to legacy banking systems. The move also intensifies competition among payment providers, especially after Western Union recently unveiled its own stablecoin initiative, signaling that remittance companies increasingly view stablecoins as essential infrastructure for the future of global money movement
-
Digital payments stock performance
The table below presents a snapshot of NYSE-listed digital payments stocks, covering Visa, Mastercard, American Express (AXP), and Circle.
| Cytonn Report: Digital Payments NYSE stock perfomance | ||||||
| Company | Year Open 2026 | Price 5/29/2026 | Price 6/6/2026 | w/w change | YTD change | P/E |
| American Express | 372.7 | 316.5 | 310.7 | 1.5% | (16.7%) | 25.2x |
| Visa | 346.5 | 326.4 | 323.6 | (0.8%) | (6.6%) | 16.3x |
| Mastercard | 563.1 | 494.0 | 491.1 | (0.9%) | (12.8%) | 30.5x |
| Circle | 83.5 | 113.0 | 80.3 | (0.1%) | (3.8%) | 44.1x |
| Average |
|
|
|
|
| 29.0x |
Source: Visa, AXP, Circle, Mastercard financials
The stocks are currently trading at an average P/E of 29.0x, implying that investors are pricing in strong future earnings growth expectations and are willing to pay a significant premium for current earnings, which may also suggest that the stocks are richly valued relative to their near-term fundamentals.
Disclaimer: The views expressed in this publication are those of the writers where particulars are not warranted. This publication, which follows Section 2 of the Capital Markets Authority Act Cap 485A, is meant for general information only and is not a warranty, representation, advice or solicitation of any nature. Readers are advised in all circumstances to seek the advice of a registered investment advisor
Introduction
The financial services sector in Sub-Saharan Africa has undergone significant structural transformation over the past two decades, driven by rapid digital innovation, rising mobile and internet penetration, urbanization, and growing demand for inclusive financial solutions. The region has emerged as a global leader in digital financial inclusion, particularly through mobile money ecosystems such as M-Pesa and a fast-expanding fintech landscape that is reshaping payments, savings, credit, and insurance delivery. Despite this progress, access to formal banking remains uneven, especially in rural and low-income segments, leaving a substantial portion of the population dependent on informal financial systems.
The annual GDP growth rate in Sub-Sahara Africa came in at 4.1% in 2025 with the projected growth rate expected to remain unchanged in 2026 as per the latest data by the World bank. This implies that Sub-Saharan Africa’s economic growth is stabilizing at a moderate yet resilient pace, signaling sustained expansion rather than a cyclical slowdown or acceleration. Inflation in major economies in SSA has remained elevated and uneven, reflecting persistent supply-side constraints, currency depreciation pressures, and tightening global financial conditions that have filtered into domestic price levels.
Given the significant role that Financial Services play in economies, we shall focus on the following;
-
Banking Sector Analysis
-
Insurance Sector Analysis
-
Mobile Money and Fintech Innovation
-
Capital Markets and Investments Services
-
Challenges Facing the Financial Services Sector
-
Recommendations and Conclusion
Section I: Banking Sector
- Top 10 Largest Banks by Asset Base
The banking sector remains one of the most important components of the financial services industry in Sub-Saharan Africa. Banks play a central role in mobilizing savings, facilitating trade and investment, supporting business growth, and promoting overall economic development. Over the past two decades, the sector has experienced considerable transformation driven by financial liberalization, technological innovation, regulatory reforms, and growing demand for financial inclusion
|
No. |
Bank |
Asset Base (USD bn) |
Market Cap (USD bn) |
Country |
|
1 |
Standard Bank Group Limited |
196.4 |
28.0 |
South Africa |
|
2 |
First Rand Ltd |
164.2 |
30.7 |
South Africa |
|
3 |
Absa Group |
137.2 |
12.2 |
South Africa |
|
4 |
Nedbank |
100.1 |
7.1 |
South Africa |
|
5 |
Ecobank |
37.0 |
1.7 |
Togo |
|
6 |
Access |
30.4 |
1.0 |
Nigeria |
|
7 |
Commercial Bank of Ethiopia |
25.0 |
N/A |
Ethiopia |
|
8 |
Guarantee Trust Holdings |
23.0 |
1.6 |
Nigeria |
|
9 |
United Bank of Africa |
20.9 |
1.5 |
Nigeria |
|
10 |
Zenith Bank |
20.6 |
3.8 |
Nigeria |
Source: Kwayisi.com and Cytonn research
There significant concentration of banking assets within South Africa, which overwhelmingly dominates the Sub-Saharan African banking sector due to the depth and sophistication of its financial system. South Africa’s banks, led by Standard Bank Group, FirstRand Group, Absa Group, and Nedbank Group, benefit from a highly developed financial ecosystem characterized by deep capital markets, strong regulatory institutions, a large pension and insurance industry, and sophisticated corporate banking activity supported by the Johannesburg Stock Exchange, the largest stock exchange in Africa. These structural advantages have enabled South African banks to accumulate substantially larger balance sheets over decades and expand regionally across the continent. In contrast, banks from other Sub-Saharan African countries, particularly Nigeria, operate in comparatively shallower financial systems with lower banking penetration, weaker savings mobilization, higher informality, and more volatile currencies, all of which constrain asset growth when measured in US dollar terms. Although Nigerian institutions such as Access Bank Group, United Bank for Africa, Guaranty Trust Holding Company, and Zenith Bank have expanded aggressively across Africa and are increasingly influential regional players, their asset bases remain significantly smaller than those of South African banks due to differences in financial sector maturity, domestic capital accumulation, and macroeconomic stability.
-
Profitability
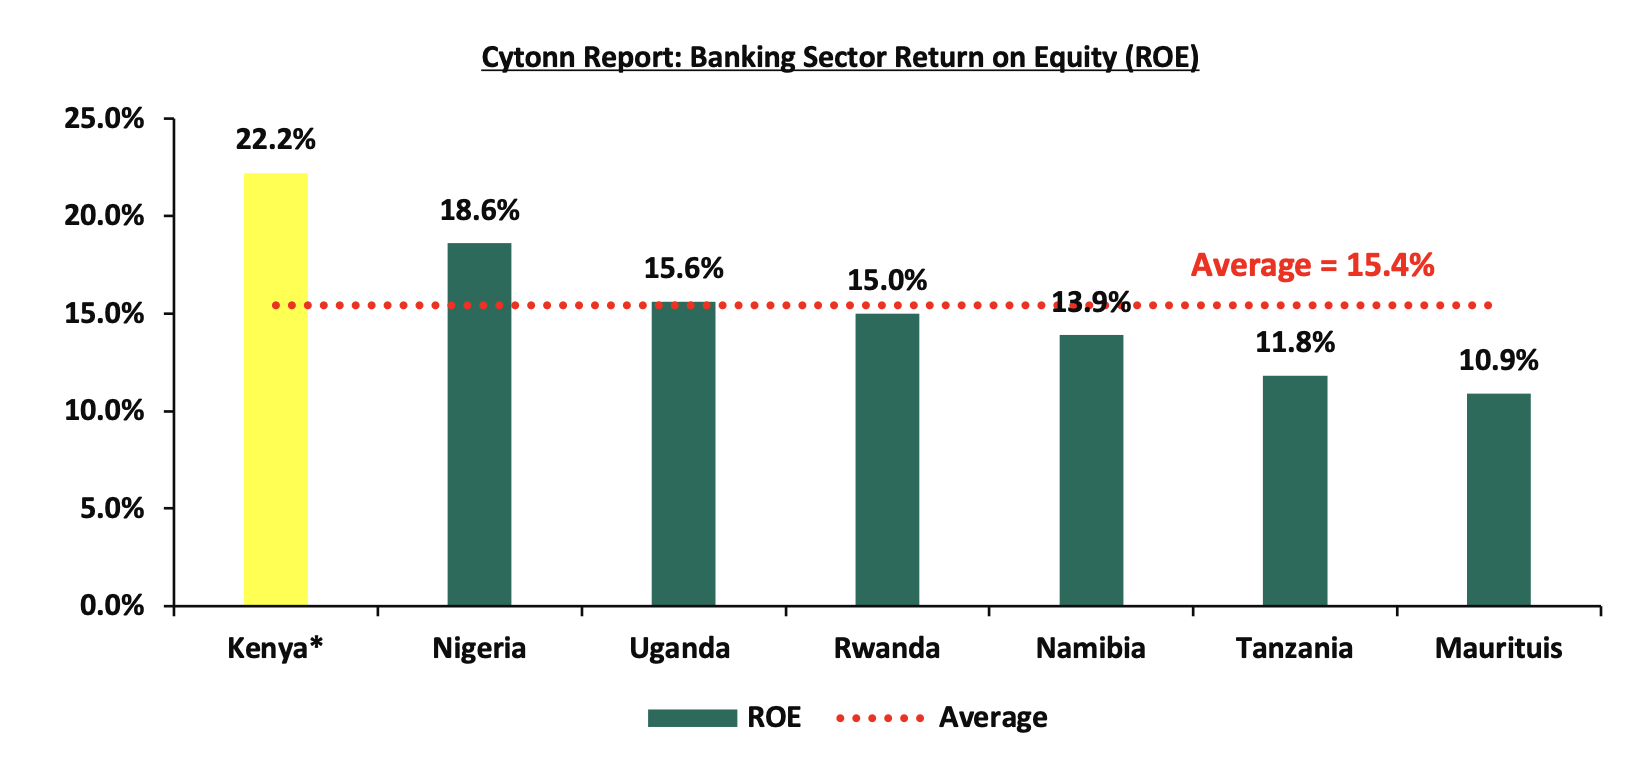
Sub-Saharan Africa’s banking sector continues to demonstrate resilience and strong earnings capacity despite occasional macroeconomic pressures, including high inflation, currency volatility, and elevated interest rates across several economies. Profitability remains a key indicator of banking sector strength, with Return on Equity (ROE) serving as a widely used measure of how effectively banks generate profits from shareholders’ capital. In recent years, many African banks have benefited from higher interest income, digital banking expansion, and growing financial inclusion, although performance continues to vary significantly across countries depending on economic conditions, regulatory environments, and market maturity.
Source: Cytonn Research
*Figures as at December 2025
The chart above highlights the banking secto4 ROE across selected Sub-Saharan African countries, showing Kenya as the top performer with an ROE of 22.2%, significantly above the regional average of 15.5%. Nigeria follows at 18.6%, while Uganda and Rwanda record ROEs of 15.6% and 15.0%, respectively, broadly aligning with the regional benchmark. Namibia, Tanzania, and Mauritius trail behind the average.
C. Banking Penetration and Financial Inclusion
Financial inclusion in Sub-Saharan Africa has grown steadily over the past decade, rising by 24.0% points from 34.0% of adults owning a financial account in 2014 to 58.0% in 2024, according to the Global Findex Database 2025 . However, this is still below the global average of 79.0%, indicating that a significant proportion of adults in the region remain excluded from formal financial systems, highlighting persistent structural barriers such as limited access to banking infrastructure, affordability constraints, low income levels, and gaps in financial literacy, which continue to hinder full participation in the formal economy.
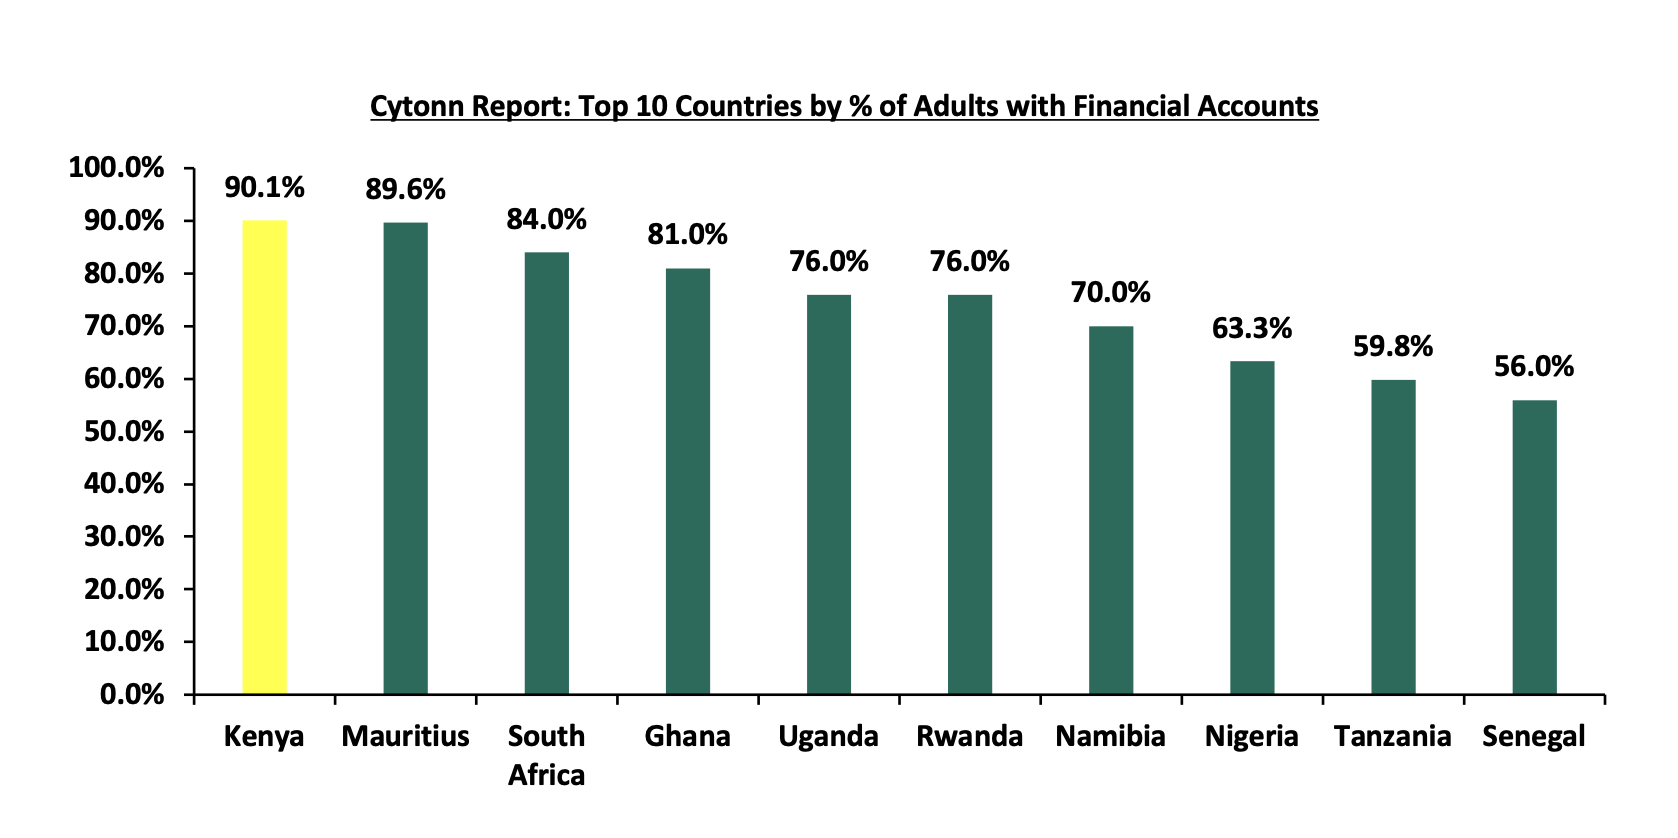
Source: Global Findex Database 2025 *Data as of 2024
Kenya has the highest percentage of adults with financial accounts at 90.1%, attributable to the widespread adoption of mobile money platforms, particularly M-Pesa, supportive regulatory frameworks, and strong integration between mobile and formal banking services. Mauritius follows closely at 89.6%, while South Africa (84.0%) and Ghana (81.0%) also demonstrate relatively high levels of financial inclusion. East African economies continue to perform strongly, with Uganda and Rwanda both recording 76.0%, reflecting the region’s growing uptake of digital financial services.
The steady rise in financial inclusion across Sub-Saharan Africa reflects meaningful progress in expanding access to formal financial services, driven largely by digital innovation and mobile-based financial solutions. However, the region’s continued lag behind the global average underscores the need for targeted policy interventions to address persistent access barriers and deepen financial participation. Kenya’s strong performance provides a compelling case study for the region, demonstrating how supportive regulation, mobile money integration, and digital infrastructure can significantly accelerate inclusion. Going forward, scaling similar models across underserved markets could play a critical role in narrowing the financial inclusion gap and fostering broader economic participation.
Section II: Insurance Sector
-
Insurance Penetration
The insurance sector in Sub-Saharan Africa (SSA) remains relatively underdeveloped compared to global standards, despite gradual expansion driven by economic growth, urbanization, rising middle-income populations, and increasing awareness of risk management. Insurance penetration, measured as gross written premiums as a percentage of GDP, averages below 3.0% across most SSA countries, significantly lower than the global average of approximately 6.8%. The sector is largely concentrated in a few mature markets, particularly South Africa, Kenya, Namibia, and Mauritius, which account for a substantial share of total premiums written in the region. The population of Africa, specifically sub-Saharan Africa, is large, youthful, and growing. The region is home to over 1.2 billion people, expected to grow to 2.5 billion by 2050 as per Deloitte Africa-Insurace-outlook-2024. The higher population growth and youthful population present a vast market for innovative insurance companies.
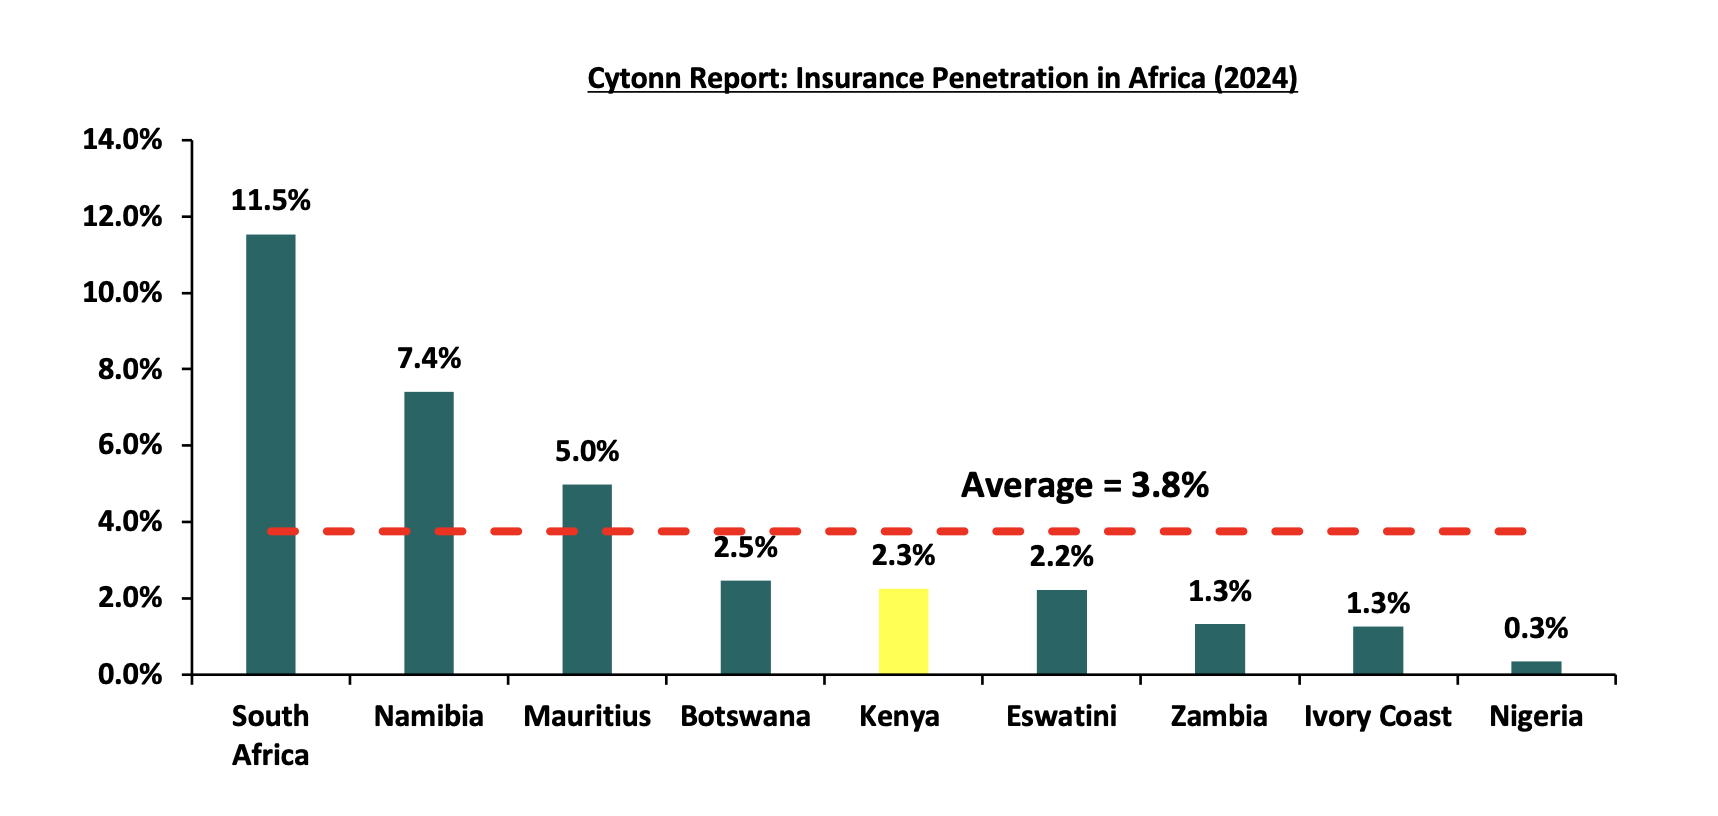
Source: Deloitte Africa Insurance Outlook 2024
South Africa remains the dominant market with 11.5% insurance penetration, supported by a sophisticated financial system, strong regulatory oversight, and a well-established life insurance industry. In contrast, many SSA markets continue to experience low insurance uptake due to limited affordability, low awareness, and underdeveloped distribution channels.
-
Insurtech and Digital Innovation
The Africa insurance market size reached USD 98.5 bn in 2025. Digital distribution and AI-driven claims processing are transforming the unit economics of insurance delivery across SSA. Several live applications illustrate the pace of change:
-
Britam (Kenya): Britam's AI-powered Motor Assessment Service launched in March 2026 has reduced the settlement time for eligible minor motor claims from the industry norm of approximately five days to as little as two hours, significantly improving customer experience and operational efficiency.
-
Leadway Assurance (Nigeria): VehiScanner AI platform enables AI-driven remote vehicle inspections and damage assessments, accelerating underwriting and claims processing while reducing reliance on manual inspections.
-
Parametric Insurance: Given Africa's significant climate protection gap, parametric insurance products, which trigger payouts based on predefined weather or disaster indicators rather than assessed losses are gaining traction. The African Risk Capacity (ARC) provides sovereign drought, flood, and other climate-risk protection to African governments, enabling rapid disaster-response funding.
-
Challenges Facing Insurance Adoption
Despite gradual growth, insurance penetration in SSA remains well below global standards. Growth has been concentrated in a few mature markets — South Africa, Kenya, and Mauritius — while most countries experience persistently low uptake. This reflects structural and socioeconomic barriers that continue to constrain broader market participation.
Below are some of the challenges facing the insurance sector:
-
Low Income Levels and Affordability Constraints: Low household incomes, particularly among rural and informal economy populations, mean that insurance premiums are often perceived as non-essential expenditures. Constrained disposable income and irregular earnings limit market penetration beyond middle- and upper-income segments.
-
Low Financial Literacy and Limited Awareness: Many individuals lack adequate understanding of insurance products including coverage terms, premium structures, and claims processes. Insufficient consumer education compounds misconceptions about insurance value, reducing uptake among underserved populations.
-
Low Trust and Weak Consumer Confidence: Persistent concerns about delayed claims settlements, opaque policy terms, and perceived insurer inefficiency have weakened consumer confidence. Negative experiences have reinforced scepticism, particularly in markets with limited regulatory enforcement of claims standards.
-
High Informality in Employment: Traditional insurance models are structurally linked to formal employment. With a large proportion of SSA's labour force in informal employment, many individuals fall outside employer-sponsored coverage, increasing the need for flexible microinsurance solutions tailored to informal workers.
-
Weak Distribution Channels: Insurance distribution remains concentrated in urban areas. Inadequate branch networks, low agent penetration, and underdeveloped distribution infrastructure limit rural outreach, though mobile-based channels are increasingly helping bridge this gap.
-
Limited Product Relevance: Many products fail to align with the income patterns and risk profiles of low-income or informal sector households. Traditional offerings are often perceived as too expensive, overly complex, or insufficiently relevant to everyday risks such as crop failure, medical emergencies, or business interruption
Addressing these barriers will be critical to unlocking the full potential of the insurance sector in Sub-Saharan Africa. In particular, digital innovation, mobile-based insurance models, and fintech-driven solutions are increasingly emerging as key enablers of broader financial access, setting the stage for the next phase of transformation in the region’s financial services landscape.
Section III: Mobile Money and Fintech Innovation
The financial services landscape in Sub-Saharan Africa has undergone a significant transformation over the past decade, driven largely by the rapid expansion of mobile money and fintech innovation. In a region historically constrained by limited banking infrastructure, high levels of financial exclusion, and large informal economies, digital financial services have emerged as a critical enabler of financial access. Mobile money platforms, digital wallets, agency banking, and fintech solutions have expanded access to payments, savings, lending, remittances, and insurance services, particularly among underserved and previously unbanked populations.
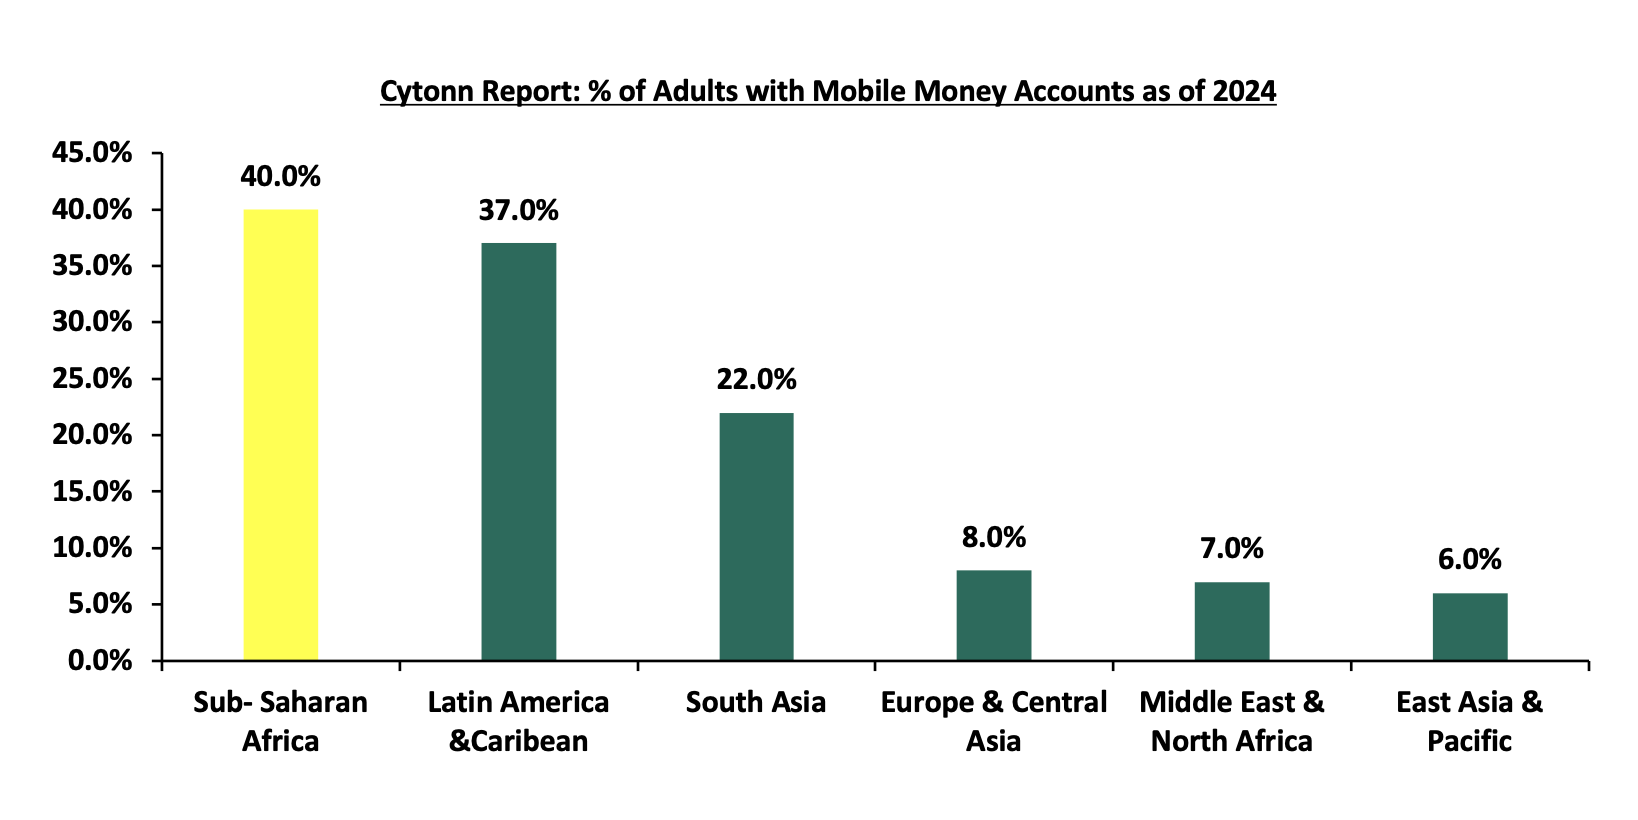
Source: Global Findex Database 2025
Sub-Saharan Africa has become the global leader in mobile money adoption, accounting for the majority of registered mobile money accounts worldwide. This digital transformation has not only enhanced financial inclusion but also improved efficiency in payments, reduced transaction costs, and strengthened economic participation across the region.
-
Growth of Mobile Money Services
Mobile money has become one of the most transformative innovations in SSA’s financial sector, helping bridge longstanding gaps in access to formal financial services. The sector has expanded rapidly due to high mobile phone penetration, supportive regulatory environments, and limited access to traditional banking infrastructure. Mobile money platforms such as M-Pesa in Kenya, MTN Mobile Money in Ghana and Uganda, and Orange Money in Francophone Africa have enabled millions of individuals to conduct financial transactions through mobile devices without requiring conventional bank accounts. According to industry estimates, SSA accounts for more than 70.0% of global mobile money transaction value, underscoring the region’s dominance in digital financial services. Beyond person-to-person transfers, mobile money ecosystems increasingly facilitate merchant payments, government transfers, international remittances, savings products, and access to microcredit.

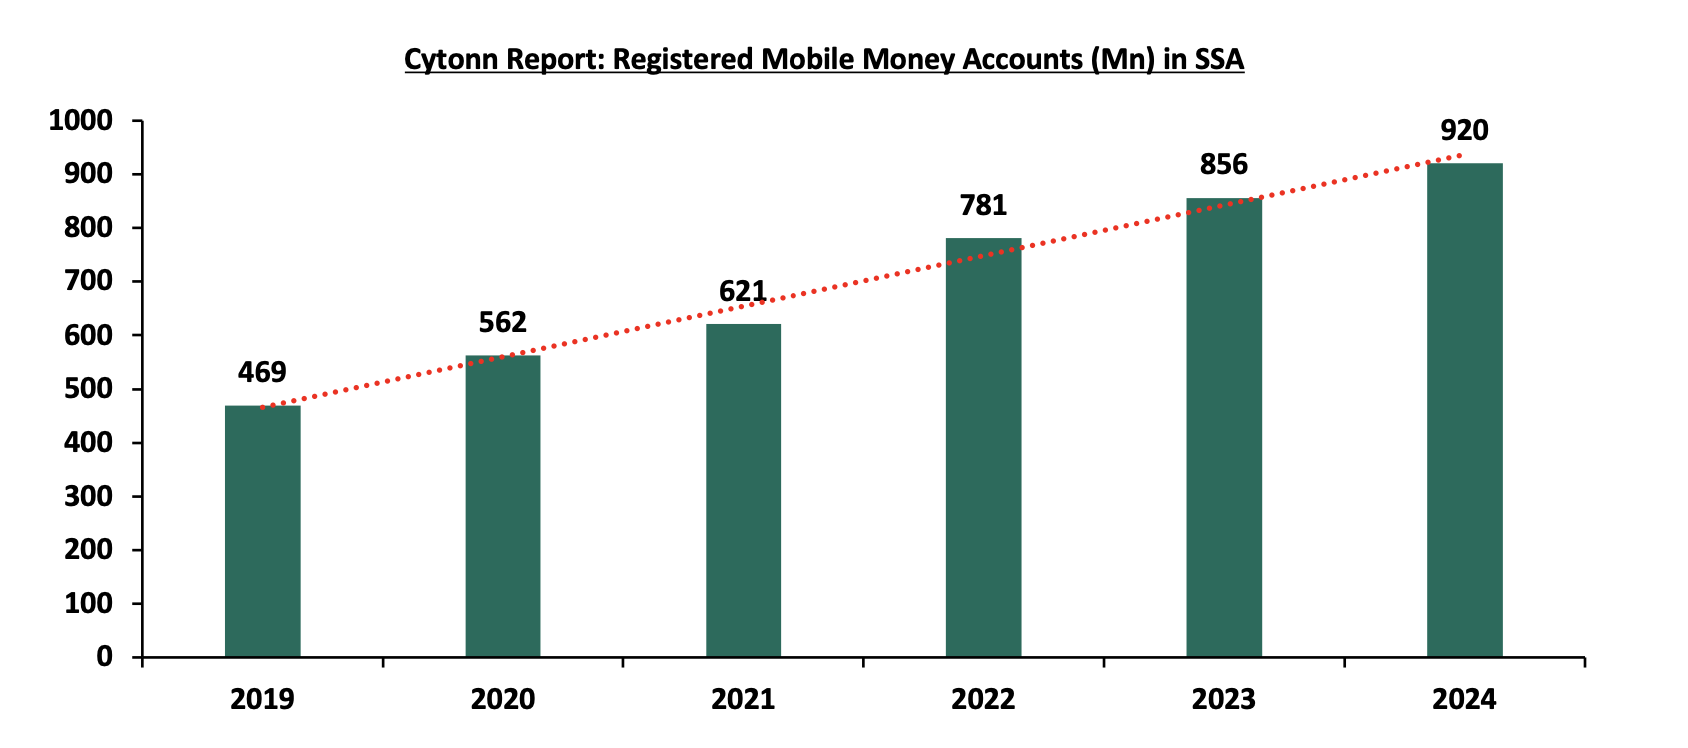
Source: GSMA State of the Industry Report
Registered mobile money accounts in Sub-Saharan Africa grew at a compounded annual growth rate (CAGR) of 14.4% between 2019 and 2024, underscoring the rapid expansion of digital financial services across the region, supported by increased mobile penetration, stronger fintech ecosystems, and rising demand for digital payments.
-
Digital Payments, Cryptocurrency and Stablecoins Adoption
The growing digitalization of financial services has accelerated the adoption of digital payments, cryptocurrencies, and stablecoins across SSA. Digital payment systems have expanded rapidly, supported by mobile money ecosystems, e-commerce growth, and increased smartphone usage. Consumers and businesses increasingly rely on digital channels for merchant payments, peer-to-peer transfers, and cross-border transactions, reducing dependence on cash-based systems
Source: Chainalysis - The 2025 Geography of Crypto Report
APAC (East Asia, South Asia, Southeast Asia, and Oceania.)
MENA (The Levant, the Gulf States, and the Maghreb)
Sub-Saharan Africa was the third fastest at 52.0%, indicating the region’s continued reliance on crypto for remittances and everyday payments. These figures underscore a broad shift in crypto momentum toward the Global South, where on-the-ground utility is increasingly fueling adoption. Nigeria, ranked 6th, is the only sub-Saharan country that appears in The 2025 Global Crypto Adoption Index Top 20.
Overall, mobile money and fintech innovation have fundamentally transformed financial service delivery in Sub-Saharan Africa, helping address longstanding barriers to financial inclusion while fostering greater efficiency and accessibility. As digital ecosystems continue to evolve, these innovations are increasingly supporting broader capital formation, investment activity, and financial market participation, creating important linkages with the development of capital markets and investment services across the region.
Section IV: Capital Markets and Investment Services
Capital markets in Sub-Saharan Africa (SSA) have expanded steadily over the past two decades, playing an increasingly important role in mobilizing long-term capital, facilitating investment, and supporting economic development. While the region’s financial systems have historically been dominated by banking institutions, stock exchanges, bond markets, private capital, and alternative investment vehicles are gradually becoming more prominent sources of financing for governments and businesses. Capital markets enable firms to raise equity and debt financing, provide investment opportunities for institutional and retail investors, and improve resource allocation within economies. However, despite progress, most SSA capital markets remain relatively shallow, characterized by low liquidity, limited product diversification, concentrated investor participation, and low market capitalization relative to more developed regions.
-
Stock Exchanges in Sub-Saharan Africa
Stock exchanges across SSA serve as key platforms for raising capital, facilitating investment, and supporting economic growth. However, market depth and sophistication vary significantly across countries. The region hosts more than 25 stock exchanges, though activity remains heavily concentrated in a few markets, particularly South Africa, Nigeria and Kenya
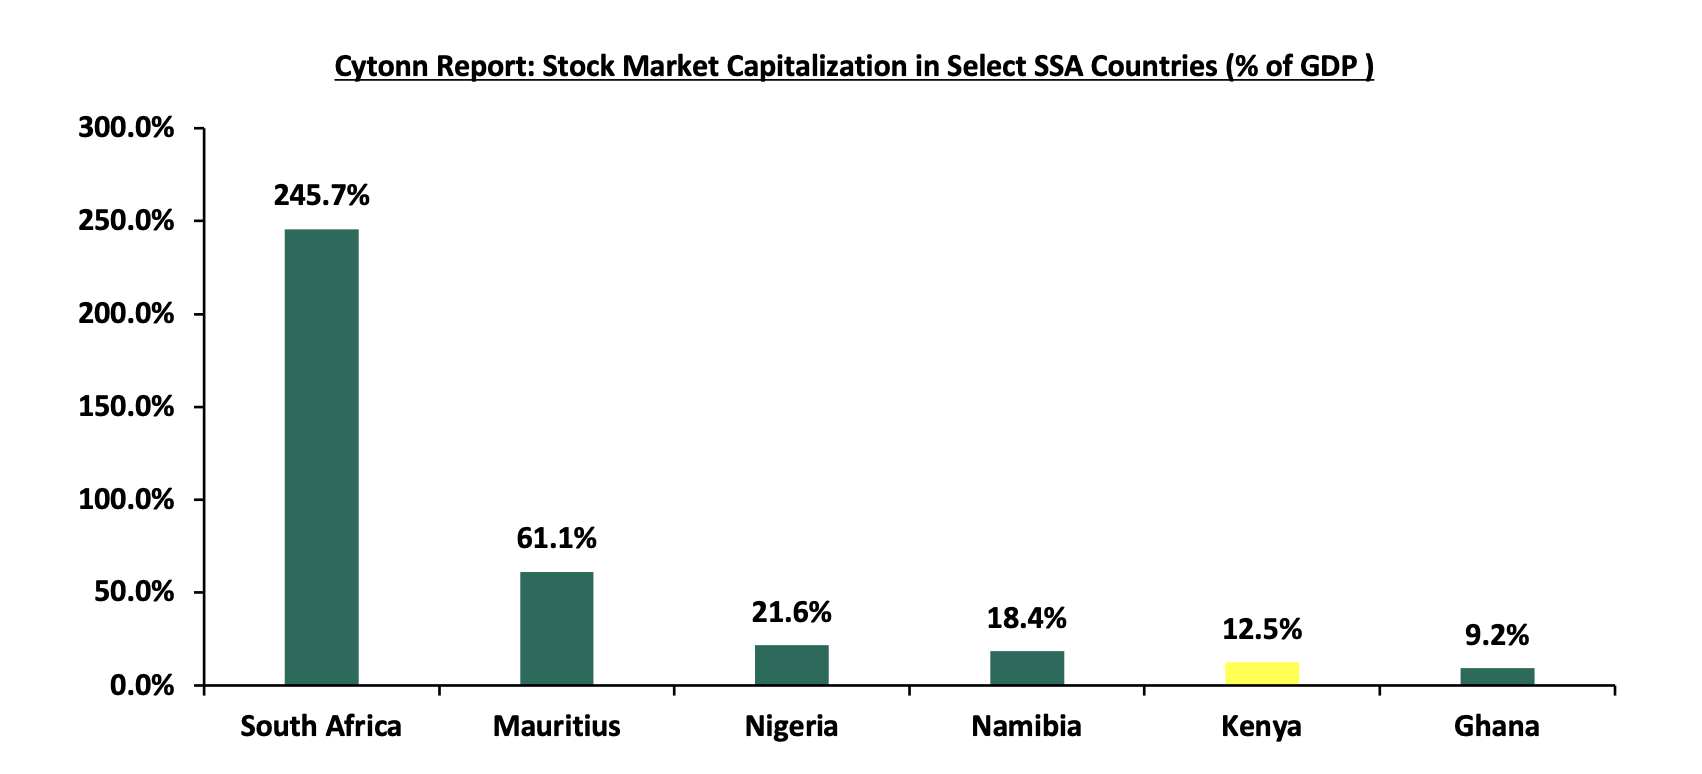
Source: World Bank as at 2024
South Africa stands out overwhelmingly at 245.7%, reflecting the depth, sophistication, and maturity of the Johannesburg Stock Exchange, which dominates regional capital markets and attracts substantial domestic and international investment. Mauritius follows distantly at 61.1%, supported by its role as a financial services hub and favorable investment environment. Nigeria (21.6%) and Namibia (18.4%) occupy the middle tier, indicating moderately developed equity markets with growing investor participation but still limited depth compared to more advanced markets. Kenya’s capitalization at 12.5% and Ghana’s 9.2% reveal relatively smaller and less liquid stock exchanges, suggesting constrained participation, fewer listed companies, and lower market penetration within their economies. The data shows the uneven development of capital markets across SSA, with most economies still facing challenges such as limited listings, low investor confidence, and insufficient market liquidity, while South Africa remains the clear regional leader.
-
Bond Market in Sub-Saharan Markets
Bond markets in SSA have become increasingly important as governments seek long-term financing for infrastructure development, fiscal deficits, and economic expansion. Sovereign debt dominates most bond markets in the region, with government securities accounting for the majority of issuance and trading activity. Treasury bonds and bills are widely used to finance public expenditure, while corporate bond markets remain comparatively underdeveloped due to limited issuer participation and weaker investor demand.
Several countries, including Kenya, Nigeria, Ghana, and South Africa, have increasingly utilized domestic bond markets to reduce dependence on external borrowing and improve debt sustainability. At the same time, Eurobond issuance gained popularity over the past decade as African governments accessed international capital markets, although rising global interest rates and debt vulnerabilities have recently increased borrowing costs.
Despite progress, bond markets in SSA continue to face liquidity constraints, short yield curves, narrow investor bases, and underdeveloped secondary markets. Strengthening institutional investors such as pension funds and insurance companies will be critical in deepening domestic debt markets.
-
Private Equity and Venture Capital
Private equity (PE) and venture capital (VC) have emerged as increasingly important financing channels in SSA, particularly for startups and small-to-medium enterprises (SMEs) that often face barriers accessing traditional bank credit or public markets. Investor interest has grown significantly in sectors such as fintech, telecommunications, renewable energy, healthcare, logistics, and agriculture, driven by favorable demographics, rising digitalization, and expanding consumer markets.
South Africa, Nigeria and Kenya have emerged as leading destinations for private capital, with fintech consistently attracting the largest share of venture funding. The rapid growth of mobile money, digital payments, and e-commerce has accelerated investor interest in African technology ecosystems, while development finance institutions (DFIs) continue to play a key role in supporting investment activity.
However, private capital flows remain vulnerable to macroeconomic uncertainty, currency depreciation, weak exit opportunities, and inconsistent regulatory environments, which continue to affect investment attractiveness in some markets.
As capital markets continue to evolve and investment activity expands, regulatory oversight becomes increasingly important in safeguarding financial stability, protecting investors, and promoting market integrity. This highlights the growing role of central banks, financial regulators, and anti-money laundering frameworks in shaping the broader financial services landscape across Sub-Saharan Africa.
Section V: Challenges Facing the Financial Services Sector in Sub- Sahara Africa
Despite the steady expansion of financial services across Sub-Saharan Africa, the sector continues to face a range of structural, technological, and macroeconomic challenges that constrain its full development. While digital innovation, mobile money, fintech growth, and financial inclusion have improved access to formal financial services, progress remains uneven across countries and institutions. Weak infrastructure, cybersecurity threats, macroeconomic volatility, limited financial literacy, and political uncertainty continue to hinder broader financial deepening, operational efficiency, and investor confidence. Addressing these challenges will be essential in strengthening financial resilience, expanding financial inclusion, and supporting sustainable economic growth across the region.
Below are some of the challenges facing the sector:
-
Infrastructure Limitations
Infrastructure gaps remain a major impediment to financial sector development in Sub-Saharan Africa, particularly in rural and underserved areas. Limited access to reliable electricity, internet connectivity, and telecommunications infrastructure continues to constrain the adoption of digital financial services, including mobile banking, online payments, and fintech solutions. In many countries, inadequate physical banking infrastructure, including branch and ATM networks, further limits access to formal financial services. While mobile money has helped bridge some of these gaps, digital infrastructure deficiencies continue to slow broader financial sector expansion, particularly among low-income and remote populations.
-
Cybersecurity Risks
As financial systems become increasingly digitized, cybersecurity risks have emerged as a growing concern across the region. The rapid expansion of mobile money, digital payments, and fintech platforms has increased exposure to cyberattacks, fraud, identity theft, data breaches, and financial crime. Weak cybersecurity infrastructure, limited institutional preparedness, and low digital awareness among consumers heighten vulnerability to operational disruptions and financial losses. Financial institutions and regulators are increasingly investing in cybersecurity frameworks, digital identity systems, and consumer protection mechanisms; however, significant capacity gaps remain across many markets.
-
Political and Economic Instability
Political uncertainty, regulatory inconsistency, and broader macroeconomic instability continue to affect financial sector performance in several SSA markets. Political disruptions, governance challenges, and policy unpredictability may weaken investor confidence, reduce capital inflows, and delay financial sector reforms. At the same time, economic slowdowns, rising public debt levels, and external shocks, including commodity price fluctuations and global monetary tightening, can negatively affect credit growth, investment activity, and financial system stability. Countries with stronger institutional frameworks generally demonstrate greater resilience in maintaining financial market confidence during periods of uncertainty.
-
Currency Volatility and Inflation
Exchange rate fluctuations and persistent inflationary pressures present significant risks to financial sector development across the region. Currency depreciation increases the cost of imports, raises debt servicing burdens, and heightens foreign exchange risks for businesses and financial institutions. High inflation also erodes household purchasing power, reduces savings accumulation, and increases borrowing costs through higher interest rates. These pressures can constrain credit demand, weaken insurance affordability, and reduce participation in long-term investment products. In economies experiencing persistent currency instability, consumers increasingly seek alternative stores of value, including foreign currency assets and digital assets such as stablecoins.
-
Low Financial Literacy
Low levels of financial literacy continue to limit effective participation in formal financial systems across much of Sub-Saharan Africa. Many individuals lack adequate understanding of financial products, including savings, insurance, investment, credit management, and digital financial services. This contributes to lower uptake of formal financial products, increased vulnerability to fraud, and poor financial decision-making. As financial ecosystems become more digitized and sophisticated, strengthening financial education and consumer awareness will be critical to ensuring that greater access to financial services translates into meaningful financial inclusion and long-term financial resilience.
While Sub-Saharan Africa’s financial services sector has made substantial progress in expanding access and innovation, persistent structural and macroeconomic constraints continue to limit its full potential. Addressing infrastructure deficits, strengthening cybersecurity resilience, improving macroeconomic stability, and enhancing financial literacy will be critical in deepening financial inclusion and promoting sustainable sector growth. As governments, regulators, and private sector players continue to invest in digital infrastructure and policy reforms, the region is likely to experience further financial transformation, albeit at varying speeds across markets.
Section VII: Recommendations and conclusion
The financial services sector in Sub-Saharan Africa has demonstrated significant progress over the past decade, driven by rapid digital transformation, mobile money adoption, improving financial inclusion, and expanding fintech ecosystems. However, persistent structural and institutional constraints continue to limit the sector’s full contribution to inclusive economic growth. To strengthen financial resilience and accelerate sector development the following recommendations would come in handy
-
Strengthen Digital and Financial Infrastructure
Governments and private sector stakeholders should increase investment in electricity access, telecommunications networks, broadband connectivity, and digital payment infrastructure to support broader financial inclusion. Expanding digital infrastructure, particularly in rural and underserved areas, will enhance access to mobile banking, digital payments, insurance, and investment services. Improved interoperability between financial institutions and payment systems will also be critical in reducing transaction costs and improving efficiency.
-
Promote Inclusive Financial Access
Financial institutions and policymakers should continue expanding access to affordable and tailored financial products for underserved populations, particularly women, youth, rural households, and informal sector workers. Greater emphasis should be placed on low-cost savings products, microcredit, agricultural insurance, and microinsurance solutions to address the unique financial needs of low-income populations. Leveraging mobile money ecosystems can further strengthen access to formal financial services.
-
Strengthen Regulatory and Supervisory Frameworks
Regulators should continue modernizing financial sector regulation to keep pace with digital innovation while ensuring financial stability and consumer protection. Harmonizing regulations across countries, strengthening licensing frameworks for fintech firms, and enhancing digital consumer protection policies will be essential in fostering trust and encouraging innovation. Greater regional regulatory cooperation may also help support cross-border payments and financial market integration.
-
Enhance Cybersecurity and Consumer Protection
As digital financial services continue to expand, financial institutions should strengthen cybersecurity systems, fraud monitoring mechanisms, and data privacy protections. Regulators should prioritize cyber resilience frameworks and strengthen consumer awareness regarding digital fraud risks. Enhancing digital identity systems and authentication measures can also reduce vulnerabilities across financial ecosystems.
-
Improve Financial Literacy and Consumer Awareness
Governments, financial institutions, and educational institutions should strengthen financial literacy initiatives to improve understanding of savings, insurance, investments, responsible borrowing, and digital financial services. Increased financial awareness can help improve trust in formal financial systems, reduce vulnerability to fraud, and encourage broader adoption of financial products.
-
Deepen Capital Markets and Domestic Investment
Policymakers should strengthen domestic capital markets by encouraging broader participation from pension funds, insurance companies, and retail investors. Improving liquidity, increasing product diversification, and supporting SME listings can help expand access to long-term financing for businesses. Greater regional integration of stock exchanges and bond markets may also improve market efficiency and attract foreign investment.
Conclusion
Sub-Saharan Africa’s financial services sector has undergone substantial transformation, evolving from a predominantly bank-centered system toward a more diversified and digitally enabled ecosystem. The expansion of mobile money, fintech innovation, insurance services, and capital market development has significantly improved financial access and economic participation across the region. In particular, digital financial solutions have helped overcome traditional barriers associated with limited banking infrastructure, contributing to meaningful gains in financial inclusion.
Nevertheless, the region continues to face important challenges, including infrastructure limitations, cybersecurity threats, macroeconomic instability, regulatory fragmentation, and low financial literacy, all of which constrain deeper financial sector development. Considerable disparities also remain across countries, with more developed markets such as South Africa, Kenya, Mauritius, and Nigeria significantly outperforming less developed financial systems.
Looking ahead, the long-term outlook for financial services in Sub-Saharan Africa remains broadly positive, supported by favorable demographics, rising digital adoption, increasing smartphone penetration, and ongoing policy reforms. If supported by stronger institutions, targeted investment, and inclusive regulation, the region is well-positioned to deepen financial inclusion, strengthen financial resilience, and unlock broader economic growth opportunities over the coming decade.
Disclaimer: The views expressed in this publication are those of the writers where particulars are not warranted. This publication, which follows Section 2 of the Capital Markets Authority Act Cap 485A, is meant for general information only and is not a warranty, representation, advice or solicitation of any nature. Readers are advised in all circumstances to seek the advice of a registered investment advisor

- Talk to us
- Kenya
- P.O Box 20695 - 00200, Nairobi, Kenya
- Cell +254709101200
- Tel +254709101200
- WhatsApp +254741676635
- United States
- +254709101200
- DOWNLOAD OUR APP
-


- Kenya
- 8th Floor, Pinetree Plaza, Kaburu Drive, Ngong Road, Nairobi, Kenya
- USA
- Suite 1150, 1775 Eye Street NW, USA, Washington DC 20006, USA
- Investments
- High Yield
- Private Equity
- Real Estate
- Real Estate
- RiverRun Estates
- Cytonn Towers
- The Ridge
- Taraji Heights
- The Alma