
Sub-Saharan Africa Eurobonds Performance 2026 Report, & Cytonn Weekly #38.2026
By Research Team, Sep 27, 2026
Executive Summary
Fixed Income
During the week, T-bills were oversubscribed for the eighth consecutive week, with the overall subscription rate coming in at 149.0% lower than the subscription rate of 152.6% recorded the previous week. Investors’ preference for the shorter 91-day paper persisted, with the paper receiving bids Kshs 17.7 bn against the offered Kshs 8.0 bn, translating to a subscription rate of 221.7%, lower than the subscription rate of 290.6%, recorded the previous week. The subscription rate for the 182-day paper increased to 127.6% from 100.5% recorded the previous week, while that of the 364-day paper increased to 112.3% from 94.3% recorded the previous week, the government accepted a total of Kshs 33.4 bn worth of bids out of Kshs 41.7 bn bids received, translating to an acceptance rate of 79.9%. The yields on the government papers were on a downward trajectory, with the yields on the 182-day decreased the most by 1.5 bps to 8.89% from 8.91% recorded the previous week, while the 364-day papers decreased by 1.3 bps to 9.04% from 9.06% recorded the previous week. While the yields on the 91-day paper decreased by 0.6 bps to remain relatively unchanged from 8.78% recorded the previous week;
During the week, the central Bank of Kenya announced the reopening of the 15-year and 20-year fixed coupon Treasury bonds, FXD3/2019/015 and FXD1/2019/020, seeking to raise Kshs 50.0 bn for budgetary support. FXD3/2019/015 has a fixed coupon rate of 12.3% and a remaining tenor of 7.8 years to maturity, while FXD1/2019/020 has a fixed coupon rate of 12.9% and a remaining tenor of 12.5 years to maturity. The period of sale opened on 24th September 2026 and closes on 30th September 2026, with the auction and settlement dates set for 30th September and 5th October 2026, respectively. Our recommended bidding range for is FXD3/2019/015 12.4%-12.8%, while that for FXD1/2019/020 is 12.8% - 13.3%, guided by prevailing yields on comparable tenors on the NSE yield curve as at 25th September 2026.
We are projecting that the year-on-year inflation rate for September 2026 will remain within the range of 6.3%-6.6%;
Equities
During the week, the equities market was on an upward trajectory, with the NSE 10, NSE 25, NSE 20 and NASI gaining by 5.6%, 5.1%, 4.8% and 4.1%, respectively, taking their YTD performance to gains of 40.2%, 38.9%, 38.0% and 32.6%, respectively for NSE 10, NSE 20, NSE 25 and NASI respectively. The week-on-week equities market performance was mainly driven by gains recorded by large-cap stocks such as Equity Group, KCB Group and ABSA Bank of 8.6%, 7.5% and 7.4%, respectively. The performance was however weighed down by losses recorded by large-cap stocks such as Standard Chartered Bank and EABL of 1.9% and 0.7%, respectively. During the week, the banking sector index increased by 6.1% to 293.5 from the 276.7 recorded the previous week. This is attributable to gains recorded by large cap stocks such as Equity, KCB and ABSA bank of 8.6%, 7.5% and 7.4% respectively. The performance was however weighed down by losses recorded by large-cap stocks such as Standard Chartered Bank of 1.9%. During the week Quick Mart PLC (Quickmart) announced its intention to list on the Main Investment Market Segment of the Nairobi Securities Exchange (NSE) through an offer for sale (OFS) by its sole shareholder, Sokoni Retail Kenya Limited (SRKL). The proposed Offer comprises 2.0 bn existing ordinary shares with a nominal value of Kshs 0.2 each, representing 50.0% of Quickmart’s issued share capital, with an over-allotment option of up to 15.0% of the Offer Shares that could increase the stake sold to 57.5%;
Real Estate
During the week, Kenya's mortgage market showed signs of recovery, with the Central Bank of Kenya (CBK) reporting that the value of outstanding mortgage loans increased by 10.0% to Kshs 307.2 bn in 2025 from Kshs 279.3 bn 2024. The increase of Kshs 27.9 bn was attributed to new mortgage lending during 2025. The number of mortgage loans increased by 2.5% to 30,762 in 2025 from 30,016 in 2024, indicating that the expansion in the mortgage portfolio was accompanied by a relatively modest increase in the number of facilities.
During the week, the Parliamentary Budget Office (PBO) flagged a Kshs 118.3 bn financing gap facing Kenya's housing development programme reporting that Kshs 228.3 bn is required in FY2026/27 to finance ongoing housing projects, against an approved allocation of Kshs 110.0 bn, creating a Kshs 118.3 bn funding shortfall.
During the week, the Kenya Wildlife Service (KWS) and Kenya Tourism Board (KTB) launched Kenya’s digital tourism through the “Experience Wonder Live from Kenya” programme. The six-month initiative provides live wildlife and conservation broadcasts from nine KWS-managed protected areas, including Nairobi National Park, Amboseli, Tsavo East, Tsavo West, the Aberdares, Sibiloi, Meru, Ruma and Mount Elgon. The broadcasts are distributed through multiple international digital platforms and currently reach more than 500,000 daily unique viewers across 16 global platforms.
During the week, Zaria Group through its local subsidiary, Metroarena Development Company, proposed a Kshs 38.1 bn Nairobi Railway City development, which will feature a 10,000-seat multi-purpose indoor arena as the centrepiece of a wider Meetings, Incentives, Conferences and Exhibitions (MICE) development. The proposal follows a long-term lease agreement between Zaria Group and Kenya Railways Corporation signed in April 2026.
On the Unquoted Securities Platform Acorn D-REIT and I-REIT traded at Kshs 29.7 and Kshs 24.4 per unit, respectively, as per the last updated data on 18th September 2026. The performance represented a 48.5% and 22.0% gain for the D-REIT and I-REIT, respectively, from the Kshs 20.0 inception price. The volumes traded for the D-REIT and I-REIT came in at 13.7 mn and 46.0 mn shares, respectively. Additionally, ILAM Fahari I-REIT traded at Kshs 13.8 per share as of 18th September 2026, representing a 31.0 % loss from the Kshs 20.0 inception price
Digital Payments Weekly Highlights
During the week, Visa released its Money Travels 2026 report highlighting that consumer interest in stablecoins nearly doubles when bank-level protections are introduced, with U.S. adoption intent climbing from 36.0% to 56.0% under hypothetical deposit insurance and fraud safeguards, while over 44.0% of Americans express concerns over AI deepfakes and cross-border payment scams; the findings emphasize that trust in traditional financial providers remains the decisive anchor for digital currency adoption;
During the week, Mastercard partnered with the McLaren Formula 1 Team to showcase the speed and reliability of Mastercard Move in global B2B payments, running head-to-head with a record 1.8-second pit stop; alongside this, Mastercard released its "Money in Motion" report with Bain & Company, showing that 91.0% of small and medium-sized businesses plan to switch cross-border payment providers over the next two years as they demand greater speed, transparency, and advanced fraud-detection features;
During the week, Block joined the x402 Foundation as a core contributor, integrating Bitcoin Lightning payments into the open HTTP 402 standard to deliver instant, low-cost rails tailored for the emerging agentic economy; by backing an open, community-governed standard where AI agents and automated systems can transact seamlessly without gatekeepers, Block is advancing Bitcoin as everyday money for high-volume, micro-payment workflows;
During the week, Circle Foundation announced its inaugural domestic grants at the Clinton Global Initiative, allocating funds to the Accion Opportunity Fund and Pacific Community Ventures to scale AI-powered tools like Credit Compass 2.0 and the Radiant Data Hub; these technologies help CDFIs expand small business credit access and provide underserved entrepreneurs with clear, data-driven roadmaps to capital;
The digital payment stocks we track (AXP, Visa, Mastercard, Circle, Block, and PayPal) are currently trading at an average forward P/E of 23.8x, implying that investors continue to price in resilient earnings growth and strong digital payment adoption, although elevated operating costs and higher client incentives across legacy card networks may moderate valuation expansion in the near term;
Focus of the Week
The international Eurobond market has continued to provide Sub Saharan African (SSA) countries with an important source of foreign currency financing, with the region recording stronger market access in 2026. Between January and September 2026 Angola, Kenya, Ivory Coast, DRC, Gabon, Cameroon, and Benin, raised USD 2.5 bn, USD 2.3 bn, USD 1.3 bn, USD 1.3 bn, USD 0.9 bn, USD 0.8 bn and USD 0.4 bn respectively, raising a total of USD 9.3 bn through Eurobond issuances. This compares with USD 7.9 bn raised through Nigeria, Ivory Coast, Angola, Kenya and Benin of USD 2.4 bn, USD 1.8 bn, USD 1.8 bn, USD 1.5 bn and USD 0.5 bn respectively in 2025, reflecting stronger investor appetite and improved access to international capital markets. Secondary market performance remained mixed, with selected SSA Eurobonds, including those of Kenya, Nigeria, Côte d’Ivoire and Benin, recording marginally higher yields between January and September 2026, while the Angola 30 year and Ivory Coast 30-year Eurobonds recorded marginal declines in yields of 0.6% and 0.1% points, respectively. The increase in yields points to continued investor caution, although performance varied across countries as investors differentiated sovereigns based on fiscal positions, debt sustainability, creditworthiness and foreign exchange stability. Public debt levels remain a key concern, with countries such as Senegal, Zambia and Kenya recording elevated debt to GDP ratios, while Ghana recorded a significant improvement following its debt restructuring. Continued fiscal consolidation, prudent debt management, stronger revenue mobilization and improved debt transparency will therefore remain critical to sustaining investor confidence and containing external borrowing costs.
Investment Updates:
- Weekly Rates: Cytonn Money Market Fund closed the week at a yield of 11.0% p.a. To invest, dial *809# or download the Cytonn App from Google Play store here or from the Appstore here;
- We continue to offer Wealth Management Training every Tuesday, from 7:00 pm to 8:00 pm. The training aims to grow financial literacy among the general public. To register for any of our Wealth Management Trainings, click here. If interested in our Private Wealth Management Training for your employees or investment group, please get in touch with us through wmt@cytonn.com;
- Cytonn Asset Managers Limited (CAML) continues to offer pension products to meet the needs of both individual clients who want to save for their retirement during their working years and Institutional clients that want to contribute on behalf of their employees to help them build their retirement pot. To more about our pension schemes, kindly get in touch with us through pensions@cytonn.com;
Hospitality Updates:
- We currently have promotions for Staycations. Visit com/offers for details or email us at sales@cysuites.com;
Money Markets, T-Bills Primary Auction:
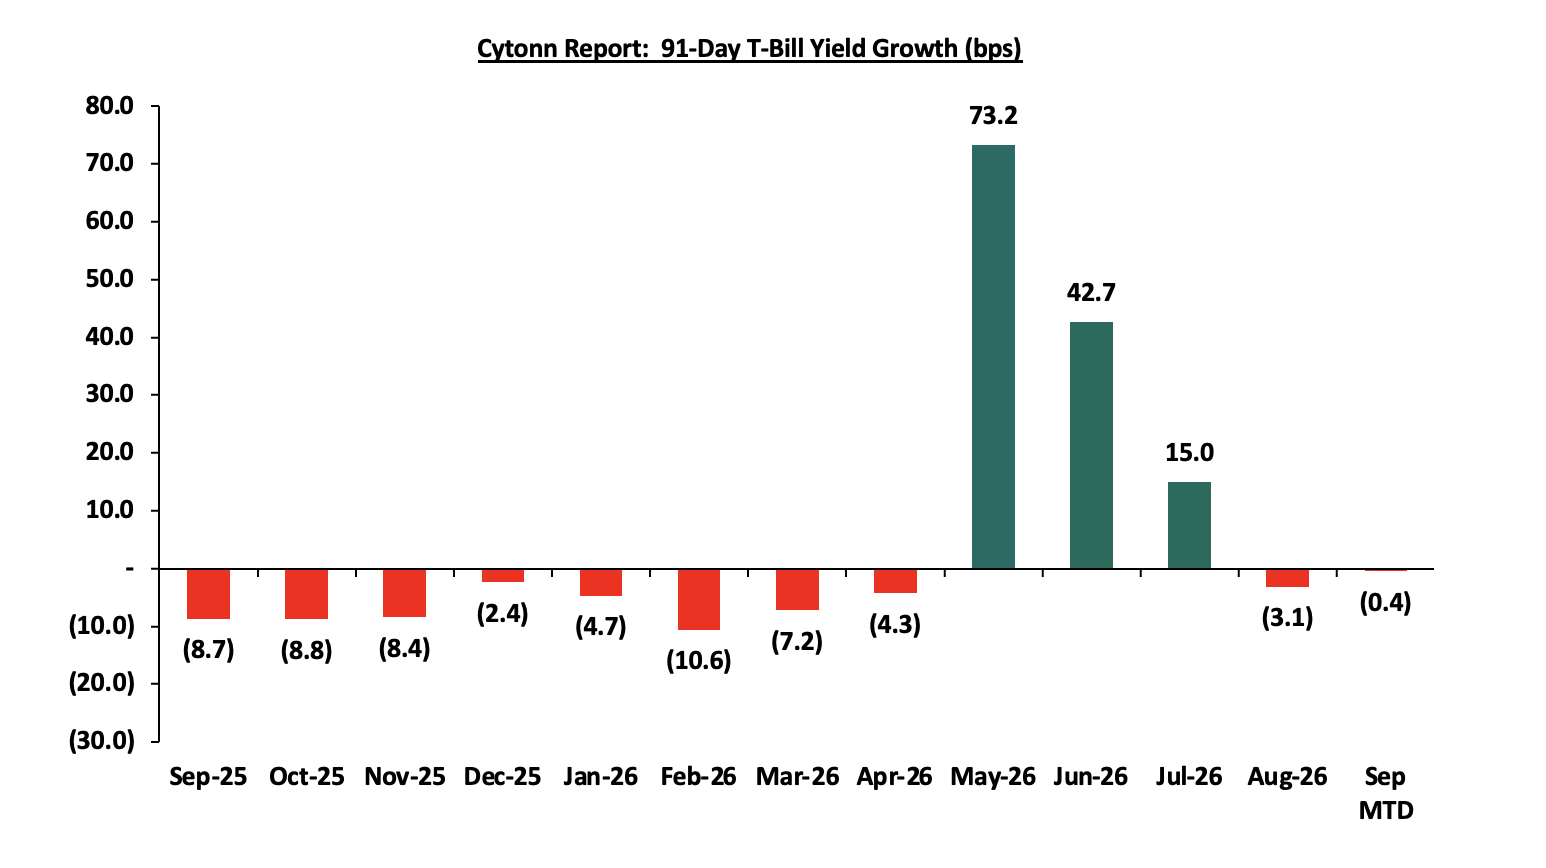
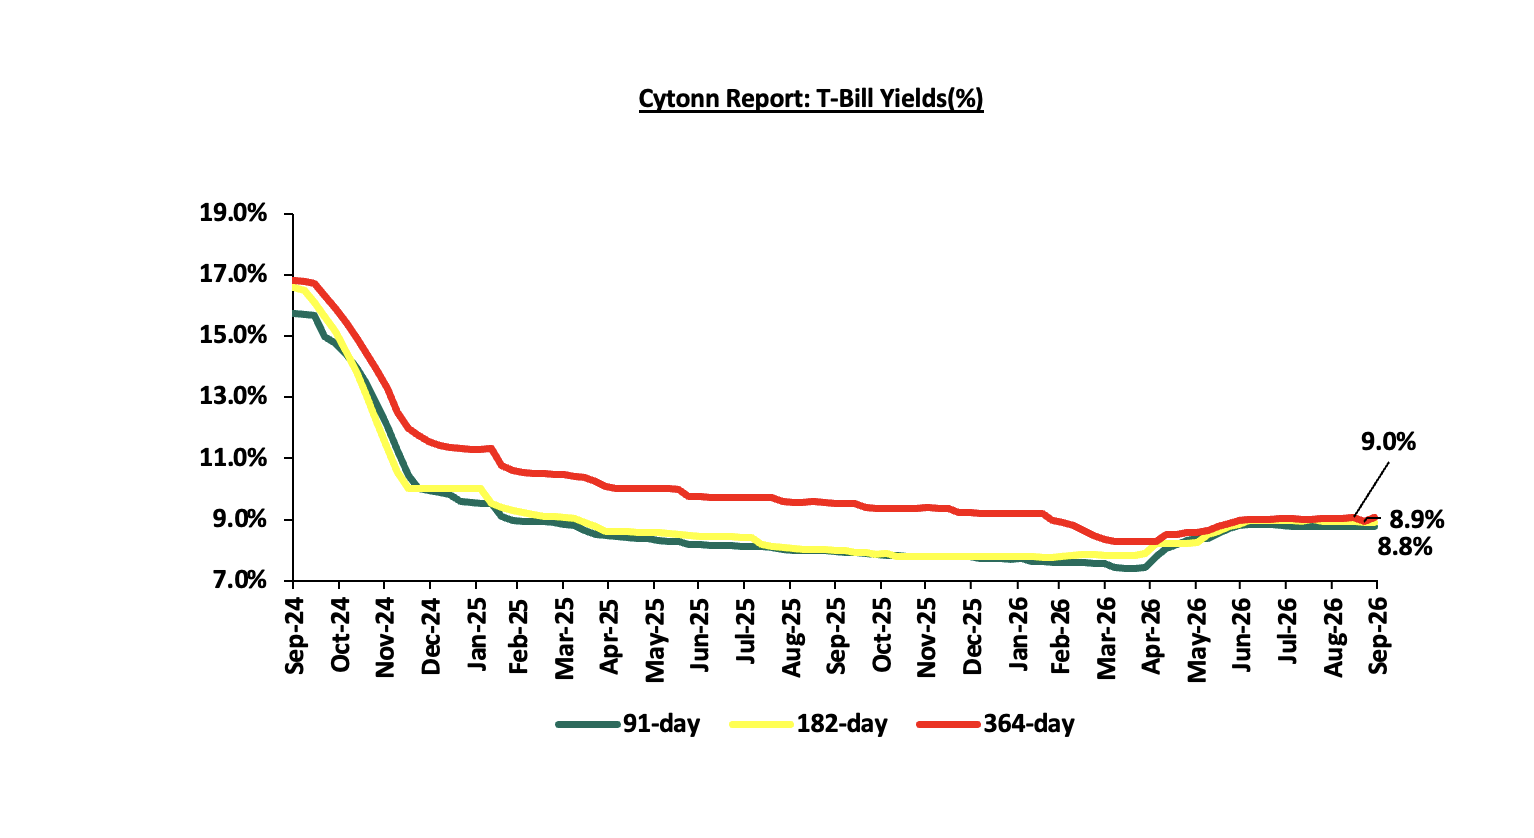
This week, T-bills were oversubscribed for the eighth consecutive week, with the overall subscription rate coming in at 149.0% lower than the subscription rate of 152.6% recorded the previous week. Investors’ preference for the shorter 91-day paper persisted, with the paper receiving bids of Kshs 17.7 bn against the offered Kshs 8.0 bn, translating to a subscription rate of 221.7%, lower than the subscription rate of 290.6%, recorded the previous week. The subscription rate for the 182-day paper increased to 127.6% from 100.5% recorded the previous week, while that of the 364-day paper increased to 112.3% from 94.3% recorded the previous week, the government accepted a total of Kshs 33.4 bn worth of bids out of Kshs 41.7 bn bids received, translating to an acceptance rate of 79.9%. The yields on the government papers were on a downward trajectory, with the yields on the 182-day decreased the most by 1.5 bps to 8.89% from 8.91% recorded the previous week, while the 364-day papers decreased by 1.3 bps to 9.04% from 9.06% recorded the previous week. Moreover, the yields on the 91-day paper decreased by 0.6 bps to remain relatively unchanged from 8.78% recorded the previous week;
The chart below shows the yield growth rate for the 91-day paper from September 2025 to date:
The chart below shows the performance of the 91-day, 182-day and 364-day papers from September 2024 to September 2026:
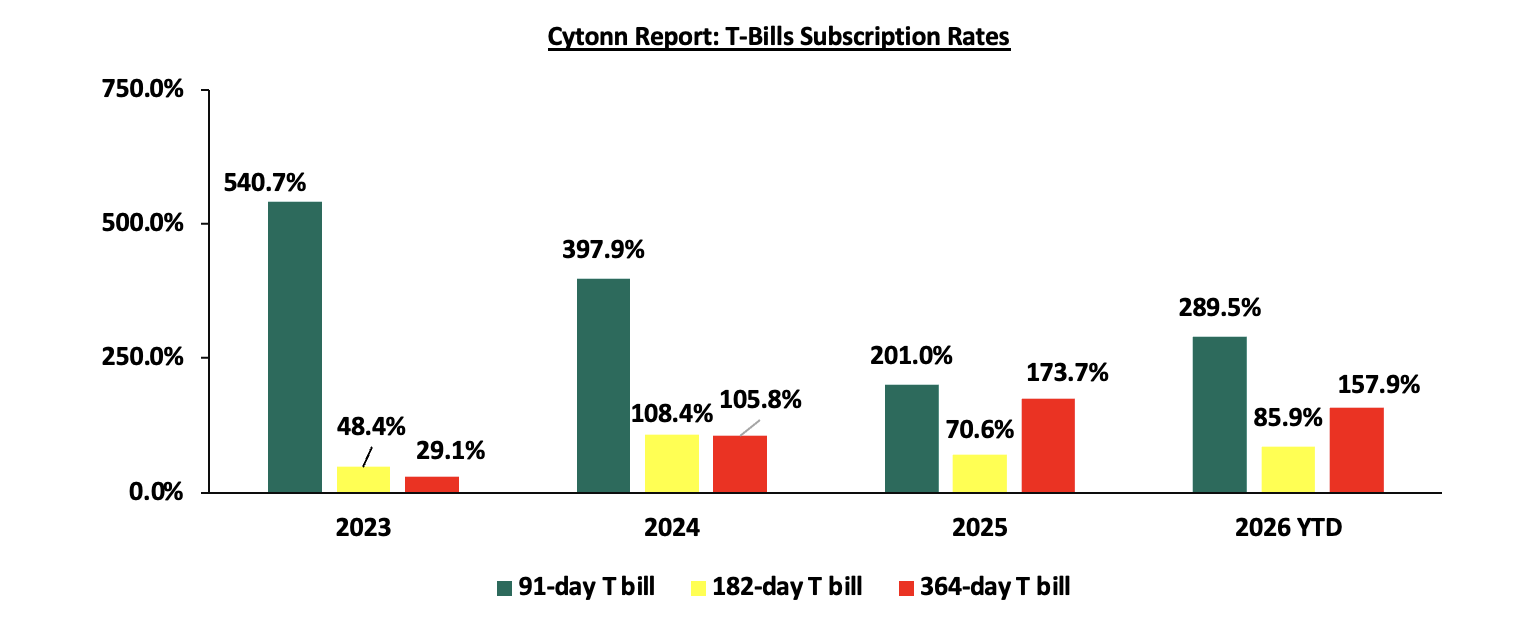
The chart below compares the overall average T-bill subscription rates obtained in 2023, 2024, 2025 and 2026 Year-to-date (YTD):
T-Bonds Primary Market:
During the week, the central Bank of Kenya announced the reopening of the 15-year and 20-year fixed coupon Treasury bonds, FXD3/2019/015 and FXD1/2019/020, seeking to raise Kshs 50.0 bn for budgetary support. FXD3/2019/015 has a fixed coupon rate of 12.3% and a remaining tenor of 7.8 years to maturity, while FXD1/2019/020 has a fixed coupon rate of 12.9% and a remaining tenor of 12.5 years to maturity. The period of sale opened on 24th September 2026 and closes on 30th September 2026, with the auction and settlement dates set for 30th September and 5th October 2026, respectively. Our recommended bidding range for is FXD3/2019/015 12.4%-12.8%, while that for FXD1/2019/020 is 12.8% - 13.3%, guided by prevailing yields on comparable tenors on the NSE yield curve as at 25th September 2026
Money Market Performance:
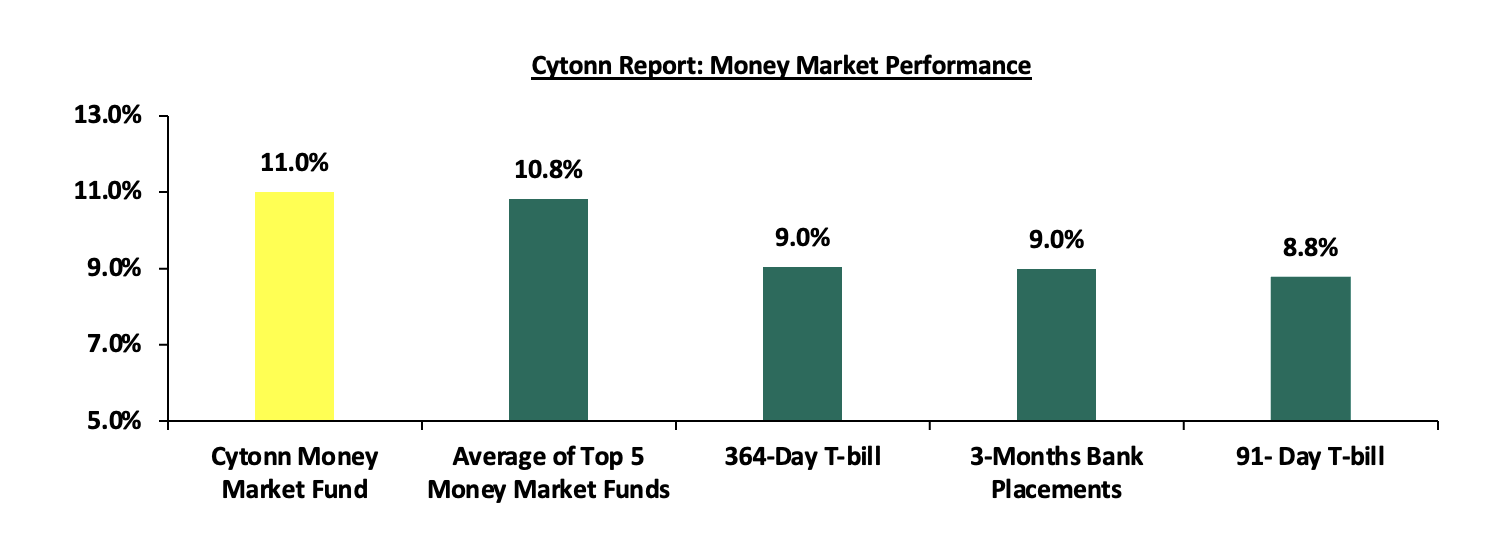
In the money markets, 3-month bank placements ended the week at 9.0% (based on rates offered by various banks). The yields on the government papers were on a downward trajectory, with the yields on the 364-day papers decreasing by 1.3 bps to 9.04% from 9.06% recorded the previous week. While the yields on the 91-day paper decreased by 0.6 bps to remain relatively unchanged from 8.8% recorded the previous week. The yield on the Cytonn Money Market Fund remained unchanged at 11.0% recorded the previous week, while the average yields on Top 5 Money Market Funds increased by 4.4 bps to 10.82% from 10.78% recorded the previous week
The table below shows the Money Market Fund Yields for Kenyan Fund Managers as published on 25th September 2026
|
Money Market Fund Yield for Fund Managers as published on 25th September 2026 |
||
|
Rank |
Fund Manager |
Effective Annual Rate |
|
1 |
Cytonn Money Market Fund (Dial *809# or download Cytonn App) |
11.0% |
|
2 |
Nabo Africa Money Market Fund |
11.0% |
|
3 |
Faulu Money Market Fund |
10.8% |
|
4 |
Lofty-Corban Money Market Fund |
10.7% |
|
5 |
Arvocap Money Market Fund |
10.7% |
|
6 |
Enwealth Money Market Fund |
10.6% |
|
7 |
Madison Money Market Fund |
10.6% |
|
8 |
Kuza Money Market fund |
10.6% |
|
9 |
Ndovu Money Market Fund |
10.5% |
|
10 |
Orient Kasha Money Market Fund |
10.4% |
|
11 |
Globetec Money Market Fund |
10.4% |
|
12 |
Jubilee Money Market Fund |
10.3% |
|
13 |
Etica Money Market Fund |
10.3% |
|
14 |
Old Mutual Money Market Fund |
10.3% |
|
15 |
Rejesha Money Market Fund |
10.3% |
|
16 |
Gulfcap Money Market Fund |
10.1% |
|
17 |
GenAfrica Money Market Fund |
9.9% |
|
18 |
SanlamAllianz Money Market Fund |
9.8% |
|
19 |
British-American Money Market Fund |
9.8% |
|
20 |
Apollo Money Market Fund |
9.6% |
|
21 |
KCB Money Market Fund |
9.3% |
|
22 |
Dry Associates Money Market Fund |
9.3% |
|
23 |
Genghis Money Market Fund |
9.1% |
|
24 |
CPF Money Market Fund |
8.5% |
|
25 |
CIC Money Market Fund |
8.4% |
|
26 |
AA Kenya Shillings Fund |
8.2% |
|
27 |
Mayfair Money Market Fund |
8.2% |
|
28 |
Co-op Money Market Fund |
8.0% |
|
29 |
Mali Money Market Fund |
8.0% |
|
30 |
ICEA Lion Money Market Fund |
7.8% |
|
31 |
Absa Shilling Money Market Fund |
7.5% |
|
32 |
Ziidi Money Market Fund |
6.0% |
|
33 |
Equity Money Market Fund |
5.7% |
|
34 |
Stanbic Money Market Fund |
|
Source: Business Daily
Liquidity:
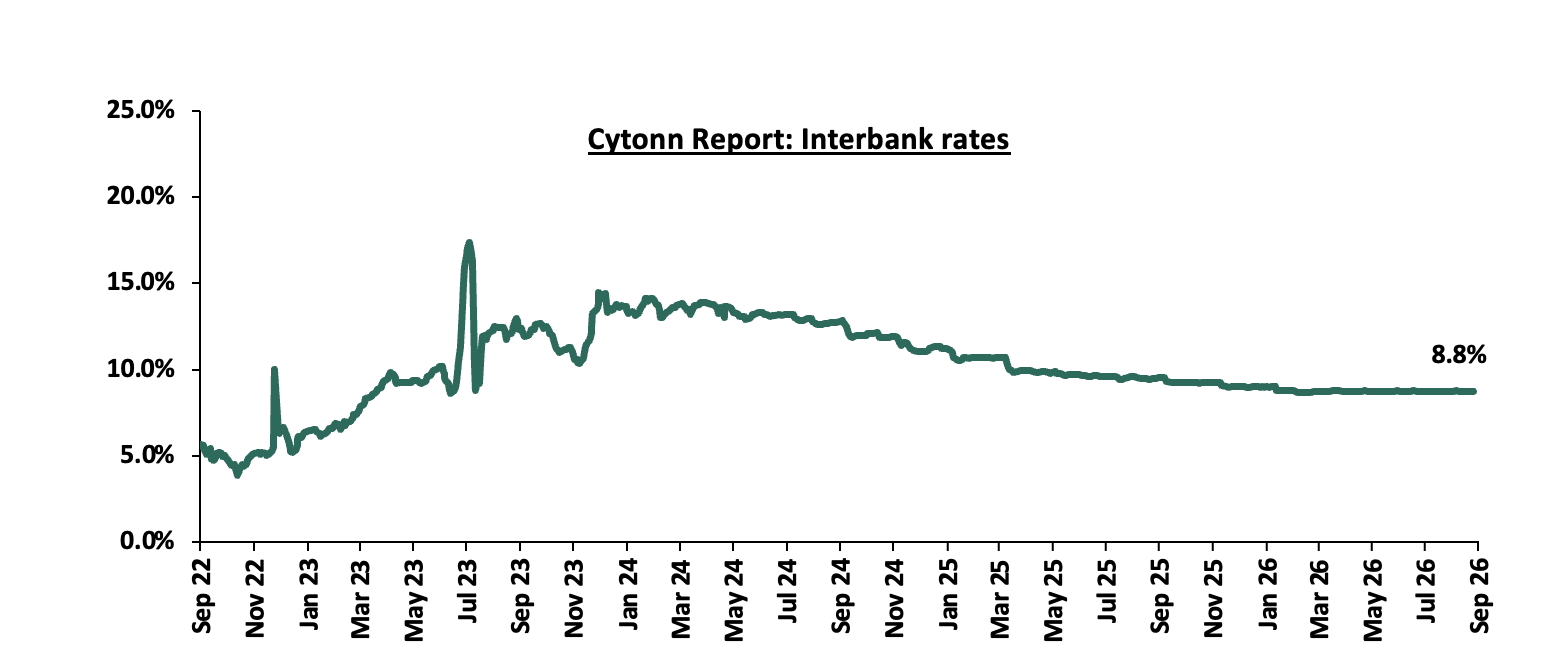
During the week, liquidity in the money markets tightened with the average interbank rate increasing marginally by 0.1 bps to remain relatively unchanged at 8.8% recorded the previous week, partly attributable government payments that offset tax remittances. The average interbank volumes traded increased by 10.5% to Kshs 14.5 bn from Kshs 13.1 bn recorded the previous week. The chart below shows the interbank rates in the market over the years:
Kenya Eurobonds:
During the week, the yields on the Eurobonds were on an upward trajectory with the yield on the 12-year Eurobond issued in 2019, increasing the most by 20.7 bps to 8.0% from 7.8% recorded the previous week. The table below shows the summary performance of the Kenyan Eurobonds as of 24th September 2026:
|
Cytonn Report: Kenya Eurobonds Performance |
||||||
|
|
2018 |
2019 |
2021 |
2024 |
||
|
Tenor |
10-year issue |
30-year issue |
12-year issue |
13-year issue |
7-year issue |
|
|
Amount Issued (USD) |
1.0 bn |
1.0 bn |
1.0 bn |
1.5 bn |
1.5 bn |
|
|
Years to Maturity |
2.5 |
22.5 |
8.8 |
5.5 |
10.5 |
|
|
Yields at Issue |
7.3% |
8.3% |
6.2% |
10.4% |
9.9% |
|
|
02-Jan-26 |
6.1% |
8.8% |
7.2% |
7.8% |
7.1% |
|
|
01-Sep-26 |
6.6% |
7.3% |
7.6% |
9.5% |
9.0% |
|
|
17-Sep-26 |
6.8% |
9.2% |
7.8% |
8.3% |
7.6% |
|
|
18-Sep-26 |
6.7% |
9.2% |
7.8% |
8.3% |
7.6% |
|
|
21-Sep-26 |
6.7% |
9.1% |
7.7% |
8.2% |
7.5% |
|
|
22-Sep-26 |
6.7% |
9.1% |
7.7% |
8.1% |
7.4% |
|
|
23-Sep-26 |
6.8% |
9.2% |
7.9% |
8.4% |
7.7% |
|
|
24-Sep-26 |
6.9% |
9.4% |
8.0% |
8.5% |
7.8% |
|
|
Weekly Change |
0.1% |
0.1% |
0.2% |
0.2% |
0.2% |
|
|
MTD Change |
0.3% |
2.1% |
0.5% |
(1.0%) |
(1.2%) |
|
|
YTD Change |
0.8% |
0.5% |
0.8% |
0.7% |
0.7% |
|
Source: Central Bank of Kenya (CBK) and National Treasury
Kenya Shilling:
During the week, the Kenya Shilling depreciated marginally against the US Dollar by 0.8 bps to remain relatively unchanged at Kshs 129.6 recorded the previous week. On a year-to-date basis, the shilling has depreciated by 44.2 bps against the dollar, as compared to the 22.9 bps appreciation recorded in 2025.
We expect the shilling to be supported by:
-
Diaspora remittances standing at a cumulative USD 5,012.7 mn in the twelve months to August 2026, slightly lower than the USD 5,078.8 mn recorded over the same period in 2025. These have continued to cushion the shilling against further depreciation. In the August 2026 diaspora remittances figures, North America remained the largest source of remittances to Kenya accounting for 50.3% in the period,
-
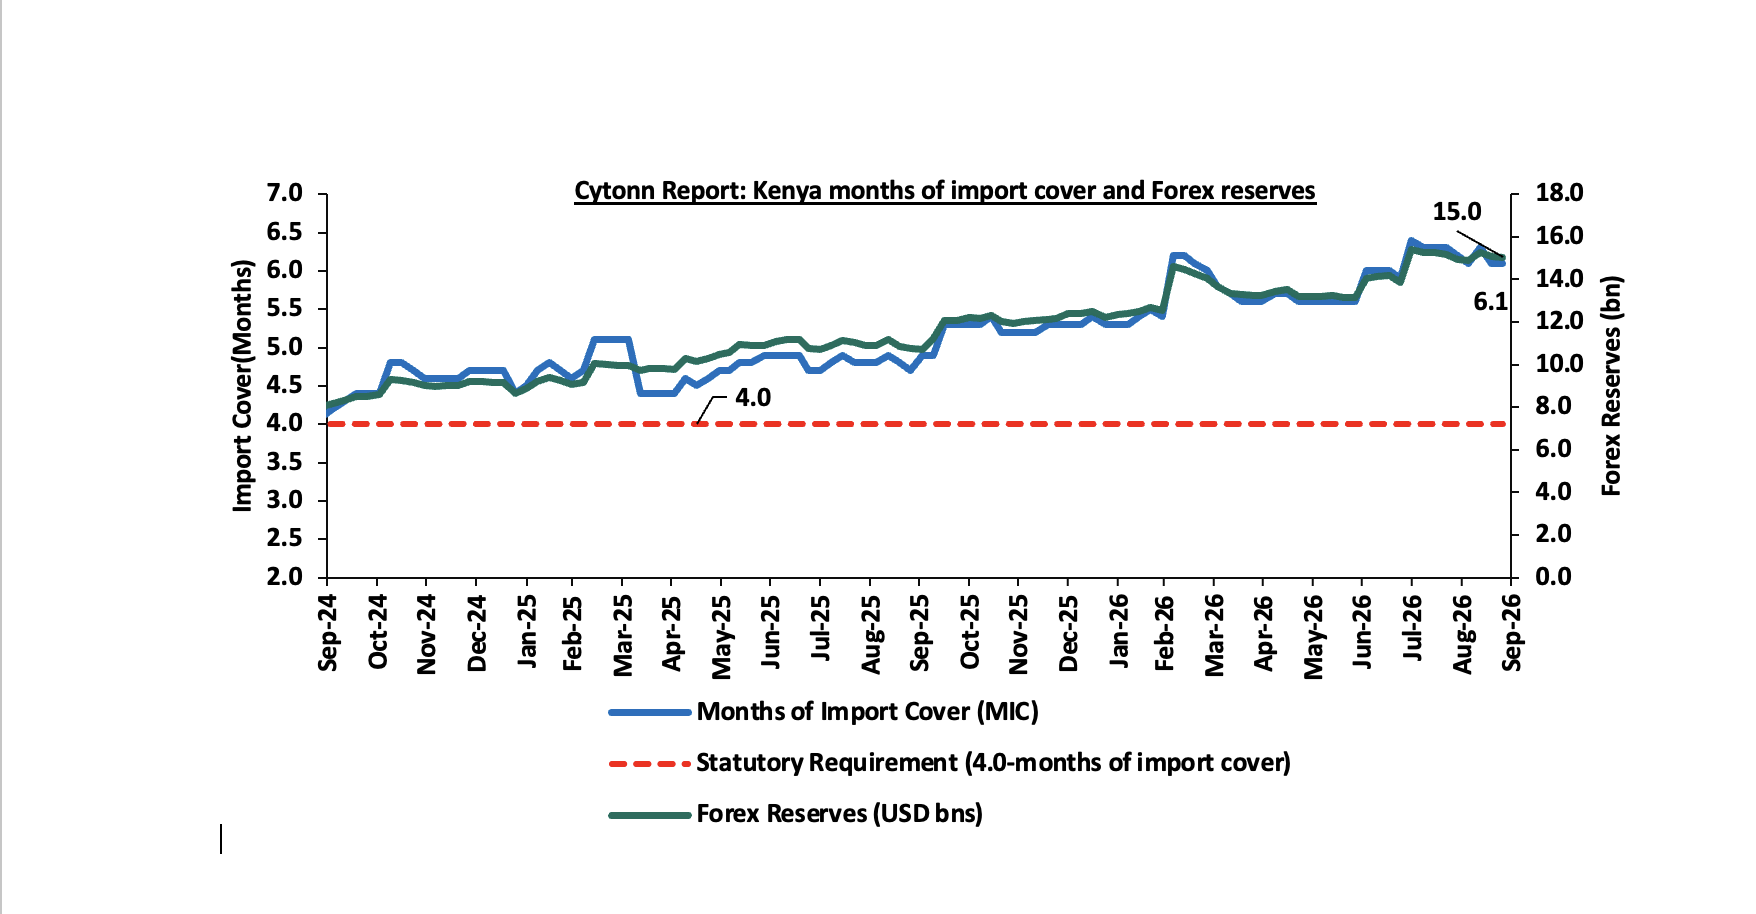
Improved forex reserves currently at USD 15.0 bn (equivalent to 6.1-months of import cover), which is above the statutory requirement of maintaining at least 4.0-months of import cover and above the EAC region’s convergence criteria of 4.5-months of import cover.
The shilling is however expected to remain under pressure in 2026 as a result of:
-
An ever-present current account deficit which widened to 3.0% of GDP in the 12 months to June 2026 compared to 1.9% of GDP in a similar period in 2025 and,
-
The need for government debt servicing, continues to put pressure on forex reserves given that 54.8% of Kenya’s external debt is US Dollar-denominated as of June 2026.
-
Rising geopolitical tensions in the Middle East, which could exert pressure on the shilling through higher global oil prices and increased uncertainty in international markets. Given that Kenya is a net importer of petroleum products, any sustained increase in oil prices would widen the import bill, increase demand for US Dollars, and consequently put depreciation pressure on the shilling
Kenya's forex reserves decreased by 0.3% during the week to USD 15.0 bn, from USD 15.1 bn recorded the previous week, equivalent to 6.1 months of import cover, and above the statutory requirement of maintaining at least 4.0-months of import cover. The chart below summarizes the evolution of Kenya's months of import cover over from September 2024 to September 2026:
Weekly Highlights
-
September 2026 Inflation Projection Highlight
We are projecting that the year-on-year inflation rate for September 2026 will remain within the range of 6.3%-6.6%, mainly on the back of:
-
Stable Retail Fuel Prices in September 2026: Energy and Petroleum Regulatory Authority (EPRA) released its monthly statement on the maximum retail fuel prices in Kenya, effective from 15th September 2026 to 14th October 2026. Notably, the maximum allowed prices for Diesel, Super Petrol and Kerosene remained unchanged at Kshs 217.9, Kshs 214.0, and Kshs 191.4 per litre, respectively set in August, despite divergent movements in landed costs across the three products. Given Diesel's importance as an input into transportation, manufacturing, agriculture, and logistics, the unchanged retail prices should help contain transport and production costs during the month, supporting our September inflation projection.
-
Maintaining the Central Bank Rate (CBR) at 8.75%: The MPC's decision to hold the CBR at 8.75% at its August 2026 meeting extends the pause that has now run from February through August. With no fresh rate cuts feeding new demand-side pressure into the economy, the disinflationary momentum built through the 2025 tightening cycle remains intact.
-
Relatively stable Kenya Shilling: The Kenya Shilling has remained relatively stable against the US dollar, trading at around Kshs 129.5 against the US dollar, remaining relatively unchanged from the beginning of the month. The relative stability of the currency should continue to limit imported inflationary pressures, particularly on fuel and other imported goods, supporting the September inflation projection.
-
Marginal Decline in Electricity Costs: Electricity costs recorded a marginal decline in September, with total variable pass-through charges falling to Kshs 4.16 per kWh, from Kshs 4.70 per kWh in August, representing a Kshs 0.54 per kWh decline. The reduction was driven by declines across the components, the Fuel Energy Cost Charge fell to Kshs 3.00 from Kshs 3.51 per kWh, the Foreign Exchange Fluctuation Adjustment decreased to Kshs 1.14 from Kshs 1.18 per kWh, while the Water Resources Management Authority levy edged down to Kshs 0.0148 from Kshs 0.015 per kWh. However, given the relatively modest decline across the components, its impact on overall inflation is expected to remain limited, although it provides some downward pressure on energy-related costs during the month.
We, however, expect inflation to face upward pressures from:
-
Rising Imported Fuel Landed Costs: Despite the unchanged domestic pump prices, the average imported landed cost of Diesel and Kerosene increased by 11.9% and 9.7% to USD 957.1 and USD 1,003.9, respectively, from USD 855.6 and USD 915.0 in July 2026. The increase in international fuel costs presents an upside risk to domestic pump prices in subsequent pricing cycles, particularly if elevated global oil prices persist.
-
Geopolitical Risks to Global Oil Prices: Global oil prices remain an upside risk to inflation amid continued disruptions to energy flows through the Strait of Hormuz. Brent crude oil prices increased to around USD 106.3 per barrel as of 25th September 2026, from USD 90.5 per barrel as of 31st August 2026, representing a 17.5% month-on-month increase. The increase has been driven by continued geopolitical tensions, uncertainty surrounding the U.S.-Iran conflict, and uncertainty over the durability of ceasefire agreements, which could affect global oil supply and prices. Given Kenya's reliance on imported petroleum products, sustained elevation in global oil prices could increase imported fuel costs and place upward pressure on domestic inflation in subsequent pricing cycles, despite the unchanged retail prices during the current review period.
Going forward, we expect inflationary pressures to remain within the Central Bank of Kenya’s (CBK) target range of 2.5%-7.5%, with headline inflation projected to range between 6.3%-6.6% in September 2026. This is supported by retail fuel prices remaining unchanged in September, alongside the Central Bank Rate (CBR) holding at 8.75%, the relative stability of the Kenya Shilling, and a marginal decline in electricity costs. However, these factors are partly offset by higher imported fuel landed costs and elevated global oil prices amid ongoing geopolitical risks surrounding the Strait of Hormuz and the U.S.-Iran standoff, which could exert upward pressure on domestic fuel prices in subsequent pricing cycles. On balance, our September inflation projection stands at 6.3%-6.6%.
Rates in the fixed income market have declined MTD, reversing the recent upward trend. The decline comes despite the CBK's decision to pause its rate-cutting cycle at 8.75%, with inflation remaining elevated at 6.6% but within the CBK's target range of 2.5%-7.5%. The government is 235.8% ahead of its prorated net domestic borrowing target of Kshs 224.8 bn, having a net borrowing position of Kshs 530.0mn (inclusive of T-bills). We expect investors to maintain a preference for short to medium-term papers as they monitor the pace of government issuance and the path of inflation before committing further out on the curve, with the yield curve likely to remain under upward pressure rather than stabilize, at least until the inflation trajectory becomes clearer.
Market Performance:
During the week, the equities market was on an upward trajectory, with the NSE 10, NSE 25, NSE 20 and NASI gaining by 5.6%, 5.1%, 4.8% and 4.1% respectively, taking their YTD performance to gains of 40.2%, 38.9%, 38.0% and 32.6%, respectively for NSE 10, NSE 20, NSE 25 and NASI respectively. The week-on-week equities market performance was mainly driven by gains recorded by large-cap stocks such as Equity Group, KCB Group and ABSA Bank of 8.6%, 7.5% and 7.4%, respectively. The performance was however weighed down by losses recorded by large-cap stocks such as Standard Chartered Bank and EABL of 1.9% and 0.7%, respectively.;
During the week, the banking sector index increased by 6.1% to 293.5 from the 276.7 recorded the previous week. This is attributable to gains recorded by large cap stocks such as Equity, KCB and ABSA bank of 8.6%, 7.5% and 7.4% respectively. The performance was however weighed down by losses recorded by large-cap stocks such as Standard Chartered Bank of 1.9%.
During the week, equities turnover decreased by 50.5% to USD 35.8 mn from USD 72.3 mn recorded the previous week, taking the YTD total turnover to USD 3,035.6 mn. Foreign investors became net buyers for the first time in eleven weeks with a net buying position of USD 0.5 mn, from a net selling position of USD 19.0 mn recorded the previous week, taking the YTD foreign net selling position to USD 167.3 mn, compared to a net selling position of USD 92.9 mn recorded in 2025.
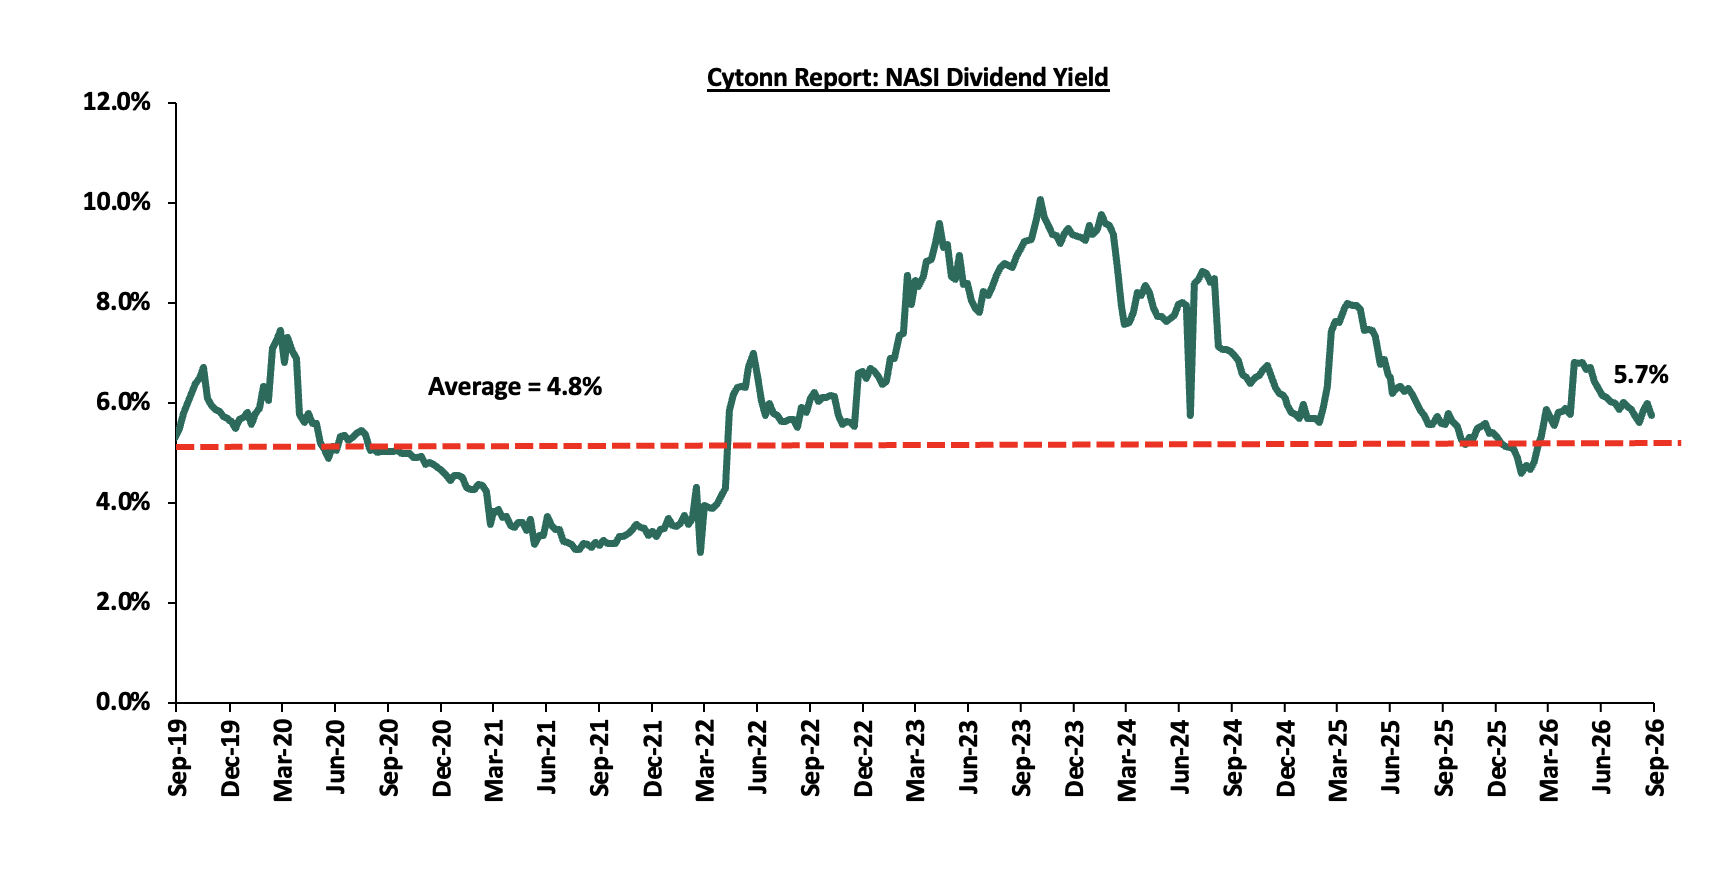
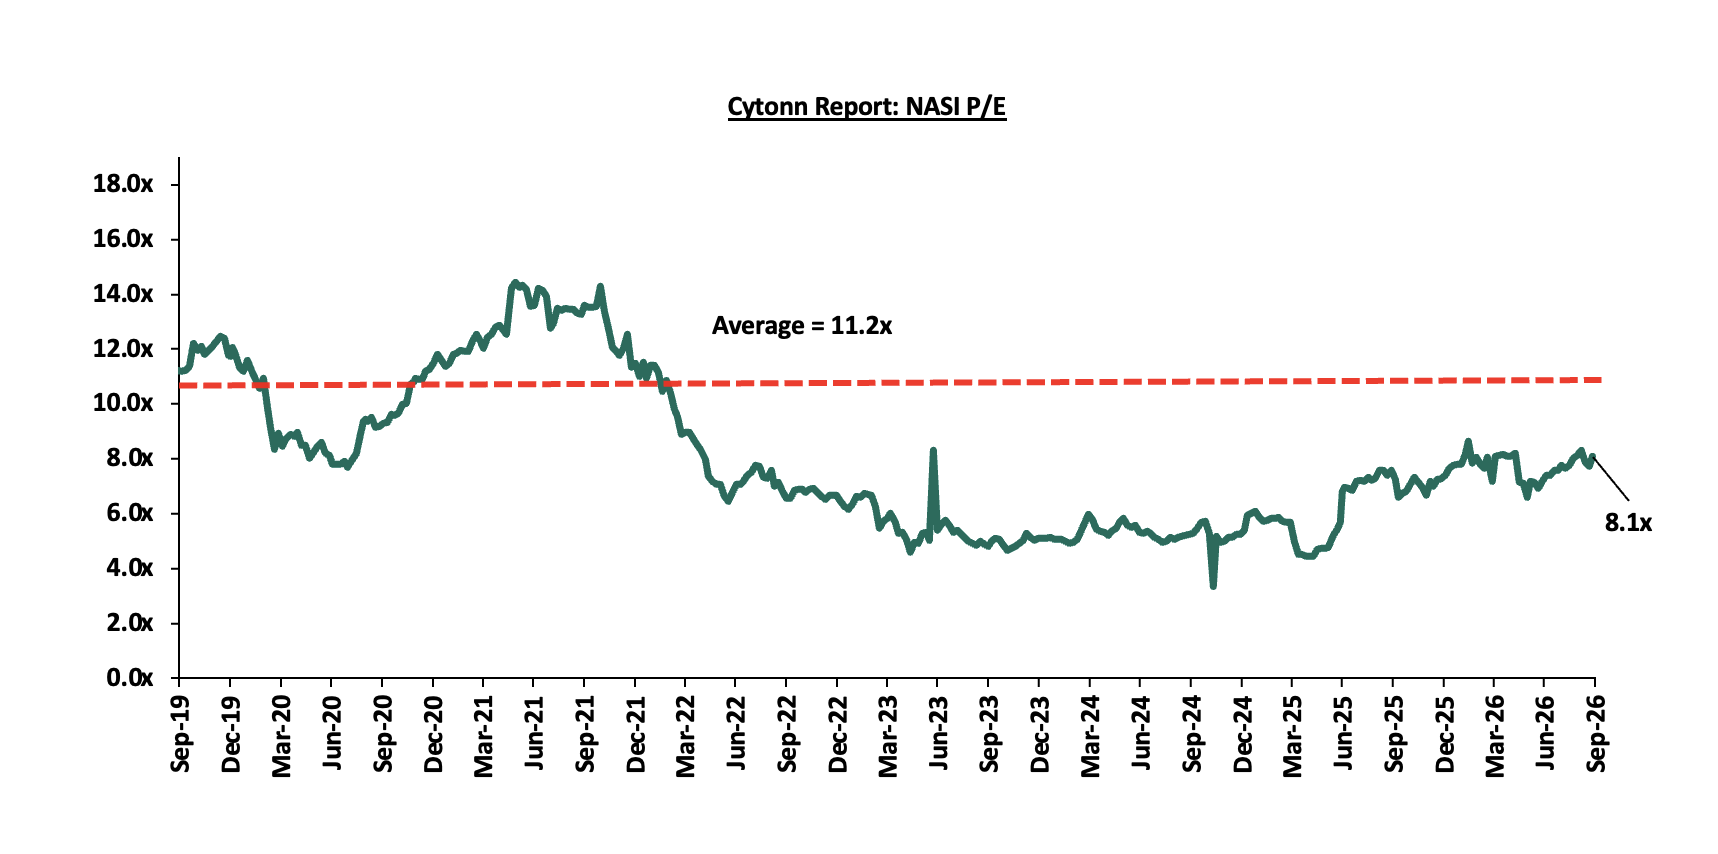
The market is currently trading at a price to earnings ratio (P/E) of 8.1x, 27.7% below the historical average of 11.2x, and a dividend yield of 5.7%, 0.9% points above the historical average of 4.8%. Key to note, NASI’s PEG ratio currently stands at 1.0x, an indication that the market is fairly valued relative to its future growth. A PEG ratio greater than 1.0x indicates the market may be overvalued while a PEG ratio less than 1.0x indicates that the market is undervalued.
The charts below indicate the historical P/E and dividend yields of the market:
Universe of Coverage:
|
Cytonn Report: Equities Universe of Coverage |
|||||||||||
|
Company |
Price as at 18/09/2026 |
Price as at 25/09/2026 |
w/w change |
m/m change |
YTD Change |
Year Open 2026 |
Target Price* |
Dividend Yield |
Upside/ Downside** |
P/TBv Multiple |
Recommendation |
|
Co-op Bank |
34.8 |
37.3 |
7.0% |
0.8% |
55.9% |
23.9 |
46.1 |
6.7% |
30.5% |
1.4x |
Buy |
|
NCBA |
86.3 |
89.8 |
4.1% |
0.6% |
5.6% |
85.0 |
108.9 |
7.9% |
29.3% |
1.2x |
Buy |
|
Family Bank |
28.0 |
29.5 |
5.4% |
(6.4%) |
63.6% |
18.0 |
34.0 |
4.1% |
19.5% |
1.5x |
Accumulate |
|
KCB Group |
87.0 |
93.5 |
7.5% |
(0.5%) |
42.2% |
65.8 |
104.4 |
7.5% |
19.1% |
1.0x |
Accumulate |
|
ABSA Bank |
31.1 |
33.4 |
7.4% |
(3.2%) |
34.4% |
24.9 |
36.8 |
6.1% |
16.4% |
1.8x |
Accumulate |
|
Standard Chartered Bank |
330.8 |
324.5 |
(1.9%) |
(2.3%) |
8.3% |
299.8 |
345.8 |
9.6% |
16.1% |
2.0x |
Accumulate |
|
Stanbic Holdings |
278.0 |
282.5 |
1.6% |
0.7% |
42.9% |
197.8 |
300.3 |
7.9% |
14.2% |
1.6x |
Accumulate |
|
Jubilee Holdings |
400.3 |
403.5 |
0.8% |
(1.5%) |
25.1% |
322.5 |
420.5 |
3.7% |
7.9% |
0.6x |
Hold |
|
Equity Group |
98.5 |
107.0 |
8.6% |
13.8% |
59.7% |
67.0 |
108.8 |
5.4% |
7.0% |
1.4x |
Hold |
|
Diamond Trust Bank |
179.5 |
189.3 |
5.4% |
(2.9%) |
64.9% |
114.8 |
190.2 |
4.8% |
5.3% |
0.5x |
Hold |
|
CIC Group |
4.7 |
5.1 |
7.9% |
5.6% |
11.5% |
4.5 |
5.0 |
2.6% |
0.6% |
1.3x |
Lighten |
|
I&M Group |
80.3 |
85.0 |
5.9% |
6.9% |
98.6% |
42.8 |
81.1 |
4.4% |
(0.2%) |
1.4x |
Sell |
|
Britam |
17.5 |
18.9 |
8.0% |
2.2% |
108.6% |
9.1 |
18.5 |
0.0% |
(2.4%) |
1.4x |
Sell |
|
*Target Price as per Cytonn Analyst estimates **Upside/ (Downside) is adjusted for Dividend Yield ***Dividend Yield is calculated using FY’2025 Dividends |
|||||||||||
Weekly highlights
-
QUICKMART ANNOUNCES 50.0% NSE LISTING THROUGH OFFER FOR SALE
During the week Quick Mart PLC (Quickmart) announced its intention to list on the Main Investment Market Segment of the Nairobi Securities Exchange (NSE) through an offer for sale (OFS) by its sole shareholder, Sokoni Retail Kenya Limited (SRKL). The proposed Offer comprises 2.0 bn existing ordinary shares with a nominal value of Kshs 0.2 each, representing 50.0% of Quickmart’s issued share capital, with an over-allotment option of up to 15.0% of the Offer Shares that could increase the stake sold to 57.5%. The Offer is expected to launch on or around 30th September 2026, subject to approval by the Capital Markets Authority (CMA) and the NSE. No new shares will be issued by Quickmart and the Company will not receive any proceeds from the Offer, with the net proceeds accruing to SRKL. Following the Offer, SRKL is expected to retain approximately 50.0% of Quickmart if the over-allotment option is not exercised, or 42.5% if exercised in full.
From a financial perspective, Quickmart operates 72 stores across 16 counties and estimates a 15.0% share of Kenya’s modern grocery retail market, with approximately 5.0 mn customer transactions per month during H1 2026 and 2.5 mn Q-Points members accounting for approximately 74.0% of sales. The Company generated revenue of Kshs 50.4 bn and adjusted PAT of Kshs 1.7 bn in FY2025, representing an 18.4% revenue CAGR between FY2021 and FY2025, while H1 2026 revenue stood at Kshs 27.3 bn and profit after tax at Kshs 872.8 mn. For FY2026, Quickmart projects revenue of Kshs 58.2 bn and PAT of Kshs 2.1 bn, and expects to distribute approximately Kshs 2.0 bn in dividends, representing a 95.1% payout ratio. Following listing, the Board intends to target a dividend payout ratio of at least 80.0% of annual PAT, with dividends declared and paid semi-annually, subject to distributable reserves, capital requirements and Board discretion. The Company expects the initial dividend relating to H2 2026 to be paid in H1 2027. The proposed listing would broaden public ownership while providing the NSE with exposure to the modern grocery retail segment, although assessment of the Offer valuation remains pending disclosure of the offer price in the Information Memorandum.
|
Cytonn Report: Main Local and International Retail Supermarket Chains |
||||||||||||
|
# |
Name of retailer |
Category |
|
|
|
|
|
|
|
|
Closed Branches |
Current Branches |
|
1 |
Naivas |
Hybrid* |
61 |
69 |
79 |
91 |
100 |
106 |
113 |
114 |
0 |
114 |
|
2 |
Quick Mart |
Hybrid** |
29 |
37 |
48 |
55 |
59 |
62 |
64 |
72 |
0 |
72 |
|
3 |
Chandarana |
Local |
19 |
20 |
23 |
26 |
26 |
26 |
27 |
27 |
0 |
27 |
|
4 |
Carrefour |
International |
7 |
9 |
16 |
19 |
22 |
26 |
34 |
36 |
0 |
36 |
|
5 |
Cleanshelf |
Local |
10 |
11 |
12 |
12 |
13 |
13 |
13 |
13 |
0 |
13 |
|
6 |
Jaza Stores |
Local |
0 |
0 |
0 |
0 |
4 |
6 |
6 |
6 |
0 |
6 |
|
7 |
China Square |
International |
0 |
0 |
0 |
0 |
2 |
3 |
5 |
7 |
0 |
7 |
|
8 |
Panda Mart |
International |
0 |
0 |
0 |
0 |
0 |
1 |
2 |
2 |
0 |
2 |
|
9 |
Uchumi |
Local |
37 |
37 |
2 |
2 |
2 |
2 |
2 |
3 |
34 |
3 |
|
10 |
Tuskys |
Local |
64 |
64 |
6 |
6 |
5 |
5 |
5 |
5 |
59 |
5 |
|
11 |
Game Stores |
International |
2 |
3 |
3 |
0 |
0 |
0 |
0 |
0 |
3 |
0 |
|
12 |
Choppies |
International |
15 |
15 |
0 |
0 |
0 |
0 |
0 |
0 |
15 |
0 |
|
13 |
Shoprite |
International |
4 |
4 |
0 |
0 |
0 |
0 |
0 |
0 |
4 |
0 |
|
14 |
Nakumatt |
Local |
65 |
65 |
0 |
0 |
0 |
0 |
0 |
0 |
65 |
0 |
|
|
Total |
|
313 |
334 |
189 |
211 |
233 |
250 |
271 |
285 |
180 |
285 |
|
*51% owned by IBL Group (Mauritius), while 49% owned by Mukuha/Gakiwawa Family (Kenya) |
||||||||||||
|
**More than 50% owned by Adenia Partners (Mauritius), while Less than 50% owned by Kinuthia Family (Kenya) |
||||||||||||
Source: Cytonn Research
We maintain a “cautiously optimistic” short-term outlook supported primarily earnings-led attractive valuations, despite heightened geopolitical risks such as Iran war that may weigh on investor sentiment, and, “neutral” in the long term as persistent foreign investor outflows continue to constrain market liquidity and limit broad-based market re-rating. With the market currently trading at a discount to its future growth (PEG Ratio at 1.0x), where performance will be driven by company-specific fundamentals rather than general market direction, we believe that investors should reposition towards value stocks exhibiting strong earnings growth, attractive dividend yields, solid balance sheets, sustainable competitive advantages and trading at compelling discounts to their intrinsic value. While foreign investor sell-offs are expected to continue exerting pressure in the near term, we believe this will create selective entry opportunities for long-term investors
-
Residential Sector
-
Mortgage lending expands as borrowing costs ease;
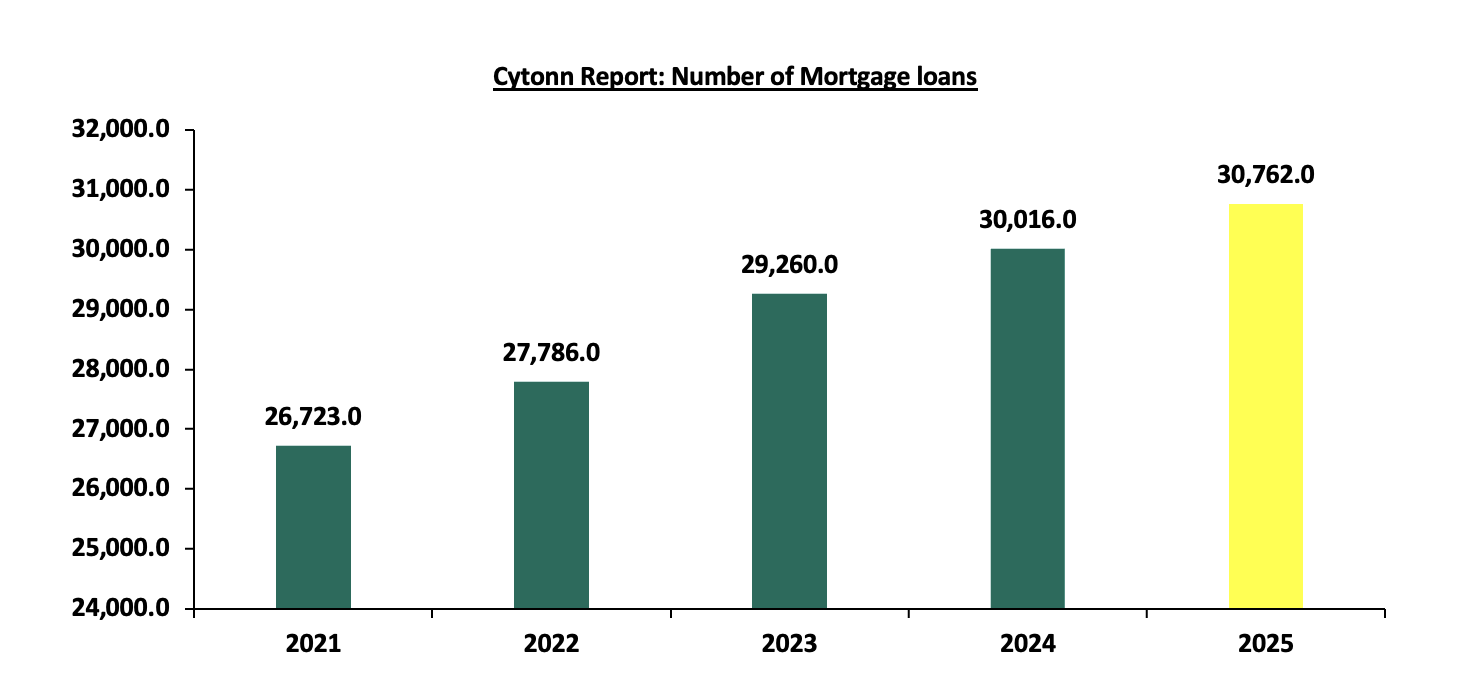
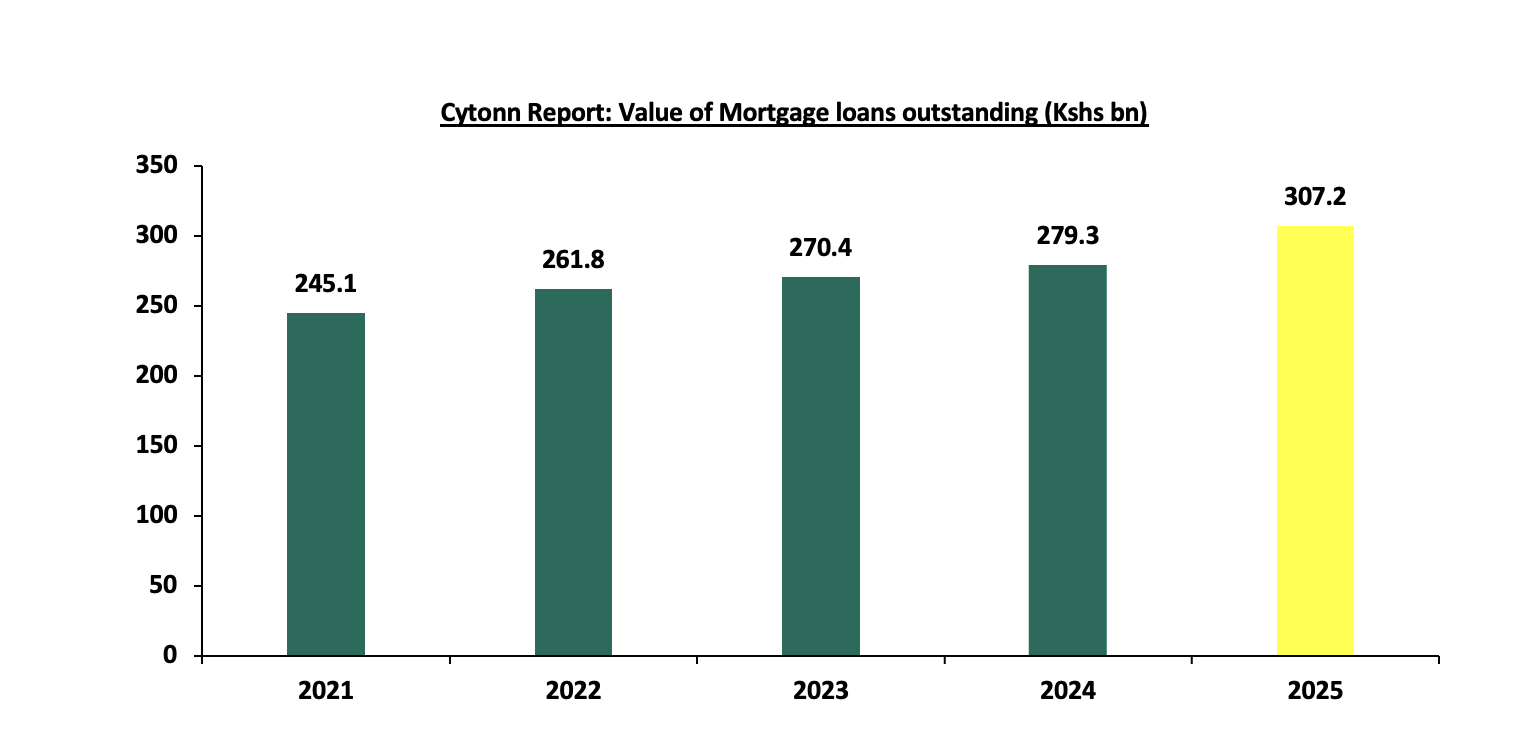
During the week, Kenya's mortgage market showed signs of recovery, with the Central Bank of Kenya (CBK) reporting that the value of outstanding mortgage loans increased by 10.0% to Kshs 307.2 bn in 2025 from Kshs 279.3 bn 2024. The increase of Kshs 27.9 bn was attributed to new mortgage lending during 2025. The number of mortgage loans increased by 2.5% to 30,762.0 in 2025 from 30,016.0 in 2024, indicating that the expansion in the mortgage portfolio was accompanied by a relatively modest increase in the number of facilities.
The improvement in mortgage activity coincided with lower borrowing costs. The average mortgage interest rate decreased by 1.7% points to 13.5% in 2025 from 15.2% in 2024. The structure of mortgage financing also changed during the period. The proportion of mortgages on fixed interest rates increased by 10.2% points to 24.3% from 14.1%, while the share of variable-rate facilities decreased by 10.3 % points to 75.6% from 85.9%. The banks continued to maintain maximum loan-to-value ratios below 90% of property value, requiring borrowers to provide a portion of the purchase price from their own resources.
The chart below shows the movement in the number of the mortgage loans over five years;
Source: Central Bank of Kenya
The Chart below shows the movements in the value of mortgage loans outstanding over the past years;
Source: Central Bank of Kenya
Mortgage refinancing also expanded, with institutions receiving financing from the Kenya Mortgage Refinance Company (KMRC) increasing by 42.9% to 10 institutions from 7 institutions. Outstanding KMRC refinancing facilities increased by 64.7% to Kshs 19.6 bn in 2025 from Kshs 11.9 bn in 2024. CBK's 2025 mortgage outlook identifies stabilising interest rates, increased affordable housing supply and longer-term financing as factors expected to support mortgage demand in 2026.
The recovery in mortgage financing could have implications for Kenya's Real Estate sector, particularly through household purchasing power and demand for residential property. Larger average loan sizes and longer repayment periods can increase the financing capacity available to prospective homeowners, while lower mortgage rates can reduce the cost of borrowing. This is occurring alongside continued residential price growth, with the Kenya National Bureau of Statistics reporting that the Residential Property Price Index changed by 4.8% to 118.4 in Q1 2026 from 113.0 in Q1 2025.
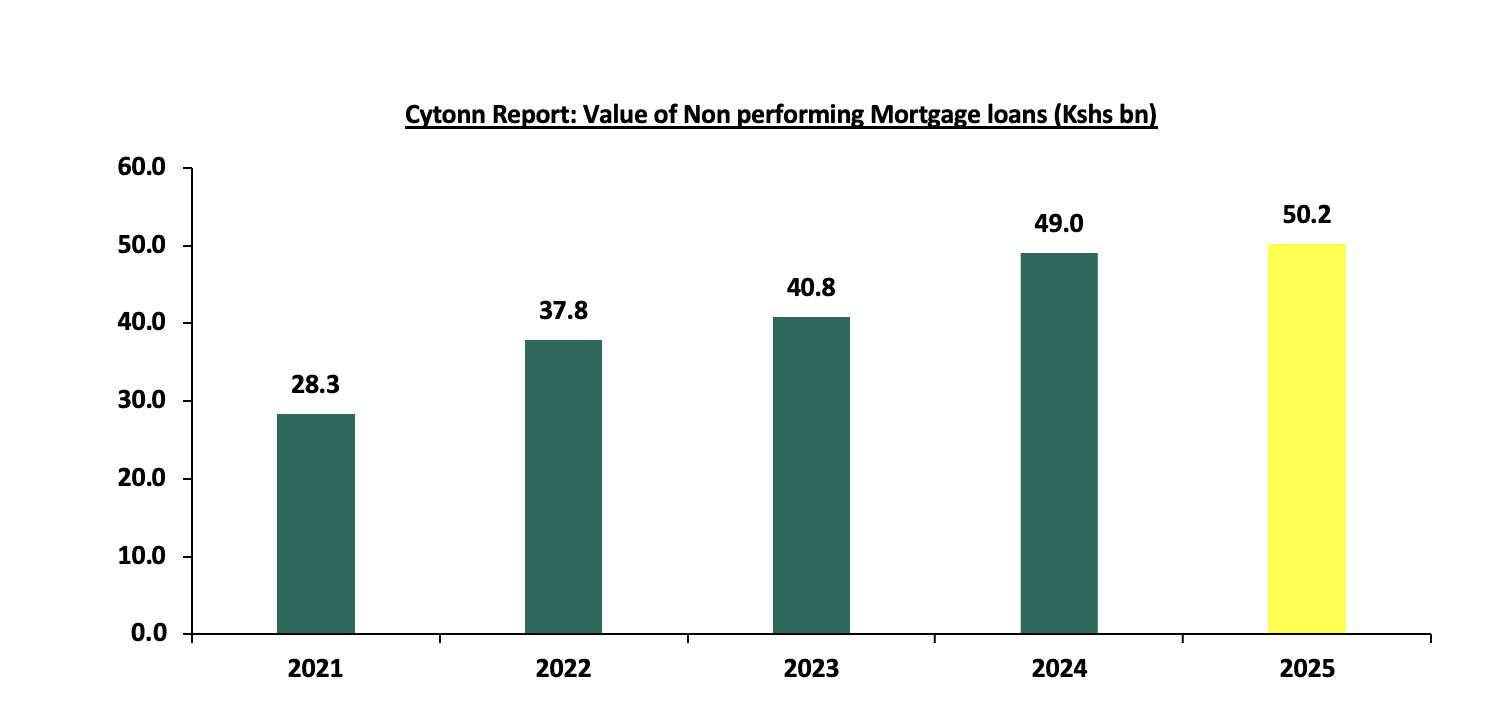
However, repayment risk remains relevant to the mortgage market. The value of non-performing mortgage loans increased by 9.1% to Kshs 50.2 bn from Kshs 46.0 bn, although the ratio of non-performing mortgages to gross mortgage loans reduced by 0.2% points to 16.3% from16.5% over the same period. The chart below shows the movement of the value of the non-performing mortgage loans over the past five years;
Source: Central Bank of Kenya
Going forward, lower borrowing costs and expanded refinancing could support residential demand, but elevated non-performing mortgages indicate continued credit-quality risk. Consequently, stronger mortgage lending should translate into sustained housing demand only to the extent that improved financing access is matched by borrower affordability and prudent credit allocation.
-
Affordable housing initiative faces a Kshs 118.3 bn funding shortfall
During the week, the Parliamentary Budget Office (PBO) flagged a Kshs 118.3 bn financing gap facing Kenya's housing development programme reporting that Kshs 228.3 bn is required in FY2026/27 to finance ongoing housing projects, against an approved allocation of Kshs 110.0 bn, creating a Kshs 118.3 bn funding shortfall.
The State Department for Housing and Urban Development is overseeing 1,186 projects across four portfolios with an estimated combined cost of Kshs 1.8 tn. By the end of FY2025/26, development expenditure stood at Kshs 198.0 bn, equivalent to a 11% of the overall project cost. The portfolio comprises 227 affordable housing projects valued at Kshs 825 bn, 216 social housing and slum-upgrading projects valued at Kshs 228 bn, 329 institutional and student housing projects valued at Kshs 634 bn and 414 social and physical infrastructure projects valued at Kshs 7.0 bn.
The PBO identifies potential implications for the Real Estate sector, particularly through construction timelines, contractor cash flows and the delivery of new housing stock. Delayed payments may result in contractor penalties and longer construction periods, while prolonged project timelines could increase construction costs. The PBO also notes that the mismatch between the timing of levy collections and project payment obligations can create cash-flow constraints even when the levy continues generating revenue.
Going forward, the Kshs 118.3 bn funding gap creates pipeline risk for the housing programme, as financing constraints could delay project completion and the conversion of planned units into occupiable housing stock. Consequently, the Kshs 1.8 tn project portfolio should be viewed as planned pipeline rather than completed supply, with actual market delivery dependent on timely capital allocation, contractor payments and project execution.
-
Hospitality
-
Kenya launches six-month live wildlife streaming programme;
During the week, the Kenya Wildlife Service (KWS) and Kenya Tourism Board (KTB) launched Kenya’s digital tourism through the “Experience Wonder Live from Kenya” programme. The six-month initiative provides live wildlife and conservation broadcasts from nine KWS-managed protected areas, including Nairobi National Park, Amboseli, Tsavo East, Tsavo West, the Aberdares, Sibiloi, Meru, Ruma and Mount Elgon. The broadcasts are distributed through multiple international digital platforms and currently reach more than 500,000 daily unique viewers across 16 global platforms.
The initiative forms part of a broader institutional shift towards digital tourism products. In May 2026, KWS issued an expression of interest for virtual safari broadcasting, digital content production and monetised virtual tourism solutions, covering live wildlife broadcasting, remote camera deployment, streaming infrastructure, digital payments, cloud infrastructure and data analytics. The proposed investment model also includes opportunities for sponsorship, branding and long-term commercial sustainability.
According to the Tourism Research Institute sector report, Kenya’s International arrivals increased by 7.2% to 2.7 mn in 2025 from 2.5 mn I 2024, while tourism earnings increased by 10.6% to Kshs 501.3 bn in 2025 from Kshs 453.5 bn in 2024. The increased use of digital wildlife experiences could have implications for Kenya’s Real Estate sector, particularly hospitality properties located within or around wildlife destinations. KWS identifies opportunities for investment in safari lodges, eco-camps, safari operations and community tourism ventures across its protected areas.
The initiative is also consistent with the Government’s draft National Tourism Strategy, which proposes digitally transforming the wildlife tourism experience through park applications, real-time wildlife information and virtual safari subscriptions for diaspora audiences, schools and wildlife enthusiasts.
Going forward, increased international visibility could support future demand for accommodation and tourism related real estate. Although the streaming programme does not constitute additional physical tourism stock, its impact on hospitality demand and market absorption will depend on whether increased digital engagement translates into higher visitor arrivals and accommodation utilization.
-
Nairobi Railway City to feature Kshs 38.1 bn sports, hospitality and entertainment complex;
During the week, Zaria Group through its local subsidiary, Metroarena Development Company, proposed a Kshs 38.1 bn Nairobi Railway City development, which will feature a 10,000-seat multi-purpose indoor arena as the centerpiece of a wider Meetings, Incentives, Conferences and Exhibitions (MICE) development. The proposal follows a long-term lease agreement between Zaria Group and Kenya Railways Corporation signed in April 2026.
The proposed development will be implemented in phases, with the first phase centred on the five-storey arena. The wider project will include a 140-room branded hotel, a 70 unit serviced apartment tower, retail and office space, restaurants, food and beverage outlets, leisure facilities, an amphitheatre, public plaza, pedestrian boulevard and parking facilities. The arena will accommodate sports such as basketball as well as conferences, exhibitions, concerts, banquets and other events.
The project will have implications for Nairobi's Real Estate sector by increasing demand for hospitality, serviced apartments, retail and commercial properties around the Railway City precinct. Kenya Railways indicates that the wider Railway City is intended to support high density commercial and mixed-use development, while the upgraded transport hub is projected to handle 400,000 daily passengers by 2030 and 600,000 by 2045. Improved accessibility and increased visitor activity will therefore support greater utilization of surrounding commercial and hospitality space.
Going forward, the proposed development remains subject to statutory planning, environmental and other regulatory approvals, meaning the stated facilities and Kshs 38.1 bn investment value represent pipeline development rather than completed real estate stock. The approval and construction process creates pipeline risk, as changes in design, financing or implementation timelines could affect the scale and timing of new hospitality, residential and commercial supply. Consequently, the project should not yet be incorporated into Nairobi’s completed stock or market absorption metrics.
-
Real Estate Investments Trusts
-
REITs Weekly Performance
On the Unquoted Securities Platform Acorn D-REIT and I-REIT traded at Kshs 29.7 and Kshs 24.4 per unit, respectively, as per the last updated data on 18th September 2026. The performance represented a 48.5% and 22.0% gain for the D-REIT and I-REIT, respectively, from the Kshs 20.0 inception price. The volumes traded for the D-REIT and I-REIT came in at 13.7 mn and 46.0 mn shares, respectively. Additionally, ILAM Fahari I-REIT traded at Kshs 13.8 per share as of 18th September 2026, representing a 31.0 % loss from the Kshs 20.0 inception price, the volume traded came in at 1.2 mn shares. REITs offer various benefits, such as tax exemptions, diversified portfolios, and stable long-term profits. However, the ongoing decline in the performance of Kenyan REITs and the restructuring of their business portfolios are hindering significant previous investments. Additional general challenges include:
-
Insufficient understanding of the investment instrument among investors leading to a slower uptake of REIT products,
-
Lengthy approval processes for REIT creation,
-
High minimum capital requirements of Kshs 100.0 mn for REIT trustees compared to Kshs 10.0 mn for pension funds Trustees, essentially limiting the licensed REIT Trustee to banks only
-
The rigidity of choice between either a D-REIT or and I-REIT forces managers to form two REITs, rather than having one Hybrid REIT that can allocate between development and income earning properties
-
Limiting the type of legal entity that can form a REIT to only a trust company, as opposed to allowing other entities such as partnerships, and companies,
-
We need to give time before REITS are required to list – they would be allowed to stay private for a few years before the requirement to list given that not all companies maybe comfortable with listing on day one, and,
-
Minimum subscription amounts or offer parcels set at Kshs 0.1 mn for D-REITs and Kshs 5.0 mn for restricted I-REITs. The significant capital requirements still make REITs relatively inaccessible to smaller retail investors compared to other investment vehicles like unit trusts or government bonds, all of which continue to limit the performance of Kenyan REITs.
Going forward, Kenya’s Real Estate sector is expected to remain resilient, supported by improving mortgage activity, continued housing development initiatives, infrastructure investment and the gradual expansion of tourism-related activity. However, weak investor appetite for listed REITs such as ILAM Fahari I-REIT, oversupply in select Real Estate segments and high capital requirements will continue to constrain the sector’s optimal performance. Consequently, the outlook remains dependent on the conversion of development pipelines into completed and absorbed stock, improved access to financing and sustained demand across residential, commercial and hospitality segments.
-
Visa Research Highlights Consumer Protection as a Key Driver of Stablecoin Adoption
During the week, Visa Inc. released its Money Travels 2026 report examining the changing dynamics of global remittances, finding that U.S. consumer intent to use stablecoins increased from 36.0% to 56.0% under a hypothetical scenario involving bank-level fraud protection and deposit insurance; the study further found that willingness to use stablecoins increased to 45.0% when offered through an existing financial provider, while 61.0% of consumers trust traditional commercial banks and 60.0% trust global payment networks to provide digital currency services. The findings also highlighted persistent consumer education and security gaps, with 56.0% of respondents having never heard of stablecoins, while 36.0% had encountered scams related to international money transfers and 44.0% expressed concern about AI-generated deepfakes impersonating family members. The findings underscore that stablecoin adoption is likely to depend not only on transaction speed and cost but also on consumer protection, institutional trust, fraud prevention, and the credibility of the provider; this could benefit established payment networks and financial institutions that can combine stablecoin functionality with existing compliance, security, and customer-protection infrastructure.
-
Mastercard Highlights Intensifying Competition in SME Cross-Border Payments
During the week, Mastercard released its Money in Motion report, compiled in partnership with Bain & Company, finding that 91.0% of SMEs trading internationally expect to switch their current cross-border payment provider within the next two years, while the B2B cross-border payments market is projected to expand by 51.0% from USD 31.7 tn in 2024 to USD 47.8 tn by 2032; the report further found that 35.0% of SMEs identify trust and 34.0% identify speed as their most important provider-selection considerations, while 67.0% of businesses that recently changed providers cited faster transactions and more reliable settlements as key drivers. With 92.0% of surveyed SMEs already using multiple payment providers, the findings point to increasing fragmentation and competitive pressure across the cross-border payments ecosystem; Mastercard's Mastercard Move infrastructure, which supports transfers across more than 200 countries and territories and over 150 currencies, positions the company to capture demand for faster, more transparent, and reliable international money movement, particularly as SMEs increasingly evaluate payment providers based on the broader value-added services they offer, including payment tracking and fraud detection.
-
Circle Foundation Expands Financial Inclusion Strategy Through AI-Enabled CDFI Infrastructure
During the week, Circle Foundation announced its inaugural domestic grants to Accion Opportunity Fund and Pacific Community Ventures to support technology-driven initiatives aimed at expanding access to capital for underserved small businesses; the funding will support Credit Compass 2.0, which provides loan applicants with personalized financial education and a roadmap toward qualification, as well as the Radiant Data Hub, an AI-enabled platform providing community lenders with data governance, predictive modelling, impact analytics, and benchmarking capabilities. Accion Opportunity Fund's data indicates that applicants who engage with its educational resources are 84.0% more likely to qualify for a loan, highlighting the potential for technology and data-driven tools to improve credit access. The initiatives extend Circle Foundation's financial inclusion strategy beyond digital currency infrastructure into the broader lending ecosystem, demonstrating how AI, alternative data, and shared financial infrastructure can improve the efficiency and reach of mission-driven lenders while supporting greater access to capital among underserved small businesses.
-
Block Joins x402 Foundation to Advance Open Agentic Payment Infrastructure
During the week, Block joined the x402 Foundation, an open standard designed to enable payments directly through HTTP requests, and contributed Bitcoin Lightning support to the protocol to facilitate instant, low-cost, and high-volume payments for people, businesses, and AI agents; the initiative builds on Block's existing investments in open-source AI agents, agentic commerce, and payment infrastructure, while expanding the range of payment methods available through an open and community-governed standard. By integrating Bitcoin Lightning into x402, Block is positioning Bitcoin for potential use in the small-value, high-frequency transactions expected to emerge as AI agents increasingly perform commercial activities autonomously; the development also supports Block's broader strategy of promoting open payment rails that can connect merchants, consumers, and agents without relying on proprietary payment integrations, potentially reducing transaction friction and expanding the addressable use cases for Bitcoin in digital commerce.
-
Digital Payments Stock Performance
The table below presents a snapshot of NYSE-listed digital payments stocks, covering Visa, Mastercard, American Express (AXP), Wise Plc, Block and PayPal:
|
Cytonn Report: Digital Payments NYSE and LSE stock perfomance |
|
|||||||
|
Company |
Year Open 2026 |
Price 9/18/2026 |
Price 9/25/2026 |
w/w change |
YTD change |
Forward P/E |
||
|
American Express |
372.7 |
311.6 |
308.9 |
(0.9%) |
(17.1%) |
15.1x |
||
|
Visa |
346.5 |
368.3 |
367.4 |
(0.2%) |
6.0% |
24.0x |
||
|
Mastercard |
563.1 |
565.2 |
567.7 |
0.4% |
0.8% |
24.2x |
||
|
Circle |
83.5 |
91.8 |
89.0 |
(3.0%) |
6.6% |
74.6x |
||
|
Block |
65.2 |
76.3 |
76.4 |
0.2% |
17.3% |
14.5x |
||
|
Paypal Holdings |
58.1 |
52.4 |
55.0 |
5.0% |
(5.3%) |
9.1x |
||
|
Global Payments Inc |
77.0 |
85.1 |
86.5 |
1.7% |
12.3% |
5.3x |
||
|
Average |
23.8x |
|||||||
Source: Visa, AXP, Circle, Mastercard, Block and PayPal financials, NYSE, PE* calculated using FY’2025 audited financials
The stocks are currently trading at an average forward P/E multiple of 23.8x, indicating that investors are pricing in strong future earnings growth and are prepared to pay a substantial premium for current earnings. This also suggests that valuations may be stretched relative to near-term fundamentals.
We expect the global digital payments sector to continue evolving toward greater payment sovereignty, digital infrastructure modernization, and reduced reliance on traditional card-based payment networks as governments and financial institutions increasingly prioritize control over domestic payment ecosystems. Recent developments, particularly the European Central Bank’s progress toward launching the Digital Euro, signal a growing global shift toward central bank-backed digital payment infrastructure aimed at enhancing financial resilience, improving transaction efficiency, and strengthening monetary independence in an increasingly digital economy. This trend is likely to accelerate competition between public-sector digital currencies and established private payment networks such as Visa Inc. and Mastercard Incorporated, while driving broader innovation across digital finance infrastructure. However, despite these favorable long-term structural tailwinds, valuations within the sector remain relatively elevated, with the companies under coverage currently trading at an average forward P/E of 23.8x, suggesting that a significant portion of future growth expectations may already be priced in. As such, we expect near-term performance to remain sensitive to regulatory developments, execution risk, and the pace at which both incumbents and emerging digital payment infrastructure providers adapt to the rapidly changing payments landscape.
Eurobonds are fixed income debt instruments issued in a currency different from that of the country or market in which they are issued, with major global currencies such as the US Dollar and Euro being the most common
denominations. By accessing international capital markets, Eurobonds enable issuers to reach a wider pool of investors while diversifying their sources of financing. In Sub Saharan Africa, Eurobonds, many of which are listed on international exchanges such as the London and Irish stock exchanges, provide governments and corporates with access to foreign currency financing. Countries across the region have increasingly turned to Eurobonds to meet external debt obligations, bridge budget financing gaps and fund large scale infrastructure and development projects.
In 2026, Sub Saharan Africa has continued to strengthen its presence in the international Eurobond market, building on the renewed access witnessed in 2024 and 2025. Between January and September 2026, Kenya, Angola, Ivory Coast, Benin, raised a combined USD 6.5 bn through Eurobond issuances, compared with USD 5.5 bn raised by the same countries by December 2025. The increased activity was supported by stronger investor appetite and improved access to international capital markets, with majority of the issuances significantly oversubscribed. The most recent issuance was by Gabon in July 2026, which raised USD 0.9 bn through a seven-year Eurobond at a 9.4% coupon, while the DRC raised USD 1.3 bn through two tranches in April 2026, comprising a USD 0.6 bn six-year tranche at a coupon of 8.8% and a USD 0.7 eleven year tranche at a coupon of 9.5%. The secondary market performance has been mixed, with yields on most selected SSA Eurobonds recording marginal increases between January and September 2026. However, borrowing costs remain elevated, particularly for lower rated sovereigns, as investors continue to price in risks associated with debt sustainability, fiscal vulnerabilities, currency movements and refinancing requirements. Consequently, while SSA sovereigns have gained broader access to international capital markets in 2026, the cost of borrowing continues to vary significantly across countries depending on their fiscal and economic fundamentals.
We have previously covered topicals with the latest one being; “Sub-Saharan Africa (SSA) Eurobonds Performance 2025”, where we highlighted SSA continued to regain international market access, with yields generally declining amid improved investor sentiment and easing inflation, although borrowing costs remained elevated due to debt sustainability concerns and heightened risk premiums.
This week we analyse the Sub-Saharan Africa (SSA) Eurobond performance in 2025 and 2026 year to date, given the mixed performing rates in the developed countries. The analysis will be broken down as follows:
-
Background of Eurobonds in Sub-Saharan Africa,
-
Analysis of Existing Eurobond Issues in Sub-Saharan Africa,
-
Debt Sustainability in the Sub-Saharan African region, and,
-
Outlook on SSA Eurobonds Performance.
Section I: Background of Eurobonds Issued in Sub-Saharan Africa
Africa’s appetite for foreign denominated debt has remained strong in 2026, with the latest issuances between January and September 2026 raising a combined USD 9.3 bn. Angola raised the highest amount with USD 2.5 bn through two tranches at coupons of 9.38% and 9.88%, respectively. Kenya raised a total of USD 2.3 bn through two tranches, comprising a seven-year bond at a 7.9% coupon and a 12-year bond at an 8.7% coupon. Ivory Coast raised USD 1.3 bn through a 15-year bond at a 6.8% coupon, while the Democratic Republic of Congo raised USD 1.3 bn through two tranches at coupons of 8.8% and 9.5%. Cameroon, Benin and Gabon raised USD 0.8 bn, USD 0.4 bn and USD 0.9 bn, respectively, with Gabon being the most recent issuer in July 2026 through a seven-year bond at a 9.4% coupon. The increased issuance activity reflects stronger access to international capital markets and sustained investor appetite for SSA sovereign debt, with majority of the issues attracting significant oversubscription.
The sovereigns have increasingly turned to international capital markets in 2026 to support their financial year budgets and manage public debt. Issuances have also been shaped by liability management considerations and prevailing global market conditions, with sovereigns seeking to refinance existing obligations, manage maturities and, in some cases, navigate heightened global uncertainty. Kenya, for instance, raised USD 2.3 bn through a new Eurobond in February 2026, alongside a USD 0.5 bn buyback of its outstanding Eurobonds. Angola similarly combined its USD 1.5 bn May 2026 Eurobond issuance with a buyback of its existing 2028 and 2029 Eurobonds, with approximately USD 0.8 bn used to repurchase outstanding debt, while Benin reopened its existing 2038 Eurobond to raise an additional USD 0.4 bn. These transactions highlight the evolving role of Eurobonds in Sub Saharan Africa, not only as a source of new financing but also as a tool for refinancing and extending debt maturities, setting the stage for an assessment of the region’s 2026 Eurobond issuance, investor demand and borrowing costs. The tables below highlight the recent performance of select African Eurobonds and Credit ratings of select SSA countries:
|
Cytonn Report: 2026 Eurobond Issues |
|||||||
|
Country |
Amount Issued |
Amount Accepted |
Issue Tenor (Years) |
Issue Date |
Maturity Date |
Coupon Rate |
Subscription Rate |
|
Gabon |
750 |
920 |
7 |
Jul-26 |
Jul-33 |
9.38% |
133.3% |
|
DRC |
600 |
600 |
6 |
Apr-26 |
May-32 |
8.75% |
416.0% |
|
650 |
650 |
11 |
Apr-26 |
May-37 |
9.50% |
||
|
Angola |
1500 |
1500 |
7 |
Mar-26 |
Mar-33 |
9.38% |
208.0% |
|
1000 |
1000 |
11 |
Mar-37 |
9.88% |
|||
|
Ivory Coast |
1,300 |
1,300 |
15 |
Feb-26 |
Mar-41 |
6.75% |
484.6% |
|
Kenya |
900 |
900 |
7 |
Feb-26 |
Mar-34 |
7.88% |
200.0% |
|
1350 |
1350 |
12 |
Mar-39 |
8.70% |
207.4% |
||
|
Benin |
350 |
350 |
12 |
Jan-26 |
Jan-38 |
7.96% |
822.9% |
|
Cameroon |
650 |
750 |
7 |
Jan-26 |
Feb-33 |
8.88% |
138.5% |
|
Cytonn Report: Credit Ratings of Select SSA Countries |
|||||||
|
Country |
Rating Agency |
Previous Rating |
Previous Outlook |
Date Released |
Current Rating |
Current Outlook |
Date Released |
|
Kenya |
S&P |
B- |
Stable |
Feb-25 |
B |
Stable |
Aug-26 |
|
Fitch |
B- |
Jan-25 |
B- |
Jul-26 |
|||
|
Moody's |
Caa1 |
Positive |
Jan-25 |
B3 |
Jan-26 |
||
|
Benin |
S&P |
BB- |
Positive |
Oct-24 |
BB- |
Stable |
Dec-25 |
|
Fitch |
B+ |
Stable |
Oct-21 |
B+ |
Positive |
Jan-26 |
|
|
Moody's |
B1 |
Positive |
Feb-25 |
Ba3 |
Stable |
Aug-26 |
|
|
Cameroon |
S&P |
SD |
|
Aug-23 |
B- |
Stable |
Mar-24 |
|
Fitch |
B |
Negative |
Nov-25 |
B |
Negative |
Apr-26 |
|
|
Moody's |
B2 |
Stable |
Jul-23 |
Caa1 |
Stable |
Aug-25 |
|
|
Ivory Coast |
S&P |
BB- |
Positive |
May-24 |
BB |
Stable |
Oct-24 |
|
Fitch |
BB- |
Stable |
Jul-21 |
BB |
Stable |
Dec-25 |
|
|
Moody's |
Ba3 |
Positive |
Jun-22 |
Ba2 |
Stable |
Mar-26 |
|
|
Angola |
S&P |
B- |
Stable |
Feb-22 |
B- |
Stable |
Aug-25 |
|
Fitch |
B- |
Jun-23 |
B- |
May-26 |
|||
|
Moody's |
B3 |
Positive |
Oct-22 |
B3 |
May-25 |
||
|
Gabon |
Moody's |
Caa2 |
Stable |
Jun-24 |
Caa2 |
Negative |
Jun-26 |
|
Nigeria |
S&P |
B- |
Positive |
Nov-25 |
B |
Stable |
May-26 |
|
Fitch |
B- |
Stable |
Apr-25 |
B |
Apr-26 |
||
|
Moody's |
B3 |
May-25 |
B3 |
Positive |
Aug-26 |
||
Source: Fitch Ratings, S&P Global, Moody’s
Section II: Analysis of Existing Eurobond Issues in Sub-Saharan Africa
Yields on the selected SSA Eurobonds have recorded a modest increase in 2026 YTD, with most of the bonds recording higher yields between January and September 2026. The increases have, however, remained relatively marginal. The modest rise in yields in 2026 follows a broader decline in 2025, when yields across all the selected bonds fell by between 0.6% points and 2.8% points. This suggests that although some of the gains recorded in 2025 have been partly reversed in 2026, the magnitude of the increase has remained relatively limited, with yields on all the selected bonds still below their January 2025 levels. The marginal increase in yields in 2026 reflects some moderation in the favourable financing conditions observed in 2025, amid renewed global and regional risks. The IMF noted that heightened geopolitical tensions, including the conflict in the Middle East, increased commodity prices and tightened financial conditions, while elevated debt service burdens and refinancing needs continue to weigh on several SSA sovereigns. Despite these pressures, the relatively contained movement in yields suggests that investor demand for SSA sovereign debt has remained comparatively resilient, although borrowing costs continue to differ across countries depending on their fiscal positions, debt sustainability and perceived credit risks. The table below highlights the recent performance of select African Eurobonds.
|
Cytonn Report: Yield Changes in Select SSA Eurobonds Issued Before 2026 |
||||||||||
|
Country |
Issue Tenor (years) |
Issue Date |
Maturity Date |
Coupon |
Yield as at Jan 2025 |
Yield as at Dec 2025 |
Yield as at Jan 2026 |
Yield as at Sep 2026 |
2025 y/y change (%Points) |
2026 YTD change (%Points) |
|
Nigeria |
12 |
Feb-18 |
Feb-30 |
7.1% |
9.1% |
6.1% |
6.2% |
6.6% |
(2.8%) |
0.3% |
|
Kenya |
7 |
Feb-24 |
Jan-31 |
8.0% |
9.8% |
7.4% |
7.2% |
8.1% |
(2.6%) |
0.9% |
|
Kenya |
12 |
Feb-20 |
Jan-32 |
8.0% |
9.5% |
7.2% |
7.1% |
8.0% |
(2.4%) |
0.9% |
|
Nigeria |
12 |
Sep-21 |
Sep-33 |
7.4% |
9.6% |
7.0% |
7.2% |
7.3% |
(2.4%) |
0.1% |
|
Nigeria |
6 |
Jun-25 |
Jun-31 |
9.6% |
9.2% |
6.5% |
6.6% |
6.9% |
(2.5%) |
0.3% |
|
Ivory Coast |
11 |
Apr-25 |
Apr-36 |
8.1% |
8.5% |
7.0% |
7.1% |
7.2% |
(1.4%) |
0.1% |
|
Nigeria |
10 |
Dec-24 |
Dec-34 |
10.4% |
9.6% |
7.4% |
7.5% |
7.6% |
(2.1%) |
0.1% |
|
Kenya |
13 |
Mar-21 |
Feb-34 |
6.3% |
9.6% |
7.7% |
7.6% |
8.3% |
(2.0%) |
0.7% |
|
Benin |
13 |
Dec-22 |
Dec-35 |
6.6% |
6.8% |
6.0% |
5.8% |
6.2% |
(1.0%) |
0.4% |
|
Ivory Coast |
13 |
Feb-24 |
Jan-37 |
5.8% |
8.6% |
7.1% |
7.2% |
7.4% |
(1.4%) |
0.2% |
|
Benin |
14 |
Feb-24 |
Feb-38 |
8.0% |
8.6% |
7.4% |
7.3% |
7.5% |
(1.3%) |
0.2% |
|
Kenya |
30 |
Feb-18 |
Jan-48 |
7.3% |
10.1% |
8.8% |
8.6% |
9.3% |
(1.5%) |
0.7% |
|
Ivory Coast |
30 |
Dec-18 |
Nov-48 |
6.4% |
8.5% |
7.5% |
7.3% |
7.2% |
(1.2%) |
(0.1%) |
|
Benin |
30 |
Feb-22 |
Jan-52 |
8.1% |
8.1% |
7.7% |
7.6% |
7.6% |
(0.6%) |
0.0% |
|
Angola |
30 |
Nov-19 |
Nov-49 |
9.1% |
11.5% |
10.7% |
10.6% |
10.0% |
(0.8%) |
(0.6%) |
Source: Bloomberg
From the table above,
-
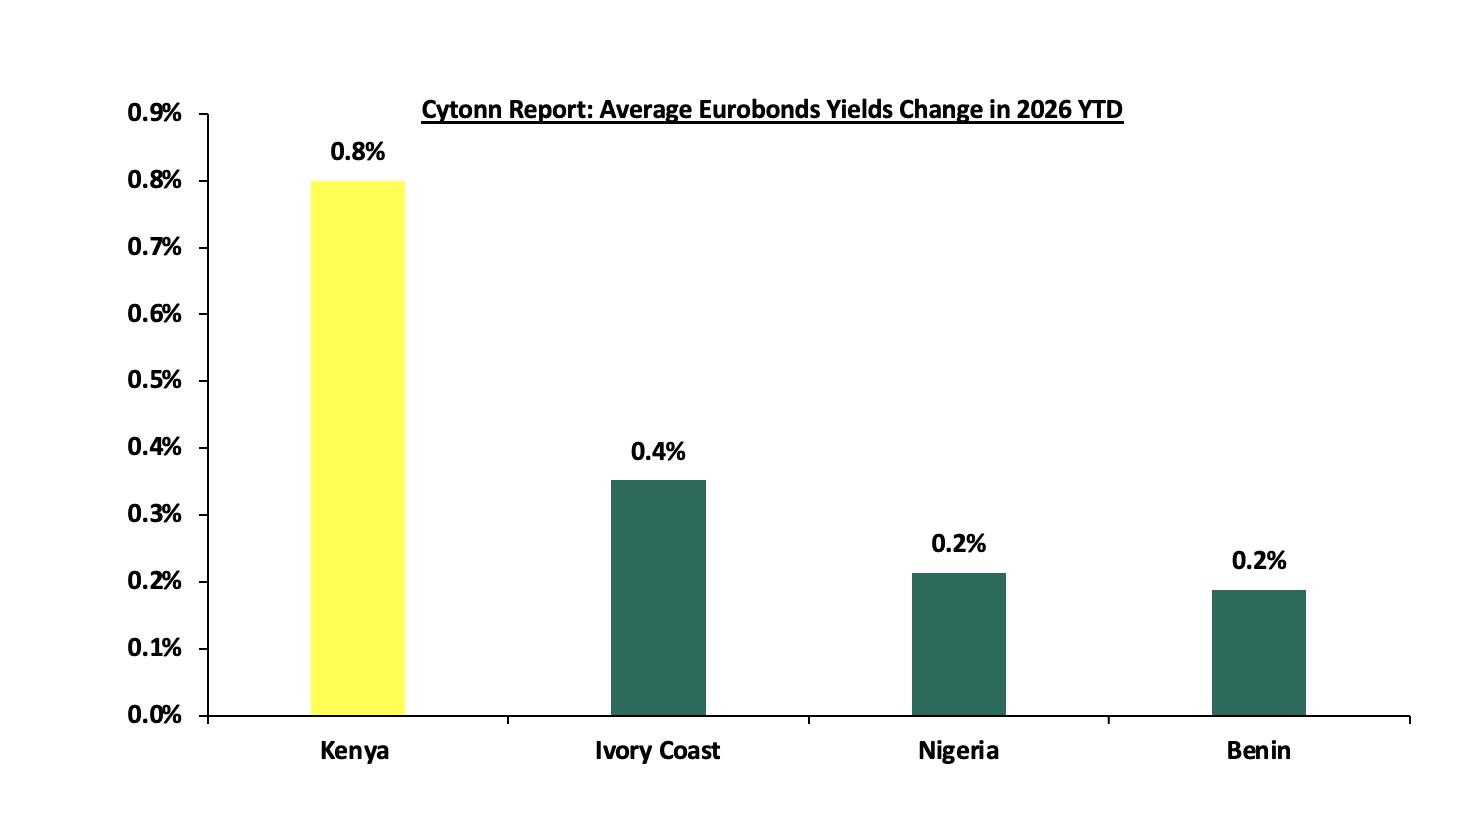
Kenya recorded the largest increases in yields among the selected countries in 2026 YTD, with the selected Eurobonds recording higher yields. The 7 year and 12-year bonds recorded the largest increases of 0.9% points each, followed by the 10-year bond at 0.8% points, while the 13 year and 30-year bonds increased by 0.7% points each. This followed significant yield declines in 2025, with the 7-year bond declining the most by 2.6% points in 2025. The increase in 2026 therefore suggests a measured repricing of the Eurobonds, following the stronger yield compression recorded in 2025.
-
Nigeria recorded relatively modest increases across all selected Eurobonds in 2026 YTD, with the 12 year and 6-year Eurobonds recording increases of 0.3 % points each, while the 12 year and 10-year bonds increased by 0.1% points each. This compares with yield declines of 2.4% and 2.1% percentage points in 2025, with the 12-year Eurobond recording the largest decline. The relatively small increases in 2026 suggest that the improvement in Nigeria’s Eurobond pricing seen in 2025 has largely been maintained.
-
Benin recorded broadly stable yield movements in 2026 YTD, with its 13-year bond increasing by 0.4 % points, while the 14-year bond increased by 0.2% points and the 30-year bond remained unchanged. This compares with yield declines of 1.3%, 1.0% and 0.5% for the 14-year, 13-year and 30-year Eurobonds in 2025.
-
Ivory Coast recorded a range of yield movements in 2026 YTD, with its 11-year and 13-year bonds increasing by 0.1% and 0.2% points, respectively, while the 30 year bond declined by 0.1% points. This contrasts with the 1.4% points and 1.2% points for the 11-year, 13 year and 30-year bonds respectively. The limited movements in 2026 indicate that yields have remained relatively stable after the decline recorded in 2025.
The graph below summarizes the average YTD change in the Eurobond yields of select countries;
Source: Reuters
*Average yields increase calculated as an average of the Country’s Eurobonds yields increase
Eurobonds, being denominated in foreign currency, imply that a depreciation in a country’s local currency leads to increased costs. These costs are incurred when purchasing foreign currency to service existing debt obligations. Below is a summary of the performance of the different resident currencies as of September 2026:
|
Cytonn Report: Select Sub-Saharan Africa Currency Performance vs USD |
|||||
|
Currency |
Sep-25 |
Jan-26 |
Sep-26 |
Last 12 months |
YTD change (%) |
|
Zambian Kwacha |
23.6 |
22.1 |
19.6 |
16.7% |
11.0% |
|
Nigerian Naira |
1,490.0 |
1,431.0 |
1,330.0 |
10.7% |
7.1% |
|
South African Rand |
17.4 |
16.5 |
16.3 |
6.4% |
1.6% |
|
Malawian kwacha |
1,733.4 |
1,749.6 |
1,734.0 |
(0.0%) |
0.9% |
|
Kenyan Shilling |
129.2 |
129.1 |
129.6 |
(0.3%) |
(0.4%) |
|
Botswana Pula |
13.3 |
13.1 |
13.2 |
0.5% |
(1.2%) |
|
Mauritius Rupee |
45.4 |
46.6 |
47.6 |
(5.0%) |
(2.1%) |
|
Tanzanian Shilling |
2,474.3 |
2,464.1 |
2,654.3 |
(7.3%) |
(7.7%) |
|
Ugandan Shilling |
3,505.1 |
3,624.7 |
3,935.0 |
(12.3%) |
(8.6%) |
|
Ghanaian Cedi |
12.3 |
10.5 |
11.6 |
5.7% |
(10.0%) |
Source: SSA Countries’ Central Banks
Sub Saharan African currencies have recorded a mixed performance against the US dollar in 2026 YTD, with most currencies depreciating while other remained stable. The divergent performance has largely been driven by differences in foreign exchange liquidity, external balances, commodity export receipts, capital inflows and domestic macroeconomic conditions. Currencies that appreciated were generally supported by stronger foreign exchange inflows, improved reserve positions, higher commodity receipts and measures by monetary authorities to enhance foreign exchange market liquidity and stability. On the other hand, depreciation pressures have largely stemmed from increased demand for foreign currency, higher import costs, weaker external balances and periodic capital outflows. Globally, currency performance has also been influenced by periods of US dollar weakness and changing expectations around the US Federal Reserve’s monetary policy path, which have provided some support to emerging and frontier market currencies. However, geopolitical tensions and shifts in global risk sentiment have periodically strengthened demand for safe haven assets, including the US dollar, creating renewed pressure on some regional currencies. Overall, the mixed performance reflects the varying strength of countries’ external positions and the effectiveness of domestic policy measures in managing foreign exchange pressures.
The Zambian Kwacha has recorded the best performance among the selected Sub Saharan African currencies, appreciating by 11.0% year to date in September 2026 and strengthening significantly compared to the same period in 2025. The appreciation has been supported by increased foreign exchange inflows from the mining sector, particularly amid higher copper prices, as well as inflows from foreign financial institutions. In Q1 2026, mining companies recorded net foreign exchange sales of USD 626.0 mn, while tax remittances amounted to USD 289.7mn, bringing total foreign exchange liquidity supplied by the mining sector to USD 915.7mn, up from USD 759.4 mn in the previous quarter. Progress on debt restructuring and improving macroeconomic conditions have further strengthened investor confidence, while improved foreign exchange liquidity has reduced pressure on the Kwacha. These factors have contributed to greater stability in the foreign exchange market and supported the currency's strong recovery. The graph below shows the select SSA Countries currency performance YTD percentage change:
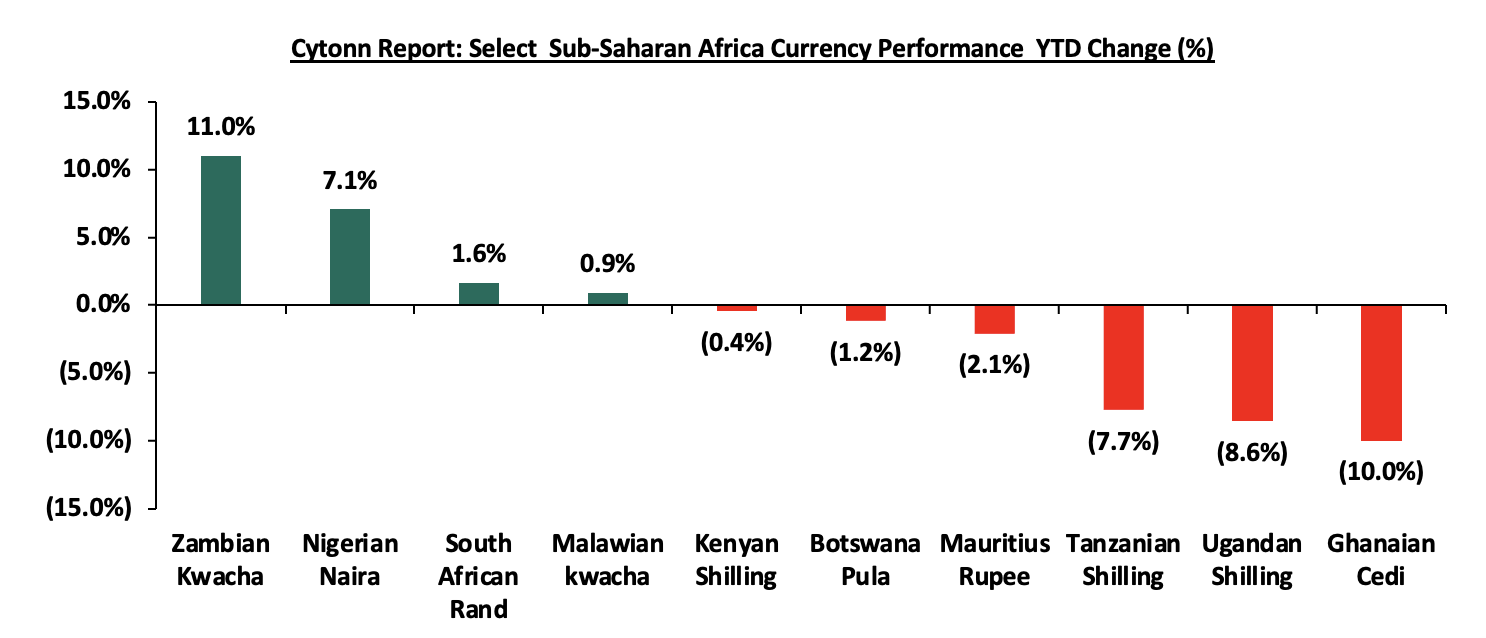
Going forward, we expect local currencies to remain under pressure from elevated energy and import costs and global geopolitical risks, which could limit further appreciation and lead to continued depreciation pressures across some markets. However, improved foreign exchange liquidity, stronger commodity export receipts and ongoing macroeconomic reforms should provide some support to currencies with stronger external positions.
Section III: Debt Sustainability in the Sub-Saharan Africa Region
Debt sustainability continues to be a key structural challenge in the Sub-Saharan Africa (SSA) region, driven by persistent fiscal deficits and elevated public debt levels, most of which is external and foreign-denominated. Elevated debt service costs continue to constrain fiscal space, with external public debt service rising significantly relative to government revenues. The accumulation of debt following the COVID 19 pandemic, together with tighter global financial conditions and elevated borrowing costs, has increased debt servicing pressures for many economies. More recently, geopolitical tensions and higher energy and import costs have added further pressure.
Since the onset of the pandemic, Zambia, Ghana and Ethiopia have experienced sovereign debt defaults in 2020, 2022 and 2023, respectively. Since 2025, however, the debt situation has seen notable developments. Ghana has progressed further with its external debt restructuring, while Zambia continues to advance negotiations with its creditors. Ethiopia also reached an agreement in principle with private bondholders in June 2026 to restructure its USD 1.0 bn Eurobond, with the agreement subsequently receiving approval from official creditors in August, although bondholder approval is still pending. In contrast, Ivory Coast has maintained strong access to international capital markets, raising USD 1.3 bn through a 15 year Eurobond in February 2026 at an effective euro cost of 5.4%, with orders reaching USD 6.3 bn.
Senegal remains a key concern following the discovery of previously undisclosed debt, which significantly increased its debt burden and constrained access to international capital markets. In September 2026, the authorities reached a staff level agreement with the IMF for a USD 2.2 bn, 36-month programme aimed at restoring debt sustainability, while also pursuing debt treatment under an enhanced G20 Common Framework. Against this backdrop, Senegal has increasingly relied on the regional market, raising USD 0.2 bn through a domestic bond auction on 11th September 2026. The increased use of domestic and regional financing highlights the country's continued funding needs amid restricted access to international capital markets and ongoing efforts to address its debt burden.
Kenya has continued to actively manage its external debt through liability management operations aimed at reducing refinancing pressures and smoothing its debt maturity profile. In March 2025, the Government raised USD 1.5 bn through a 10-year Eurobond at a 9.5% coupon, with USD 0.6 mn used to partially repurchase the USD 0.9 mn Eurobond maturing in 2027. In February 2026, Kenya returned to the international market and raised a further USD 2.3 bn through a dual tranche Eurobond, comprising USD 0.9 mn maturing in 2034 at a 7.9% coupon and USD 1.4 bn maturing in 2039 at an 8.7% coupon. The proceeds were primarily used to refinance existing obligations, including the repurchase of portions of the 2028 and 2032 Eurobonds, while also supporting general budgetary needs. The transactions have therefore helped spread debt repayments over a longer period and reduce near term refinancing pressures, although they also increase the stock of external commercial debt.
Overall, debt sustainability across Sub Saharan Africa has shown some improvement, with several countries making progress on debt restructuring while others have regained access to international capital markets. However, elevated debt service costs, borrowing costs for higher risk sovereigns and large refinancing needs continue to constrain fiscal space and expose countries to external shocks. Sustained improvements in debt sustainability will depend on stronger fiscal consolidation, improved revenue mobilisation and reduced reliance on expensive commercial borrowing. Below is a summary of public debt to GDP ratios of the selected Sub Saharan African countries:
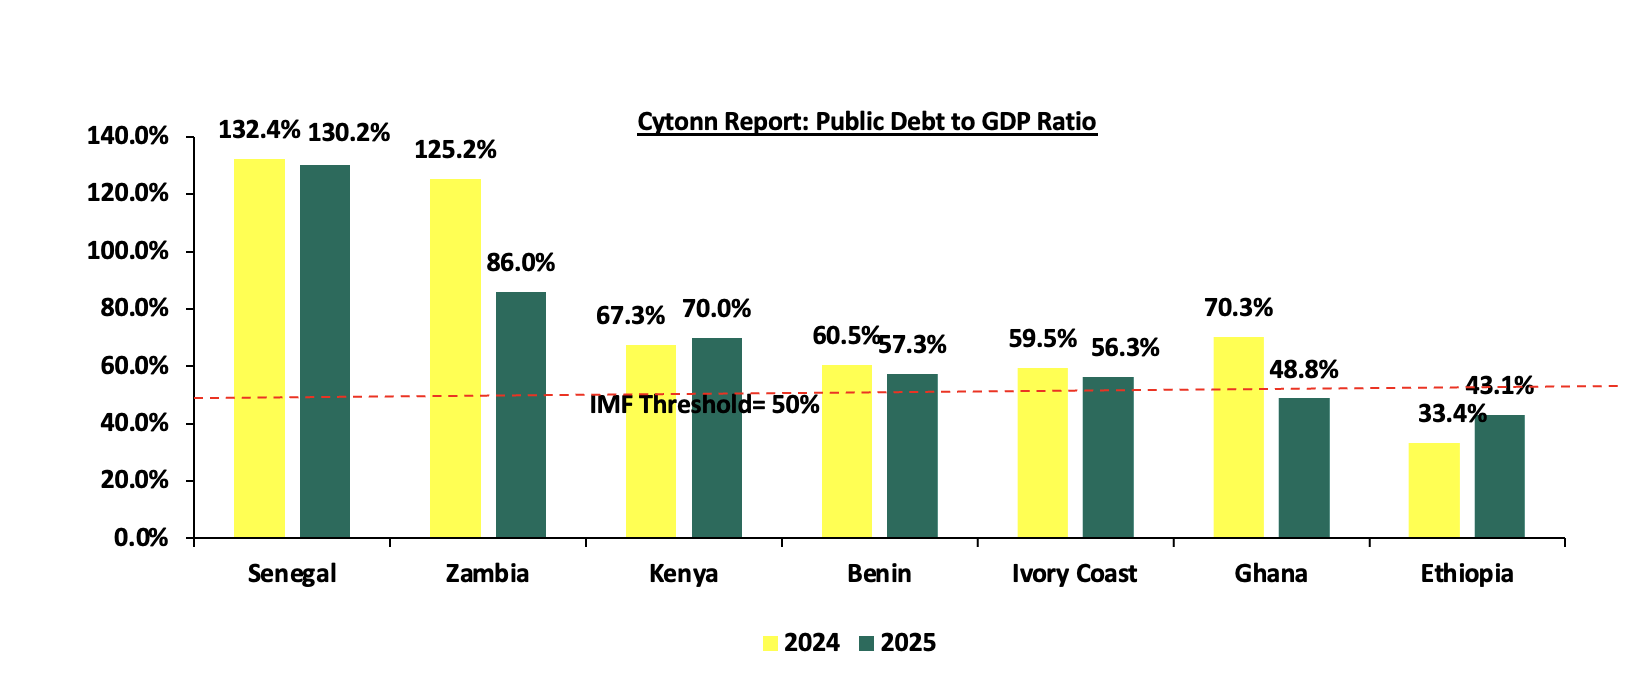
Source: IMF
From the graph above the key take outs include;
-
Senegal’s public debt to GDP ratio decreased by 2.2% points to 130.2% in 2025 from 132.4% in 2024, highlighting continued pressures on debt sustainability. The elevated debt burden largely reflects the fiscal imbalances and previously undisclosed liabilities uncovered through the audit of public finances. The deterioration in Senegal’s fiscal and debt position also led Moody’s to downgrade the sovereign rating to B1 from Ba3 in October 2024 and place it on review for further downgrade. In the February 2025 rating, Moody’s further downgraded it to B3 from B1 it was reflecting heightened fiscal and liquidity risks. Despite the elevated debt burden, Senegal made some progress in 2025, with the fiscal deficit narrowing from 13.4% of GDP in 2024 to 6.4% in 2025, supported by spending rationalisation. Economic growth also strengthened to 6.7% in 2025, driven largely by the expansion of the hydrocarbon sector following the start of oil and gas production. However, the high level of public debt continues to constrain fiscal space, with the authorities needing to maintain fiscal consolidation and strengthen debt management to restore debt sustainability.
-
Kenya’s public debt to GDP ratio increased by 2.7% points to 70.5% in 2025 from 67.3% in 2024, reflecting continued debt accumulation amid persistent fiscal deficits and elevated debt servicing costs. The increase was mainly driven by the continued budget financing gap, which required additional borrowing, while high interest costs further increased the government’s financing needs. The National Treasury continues to identify fiscal consolidation as a key measure to reduce the pace of debt accumulation, with Kenya’s present value of public debt remaining above the 55% sustainability threshold and the country assessed to be at high risk of debt distress. The IMF has similarly identified the high interest cost of domestic debt and exchange rate risks associated with external debt as key challenges to debt management. Despite the increase in the debt ratio, Kenya’s external financing position improved during 2025. S&P Global upgraded Kenya’s sovereign rating to B from B minus in August 2025 and maintained a stable outlook, citing stronger foreign exchange reserves, improved access to external funding and robust export earnings. These developments point to improved market access and lower near-term refinancing risks, although elevated interest costs, large financing needs and reliance on commercial borrowing continue to pose challenges to long term debt sustainability.
-
Ethiopia’s public debt to GDP ratio increased by 9.7% points to 43.1% in 2025 from 33.4% in 2024, reflecting continued fiscal and external financing pressures despite ongoing economic reforms. The elevated debt burden has been compounded by the country’s limited fiscal space and foreign exchange constraints, which have increased the challenges of servicing external obligations. Ethiopia remains in debt distress following its default on the USD 1.0 bn Eurobond in December 2023. However, significant progress has been made in restructuring its external debt. In June 2026, Ethiopia reached an agreement in principle with a group of Eurobond holders to restructure the USD 1.0 bn notes, involving a 12.0% haircut and the issuance of a new USD 0.9 bn bond maturing in 2029 at a 6.2% coupon. The Official Creditor Committee subsequently assessed the agreement as compliant with the comparability of treatment principle in August 2026. Ethiopia has also continued to make progress under its USD 3.4 bn IMF Extended Credit Facility programme, with the IMF noting significant progress towards restoring debt sustainability. As of June 2026, agreements had been reached with several official and commercial creditors, while negotiations with Eurobond holders were continuing. The IMF’s latest debt sustainability analysis nevertheless continues to classify Ethiopia as being in debt distress, although the illustrative restructuring scenario indicates that debt indicators could fall below their respective thresholds by 2027/28 as debt treatment is implemented. Overall, while the increase in the debt ratio highlights continued debt pressures, the progress in external debt restructuring and ongoing IMF supported reforms provide a pathway towards improving debt sustainability.
-
Zambia’s public debt to GDP ratio declined significantly by 39.2% points to 86.0% in 2025 from 125.2% in 2024, reflecting progress in fiscal consolidation and the implementation of external debt restructuring agreements. The decline was supported by the restructuring of Zambia’s Eurobond, which was completed in June 2024 and provided a substantial reduction in the principal value of the outstanding bonds, as well as continued fiscal adjustment under the IMF supported programme. By May 2025, Zambia had signed restructuring agreements with three bilateral creditors, while agreements with its main private sector creditors had also been reached, bringing approximately 94.0% of the debt within the restructuring perimeter under agreed treatment. The restructuring was important in reducing Zambia’s debt burden and improving the projected debt service profile, although the country remained at high risk of overall and external debt distress. However, the restructuring process was not yet fully complete by the end of 2025. Negotiations with Afreximbank and the Trade and Development Bank remained unresolved, delaying the completion of the external debt restructuring despite the agreement reached with the main private creditors in June 2025. This continued to constrain Zambia’s ability to fully exit its default status and remained a key risk to investor confidence. Nevertheless, Zambia recorded progress in restoring market credibility, with S&P Global upgrading its long term foreign currency sovereign rating to CCC+ in November 2025, with a stable outlook, effectively removing the country from selective default status. The IMF also reported progress in rebuilding international reserves and improving the fiscal position, while the fifth review under the Extended Credit Facility was completed in July 2025, releasing a further USD 0.2 bn. Overall, the decline in the debt ratio indicates meaningful progress in Zambia’s debt restructuring and fiscal adjustment, although the high risk of debt distress and unresolved creditor negotiations continued to underscore the need for sustained fiscal discipline and completion of the restructuring process.,
-
Ghana’s public debt to GDP ratio declined significantly by 21.5% points to 48.8% in 2025 from 66.4% in 2024, marking a substantial improvement in debt sustainability following the country’s sovereign default in 2022. The sharp decline was driven by the ongoing restructuring of both domestic and external debt, strong nominal GDP growth and improved fiscal performance. Ghana completed its domestic debt exchange in 2023 and its USD 13.1 bn Eurobond exchange in October 2024, while the Memorandum of Understanding with the Official Creditor Committee under the G20 Common Framework was signed in January 2025, paving the way for bilateral agreements with official creditors. By December 2025, bilateral debt relief agreements had been signed with several official creditors, while Agreements in Principle had also been reached with a number of external commercial creditors. The debt restructuring has therefore reduced Ghana’s debt service burden and improved the projected debt trajectory, with the IMF estimating that public debt had fallen to 48.8% of GDP by end 2025. The improvement was also supported by stronger macroeconomic fundamentals. Real GDP growth accelerated to 6.0% in 2025, while inflation declined substantially and the cedi appreciated, supported by stronger gold and cocoa exports. Gross international reserves also increased to about USD 9.1 bn by end 2025, equivalent to approximately 3.4 months of prospective imports, strengthening Ghana’s external liquidity position. On the fiscal side, the government was on track to achieve a primary surplus of 1.5% of GDP in 2025, compared with a large primary deficit during the earlier stages of the debt crisis, reflecting expenditure rationalisation and stronger revenue mobilisation. Ghana remained exposed to elevated debt servicing costs and the need to complete negotiations with remaining external creditors. The decline in Ghana’s debt ratio, stronger fiscal position, improving external buffers and progress in debt restructuring represented a significant improvement in debt sustainability, although maintaining fiscal discipline and completing the remaining restructuring remained critical to preventing a renewed accumulation of debt.
Section IV: Outlook on SSA Eurobonds Performance
-
Improved Eurobond Yields –Sub Saharan Africa SSA Eurobond yields are expected to remain relatively stable but with a moderate upward bias, as the yield compression recorded in 2025 appears to be losing momentum. The marginal increases recorded across most of our selected bonds in 2026 YTD suggest that further declines in yields may be limited, particularly as elevated refinancing needs and tighter global financial conditions increase sensitivity to country specific fiscal and external vulnerabilities. Countries with stronger fiscal positions, improved debt sustainability and stable foreign exchange conditions are likely to continue attracting investor demand, while weaker sovereigns could face higher borrowing costs.
-
Public debt to GDP ratios will continue to rise – Public debt to GDP ratios remain uneven across the region, with our selected countries showing significant differences in both debt levels and the direction of change. Senegal recorded the highest ratio at 130.2% in 2025, followed by Zambia at 86.0% and Kenya at 69.3%, while Ghana recorded the largest improvement, with its ratio declining from 66.4% to 48.8%. This divergence is important for Eurobond performance because investors are likely to favour countries where debt ratios are declining alongside fiscal consolidation and stronger economic growth, while countries with high or rising debt ratios are likely to attract higher risk premiums. The IMF notes that more than one third of SSA countries are at high risk of, or already in, debt distress, while rising interest costs continue to increase debt service burdens. Going forward, we expect countries with declining debt to GDP ratios, credible fiscal consolidation and stronger growth prospects to experience more favourable borrowing conditions, while countries with elevated or rising debt ratios will continue to face higher refinancing risks and borrowing costs, and,
-
Geopolitical and Global risks concern - The recent improvement in SSA Eurobond performance remains vulnerable to renewed geopolitical tensions and tighter global financial conditions. The conflict in the Middle East has already increased energy, fertiliser and shipping costs, which could raise inflation and widen current account and fiscal pressures, particularly for countries that are net importers of energy and other commodities. At the same time, a stronger US dollar or a reversal in global investor risk appetite could increase the cost of servicing foreign currency debt and reduce demand for SSA sovereign bonds. The IMF expects these pressures to weigh on regional growth in 2026, while noting that more than one third of SSA countries are already at high risk of, or in, debt distress. Going forward, we therefore expect geopolitical shocks and changes in global financial conditions to create periods of renewed upward pressure on Eurobond yields, with countries that have high refinancing needs, weak external balances and limited fiscal space likely to be more affected.
Measures that the SSA Region Can Take to Improve Its Credit Ratings
-
Strengthen fiscal consolidation and budget credibility– The region should maintain credible medium-term fiscal consolidation programmes focused on reducing persistent budget deficits, controlling recurrent expenditure and protecting priority development spending. Stronger budget execution and adherence to fiscal targets would improve investor confidence and reduce sovereign risk premiums,
-
Domestic revenue mobilisation– The region should broaden their tax bases, strengthen tax administration and reduce leakages to increase government revenue without relying excessively on higher tax rates. Higher and more predictable domestic revenues would improve debt servicing capacity and reduce the need for expensive external borrowing,
-
Debt Management – Governments should actively manage their debt portfolios by extending maturities, refinancing expensive obligations where market conditions permit and increasing the use of concessional financing. Liability management operations similar to those undertaken by Kenya can help smooth maturity profiles and reduce near term refinancing pressures, while stronger debt transparency can improve investor confidence,
-
Deepen domestic capital markets– SSA countries should develop deeper and more liquid local currency bond markets to diversify government financing sources and reduce excessive dependence on Eurobonds. Establishing reliable yield curves, broadening institutional investor participation and improving market transparency would strengthen domestic financing capacity and reduce exposure to global capital market volatility. The IMF highlights stronger domestic debt markets as an important avenue for reducing reliance on external financing and strengthening financial resilience,
-
Debt transparency, governance and structural reforms– The region should improve the disclosure of public debt, strengthen public financial management and ensure that borrowed funds are directed towards productive investments that support economic growth. Greater transparency and stronger institutions would reduce uncertainty around sovereign finances, improve creditworthiness and help attract private investment, while structural reforms that raise productivity and diversify economic activity would strengthen the long-term capacity to service public debt,
Conclusion: From our analysis, the Sub Saharan Africa Eurobond market has recorded a notable improvement in 2026, supported by stronger international market access, increased investor appetite and marginal increase in secondary market yields. The return of several sovereigns to the international capital markets, including Kenya, Angola, Ivory Coast, Cameroon, Benin, Gabon and DRC, alongside the strong demand recorded during recent issuances, indicates an improvement in investor confidence towards selected SSA sovereigns. However, the performance remains uneven across countries, with differences in fiscal positions, debt sustainability, foreign exchange stability and creditworthiness continuing to influence borrowing conditions. Going forward, we expect the SSA Eurobond market to remain accessible to stronger sovereigns, although borrowing costs are likely to remain sensitive to global financial and geopolitical developments. Elevated public debt levels, high debt service obligations and large refinancing requirements will continue to constrain fiscal space, particularly for countries with weaker credit profiles. These measures will be critical in lowering sovereign risk premiums, improving creditworthiness and enabling SSA countries to access international capital markets at more sustainable borrowing costs.
Disclaimer: The views expressed in this publication are those of the writers where particulars are not warranted. This publication, which is in compliance with Section 2 of the Capital Markets Authority Act Cap 485A, is meant for general information only and is not a warranty, representation, advice or solicitation of any nature. Readers are advised in all circumstances to seek the advice of a r

- Talk to us
- Kenya
- P.O Box 20695 - 00200, Nairobi, Kenya
- Cell +254709101200
- Tel +254709101200
- WhatsApp +254741676635
- United States
- +254709101200
- DOWNLOAD OUR APP
-


- Kenya
- 8th Floor, Pinetree Plaza, Kaburu Drive, Ngong Road, Nairobi, Kenya
- USA
- Suite 1150, 1775 Eye Street NW, USA, Washington DC 20006, USA
- Investments
- High Yield
- Private Equity
- Real Estate
- Real Estate
- RiverRun Estates
- Cytonn Towers
- The Ridge
- Taraji Heights
- The Alma