The Nairobi Metropolitan Area (NMA) Mixed-Use Developments Report, & Cytonn Weekly #43/2022
By Research, Oct 30, 2022
Executive Summary
Fixed Income
During the week, T-bills were undersubscribed, with the overall subscription rate coming in at 75.8%, a decline from the 117.9% recorded the previous week. Investor’s preference for the shorter 91-day paper persisted, with the paper receiving bids worth Kshs 12.0 bn against the offered Kshs 4.0 bn, translating to a subscription rate of 299.8%, down from 488.0% recorded the previous week. Similarly, the subscription rates for the 364-day and 182-day papers declined to 21.5% and 40.4%, from 39.7% and 48.2% respectively, recorded the previous week. The yields on the government papers were on an upward trajectory, with the yields on the 364-day, 182-day and 91-day papers increasing by 3.7 bps, 1.4 bps and 2.7 bps to 10.0%, 9.7% and 9.1%, respectively. In the Primary Bond Market, the government is seeking to raise Kshs 60.0 bn for infrastructure projects in the FY’2022/2023 budget by opening an infrastructure bond, IFB1/2022/14, with a tenor of 14 years whose offer period ends on 8th November 2022;
According to the International Monetary Fund (IMF) Regional Economic Outlook Report October 2022, the Sub-Saharan Region’s economic growth rate is projected to grow at 3.6% in 2022 and rise marginally to 3.7% in 2023, down from 4.7% recorded in 2021. The main drivers behind the projected slower growth are elevated inflationary pressures driven by high global food and energy prices, tightened monetary policies, persistent currency depreciation, capital outflows and debt sustainability concerns;
Equities
During the week, the equities market recorded mixed performance with NASI and NSE 25 gaining by 0.1% and 0.4% respectively while NSE 20 declined by 1.4%, taking their YTD performance to losses of 23.1%, 12.2% and 16.9%, for NASI, NSE 20 and NSE 25, respectively. The equities market performance was mainly driven by gains recorded by banking stocks such as NCBA Group, Equity Group, and KCB Group of 6.6%, 3.2% and 3.1%, respectively. The gains were however weighed down by losses recorded by other banking stocks such as ABSA Bank of 3.9% while Co-operative Bank and DTB-K both declined by 1.7% each;
Also during the week, the Cabinet Secretary for the National Treasury and Planning, through the Capital Markets Authority (CMA) announced the gazettement of the amended The Capital Markets (Investments-Based Crowdfunding) Regulations 2022, that were first issued for public review in July 2021;
Real Estate
During the week, student housing property developer Acorn Holdings, announced plans to repay loans worth Kshs 800.2 mn, which is a portion of its outstanding Kshs 5.7 bn green bond, through an early redemption option. Additionally, Shelter Afrique, a Pan African housing finance institution based in Nairobi’s Upperhill district, announced plans to develop a sovereign lending product which will boost its traditional lending products to finance both the demand and supply sides of the housing sector in Africa. In the hospitality sector, Crowne Plaza Nairobi was voted the best luxury airport hotel in Africa during the 16th World Luxury Hotel Awards 2022, thereby becoming Kenya’s first airport hotel to win the award, while Kenya emerged as Africa’s best MICE destination in the in the 3rd annual World MICE Awards. Under statutory reviews, President William Ruto announced plans to exempt all first time home buyers from paying stamp duty. For Real Estate Investment Trusts, Fahari I-REIT closed the week trading at an average price of Kshs 6.6 per share on the Nairobi Stock Exchange, while Acorn D-REIT and Acorn I-REIT prices stood at Kshs 23.8 and Kshs 20.8 per unit, respectively, on the Unquoted Securities Platform as at 7th October 2022;
Focus of the Week
In November 2021, we released the Nairobi Metropolitan Area Mixed-Use Developments (MUDs) Report 2021, which highlighted that Mixed-Use Developments (MUDs) recorded an average rental yield of 7.2%, which was 0.7% points higher than the 6.5% rental yield for the retail, commercial Office and residential single use themes. This week we update our report with the 2022 market research in order to determine the progress and performance of MUDs against the performance of single use Residential, Commercial Office, and Retail developments. In terms of performance, Mixed-Use Developments in the NMA recorded an average rental yield of 7.4% in 2022, 0.6% points higher than the respective single-use themes which recorded an average rental yield of 6.8% in the similar period. Additionally, the performance was a 0.2% points y/y increase in the average rental yield to 7.4% in 2022, from the 7.2% realized in 2021;
Investment Updates:
- Weekly Rates:
- Cytonn Money Market Fund closed the week at a yield of 10.7%. To invest, dial *809# or download the Cytonn App from Google Playstore here or from the Appstore here;
- Cytonn High Yield Fund closed the week at a yield of 13.9% p.a. To invest, email us at sales@cytonn.com and to withdraw the interest, dial *809# or download the Cytonn App from Google Playstore here or from the Appstore here;
- We continue to offer Wealth Management Training every Wednesday and every third Saturday of the month, from 9:00 am to 11:00 am, through our Cytonn Foundation. The training aims to grow financial literacy among the general public. To register for any of our Wealth Management Trainings, click here;
- If interested in our Private Wealth Management Training for your employees or investment group, please get in touch with us through wmt@cytonn.com;
- Any CHYS and CPN investors still looking to convert are welcome to consider one of the five projects currently available for assignment, click here for the latest term sheet;
- Cytonn Insurance Agency acts as an intermediary for those looking to secure their assets and loved ones’ future through insurance namely; Motor, Medical, Life, Property, WIBA, Credit and Fire and Burglary insurance covers. For assistance, get in touch with us through insuranceagency@cytonn.com;
- Cytonnaire Savings and Credit Co-operative Society Limited (SACCO) provides a savings and investments avenue to help you in your financial planning journey. To enjoy competitive investment returns, kindly get in touch with us through clientservices@cytonn.com;
- For an exclusive tour of Cytonn’s real estate developments, visit: Sharp Investor's Tour, and for more information, email us at sales@cytonn.com;
- Phase 3 of The Alma is now ready for occupation and the show house is open daily. To rent please email properties@cytonn.com;
- We have 8 investment-ready projects, offering attractive development and buyer targeted returns; See further details here: Summary of Investment-ready Projects;
- For Third Party Real Estate Consultancy Services, email us at rdo@cytonn.com;
- For recent news about the group, see our news section here;
Hospitality Updates:
- We currently have promotions for Staycations. Visit cysuites.com/offers for details or email us at sales@cysuites.com;
During the week, T-bills were undersubscribed, with the overall subscription rate coming in at 75.8%, a decline from the 117.9% recorded the previous week. Investor’s preference for the shorter 91-day paper persisted, with the paper receiving bids worth Kshs 12.0 bn against the offered Kshs 4.0 bn, translating to a subscription rate of 299.8%, down from 488.0% recorded the previous week. Similarly, the subscription rates for the 364-day and 182-day papers declined to 21.5% and 40.4%, from 39.7% and 48.2% respectively, recorded the previous week. The yields on the government papers were on an upward trajectory, with the yields on the 364-day, 182-day and 91-day papers increasing by 3.7 bps, 1.4 bps and 2.7 bps to 10.0%, 9.7% and 9.1%, respectively.
In the Primary Bond Market, the government is seeking to raise Kshs 60.0 bn for infrastructure projects by opening an infrastructure bond, IFB1/2022/14, with a tenor of 14 years whose offer period ends on 8th November 2022. Key to note, the bond’s coupon rate will be market determined. Given the ample liquidity in the market, as well as the attractive tax-free nature of the infrastructure bond, we anticipate an oversubscription and a higher acceptance rate. Our recommended bidding range for the bond is: 13.8%-14.1% within which bonds of a similar tenor are trading.
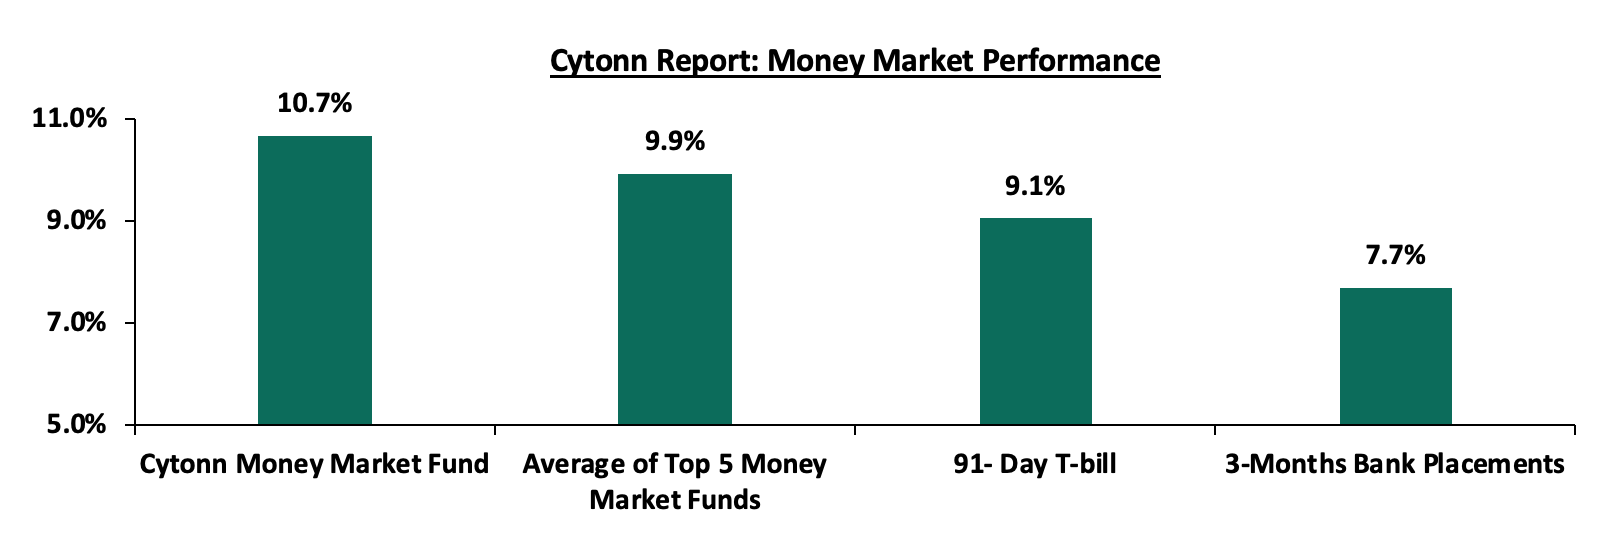
In the money markets, 3-month bank placements ended the week at 7.7% (based on what we have been offered by various banks), while the yield on the 91-day T-bill increased by 2.7 bps to 9.1%. The average yields of the Top 5 Money Market Funds and the Cytonn Money Market Fund remained unchanged at 9.9% and 10.7%, respectively.
The table below shows the Money Market Fund Yields for Kenyan Fund Managers as published on 28th October 2022:
|
Cytonn Report: Money Market Fund Yield for Fund Managers as published on 28th October 2022 |
||
|
Rank |
Fund Manager |
Effective Annual Rate |
|
1 |
Cytonn Money Market Fund |
10.7% |
|
2 |
Zimele Money Market Fund |
9.9% |
|
3 |
NCBA Money Market Fund |
9.6% |
|
4 |
Dry Associates Money Market Fund |
9.5% |
|
5 |
Sanlam Money Market Fund |
9.5% |
|
6 |
Madison Money Market Fund |
9.4% |
|
7 |
Old Mutual Money Market Fund |
9.3% |
|
8 |
Apollo Money Market Fund |
9.2% |
|
9 |
Co-op Money Market Fund |
9.2% |
|
10 |
CIC Money Market Fund |
9.1% |
|
11 |
GenCap Hela Imara Money Market Fund |
8.9% |
|
12 |
Nabo Africa Money Market Fund |
8.9% |
|
13 |
ICEA Lion Money Market Fund |
8.5% |
|
14 |
Orient Kasha Money Market Fund |
8.5% |
|
15 |
AA Kenya Shillings Fund |
8.4% |
|
16 |
British-American Money Market Fund |
7.7% |
Source: Business Daily
Liquidity:
During the week, liquidity in the money markets eased, with the average interbank rate declining to 5.0% from 5.1% recorded the previous week, partly attributable to government payments offsetting tax remittances. The average interbank volumes traded declined by 6.1% to Kshs 29.8 bn from Kshs 31.7 bn recorded the previous week.
Kenya Eurobonds:
During the week, the yields on Eurobonds were on a downward trajectory, an indication of declining risk concerns over the economy. The yield on the 10-year Eurobond issued in 2014 declined the most by 1.1% points to 16.2% from 17.3% recorded in the previous week. The table below shows the summary of the performance of the Kenyan Eurobonds as of 27th October 2022;
|
Cytonn Report: Kenya Eurobond Performance |
||||||
|
|
2014 |
2018 |
2019 |
2021 |
||
|
Date |
10-year issue |
10-year issue |
30-year issue |
7-year issue |
12-year issue |
12-year issue |
|
3-Jan-22 |
4.4% |
8.1% |
8.1% |
5.6% |
6.7% |
6.6% |
|
30-Sep-22 |
17.6% |
14.7% |
14.0% |
15.6% |
14.7% |
13.2% |
|
20-Oct-22 |
17.3% |
14.8% |
13.8% |
15.8% |
14.7% |
13.3% |
|
21-Oct-22 |
17.9% |
14.9% |
14.1% |
16.3% |
15.0% |
13.5% |
|
24-Oct-22 |
18.0% |
15.0% |
14.1% |
16.1% |
15.2% |
13.5% |
|
25-Oct-22 |
17.6% |
15.0% |
14.1% |
16.1% |
15.0% |
13.4% |
|
26-Oct-22 |
17.4% |
14.7% |
13.7% |
15.6% |
14.7% |
13.2% |
|
27-Oct-22 |
16.2% |
14.1% |
13.4% |
15.1% |
14.4% |
12.8% |
|
Weekly Change |
(1.1%) |
(0.7%) |
(0.4%) |
(0.7%) |
(0.3%) |
(0.5%) |
|
MTD Change |
(1.3%) |
(0.7%) |
(0.6%) |
(0.6%) |
(0.3%) |
(0.4%) |
|
YTD Change |
11.8% |
6.0% |
5.3% |
9.5% |
7.7% |
6.2% |
Source: Central Bank of Kenya (CBK)
Kenya Shilling:
During the week, the Kenyan shilling depreciated by 0.1% against the US dollar to close the week at Kshs 121.3, from Kshs 121.1 recorded the previous week, partly attributable to increased dollar demand from importers, especially oil and energy sectors against a slower supply of hard currency. On a year to date basis, the shilling has depreciated by 7.2% against the dollar, higher than the 3.6% depreciation recorded in 2021. We expect the shilling to remain under pressure in 2022 as a result of:
- High global crude oil prices on the back of persistent supply chain bottlenecks coupled with high demand,
- An ever-present current account deficit estimated at 5.2% of GDP in the 12 months to August 2022, same as what was recorded in a similar period in 2021, and,
- The need for Government debt servicing which continues to put pressure on forex reserves given that 68.1% of Kenya’s External debt was US Dollar denominated as of July 2022.
The shilling is however expected to be supported by:
- Improved diaspora remittances standing at a cumulative USD 4.0 bn as of September 2022, representing a 14.3% y/y increase from USD 3.5 bn recorded over the same period in 2021, and,
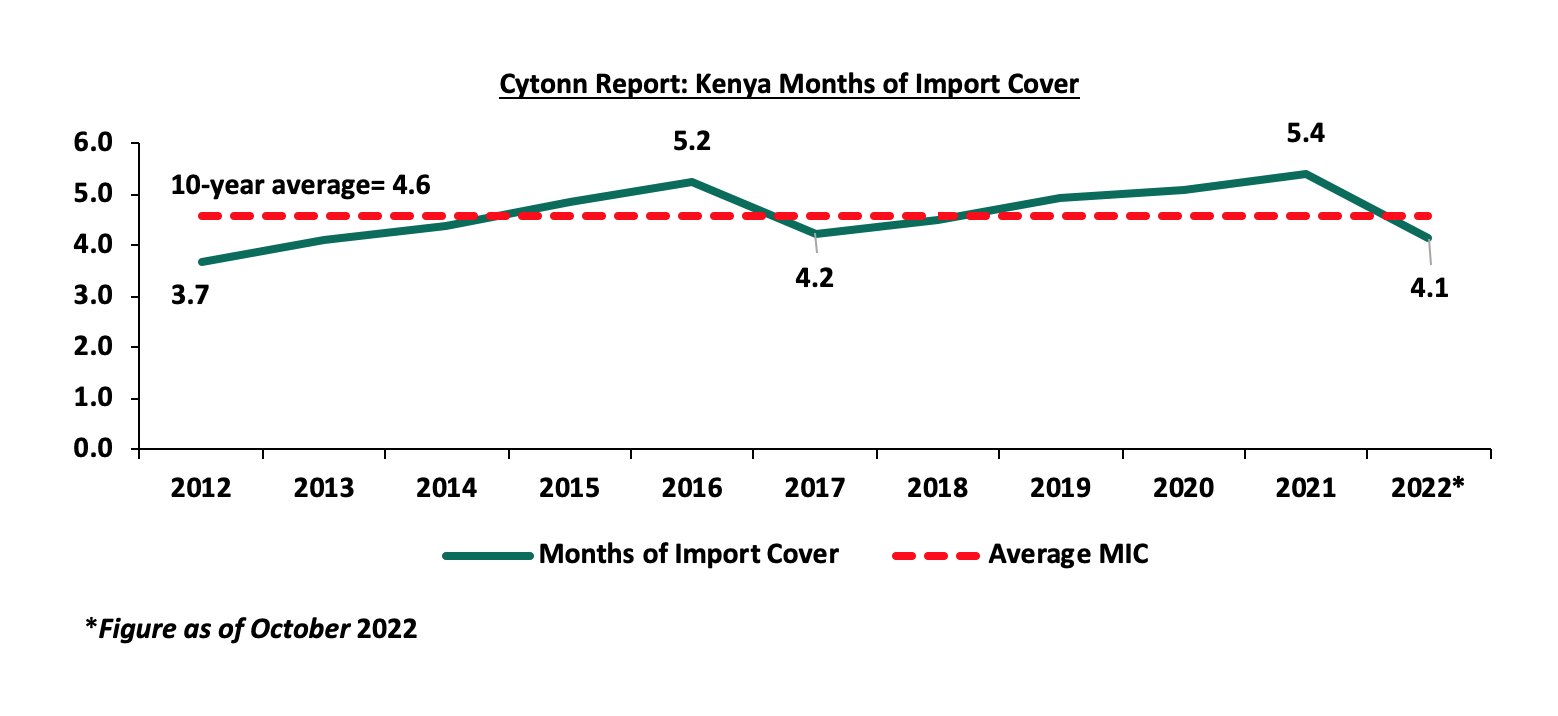
- Sufficient Forex reserves currently at USD 7.3 bn (equivalent to 4.1 months of import cover), which is above the statutory requirement of maintaining at least 4.0-months of import cover, however it’s important to note that Forex reserves have dropped by 16.5% YTD from USD 8.8 bn. The chart below summarizes the evolution of Kenya months of import cover over the last 10 years;
Weekly Highlight:
IMF Sub-Saharan Africa (SSA) Regional Economic Outlook
According to the International Monetary Fund (IMF) Regional Economic Outlook Report October 2022, the Sub-Saharan Region’s economic growth rate is projected to grow at 3.6% in 2022 and rise marginally to 3.7% in 2023, with both projections lower than the 4.7% economic growth rate recorded in 2021. The main drivers behind the slower growth are elevated inflationary pressures driven by high global food and energy prices, persistent currency depreciation, capital outflows and debt sustainability concerns. Inflation within the SSA is expected to remain elevated at 14.4% and 11.9% for 2022 and 2023, respectively, from 11.1% recorded in 2021.
Below is a table showing GDP projections of select African countries against projected inflation rates:
|
Cytonn Report: Select African Countries GDP vs Inflation Projections |
||||||
|
|
GDP Projection |
Inflation Projection |
||||
|
Country |
2021 |
2022f |
2023f |
2021 |
2022f |
2023f |
|
Senegal |
6.1 |
4.7 |
8.1 |
2.2% |
7.5% |
3.1% |
|
Rwanda |
10.9 |
6.0 |
6.7 |
0.8% |
9.5% |
8.0% |
|
Uganda |
6.7 |
4.4 |
5.9 |
2.2% |
6.4% |
6.4% |
|
Mauritius |
4.0 |
6.1 |
5.4 |
4.0% |
10.6% |
6.1% |
|
Tanzania |
4.9 |
4.5 |
5.2 |
3.7% |
4.0% |
5.3% |
|
Kenya |
7.5 |
5.3 |
5.1 |
6.1% |
7.4% |
6.6% |
|
Zambia |
4.6 |
2.9 |
4.0 |
22.0% |
12.5% |
9.5% |
|
Botswana |
11.4 |
4.1 |
4.0 |
6.7% |
11.2% |
5.8% |
|
Nigeria |
3.6 |
3.2 |
3.0 |
17.0% |
18.9% |
17.3% |
|
Ghana |
5.4 |
3.6 |
2.8 |
10.0% |
27.2% |
20.9% |
|
Malawi |
2.2 |
0.9 |
2.5 |
9.3% |
18.4% |
16.5% |
|
South Africa |
4.9 |
2.1 |
1.1 |
4.6% |
6.7% |
5.1% |
|
Sub-Saharan Africa |
4.7 |
3.6 |
3.7 |
11.1% |
14.4% |
11.9% |
Source: IMF
Key take-outs from the table;
- Senegal is projected to have the highest GDP growth rate at 8.1% in 2023, majorly attributable to mining sector with the country set to roll out its first natural gas production from Sangomar and Grand Tortue Ahyemim (GTA) fields in Q3’2023 with a daily production target of 70.0 mn cubic Ft of natural gas. This is expected to boost Senegal’s GDP through increased exports and subsequently ease the current account deficit as a percentage of GDP to 6.6% in 2023 from 10.5% in 2022. Additionally, Senegal’s inflation is projected to decline to 3.1% in 2023 from 7.5% in 2022,
- Nigeria’s economy is expected to grow by 3.0% in 2023, 0.2% points lower than the 3.2% projections in 2022 as a result of uncertainties surrounding the 2023 electioneering period, coupled with a high persistent inflation which came in at 20.5% in August 2022 and decline in fuel prices evidenced by a 16.1% decline in average oil prices to USD 88.2 per barrel in September 2022, from USD 105.1 per barrel in July 2022,
- South Africa’s GDP growth is expected to come in at 1.1% in 2023, a significant decline from 2.1% growth in 2022 attributable to continued infrastructure constraints such as electricity supply, a projected erosion of the current account balance to a deficit of 1.0% in 2023, from a surplus of 3.7% in 2021 driven by increasing import bill against reduced exports. South Africa is also expected to have a weak macroeconomic environment, stemming from elevated inflationary pressures, tightened monetary policies with the interest rate increasing by 25.0 bps to 6.25% in September 2022 and a high debt to GDP ratio coming in at 69.0% in 2021,
- Kenya’s growth rate is projected to slow to 5.1% in 2023, from 5.3% in 2022, with the slower growth mainly attributable to expected persisting of the elevated inflationary pressures. This stems from the fact that Kenya is a net importer and has seen an inflated import bill due to the high global fuel and commodity prices. Additionally, the Agricultural sector, Kenya’s largest contributor to GDP, continues to suffer from unfavorable weather patterns, hence food unsustainability. Further the tightening of monetary policy by hiking of the Central Bank Rate by 75.0 bps to 8.25% in September 2022 in a bid to curb inflation that is currently at 9.2% is expected to stifle economic growth. However, average inflation is projected to slow to 6.6% in 2023, and,
- Notably, Uganda, Rwanda and Tanzania are expected to record higher economic growth rates than Kenya mainly due to lower inflation rates, better revenue performances and increased reforms to promote commercial agriculture.
Going forward, we expect that the slow growth in 2023 will further be driven by heightened food crisis on the back of unfavorable weather patterns hindering agricultural production in the Agriculture-dependent region, coupled with supply chain disruptions with Russia supplying 65.0% of wheat imports into Africa. The SSA region has also seen heightened debt unsustainability concerns as the region’s debt to GDP stands at 60.0% with 19 out of the 35 low-income countries being in debt distress or at a high risk of distress. Additionally, the tightened monetary policy in majority of the region’s economies in a bid to curb inflation against a backdrop of declining local currencies are stifling economic activity in the region. To offset the downsides, SSA countries must focus on increased adoption of modern agriculture and shifting from traditional rain fed agriculture to enhance domestic production, and develop contingency plans to help mitigate food unsustainability crises. Additionally, SSA economies must pursue fiscal consolidation, revenue mobilization, develop domestic bond markets and opt for low cost multilateral borrowing as compared to commercial borrowing to plug fiscal deficits.
Rates in the Fixed Income market have remained relatively stable due to the relatively ample liquidity in the money market. The government is 20.3% behind its prorated borrowing target of Kshs 191.8 bn having borrowed Kshs 152.9 bn of the Kshs 581.7 bn borrowing target for the FY’2022/2023. We expect sustained gradual economic recovery as evidenced by the revenue collections of Kshs 486.0 bn in the first quarter of FY’2022/2023, equivalent to a 22.7% of its target of 2.1 tn. Despite the performance, we believe that the projected budget deficit of 6.2% is relatively ambitious given the downside risks and deteriorating business environment occasioned by high inflationary pressures. We however expect the support from the IMF and World Bank to finance some of the government projects and thus help maintain a stable interest rate environment since the government is not desperate for cash. Owing to this, our view is that investors should be biased towards short-term fixed-income securities to reduce duration risk.
Market Performance:
During the week, the equities market recorded mixed performance with NASI and NSE 25 gaining by 0.1% and 0.4% respectively while NSE 20 declined by 1.4%, taking their YTD performance to losses of 23.1%, 12.2% and 16.9%, for NASI, NSE 20 and NSE 25, respectively. The equities market performance was mainly driven by gains recorded by banking stocks such as NCBA Group, Equity Group, and KCB Group of 6.6%, 3.2% and 3.1%, respectively. The gains were however weighed down by losses recorded by other banking stocks such as ABSA Bank of 3.9% while Co-operative Bank and DTB-K both declined by 1.7% each;
During the week, equities turnover increased by 154.3% to USD 13.2 mn from USD 5.2 mn recorded the previous week, taking the YTD turnover to USD 704.1 mn. Additionally, foreign investors remained net sellers, with a net selling position of USD 5.8 mn, from a net selling position of USD 1.0 mn recorded the previous week, taking the YTD net selling position to USD 183.2 mn.
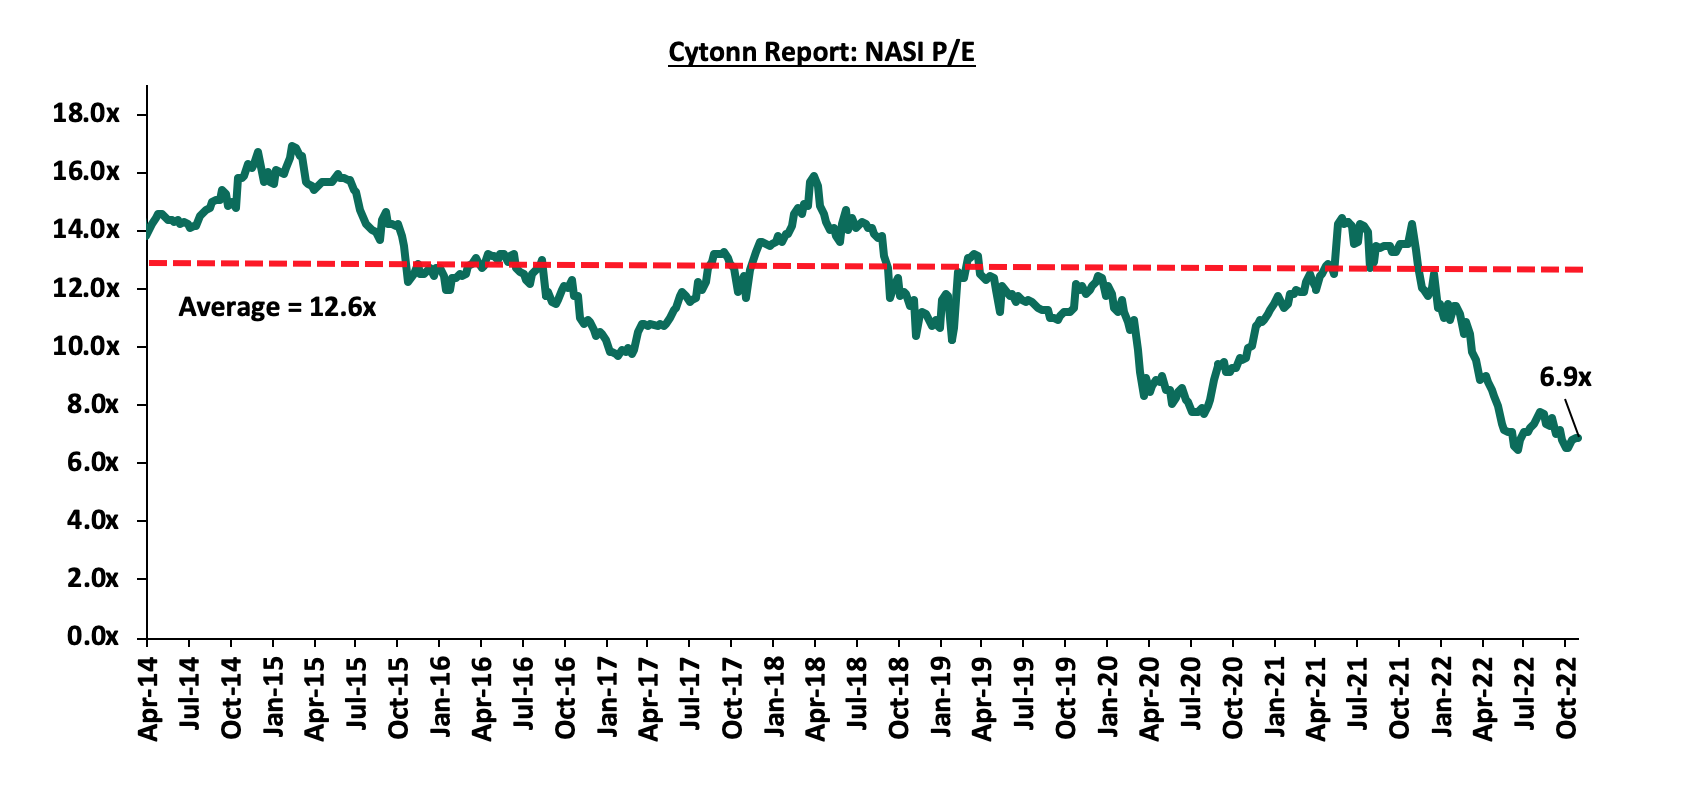
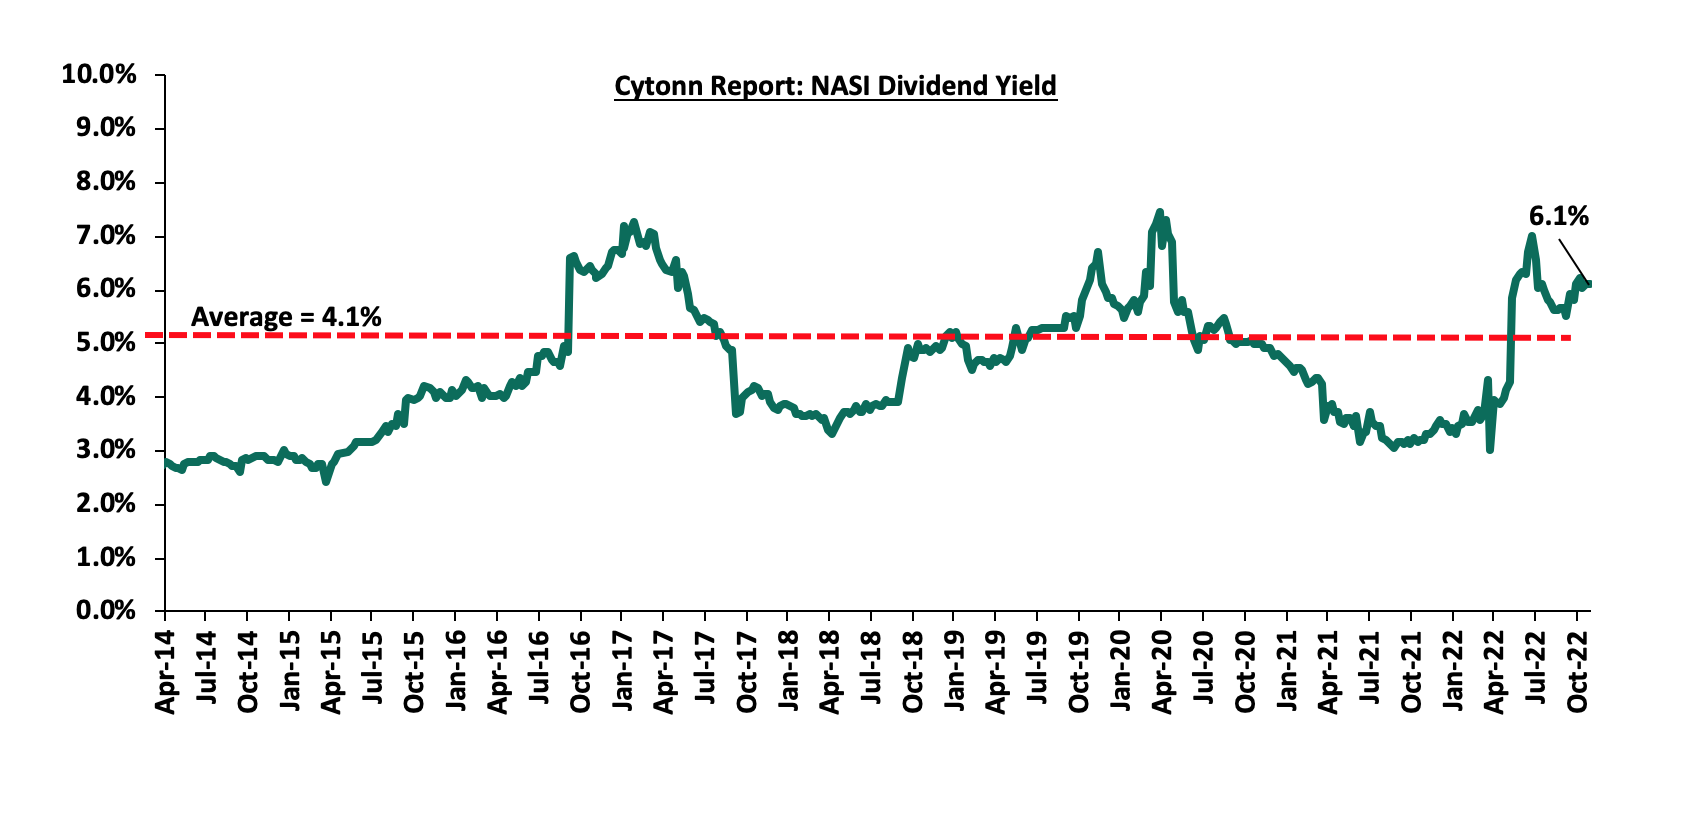
The market is currently trading at a price to earnings ratio (P/E) of 6.9x, 45.5% below the historical average of 12.6x, and a dividend yield of 6.1%, 2.0% points above the historical average of 4.1%. Key to note, NASI’s PEG ratio currently stands at 0.9x, an indication that the market is undervalued relative to its future growth. A PEG ratio greater than 1.0x indicates the market may be overvalued while a PEG ratio less than 1.0x indicates that the market is undervalued.
The charts below indicate the historical P/E and dividend yields of the market;
Weekly Highlight:
CMA announces gazettement of Investments-Based Crowdfunding regulations
During the week, the Cabinet Secretary for the National Treasury and Planning, through the Capital Markets Authority (CMA) announced the gazettement of the amended The Capital Markets (Investments-Based Crowdfunding) Regulations 2022, that were first issued for public review in July 2021. The regulations seek to regulate the raising of money from many individual or entities through the internet based portals, referred to as crowdfunding platforms while seeking to increase the access to funding for the Micro, Small and Medium Enterprises (MSMEs), startups and businesses while protecting investor’s interest. Notably, the platform operator’s annual regulatory fee was reduced by 50.0% to Kshs 100,000.0 from Kshs 200,000.0. Guidelines that remained unchanged include;
- The Crowdfunding Platform Operator will pay an application and license fee of Kshs 10,000.0 and Kshs 100,000.0 respectively to obtain an approval and licensing from the CMA, and must have a minimum paid up share capital of Kshs 5.0 mn and a minimum capital of Kshs 10.0 mn,
- The Investors eligible through crowdfunding include sophisticated investors and retail investors, but the retail investors are subject to the investors limits per the Platform Operator, which is up to a maximum Kshs 100,000.0,
- The issuers include MSME(s) that are incorporated in Kenya with a minimum of 2 years’ operating track record, and startups with good operating track record, but the aggregate amount shall be a maximum of Kshs 100.0 mn within a 12-month duration, and,
- For the Crowdfunding transactions, the offering document through the platform should be made available to the investors at least 14 days before the beginning of the period, and the offering shall not remain open for more than 60 days. Additionally, if the issuer is unable to meet the minimum threshold for the targeted amount, the offer shall be withdrawn with effective refunding to the investors done within 48 hours. Furthermore, the operator of the Crowdfunding platform can only begin a fresh crowdfunding not earlier than 90 days of the said withdrawal.
Key to note, all existing crowdfunding platforms in the country shall be required to obtain a license within the next one year after the commencement of the regulations. For more information on the Crowdfunding regulations, please see our Cytonn Weekly #32/2021
In our view, the gazettement of the Investments-based Crowdfunding regulations is commendable as they will allow for licensing, regulating and authorizing crowdfunding platforms and the operators, which will not only ensure that Investment Based Crowdfunding platforms are managed well within a legal and regulatory framework, but also investors using such platforms will be protected. We expect that this will provide an alternative means of financing for SMEs and MSMEs, helping them to grow and expand operations. Reduction of the annual regulatory fee for the Crowdfunding Platforms is also commendable, as this will reduce the cost of running such platform, and paving way for more platforms increasing access to the much needed financing to startups and enterprises. Currently in Kenya, according to the World Bank, banks provide 99.0% of capital for business financing, with Capital Markets and other sources providing a paltry 1.0% yet in developed markets, banks only provide 40.0% of the capital in the economy while other sources provide 60.0%. Therefore, we urge the regulatory bodies to continue looking into and working with shareholders to ease the regulations that put barriers to other Capital Markets products. A vibrant capital markets will not only ease business financing for SMEs and MSMEs, but also attract higher Foreign Direct Investments inflows which will contribute to both markets and economic growth, in a country which has continued to suffer from foreign investor exits, with the net outflows increasing by 819.0% to Kshs 19.3 bn in the nine months to September 2022 up from Kshs 2.1 bn in a similar period in 2021.
Universe of coverage:
|
Company |
Price as at 21/10/2022 |
Price as at 28/10/2022 |
w/w change |
YTD Change |
Target Price* |
Dividend Yield |
Upside/ Downside** |
P/TBv Multiple |
Recommendation |
|
KCB Group*** |
36.6 |
37.7 |
3.1% |
(17.2%) |
53.5 |
8.0% |
49.9% |
0.6x |
Buy |
|
Co-op Bank*** |
12.0 |
11.8 |
(1.7%) |
(9.2%) |
15.6 |
8.5% |
40.7% |
0.7x |
Buy |
|
Sanlam |
9.1 |
8.5 |
(6.4%) |
(26.4%) |
11.9 |
0.0% |
40.1% |
0.9x |
Buy |
|
Kenya Reinsurance |
1.9 |
1.9 |
2.2% |
(17.0%) |
2.5 |
5.3% |
37.4% |
0.2x |
Buy |
|
ABSA Bank*** |
11.6 |
11.2 |
(3.9%) |
(5.1%) |
14.9 |
1.8% |
35.4% |
1.0x |
Buy |
|
Equity Group*** |
45.4 |
46.8 |
3.2% |
(11.3%) |
59.7 |
6.4% |
33.9% |
1.1x |
Buy |
|
Jubilee Holdings |
237.5 |
230.0 |
(3.2%) |
(27.4%) |
305.9 |
0.4% |
33.5% |
0.4x |
Buy |
|
I&M Group*** |
17.0 |
16.7 |
(1.5%) |
(22.0%) |
20.5 |
9.0% |
32.0% |
0.4x |
Buy |
|
Diamond Trust Bank*** |
49.0 |
48.2 |
(1.7%) |
(19.1%) |
59.5 |
6.2% |
29.8% |
0.2x |
Buy |
|
Britam |
6.2 |
5.6 |
(9.4%) |
(25.7%) |
7.1 |
0.0% |
26.7% |
0.9x |
Buy |
|
Liberty Holdings |
5.9 |
5.5 |
(6.8%) |
(22.1%) |
6.8 |
0.0% |
22.7% |
0.4x |
Buy |
|
Standard Chartered*** |
138.5 |
138.8 |
0.2% |
6.7% |
155.0 |
10.1% |
21.8% |
0.9x |
Buy |
|
CIC Group |
2.0 |
2.0 |
(2.0%) |
(9.2%) |
2.3 |
0.0% |
17.8% |
0.7x |
Accumulate |
|
HF Group |
3.0 |
3.0 |
2.7% |
(20.3%) |
3.5 |
0.0% |
15.5% |
0.2x |
Accumulate |
|
NCBA*** |
30.3 |
32.3 |
6.6% |
26.7% |
35.2 |
6.2% |
15.2% |
0.7x |
Accumulate |
|
Stanbic Holdings |
98.0 |
100.0 |
2.0% |
14.9% |
99.9 |
9.0% |
8.9% |
0.8x |
Hold |
|
Target Price as per Cytonn Analyst estimates **Upside/ (Downside) is adjusted for Dividend Yield ***For Disclosure, these are stocks in which Cytonn and/or its affiliates are invested in |
|||||||||
We are “Neutral” on the Equities markets in the short term due to the current adverse operating environment and huge foreign investor outflows, and, “Bullish” in the long term due to current cheap valuations and expected global and local economic recovery.
With the market currently trading at a discount to its future growth (PEG Ratio at 0.9x), we believe that investors should reposition towards value stocks with strong earnings growth and that are trading at discounts to their intrinsic value. We expect the current high foreign investors sell-offs to continue weighing down the economic outlook in the short term.
- Residential Sector
- Acorn Holdings to Repay Part of Its Kshs 5.7 bn Green Bond
During the week, student housing property developer Acorn Holdings, announced plans to repay loans worth Kshs 800.2 mn, which is a portion of its outstanding Kshs 5.7 bn green bond, through an early redemption option. Acorn Project Two, a subsidiary of Acorn Holdings, will repay the outstanding amounts which is inclusive of accrued interests but unpaid interest using funds from the sale of its two student housing development projects by the end of October 2022. The two projects include the USIU3 and Qwetu Aberdare Heights near the Pan African University.
As per our Cytonn Weekly 29/2021, Acorn, had in October 2019 floated a 5-Yr term Kshs 5.0 bn Green Bond at the Nairobi Securities Exchange with a coupon rate of 12.25%, which was then upsized to Kshs 5.7 bn in May 2021. The first tranche raised Kshs 4.3 bn against the Kshs 2.0 bn expectation, a 215.0% subscription rate, and was aimed at developing 6 Purpose Built Student Accommodation. The second tranche of the bond was floated in July 2021 with the purpose of raising Kshs 1.4 bn to develop 2 hostels constituting 2,654 beds. Acorn managed to raise Kshs 2.1 bn, representing a 145.8% subscription rate. Out of the Kshs 5.7 bn bond, the firm has withdrawn a total of Kshs 4.2 bn to develop hostels in USIU, Hurlingham and Chiromo. Following the announcement, a total of Kshs 1.6 bn having been redeemed so far, with Kshs 0.8 bn redeemed from the Wilson View transaction in 2021. As it stands, Acorn has over 4,500 beds under management, while it is targeting a total of 60,000 by 2030. In terms of performance, Purpose Built Student Accommodation continues to provide relatively higher rental yields compared to other asset classes, such as the residential and serviced apartments as highlighted below;
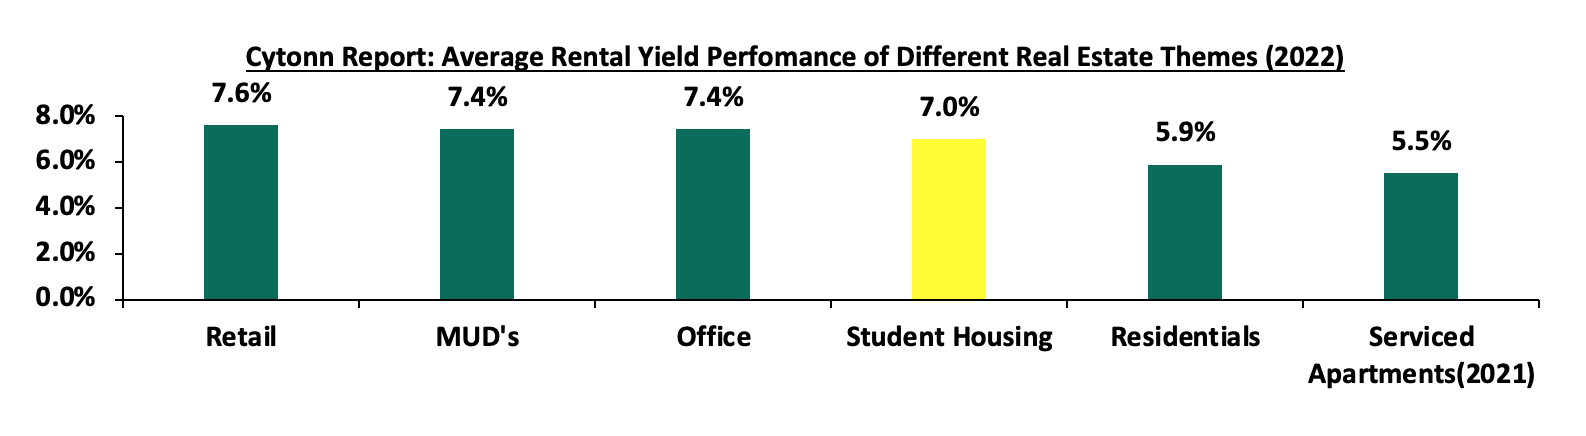
Source; Cytonn Research
The performance of the Acorn Bonds, continues to set a good precedence for corporate bonds as a way of funding Real Estate projects, as evidenced by the early loan redemption. The impressive performance, investment returns and attractiveness of the student housing market driven by the increasing student population will continue to drive the positive performance of the Acorn D-REIT and I-REIT.
- Shelter Afrique to Develop a Sovereign Lending Product to Boost Housing Finance in Africa
During the week, Shelter Afrique, a Pan African housing finance institution based in Nairobi’s Upperhill district, announced plans to develop a sovereign lending product which will boost its traditional lending products to finance both the demand and supply sides of the housing sector in Africa. Shelter Afrique shareholders constitutes of 44 African countries, the African Development Bank (AfDB) and the Africa Reinsurance Corporation (Africa-Re). The sovereign lending product will be facilitated by the AfDB through its training arm, the African Development Institute (ADI) to support affordable housing and commercial Real Estate in its member states by offering trade finance, equity investments, joint ventures, social housing, institutional lending, and project finance.
The decision by the firm was made as a response to the risk of potential disengagement of African governments to continue with their housing goals, owing to Africa’s Gross Domestic Product (GDP) contraction at an average of 2.1% in 2020 resulting from the COVID-19 pandemic. The sovereign lending product is therefore expected to restore and improve the firm's financial flexibility and aligning itself to its members’ Real Estate priorities for better performance and enhanced development impact. This comes one month after Shelter Afrique approved a Kshs 2.2 bn corporate loan in September 2022 towards Maison Super Development (MSD) firm to finance the construction of three ongoing projects in the Democratic Republic of Congo (DRC). The firm also announced plans in February 2022 to issue an East African bond in the Kenyan Capital Market through the NSE to raise USD 500.0 mn (Kshs 56.9 bn) for financing upcoming affordable housing projects within East Africa with the main focus being on Kenyan market.
Upon implementation, we expect the decision by the lender will boost both local and foreign investors’ confidence in Africa amid recovery of economic status of most African countries after the COVID-19 period. The move will also promote the continued efforts to raise funds and support the housing sector which has witnessed improved activities and developments in several countries like Kenya.
- Hospitality Sector
During the week, Crowne Plaza Nairobi was voted the best luxury airport hotel in Africa during the 16th World Luxury Hotel Awards 2022 becoming Kenya’s first airport hotel to win the award. The hotel emerged top beating 644 other hotels across the continent. This was supported by the hotel’s tranquility, state of the art design and facilities as well as high quality customer service and products offered. Notably, a total of 9 Kenyan hotels received awards in the different categories as highlighted below;
|
Cytonn Report: 16th World Luxury Hotel Awards |
|
|
Hotel |
Award |
|
Crowne Plaza Hotel |
Best Luxury Airport Hotel in Africa |
|
Enashipai Resort and Spa |
Best Luxury Spa Resort in Kenya |
|
Maiyan |
Best Luxury Eco Villa in Africa |
|
Royal Tulip Canaan Nairobi |
Best Luxury Business Hotel in Africa |
|
Sarova Panafric |
Best Luxury Banquet/Event Hotel in Africa |
|
Silver Palm Resort and Spa |
Best Luxury Boutique Resort in East Africa |
|
Sirikoi Lodge |
Best Luxury Eco Safari Lodge in East Africa |
|
The Lawford |
Best Luxury Historical Hotel in Africa |
|
Villa Kalista |
Best Luxury Villa Resort in Africa |
Source: World Luxury Hotel Awards
In the 3rd annual World MICE Awards, Kenya emerged as Africa’s best MICE destination, as a result of Nairobi winning Africa's Best MICE Destination 2022 award. This was on the back of outstanding conferencing centers such as Kenyatta International Convention Centre (KICC), top rated accommodation centers such as the Hilton Hotel in Nairobi, world class airlines such as Kenya Airways (KQ), and stable business environment. The table below shows the key awards for Kenya in the African category and the respective MICE winners in 2022 and 2021;
|
Cytonn Report: 3rd Annual MICE Awards |
||
|
Award |
2022 Winner |
2021 Winner |
|
Africa's Best MICE Destination 2022 |
Kenya - Nairobi |
South Africa – Durban |
|
Africa's Best Convention Centre 2022 |
Kenyatta International Convention Centre - Kenya |
Durban International Convention Centre - South Africa |
|
Africa's Best MICE Airline 2022 |
Kenya Airways - Kenya |
Ethiopian Airlines – Ethiopia |
Source: World MICE Awards
Subsequent awards that featured in the Kenyan category include;
|
Cytonn Report: 3rd Annual MICE Awards |
|
|
Award |
2022 Winner |
|
Kenya's Best Convention Centre 2022 |
Kenyatta International Convention Centre |
|
Kenya's Best MICE Hotel 2022 |
Hilton |
|
Kenya's Best Incentive Hotel 2022 |
The Leopard Beach Resort & Spa |
|
Kenya's Best MICE Organiser 2022 |
Zuri Events |
Source: World MICE Awards
In our view, the aforementioned awards as well as the recent 29th World Travel Awards where Kenya was voted as Africa’s leading destination, positions the country as a vibrant tourism market. In turn, this is expected to further boost investment confidence in the hospitality market as well as visitor arrivals into the country. Some of the factors that are expected to further enhance the growth of the sector include; i) promotion of local tourism, ii) aggressive marketing campaigns by the Kenya Tourism Board on the Magical Kenya platform, iii) calm post-electioneering period that has improved business stability in the country, iv) improved security, and, v) increased sports and leisure events. Notably, the incoming festive season is also expected to further boost the performance of the sector through increased bookings and leisure activities.
- Statutory Reviews
During the week, President William Ruto announced plans to exempt all first-time home buyers from paying stamp duty. This comes two years after the Stamp Duty Act was amended in 2020 to allow exemptions for first time home buyers of only approved affordable housing units by the government. Stamp duty is a property tax payable once by land transferee at a rate of 4.0% and 2.0% in urban and rural areas, respectively, and is to be paid within 30 days of contract execution. Failure to pay the duty and or assessed amounts leads to a 5.0% fine of the principal assessed stamp duty for every quarter from the date of land transaction. President Ruto’s decision is expected to improve the performance of the Real Estate sector by easing home ownership costs amid the rising cost of living. This in turn is expected to boost home ownership rates in Kenya by reducing the associated costs to purchase a home, while also helping curb the existing housing deficit in the country. Moreover, this correlates with the President’s affordable housing agenda of increasing the supply of housing units per annum by 200,000, as home ownership rates have remained significantly low at 21.3% in Kenya, owing to various setbacks outlined in our Affordable Housing topical. With the implementation of the policy, we expect that the exemption will lead to an improvement in property transaction volumes and uptake rates and in turn an improvement in the performance.
- Real Estate Investment Trusts (REITs)
In the Nairobi Stocks Exchange, ILAM Fahari I-REIT closed the week trading at an average price of Kshs 6.6 per share. The performance represented a 5.4% Year-to-Date (YTD) increase. However, this represents a 67.0% Inception-to-Date (ITD) decline from the listing price of Kshs 20.0. The graph below shows Fahari I-REIT’s performance from November 2015 to 28th October 2022:
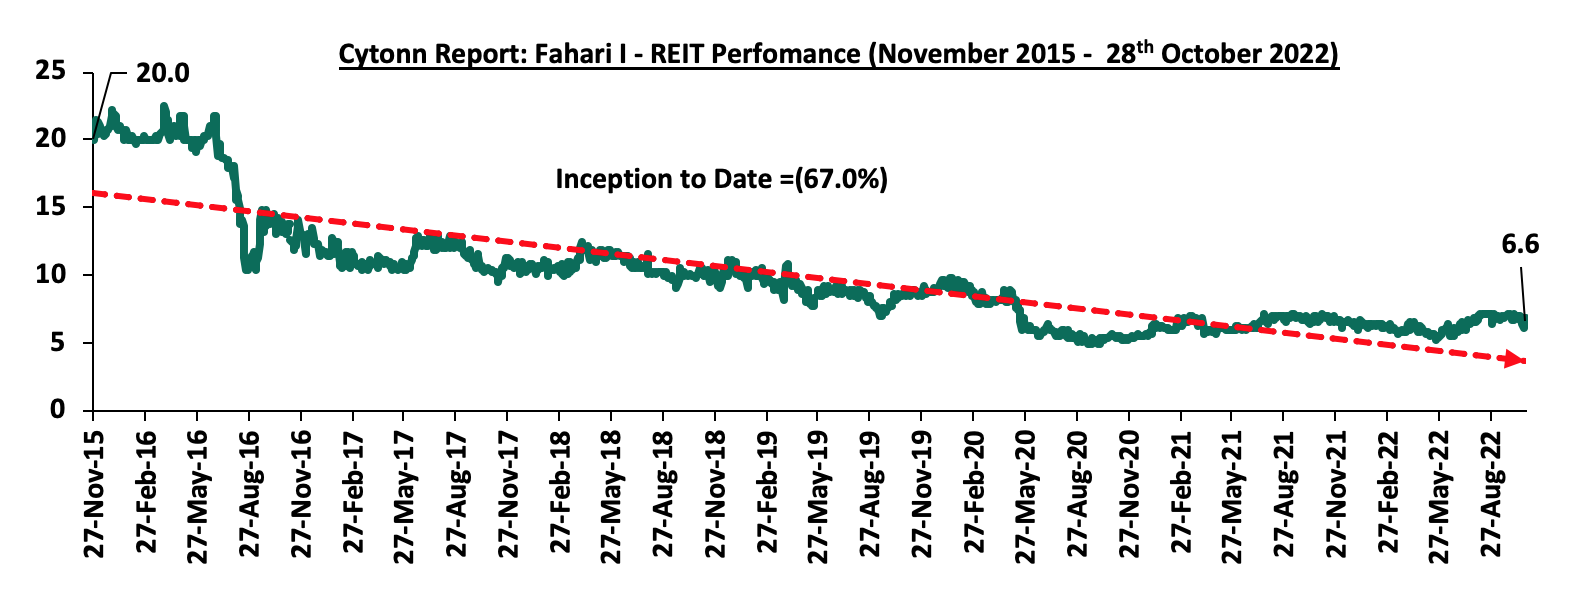
In the Unquoted Securities Platform, Acorn D-REIT and I-REIT traded at Kshs 23.8 and Kshs 20.8 per unit, respectively, as at 7th October 2022. The performance represented a 19.0% and 4.0% gain for the D-REIT and I-REIT, respectively, from the Kshs 20.0 inception price. The volumes traded for the D-REIT and I-REIT came in at 5.5 mn and 14.5 mn shares, with a turnover of Kshs 116.9 mn and Kshs 300.3 mn, respectively, since its Inception in February 2021.
We expect Kenya’s Real Estate sector performance to be on an upward trajectory driven by factors such as the initiative to exempt first time home buyers from paying stamp duty, continued growth in the hospitality sector owing to Kenya’s recognition as an impressive tourism market, and, efforts to provide financing towards the housing market. However, the low investor appetite for REITS continues to weigh down the optimum performance of the sector.
In November 2021, we released the Nairobi Metropolitan Area Mixed-Use Developments (MUDs) Report 2021, which highlighted that Mixed-Use Developments (MUDs) recorded an average rental yield of 7.2%, which was 0.7% points higher than the 6.5% rental yield for the retail, commercial Office and residential themes in 2021. The relatively better performance was mainly attributed to; i) an improved business environment, ii) strategic and prime locations of the developments with the capability to attract prospective clients, and, iii) preference by target clients due to their convenience hence improved demand and returns to investors.
This week we update our report with the 2022 market research that was conducted in 8 nodes within the Nairobi Metropolitan Area (NMA), in order to determine the progress and performance of MUDs against the market performance of the Residential, Commercial Office and Retail sectors. Therefore, this topical will cover the following:
- Overview of Mixed-Use Developments
- Mixed-Use Developments Performance Summary in 2022
- Mixed-Use Developments Investment Opportunity and Outlook
Section I: Overview of Mixed-Use Developments
A Mixed-Use Development (MUD) is an urban development that combines multiple Real Estate themes including residential, commercial, retail, and hospitality. Due to this integration, a single development project serves more than one purpose within a single location. MUDs thus offer benefits such as enhanced access to amenities and services, and, convenience of living and working areas at the same place. Consequently, they have been gaining traction in Kenya owing to the various changing life patterns and needs of clients. For the year 2022;
- Property developer Unity homes completed 64 units out of 640 units of its Kshs 5.4 bn housing project dubbed Unity East, which sits on a 10.4-acre piece of land at Tatu City in Ruiru Sub - County. For more information, see Cytonn Weekly #42/2022,
- Local eye-wear Optica Limited opened a new outlet at NextGen Mall, along Mombasa Road bringing its total outlets countrywide to 65. For more information, see Cytonn Weekly #36/2022,
- Property developer Mi Vida Homes completed and launched the first phase comprising a total of 221 units of the Mi Vida housing project worth Kshs 12.0 bn at Garden City Thika Road. For more information, see our Cytonn Weekly #31/2022,
- Local Authorities Pension Fund (LAPF) Kenya announced plans to construct a Mixed Use development facility at an estimated cost of Kshs 10.0 bn in Nakuru County. For more information, see our Cytonn Weekly #31/2022,
- Sheria Savings and Credit Cooperative Society (SACCO) announced plans to build a Mixed-Use Development tower in Nairobi’s Upper Hill Matumbato Close, at a cost of Kshs 3.3 bn, by December 2025. For more information, see Cytonn Monthly- April 2022,
- Gateway Real Estate Africa (GREA), a private development company specializing in turnkey construction, began the construction of CCI Group of Companies’ commercial office project in Tatu City, Ruiru constituency. For more information, see Cytonn Weekly #24/2022, and,
- CCI Group of companies, a business process outsourcing (BPO) provider, and, nutrition supplements distributor Max International took up approximately 60.0% of the 270,000 SQFT space at Garden City Business Park along Thika Road. For more information, see Cytonn Weekly #02/2022.
Some of the factors that have been driving the growth of MUDs include;
- Changing Lifestyles: Mixed-Use Developments offer a convenient and integrated way of living, which appeals to the urban lifestyle. As such, there demand has been on the rise owing to the changing lifestyle patterns in Kenya, leading to increased developments,
- Positive Demographics: Kenya has relatively high population and urbanization growth rates of 2.3% p.a and 4.0% p.a, respectively, against the world’s 1.0% p.a and 1.8% p.a, respectively, as at 2020. This creates demand for development which accelerates the growth and performance of MUDs,
- Relatively Higher Returns: The incorporation of different Real Estate themes within the same location make Mixed-Use Developments more profitable than single use developments. This is because investors can generate returns from multiple sources from the sale and lease of residential, office and retail spaces,
- Improved Infrastructure: There has been a significant improvement in infrastructure developments in the recent years, which has promoted the establishment of MUDs, given that they require massive infrastructure to set up. This includes the development of highways such as the Nairobi Expressway and Western Bypass project, among many others,
- Diversification of Risks: Mixed-Use Developments provide diversification to the risk of any one asset class that may be negatively affected by market forces such as low uptake or demand in specific themes,
- Strategic Location: Mixed-Use Developments are in most instances strategically located in urban areas with adequate ample infrastructure and are accessible to high and middle income people thereby being accessible and attracting a large number of high end potential clients, and,
- Sustainability: Mixed-Use Developments integrate the different Real Estate classes in one project and location which utilizes space more efficiently and helps to reduce the need for people to commute long distances by living, working, and shopping all in one place.
Despite the aforementioned factors, there exist various setbacks hindering the development and performance of MUDs such as:
- High Costs of Development: Mixed-Use Developments are more expensive to develop and finance as compared to single-use projects because they require complex designs to ensure that the various Real Estate themes integrate seamlessly and that the overall project is attractive and functional, thereby making it difficult for developers to access funding for MUDs from banks and other stakeholders,
- Oversupply in Select Real Estate Sectors such as the 6.7 mn SQFT in the NMA commercial office market, 3.0 mn SQFT in the NMA retail market, which in turn hinder optimum performance of the developments, and,
- Coordinating Different Uses: Integrating the diverse uses included in MUDs may be challenging, as each Real Estate theme has different needs and requirements. Incorporating the right mix requires specific management considerations, as the tenants need to complement each other and support the overall goals of the development, which may be difficult to implement.
Section II: Mixed-Use Developments Performance Summary in 2022
- Summary of MUDs Performance in Comparison to General Market Performance
Mixed-Use Developments recorded an average rental yield of 7.4% in 2022, 0.6% points higher than the respective single use themes which recorded an average rental yield of 6.8% in the similar period. The relatively better performance was mainly attributable to MUDs attractiveness to the high and middle income earning population. The retail and commercial office themes in the MUDs recorded 0.4% and 0.2% points increase in average rental yields to 8.8% and 7.3%, respectively in 2022, from 8.4% and 7.1% in 2021. This was mainly supported by the addition of prime spaces fetching higher rents and yields such as Global Trade Centre (GTC), slow but rising demand for office spaces by potential clients such as CCI Group and Max International which took up approximately 60.0% space at Garden City Business Park in January 2022, and, a rapid expansion drive by retailers. For the Residential theme in the MUDs, the average rental yield declined by 0.8% points to 5.2% in 2022, from 6.0% in 2021, driven by the conclusion and launch of various developments which weighed down the overall occupancy rates in existing developments. New developments include Garden City’s Mi Vida phase one housing project which was completed and launched for occupation in August 2022. The table below shows the performance of single-use and Mixed-Use development themes between 2021 and 2022;
|
Cytonn Report: Thematic Performance in MUDs Vs. Key Nodes Hosting MUDs Market Performance 2021-2022 |
||||||
|
|
MUD Themes Average |
Market Average |
||||
|
Rental Yield % 2021 |
Rental Yield % 2022 |
Rental Yield % 2021 |
Rental Yield % 2022 |
∆ in y/y MUD Rental yields |
∆ in theme Rental Yields |
|
|
Retail |
8.4% |
8.8% |
7.8% |
7.8% |
0.4% |
0.0% |
|
Offices |
7.1% |
7.3% |
6.6% |
7.0% |
0.2% |
0.4% |
|
Residential |
6.0% |
5.2% |
5.2% |
5.2% |
(0.8%) |
0.0% |
|
Average |
7.2% |
7.4% |
6.5% |
6.8% |
0.2% |
0.3% |
|
* Market performance is calculated from nodes where sampled MUDs exist |
||||||
Source: Cytonn Research 2022
- Mixed-Use Developments Performance per Node
In terms of performance per node, Karen was the best performing of all sampled nodes with an average MUD rental yield of 9.8%, 2.4% points higher than the market average of 7.4% in 2022. The remarkable performance was largely attributed to; i) the presence of prime retail and office spaces fetching higher rents and yields, ii) quality infrastructure supporting investments, and, iii) affluent residents with high consumer spending power. On the other hand, Eastlands was the worst performing node with an average MUD rental yield of 5.0%, 2.4% points lower than the market average of 7.4%. The relatively poor performance was mainly attributed to; i) low rental rates attracted by developments, ii) inadequate support infrastructure to promote investments, and, iii) a lower consumer spending power of residents. The table below shows the performance of Mixed-Use Developments by node in 2022;
|
(All Values in Kshs Unless Stated Otherwise) |
|||||||||||
|
Cytonn Report: Nairobi Metropolitan Area Mixed Use Developments Performance by Nodes 2022 |
|||||||||||
|
Location |
Commercial Retail Sector |
Commercial Office Sector |
Residential Sector |
Average MUD Yield |
|||||||
|
Rent (Kshs/SQFT) |
Occupancy |
Rental Yield |
Rent (Kshs/SQFT) |
Occupancy |
Rental Yield |
Price (Kshs/SQM) |
Rent (Kshs/SQM) |
Annual Uptake |
Rental Yield |
||
|
Karen |
240 |
94.0% |
10.5% |
115 |
90.0% |
9.1% |
9.8% |
||||
|
Kilimani |
166 |
80.0% |
8.7% |
102 |
80.0% |
7.4% |
8.0% |
||||
|
Westlands |
193 |
71.1% |
9.2% |
106 |
74.4% |
7.6% |
245,095 |
1,984 |
13.7% |
7.0% |
7.9% |
|
Upper Hill |
140 |
73.3% |
7.8% |
102 |
78.3% |
7.9% |
7.8% |
||||
|
Limuru Road |
238 |
80.0% |
10.3% |
105 |
72.5% |
6.9% |
184,399 |
1,292 |
31.1% |
6.0% |
7.7% |
|
Thika Rd |
193 |
76.7% |
8.6% |
93 |
75.0% |
6.5% |
138,831 |
758 |
17.8% |
4.4% |
6.5% |
|
Mombasa Rd |
203 |
72.5% |
8.8% |
90 |
70.0% |
5.8% |
120,539 |
551 |
13.6% |
4.1% |
6.3% |
|
Eastlands |
125 |
77.5% |
5.8% |
80 |
66.5% |
5.3% |
81,081 |
360 |
10.7% |
4.0% |
5.0% |
|
Average |
185 |
76.4% |
8.8% |
101 |
76.2% |
7.3% |
159,301 |
1,030 |
16.5% |
5.2% |
7.4% |
|
*The average MUDs performance is based on areas where sampled projects exist |
|||||||||||
Source: Cytonn Research 2022
- Performance of Real Estate Themes in MUDs versus Single-themed Developments’ Performance
In our Mixed-Use Development analysis, we looked into the performance of the retail, commercial office and residential themes:
- Retail Space
The average rental yield of retail spaces in Mixed-Use Developments came in at 8.8% in 2022, 1.0% points higher than single use retail developments that realized an average rental yield of 7.8%. This was mainly attributable to the high rental rates that MUDs generated at Kshs 185 per SQFT when compared to the Kshs 175 per SQFT recorded for the single-use retail spaces owing to availability of quality spaces. Additionally, the impressive performance of MUDs is heavily linked to their increasing popularity, interest and demand as All-in-one facilities for customers shopping, working and residing in the vicinity.
Karen was the best performing node with the average rental yield at 10.5%, 1.7% points higher than the market average of 8.8%. This was mainly driven by; i) relatively high rental rates which generated higher returns, ii) presence of high income earning residents with greater purchasing power, and, iii) sufficient infrastructure in that adequately support the MUDs. On the other hand, Eastlands was the worst performing node with an average rental yield of 5.8%, 3.0% points lower than the market average of 8.8%. This was attributed to i) lower rental rates emanating from low quality spaces available, ii) competition from the informal retail spaces that offer cheaper rates, iii) fewer restrictions to conduct businesses in the node, and, iv) lower purchasing and spending power by consumers within the region as compared to other nodes in Nairobi Metropolitan Area.
The table below provides a summary of the performance of retail spaces in MUDs against market performance in 2022;
|
(All Values in Kshs Unless Stated Otherwise) |
|
||||||
|
Cytonn Report: Performance of Retail in MUDs Vs. Market Performance 2022 |
|
||||||
|
Location |
MUD Performance |
Market Performance |
Rental Yield Difference |
||||
|
Rent/SQFT |
Occupancy (%) |
Rental Yield (%) |
Rent/SQFT |
Occupancy (%) |
Rental Yield (%) |
(%) |
|
|
Karen |
240 |
94.0% |
10.5% |
205 |
78.6% |
8.8% |
1.7% |
|
Limuru Road |
238 |
80.0% |
10.3% |
187 |
71.7% |
7.8% |
2.5% |
|
Westlands |
193 |
71.1% |
9.2% |
214 |
73.6% |
8.6% |
0.6% |
|
Mombasa Rd |
203 |
72.5% |
8.8% |
148 |
80.8% |
7.3% |
1.5% |
|
Kilimani |
166 |
80.0% |
8.7% |
184 |
84.8% |
9.8% |
(1.1%) |
|
Thika Rd |
193 |
76.7% |
8.6% |
158 |
73.8% |
6.7% |
1.9% |
|
Upper Hill |
140 |
73.3% |
7.8% |
|
|||
|
Eastlands |
125 |
77.5% |
5.8% |
127 |
73.0% |
5.7% |
0.1% |
|
Average |
185 |
76.4% |
8.8% |
175 |
76.6% |
7.8% |
1.0% |
Source: Cytonn Research 2022
- Commercial Office Space
The average rental yield for commercial office spaces in MUDs came in at 7.3%, 0.3% points higher than single use commercial developments which realized an average rental yield of 7.0% in 2022. The performance by MUDs was largely attributed to; i) higher rental rates owing to the presence of quality, sustainable and energy efficient spaces to enhance businesses and workers’ experience, and, ii) slow but rising demand and uptake for the office spaces. In terms of submarket performance, Karen was the best performing node posting an average rental yield of 9.1%, 1.8% points higher than the market average of 7.3% attributable to; i) the presence of high-end business parks such as the Hub and the Galleria business park which offer higher rental rates and returns, ii) good and sufficient infrastructure interconnecting the node, and, iii) higher demand for the prime location, with targeted clients who are willing to pay premiums rents for the spaces. Eastlands was the worst performing node with an average rental yield of 5.3% attributable to; i) availability of low quality office spaces posting lower rents, and, ii) insufficient quality infrastructure that can support seamless facilitation of MUDs. The table below shows the performance of office spaces in MUDs against the single use themed market in 2022;
|
(All Values in Kshs Unless Stated Otherwise) |
|
||||||
|
Cytonn Report: Performance of Commercial Offices in MUDs Vs. Market Performance |
|
||||||
|
Location |
MUD Performance |
Market Performance |
Rental Yield Difference |
||||
|
Rent/SQFT |
Occupancy (%) |
Rental Yield (%) |
Rent/SQFT |
Occupancy (%) |
Rental Yield (%) |
(%) |
|
|
Karen |
115 |
90.0% |
9.1% |
107 |
83.0% |
8.0% |
1.1% |
|
Upper Hill |
102 |
78.3% |
7.9% |
96 |
75.2% |
6.9% |
1.0% |
|
Westlands |
106 |
74.4% |
7.6% |
107 |
75.7% |
8.2% |
(0.6%) |
|
Kilimani |
102 |
80.0% |
7.4% |
92 |
80.8% |
7.4% |
0.0% |
|
Limuru Road |
105 |
72.5% |
6.9% |
|
|||
|
Thika Rd |
93 |
75.0% |
6.5% |
77 |
77.9% |
6.6% |
(0.1%) |
|
Mombasa Road |
90 |
70.0% |
5.8% |
73 |
65.5% |
5.1% |
0.7% |
|
Eastlands |
80 |
66.5% |
5.3% |
|
|||
|
Average |
101 |
76.2% |
7.3% |
92 |
76.4% |
7.0% |
0.3% |
Source: Cytonn Research 2022
- Residential Space
Residential units within MUDs recorded an average rental yield of 5.2% in 2022, 0.3% points lower than the single-use residential market average of 5.5%. The relatively subdued performance was mainly on the back of declined occupancy rates emanating from the addition of new developments such as the Mi Vida project consisting of 225 units. In terms of sub market performance Westlands was the best performing node with an average rental yield of 7.0%, attributable to the presence of affluent developments fetching premium rents, coupled with the area being serviced by adequate infrastructure such as Redhill and Mwanzi roads and the Nairobi Expressway. On the other hand, Eastlands was the worst performing node recording an average rental yield of 4.0% primarily owing to the lower prices and rental rates generated by the developments within the node. The table below summarizes the performance of residential spaces in MUDs against the single themed market in 2022;
|
All Values are in Kshs Unless Stated Otherwise |
|
||||||||
|
Cytonn Report: Performance of Residential Units in MUDs Vs. Market Performance 2022 |
|
||||||||
|
Location |
MUD Performance |
Market Performance |
Rental Yield Difference |
||||||
|
Price/SQM |
Rent/SQM |
Annual Uptake |
Rental Yield % |
Price/SQM |
Rent/SQM |
Annual Uptake |
Rental Yield % |
(%) |
|
|
Westlands |
245,095 |
1,984 |
13.7% |
7.0% |
149,039 |
802 |
22.4% |
5.7% |
1.3% |
|
Limuru Road |
184,399 |
1,292 |
31.1% |
6.0% |
108,117 |
546 |
21.5% |
5.1% |
0.9% |
|
Thika Road |
138,831 |
758 |
17.8% |
4.4% |
83,283 |
416 |
14.0% |
5.4% |
(1.0%) |
|
Mombasa Road |
120,539 |
551 |
13.6% |
4.1% |
80,718 |
468 |
14.1% |
5.6% |
(1.5%) |
|
Eastlands |
81,081 |
360 |
10.7% |
4.0% |
72,884 |
379 |
12.6% |
5.1% |
(1.1) |
|
Average |
159,301 |
1,030 |
16.5% |
5.2% |
91,053 |
492 |
15.6% |
5.2% |
0.0% |
Source: Cytonn Research 2022
Section III: Mixed-Use Developments Investment Opportunity and Outlook
The table below summarizes our outlook on Mixed-Use Developments (MUDs), where we look at the general performance of the key sectors that compose MUDs i.e. retail, commercial office and residential and investment opportunities that lies in the themes;
|
Cytonn Report: Mixed-Use Developments (MUDs) Outlook |
|||
|
Sector |
2022 Sentiment and Outlook |
2022 Outlook |
|
|
Retail |
|
Neutral |
|
|
Office |
|
Neutral |
|
|
Residential |
|
Neutral |
|
|
Outlook |
Our outlook for the Mixed Use Developments (MUDs) is Neutral, supported by the remarkable returns compared to single use themes, and the increasing need for quality, sustainable and energy efficient developments However, the existing oversupply of NMA office market at 7.3 mn SQFT, 3.0 mn SQFT in the NMA retail market and 1.7mn SQFT in the Kenyan Retail market is expected to weigh down the performance. Karen, Kilimani and Westlands nodes provided the best investment opportunities, with the areas providing the highest average MUD yields of 9.8%, 8.0% and 7.9% respectively, compared to the market average of 7.4%. |
||
Disclaimer: The views expressed in this publication are those of the writers where particulars are not warranted. This publication, which is in compliance with Section 2 of the Capital Markets Authority Act Cap 485A, is meant for general information only and is not a warranty, representation, advice or solicitation of any nature. Readers are advised in all circumstances to seek the advice of a registered investment advisor.

- Talk to us
- Kenya
- P.O Box 20695 - 00200, Nairobi, Kenya
- Cell +254709101200
- Tel +254709101200
- WhatsApp +254741676635
- United States
- +254709101200
- DOWNLOAD OUR APP
-


- Kenya
- 8th Floor, Pinetree Plaza, Kaburu Drive, Ngong Road, Nairobi, Kenya
- USA
- Suite 1150, 1775 Eye Street NW, USA, Washington DC 20006, USA
- Investments
- High Yield
- Private Equity
- Real Estate
- Real Estate
- RiverRun Estates
- Cytonn Towers
- The Ridge
- Taraji Heights
- The Alma