The Progress of Retirement Benefits Schemes in Kenya, & Cytonn Weekly #21/2025
By Research Team, May 25, 2025
Executive Summary
Fixed Income
This week, T-bills were oversubscribed for the third consecutive week, with the overall subscription rate coming in at 142.4%, albeit lower than the subscription rate of 179.7% recorded the previous week. Investors’ preference for the shorter 91-day paper persisted, with the paper receiving bids worth Kshs 4.5 bn against the offered Kshs 4.0 bn, translating to a subscription rate of 113.2%, significantly lower than the oversubscription rate of 202.2%, recorded the previous week. The subscription rates for the 182-day increased to 113.9% from the 53.6% recorded the previous week, while the 364-day papers decreased to 182.7% from the 296.8% respectively recorded the previous week. The government accepted a total of Kshs 29.9 bn worth of bids out of Kshs 34.2 bn bids received, translating to an acceptance rate of 87.6%. The yields on the government papers registered a mixed performance with the yields on the 91-day paper decreasing the most by 4.7 bps to 8.3% from the 8.4% recorded the previous week, the yields on the 182-day paper decreased by 0.8 bps to 8.57% from the 8.58% recorded the previous week while the yields on the 364-day paper increased by 0.04 bps to remain relatively unchanged from the 10.0% recorded the previous week.
Also, we are projecting the y/y inflation rate for May 2025 to increase marginally to within the range of 4.2% - 4.5% mainly on the back of increased forex adjustment charges on electricity, coupled with the decrease in the Central Bank Rate (CBR) by 75.0 bps to 10.00% from 10.75%
Equities
During the week, the equities market was on a downward trajectory, with NSE 20, NASI and NSE 25 each losing by 0.3% while NSE 10 lost by 0.2%, taking the YTD performance to gains of 6.8%, 6.4%, 3.5% and 3.0% for NASI, NSE 20, NSE 25 and NSE 10. The equities market performance was driven by losses recorded by large-cap stocks such as Stanbic, KCB and EABL of 12.4%, 4.8% and 1.2%, respectively. The performance was however supported by gains recorded by large cap stock such as DTB-K, Absa and NCBA of 4.8%, 3.8% and 2.0%;
Additionally, in the regional equities market, the East African Exchanges 20 (EAE 20) share index lost by 0.2% to 100.0 from 100.1 recorded the previous week, attributable to losses recorded by large cap stocks such as the Airtel Uganda, Absa Bank Kenya and CRDB Bank of 6.1%, 2.1% and 1.5% respectively, the performance was however supported by gains recorded by large cap stocks such as gains recorded by large cap stocks such as the Bank of Baroda Uganda, The Co-operative Bank of Kenya and Bralirwa Limited of 10.8%, 9.1% and 7.8 % respectively;
During the week Standard Chartered Bank Kenya released their Q1’2025 financial results, highlighting that Profit After Tax (PAT) decreased by 13.5% to Kshs 4.9 bn, from Kshs 5.6 bn in Q1’2024. The performance was mainly driven by a 11.2% decrease in Total Operating Income to Kshs 11.6 bn, from Kshs 13.1 bn in Q1’2024, which outpaced the 8.7% decrease in Total Operating expense to Kshs 5.0 bn in Q1’2025, from Kshs 5.4 bn in Q1’2024;
During the week KCB Group released their Q1’2025 financial results, highlighting that their profit after tax (PAT) increased by 0.4% to Kshs 16.54 bn, from Kshs 16.48 bn in Q1’2024. The performance was mainly driven by a 2.0% increase in Total Operating Income to Kshs 49.4 bn, from Kshs 48.5 bn in Q1’2024, which was weighed down by the 3.4% increase in Total Operating expense to Kshs 28.3 bn in Q1’2025, from Kshs 27.3 bn in Q1’2024;
During the week NCBA Group released their Q1’2025 financial results, highlighting that their profit after tax (PAT) increased by 3.4% to Kshs 5.5 bn, from Kshs 5.3 bn in Q1’2024. The performance was mainly driven by a by 8.5% increase in total operating income to Kshs 17.3 bn, from Kshs 16.0 bn in Q1’2024, which outpaced the 11.3% increase in total operating expenses to Kshs 10.5 bn, from Kshs 9.4 bn in Q1’2024;
Real Estate
During the week, President William Ruto officiated the handover of 1,080 housing units at the Mukuru Affordable Housing Project in Nairobi’s Embakasi South, marking a pivotal moment in Kenya’s housing sector. Spanning 56 acres, this ambitious initiative, the largest of its kind in the country, aims to deliver 13,248 units by March 2026;
During the week, property developer Mi Vida Homes announced a strategic partnership with Space Master Properties to construct Habitat, a 24-story mixed-use facility along Ralph Bunche Road in Nairobi’s Westlands. This ambitious project, developed in collaboration with Parklane Construction, marks a pioneering effort in Kenya’s real estate market by integrating healthcare with residential and commercial spaces. The development will feature 42 medical suites for sale to healthcare providers, a residential component with assisted living options, and retail areas, targeting Nairobi’s growing medical tourism sector;
On the Unquoted Securities Platform, Acorn D-REIT and I-REIT traded at Kshs 25.4 and Kshs 22.2 per unit, respectively, as per the last updated data on 23rd May 2025. The performance represented a 27.0% and 11.0% gain for the D-REIT and I-REIT, respectively, from the Kshs 20.0 inception price. Additionally, ILAM Fahari I-REIT traded at Kshs 11.0 per share as of 23rd May 2025, representing a 45.0% loss from the Kshs 20.0 inception price. The volume traded to date came in at Kshs 1.2 mn shares for the I-REIT since inception in November 2015.
Focus of the Week
According to the ACTSERV Q1’2025 Pension Schemes Investments Performance Survey, segregated retirement benefits scheme quarterly returns increased to a 7.1% return in Q1’2025, up from the 6.0% gain recorded in Q1’2024. The y/y growth in overall returns was largely driven by the 4.9% points increase in returns from Fixed Income to 7.8% from a gain of 2.9% in Q1’2024. The schemes overall performance is attributable to increased investments in government securities to lock in the higher yields in anticipation of further yield declines driven by the CBK’s expected continued monetary policy easing. The performance was however weighed down the low Equities returns of 4.6%,compared to a 25.6% return in Q1’2024. Notably, on a q/q basis the segregated retirement benefits schemes recorded a decline in returns from a gain of 13.2% in Q4’2024. This week, we shall focus on understanding Retirement Benefits Schemes and look into the quarterly performance and current state of retirement benefits schemes in Kenya with a key focus on Q1’2025;
Investment Updates:
- Weekly Rates: Cytonn Money Market Fund closed the week at a yield of 13.6 % p.a. To invest, dial *809# or download the Cytonn App from Google Play store here or from the Appstore here;
- We continue to offer Wealth Management Training every Tuesday, from 7:00 pm to 8:00 pm. The training aims to grow financial literacy among the general public. To register for any of our Wealth Management Trainings, click here;
- If interested in our Private Wealth Management Training for your employees or investment group, please get in touch with us through wmt@cytonn.com;
- Cytonn Insurance Agency acts as an intermediary for those looking to secure their assets and loved ones’ future through insurance namely; Motor, Medical, Life, Property, WIBA, Credit and Fire and Burglary insurance covers. For assistance, get in touch with us through insuranceagency@cytonn.com;
- Cytonn Asset Managers Limited (CAML) continues to offer pension products to meet the needs of both individual clients who want to save for their retirement during their working years and Institutional clients that want to contribute on behalf of their employees to help them build their retirement pot. To more about our pension schemes, kindly get in touch with us through pensions@cytonn.com;
Hospitality Updates:
- We currently have promotions for Staycations. Visit cysuites.com/offers for details or email us at sales@cysuites.com;
Money Markets, T-Bills Primary Auction:
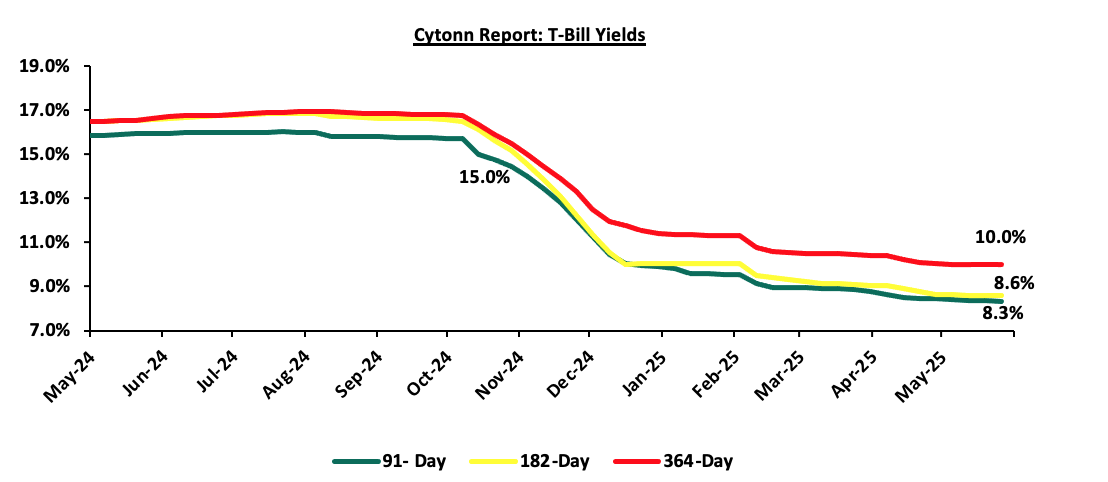
During the week, T-bills were oversubscribed for the third consecutive week, with the overall subscription rate coming in at 142.4%, albeit lower than the subscription rate of 179.7% recorded the previous week. The 91-day paper received bids worth Kshs 4.5 bn against the offered Kshs 4.0 bn, translating to a subscription rate of 113.2%, significantly lower than the oversubscription rate of 202.2%, recorded the previous week. The subscription rates for the 182-day increased to 113.9% from the 53.6% recorded the previous week, while the 364-day papers decreased to 182.7% from the 296.8% respectively recorded the previous week. The government accepted a total of Kshs 29.9 bn worth of bids out of Kshs 34.2 bn bids received, translating to an acceptance rate of 87.6%. The yields on the government papers registered a mixed performance with the yields on the 91-day paper decreasing the most by 4.7 bps to 8.3% from the 8.4% recorded the previous week, the yields on the 182-day paper decreased by 0.8 bps to 8.57% from the 8.58% recorded the previous week while the yields on the 364-day paper increased by 0.04 bps to remain relatively unchanged from the 10.0% recorded the previous week.
The chart below shows the yield performance of the 91-day, 182-day and 364-day papers from May 2024 to May 2025:
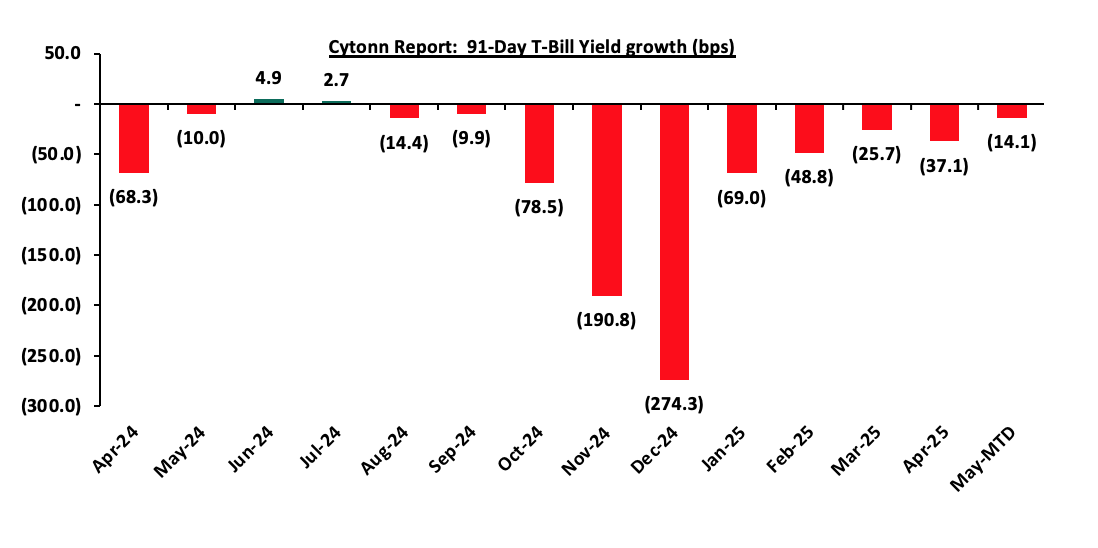
The chart below shows the yield growth for the 91-day T-bill:
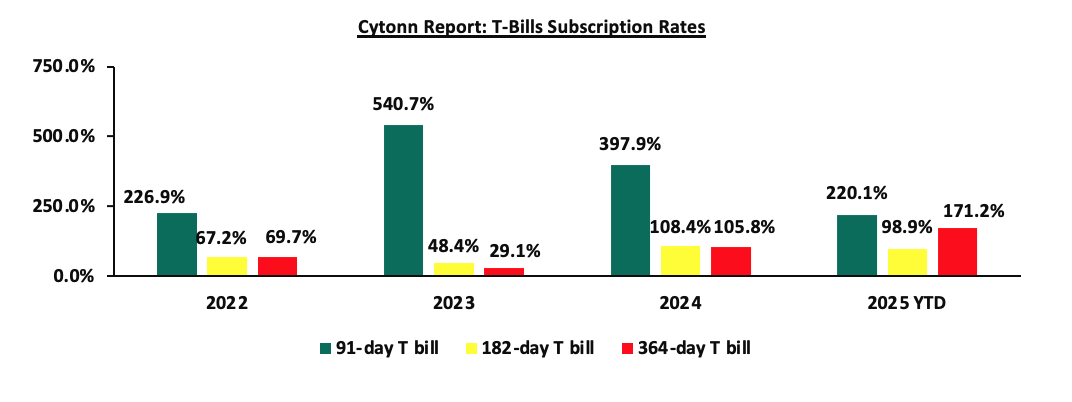
The chart below compares the overall average T-bill subscription rates obtained in 2022,2023, 2024 and 2025 Year-to-date (YTD):
Money Market Performance:
In the money markets, 3-month bank placements ended the week at 10.1% (based on what we have been offered by various banks) and the yields on the government papers registered mixed performance with the yields on 91-day paper decreasing by 4.7 bps to 8.3% from 8.4% recorded the previous week while the yields for the 364-day papers increased by 0.04 bps to remain relatively unchanged from the 10.0% recorded the previous week. The yield on the Cytonn Money Market Fund decreased by 3.0 bps to 13.6% from the 13.7% recorded the previous week, while the average yields on the Top 5 Money Market Funds decreased by 1.4 bps to close the week at 13.4%, relatively unchanged from the previous week.
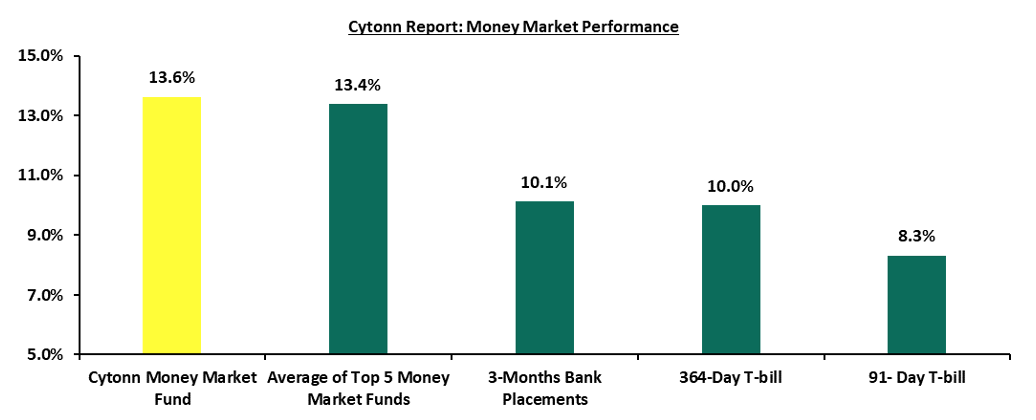
The table below shows the Money Market Fund Yields for Kenyan Fund Managers as published 23rd May 2025:
|
Cytonn Report: Money Market Fund Yield for Fund Managers as published on 23rdMay 2025 |
||
|
Rank |
Fund Manager |
Effective Annual Rate |
|
1 |
Gulfcap Money Market Fund |
13.9% |
|
2 |
Cytonn Money Market Fund ( Dial *809# or download Cytonn App) |
13.6% |
|
3 |
Kuza Money Market fund |
13.3% |
|
4 |
GenAfrica Money Market Fund |
13.1% |
|
5 |
Ndovu Money Market Fund |
13.1% |
|
6 |
Arvocap Money Market Fund |
13.1% |
|
7 |
Etica Money Market Fund |
12.9% |
|
8 |
Lofty-Corban Money Market Fund |
12.8% |
|
9 |
Enwealth Money Market Fund |
12.1% |
|
10 |
Old Mutual Money Market Fund |
12.0% |
|
11 |
Orient Kasha Money Market Fund |
11.9% |
|
12 |
British-American Money Market Fund |
11.8% |
|
13 |
Nabo Africa Money Market Fund |
11.3% |
|
14 |
Madison Money Market Fund |
11.2% |
|
15 |
Jubilee Money Market Fund |
11.2% |
|
16 |
Faulu Money Market Fund |
11.0% |
|
17 |
Sanlam Money Market Fund |
10.9% |
|
18 |
Dry Associates Money Market Fund |
10.7% |
|
19 |
Genghis Money Market Fund |
10.5% |
|
20 |
Apollo Money Market Fund |
10.4% |
|
21 |
Co-op Money Market Fund |
10.2% |
|
22 |
KCB Money Market Fund |
10.1% |
|
23 |
CIC Money Market Fund |
10.1% |
|
24 |
Absa Shilling Money Market Fund |
9.9% |
|
25 |
ICEA Lion Money Market Fund |
9.8% |
|
26 |
Mali Money Market Fund |
9.7% |
|
27 |
Mayfair Money Market Fund |
9.2% |
|
28 |
AA Kenya Shillings Fund |
7.8% |
|
29 |
Stanbic Money Market Fund |
7.5% |
|
30 |
Ziidi Money Market Fund |
7.2% |
|
31 |
Equity Money Market Fund |
5.4% |
Source: Business Daily
Liquidity:
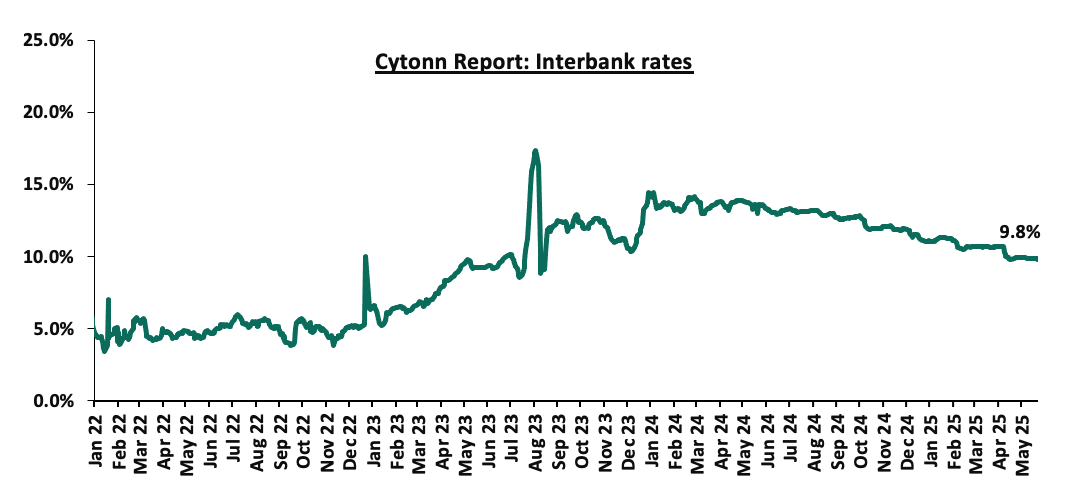
During the week, liquidity in the money markets marginally tightened, with the average interbank rate increasing by 1.8 bps, to remain relatively unchanged from the 9.9% recorded the previous week, partly attributable to government payments that were offset by tax remittances. The average interbank volumes traded decreased by 32.6% to Kshs 5.0 bn from Kshs 7.5 bn recorded the previous week. The chart below shows the interbank rates in the market over the years:
Kenya Eurobonds:
During the week, the yields on Kenya’s Eurobonds registered a mixed performance with the yield on the 30-year Eurobond issued in 2018 increasing the most by 13.1 bps to 11.0% from the 10.9% recorded the previous week while the yield on the 7-year Eurobond issued in 2019 decreased by 13.1 bps to 7.7% from the 7.8% recorded the previous week. The table below shows the summary performance of the Kenyan Eurobonds as of 22nd May 2025;
|
Cytonn Report: Kenya Eurobonds Performance |
|
||||||
|
|
2018 |
2019 |
2021 |
2024 |
2025 |
||
|
Tenor |
10-year issue |
30-year issue |
7-year issue |
12-year issue |
13-year issue |
7-year issue |
11-year issue |
|
Amount Issued (USD) |
1.0 bn |
1.0 bn |
0.3 bn |
1.2 bn |
1.0 bn |
1.5 bn |
1.5 bn |
|
Years to Maturity |
2.8 |
22.8 |
2.0 |
7.0 |
9.1 |
5.7 |
10.8 |
|
Yields at Issue |
7.3% |
8.3% |
7.0% |
7.9% |
6.2% |
10.4% |
9.9% |
|
02-Jan-25 |
9.1% |
10.3% |
8.5% |
10.1% |
10.1% |
10.1% |
|
|
01-May-25 |
10.1% |
11.4% |
8.4% |
11.1% |
10.9% |
11.2% |
|
|
15-May-25 |
9.2% |
10.9% |
7.8% |
10.3% |
10.2% |
10.3% |
|
|
16-May-25 |
9.0% |
10.8% |
7.7% |
10.3% |
10.1% |
10.2% |
|
|
19-May-25 |
9.1% |
10.9% |
7.7% |
10.3% |
10.2% |
10.3% |
|
|
20-May-25 |
8.9% |
10.8% |
7.7% |
10.1% |
10.1% |
10.2% |
|
|
21-May-25 |
9.1% |
10.9% |
7.7% |
10.3% |
10.2% |
10.3% |
|
|
22-May-25 |
9.2% |
11.0% |
7.7% |
10.4% |
10.3% |
10.4% |
|
|
Weekly Change |
0.0% |
0.1% |
(0.1%) |
0.1% |
0.1% |
0.1% |
- |
|
MTD Change |
(0.9%) |
(0.4%) |
(0.8%) |
(0.7%) |
(0.6%) |
(0.8%) |
- |
|
YTD Change |
0.1% |
0.8% |
(0.8%) |
0.4% |
0.2% |
0.3% |
- |
Source: Central Bank of Kenya (CBK) and National Treasury
Kenya Shilling:
During the week, the Kenyan Shilling appreciated marginally against the US Dollar by 3.4 bps, to remain relatively unchanged from the Kshs 129.3 recorded the previous week. On a year-to-date basis, the shilling has appreciated by 4.0 bps against the dollar, compared to the 17.4% appreciation recorded in 2024.
We expect the shilling to be supported by:
- Diaspora remittances standing at a cumulative USD 4,997.2 mn in the twelve months to April 2025, 12.1% higher than the USD 4,457.5 mn recorded over the same period in 2024. These has continued to cushion the shilling against further depreciation. In the April 2025 diaspora remittances figures, North America remained the largest source of remittances to Kenya accounting for 59.6% in the period,
- The tourism inflow receipts which came in at Kshs 452.2 bn in 2024, a 19.8% increase from Kshs 377.5 bn inflow receipts recorded in 2023, and owing to tourist arrivals that improved by 14.6% to 2,394,376 in 2024 from 2,089,259 in 2023, and,
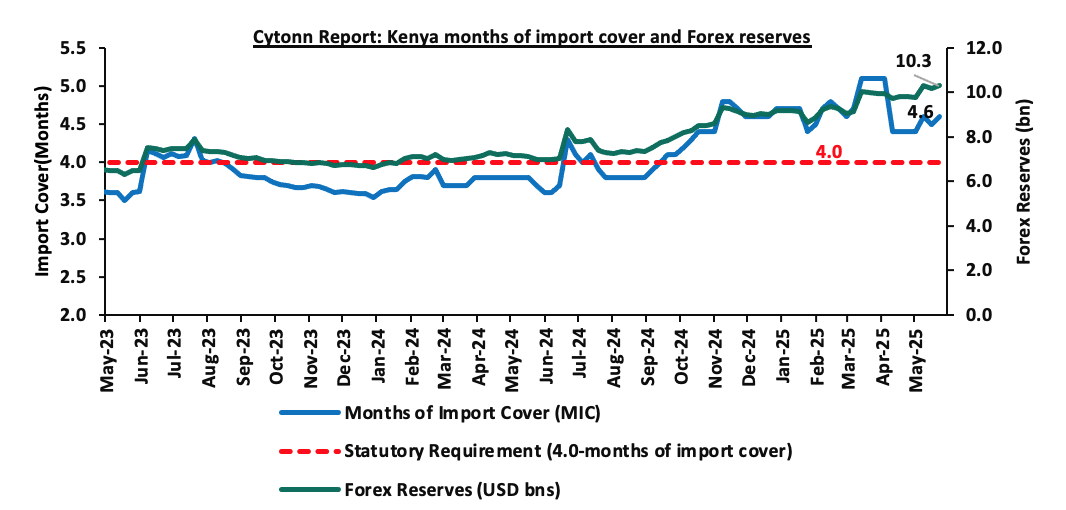
- Improved forex reserves currently at USD 10.3 bn (equivalent to 4.6-months of import cover), which is above the statutory requirement of maintaining at least 4.0-months of import cover and at par with the EAC region’s convergence criteria of 4.5-months of import cover.
The shilling is however expected to remain under pressure in 2025 as a result of:
- An ever-present current account deficit which came at 3.1% of GDP in the twelve months to February 2025, and,
- The need for government debt servicing, continues to put pressure on forex reserves given that 62.0% of Kenya’s external debt is US Dollar-denominated as of December2024.
Key to note, Kenya’s forex reserves increased by 1.4% during the week, to USD 10.3 bn from USD 10.2 bn recorded in the previous week, equivalent to 4.6 months of import cover (based on updated import data), from the 4.5 months of import cover recorded last week, and above the statutory requirement of maintaining at least 4.0-months of import cover.
The chart below summarizes the evolution of Kenya's months of import cover over the years:
Weekly Highlights
- May 2025 Inflation projection
We are projecting the y/y inflation rate for May 2025 to increase marginally to within the range of 4.2% - 4.5% mainly on the back of:
- Increased electricity forex adjustment charges – In May 2025, EPRA increased the forex adjustment charge to Kshs 1.3 from Kshs 1.0 in April 2025. With electricity being one the major inputs of inflation, this increase is expected to increase production costs for businesses as well as increase electricity costs for households and thus tightening inflation.
- The decrease in the Central Bank Rate (CBR) by 75.0 bps to 10.00% from 10.75% – In 2025, the CBK Monetary Policy Committee continued reducing the Central Bank Rate (CBR) with a 75.0 bps cut in April, lowering it to 10.00% in April 2025 from 10.75% in February 2025. In their previous meeting on 5th February 2025, they cut the CBR by 50.0 bps to 10.75%. This reduction in the CBR is likely to increase the money supply through lower borrowing costs, which may cause a slight rise in inflation rates as the effects of the CBR gradually take hold in the broader economy.
We, however, expect that inflation rate will, however, be supported by:
- Stability of Fuel Prices in May– In their last fuel prices release, EPRA announced that the maximum allowed price for Super Petrol, Diesel and Kerosene remained unchanged at Kshs 174.6, Kshs 164.9 and Kshs 150.0 per litre respectively. This stability in fuel prices is likely to decrease pressure on consumers’ purchasing power as well as business operational costs, since fuel is a major input cost for businesses, and,
- Stability of the Kenya Shilling against the US Dollar – The Kenya Shilling has recorded an 8.1 bps month-to-date appreciation as of 21st May 2025 to Kshs 129.2 from Kshs 129.5 recorded at the beginning of the month. This appreciation in the exchange rate, though slight, could help stabilize inflationary pressures.
Going forward, we expect inflationary pressures to remain anchored in the short term, remaining within the CBK’s target range of 2.5%-7.5% aided by the stable fuel prices, decreased energy costs and stability in the exchange rate. However, risks remain, particularly from the potential for increased demand-driven inflation due to accommodative monetary policy. The decision to lower the CBR to 10.00% during the latest MPC meeting will likely increase money supply, in turn increasing inflation, especially with further cuts expected in the coming meetings. The CBK’s ability to balance growth and inflation through close monitoring of both inflation and exchange rate stability will be key to maintaining inflation within the target range.
Rates in the Fixed Income market have been on a downward trend due to high liquidity in the money market which allowed the government to front load most of its borrowing. The government is 75.2% ahead of its prorated net domestic borrowing target of Kshs 539.7 bn, and 58.4% ahead of the total FY’2024/25 net domestic borrowing target of Kshs 597.2 bn, having a net borrowing position of Kshs 945.8 bn (inclusive of T-bills). However, we expect a stabilization of the yield curve in the short and medium term, with the government looking to increase its external borrowing to maintain the fiscal surplus, hence alleviating pressure in the domestic market. As such, we expect the yield curve to stabilize in the short to medium-term and hence investors are expected to shift towards the long-term papers to lock in the high returns
Market Performance
During the week, the equities market was on a downward trajectory, with NSE 20, NASI and NSE 25 each losing by 0.3% while NSE 10 lost by 0.2%, taking the YTD performance to gains of 6.8%, 6.4%, 3.5% and 3.0% for NASI, NSE 20, NSE 25 and NSE 10. The equities market performance was driven by losses recorded by large-cap stocks such as Stanbic, KCB and EABL of 12.4%, 4.8% and 1.2%, respectively. The performance was however supported by gains recorded by large cap stock such as DTB-K, Absa and NCBA of 4.8%, 3.8% and 2.0%.
Additionally, in the regional equities market, the East African Exchanges 20 (EAE 20) share index lost by 0.2% to 100.0 from 100.1 recorded the previous week, attributable to losses recorded by large cap stocks such as the Airtel Uganda, Absa Bank Kenya and CRDB Bank of 6.1%, 2.1% and 1.5% respectively, the performance was however supported by gains recorded by large cap stocks such as the Bank of Baroda Uganda, The Co-operative Bank of Kenya and Bralirwa Limited of 10.8%, 9.1% and 7.8 % respectively.
During the week, equities turnover decreased by 40.1% to USD 15.0 mn, from USD 25.1 mn recorded the previous week, taking the YTD total turnover to USD 315.4 mn. Foreign investors became net sellers for the first time in two weeks, with a net selling position of USD 0.02 mn, from a net buying position of USD 1.9 mn recorded the previous week, taking the YTD foreign net selling position to USD 30.1 mn, compared to a net selling position of USD 16.9 mn in 2024.
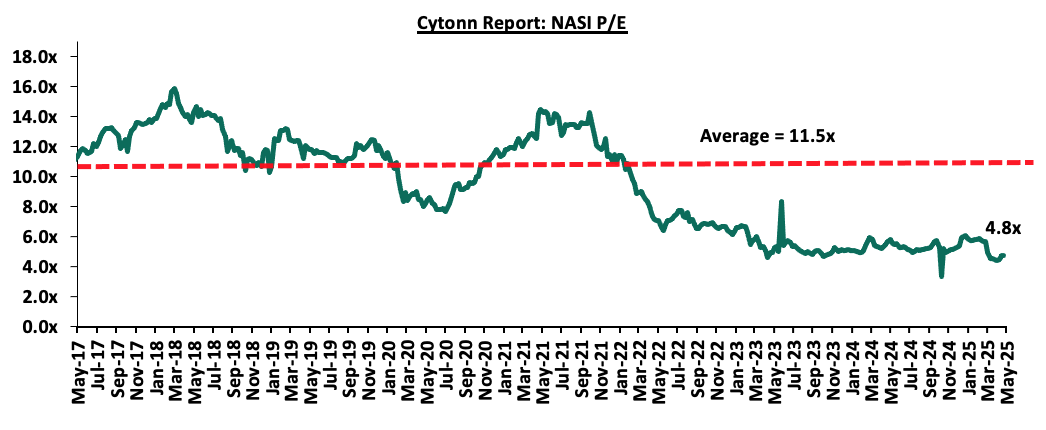
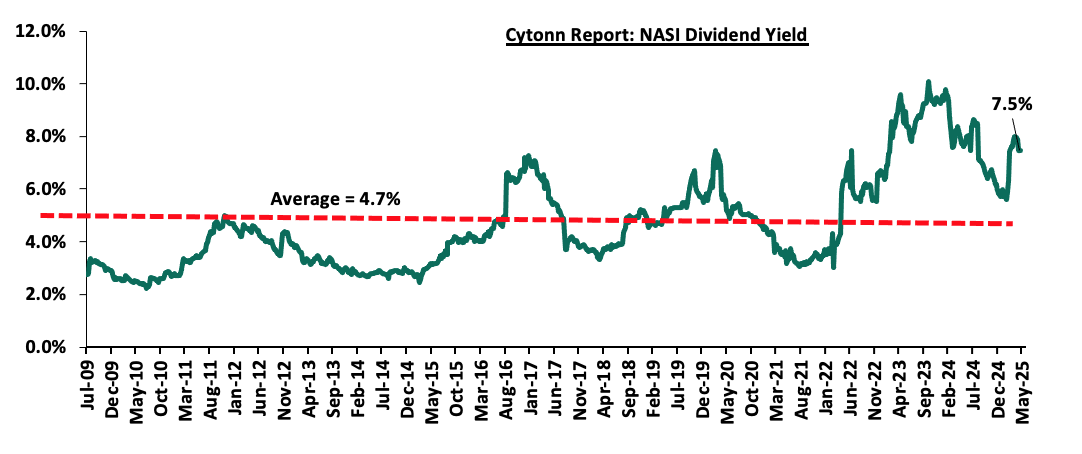
The market is currently trading at a price-to-earnings ratio (P/E) of 4.8x, 58.6% below the historical average of 11.5x. The dividend yield stands at 7.5%, 2.7% points above the historical average of 4.7%. Key to note, NASI’s PEG ratio currently stands at 0.6x, an indication that the market is undervalued relative to its future growth. A PEG ratio greater than 1.0x indicates the market is overvalued while a PEG ratio less than 1.0x indicates that the market is undervalued. The charts below indicate the historical P/E and dividend yields of the market;
Universe of Coverage:
|
Cytonn Report: Equities Universe of Coverage |
||||||||||
|
Company |
Price as at 16/05/2025 |
Price as at 23/05/2025 |
w/w change |
YTD Change |
Year Open 2025 |
Target Price* |
Dividend Yield |
Upside/ Downside** |
P/TBv Multiple |
Recommendation |
|
Standard Chartered Bank |
270.0 |
269.3 |
(0.3%) |
(5.6%) |
285.3 |
328.8 |
16.7% |
38.8% |
1.5x |
Buy |
|
Stanbic Holdings |
169.8 |
148.8 |
(12.4%) |
6.4% |
139.8 |
185.3 |
13.9% |
38.5% |
0.9x |
Buy |
|
KCB Group |
42.9 |
40.8 |
(4.8%) |
(3.8%) |
42.4 |
50.7 |
7.4% |
31.6% |
0.5x |
Buy |
|
ABSA Bank |
17.1 |
17.8 |
3.8% |
(5.8%) |
18.9 |
21.0 |
9.9% |
28.2% |
1.1x |
Buy |
|
Co-op Bank |
15.5 |
15.7 |
1.3% |
(10.0%) |
17.5 |
18.6 |
9.6% |
28.2% |
0.6x |
Buy |
|
NCBA |
51.0 |
52.0 |
2.0% |
2.0% |
51.0 |
60.2 |
10.6% |
26.3% |
0.8x |
Buy |
|
Diamond Trust Bank |
73.0 |
76.5 |
4.8% |
14.6% |
66.8 |
87.1 |
9.2% |
23.0% |
0.3x |
Buy |
|
Jubilee Holdings |
206.0 |
224.8 |
9.1% |
28.6% |
174.8 |
260.7 |
6.0% |
22.0% |
0.3x |
Buy |
|
CIC Group |
2.7 |
2.7 |
0.4% |
26.2% |
2.1 |
3.1 |
4.8% |
19.6% |
0.7x |
Accumulate |
|
Equity Group |
48.6 |
48.5 |
(0.3%) |
0.9% |
48.0 |
52.8 |
8.8% |
17.8% |
0.8x |
Accumulate |
|
I&M Group |
31.9 |
34.5 |
8.2% |
(4.2%) |
36.0 |
36.8 |
8.7% |
15.4% |
0.6x |
Accumulate |
|
Britam |
6.6 |
7.3 |
10.6% |
25.8% |
5.8 |
7.5 |
0.0% |
2.5% |
0.7x |
Lighten |
|
*Target Price as per Cytonn Analyst estimates **Upside/ (Downside) is adjusted for Dividend Yield ***Dividend Yield is calculated using FY’2024 Dividends |
||||||||||
Weekly Highlights
- Standard Chartered Bank Kenya Q1’2025 Financial Results
During the week, Standard Chartered Bank Kenya released their Q1’2025 financial results. Below is a summary of the performance:
|
Balance Sheet Items |
Q1’2024 |
Q1’2025 |
y/y change |
|
Net loans |
153.6 |
137.9 |
(10.2%) |
|
Government Securities |
69.0 |
100.8 |
46.2% |
|
Total Assets |
391.3 |
382.3 |
(2.3%) |
|
Customer Deposits |
306.0 |
285.2 |
(6.8%) |
|
Deposits per Branch |
8.5 |
8.9 |
4.9% |
|
Total Liabilities |
323.4 |
306.2 |
(5.3%) |
|
Shareholder's Funds |
68.0 |
76.1 |
12.0% |
|
Balance Sheet Ratios |
Q1’2024 |
Q1’2025 |
% points change |
|
Loan to deposit ratio |
50.2% |
48.3% |
(1.9%) |
|
Government securities to deposit ratio |
22.5% |
35.3% |
12.8% |
|
Return on Average Equity |
24.0% |
26.8% |
2.8% |
|
Return on Average Assets |
4.0% |
5.0% |
1.0% |
|
Income Statement |
Q1’2024 |
Q1’2025 |
y/y change |
|
Net Interest Income |
8.3 |
8.2 |
(0.8%) |
|
Net non-Interest Income |
4.8 |
3.4 |
(29.3%) |
|
Total Operating income |
13.1 |
11.6 |
(11.2%) |
|
Loan Loss provision |
0.5 |
0.4 |
(24.7%) |
|
Total Operating expenses |
5.4 |
5.0 |
(8.7%) |
|
Profit before tax |
7.6 |
6.6 |
(13.0%) |
|
Profit after tax |
5.6 |
4.9 |
(13.5%) |
|
Core EPS (Kshs) |
14.9 |
12.9 |
(13.5%) |
|
Income Statement Ratios |
Q1’2024 |
Q1’2025 |
% points change |
|
Yield from interest-earning assets |
9.6% |
9.3% |
(0.3%) |
|
Cost of funding |
1.2% |
1.0% |
(0.2%) |
|
Net Interest Spread |
8.5% |
8.4% |
(0.1%) |
|
Net Interest Margin |
8.6% |
8.5% |
(0.1%) |
|
Cost of Risk |
4.2% |
3.6% |
(0.6%) |
|
Net Interest Income as % of operating income |
63.3% |
70.8% |
7.4% |
|
Non-Funded Income as a % of operating income |
36.7% |
29.2% |
(7.4%) |
|
Cost to Income Ratio |
41.6% |
42.7% |
1.2% |
|
Cost to Income Ratio without LLP |
37.4% |
39.2% |
1.8% |
|
Capital Adequacy Ratios |
Q1’2024 |
Q1’2025 |
% points change |
|
Core Capital/Total Liabilities |
17.6% |
19.8% |
2.2% |
|
Minimum Statutory ratio |
8.0% |
8.0% |
|
|
Excess |
9.6% |
11.8% |
2.2% |
|
Core Capital/Total Risk Weighted Assets |
18.4% |
20.6% |
2.2% |
|
Minimum Statutory ratio |
10.5% |
10.5% |
|
|
Excess |
7.9% |
10.1% |
2.2% |
|
Total Capital/Total Risk Weighted Assets |
18.5% |
20.6% |
2.2% |
|
Minimum Statutory ratio |
14.5% |
14.5% |
|
|
Excess |
4.0% |
6.1% |
2.2% |
|
Liquidity Ratio |
66.9% |
73.6% |
6.7% |
|
Minimum Statutory ratio |
20.0% |
20.0% |
|
|
Excess |
46.9% |
53.6% |
6.7% |
Key Take-Outs:
- Declined earnings growth - Core earnings per share decreased by 13.5% to Kshs 12.9, from Kshs 14.9 in Q1’2024, mainly driven by the 11.2% decrease in total operating income to Kshs 11.6 bn, from Kshs 13.1 bn in Q1’2024, which outpaced the 8.7% decrease in total operating expenses to Kshs 5.0 bn, from Kshs 5.4 bn in Q1’2024,
- Improved asset quality – The bank’s Asset Quality improved, with Gross NPL ratio decreasing to 8.3% in Q1’2025, from 9.9% in Q1’2024, attributable to the 26.1% decrease in gross non-performing loans to Kshs 12.2 bn, from Kshs 16.5 bn in Q1’2024, relative to the slower 11.9% decrease in gross loans to Kshs 147.5 bn, from Kshs 167.4 bn recorded in Q1’2024, and,
- Decreased Lending – The bank’s loan book decreased by 10.2% to Kshs 137.9 bn from Kshs 153.6 bn in Q1’2024,
For a more detailed analysis, please see the Standard Chartered Bank Kenya’s Q1’2025 Earnings Note
- KCB Group Q1’2025 Financial Results
During the week, KCB Group released their Q1’2025 financial results. Below is a summary of the performance:
|
Balance Sheet Items |
Q1'2024 |
Q1'2025 |
y/y change |
|
Government Securities |
393.0 |
312.6 |
(20.5%) |
|
Net Loans and Advances |
1,017.4 |
1,018.6 |
0.1% |
|
Total Assets |
1,996.2 |
2,034.2 |
1.9% |
|
Customer Deposits |
1,501.0 |
1,427.8 |
(4.9%) |
|
Deposits/Branch |
2.8 |
2.6 |
(9.4%) |
|
Total Liabilities |
1,757.6 |
1,728.7 |
(1.6%) |
|
Shareholders’ Funds |
231.5 |
297.1 |
28.4% |
|
Balance Sheet Ratios |
Q1'2024 |
Q1'2025 |
% y/y change |
|
Loan to Deposit Ratio |
67.8% |
71.7% |
3.9% |
|
Government Securities to Deposit Ratio |
26.2% |
21.9% |
(4.3%) |
|
Return on average equity |
20.1% |
23.4% |
3.3% |
|
Return on average assets |
2.4% |
3.1% |
0.6% |
|
Income Statement (Kshs Bn) |
Q1'2024 |
Q1'2025 |
y/y change |
|
Net Interest Income |
31.1 |
33.7 |
8.5% |
|
Net non-Interest Income |
17.4 |
15.7 |
(9.8%) |
|
Total Operating income |
48.5 |
49.4 |
2.0% |
|
Loan Loss provision |
(6.3) |
(5.6) |
(11.3%) |
|
Total Operating expenses |
(27.3) |
(28.3) |
3.4% |
|
Profit before tax |
21.2 |
21.2 |
0.1% |
|
Profit after tax |
16.5 |
16.5 |
0.4% |
|
Core EPS |
5.1 |
5.1 |
0.4% |
|
Income Statement Ratios |
Q1'2024 |
Q1'2025 |
y/y change |
|
Yield from interest-earning assets |
11.6% |
13.0% |
1.4% |
|
Cost of funding |
4.6% |
4.7% |
0.1% |
|
Net Interest Spread |
7.0% |
8.3% |
1.3% |
|
Net Interest Margin |
7.4% |
8.5% |
1.1% |
|
Cost of Risk |
13.0% |
11.3% |
(1.7%) |
|
Net Interest Income as % of operating income |
64.1% |
68.2% |
4.1% |
|
Non-Funded Income as a % of operating income |
35.9% |
31.8% |
(4.1%) |
|
Cost to Income Ratio |
56.4% |
57.2% |
0.8% |
|
Cost to Income Ratio (without LLP) |
43.3% |
45.8% |
2.5% |
|
Capital Adequacy Ratios |
Q1'2024 |
Q1'2025 |
% points change |
|
Core Capital/Total Liabilities |
15.6% |
19.7% |
4.1% |
|
Minimum Statutory ratio |
8.0% |
8.0% |
0.0% |
|
Excess |
7.6% |
11.7% |
4.1% |
|
Core Capital/Total Risk Weighted Assets |
17.6% |
16.7% |
(0.9%) |
|
Minimum Statutory ratio |
10.5% |
10.5% |
0.0% |
|
Excess |
7.1% |
6.2% |
(0.9%) |
|
Total Capital/Total Risk Weighted Assets |
20.0% |
19.7% |
(0.3%) |
|
Minimum Statutory ratio |
14.5% |
14.5% |
0.0% |
|
Excess |
5.5% |
5.2% |
(0.3%) |
|
Liquidity Ratio |
47.9% |
47.6% |
(0.3%) |
|
Minimum Statutory ratio |
20.0% |
20.0% |
0.0% |
|
Excess |
27.9% |
27.6% |
(0.3%) |
Key Take-Outs:
- Increased earnings - Core earnings per share (EPS) grew by 0.4% to Kshs 5.15, from Kshs 5.13 in Q1’2024, driven by the 2.0% increase in total operating income to Kshs 49.4 bn, from Kshs 48.5 bn in Q1’2024, which was however weighed down by the 3.4% increase in total operating expenses to Kshs 28.3 bn from Kshs 27.3 bn in Q1’2024,
- Deteriorated asset quality –The bank’s Asset Quality deteriorated, with Gross NPL ratio increasing to 19.9% in Q1’2025, from 17.9% in Q1’2024, attributable to a 13.6% increase in Gross non-performing loans to Kshs 233.3 bn, from Kshs 205.3 bn in Q1’2024, compared to the 2.6% increase in gross loans to Kshs 1,174.2 bn, from Kshs 1,144.1 bn recorded in Q1’2024,
- Increased Provisioning – General Provisions (LLP) increased by 20.1% to Kshs 122.5 bn in Q1’2025 from Kshs 102.1 bn in Q1’2024.
For a more detailed analysis, please see the KCB Group’s Q1’2025 Earnings Note
- NCBA Group Q1’2025 Financial Results
During the week, NCBA Group Kenya released their Q1’2025 financial results. Below is a summary of the performance:
|
Balance Sheet Items |
Q1'2024 |
Q1'2025 |
y/y change |
|
Government Securities |
320.5 |
287.0 |
(10.4%) |
|
Net Loans and Advances |
178.0 |
187.5 |
5.3% |
|
Total Assets |
694.9 |
656.0 |
(5.60%) |
|
Customer Deposits |
548.1 |
495.7 |
(9.6%) |
|
Deposits/Branch |
5.0 |
4.2 |
(17.2%) |
|
Total Liabilities |
596.1 |
539.7 |
(9.5%) |
|
Shareholders’ Funds |
98.8 |
116.3 |
17.8% |
|
Balance Sheet Ratios |
Q1'2024 |
Q1'2025 |
% y/y change |
|
Loan to Deposit Ratio |
58.5% |
57.9% |
(0.6%) |
|
Government Securities to Deposit Ratio |
32.5% |
37.8% |
5.3% |
|
Return on average equity |
23.2% |
21.2% |
(2.1%) |
|
Return on average assets |
3.3% |
3.4% |
0.1% |
|
Income Statement (Kshs Bn) |
Q1'2024 |
Q1'2025 |
y/y change |
|
Net Interest Income |
8.3 |
10.0 |
20.6% |
|
Net non-Interest Income |
7.7 |
7.4 |
(4.5%) |
|
Total Operating income |
16.0 |
17.3 |
8.5% |
|
Loan Loss provision |
1.4 |
1.6 |
20.3% |
|
Total Operating expenses |
9.4 |
10.5 |
11.3% |
|
Profit before tax |
6.5 |
6.8 |
4.5% |
|
Profit after tax |
5.3 |
5.5 |
3.4% |
|
Core EPS |
3.2 |
3.3 |
3.4% |
|
Income Statement Ratios |
Q1'2024 |
Q1'2025 |
y/y change |
|
Yield from interest-earning assets |
12.2% |
10.9% |
(1.2%) |
|
Cost of funding |
6.5% |
5.0% |
(1.5%) |
|
Net Interest Spread |
5.7% |
5.9% |
0.2% |
|
Net Interest Margin |
6.0% |
6.5% |
0.5% |
|
Cost of Risk |
8.5% |
9.4% |
0.9% |
|
Net Interest Income as % of operating income |
51.7% |
57.5% |
5.8% |
|
Non-Funded Income as a % of operating income |
48.3% |
42.5% |
(5.8%) |
|
Cost to Income Ratio |
59.1% |
60.6% |
1.5% |
|
Cost to Income Ratio (without LLP) |
50.6% |
51.2% |
0.6% |
|
Capital Adequacy Ratios |
Q1'2024 |
Q1'2025 |
% points change |
||
|
Core Capital/Total Liabilities |
17.1% |
21.2% |
4.2% |
||
|
Minimum Statutory ratio |
8.0% |
8.0% |
|
||
|
Excess |
9.1% |
13.2% |
4.2% |
||
|
Core Capital/Total Risk Weighted Assets |
18.5% |
21.5% |
3.1% |
||
|
Minimum Statutory ratio |
10.5% |
10.5% |
|
||
|
Excess |
8.0% |
11.0% |
3.1% |
||
|
Total Capital/Total Risk Weighted Assets |
18.6% |
21.6% |
3.1% |
||
|
Minimum Statutory ratio |
14.5% |
14.5% |
|
||
|
Excess |
4.1% |
7.1% |
3.1% |
||
|
Liquidity Ratio |
51.6% |
55.8% |
4.2% |
||
|
Minimum Statutory ratio |
20.0% |
20.0% |
|
||
|
Excess |
31.6% |
35.8% |
4.2% |
||
Key Take-Outs:
- Increased earnings – Core earnings per share increased by 3.4% to Kshs 3.3, from Kshs 3.2 in Q1’2024, mainly driven by the 8.5% increase in total operating income to Kshs 17.3 bn, from Kshs 16.0 bn in Q1’2024, which outpaced the 11.3% increase in total operating expenses to Kshs 10.5 bn, from Kshs 9.4 bn in Q1’2024
- Deteriorated asset quality – The bank’s Asset Quality deteriorated, with Gross NPL ratio increasing to 12.2% in Q1’2025, from 11.7% in Q1’2024, attributable to the 9.4% decrease in gross loans to Kshs 310.8 bn, from Kshs 342.9 bn recorded in Q1’2024, which outpaced the 5.9% decrease in gross non-performing loans to Kshs 37.8 bn, from Kshs 40.2 bn in Q1’2024,
- Decreased Lending – The bank’s loan book recorded a contraction of 10.4% to Kshs 287.0 bn from Kshs 320.5 bn in Q1’2024 attributed to increased credit risk with NPLs rising to 12.2% in March 2025, from 11.7% in March 2024.
- Contracted Balance sheet- The balance sheet recorded a contraction as total assets declined by 5.6% to Kshs 656.0 bn, from Kshs 694.9 bn in Q1’2024, mainly driven by a 10.4% loan book contraction to Kshs 287.0 bn from Kshs 320.5 bn in Q1’2024
For a more detailed analysis, please see the NCBA Group’s Q1’2025 Earnings Note
Asset Quality:
The table below shows the asset quality of listed banks that have released their Q1’2025 results using NPL ratio and NPL coverage:
|
Cytonn Report: Listed Banks Asset Quality in Q1’2025 |
||||||
|
|
Q1'2025 NPL Ratio* |
Q1'2024 NPL Ratio** |
% point change in NPL Ratio |
Q1'2025 NPL Coverage* |
Q1'2024 NPL Coverage** |
% point change in NPL Coverage |
|
Stanbic Holdings |
8.7% |
8.9% |
(0.2%) |
80.8% |
72.3% |
8.5% |
|
Cooperative Bank |
17.1% |
15.9% |
1.2% |
64.2% |
58.6% |
5.6% |
|
Standard Chartered Bank
|
8.3% |
9.9% |
(1.6%) |
78.7% |
83.7% |
(5.0%) |
|
KCB Group |
19.9% |
17.9% |
2.0% |
67.0% |
62.0% |
5.0% |
|
NCBA Group |
12.2% |
11.7% |
0.5% |
63.0% |
55.7% |
7.3% |
|
Mkt Weighted Average* |
14.0% |
13.5% |
0.5% |
70.0% |
62.7% |
7.3% |
|
*Market cap weighted as at 23/05/2025 |
||||||
|
**Market cap weighted as at 13/06/2024 |
||||||
Key take-outs from the table include;
- Asset quality for the listed banks that have released results declined during Q1’2025, with market-weighted average NPL ratio increasing by 0.5% points to 14.0% from 13.5% in Q1’2024 largely due to KCB Group’s numbers, and,
- Market-weighted average NPL Coverage for the five listed banks increased by 7.3% points to 70.0% in Q1’2025 from 62.7% recorded in Q1’2024. The increase was attributable to Stanbic Bank’s coverage ratio increasing by 8.5% points to 80.8% from 72.3% in Q1’2024, coupled with NCBA Group’s NPL coverage ratio increasing by 7.3% points to 63.0% from 55.7% in Q1’2024.
Summary Performance
The table below shows the performance of listed banks that have released their Q1’2025 results using several metrics:
|
Cytonn Report: Listed Banks Performance in Q1’2025 |
|||||||||||||
|
Bank |
Core EPS Growth |
Interest Income Growth |
Interest Expense Growth |
Net Interest Income Growth |
Net Interest Margin |
Non-Funded Income Growth |
NFI to Total Operating Income |
Growth in Total Fees & Commissions |
Deposit Growth |
Growth in Government Securities |
Loan to Deposit Ratio |
Loan Growth |
Return on Average Equity |
|
Stanbic Group |
(16.6%) |
(8.9%) |
(24.6%) |
4.6% |
7.8% |
(27.2%) |
28.9% |
44.1% |
(5.0%) |
27.2% |
72.3% |
(4.6%) |
20.0% |
|
Co-operative Bank |
5.3% |
14.4% |
3.3% |
21.7% |
8.4% |
(1.9%) |
32.8% |
6.7% |
9.0% |
20.9% |
73.2% |
1.7% |
18.2% |
|
Standard Chartered Bank |
(13.5%) |
(2.4%) |
(13.1%) |
(0.8%) |
8.5% |
(29.3%) |
29.2% |
(3.1%) |
(6.8%) |
46.2% |
48.3% |
(10.2%) |
26.8% |
|
KCB Group |
0.4% |
2.2% |
(8.6%) |
8.5% |
8.5% |
(9.8%) |
31.8% |
0.4% |
(4.9%) |
(20.5%) |
71.7% |
0.1% |
23.4% |
|
NCBA Group |
3.4% |
(10.1%) |
(33.5%) |
20.6% |
6.5% |
(4.5%) |
42.5% |
(2.8%) |
(9.6%) |
5.3% |
57.9% |
(10.4%) |
21.2% |
|
Q1'2025 Mkt Weighted Average* |
(3.2%) |
(0.0%) |
(13.8%) |
10.8% |
8.0% |
(13.7%) |
33.0% |
5.8% |
(3.4%) |
12.8% |
64.5% |
(4.3%) |
22.3% |
|
Q1’2024 Mkt Weighted Average* |
29.8% |
35.3% |
64.7% |
22.8% |
8.0% |
10.9% |
38.6% |
10.7% |
14.1% |
3.1% |
68.4% |
7.5% |
21.9% |
|
*Market cap weighted as at 23/05/2025 |
|||||||||||||
|
**Market cap weighted as at 13/06/2024 |
|||||||||||||
Key take-outs from the table include:
- The listed banks that have released their Q1’2025 results recorded a 3.2% decline in core Earnings per Share (EPS) in Q1’2025, compared to the weighted average growth of 29.8% in Q1’2024, an indication of declined performance attributable to the declined operating environment experienced during Q1’2025,
- Interest income recorded a weighted average decline of 0.03% in Q1’2025, compared to 35.3% in Q1’2024. Similarly, interest expenses recorded a market-weighted average decline of 13.8% in Q1’2025 compared to a growth of 64.7% in Q1’2024,
- The Banks’ net interest income recorded a weighted average growth of 10.8% in Q1’2025, a decline from the 22.8% growth recorded over a similar period in 2024, while the non-funded income declined by 13.7% in Q1’2025 compared to the 10.9% growth recorded in Q1’2024 despite the revenue diversification strategies implemented by most banks, and,
- The Banks recorded a weighted average deposit decline of 3.4%, compared to the market-weighted average deposit growth of 14.1% in Q1’2024.
We are “Bullish” on the Equities markets in the short term due to current cheap valuations, lower yields on short-term government papers and expected global and local economic recovery, and, “Neutral” in the long term due to persistent foreign investor outflows. With the market currently trading at a discount to its future growth (PEG Ratio at 0.6x), we believe that investors should reposition towards value stocks with strong earnings growth and that are trading at discounts to their intrinsic value. We expect the current high foreign investors sell-offs to continue weighing down the economic outlook in the short term.
- Residential Sector
- Mukuru Affordable Housing Project Handover
During the week, President William Ruto officiated the handover of 1,080 housing units at the Mukuru Affordable Housing Project in Nairobi’s Embakasi South, marking a pivotal moment in Kenya’s housing sector. Spanning 56 acres, this ambitious initiative, the largest of its kind in the country, aims to deliver 13,248 units by March 2026. The project, valued at over Kshs 7.0 bn and funded through the Housing Levy Fund, offers bedsitters at Kshs 3,900, one-bedroom units at Kshs 4,000, and two-bedroom units at Kshs 5,000 monthly under a rent-to-own scheme. This milestone follows the reclamation of the land, previously grabbed illegally, by the Ethics and Anti-Corruption Commission in 2020.
The project’s economic ripple effects are notable, injecting Kshs 11.0 bn into construction and neighborhood development, generating jobs for over 3,000 workers, with plans to scale to 4,800. Ruto emphasized its role in unlocking opportunities and fostering inclusive growth, aligning with the goal of building 200,000 units annually to address a 2-mn-unit housing deficit.
We expect that the Mukuru affordable housing initiative, sets a precedent for urban renewal, encouraging private-sector collaboration and innovative construction methods. However, critics question long-term affordability and maintenance without sustained subsidies, risking the creation of “vertical slums” if services falter. This project could transform Nairobi’s residential landscape, but its success hinges on addressing these challenges and ensuring broad accessibility.
The project not only aims to alleviate the housing deficit but also seeks to stimulate regional economic growth. Job creation during the construction phase is anticipated, and improvements in local infrastructure may spur ancillary investments in services such as education, retail, and transportation. Additionally, the redevelopment component of the project might involve upgrading existing estates, a factor that could lead to legal disputes or displacement concerns similar to those experienced in previous phases.
The Centre for Affordable Housing Finance Africa (CAHF) estimates that Kenya faces an annual housing deficit of 80.0%. Currently, only 50,000 new houses are built each year, while the demand stands at approximately 250,000 units, leaving a shortfall of about 200,000 homes annually. The Centre for Affordable Housing Finance in Africa (CAHF) reports that 61.3% of Kenyans own homes, compared to other African countries like Angola and Algeria with 75.4% and 74.8% national home ownership rates respectively. The national homeownership rate stands at approximately 29.5% in urban areas sprawling the national average of 61.3% while 78.7% of urban dwellers rent. The government's push for affordable housing aims to improve this rate by making homes more accessible to lower and middle-income earners. The graph below shows the home ownership percentages for different countries compared to Kenya;
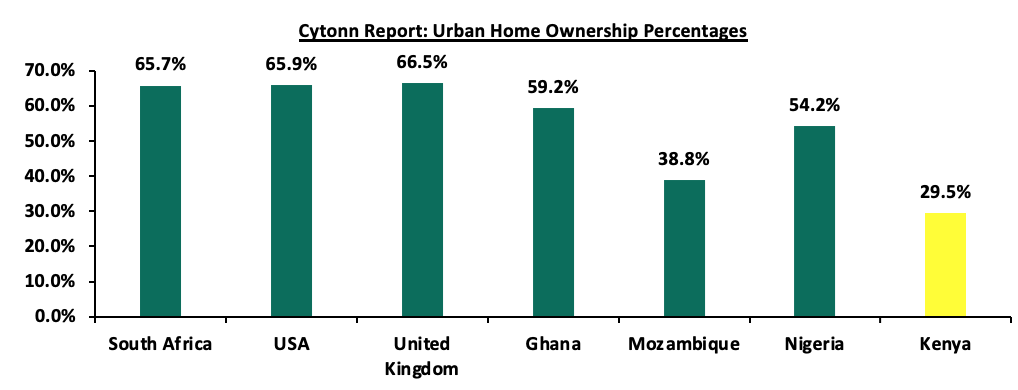
Source: Centre for Affordable Housing Finance Africa (CAHF), US Census Bureau, UK Office for National Statistics
The AHP initiatives are expected to have transformative impact in the Real Estate sector. Improved housing and infrastructure in urban areas will likely increase property values, attracting both residential and commercial investments. This could lead to the development of new residential estates, shopping centers, and community facilities, thereby boosting local economic activity. However, careful planning will be needed to mitigate potential social challenges, including the displacement of current residents. Overall, the project is poised to serve as a catalyst for urban renewal and sustainable development in one of Nairobi’s most dynamic areas.
- Mixed-use Sector
- Mi-Vida Homes Partnership with Space Master Properties for a 24-storey mixed use development
During the week, property developer Mi Vida Homes announced a strategic partnership with Space Master Properties to construct Habitat, a 24-story mixed-use facility along Ralph Bunche Road in Nairobi’s Westlands. This ambitious project, developed in collaboration with Parklane Construction, marks a pioneering effort in Kenya’s real estate market by integrating healthcare with residential and commercial spaces. The development will feature 42 medical suites for sale to healthcare providers, a residential component with assisted living options, and retail areas, targeting Nairobi’s growing medical tourism sector.
Mi Vida Homes CEO Samuel Kariuki hailed the project as an innovative response to human needs, combining accessibility to medical care with thoughtfully designed living spaces. The initiative aligns with the firm’s mission to deliver quality, timely projects, leveraging its Kshs 12.0 bn joint venture backing from Actis and Shapoorji Pallonji Real Estate.
We expect the project to have economic benefits, including job creation and investment in medical tourism, a sector Kenya aims to expand. However, skepticism lingers. The high-rise’s feasibility in Westlands, a congested area, raises concerns about infrastructure strain and parking, despite claims of “ample” provision. Critics also question whether the focus on medical suites will truly benefit locals or primarily serve wealthy tourists, potentially widening inequality. The government’s push for urban development through such partnerships is commendable, but past delays in similar projects suggest execution risks. If successful, Habitat could redefine Westlands’ residential and healthcare landscape, though its long-term impact depends on addressing these challenges and ensuring inclusivity.
- Real Estate Investments Trusts (REITs) Performance
On the Unquoted Securities Platform, Acorn D-REIT and I-REIT traded at Kshs 25.4 and Kshs 22.2 per unit, respectively, as per the last updated data on 23rd May 2025. The performance represented a 27.0% and 11.0% gain for the D-REIT and I-REIT, respectively, from the Kshs 20.0 inception price. The volumes traded for the D-REIT and I-REIT came in at Kshs 12.8 mn and Kshs 37.5 mn shares, respectively. Additionally, ILAM Fahari I-REIT traded at Kshs 11.0 per share as of 23rd May 2025, representing a 45.0% loss from the Kshs 20.0 inception price. The volume traded to date came in at Kshs 1.2 mn shares for the I-REIT since inception in November 2015.
REITs offer various benefits, such as tax exemptions, diversified portfolios, and stable long-term profits. However, the ongoing decline in the performance of Kenyan REITs and the restructuring of their business portfolios are hindering significant previous investments. Additional general challenges include:
- Insufficient understanding of the investment instrument among investors leading to a slower uptake of REIT products,
- Lengthy approval processes for REIT creation,
- High minimum capital requirements of Kshs 100.0 mn for REIT trustees compared to Kshs 10.0 mn for pension funds Trustees, essentially limiting the licensed REIT Trustee to banks only
- The rigidity of choice between either a D-REIT or and I-REIT forces managers to form two REITs, rather than having one Hybrid REIT that can allocate between development and income earning properties
- Limiting the type of legal entity that can form a REIT to only a trust company, as opposed to allowing other entities such as partnerships, and companies,
- We need to give time before REITS are required to list – they would be allowed to stay private for a few years before the requirement to list given that not all companies maybe comfortable with listing on day one, and,
- Minimum subscription amounts or offer parcels set at Kshs 0.1 mn for D-REITs and Kshs 5.0 mn for restricted I-REITs. The significant capital requirements still make REITs relatively inaccessible to smaller retail investors compared to other investment vehicles like unit trusts or government bonds, all of which continue to limit the performance of Kenyan REITs.
We expect Kenya’s Real Estate sector to remain on a growth trend, supported by: i) demand for housing sustained by positive demographics, such as urbanization and population growth rates of 3.8% p.a and 2.0% p.a, respectively, against the global average of 1.7% p.a and 0.9% p.a, respectively, as at 2023,, ii) activities by the government under the Affordable Housing Program (AHP) iii) heightened activities by private players in the residential sector iv) increased investment by local and international investors in the retail and commercial sector. However, challenges such as rising construction costs, strain on infrastructure development (including drainage systems), high capital requirements for REITs, and existing oversupply in select Real Estate sectors will continue to hinder the sector’s optimal performance by limiting developments and investments.
According to the ACTSERV Q1’2025 Pension Schemes Investments Performance Survey, segregated retirement benefits scheme quarterly returns increased to a 7.1% return in Q1’2025, up from the 6.0% gain recorded in Q1’2024. The y/y growth in overall returns was largely driven by the 4.9% points increase in returns from Fixed Income to 7.8% from a gain of 2.9% in Q1’2024 attributable to increased investments in government securities to lock in the higher yields in anticipation of further yield declines driven by the CBK’s expected continued monetary policy easing. The performance was however weighed down by the 21.0% points decline in the Equities returns to 4.6%, from 25.6% in Q1’2025. Notably, on a q/q basis the segregated retirement benefits schemes recorded a decline in returns from a gain of 13.2% in Q4’2024. This week, we shall focus on understanding Retirement Benefits Schemes and look into the quarterly performance and current state of retirement benefits schemes in Kenya with a key focus on Q1’2025;
We have been tracking the performance of Kenya’s Pension schemes with the most recent topical being, Retirement Benefits Schemes Q4’2024 Performance Report, done in March 2025. This week, we shall focus on understanding Retirement Benefits Schemes and looking into the historical and current state of retirement benefits schemes in Kenya and what can be done going forward. We shall also analyze other asset classes that the schemes can tap into to achieve higher returns. Additionally, we shall look into factors and challenges influencing the growth of the retirement benefits schemes in Kenya as well as the actionable steps that can be taken to improve the pension industry. We shall do this by looking into the following:
- Historical and Current State of Retirement Benefits Schemes in Kenya,
- Factors Influencing the Growth of Retirement Benefits Scheme in Kenya,
- Challenges that Have Hindered the Growth of Retirement Benefit Schemes, and,
- Recommendations on Enhancing the Performance of Retirement Benefits Schemes in Kenya;
Section I: Historical and the Current State of Retirement Benefits Schemes in Kenya
- Growth of Retirement Benefits Schemes AUM
According to the latest Retirement Benefits Authority (RBA) Industry Report for December 2024, , assets under management increased by 30.7% to Kshs 2.3 tn from the Kshs 1.7 tn recorded in December 2023. The growth of the assets is majorly attributed to the increase in contributions to the mandatory National Social Security Fund (NSSF) scheme, through the rollout of the second phase of the NSSF Act, 2013 which took effect in February 2024 significantly boosting retirement savings. Additionally, the improved market and economic conditions during the period as evidenced by improved business conditions, eased inflationary pressures and stability of the exchange rate led to the growth in investment income for the schemes. Looking ahead, the further upward adjustment of NSSF contribution limits in February 2025, marking the third phase of implementation is expected to further strengthen the pension sector by enhancing retirement savings and growing the overall Assets Under Management (AUM). Notably, the AUM increased by 14.0% to Kshs 2.3 tn in December 2024 from the Kshs 2.0 tn recorded in June 2024.
The graph below shows the growth of Assets under Management of the retirement benefits schemes over the last 10 years:
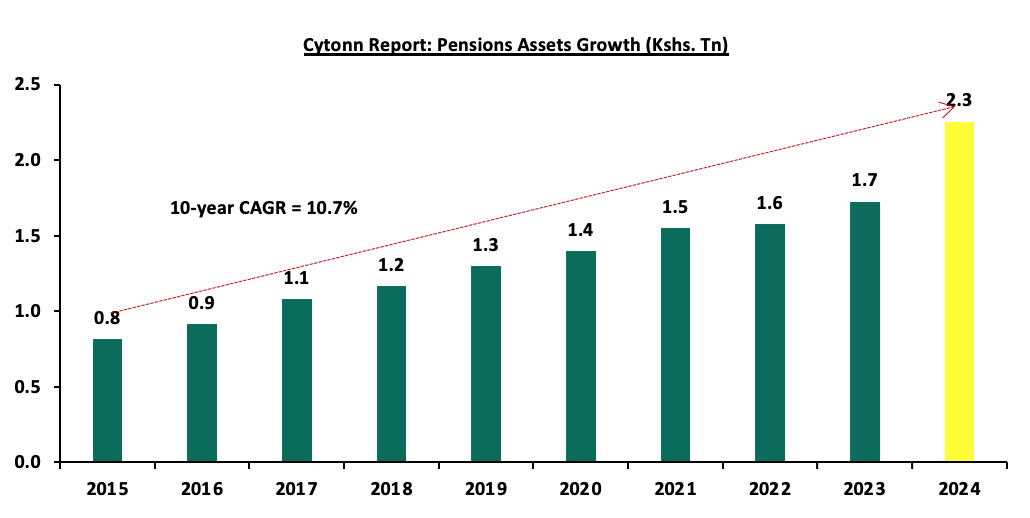
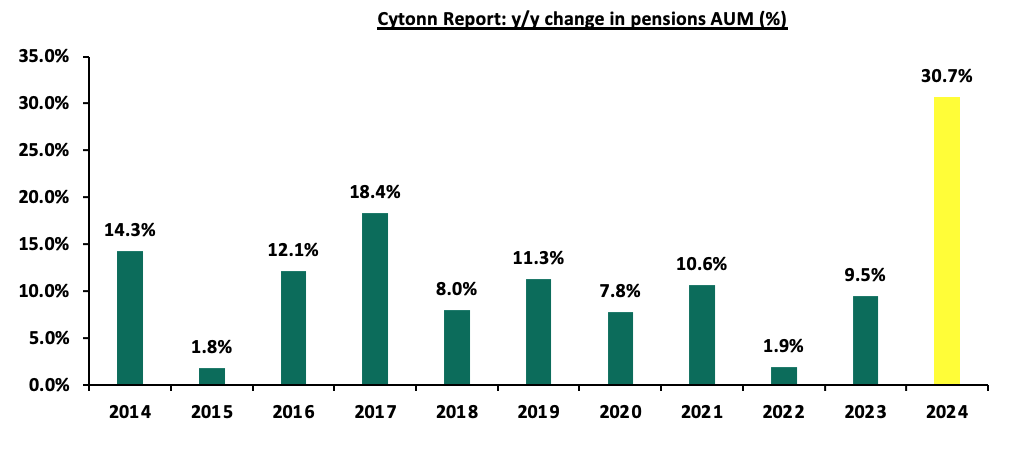
Pensions AUM increased by 30.7% to Kshs 2.3 tn in December 2024 from the Kshs 1.7 tn recorded in December 2023. The pension industry AUM has been on an upward trajectory for the last 10 years, recording a CAGR of 10.7% to Kshs 2.3 tn in 2024 from Kshs 0.8 tn in 2015. The notable 30.7% jump in AUM marks the highest year-on year growth within the decade. This surge is largely attributable to enhanced NSSF contributions from employers and employees, with contributions increasing by 133.4% to Kshs 59.3 bn in 2024, from Kshs 25.4 bn in 2023, coupled with improved investment income from fixed income investments and a rebounding stock market. Additionally, the 30.7% increase in Assets Under Management is 28.8% points increase in growth from the dismal 1.9% growth that was recorded in 2022, demonstrating the significant role that the enhanced NSSF contributions made to the recovery of the industry’s performance following a difficult period in 2022 due to the court ruling that declared revival of NSSF Act No.45 of 2013 unconstitutional. The primary goal of the Act was to broaden the NSSF’s benefit coverage, range, and scope as well as improve the adequacy of benefits paid out of the scheme by the Fund amongst others.
The chart below shows the y/y changes in the assets under management for the schemes over the years.
In Kenya, pension funds hold a substantial share of financial assets, consistently growing due to mandatory and voluntary contributions under the National Social Security Fund (NSSF) Act of 2013 regulations. In comparison, bank deposits remain the largest financial pool, reflecting their role as the primary savings vehicle driven by their liquidity, security, and accessibility, though they offer lower returns. Capital markets products, including unit trusts, REITs, are relatively smaller highlighting the nascent stage of capital markets in Kenya, but expanding as investors seek diversification and higher yields. SACCOs play a crucial role in cooperative-based savings and credit access, especially for middle-income earners.
The graph below shows the Assets under Management of Pensions against other Capital Markets products and bank deposits:
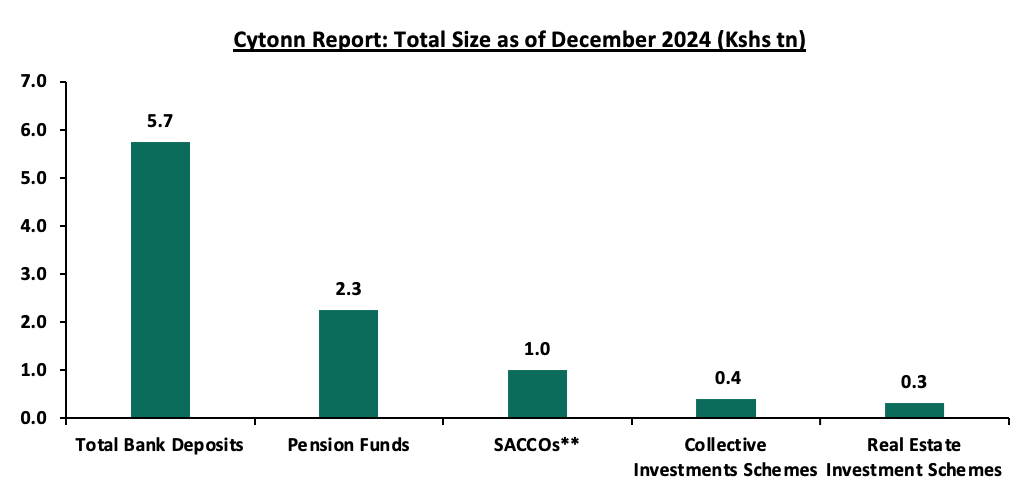
Sources: CMA, RBA, SASRA and REIT Financial Statements, **as of June 2024
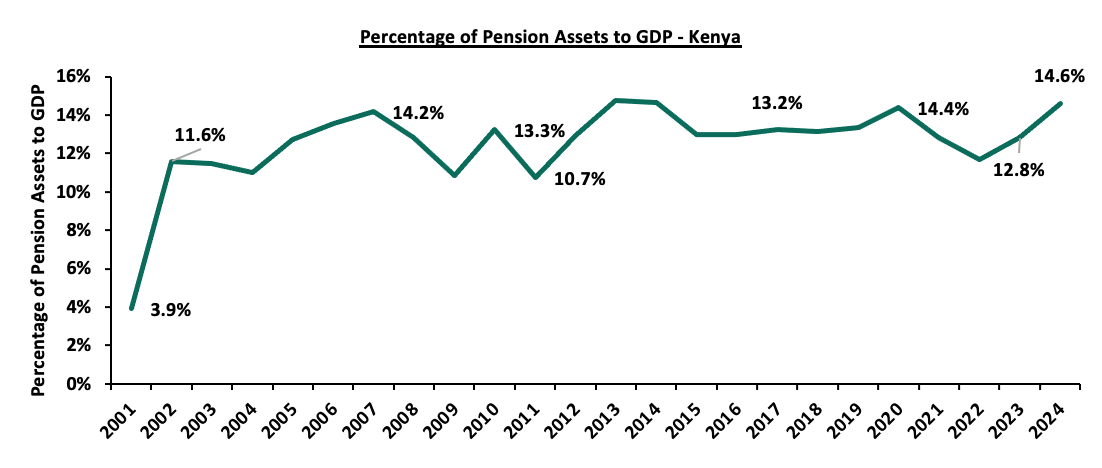
The pension to GDP ratio increased by 1.8% points to 14.6% in 2024 from 12.8% in 2023, attributable to the 30.7% increase in the pensions AUM to Kshs 2.3 bn in 2024. However, the 14.6% was low compared to most developing countries emphasizing the importance of policy reforms to broaden access to pensions and encourage greater savings. The graph below shows Kenya’s pension to GDP ratio over the years:
- Assets Held by Fund Managers
According to the Retirement Benefits Authority, as of the end of December 2024, 21 fund managers submitted their returns to RBA. The AUM for the fund managers increased by 15.6% to Kshs 1,714.8 bn in December 2024 from Kshs 1,483.4 bn recorded in June 2024. The table below outlines the performance of the Fund Managers comparing June 2024 and December 2024:
|
Cytonn Report: Assets Under Management for the Fund Managers |
||||||
|
No. |
Fund Manager |
June 2024 AUM (Kshs bn) |
Market Share |
December 2024 AUM (Kshs bn) |
Market Share |
AUM Growth (June 2024 to December 2024) |
|
1 |
Genafrica Asset Managers Limited |
465.7 |
31.4% |
651.4 |
38.0% |
39.9% |
|
2 |
Co-optrust Investment Services Limited |
231.1 |
15.6% |
303.4 |
17.7% |
31.3% |
|
3 |
Sanlam Investments East Africa Limited |
254.0 |
17.1% |
228.9 |
13.3% |
(9.9%) |
|
4 |
African Alliance Kenya Asset Management Limited |
99.7 |
6.7% |
201.0 |
11.7% |
101.7% |
|
5 |
Old Mutual Investment Group Limited |
243.1 |
16.4% |
191.3 |
11.2% |
(21.3%) |
|
6 |
ICEA Lion Asset Management Limited |
81.4 |
5.5% |
78.5 |
4.6% |
(3.5%) |
|
7 |
CIC Asset Management Limited |
70.5 |
4.8% |
35.8 |
2.1% |
(49.2%) |
|
8 |
Britam Asset Managers Kenya Limited |
26.3 |
1.8% |
9.5 |
0.6% |
(63.8%) |
|
9 |
NCBA Investment Bank Ltd |
6.3 |
0.4% |
7.2 |
0.4% |
13.9% |
|
10 |
ABSA Asset Management LTD |
3.4 |
0.2% |
4.0 |
0.2% |
16.1% |
|
11 |
Globetec Asset Management Limited |
1.5 |
0.1% |
2.1 |
0.1% |
40.1% |
|
12 |
Zimele Asset Management Company Limited |
0.0 |
0.0% |
0.7 |
0.0% |
- |
|
13 |
Mayfair Asset Managers Limited |
0.0 |
0.0% |
0.3 |
0.0% |
2800.0% |
|
14 |
Dry Associates Limited |
0.3 |
0.0% |
0.3 |
0.0% |
0.0% |
|
15 |
Kuza Asset Management Limited |
0.0 |
0.0% |
0.2 |
0.0% |
275.0% |
|
16 |
Cytonn Asset Managers Limited |
0.1 |
0.0% |
0.1 |
0.0% |
14.3% |
|
17 |
KCB Asset Management Limited |
0.1 |
0.0% |
0.1 |
0.0% |
20.0% |
|
18 |
Amana Capital Limited |
0.0 |
0.0% |
0.1 |
0.0% |
25.0% |
|
19 |
Fusion Investment Management Limited |
0.0 |
0.0% |
0.0 |
0.0% |
0.0% |
|
20 |
Genghis Capital Ltd |
0.0 |
0.0% |
0.0 |
0.0% |
0.0% |
|
21 |
Lofty- Corban Investments Limited |
0.0 |
0.0% |
0.0 |
0.0% |
- |
|
|
Total |
1483.4 |
|
1714.8 |
|
|
Key take-outs from the above table include:
- Assets Under Management: The AUM recorded a 15.6% growth to Kshs 1,714.8 bn in December 2024, higher than the AUM of Kshs 1,483.4 bn in June 2024,
- Growth: In terms of AUM growth, Mayfair Asset Managers recorded the highest growth of 2800.0% with its AUM increasing to Kshs 0.3 bn, from Kshs 0.02 bn in June 2024, attributable to the base effect. On the other hand, Britam Asset Managers recorded the largest decline with its AUM declining by 63.8% to Kshs 9.5 bn in December 2024, from Kshs 26.3 mn in June 2024,
- Market Share: Genafrica Asset Managers remained the largest overall Unit Trust with a market share of 38.0%, 6.6% points increase from 31.4% recorded in June 2024.
- Assets Held by NSSF
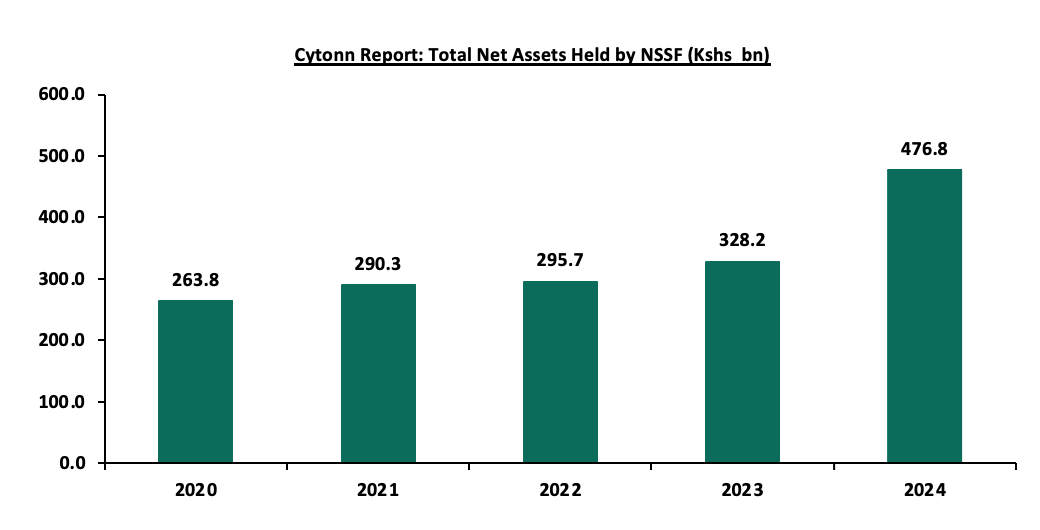
The total assets held by NSSF increased by 45.3% on a year on year basis to Kshs 476.8 bn in December 2024 from Kshs 328.2 bn in December 2023, and by 18.6% from Kshs 402.0 in June 2024. This is attributable to increased contributions due to the implementation of the NSSF Act of 2013, with the total contributions increasing significantly by 133.4% to Kshs 59.3 bn in 2024 from Kshs 25.4 bn in 2023. Additionally, internally managed funds amounted to Kshs 52.2 bn while externally managed funds were Kshs 424.6 bn. The graph below shows the total Assets under Management of NSSF over the last 5 years:
- Retirement Benefits Schemes Allocations and Various Investment Opportunities
Retirement Benefits Schemes strategically allocate funds across various asset classes available in the market to safeguard members' contributions while striving to generate attractive returns. These schemes have access to a diverse range of investment opportunities, including traditional asset classes such as equities and fixed income securities. Additionally, they can explore alternative investments such as real estate, private equity, infrastructure, and other non-traditional assets, which may offer higher returns and diversification benefits. The choice of investments is guided by the scheme's Investment Policy Statement (IPS), regulatory guidelines, and the need to align with the risk tolerance and long-term goals of the members. As such, the performance of Retirement Benefits Schemes in Kenya depends on a number of factors such as;
- Asset allocation,
- Selection of the best-performing security within a particular asset class,
- Size of the scheme,
- Risk appetite of members and investors, and,
- Investment horizon.
The Retirement Benefits (Forms and Fees) Regulations, 2000 offers investment guidelines for retirement benefit schemes in Kenya in terms of the asset classes to invest in and the limits of exposure to ensure good returns and that members’ funds are hedged against losses. According to RBA’s Regulations, the various schemes through their Trustees should formulate their own Investment Policy Statements (IPS) to Act as a guideline on how much to invest in the asset option and assist the trustees in monitoring and evaluating the performance of the Fund. However, the Investment Policy Statements often vary depending on risk-return profile and expectations mainly determined by factors such as the scheme’s demography and the economic outlook.
The Retirement Benefits Authority (RBA) regulations also emphasize the importance of diversification as a key principle in managing pension funds. By setting limits on exposure to specific asset classes, the regulations mitigate the risks associated with market volatility, ensuring that no single investment disproportionately affects the scheme's overall performance. Trustees are required to regularly review and update their Investment Policy Statements (IPS) to reflect changes in market conditions, economic dynamics, and the evolving needs of the scheme's members. This proactive approach not only aligns the investment strategy with the scheme’s objectives but also enhances accountability and transparency in fund management, safeguarding members’ retirement savings. The table below represents how the retirement benefits schemes have invested their funds in the past:
|
Cytonn Report: Kenyan Pension Funds’ Assets Allocation |
|||||||||||||||
|
Asset Class |
2014 |
2015 |
2016 |
2017 |
2018 |
2019 |
2020 |
2021 |
2022 |
2023 |
2024 |
Average |
Limit |
|
|
|
Government Securities |
31.0% |
29.8% |
38.3% |
36.5% |
39.4% |
42.0% |
44.7% |
45.7% |
45.8% |
47.5% |
52.5% |
41.2% |
90.0% |
|
|
|
Immovable Property |
17.0% |
18.5% |
19.5% |
21.0% |
19.7% |
18.5% |
18.0% |
16.4% |
15.8% |
14.0% |
11.1% |
17.2% |
30.0% |
|
|
|
Quoted Equities |
26.0% |
23.0% |
17.4% |
19.5% |
17.3% |
17.6% |
15.6% |
16.5% |
13.7% |
8.4% |
9.0% |
16.7% |
70.0% |
|
|
|
Guaranteed Funds |
11.0% |
12.2% |
14.2% |
13.2% |
14.4% |
15.5% |
16.5% |
16.8% |
18.9% |
20.8% |
19.4% |
15.7% |
100.0% |
|
|
|
Fixed Deposits |
5.0% |
6.8% |
2.7% |
3.0% |
3.1% |
3.0% |
2.8% |
1.8% |
2.7% |
4.8% |
2.4% |
3.5% |
30.0% |
|
|
|
Listed Corporate Bonds |
6.0% |
5.9% |
5.1% |
3.9% |
3.5% |
1.4% |
0.4% |
0.4% |
0.5% |
0.4% |
0.3% |
2.5% |
20.0% |
|
|
|
Offshore |
2.0% |
0.9% |
0.8% |
1.2% |
1.1% |
0.5% |
0.8% |
1.3% |
0.9% |
1.6% |
2.9% |
1.3% |
15.0% |
|
|
|
Cash |
1.0% |
1.4% |
1.4% |
1.2% |
1.1% |
1.2% |
0.9% |
0.6% |
1.1% |
1.5% |
1.0% |
1.1% |
5.0% |
|
|
|
Unquoted Equities |
1.0% |
0.4% |
0.4% |
0.4% |
0.3% |
0.3% |
0.2% |
0.2% |
0.3% |
0.2% |
0.2% |
0.4% |
5.0% |
|
|
|
REITs |
0.0% |
0.0% |
0.1% |
0.1% |
0.1% |
0.0% |
0.0% |
0.0% |
0.0% |
0.6% |
0.5% |
0.1% |
30.0% |
|
|
|
Private Equity |
0.0% |
0.0% |
0.0% |
0.0% |
0.1% |
0.1% |
0.1% |
0.2% |
0.2% |
0.3% |
0.7% |
0.2% |
10.0% |
|
|
|
Others e.g. unlisted commercial papers |
0.0% |
0.0% |
0.0% |
0.0% |
0.0% |
0.0% |
0.0% |
0.1% |
0.2% |
- |
0.0% |
0.0% |
10.0% |
|
|
|
Commercial Paper, non-listed bonds by private companies |
- |
- |
- |
0.0% |
0.0% |
0.0% |
0.0% |
0.0% |
0.0% |
0.0% |
0.1% |
0.0% |
10.0% |
|
|
|
Total |
100.0% |
100.0% |
100.0% |
100.0% |
100.0% |
100.0% |
100.0% |
100.0% |
100.0% |
100.0% |
100.0% |
100.0% |
100.0% |
|
|
Source: Retirement Benefits Authority
Retirement benefits schemes have for a long time skewed their investments towards traditional assets, mostly, government securities and the equities market, averaging 57.9% as of 31st December 2024 for the two asset classes, leaving only 42.1% for the other asset classes. However, as pension schemes seek higher returns, diversification, and inflation hedging, there has been a growing shift towards alternative investments that include immovable property, private equity as well as Real Estate Investments Trusts (REITs). It is vital to note, that in 2024 the second largest increase in allocation was recorded in investments in private equity by 182.2% to Kshs 16.2 bn from Kshs 5.7 bn recorded in 2023 and investments in Real Estate Investments Trusts increased by 5.2% to Kshs 11.7 bn in 2024 from Kshs 11.1 bn in 2023. However, allocation to immovable property increased by 2.9% to Kshs 249.2bn in 2024 from Kshs 242.1 bn in 2023.
Key take-outs from the table above are;
- Schemes in Kenya allocated an average of 57.9% of their members’ funds towards government securities and Quoted Equities between the period of 2014 and end of 2024. The 41.2% average allocation to government securities is the highest among the asset classes attributable to safety assurances of members’ funds because of low-risk associated with government securities. Notably, allocation towards government securities increased by 5.0% points to 52.5% in 2024 from 47.5% in 2023 attributable to high yields by the government papers and increased issuance of treasury bonds to finance fiscal deficits as well as increase domestic borrowing during the period,
- The allocation towards quoted equities increased by 0.6% points to 9.0% in 2024, from 8.4% in 2023 on the back of improved performance in the Kenyan equities market as evidenced by 34.3% gain by the NASI index in 2024, driven by a recovery in corporate earnings and increased investor confidence. Favourable macroeconomic conditions, such as easing inflation and a strengthened shilling, boosted market sentiment, have encouraged trustees to allocate more funds to equities during the period, and,
- Retirement Benefits Schemes investments in offshore markets increased by 1.3% points to 2.9% in 2024, from 1.6% in 2023 as a result of the opportunities in developed and emerging markets, and currency hedging strategies that allowed schemes to benefit from foreign exchange gains.
The chart below shows the allocation by pension schemes on the three major asset classes over the years:
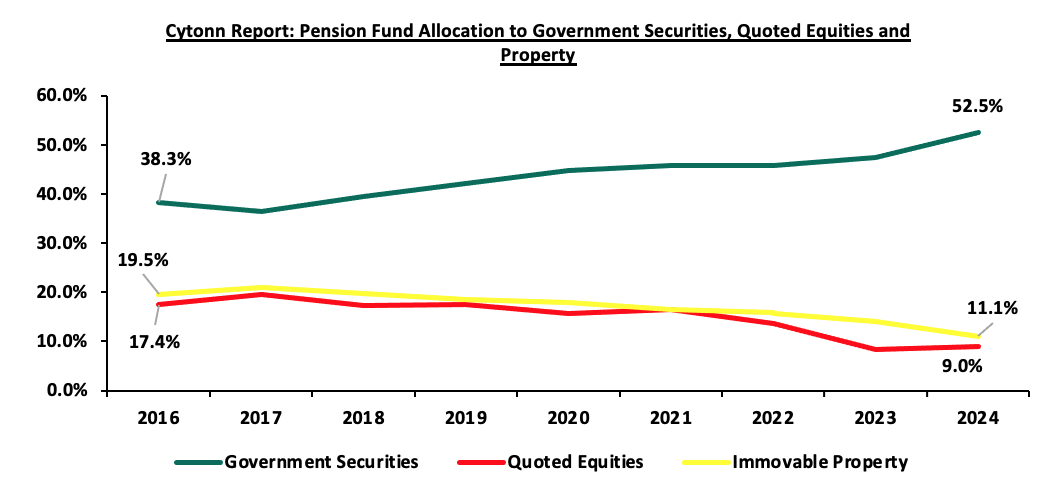
Source: RBA Industry report
The table below shows the AUM in the different asset classes in 2023 and 2024 and the change:
|
Cytonn Report: Kenyan Pension Funds’ Assets AUM (Kshs bn) |
|||
|
Asset Category |
FY'2023 |
FY'2024 |
YoY Change (%) |
|
Government Securities |
818.9 |
1183.3 |
44.5% |
|
Guaranteed Funds |
358.1 |
437.5 |
22.2% |
|
Immovable Property |
242.1 |
249.2 |
2.9% |
|
Quoted Equities |
145.2 |
202.3 |
39.4% |
|
Offshore |
27.2 |
64.5 |
137.2% |
|
Fixed Deposits |
81.9 |
53.7 |
(34.5%) |
|
Cash |
25.0 |
23.1 |
(7.4%) |
|
Private Equity |
5.7 |
16.2 |
182.2% |
|
REITs* |
11.1 |
11.7 |
5.2% |
|
Listed Corporate Bonds |
6.7 |
6.3 |
(5.3%) |
|
Unquoted Equities |
3.6 |
4.0 |
10.2% |
|
Commercial Paper, non-listed bonds by private companies* |
0.0 |
3.2 |
15900.0% |
|
Others e.g. Unlisted Commercial Papers |
0.0 |
0.2 |
- |
|
Total Assets |
1725.4 |
2255.2 |
30.7% |
Source: RBA Industry report
Key Take-outs from the table above are;
- Government securities remained the highest allocated asset class, recording a 44.5% increase in AUM to Kshs 1,183.3 bn in 2024 from Kshs 818.9 bn in 2023. Additionally, quoted equities grew by 39.4% to Kshs 202.3 bn in 2024 from Kshs 145.2 bn in 2023, attributable to the 34.3% gain by NASI in 2024 and the 17.4% appreciation of the Kenya Shilling which remained stable attracting more foreign direct investors,
- Commercial paper and non-listed bonds by private companies grew significantly by 15900.0% to Kshs 3.2 bn in 2024 from Kshs 0.0 bn in 2023 due to an investment of Kshs 3.0 bn in Linzi sukuk bond by one of the schemes during the period. Notably, investment in other assets increased to Kshs 0.2 bn, attributable to investment in the Mansa X shariah compliant fund in 2024
- Fixed deposits declined by 34.5% to Kshs 53.7 bn in 2024 from Kshs 81.9 bn in 2023. Additionally, cash declined by 7.4% to Kshs 23.1 bn in 2024 from Kshs 25.0 bn in 2024.
- Performance of the Retirement Benefit Schemes
According to the ACTSERV Q1’2025 Pension Schemes Investments Performance Survey, segregated retirement benefits scheme quarterly returns increased to a 7.1% return in Q1’2025, up from the 6.0% gain recorded in Q1’2024. The y/y growth in overall returns was largely driven by the 4.9% points increase in returns from Fixed Income to 7.8% from a gain of 2.9% in Q1’2024 attributable to increased investments in government securities to lock in the higher yields in anticipation of further yield declines driven by the CBK’s expected continued monetary policy easing. The performance was however weighed down by the 21.0% points decline in the Equities returns to 4.6%, from 25.6% in Q1’2025 majorly attributable to lower investor sentiment with concerns over rising inflationary pressures. Notably, on a q/q basis the segregated retirement benefits schemes recorded a decline in returns from a gain of 13.2% in Q4’2024. The chart below shows the performance of segregated pension schemes in the first quarters over the last 5 years:
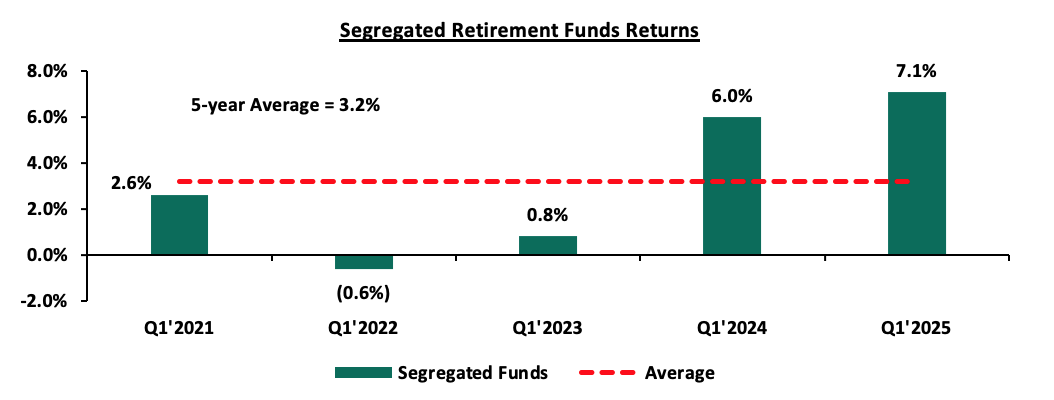
Source: ACTSERV Survey Reports (Segregated Schemes)
The key take-outs from the graph include:
- Schemes recorded a 7.1% gain in Q1’2025, representing 1.1 points increase from the 6.0% gain recorded in Q1’2024. The performance was largely driven by the 4.9% points increase in returns from Fixed Income to 7.8% from a gain of 2.9% in Q1’2024 attributable to increased investments in government securities to lock in the higher yields in anticipation of further yield declines driven by the CBK’s expected continued monetary policy easing. The performance was however weighed down by the 21.0% points decline in the Equities returns to 4.6%, from 25.6% in Q1’2025 majorly attributable to lower investor sentiment with concerns over rising inflationary pressures. and,
- Returns from segregated retirement funds have exhibited significant fluctuations over the last five years, ranging from a high of 7.1% recorded in Q1’2025 to a low of (0.6%) in Q1’2021, highlighting the sensitivity of fund performance to market and economic conditions.
The survey covered the performance of asset classes in three broad categories: Fixed Income, Equity, Offshore, and Overall Return.
Below is a table showing the first quarter performances over the period 2021-2025:
|
Cytonn Report: Quarterly Performance of Asset Classes (2021 – 2025) |
|||||||
|
|
Q1'2021 |
Q1'2022 |
Q1'2023 |
Q1’2024 (a) |
Q1'2025 (b) |
Average (2020-2024) |
% points change (b-a) |
|
Equity |
5.6% |
(4.8%) |
(7.2%) |
25.6% |
4.6% |
4.8% |
(21.0%) |
|
Fixed Income |
1.6% |
1.1% |
2.6% |
2.9% |
7.8% |
3.2% |
4.9% |
|
Offshore |
0.3% |
(8.7%) |
16.0% |
(9.2%) |
(4.1%) |
(1.1%) |
5.1% |
|
Overall Return |
2.6% |
(0.6%) |
0.8% |
6.0% |
7.1% |
3.2% |
1.1% |
Source: ACTSERV Surveys
Key take-outs from the table above include;
- Returns from Equity investments recorded a significant decrease by 21.0% points to a 4.6% gain in Q1’2025, from the 25.6% gain recorded in Q4’2023, majorly driven by the decline in the equities market performance as evidenced by 16.8% points decline in NASI to 6.0% from 22.8% in Q1’2024.
- Returns from Fixed Income also recorded an increase of 4.9% points to 7.8% in Q1’2025 from 2.9% recorded in Q1’2024. A declining yield curve boosted bond valuations, encouraging investors to lock in higher yields ahead of further yield drops expected from continued monetary policy easing by the Central Bank of Kenya (CBK).
- Returns from the Offshore investments recorded an increase to a loss of 4.1% return in Q1’2025 from the 9.2% loss recorded in Q1’2024. The performance was partly attributable to the increase in positive earnings growth as a result of the easing of monetary policies in major economies.
Other Asset Classes that Retirement Benefit Schemes Can Leverage on
- Alternative Investments (Immovable Property, Private Equity and REITs)
Retirement benefits schemes have for a long time skewed their investments towards traditional assets, mostly, government securities and the equities market, averaging at 57.9% in 10 years, in 2024, leaving only 42.1% for all the other asset classes. In the asset allocation, alternative investments that include immovable property, private equity as well as Real Estate Investments Trusts (REITs) account for an average of only 17.5% against the total allowable limit of 70.0%. In terms of overall asset allocation, alternative investments still lagged way behind the other asset classes, as demonstrated in the graph below;
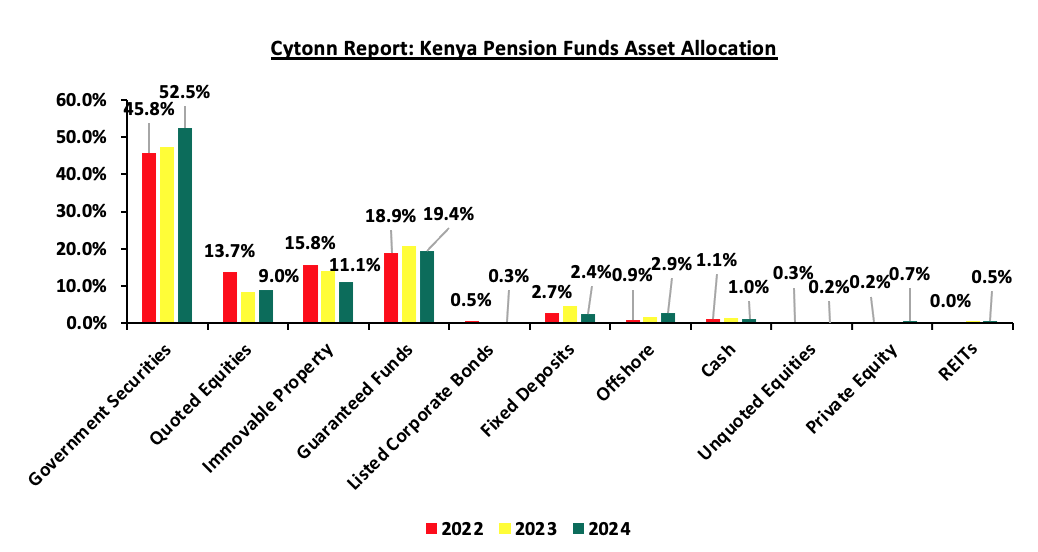
Source: RBA Industry Report
Alternative Investments refers to investments that are supplemental strategies to traditional long-only positions in equities, bonds, and cash. They differ from traditional investments on the basis of complexity, liquidity, and regulations and can invest in immovable property, private equity, and Real Estate Investment Trusts (REITs) to a limit of 70.0% exposure. We believe that Alternative Investments, including REITs, would play a significant role in improving the performance of retirement benefits schemes by providing opportunities for higher returns and enhanced portfolio resilience.
Alternative Investments, such as immovable property, private equity, and REITs, offer not only diversification and competitive long-term returns but also the potential to hedge against inflation. Investments in real assets like immovable property and REITs often benefit from inflationary environments, as property values and rental incomes tend to rise with inflation. Additionally, private equity provides access to high-growth sectors, such as technology and renewable energy, which are less correlated to traditional market movements, offering an attractive risk-adjusted return profile.
Furthermore, REITs in Kenya, particularly Development and Income REITs, present unique opportunities for retirement schemes. They provide exposure to the real estate sector without the liquidity constraints and management challenges associated with direct property ownership. As the Kenyan real estate market continues to mature and regulatory frameworks for REITs improve, these instruments are becoming more viable for retirement funds seeking stable, inflation-protected income streams and long-term growth. By strategically allocating a portion of their portfolio to alternative investments, retirement schemes can enhance overall returns while safeguarding members' contributions against market volatility.
- Public Private Partnerships
According to the Retirement Benefits Authority Investment Regulations and Policies, pension schemes can invest up to 10.0% of their total assets under management in debt instruments for the financing of infrastructure or affordable housing projects approved under the Public Private Partnerships Act. Kenya's pension schemes are increasingly investing in infrastructure projects to diversify their portfolios, achieve stable long-term returns, and contribute to national development. A significant initiative in this direction is the Kenya Pension Funds Investment Consortium (KEPFIC), established in 2018. KEPFIC is a collective of prominent Kenyan retirement benefit funds that have united to make long-term investments in infrastructure and alternative assets within the region. As of the latest report, KEPFIC has mobilized over USD 113.0 mn into projects such as roads, student housing, and affordable housing, involving 88 local pension funds.
Despite there being 1,075 registered pension schemes in Kenya, only 88 have actively participated in infrastructure investments through KEPFIC, highlighting a significant untapped opportunity. With the Retirement Benefits Authority allowing schemes to allocate up to 10.0% of their assets into such projects, there remains substantial room for more pension funds to diversify into infrastructure and affordable housing. A prime example of this opportunity is the Usahihi Expressway, a 440-kilometer dual carriageway connecting Nairobi and Mombasa, which seeks to raise approximately USD 1.0 bn from local pension funds and financial institutions as part of its estimated USD 3.5 bn cost. The Usahihi Expressway is expected to generate revenue primarily through toll collections over the 30-year concession period. Toll roads historically provide stable, inflation-hedged cash flows, making them attractive to long-term institutional investors like pension funds. Toll roads generate cash flows that grow over time, as toll rates can be adjusted for inflation and traffic volumes are expected to increase. By participating in this Public-Private Partnership, pension schemes can not only enhance portfolio returns and manage long-term risks but also play a crucial role in national development by financing transformative projects that spur economic growth.
Section III: Factors Influencing the Growth of Retirement Benefit Schemes
The retirement benefit scheme industry in Kenya has registered significant growth in the past 10 years with assets under management growing at a CAGR of 10.7% to Kshs 2.3 tn in FY’2024, from Kshs 0.8 tn in FY’2015. The growth is attributable to:
- Legislation – The National Assembly, on 26th December 2024, assented to the Tax Laws (Amendment) Bill 2024. The Bill amended the Income Tax Act by increasing the deductible amount for contributions to registered pension, provident, and individual retirement funds or public pension schemes to Kshs 360,000 annually from Kshs 240,000 and introduced provisions that allow contributions to post-retirement medical funds up to Kshs 15,000 per month—to be tax-deductible. Additionally, income from registered retirement benefits schemes is now tax-exempt for individuals who have reached the retirement age set by their scheme, those withdrawing benefits early due to ill health, or those exiting a registered scheme after at least 20 years of membership. These changes aim to adjust for inflation and modernize deductions that have remained unchanged for over a decade. The revisions are expected to reduce individual taxable income and enhance retirement benefits. In addition, the implementation of the National Social Security Fund Act, 2013 is entering its third year and is expected to foster the growth of the pension industry by allowing both the employees in the formal and informal sector to save towards their retirement. The upward revision of the NSSF Tier 1 and Tier 2 contribution limits effective from February 2025, to Kshs 8,000 and 72,000 respectively from Kshs 7,000 and Kshs 36,000 respectively is expected to enhance retirement savings, improving pension adequacy for retirees,
- Public-Private Partnerships - Public-private partnerships can be instrumental in expanding financial inclusion in the Kenyan pension sector. Collaborations between the government and private financial institutions can lead to the development and promotion of inclusive pension products. In Kenya, the National Social Security Fund (NSSF) is currently licensing and partnering with the private sector (Pension Fund Managers) to invest and manage NSSF Tier II contributions. This is a good example that the government is giving employees, employers, and persons in the informal sector to invest and save for their retirement in the private sector,
- Increased Pension Awareness – More people are becoming increasingly aware of the importance of pension schemes and as such, they are joining schemes to grow their retirement pot which they will use during their golden years. Over the last 20 years, pension coverage has grown from 12.0% to about 26.0% of the labour force. The Retirement Benefits Authority, through their Strategic Plan 2024-2029, aims to further expand this coverage to 34.0% by 2029. This growth reflects industry-wide initiatives to increase awareness among Kenyan citizens on the need for retirement planning and innovations,
- Tax Incentives - Members of Retirement Benefit Schemes are entitled to a maximum tax-free contribution of Kshs 30,000 monthly. Consequently, pension scheme members enjoy a reduction in their taxable income and pay less taxes. This incentive has motivated more people to not only register but also increase their regular contributions to pension schemes,
- Micro-pension schemes - Micro-pension schemes are tailored to address the needs of Kenyans in the informal sector with irregular earnings. These schemes allow people to make small, flexible contributions towards their retirement. By accommodating their financial realities, micro-pensions can attract a broader segment of the population into the pension sector. Examples of these pension schemes are Mbao Pension Plan and Individual Pension Schemes where one can start saving voluntarily and any amount towards their retirement,
- Relevant Product Development – Pension schemes are not only targeting people in formal employment but also those in informal employment through individual pension schemes, with the main aim of improving pension coverage in Kenya. To achieve this, most Individual schemes have come up with flexible plans that fit various individuals in terms of affordability and convenience. Additionally, the National Social Security Fund Act, 2013 contains a provision for self-employed members to register as members of the fund, with the minimum aggregate contribution in a year being Kshs 4,800 with the flexibility of making the contribution by paying directly to their designated offices or through mobile money or any other electronics transfers specified by the board,
- Technological Advancement – The adoption of technology into pension schemes has improved the efficiency and management of pension schemes. A notable example of pension technology in Kenya is the M-Akiba platform. This is a mobile-based platform that was developed by the government to enable Kenyans to save for their retirement using their mobile phones. Additionally, the improvement of mobile penetration rate and internet connectivity has enabled members to make contributions and track their benefits from the convenience of their mobile phones, and,
- Financial literacy programs - Financial literacy programs play a vital role in promoting the growth of retirement benefit schemes by enhancing financial inclusion among the public. Educating the public about the benefits of retirement savings and how to navigate pension schemes can empower individuals to take control of their financial future. The Retirement Benefits Authority (RBA) is at the forefront of ensuring the public is educated on financial literacy by organizing free training.
Section IV: Challenges that Have Hindered the Growth of Retirement Benefit Schemes
Although the Retirement Benefit industry is expanding, several obstacles still hinder its progress. The main challenges include:
- Low Pension Coverage in the Informal Sector – Many informal sector workers and small businesses lack access to structured retirement savings plans, leaving a significant portion of the Kenya’s workforce without adequate retirement security due to irregular incomes and job insecurity. The Retirement Benefit Statistical Digest 2021 reports that only 266,764 individuals are registered in individual pension schemes. This number is low compared to the 15.2 mn people in the informal sector, representing 83.2% of the total workforce (Kenya National Bureau of Statistics Economic Survey Report 2023). Many individuals in this sector focus on immediate financial needs rather than long-term savings, and traditional pension products may not align with their financial circumstances,
- Market Volatility – In segregated schemes, investment returns are not assured and fluctuate with market conditions. In Q1’2025 the equities market registered a decrease in returns to 6.0% from by 15.7% in Q4’2024, and a further drop from a 22.8% gain in Q1’2024. This volatility creates uncertainty in the growth of retirement savings.
- Low Awareness and Financial Literacy - Lack of awareness and understanding of retirement planning among individuals reduces participation rates, leading to inadequate savings for retirement. Many individuals don't fully understand the importance of saving for retirement or the lasting benefits of participating in a pension plan. This lack of understanding often originate from not being aware of these options, the advantages they offer, or how to enrol. This issue is particularly common in rural or underserved areas, where access to information is limited,
- Inadequate Contributions - Even when individuals are covered by retirement schemes, their contributions are often inadequate to meet future financial needs due to factors such as low disposable income, delayed enrolment in schemes and inadequate contribution rates. Insufficient contributions translate directly into lower payouts upon retirement. For retirees, this can result in financial insecurity, dependence on family or government assistance and inability to meet basic living expenses,
- High Level of Unemployment – According to the Kenya National Bureau of Statistics the unemployment rate in Kenya stood at 5.4% in 2024. The high unemployment rate presents a major obstacle for many individuals, preventing them from making consistent contributions to retirement schemes,
- Premature Access to Savings – Members of individual pension schemes can withdraw 100.0% of their own contributions, though this does not include any employer contributions that have been transferred. On the other hand, members in umbrella and occupational schemes can access up to 50.0% of their accumulated benefits before reaching retirement age, typically in situations such as job loss or a change in employment. In recent developments made a proposal to stop workers from accessing the pension savings in order to help retirees have adequate savings after their retirement. The regulator wants to remove the part of the law that allows workers under the age of 50 to access half of their of their pensions benefits when they switch jobs. While this new proposal does not offer immediate financial relief, it increases the overall value of retirement savings, thereby encouraging the pension sector's long-term growth potential.
- Unremitted Contributions – Due to financial constraints, some employers have postponed or failed to remit pension contributions to umbrella and occupational schemes. As a result, unremitted contributions have increased significantly, growing to Kshs 47.2 billion as of June 2024 from Kshs 41.9 billion in June 2023 according to the RBA Industry Brief December 2024, and,
- Delayed Benefit Payments –Streamline the approval process by cutting down on the number of steps and parties involved. Pension scheme administrators should have greater autonomy in calculating and approving payments, which would help speed up disbursements. Additionally, implementing automated systems to calculate and process benefits can minimize manual work and reduce the time spent transferring files between service providers.
Section V: Recommendations to Enhance the Growth and Penetration of Retirement Benefit Schemes in Kenya
- Increase Public Education and Awareness – Initiate targeted campaigns to inform the public about the importance of planning for retirement and the benefits of pension schemes. Organize workshops and seminars in rural and underserved communities to simplify pension concepts and boost understanding in terms of how to join, benefits of joining and process of exiting. The Retirement Benefits Authority (RBA) has recently been leading this essential campaign by hosting seminars, workshops, and roadshows to achieve these goals.
- Improve Regulatory Framework to Address Unremitted Contributions – The Retirement Benefits Authority (RBA) should enhance its oversight of employers to ensure pension contributions are fully and promptly remitted. Non-compliant employers should be subject to stricter penalties, such as fines or legal action, to encourage timely payments. However, for businesses experiencing short-term financial difficulties, RBA could provide options for structured payment plans or deadline extensions, helping them meet their obligations without defaulting. Additionally, RBA could involve Kenya Revenue Authority (KRA) to collect unremitted pension contributions and remit to RBA. KRA shall issue agency notices requiring holders of unremitted pension contributions to pay up within a specified date or notify KRA of their inability to pay due to lack of funds within 14 days of the receipt of the notice.
- Introduce Policy Reforms to Limit Premature Withdrawals – To safeguard long-term retirement savings, the percentage of pension funds accessible before retirement should be further reduced. Withdrawals should only be permitted in cases of genuine emergencies, such as critical illness, and must be supported by clear documentation and justification. Additionally, retirement schemes should provide educational workshops and materials to raise awareness about the long-term benefits of sustained savings and the financial risks associated with early withdrawals.
- Develop Tailored Pension Products for the Informal Sector – RBA should explore ways of encouraging the development of products with low, flexible contribution thresholds aimed at reaching the informal sector with irregular contributions. Targeting this section would greatly improve the pension coverage in the country. Leverage mobile money platforms and apps to facilitate seamless enrolment, contributions, and tracking of pension accounts.
- Promote Employees and Employer Participation in Pension Schemes – The Retirement Benefits Authority (RBA) should introduce incentives to encourage higher pension savings. This could include enhanced tax benefits for individuals and employers who contribute more to their pension schemes or a matching contribution system for voluntary savings. Such measures would motivate employees and employers to save beyond the mandatory contributions, ultimately improving retirement security and financial well-being.
- Streamline the Benefit Payment Process – The approval and disbursement of retirement benefits should be streamlined to minimize delays. Implementing automation for key processes and establishing clear timelines for each stage would ensure that retirees receive their benefits promptly. This efficiency would enhance trust in pension schemes and encourage greater participation, ultimately strengthening the retirement savings culture.
Implementing these recommendations will play important role in driving the sustainable growth of Kenya's retirement benefit schemes. By tackling key structural challenges faced in the industry, it will lead to enhanced trust, increased participation, and ultimately strengthen the sector’s long-term impact.
Disclaimer: The views expressed in this publication are those of the writers where particulars are not warranted. This publication, which is following Section 2 of the Capital Markets Authority Act Cap 485A, is meant for general information only and is not a warranty, representation, advice, or solicitation of any nature. Readers are advised in all circumstances to seek the advice of a registered investment advisor.

- Talk to us
- Kenya
- P.O Box 20695 - 00200, Nairobi, Kenya
- Cell +254709101200
- Tel +254709101200
- WhatsApp +254741676635
- United States
- +254709101200
- DOWNLOAD OUR APP
-


- Kenya
- 8th Floor, Pinetree Plaza, Kaburu Drive, Ngong Road, Nairobi, Kenya
- USA
- Suite 1150, 1775 Eye Street NW, USA, Washington DC 20006, USA
- Investments
- High Yield
- Private Equity
- Real Estate
- Real Estate
- RiverRun Estates
- Cytonn Towers
- The Ridge
- Taraji Heights
- The Alma